soil cement roads in richland county montana 2010-15 · 2015-03-31 · soil cement roads in...
TRANSCRIPT

Soil Cement Roads in Richland County Montana 2010-15
Interim Report (March 6, 2015)
Prepared for Russell Huotari, Richland County Public Works Department
Sidney Montana
Prepared by Stephen L Monlux, P.E., US Forest Service (Retired) William Vischer, P.E., US Forest Service (Retired)

ii
This paper and all the work represented here in were sponsored by Richland County Montana for the purpose of sharing information. You are free to copy, distribute, display and perform the work; make derivative works; make commercial use of the work under the condition that you give the original author and sponsor credit. For any reuse or distribution, you must make clear to others the license terms of this work. Any of these conditions can be waived if you get permission from the sponsor. Your fair use and other rights are in no way affected by the above.
ACKNOWLEDGMENTS The authors want to express their appreciation to Russell Huotari, Richland County Public Works Director for his continuous support, patience and vision for using new alternatives that have considerable risk. Appreciation is also given to the Montana Department of Transportation Non-Destructive Testing Data Unit for their professional services and willingness to fit Richland County Falling Weight Deflectometer field surveys into their busy schedule.

iii
ABSTRACT Heavy truck traffic from oil field development and oil extraction has damaged a significant amount of road infrastructure in many counties in the Bakken Formation in North Dakota and Montana since 2009. Structural capacity of roads has been exceeded and costly repairs required on paved, aggregate and soil surfaced roads. These roads served agriculture trucking for decades with gravel added as necessary. The increase in the number and excessive weight of trucks on weak clay soils requires a more substantial all weather road structure. This situation is worsened by inadequate budgets and rapid cost increases for dwindling aggregate resources. Most areas lack sufficient aggregate and funding resources to build traditional structural sections with thick layers of aggregate base and hot mix asphalt over weak clay soils. However, these soils can be permanently stabilized with Portland cement at a much lower initial cost using much less aggregate resource. Additional cost savings come from less right of way acquisition and much less reconstruction for road widening. Between 2010 and 2013 Richland County in Sidney Montana, built 59 miles of soil cement roads with various types of low cost wearing surfaces that appears to provide a cost effective structural section for heavy oil field truck traffic. Biennial performance monitoring with a Falling Weight Deflectometer (FWD) indicates soil cement provides adequate strength and durability even where extensively cracked. Methods have been developed to significantly reduce the amount of structural problems created during construction. A comprehensive set of construction and quality assurance specifications were developed to ensure a good quality structural section was achieved. Quality assurance efforts are more intensive for soil cement than cement treated base due to variations in soil type, moisture content and issues with soil pulverization, compaction and curing. Richland County road crews have done full depth reclamation on some under designed sections. A mechanistic analysis of the structural pavement layers was done using biennial FWD data to validate performance and to attempt to establish a simplified design methodology for cement treated clays. This paper will be updated as new information becomes available.
KEY WORDS SOIL CEMENT SOIL STABILIZATION FULL DEPTH RECLAMATION THICKNESS DESIGN BITUMINOUS SURFACE TREATMENT GRAVEL SURFACING UNPAVING

iv
TABLE OF CONTENTS ABSTRACT …………………………………………………………….………………………iii
TABLE OF CONTENTS ………………………………………………………………………iv
APPENDIX ………..……………………………………………………………………………..v
LIST OF FIGURES ..………………………………………………..………………………….vi
LIST OF TABLES……..…………….……………………………….……………….………..vii
INTRODUCTION…………..………………………………………….…………………...…viii
CHAPTER 1 - ROAD DEVELOPMENT HISTORY 2006 to 2014….…..………………… 1
CHAPTER 2 - STRUCTURAL SECTION ALTERNATIVES ……………………….……..3
CHAPTER 3 - SOIL CEMENT DESIGN …………………………………………..…… .…10
CHAPTER 4 - ROAD SURFACE DESIGN ……………………………………….. …….….15
CHAPTER 5 – SOIL CEMENT CONSTRUCTION …………...………………………..….20
CHAPTER 6 – REPAIR AND MAINTENANCE………………...…………………….…....24
CHAPTER 7 - CONSTRUCTION SPECIFICATIONS…………...……………………...…28
CHAPTER 8 - SOIL CEMENT QUALITY AND QUANTITY ASSURANCE …...…....…31
CHAPTER 9 - SOIL CEMENT EVALUATION…………………………………...……......39
CHAPTER 10 - CONCLUSIONS…………………………………………………...…….......40
CHAPTER 11 – CONCERNS………………………………………………………..………..41
CHAPTER 12 - RECOMMENDATIONS…………………………………………...………..42
REFERENCES………………………………………………………………………...………..45
APPENDIX……………………………………………………………………………...………46
v
APPENDIX
A1 Cost Comparisons for Structural Section Alternatives(Metric)(Reserved)....…...…47 A2 Cost Comparisons for Structural Section Alternatives(English) ………...…………48 B Soil Cement Road Problems, Causes, Prevention and Repair Methods…….………49 C1 Soil Cement Construction Specifications (2013)………………………………….…..51 C2 Soil Cement Construction Specifications (2014)……………………………….……..57 D Evaluation Criteria for Request for Proposal (RFP) Contracts…..……….………...64 E1 Soil Cement QA Specifications (3/2013)………………………………………………67 E2 Soil Cement QA Methods (3/2013)…………………………………………………….73 F Otta Seal Specifications for Emulsion and for Aggregate………………...…….……85 G Structural Thickness Design - Soil Cement (4/2014)……………………...….………86 H Structural Thickness Design – BST on Aggregate Base (Reserved)……..….………90 I 2014 FWD Data Summary – BST on Soil Cement (10/2014)……………..….………91 J 2014 FWD Data Summary– BST on Aggregate on Soil Cement (10/2014)…..……101 K 2014 FWD Data Summary – BST on Aggregate on Geotextile (10/2014)…....……106 L Roadway Materials Testing, Soils ………………………………………….………..112 M Roadway Materials Testing, Aggregate ……………………………………........…..116 N Roadway Materials Testing, Soil Cement ………………………………..….........…124 O Soil Cement Repair Process (Reserved)…………………………………….....….….136 P Project Development History Maps……………………………………..……….…..137 Q Richland County Traffic Monitoring Plan………………………….……………….142

vi
LIST OF FIGURES Figure 1. Structural Section History for years 2006 through 2013…………….……….……1
Figure 2. Non-standard truck configurations used to transport agriculture commodities...3
Figure 3. Soil cement layer 300 mm (12 inches) in depth, BST surface & clay subgrade. ....5
Figure 4. Treated gravel surface ………………………………….………………...…….……6
Figure 5. Soil stabilization treatment design for normal stabilization and for soft subgrade
areas.……………………………………………………………………….……..9
Figure 6. Soil cement durability versus cement content ………………..……..…………… 10
Figure 7. History of soil cement modulus values ……..….……………………………….… 11
Figure 8. Soil Cement Mix Characteristics…..…………………………...…………………. 12
Figure 9. Subgrade Soft Spots.. …………………………………………..…………………. 12
Figure 10. Soft Spot Detection Equipment ………………………….…..……………….…. 13
Figure 11. Soft Subgrade Stabilization Designs………………... ……...……………...….... 14
Figure 12. Relationship between FWD Deflection and Subgrade Modulus...………….…. 14
Figure 13. Clean chip BST on paving fabric ………………………...……….…….….….... 17
Figure 14. “Corrugated” soil cement surface prior to BST construction …..……….....…. 17
Figure 15. Otta seal BST “pot hole” area …………………………………………….......….18
Figure 16. Wheel track cracking…………………… ………………………………...……...22
Figure 17. Heavy load damage to green soil cement ………………………………...….…...23
Figure 18. Pothole location at transverse joint location……………………….…….…. ..…23
Figure 19. Uncompacted cold patch mix…………………… …………………..….…….…. 24
Figure 20. Full Depth Reclamation of Soil Cement…………………………….….…….…. 25
Figure 21. Blade laid hot mix on intersection……… ………………………………...……...27
Figure 22. Weak shoulders outside soil stabilization ………………………………...……...27
Figure 23. Cement Spread placement and alignment berms………………….….……. ..…32
Figure 24. Pick axe probe to determine cement used……… ………………….…….….…. 33
Figure 25. Cement is not moved left or right during mixing………………….….…......…. 33
Figure 26. Unacceptable moisture uniformity …………………………………..……….…. 34
Figure 27. Good pulverization on left and bad pulverization on right ………….…..….… 35
Figure 28. Sandy silt wet area from perched water table ………………………….….…… 36
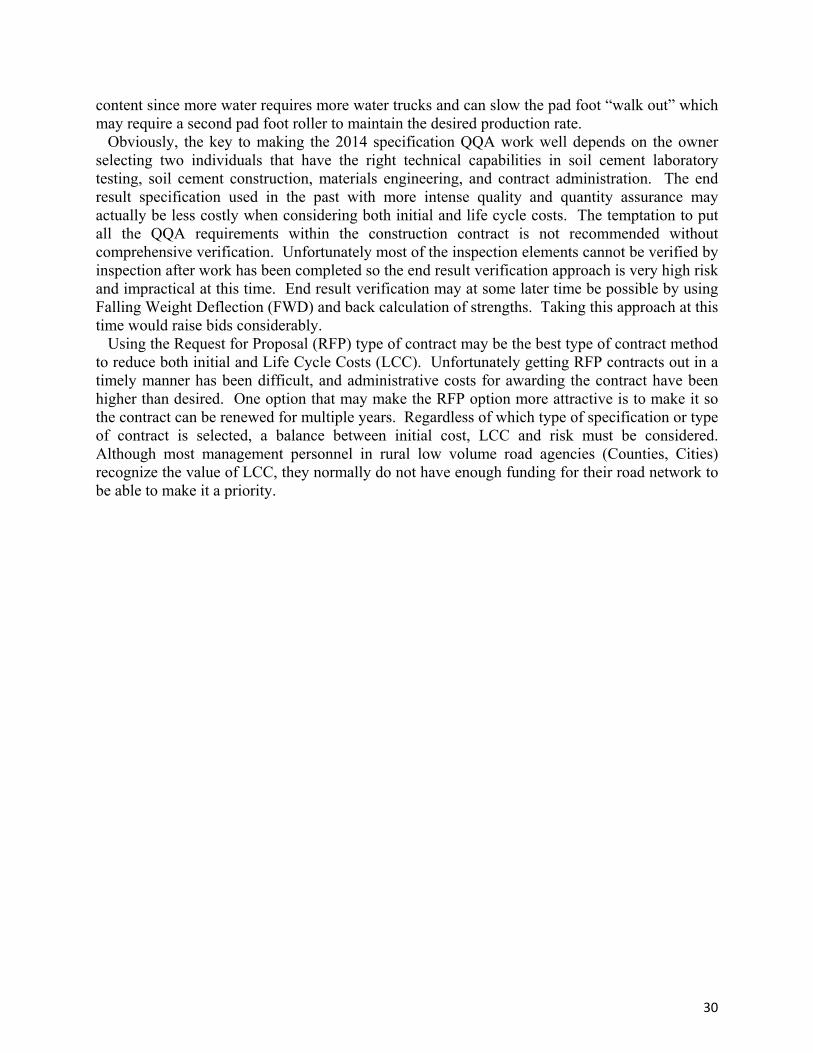
Figure 29. Single point proctor sample ……………………………………….…….…..…… 37

vii
LIST OF TABLES
Table 1. Comparisons Between Structural Section Alternatives ……..…………………….. 7
Table 2. Cost Comparisons for Structural Section Alternatives ...……………...……….…. 8
Table 3. Summary of all Surfacing Types and Miles………………...……………………... 15
Table 4. Bituminous Surface Treatment Options..………………………………...….….….17
Table 5. Extent of Soil Cement Structural Repairs……………...…………….........….…... 20
Table 6. Portland Cement Spread Chart………………………………………..……...…….26
Table 7. Quality and Quantity Assurance Work Summary……………….….….……...….28
Table 8. Daily Quality Assurance Report Format…………………………….….……….....31
Table 9. Costs for Soil Cement and For Quantity and Quality……………….….…………38

viii
INTRODUCTION
The Richland County road inventory presently includes over 1600 Kilometers (1000 miles) of unpaved rural roads, and another 65 kilometers (40 miles) of paved roads. The impacts to all roads has been significant with road closures on unpaved roads during wet weather and load restrictions posted on all roads during spring break-up. The primary emphasis has been to preserve existing pavement structures and make arterial unpaved roads into all-weather routes. About 90,000 t (100,000 tons) of aggregate has been used annually on gravel roads to keep up with deterioration caused by oil field truck traffic. A five year alternative delivery contract was awarded in April 2008 to expedite contracting for road improvements and obtain the best value for Richland County. This contract requires the prime contractor to obtain at least three bids on all work. The County and prime contractor have the flexibility to select subcontractors that will deliver the best value. It also allows them to decide which work should be completed by the prime contractor on a time and materials basis, to reduce subcontractor bid contingencies. Overall, this process worked well, with the exception of warranty issues on work that developed problems after construction. Although cement treated base (CTB) has been used by the Montana Transportation Department, no Montana contractors had experience with cement stabilization of soils. Cement stabilization of subgrade soils is significantly more difficult due to variations in soil types and moisture contents, difficulties achieving pulverization, etc. Stabilization of clay soils in Richland County started in 2010. Ninety five kilometers (59 miles) of soil cement stabilization was built by the end of 2013 and closely monitored by FWD surveys in spring and fall seasons. During this four year period, many test sections were built and changes made in cement contents, treatment depths, soft spot reinforcement strategies, road surface types and construction and quality assurance specifications. Sixty three of the 95 Kilometers (38 of 59 miles) of soil cement roads were surfaced with a double Bituminous Surface Treatment (BST) directly on soil cement. This design made all soil cement defects very obvious and significantly improved the learning and development process. Soil cement problems were easy to identify and diagnose since only a thin wearing surface exists on the soil cement surface, as opposed to the more typical structural section that covers structural problems with multiple layers of aggregate and hot mix. Many changes in specifications and construction practices were made to alleviate problems with both soil cement and the driving surface. FWD and Ground Penetrating Radar (GPR) survey data generally indicate that soil cement is seeing some structural deterioration over time, but even if it were to all become heavily cracked, it would still have support characteristics greater than that of crushed aggregate base. This point by itself is even more impressive when considering the cost of soil cement is roughly half that of crushed aggregate base when compared on an inch to inch thickness basis. Also, back calculation of FWD survey data on paved roads in Richland County (the traditional alternative) shows that aggregate base materials experience significant freeze thaw weakening beneath pavement structures. Problems have occurred in the soil cement and road surface, and repair strategies developed. Changes made in construction practices, detection of soft spots and using better road surfacing has significantly reduced the number of performance problems. In 2014 the Richland County road crew did Full Depth Reclamation (FDR) on some 2011 soil cement problem areas that were initially under designed.

1
CHAPTER 1 - ROAD DEVELOPMENT HISTORY 2006 TO 2014 Prior to 2010, the Richland County road network consisted of about 40 miles of paved roads and about 1000 miles of gravel roads. About 340 miles of gravel roads are also school bus routes. Most of the good aggregate sources are along the Yellowstone River corridor on the east side of the county. Rock costs are high due to haul distances to the western oil development areas and also high demand for rebuilding pavements and private oil field roads and drill pads in surrounding counties. Figure 1 provides a schematic for each of the structural sections built by Richland County over the past 8 years. Appendix P contains maps of Richland County that provides the location of each of the different types of structural section built between 2006 and 2014. Traditional hot mix asphalt (HMA) was used on one primary arterial in 2006 and later followed by Bituminous Surface Treatments (BST) over thick gravel sections, then soil cement of various thicknesses and cement contents. Soil cement test sections were built in 2010 and 2011 in an effort to determine the most cost effective alternatives. Performance evaluations of FWD field tests and Ground Penetrating Radar (GPR) measurements continue to provide critical information. In 2006 a 19 kilometer (12 mile) arterial was paved with 125 mm (5 inches) of hot mix asphalt over 175 mm (7 inches) of base. Eight kilometers (five miles) was overlaid in 2013 due to excessive amounts of truck traffic and heavy loads where subsurface drainage was poor in subgrade clays and base layers were well under the seven inches specified. During 2009 and 2010 an alternative delivery contract was used to pave and overlay the streets in one small community and another short road was asphalted with a double Bituminous Surface Treatment(BST) after stabilizing the four inch aggregate base with a proprietary product called BASE ONE (Team Labs, Inc.).
FIG. 1. Structural section history for years 2006 through 2014.
After completing preliminary thickness designs on oil field and local roads, it became apparent that the increase in infrastructure funding from oil development was not adequate for the traditional structural section of HMA over base course primarily due to high volumes of truck traffic, weak soils and high aggregate costs. Subgrade strengths were determined by laboratory
Subgrade
50‐275
mm (2"‐9")
100 mm
(4")
200 mm
(8")
250mm (10")
2010 2011 2012/13
75 mm (3")
2006 2009
100 mm (4")
250 mm (10")
8.7% C300 mm (12") 6 to 7.5% C
125 mm (5")
200 mm (8")
5 & 7% C
Hot Mix Asphalt
Soil Cement
Double BST
Separation Geotextile
Aggregate Base
Treated Gravel
175 mm (7") 25"
2014
2
California Bearing Ratio (CBR) tests (AASHTO T193) and numerous Dynamic Cone Penetrometer (DCP) tests (ASTM D6951). Natural Resources Conservation Service Soil surveys (Web Soil Survey) indicated fairly abundant lean clays which led to looking at soil stabilization alternatives. Various methods of subgrade stabilization were investigated, and Portland cement had the most promise with respect to long term performance and cost especially in remote areas where aggregate haul costs were high. Demand for road improvements, budget limitations and high aggregate costs persuaded the County to select somewhat non-standard structural sections and also favor options that could be maintained with their own workforce. In 2010, eight kilometers (five miles) of soil cement test sections were built with various road surface wearing courses. Although Falling Weight Deflectometer (FWD) tests on the 2010 work did not look promising, few other affordable options existed for remote roads in the county. In 2011, 42 kilometers (26 miles) of road was stabilized with Portland cement in the northwestern remote section of the county. Thirty four kilometers (21 miles) was surfaced with a BST with High Float Emulsion (HFE) and graded aggregate, commonly called an Otta seal. The other eight kilometers (five miles) was surfaced with a BST with clean chips over a paving fabric. No base course was used in 2011 due to excessive haul costs – BST construction was directly on soil cement. The Otta seal type BST required significant maintenance work in 2012 and 2013 primarily due to bad application rates. In 2012 and 2013 soil cement was built under somewhat tighter construction and quality assurance specifications. A greater percentage of weak subgrade soil areas were reinforced prior to soil cement construction. Nineteen kilometers (12 miles) of soil cement was surfaced with a clean aggregate chip BST and 26 kilometers (16 miles) surfaced with aggregate, most containing bentonite and calcium chloride additives. One short segment of a high profile road received base course and Hot Mix Asphalt (HMA) surface. In 2014 three miles of CR 350 (Rau School) soil cement road was resurfaced with three inches of aggregate base followed by a double BST. FWD testing was done in the fall and spring from 2010 through 2014 on newly constructed sections and many roads retested to establish deterioration trends and for making life predictions. FWD testing and GPR measurements were done in 2013 to help define the extent of soil cement structural repair areas. FWD testing was done in 2014 to improve performance prediction and the structural thickness design process.

3
CHAPTER 2 - STRUCTURAL SECTION ALTERNATIVES Thickness designs of road structural layers depend primarily on the strength of subgrade soils and the number and weight of trucks. For large oil field development, it is unrealistic to determine the design traffic because (1) oil exploration in the area is very secretive and fluctuates with the price of crude oil (2) the weight of trucks is unknown and not controlled and (3) alternate routes normally exist. Also, Richland County has agricultural commodity related traffic that does not conform to standard highway truck load configurations as shown in Figure 2. Since design traffic levels cannot be determined, it was decided to build affordable sections and test them with a Falling Weight Deflectometer (FWD) to estimate remaining life in terms of truck traffic volumes. The FWD tests the strength of the whole road structure including the subgrade and is designed to simulate the force exerted by an 8200 kg (18,000 pound) truck axle. Estimates for remaining life from the FWD data and cost estimates for maintenance were used to make life cycle cost comparisons for the various alternatives in terms of cost per ESAL. This design strategy for evaluating alternatives was started in 2010 and continues into 2014. As more information becomes available on maintenance costs and FWD deflections, refinements are made.
FIG. 2. Non-standard truck configurations used to transport agriculture commodities. Natural Resources Conservation Service soil surveys (Web Soil Survey) indicate about 60 percent of surface soil types in Richland County are lean clay. Another 5 to 7% are heavier clay. The remaining areas are predominantly sands and silts. Although annual precipitation is only 350 mm (14 inches) per year, many road surfaces outside the valley bottoms have soft spots caused by subsurface water from perched water tables. Many of these areas also contain frost susceptible soils which cause frost heaves and spring breakup conditions. Roadbed soil strengths

4
were tested extensively with Dynamic Cone Penetrometers (DCP). Strengths were variable with lower strength during the spring season when moisture contents were greater. In addition back calculation analysis of FWD data indicates severe freeze-thaw weakening of the typical base course used in any pavement structure. A California Bearing Ratio of 3 was considered appropriate for design, with localized lower strength areas. Road soft spots typically have CBR values below one for extended periods. These soft spots are normally repaired with 300 to 450 mm (1 to 1.5 foot) thick layers of pit run or crushed scoria type aggregate. In 2010, two structural design options were selected that had affordable construction costs per mile: Bituminous Surface Treatment (BST) over aggregate base and BST over soil stabilized with Portland Cement. However, the cost of long term maintenance of these design options was not well established. Two primary criteria used for selecting these options were: (1) low construction and maintenance costs, and (2) road surface and structural repairs should be possible with county personnel. Many soil stabilization options were considered (enzymes, local beet lime, hydrated lime, fly ash and proprietary stabilization products) but not used because of risks from unproven mix design procedures, leaching from subgrade moisture vapor, marginal durability (e.g., Milburn and Parsons 2004) and a history of unknown, inconsistent product formulations and wide variations in field performance. Portland cement was selected as the soil stabilization agent over the proprietary products for numerous reasons, but primarily due to a well-documented history of proven performance. A Transportation Research Board follow-up report documented the permanence of soil properties changes on Portland cement modified soils on eleven projects that were built 45 years earlier (Roberts 1986). Geosynthetics were considered for enhancing subgrade and base aggregate performance, but none were selected due to either higher cost or unproven design history for large volumes of heavy truck traffic over very weak soils. The two primary structural options selected for consideration in 2010 are included in Figure 1 and are described as follows.
Thin asphalt seal coats or Bituminous Surface Treatments (BST) over thick gravel base structures with fabric under the base aggregate for separation. This approach cost much less than traditional paving, but the thick gravel layers raise the road surface elevation so much that more roadbed widening is required to obtain safe road shoulders
Soil cement (a mixture of roadbed soil and Portland cement, Figure 3) with a road surface of either Double BST or treated gravel. This structural option stood out because the predominant soils (low plasticity clays) were found to be suitable for cement stabilization and large quantities of gravel resources are not required for the structural section. Also, Portland cement makes a permanent change in soil structure and stabilized roads can be easily repaired/reinforced by grinding and re-stabilization with either more Portland cement (e.g. Department of the Air Force, 2012), asphalt emulsion or a combination of the two. Hydrated lime and Class C Fly ash were also considered, but preliminary lab mix designs were not as promising as Portland cement, construction costs were greater and tests on very similar clay soils required much higher stabilizer percentages (e.g. Parker, 2008). The subgrade stabilization option also has the advantage of reducing costs for road widening which becomes critical for areas with narrow Right of Way (ROW) limits or deep roadway embankments. Soil cement has a much lower strength, durability and cost than traditional Portland cement concrete pavement or

5
Portland Cement Treated Bases (CTB) which are traditionally used as a surface and structural layer on major highways and city streets. Soil cement does not resist surface abrasion well, so it requires a covering or road surface that will protect it from traffic abrasion and snow plows when it becomes wet. Two options were selected for a road surface, Double Bituminous Surface Treatments (BST) and ‘treated gravels’ (Figure 4) that contain both bentonite and calcium chloride additives that reduce gravel loss. The bentonite additive reduces chloride leaching and chloride reduces bentonite dusting/loss. A gravel base and hot mix structure was not selected as the road surface because of cost and hot mix cracking issues that are worse than the thin asphalt rich BST surface. The cost of treated gravel is greater than the BST surface on projects where longer haul distances exist since about five times the amount of gravel is required.
FIG. 3. Twelve inch thick soil cement layer with Double BST on surface and moist underlying clay subgrade (2012 repair of 2011 soil cement on CR 146E).

6
FIG. 4. Treated gravel surface containing 3.5% Bentonite clay and 1.5% dry calcium chloride. Percentages are based on dry weight of aggregate. Early on, it became evident that the use of soil cement in Richland County was different than some of the private sector and other agency uses in the area. Two primary differences are (1) soil cement is expected to be a permanent part of a heavy truck road structural section, not for road or work platforms used for shorter term lower traffic mineral extraction and (2) soil cement is the primary and in some cases the only structural component that is much higher and even at the surface of the road. Most designs using soil cement put it lower in the structural section with overlaying aggregate base and pavement layers (Scullion 2008). Other factors considered in the selection of alternatives are shown in Table 1. Most of the factors were not easily quantified, but were considered in the selection process especially when estimating maintenance costs. A factor that became apparent after several years of FWD testing on pavements in Richland County was that the typical base course on subgrade structure was experiencing significant freeze thaw weakening of the pavement structure over time.
Close-up photo of road surface in wheel track

7
Table 1. Comparisons Between Structural Section Alternatives
(Levels of Concern: Very High 5, High 4, Moderate 3, Low 2, Very Low 1, None 0)
Type of Structural Section
Driving Surface Hot Mix Asphalt
Double BST
Double BST
Double BST
Double BST
Base Structure Aggregate Base
Aggregate Base
Stabilized Aggregate
Base
Stabilized Subgrade
Aggregate Base
Stabilized Subgrade Type of Concern
Construction Cost $ 5 4 3 2 2 Relative Life Cycle $ Depends on maintenance costs, adequate design, etc. Illegal load damage 4 3 3 3 2 Edge cracking & deterioration from farm machinery
2 4 3 3 2
Unsafe side slopes off asphalt edge
4 5 4 2 2
Rock Resource Depletion 4 5 3 1 2 BST Adhesion 0 4 3 5 4 Large rock punctures 0 4 2 2 3 Vehicle skid damage 1 4 3 4 4 Turning movements 1 5 3 4 4 Bleeding and Blotting 1 4 4 4 4 Chip Loss 1 4 4 4 4 Cracking (non-shoulder) 3 2 2 3 2
Table 2 contains a summary of information on road structural sections built since 2006 in Richland County along with current estimates of life and maintenance costs. More details are provided in Appendix A1 and A2. Primary factors used for selecting alternatives were construction costs, and estimates of maintenance costs and life, project location and aggregate resource conservation. Since aggregate haul costs are a significant factor in some areas, costs for alternatives that include aggregate are quite variable. For this reason, one alternative may be selected in one area of the county and not another.

8
Table 2. Cost Comparisons for Structural Section Alternatives
Really high costs per ESAL values for County Roads (CR) can indicate inadequate design thickness as is the case with BST over aggregate (CR 127E, 326 and 321S) and soil cement roads (CR 321 and 480). Fewer construction problems and more extensive subgrade reinforcement of soft areas would have lowered cost/ESAL for 321 and 480. Thin base layers stabilized with proprietary product BASE ONE, were found to have no physical evidence of stabilization three years later, perhaps due to leaching caused by moisture vapor within the subgrade soils. Note that all Double BST on aggregate base are likely under designed according to the Washington State design procedure in Appendix H. Lower costs per ESAL for soil cement treatments look promising, but there is greater uncertainty in life predictions and maintenance costs than other options. The relative reliability of life and maintenance cost estimates is influenced by the extent of historical data available from outside sources and the length of time the alternative has been analyzed in Richland County. As more data is collected, the analysis reliability will increase and life cycle costs will change. The ESAL life estimate from FWD survey data is based on mechanistic analysis of the seasonal deflection data. Back calculations and other supplementary mechanistic analysis provide seasonal modulus, stress and strain values for the pavement structure under a standard 8200 Kg (18,000 pound) ESAL (Appendix G). Using these seasonal values in the available distress models developed for pavements, an estimate of pavement life was obtained. For the pavement structure, distress models considering both vertical subgrade strain and tensile stress at the bottom of the soil cement layer are used. As no models have been specifically developed for cement treated lean clays when used as the primary structural component, we assume the models or their inputs, will have to be modified over time to more accurately predict the life of such structural sections.
Road SurfaceSupport
Structure ESAL Life Years (b)
Construc‐
tion
Average
Annual MtcAnnual Cost
5" Hot Mix 8" Base 1,150,000 8 $900,000 $16,000 $149,000
Double BST 10" Base 100,000 1 $400,000 $20,000 $606,000 (c)
Double BST12" Soil
Cement500,000 3 $300,000 $18,000 $115,000
Double BST
3" Gravel on
12" Soil
Cement
2,000,000 13 $350,000 $16,000 $48,000
4" Treated
Gravel
12" Soil
Cement2,000,000 13 $400,000 $26,000 (d) $63,000
(b) Based on 200 trucks/day, 50,000/yr (150,000 ESAL/yr)
(c) Classic case of under designed structural section for the selected ESAL/year traffic
(d) Cost is based on 1" gravel replaced each year
Road Design OptionAverage Estimated Life
from FWD Data Approximate Cost per Mile (a)
(a) Costs are very project specific
9
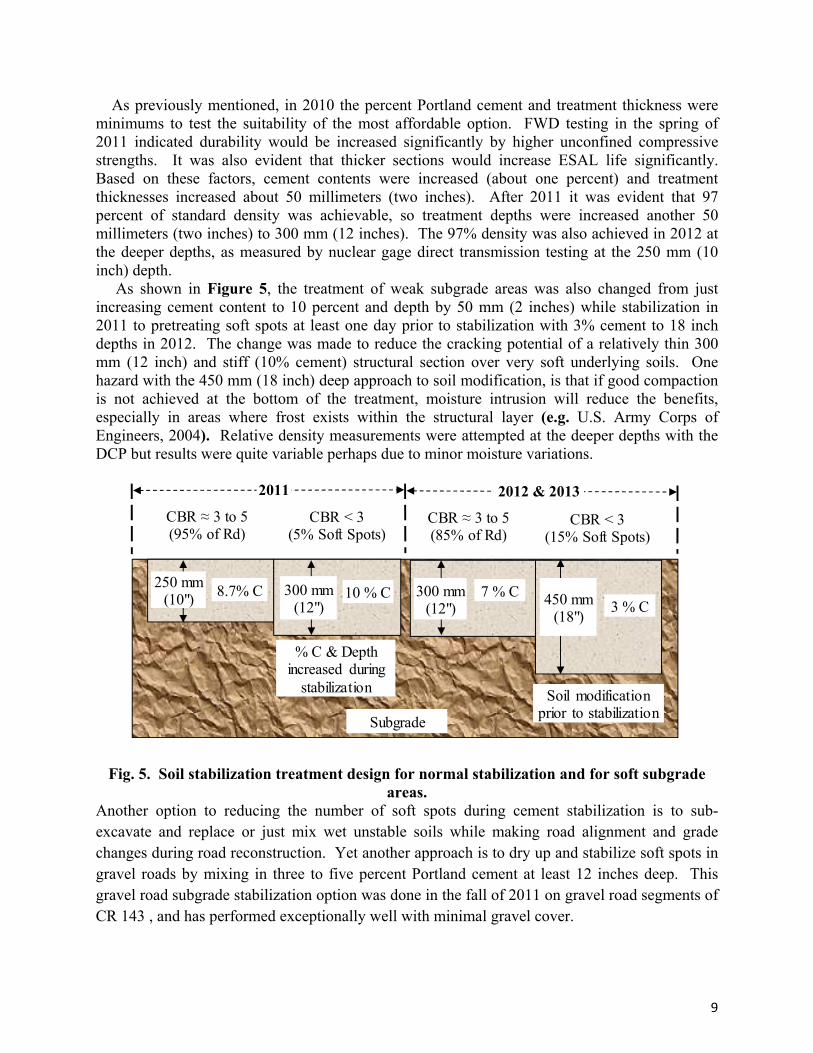
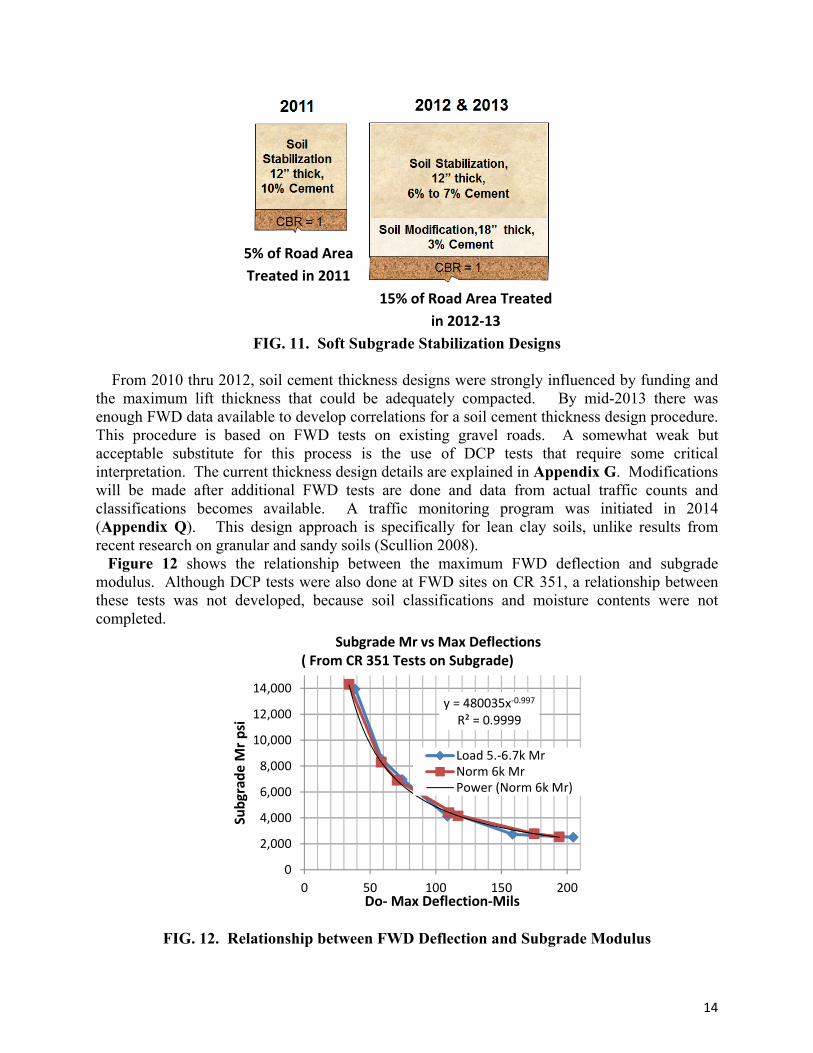
As previously mentioned, in 2010 the percent Portland cement and treatment thickness were minimums to test the suitability of the most affordable option. FWD testing in the spring of 2011 indicated durability would be increased significantly by higher unconfined compressive strengths. It was also evident that thicker sections would increase ESAL life significantly. Based on these factors, cement contents were increased (about one percent) and treatment thicknesses increased about 50 millimeters (two inches). After 2011 it was evident that 97 percent of standard density was achievable, so treatment depths were increased another 50 millimeters (two inches) to 300 mm (12 inches). The 97% density was also achieved in 2012 at the deeper depths, as measured by nuclear gage direct transmission testing at the 250 mm (10 inch) depth. As shown in Figure 5, the treatment of weak subgrade areas was also changed from just increasing cement content to 10 percent and depth by 50 mm (2 inches) while stabilization in 2011 to pretreating soft spots at least one day prior to stabilization with 3% cement to 18 inch depths in 2012. The change was made to reduce the cracking potential of a relatively thin 300 mm (12 inch) and stiff (10% cement) structural section over very soft underlying soils. One hazard with the 450 mm (18 inch) deep approach to soil modification, is that if good compaction is not achieved at the bottom of the treatment, moisture intrusion will reduce the benefits, especially in areas where frost exists within the structural layer (e.g. U.S. Army Corps of Engineers, 2004). Relative density measurements were attempted at the deeper depths with the DCP but results were quite variable perhaps due to minor moisture variations.
Fig. 5. Soil stabilization treatment design for normal stabilization and for soft subgrade areas.
Another option to reducing the number of soft spots during cement stabilization is to sub-excavate and replace or just mix wet unstable soils while making road alignment and grade changes during road reconstruction. Yet another approach is to dry up and stabilize soft spots in gravel roads by mixing in three to five percent Portland cement at least 12 inches deep. This gravel road subgrade stabilization option was done in the fall of 2011 on gravel road segments of CR 143 , and has performed exceptionally well with minimal gravel cover.
Subgrade
2011
250 mm (10")
8.7% C 300 mm (12")
10 % C 300 mm (12")
7 % C 450 mm (18")
3 % C
CBR ≈ 3 to 5 (95% of Rd)
CBR < 3 (5% Soft Spots)
CBR ≈ 3 to 5 (85% of Rd)
CBR < 3 (15% Soft Spots)
2011 2012 & 2013
Soil modificationprior to stabilization
% C & Depth increased during
stabilization
10
CHAPTER 3 - SOIL CEMENT DESIGN
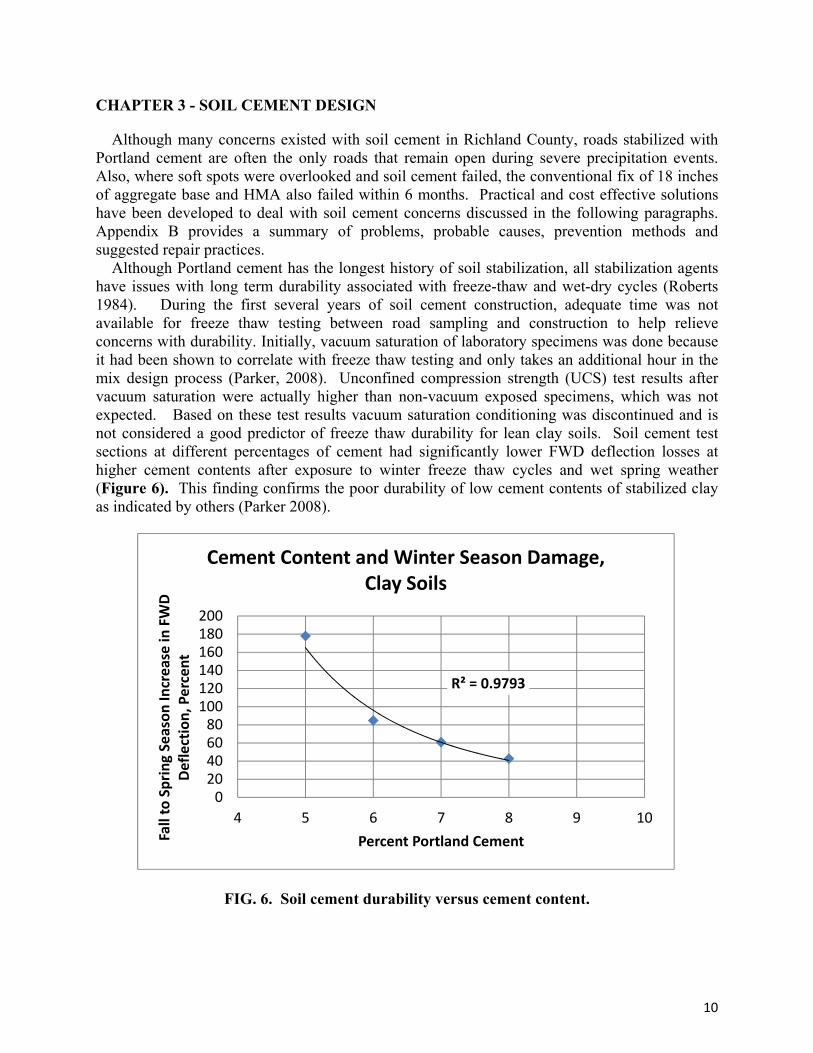
Although many concerns existed with soil cement in Richland County, roads stabilized with Portland cement are often the only roads that remain open during severe precipitation events. Also, where soft spots were overlooked and soil cement failed, the conventional fix of 18 inches of aggregate base and HMA also failed within 6 months. Practical and cost effective solutions have been developed to deal with soil cement concerns discussed in the following paragraphs. Appendix B provides a summary of problems, probable causes, prevention methods and suggested repair practices. Although Portland cement has the longest history of soil stabilization, all stabilization agents have issues with long term durability associated with freeze-thaw and wet-dry cycles (Roberts 1984). During the first several years of soil cement construction, adequate time was not available for freeze thaw testing between road sampling and construction to help relieve concerns with durability. Initially, vacuum saturation of laboratory specimens was done because it had been shown to correlate with freeze thaw testing and only takes an additional hour in the mix design process (Parker, 2008). Unconfined compression strength (UCS) test results after vacuum saturation were actually higher than non-vacuum exposed specimens, which was not expected. Based on these test results vacuum saturation conditioning was discontinued and is not considered a good predictor of freeze thaw durability for lean clay soils. Soil cement test sections at different percentages of cement had significantly lower FWD deflection losses at higher cement contents after exposure to winter freeze thaw cycles and wet spring weather (Figure 6). This finding confirms the poor durability of low cement contents of stabilized clay as indicated by others (Parker 2008).
FIG. 6. Soil cement durability versus cement content.
R² = 0.9793
020406080100120140160180200
4 5 6 7 8 9 10
Fall to Spring Season In
crease in
FWD
Deflection, Percent
Percent Portland Cement
Cement Content and Winter Season Damage, Clay Soils

11
The ultimate approach taken for durability evaluation was to look at the changes in FWD deflections and soil cement modulus over time instead of the lab testing approach that attempts to simulate freeze thaw conditions and predict performance. Back calculation of soil cement modulus over the first four years indicates an initial drop of strength of up to 40%. Most of the curves shown in Figure 7 suggest deterioration is leveling off. A summary of the latest surveys are in Appendix I. Future changes, however, will be closely monitored as practicing design engineers have noted significant reduction in pavement strength often occur over time for cement stabilized base courses (Scullion 2008).
FIG. 7. History of Soil Cement Modulus (Ep) values for Soil Cement with BST Surface. Soil cement mix designs were done on samples taken from each road alignment at locations where soil changes could be observed, generally at 0.4 km to 2.4 km (0.25 to 1.5 mile) intervals. Each year, all samples were grouped in a blind fashion according to similarities in gradation, soil texture and plasticity index. Mix designs were performed by ASTM D559 & D1653, along with guidance from the Portland Cement Association (PCA) Soil Cement Handbook. Cement contents were selected based on target compressive strengths of 2068 kPa (300 psi), and concerns about shrinkage associated with high cement contents and durability associated with low cement contents.
50
100
150
200
250
300
0 1 2 3 4
Ep x 1000, psi
Soil Cement Age, years
CR 129W
50
100
150
200
250
300
0 1 2 3 4
Ep x 1000, psi
Soil Cement Age, years
CR 201
50
100
150
200
250
300
0 1 2 3 4
Ep x 1000, psi
Soil Cement Age, years
CR 321
50
100
150
200
250
300
0 1 2 3 4
Ep x 1000, psi
Soil Cement Age, years
CR 143E
50
100
150
200
250
300
0 1 2 3 4
Ep x 1000, p
si
Soil Cement Age, years
CR 324
50
100
150
200
250
300
0 1 2 3 4
Ep x 1000, psi
Soil Cement Age, years
CR 146W
50100150200250300
0 1 2 3 4
Ep x 1000, psi
Soil Cement Age, years
CR 146E
50100150200250300
0 1 2 3 4
Ep x 1000, psi
Soil Cement Age, years
CR 314
50100150200250300
0 1 2 3 4
Ep x 1000, psi
Soil Cement Age, years
CR 143W

12
Figure 8 shows the different design changes used between 2010 and 2013. In 2011, cement contents above 8% were selected due to roads containing higher clay content soils and hopes of improving durability. This increase in cement content with clay soils resulted in a significant increase in shrinkage cracking. As a result, cement contents and corresponding unconfined compression strength targets for mix design specimens were lowered in 2012. Micro cracking was considered each year as a measure to reduce shrinkage cracking. Micro cracking was not done due to variations in strength development over time associated with varitions in soil type (Scullion 2001). Time will tell if shrinkage cracks in the 2011 work will cause performance problems in this realtively dry climate.
FIG. 8. Soil Cement Mix Characteristics
Very weak subgrade soils at numerous locations were recognized by DCP testing throughout the Richland County road network in 2010. Reinforcement of these areas prior to or during stabilization significantly reduces maintenance costs and extends ESAL life of the stabilized road. Determining the length of weak areas and in some cases just locating weak areas was challenging (Figure 9). Soft spots are primarily caused by perched water table feeding permeable subgrade soils.
FIG. 9. Subgrade Soft Spot Location

The exsurface wstabilizatequipmen41,000Kgidentify t
In 2012used to loroad surfin road dunder themotor gridentified Prior where wewith weaat aroundidentify 2014 was In 201increased2011 wamixing 3stabilizatstabilizat
xtent of manwas deformition becausent used for dg (90,000 pthe road leng
FI
2, an intelligocate soft spfaces and thedensity and ce much smalrader prior tod by IC rollinto stabilizatieak subgradak areas prevd 300 mm subsurface ws really not d11, weak sud from 250 ms reinforced
3% cement 4tion over thetion designs
ny soft areasing under he they were detecting sofound), threegth that need
G. 10. Roa
gent compacpots. Initialle IC roller. correspondinller 12 inch do IC roller tng were conion in 2013, e areas wereviously ident(12 inches).weak areas designed to bubgrade areamm to 300 md in this man450 mm (18e entire projebetween the
s was obviouheavy loads.
bridged oveft spots. Some axle cemended to be rein
ad Subgrade
ction (IC) roly, a correlatThis correla
ng strength bdiameter FWtesting did imnfirmed and s
Ground Pene identified itified, but th. GPR surat relativelybe used on uas were treamm (10 to 12nner. About8 inches) deect area. Fig
e 2011 and 2
us where de Many sof
er by the drme ‘hidden’nt distributonforced.
e Soft Spot
oller (Bomagtion was atteation failed pbeneath the sWD loading pmprove the strength quanetrating Rain 2012. Thhe depth of mrveys to 60
y low cost, buneven subgrated with ex2 inches). At 15% of theeep at least gure 11 show012/13 cons
eep ruts exisft areas werry road crusareas were
ors. All are
Detection E
g model numempted betwprimarily duseven foot wplate. Flattcorrelation.
antified by Dadar (GPR) she GPR survemoisture dete0 mm (24 ibut the MDrade or grav
xtra cement, About 5% ofe road lengtone day priws the progrstruction sea
st or the exie difficult tst. Figure located by peas were DC
Equipment
mber BW21ween FWD teue to the tranwide drum vetening the ro
The locatioDCP testing. surveys wereey data did nection was rinch) or greT equipmenel road surfa and the def the total roth was reinfoior to the 30ression of so
asons.
sting gravelto locate pri10 illustrate
proof rollingCP tested to
13BVC) wasesting of unpnsverse variaersus the stre
oad surface won of weak e run on onenot correlaterelatively shaeater depths nt used briefaces. epth of treatad length bu
forced in 20100 mm (12 oft spot subg
13
l road ior to es the g with o help
s also paved ations ength
with a areas
e road e well allow may fly in
tment uilt in 12 by inch) grade
14
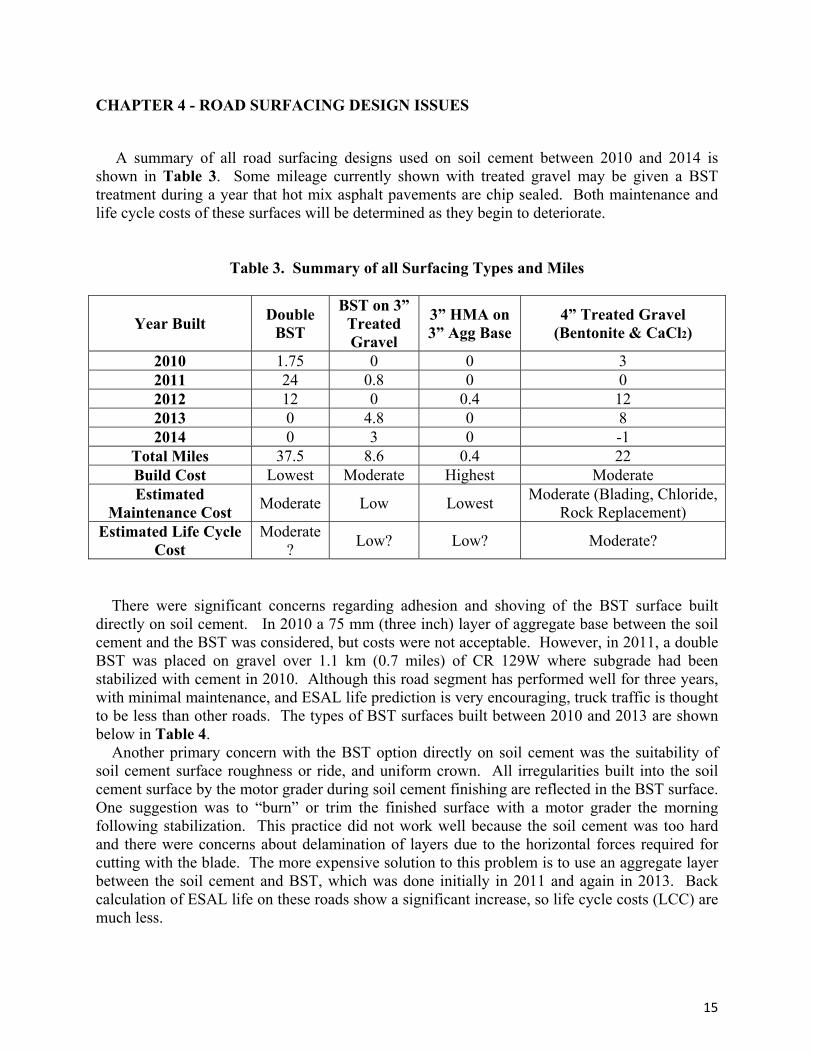
FIG. 11. Soft Subgrade Stabilization Designs From 2010 thru 2012, soil cement thickness designs were strongly influenced by funding and the maximum lift thickness that could be adequately compacted. By mid-2013 there was enough FWD data available to develop correlations for a soil cement thickness design procedure. This procedure is based on FWD tests on existing gravel roads. A somewhat weak but acceptable substitute for this process is the use of DCP tests that require some critical interpretation. The current thickness design details are explained in Appendix G. Modifications will be made after additional FWD tests are done and data from actual traffic counts and classifications becomes available. A traffic monitoring program was initiated in 2014 (Appendix Q). This design approach is specifically for lean clay soils, unlike results from recent research on granular and sandy soils (Scullion 2008). Figure 12 shows the relationship between the maximum FWD deflection and subgrade modulus. Although DCP tests were also done at FWD sites on CR 351, a relationship between these tests was not developed, because soil classifications and moisture contents were not completed.
FIG. 12. Relationship between FWD Deflection and Subgrade Modulus
y = 480035x‐0.997
R² = 0.9999
0
2,000
4,000
6,000
8,000
10,000
12,000
14,000
0 50 100 150 200
Subgrad
e M
r psi
Do‐Max Deflection‐Mils
Graph 1. Subgrade Mr vs Max Deflections ( From CR 351 Tests on Subgrade)
Load 5.‐6.7k MrNorm 6k MrPower (Norm 6k Mr)
5% of Road Area
Treated in 2011
15% of Road Area Treated
in 2012‐13
15
CHAPTER 4 - ROAD SURFACING DESIGN ISSUES
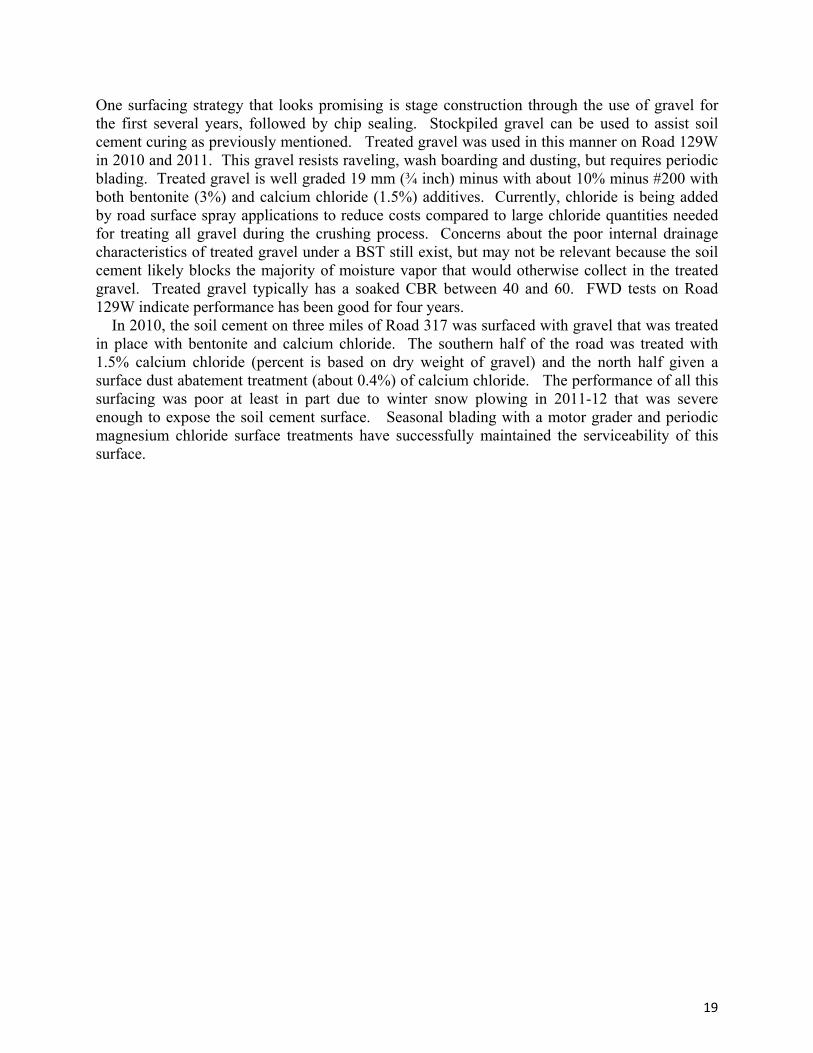
A summary of all road surfacing designs used on soil cement between 2010 and 2014 is shown in Table 3. Some mileage currently shown with treated gravel may be given a BST treatment during a year that hot mix asphalt pavements are chip sealed. Both maintenance and life cycle costs of these surfaces will be determined as they begin to deteriorate.
Table 3. Summary of all Surfacing Types and Miles
Year Built Double
BST
BST on 3” Treated Gravel
3” HMA on 3” Agg Base
4” Treated Gravel (Bentonite & CaCl2)
2010 1.75 0 0 3 2011 24 0.8 0 0 2012 12 0 0.4 12 2013 0 4.8 0 8 2014 0 3 0 -1
Total Miles 37.5 8.6 0.4 22 Build Cost Lowest Moderate Highest Moderate Estimated
Maintenance Cost Moderate Low Lowest
Moderate (Blading, Chloride, Rock Replacement)
Estimated Life Cycle Cost
Moderate?
Low? Low? Moderate?
There were significant concerns regarding adhesion and shoving of the BST surface built directly on soil cement. In 2010 a 75 mm (three inch) layer of aggregate base between the soil cement and the BST was considered, but costs were not acceptable. However, in 2011, a double BST was placed on gravel over 1.1 km (0.7 miles) of CR 129W where subgrade had been stabilized with cement in 2010. Although this road segment has performed well for three years, with minimal maintenance, and ESAL life prediction is very encouraging, truck traffic is thought to be less than other roads. The types of BST surfaces built between 2010 and 2013 are shown below in Table 4. Another primary concern with the BST option directly on soil cement was the suitability of soil cement surface roughness or ride, and uniform crown. All irregularities built into the soil cement surface by the motor grader during soil cement finishing are reflected in the BST surface. One suggestion was to “burn” or trim the finished surface with a motor grader the morning following stabilization. This practice did not work well because the soil cement was too hard and there were concerns about delamination of layers due to the horizontal forces required for cutting with the blade. The more expensive solution to this problem is to use an aggregate layer between the soil cement and BST, which was done initially in 2011 and again in 2013. Back calculation of ESAL life on these roads show a significant increase, so life cycle costs (LCC) are much less.

16
Table 4. Bituminous Surface Treatment Options
(a) Treated gravel is crushed rock with bentonite and calcium chloride additives.
The BST on paving fabric option was selected due to concerns about adhesion to the soil cement surface. Figure 13 shows a cut section of the finished chip seal with underlying geotextile where no adhesion exists to soil cement and minor lateral movement has occurred. This cut in the BST was made one year after construction. All roads where this option was used required blotting the following summer, due to asphalt cement application rates being too high. On Road 321N, some areas of the BST eventually shoved towards the shoulder. This problem is likely due to a combination of high asphalt application rates and road surface crowns exceeding four percent. Fabric under the BST may have helped performance to some extent, but good performance of the clean chips without fabric made the more costly fabric option less desirable. A portion of the soil cement and chip seal on fabric was successfully milled up at the end of Highway 201 to demonstrate that soil cement with a BST on fabric could be repaired effectively. Corrugating the soil cement surface with carbide cutting edges on motor graders was done on Road 129W primarily because of concerns about delamination in the top of the soil cement. The advantages of the roughened surface for holding the BST in place was later dismissed when similar performance was achieved in a side by side comparison on non-corrugated soil cement on a steep grade on the north end of CR 321N. Figure 14 shows the corrugations made by carbide “pick” style cutting edges on motor grader blades.
Double BST Type
County Road Number
Year Built
Km (mi) Asphalt AggregateSoil Cement Surface Prep
129W 2010 0.5 (0.3)AC-10 & MC-3000
Corrugated
201 & 321N 2011 8.2 (5.1)
Clean Chip321N (S end S
bound lane)2011 0.2 (0.1)
321N (N end S bound lane)
0.4 (0.25)
Corrugated
321N (N end N bound lane)
0.4 (0.25)
Not Corrugated
143E, 324, 14629.6
(18.5)MC-70 Prime &
Blotter129W 1.1 (0.7) Treated Gravel (a)
Clean Chip314, 143W,
4802012
15.0 (9.4)
HFE CRS-2P
none
Clean Chip350 Rau School
2012 & 2013
3.2 (2)PASS & CRS-2P
Untreated Agg Base
16 mm & 9 mm (5/8" & 3/8") clean chips
Clean Chip on Paving
Fabric16 mm & 9 mm (5/8" & 3/8") clean chips
AC-10 & CRS-2P
Not Corrugated
Otta Seal 2011 HFE 125S16 mm (5/8”)
Graded aggregate

17
FIG. 13. Clean chip BST on paving fabric, CR 321N. Note lack of adhesion and significant lateral movement on soil cement surface. Photo insert shows road crown measurement of 5.8 percent, almost two percent over the specification limit.
FIG. 14. “Corrugated” soil cement surface prior to BST construction, CR 129W.
Corrugations made by carbide “pick” cutting edge on motor
grader blade

18
The Otta seal option was selected over traditional chip sealing in 2010 and 2011 to realize the benefit of using less expensive graded aggregate than clean single size chip aggregate. The Otta seal surfaces had to be blotted with 16 mm (5/8 inch) clean chips the year after placement to control bleeding. High float emulsion application rates varied from 1.8 to 1.9 liters/square meter (0.40 to 0.42 gal./SY) and aggregate rates varied from 18 to 21 kilograms/square meter (33 to 39 lbs/SY). Many areas also had to be patched where the BST stuck to tires on parked vehicles and was then pulled off the soil cement surface (Figure 15). The bleeding could have been reduced considerably by higher applications of graded aggregate during construction or by using harder asphalt cement in the emulsion. Also, questions were raised about the suitability of Otta seals on heavy haul truck routes. Bleeding may have also been caused by the oil distillate exceeding maximum limits. High float emulsion samples should have been retained for testing for one year to ensure that they met specifications. The specifications for the Otta seal emulsion (HF125S) and aggregate are shown in Appendix F. The use of the Otta seal was dropped in 2012 due to problems with 2011 work and also due to minimal cost savings over traditional clean chip treatments, since most of the aggregate cost was in haul, rather than the cost of the aggregate itself.
FIG. 15. Otta seal BST “pot hole” area where stopped traffic pulled BST off soil cement surface, CR 146W. The 2012 clean chip BST treatments built without fabric or soil cement surface corrugation appear to be working well. Those placed over a 75 mm (three inch) aggregate base appear to be working better for several reasons. The aggregate layer will reduce excessive compression forces and cracking caused by heavy loads on green soil cement. This layer can also act as an effective cure ‘blanket’ that helps reduce soil cement moisture loss so somewhat higher ultimate strengths can be achieved.
19
One surfacing strategy that looks promising is stage construction through the use of gravel for the first several years, followed by chip sealing. Stockpiled gravel can be used to assist soil cement curing as previously mentioned. Treated gravel was used in this manner on Road 129W in 2010 and 2011. This gravel resists raveling, wash boarding and dusting, but requires periodic blading. Treated gravel is well graded 19 mm (¾ inch) minus with about 10% minus #200 with both bentonite (3%) and calcium chloride (1.5%) additives. Currently, chloride is being added by road surface spray applications to reduce costs compared to large chloride quantities needed for treating all gravel during the crushing process. Concerns about the poor internal drainage characteristics of treated gravel under a BST still exist, but may not be relevant because the soil cement likely blocks the majority of moisture vapor that would otherwise collect in the treated gravel. Treated gravel typically has a soaked CBR between 40 and 60. FWD tests on Road 129W indicate performance has been good for four years. In 2010, the soil cement on three miles of Road 317 was surfaced with gravel that was treated in place with bentonite and calcium chloride. The southern half of the road was treated with 1.5% calcium chloride (percent is based on dry weight of gravel) and the north half given a surface dust abatement treatment (about 0.4%) of calcium chloride. The performance of all this surfacing was poor at least in part due to winter snow plowing in 2011-12 that was severe enough to expose the soil cement surface. Seasonal blading with a motor grader and periodic magnesium chloride surface treatments have successfully maintained the serviceability of this surface.

20
CHAPTER 5 – SOIL CEMENT CONSTRUCTION
Soil cement construction in 2010 was not a common process in Montana or the Dakotas, so experienced contractors were not locally available. Contractors for Richland County soil stabilization came from the states of Washington, Nevada, Ohio and in 2013, from Eastern Montana. Currently there are a number of soil stabilization contractors in Montana and others from out of the area that have done oil field pads and one state road in North Dakota. This type of construction requires an experienced contractor if it is to be done in a cost effective and timely manner. The 20 to 25 miles per year of road stabilization completed by Richland County is difficult unless work is started in early July and is allowed to be completed in late September. This amount of work is not realistic without an experienced contractor. The logistics of shipping and handling large quantities of cement, finding suitable water sources and developing an effective traffic management plan are all challenging. Although more time consuming than the traditional low bid contract, a Request for Proposal (RFP) type of contract is strongly suggested for larger contracts or multi-year contracts since soil cement construction is not routine in nature and the owner should have more than normal assurances that the work will be done well and in a timely manner. Suggestions for a rating criteria for an RFP contract are in Appendix P.
Construction practices were improved significantly each year since initial soil cement stabilization in 2010. The percentage of structural repairs to soil cement decreased significantly between 2010 and 2013 for the following reasons: better control of cement flow and content, better control of soil pulverization and moisture content, increased design thickness from 10 to 12 inches and more soft spot repairs done prior to stabilization. Table 5 summarizes the amount of soil cement structural repairs needed by year as of the fall of 2014.
Table 5. Extent of Soil Cement Structural Repairs
2011 (24 miles) 2012 & 2013 (30 miles)
Total Surface Area, SY 394,240 492,800
Total Repair Surface Area, SY 9,878 1,418
Percent of Total Work (a) 2.5% 0.3%
(a) Relative amounts of truck traffic are unknown, 2012 & 13 work may show additional defects
The amount of repairs in the driving surface have decreased even more than the repairs on soil cement. Repairs were significant for the Otta seal built in 2011, primarily due to improper application rates. Repairs on chip seal over geotextile on CR 321N will also be significant in 2015 prior to resealing all of 2011 work. Reconstruction of CR 321N to improve vertical alignment would have significantly reduced repairs, had there been enough time to deal with adverse soil and subsurface moisture conditions. A comprehensive set of construction and quality assurance specifications were developed to ensure a good quality structural section was achieved and recommended repair methods for

21
structural problems developed. Problems have occurred in the soil cement and road surface, and repair strategies developed. Changes made in construction practices, detection of soft spots and selection of road surface type has significantly reduced the number of performance problems. The soil cement compaction and surface finishing process was an ongoing concern primarily because compaction is critical for achieving the desired strengths, long term durability and a monolithic structure without delaminations. To make matters worse, there was a lack of agreement on the best compaction and finishing practices to use between agencies and contractors. Although the 2010 stabilization contractor insisted smooth vibratory drum compactors would work adequately, vibratory pad foot rollers were specified as the primary tool for achieving density due to the cohesive nature of clay soils and deep layer thicknesses. Based on many recommendations, Richland County adopted the practice of cutting down to, or just below the pad foot indentations during road surface finishing. In August of 2012, a contractor blade operator suggested cutting above the pad foot indentations to lessen the amount of horizontal cutting force on the upper layer during blading so that delamination would be less likely to occur. The shallow cutting practice appeared to work well for achieving the desired finish and time will tell if delamination problems develop. Although many use smooth steel vibratory rollers for finish rolling, a 25 ton pneumatic roller was used on all work because it did not bridge over low areas and seemed to tie the surface together better. The primary method used for curing soil cement was watering for 5 to 7 days. Water curing is challenging due to continuous hot windy weather and was seldom done at night. In 2011a prime coat and blotter were done at the end of each week. Some of the prime treatment was worn off the surface prior to chip sealing on the first soil cement roads since chip sealing was not started until most of the soil cement roads were built. Where roads were to receive a gravel surface, the gravel placement was often delayed until the whole roadway was ready. This delay caused some surface wear on the soil cement and occasional rains made the roads too slippery for safe travel. Magnesium chloride brine was used for curing in 2012 on a very small scale and appeared to work well for much longer periods than plain water. Magnesium chloride did not change soil cement strengths on specimens that were first cured for 7 days then soaked in magnesium chloride prior to compression testing. Heavy truck traffic control on green soil cement was a continuous issue since roads could not be closed to commercial truck traffic, cement transport/delivery trucks or cement distributor trucks that were loaded at central point staging areas. Ground Penetrating Radar (GPR) surveys have detected multiple layers, possibly suggesting potential horizontal shear zones within the stabilized layer, but are difficult to detect during DCP testing of weaker soil cement. A traffic control plan was developed for 5 and 6 day work weeks with one lane traffic segments that required traffic candling for 48 hours after finish blading. The 48 hour cure period was established by measurement of soil cement surface deformation and cracking from multiple slow passes of a 90,000 lb. three axle cement distributor truck. The primary weakness in the traffic control system was inadequate control of night time truck traffic and safety issues associated with inadequate stopping sight distance on blind vertical curves. Also, early in 2011, the contractor occasionally used the green soil cement on County Road (CR) 321 as a turnout for fully loaded cement distributors. Damage from this type of early traffic was measured by FWD tests on a staging area access on CR 314 in 2012. Deflections in the damaged area were 60 percent higher (24 mils versus 15 mils) than those in the surrounding soil cement. One possible improvement on this traffic control plan is to cure with three inches (compacted thickness) of gravel surfacing each day instead of water curing for one week. The aggregate would help

22
distribute heavy wheel loads and reduce green soil cement cracking. Aggregate could be applied with side dump semi-trailers and spread with an articulated blade to limit loads on the green soil cement. Daily aggregate cover would appear to solve both curing and traffic control issues, but if ½ mile of road is stabilized each day about 1200 tons of gravel surfacing would be required each day. After examining problem areas on 2011 cement stabilization, it was found that some areas of soil cement were ‘rubbleized’ in the wheel tracks from early heavy loads where soil cement had not been given adequate cure time to resist heavy vehicle wheel load crushing forces that exceeded soil cement compressive strength (Figure 16). Most of these problems were likely caused by construction traffic, although one problem area in particular was caused by movement of a drilling platform that was not disassembled. Figure 17 shows BST surface distresses that were patched that coincide with dual wheels in the left lane where green soil cement existed. The drilling platform had an estimated weight of 182,000 Kg (400,000 pounds) on multiple axles of off highway class trucks. The right lane showed no distress as it had three days more cure than the left lane.
FIG. 16. Wheel track cracking (rubblization) of 300 mm (12 inch) thick soil cement layer.

23
FIG. 17. Heavy load damage to green soil cement in left lane. Right lane was exposed to the same loading, but had three days of additional cure. Proper moisture contents at transverse joints at the beginning and ending of mixing runs are a concern. The pulverizer/mixer operator’s skill and mixing equipment capabilities to “ramp up” moisture delivery at the start of mixing runs is critical. The tendency is to error on the dry side to avoid having to blade out and re-mix overly wet areas prior to compaction. Figure 18 shows a wide pot hole that coincides with the location of a transverse joint that was likely on the dry side of optimum.
FIG. 18. Pothole location coincides with transverse joint location. Pothole caused by either low cement content, pulverization, moisture content or compaction. White straight edge is 2.4 m (eight feet) long and 25 mm (one inch) square.
24
CHAPTER 6 - REPAIR AND MAINTENANCE
Two types of structural problems make up the small percentage of problem areas that need repair.
Areas with adequate soil cement strength and very low subgrade strengths (CBR < 3) will be repaired adding three percent additional cement and mixing with water to 12 inch depths.
Areas with low soil cement strength and normal strength subgrade (CBR > 3) will be repaired by stabilization with six percent additional cement and mixing with water to 12 inch depths.
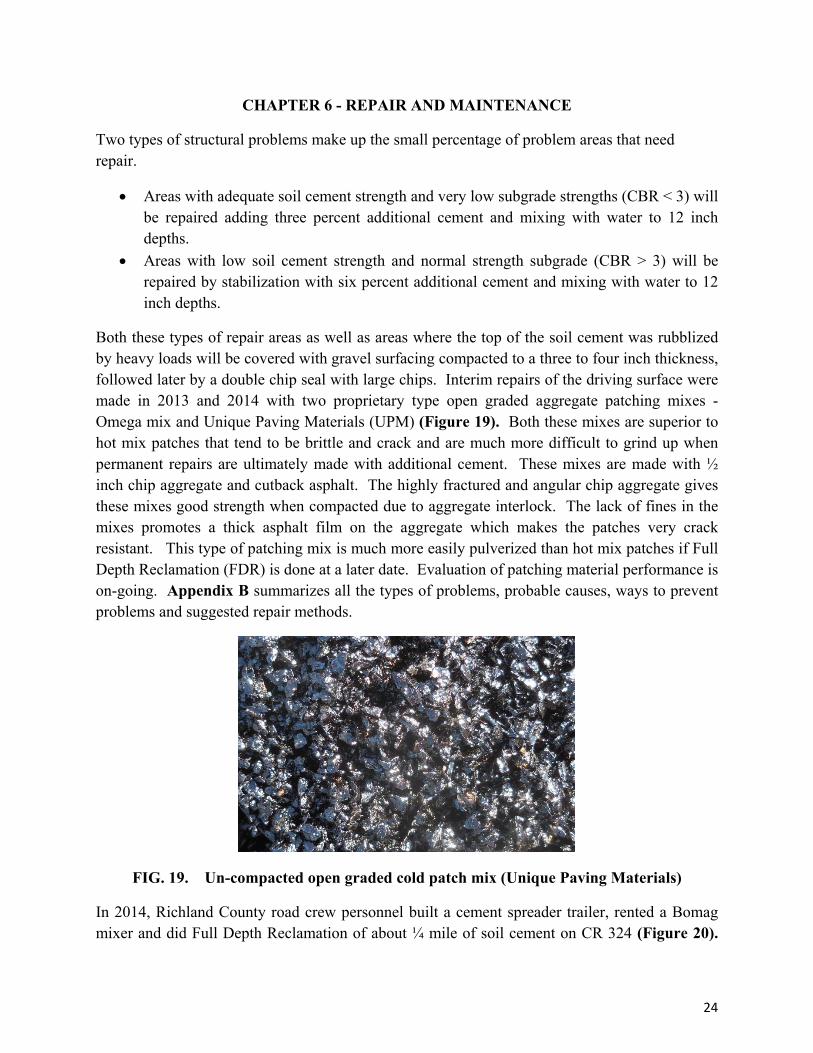
Both these types of repair areas as well as areas where the top of the soil cement was rubblized by heavy loads will be covered with gravel surfacing compacted to a three to four inch thickness, followed later by a double chip seal with large chips. Interim repairs of the driving surface were made in 2013 and 2014 with two proprietary type open graded aggregate patching mixes - Omega mix and Unique Paving Materials (UPM) (Figure 19). Both these mixes are superior to hot mix patches that tend to be brittle and crack and are much more difficult to grind up when permanent repairs are ultimately made with additional cement. These mixes are made with ½ inch chip aggregate and cutback asphalt. The highly fractured and angular chip aggregate gives these mixes good strength when compacted due to aggregate interlock. The lack of fines in the mixes promotes a thick asphalt film on the aggregate which makes the patches very crack resistant. This type of patching mix is much more easily pulverized than hot mix patches if Full Depth Reclamation (FDR) is done at a later date. Evaluation of patching material performance is on-going. Appendix B summarizes all the types of problems, probable causes, ways to prevent problems and suggested repair methods.
FIG. 19. Un-compacted open graded cold patch mix (Unique Paving Materials)
In 2014, Richland County road crew personnel built a cement spreader trailer, rented a Bomag mixer and did Full Depth Reclamation of about ¼ mile of soil cement on CR 324 (Figure 20).

25
This segment had very weak subgrade that should have been stabilized to deeper depths during initial construction in 2011. Three percent cement was added and mixed with water to at least 12 inches, then covered with three inches of gravel surfacing. Table 6 shows a spread table for 3% cement when mixed 12 inches deep. The soil cement was readily ground up, cement spread, water applied then remixed and compacted with their pad foot roller. The process would have been faster and more effective if the Bomag mixer had a spray bar that would have allowed more efficient water addition and mixing. About one half mile of gravel road soft spots were also stabilized with one, two and three percent cement, then covered with minimal amounts of gravel surfacing. FDR of soil cement problem areas and more gravel road soft spots are planned for treatment in 2015 after purchasing a mixer similar to the Bomag used in 2014.
FIG. 20. Full Depth Reclamation (FDR) of Soil Cement to 12 inch depths with the addition of 3% more Portland cement.

26
TABLE 6. Portland Cement Spread Chart for 3 Percent Cement mixed 12 inches deep.
Also in 2014 Richland County road crew personnel blade spread a three inch layer of hot mix over the intersection of CR 324 and 146. This “T” intersection had tight radius curves that made holding of the BST on soil cement a problem. Figure 21 shows this intersection with the inside curve radius armored with hot mix – this mix on the inside curves came from the cuttings during finish blading. The armor effect of the uncompacted hot mix will likely control trailer axle cutting on the tight inside radius curve.
Spread Length in Feet for Cement Load Quantity
Percent Cement: 3 Mixing Depth: 12" Application Rate, #/SF: 3.45
Lbs Tons 10 11 12 13 14 15 16 17 18 19 20 21 22 23 24 25 26 27 28
2,000 1 58 53 48 45 41 39 36 34 32 31 29 28 26 25 24 23 22 21 21
4,000 2 116 105 97 89 83 77 72 68 64 61 58 55 53 50 48 46 45 43 41
6,000 3 174 158 145 134 124 116 109 102 97 92 87 83 79 76 72 70 67 64 62
8,000 4 232 211 193 178 166 155 145 136 129 122 116 110 105 101 97 93 89 86 83
10,000 5 290 264 242 223 207 193 181 171 161 153 145 138 132 126 121 116 111 107 104
12,000 6 348 316 290 268 248 232 217 205 193 183 174 166 158 151 145 139 134 129 124
14,000 7 406 369 338 312 290 271 254 239 225 214 203 193 184 176 169 162 156 150 145
16,000 8 464 422 386 357 331 309 290 273 258 244 232 221 211 202 193 186 178 172 166
18,000 9 522 474 435 401 373 348 326 307 290 275 261 248 237 227 217 209 201 193 186
20,000 10 580 527 483 446 414 386 362 341 322 305 290 276 264 252 242 232 223 215 207
22,000 11 638 580 531 491 455 425 399 375 354 336 319 304 290 277 266 255 245 236 228
24,000 12 696 632 580 535 497 464 435 409 386 366 348 331 316 302 290 278 268 258 248
26,000 13 754 685 628 580 538 502 471 443 419 397 377 359 343 328 314 301 290 279 269
28,000 14 812 738 676 624 580 541 507 477 451 427 406 386 369 353 338 325 312 301 290
30,000 15 870 791 725 669 621 580 543 512 483 458 435 414 395 378 362 348 334 322 311
32,000 16 928 843 773 713 663 618 580 546 515 488 464 442 422 403 386 371 357 344 331
34,000 17 986 896 821 758 704 657 616 580 548 519 493 469 448 428 411 394 379 365 352
36,000 18 1043 949 870 803 745 696 652 614 580 549 522 497 474 454 435 417 401 386 373
38,000 19 1101 1001 918 847 787 734 688 648 612 580 551 524 501 479 459 441 424 408 393
40,000 20 1159 1054 966 892 828 773 725 682 644 610 580 552 527 504 483 464 446 429 414
42,000 21 1217 1107 1014 936 870 812 761 716 676 641 609 580 553 529 507 487 468 451 435
44,000 22 1275 1159 1063 981 911 850 797 750 709 671 638 607 580 555 531 510 491 472 455
46,000 23 1333 1212 1111 1026 952 889 833 784 741 702 667 635 606 580 556 533 513 494 476
48,000 24 1391 1265 1159 1070 994 928 870 818 773 732 696 663 632 605 580 557 535 515 497
50,000 25 1449 1318 1208 1115 1035 966 906 853 805 763 725 690 659 630 604 580 557 537 518
Cement Qty Treatment Width, ft

27
FIG. 21. Blade laid hot mix on intersection of CR 324 and CR 146
Cutting of corners and wearing away un-stabilized shoulder soil is a problem, especially where horizontal curves are tight and sight distance is limited. Figure 21 shows where one truck trailers cut a corner shortly after wet weather. Full depth hot mix armor on these inside curves may be a viable repair method for this problem. If this horizontal alignment problem is recognized prior to soil stabilization, the curve radius could be increased, or curve widening added during soil stabilization to mitigate the shoulder drop off problem. Shoulder striping and shoulder drop off signs are other options to consider.
FIG. 22. Weak shoulders outside the 28 foot wide subgrade soil stabilization.
Photo to be added later

28
CHAPTER 7 - CONSTRUCTION SPECIFICATIONS
Comprehensive construction specifications for soil cement were initially developed in 2011 and further refined in 2012 and 2013 (Appendix C1). The resulting specifications were based on information from a search of many road agency and trade organizations and reviewed by four contractors with many years of experience in soil stabilization construction from various parts of the country. Many agencies are familiar with Cement Treated Base (CTB) specifications but they are of little use for soil cement. In February of 2013, detailed Quality and Quantity Assurance (QQA) specifications and field test methods were written for the purpose of awarding a materials engineering consultant contract with the goal of reducing costs (Appendix G1 and G2). Unfortunately this contract was never advertised so competitive costs for this work was never determined. Table 7 summarizes QQA work contained in both the 2013 and 2014 specifications
Table 7. Quality and Quantity Assurance Work Summary
2011-2013 QQA Work Items Done by Owner 2014 Primary Responsibility
Owner QQA Method
Equipment inspection Owner Visual Road crown & smoothness before & after stabilization Owner Measured Cement Scale for Payment Owner Certification Cement application rate testing with tarps Contractor Visual Cement waste Not Required na Pulverization Owner Visual Mixing Depth Contractor Visual Moisture Density Test Curves Not Required na Finished Density Testing Contractor Visual % Compaction Contractor Estimated Mixing & Finishing Time Contractor Visual On-going curing & condition evaluation Not Required na Water and Portland Cement Quality Contractor Visual Unconfined Compression Strength Not Required na As-Built Drawings Not Required na
In 2014, construction specification revisions were made to reduce Richland Counties cost for QQA by requiring the Contractor to gather some of the more “less sensitive” production data and also eliminate all QQA testing and documentation by the owner. Less sensitive tasks are ones with lower potential for conflict of interest. In this version of the specification (Appendix C2) two QQA personnel are needed instead of four and their work is done by visual inspection of the 19 tasks (Appendix G1 & G2). Unfortunately, this approach may not reduce initial cost funding because the two individuals have to be more highly qualified than the four, bids will increase for tasks passed onto the Contractor, and the spec had to be written in a more prescriptive manner. Prescriptive specifications can increase costs for a number of reasons. For example, to ensure adequate pulverization, the 2014 spec requires the mixer to run at high rotor speeds and slow ground speeds to achieve pulverization. Although operating in this manner may not be necessary at all times, higher bids will result in order to cover costs of this slower production

29
process. Also, prescriptive specs reduce the incentive for Contractors to utilize their expertise and ingenuity in getting the work done in a manner they are familiar with or a process that utilizes more efficient and lower cost methods. This approach to QQA does raise owner risk and likely life cycle costs since quality is based on what a trained individual observes rather than on non-bias test results. The argument for a more prescriptive specification is that (1) little has been learned about improving work quality from soil cement contractors during the first three years of soil cement construction and (2) after three years of construction Richland County personnel are in a pretty good position to know what is required to do the work in a cost effective manner. The interest in changing the 2013 specification came from a desire to reduce costs for quality and quantity assurance and there was a perception among contractor and some consultant personnel that many QQA requirements (especially for moisture content and pulverization) were over emphasized. Common sense and the literature contradicts this perception (Petry 1988). Some of the primary changes in the 2014 specification are summarized below. In the 2014 specification, the Owner’s burden is increased in the following areas:
Prior to stabilization, grading road tangents to 3 percent and super-elevations as desired, correcting minor profile and alignment problems.
Daily placement of gravel surfacing over the freshly compacted and finished soil cement so that curing costs are reduced, curing effectiveness is increased and green soil cement is better protected from heavy trucks
After stabilization is completed, shape road-side to insure properly shaped in-slopes, ditch and shoulder tie-ins to the final stabilized road section.
In the 2014 specification the Contractor’s is burden is increased in the following areas:
Certified scales if cement is stored on site 18 hour per day manned road closure, MUTCD signage, including two reader boards for
the duration of the work 24 hour water and cement quality sampling and testing on selected random samples, Cement spreader rate testing to ensure uniformity of spread Staking of treatment segments and documentation of production data on cement spread
rate, amount of additional mixing, and two hour limit verification Length of additional regrinding passes (will be paid as a bid item based on length
measurement by station). Pad foot rolling must be continuous until “walk out” occurs In-place nuclear gauge density & moisture testing of soil cement after soil cement
compaction and finishing. The Owner’s QQA personnel are responsible for determining the actual target density and corresponding percent compaction based on old moisture density curves, soil type and texture, percent retained on the number 4 sieve, and moisture content.
The 2013 specs are more of an end result spec and the 2014 version is more prescriptive. The prescriptive nature of the 2014 version will likely increase costs due to slower speeds to ensure pulverization and other required practices that may not fit well with some contractors that would normally bid on the work. Also, tension between parties is expected to increase over moisture
30
content since more water requires more water trucks and can slow the pad foot “walk out” which may require a second pad foot roller to maintain the desired production rate. Obviously, the key to making the 2014 specification QQA work well depends on the owner selecting two individuals that have the right technical capabilities in soil cement laboratory testing, soil cement construction, materials engineering, and contract administration. The end result specification used in the past with more intense quality and quantity assurance may actually be less costly when considering both initial and life cycle costs. The temptation to put all the QQA requirements within the construction contract is not recommended without comprehensive verification. Unfortunately most of the inspection elements cannot be verified by inspection after work has been completed so the end result verification approach is very high risk and impractical at this time. End result verification may at some later time be possible by using Falling Weight Deflection (FWD) and back calculation of strengths. Taking this approach at this time would raise bids considerably. Using the Request for Proposal (RFP) type of contract may be the best type of contract method to reduce both initial and Life Cycle Costs (LCC). Unfortunately getting RFP contracts out in a timely manner has been difficult, and administrative costs for awarding the contract have been higher than desired. One option that may make the RFP option more attractive is to make it so the contract can be renewed for multiple years. Regardless of which type of specification or type of contract is selected, a balance between initial cost, LCC and risk must be considered. Although most management personnel in rural low volume road agencies (Counties, Cities) recognize the value of LCC, they normally do not have enough funding for their road network to be able to make it a priority.

31
CHAPTER 8 - SOIL CEMENT QUALITY AND QUANTITY ASSURANCE The extent of testing and measurements taken in 2012 and 2013 are illustrated in Table 8. This table is the daily QA report sheet generated prior to the start of the next day of work. Each of the four field inspectors generated detailed field reports that fed the daily QA report for each of the cement spreads. Cement spread lengths varied from 120 to 180 meters (400 to 600 feet) in length. When work was found to be out of specification and not corrected, QA personnel gave a written notice to contractor representatives explaining the deficiency. Out-of-specification materials test results were colored red on the daily QA report (Appendix E1).
Table 8. Daily Quality Assurance Report Format
Daily QA Measurements
Typical Number of
Measurements per Cement
Spread
Date ______ Cement Spread No ___
Cement Spread No ___
Cement Spread GPS Coordinates 2 Road Crown, Alignment & Width 3 Cement Spread Accuracy 2 Mixing Depth (Compacted Thickness) 1/10 spreads Percent Pulverization - Tests/Estimate 2/30 Mixing Moisture Content Estimate 30 Compacted Moisture and Density 5 Surface Crown, Smoothness & Duration 3 Curing Moisture Moisture Density Curve 1/30 spreads Unconfined Compressive Strength 1/30 Spreads Portland Cement and Water Quality 1/50 Spreads Condition Evaluation (cracking, unbounded soil, rutting, raveling, low moisture, delamination)
10
Significant problems developed with contractor built cement spreaders at the start of the 2012 construction season. These spreaders were eventually replaced with commercially built machines that were able to meet the specified spread accuracy requirements. Cement spread uniformity problems were improved by devoting an inspector to observing spreaders as well as checking for overlaps and calculating spread rates from truck scale weight and road area covered. In 2012, questions regarding the importance of cement spread accuracy led to Unconfined Compression Strength (UCS) testing on CR 314. Contractor personnel believed that the mixing process would fix non-uniform cement spreads. UCS tests on mixed soil where cement was light along the outside shoulder and where it was uniform indicated a 33% loss in strength in the lower cement spread area. The widths and alignments of cement spreads were improved significantly in 2013 by requiring a motor grader to first build a 150 mm (six inch) high shoulder berm and then a centerline berm using a consistent preset blade angle to get a uniform width for cement spreader alignment. See Figure 22.

32
FIG. 23. Cement spread placement and alignment controlled by berms along road shoulder and centerline. Road surface ripping prior to cement spreading reduces cement “flow” caused by water truck and pulverizer/mixer tires. The best method of controlling cement spreads was found to be by running multiple yield checks while spreading. The spreader truck operator adjusts his vehicle speed within 30 meter (100 foot) road lengths to achieve the required weight of cement spread. This method requires the spreader truck to have accurate truck scales and an electronic odometer that reads in meters or feet. Equipment with integrated vehicle speed and vane feeder revolution speed were inconsistent due to variations in bulk unit weight of cement. Cement unit weights are changed significantly by many factors, the most critical being the haul road roughness, haul speeds, and if spreading uphill or downhill. The movement of cement on the road surface caused by water truck and pulverizer/mixer tires was worse in some areas than others. Shallow ripping of the road surface just after making shoulder and centerline berms and prior to spreading cement was found to help considerably. Within 6 months after year 2011 stabilization was complete, depressions along road shoulders and some centerline locations were observed. DCP testing and pick axe probing of the depression areas indicates low cement content (Figure 23). The location of these depressions suggests cement was displaced out of these areas by construction vehicle tire traffic prior to mixing. During the first three years of stabilization, contractor personnel continually indicated the pulverizer/mixer would “even up” any problems caused by cement movement. However, if the “even up” theory were true, there would be no way to avoid excess moisture content when the pulverizer/mixer makes a longitudinal overlap pass. The photo in Figure 24 shows that pulverizer/mixers do not move cement left or right to any significant extent. In this photo the
Cement
“Flow”

33
pulverizer/mixer wondered off the road and the cement application stayed where it was initially placed.
FIG. 24. Pick axe probe to determine if sufficient cement was used in rutted areas. Photo was taken six months after stabilization. Pick penetrated 50 mm (2 inches) into dense clay – no strength from cement was evident in soil chunks.
FIG. 25. Cement is not moved left or right during mixing.
Cement spread not moved
left or right during mixing
4 inch
penetration

Treatmquite accinspectioultimatelmixing dreplacem Somemoisture thresholdinjected mroad weruniform mthe “Wirwere beliand contr2012 befUniform cleaned tcleaning There increasinmultiple strengthspulverizathird passtrength photos oshows gomoisture
FIG. 26
ment depths curate for theon element sly the structudepth come
ment. areas of stacontent en
d difficult, wmoisture ware generallymoisture con
rtgen 2500 oieved to havrol. Unforfore equipme
moisture cothe mixing cto keep the wwere times
ng rotor spepasses. Co
s of 1532 kation. Similas provides limore than
of problems ood pulverizcontent and
6. Unaccept
were checke Terex and since variatiural strength s from the
abilization wncountered. while short as not reduce drier than ntents were
or equal” stave the abilityrtunately 12ent operatorontents werechamber aftewater spray when pulveed, decreasiompanion UkPa (222 psar findings hittle pulverizthe gains asencountere
ation near thd soil type va
table moistucaused by
ked more oftWirtgen pu
ions in deptand life of tdesire to i
were more pro Heavy clasections of ed rapidly eshoulders dactually a si
abilizers wery to achieve miles of stas finally unde not achiever each cembar unclogg
erization effoing ground
UCS tests consi) for 43%have been puzation improvssociated wi
ed with twohe road centeariations acro
ure uniformy inadequat
ten at the staulverizer mixth directly the stabilizatncrease dail
oblematic thays made asilts and sa
enough. Alsdue to higheignificant prore specified
higher pulvabilization wderstood howved consiste
ment spread. ged is emphaorts could nospeed, closinducted in 2
% pulverizatublished by vement, andith slightly
o other pulver and bad poss the road
mity primarite mixing ch
art of each pxers. Routininfluence cetion treatmely productio
han others deachieving thands createdso, moisture er compactiooblem in 20because the
verization anwas completw to properlently until 2 The need f
asized in the ot meet the ing mixing 2013 in the tion and 17Petry (1988
d delays combetter pulve
verizer/mixerpulverizationsurface.
ily due to inhamber clea
project and wne depth cheement conte
ent. The temon and cost
epending onhe 80 perced very wet contents in
on in the ro10, 2011 an
ey were readnd better moted with the ly adjust the2013 when afor frequent Wirtgen equ80 percent chamber dosame locatio
766 kPa (25). It was de
mpaction whierization. Fr manufactu
n near the sh
nternal spraaning.
were found ecks are a crent accuracy
mptation to ret for carbid
n the soil typent pulverizconditions wthe center o
oad center. nd 2012. In 2dily availableoisture unifor
Wirtgen 25e water spraya new contrmixing cha
uipment manthreshold deoors and maon indicate 756 psi) for etermined thaich likely redFigure 25 surers. Figurhoulder cause
ay bar plugg
34
to be ritical y and educe de tip
e and zation when of the Non 2012, e and rmity 00 in y bar. ractor amber nual. espite aking 7 day 66%
at the duces shows re 26 ed by
ging

35
FIG. 27. Good pulverization on left and bad pulverization on right. Maintaining moisture one to two percent above optimum was an ongoing struggle between contractor and QA personnel due to the water haul cost and lower production associated with more water usage. Also, the moisture contents above optimum were blamed for not being able to achieve pulverization and creating excessively wet areas when silts and sands were encountered as shown in Figure 27. Durability is significantly reduced by dry un-pulverized clay balls retained on the number 4 sieve as reported by Kersten (1961). The specification calls for 80 percent pulverization and mixing moisture contents above optimum. Although these requirements were often extremely difficult to enforce, they were never changed. An inspector was continually devoted to moisture adjustments and pulverization assessment. The need for adequate moisture is well documented especially where clays are encountered that are difficult to pulverize. The ability of QA personnel to confidently estimate optimum moisture for various soil mixtures and the ability to work with equipment operators and contractors cannot be overemphasized.

36
FIG. 28. Sandy silt wet area from perched water table close to road centerline. Early in the stabilization process, efforts were made to correlate nuclear gauge moisture readings on un-compacted mixed soil with gravimetric samples from the field laboratory. This was done to lower the subjectivity of estimating the correct moisture content by hand squeezing soil. This effort was dropped because (1) results were somewhat scattered perhaps due to the loose state of soil being tested by the nuclear gage and (2) optimum moisture can change quickly when encountering different soil combinations. A more productive moisture verification process is to occasionally pound a single point proctor and hand squeeze the soil to make a judgment regarding how close you are to optimum. If single point proctors are done they should be pounded right after sampling on site as indicated in Figure 28 since cement hydration will change moisture content if delayed. The extent of shoving in the mold is an indicator for how close moistures are to optimum provided QA personnel are aware what the soil should look like during compaction at different moisture contents.
37
FIG. 29. Single point proctor sample pounded on site immediately after sampling. Achieving 97 percent of standard compaction effort was achieved about 90 percent of the time, primarily due to continuous moisture monitoring and adjustment during mixing. Numerous laboratory moisture density tests were done so that the correct relationship could be selected during in-place density testing of finished soil cement. Diligent pad foot roller operators and timely finish blading and compaction were also critical elements to achieving compaction. Heavy vibratory pad foot rollers exceeding 11,000 Kg (25,000 lbs.) worked well for 300mm (12 inch) layer compaction. The kneading action from a 23 t (25 ton) pneumatic roller was also thought to be critical for compaction in the top 100mm (4 inches) and for finished surface sealing. Nuclear gauge testing was not done directly after pad foot rolling since the practice delays the compaction and finishing process and results were quite variable. Instead, the roller pattern was continually evaluated for consistency and density testing was done immediately after finishing. Most all compaction and finishing was completed within 2 hours of mixing cement. Delaying density testing for any length of time makes it very difficult to drive probes into the soil cement that hardens as the work progresses. Although the technology associated with the Intelligent Compaction (IC) rollers is believed to be of value, equipment operators in 2012 stopped rolling when they believed that the IC roller feedback indicated they were “over rolling” the soil cement even prior to the pad foot drum “walking out”. Quality Assurance (QA) personnel felt that the roller should never stop until walking out since the specification indicated compaction was to be maximized. More extensive operator training by more experienced roller manufacture personnel would have been beneficial. Unconfined compressive strength testing was done during stabilization of all roads built in 2011, 12 & 13. About 64 tests were conducted on 86 Km (54 miles) of soil cement construction. Field UCS specimens were generally 345 kPa (50 psi) lower than strengths from laboratory mix designs. This drop in strength is mainly due to time delays between field mixing and compaction

38
of the field UCS samples which does not occur when mix design testing in the laboratory. Compacting UCS specimens beside the road instead of in the field laboratory produces more realistic compression strengths. Field UCS test procedures and techniques used are considered very reliable since the spread in strength test results between 3 specimens from the same area were very small. Test results from different areas often had wide variations in strength that are due to variations in cement content, percent moisture and pulverization. The DCP was used after finish blading to help detect any major problems with strength development. Correlation was poor between DCP tests in the top two inches of soil cement and UCS strengths, perhaps due to variable moisture content of the soil cement surface from variable water curing conditions. The quality of water and Portland cement was checked when water sources changed as most were not potable. Mortar cube strength test results of project water and cement were compared to strengths achieved with samples made from control samples of water and cement with known quality. Tests were done after 24 hours of moist curing so that work could be stopped within 24 hours if problems existed. No problems were detected with water or cement quality. Costs for quantity and quality assurance are shown in Table 9. The costs were considered very high by many individuals, but are likely very low when considering the benefits associated with a longer performance life with less maintenance and when costs are spread over the life of the structural section. The QA costs for 2012 were higher mainly due to three weeks when the contractors cement distributors could not meet spreading accuracy specifications. Table 9. Costs for Soil Cement and Quantity and Quality Assurance.
Item Unit 2011 2012 Contract Quantity Square Feet 3,800,000 4,200,000 Stabilization (No Cement Cost) Cost/SF $2.12 $1.60
Quality & Quantity Assurance Cost/SF $0.065 $0.094 % of Stabilization 3.1% 5.9%

39
CHAPTER 9 – SOIL CEMENT EVALUATION After three years of construction, problem areas in soil cement accounted for fewer than 2.8% of the total miles constructed (Table 5). Although this percentage may seem small, road users and agency officials think it is significant. FWD and DCP testing was also used in 2013 to help determine the cause of soil cement distresses and identify the size of the problem area by testing at 10 to 15 meter intervals in both lanes of some road segments. Problem areas were first located by high deflections from previous surveys, and then from visual recognition of road surface rutting and depressions. Where soil cement was weak, DCP testing was done through the road surface to determine soil cement thickness, identify delamination, and determine the depths and strength of soil layers three feet below the road surface. Repair strategies were developed from FWD and DCP data (Chapter 6). The primary tools used for biennial evaluations are the Falling Weight Deflectometer (FWD) and Ground Penetrating Radar (GPR). This work was done by the Montana Department of Transportation Non-Destructive Testing Data Unit, located in Helena Montana. Their FWD device was made by Foundation Mechanics Inc. (Jils/20T/year 2010) and the GPR was made by Geophysical Survey Systems, Inc. (Air launched Horn Antenna/2Gigahertz Year 2006 & 2010). Tests were done in the fall after soil cement construction to establish a base line and provide feedback on construction method consistency prior to influences from cold weather, freeze thaw and heavy traffic. Tests were run in the outside wheel track of one lane at intervals between 20 and 250 meters, depending on the length of road segment, work time available and weather conditions. GPR data for layer depths was also obtained for each FWD test site. Some conclusions from biennial FWD and GPR surveys are as follows:
Plots of maximum deflections, and back calculated pavement moduli over a period of years indicates there is a considerable amount of deflection and soil cement elastic modulus recovery that takes place between spring and fall tests on a regular basis, (Figure 7)
Deflections do not appear to be increasing or soil cement modulus decreasing significantly after the first year. This suggests that little deterioration in the pavement structure has taken place and soil cement durability is good at this point.
As built drawings were made each season and were found to be critical for determining the cause of performance problems and documenting where special sections were built for evaluation. The GPS locations of each cement spread and problems areas were recorded and then transferred to the drawings each day. Field notes from quality assurance personnel and locations of UCS tests were recorded. Field notes were found to be a very convenient and critical means for determining the cause of problems (Appendix E1).

40
CHAPTER 10 – CONCLUSIONS Where suitable soils exist, subgrade soil stabilization with Portland cement is normally very cost effective for the following reasons:
Much less expensive aggregate used, Much less aggregate haul cost and Less cost for embankment reconstruction and Right of Way acquisition to accommodate
thick aggregate and hot mix structural sections. FWD testing and observations indicate the most cost effective soil cement design for Richland County is 12 inches of soil cement at 300 psi with three inches of gravel and a double BST driving surface. Seasonal FWD testing indicates soil cement appears to possess the capability to recover from high deflections in the spring. The soil cement moduli determined by FWD back calculation after four years is still at least twice that of new aggregate and perhaps three times that of new aggregate in very poor drainage conditions. FWD test surveys are invaluable for making assessments of soil cement durability and long term cost effectiveness Soil cement layers have not exhibited the severe freeze thaw weakening characteristic as seen in the gravel base course layer used under hot mix asphalt pavements in this area. Uniform cement content, correct moisture content, 80% pulverization and high compaction are very critical to achieving durable, cost effective soil cement.
More uniform cement applications can be achieved by building shoulder and centerline berms and ripping the road surface.
Uniform moisture contents can be achieved if the water spray bar in the soil cement mixing chamber is cleaned after mixing each cement spread of 500 feet.
Pulverization can be increased by higher drum speeds, lower ground speed and remixing a second time. Contract administration arguments can be reduced by specifying drum speed, ground speed and pay for remixing passes to improve pulverization.
Specifying minimum size pad foot rollers and requiring pad foot rollers to roll until they walk out may be an effective means to achieve maximum compaction and avoid the expense of density testing. However, this will likely increase arguments on the correct moisture content and slow production which would increase overall costs.
Soil Cement repairs can be reduced significantly by the following:
Employing knowledgeable and diligent Quality and Quantity Assurance personnel that can work with contractor personnel is essential
Pretreatment of soft spots before soil cement stabilization will extend treatment life The cost for road surface repairs can be reduced by making repairs as soon as possible. Proprietary open graded cold mixes (UPM or Omega mix) or spray patching appear cost effective, although repair life is still uncertain. Soil stabilization contractors with good equipment, intentions and considerable experience do not necessarily possess a good working knowledge of their own sophisticated construction equipment or soil stabilization technology. Contractors will normally have problems meeting specifications with unfamiliar specifications, equipment, soil, aggregate, asphalt and weather conditions.

41
CHAPTER 11 - CONCERNS
Although soil cement is considered to be a cost effective option for Richland County roads, there are some lingering concerns which are listed below:
Even though a considerable amount of FWD work has been done for four years, very long term freeze/thaw, wet/dry cycle durability and cracking may be an issue due to extreme weather conditions. Commitment to continuing the FWD testing and analysis is a concern.
Although maintenance, repair and reconstruction work has been done to some extent, costs associated with these activities have not been monitored for extended periods. Life cycle cost analysis is a concern.
Quality and Quantity Assurance (QQA) was a significant cost item on the work done during 2011 through 2013 and is felt to be essential to reducing post construction costs for maintenance and repairs. Commitment to this level of QQA is a concern.
Location and pre construction treatment of soft spots significantly influences construction and maintenance costs. Commitment to treating soft spots in gravel roads prior to stabilization is a concern.
Although a comprehensive mechanistic structural design is being developed for the Richland county clay soils, there are some basic design issues that are of concern:
o Little ability to predict truck traffic volumes o Limited ability to control very heavy loads and enforce weight limits during
winter and spring breakup o Modulus of rupture on cement stabilized lean clay material is needed for a more
accurate structural design process.
There has been a significant amount of knowledge gained from Richland Counties commitment to comprehensive construction practices and monitoring of performance. Continuing this commitment and technology transfer is a concern.

42
CHAPTER 12 - RECOMMENDATIONS Structural Section Design:
From the seasonal FWD testing and associated mechanistic analysis establish the appropriate long term pavement design parameters for cement stabilized lean clay and refine the appropriate distress models. Using these results develop a relatively simple thickness design catalog that requires input for subgrade strength, traffic, stabilized soil strengths and design reliability for the Richland County Area.
Where heavy truck traffic exists, use a maximum soil cement thickness of 12 inches, a three inch layer of aggregate and a double BST. If this design results in undesirable stresses in the soil cement or strains in subgrade, increase the thickness of aggregate base and if necessary add a surface layer of hot mix asphalt. Normally, more base and hot mix are not necessary if road soft spot soils are modified with three percent cement to 18 inch depths.
Modify soft spot reinforcement cement content and treatment depth based on long term comparisons of FWD deflections and increases in deflections between 2011 and 2012 reinforcement methods.
Use the soil cement option in the following circumstances o High rock costs o Embankment widths are too narrow to accommodate thick structural sections built
on top of existing subgrade o Road side drainage is poor and “bathtub” type structural sections with untreated
aggregate base are unacceptable. Use a 75 to 100 mm (three to four inch) thick compacted layer of crushed gravel between
soil cement and the bituminous road surface to improve ESAL life, reduce asphalt cracking, reduce soil cement finishing tolerances, reduce concentrated loads on soil cement, improve soil cement cure and decrease soil cement damage from heavy truck loads.
BST surfacing is not recommended directly on soil cement especially where heavy truck traffic exists. Three inches of gravel on soil cement provides significant benefits.
Tight radius intersections and approaches should be paved with hot mix to withstand heavy truck turning movements. Blade laying of hot mix appears to work well at least in rural areas.
HMA paving is not recommended directly on soil cement except at intersections due to reflective cracking.
Soil Cement Design & Construction:
Continue to use unconfined compression target of 300 psi when determining percent cement in laboratory mix design work. Assume that unconfined compression targets will be 50 psi lower due to delays in compaction. Reduce delays by compacting specimens immediately after sampling the grade.
Use the tube suction test to provide an indication of long term damage from freeze thaw exposure.
Use experienced personnel for road surface sampling and for mix design work.

43
Road Surface Design and Construction: Use clean ½ inch chips and polymerized rapid set emulsions to build BST road surfaces. If BST surfaces bleed and need blotting, do not use traffic control to stop vehicles on the
bleeding surface, as parked vehicle tires stick to the BST and pull it off the soil cement. These “pull out” (pothole) areas have to be repaired by patching. Instead, close road segments and divert traffic around the blotting operation and use reader boards one day ahead to warn of closures and identify alternate routes.
When improving road geometrics, complete alignment and finish grade work at least one year ahead of soil cement stabilization to reduce settlements and detect new soft spot locations. Excavate cut sections and build embankments with thin lifts with moisture conditioned soil especially where wet soils exist. Strive to get a mixture of soil types to reduce frost susceptibility and saturation from perched water table. Utilize Portland cement to dry up and stabilize areas that have high ground water.
Permanently modify subgrade soil soft spots on existing gravel roads with three percent Portland cement to a depth of 375 mm to 450 mm (15 to 18 inches) to reduce the amount of gravel required for this purpose and also reduce the amount of soil cement repairs after stabilization is eventually completed.
Construction Specifications & Contract Administration: The amount of QA/QC work needed depends on the contractor, soil conditions, size of
project, weather, acceptable degree of risk, ability to fund repairs, etc. o Where a relatively small amount of soil stabilization is to be contracted, use the
2014 specification (Appendix C2) with two personnel who are well trained in soil cement work that can make reliable visual assessments of quality.
o For larger contracts use the 2014 specifications and advertise a request for proposal contract for quality and quantity assurance services using two options. One option is for services conforming to specs in Appendix E1 and Methods in Appendix E2. The second option is for services by visual inspection discussed in Table 7 of Chapter 7. Five percent of construction costs are normally considered realistic, but proposals may be higher due to the remote work locations.
Employ a qualified materials/construction engineering consultant to monitor and manage the contract work.
Require the pulverizer/mixer water spray bar to be flushed and the mixing chamber cleaned after mixing of each cement spread.
Specify that road surface finishing be restricted to depths above pad foot marks to reduce the potential for delamination.
Require pad foot rollers to operate continuously until the drum walks out Allow the engineer to require multiple applications of magnesium chloride for curing
when watering is not effective due to weather conditions, traffic, night time conditions, etc.
Terminate all soil cement construction by August 15, and require emulsion BST construction with clean chips to be completed before September 1. Consider specifying a reduction in payment for unfinished work based on 1.5 times unit costs for work not completed by the dates specified or utilize Liquidated Damages clauses in the 2013 specifications.

44
Use a Request for Proposal type of contract to (1) reduce risk, (2) help ensure that the work is done by qualified contractors that have an interest in quality work and (3) reduce contract claims.
Reduce bids by (1) pretesting water sources, (2) providing effective road closure by including maps in the contract package that indicate where reader boards can be placed for thru traffic bypass routes, (3) reduce costs for curing by committing to covering green soil cement each day and (4) use multi-year renewable contract clauses.
Repair and Maintenance: Patch holes in BST as soon as possible with proprietary open graded cold mixes (UPM or
Omega mix or spray patching equipment) Schedule funding for chip sealing every 5 years Repair rutted/deformed areas with 6% cement to a depth of 12 inches, and adding a three
inch layer of compacted aggregate base followed by a double BST. If a smaller mixer/pulverizer is used, pulverize the repair area prior to adding cement to meet 2 hour time limits.
Repair soil cement “rubblized” areas by strengthening with at least three inches of compacted gravel base and add a double BST when doing seal coat work in the area.
Document and refine soil cement repair methods and develop appropriate specifications. Future Evaluations and Investigations:
Continue to conduct FWD surveys and analysis on soil cement roads to: o Confirm that reductions in field moduli have stabilized at 40% o Improve the life cycle cost analysis of the different soil cement thickness designs o Identify failure mechanisms for more effective repair practices o Continue validation of long term freeze thaw cycle durability.
Compile records on maintenance and repair costs on all types of structural sections and road surface treatments to improve life cycle cost predictions
Improve the reliability of the PCA distress model and its inputs, by perform laboratory “modulus of rupture” tests on the cement stabilized lean clay material to establish better correlations and more reliable results. Currently the only data available is on fine granular material.
Verify delamination seen by ground penetrating radar in soil cement by using strain gages at the bottom and top of newly constructed soil cement layers at a number of locations, and then FWD test these locations at different load levels.
Perform additional tests on the effects of magnesium chloride curing on soil cement compressive strength.
Determine thermal conductivity of cement stabilized clay soil so that reductions in frost depth can be determined and compared to saturated and unsaturated aggregate base typically used in the area.
Run soil cement mix designs with at least three samples made from soil cement grindings so a guide for minimum cement contents can be developed for full depth reclamation.
Utilize GPR equipment that can effectively locate subsurface wet areas for delineating soft soils that need cement modification prior to stabilization.
45
REFERENCES Department of the Air Force, (2012). “Engineering Technical Letter (ETL) 12-7:
Repair of Cement-Stabilized Soil (CSS) Surfaces.” Department of Defense, USA, Washington D.C., 5-8
Kersten, M.S.(1961). Soil Stabilization with Portland Cement, Highway Research Board Bulletin (292), National Academy of Sciences, Washington D.C., 36-37.
Milburn, J.P. and Parsons, R.L.(2004) “Performance of Soil Stabilization Agents”, Kansas Department of Transportation Report No K-TRAN:KU-01-8,
University of Kansas, Lawrence, Kansas, 60-62. Parker, J.W., (2008). “Evaluation of Laboratory Durability Tests for stabilized
Subgrade Soils.” M.S. thesis, Bringham Young University, Provo, UT, 9, 65-66. Petry, T.M. and Wohlgemuth,S.K. (1988). “Effects Of Pulverization On The Strength
And Durability Of Highly Active Clay Soils Stabilized With Lime And Portland Cement”, Transportation Research Board, 500 Fifth Street, NW, Washington, DC 20001 USA, 38-45.
Scullion, T., (2001) “Field Investigation: Pre-Cracking of Soil-Cement Bases to Reduce Reflective Cracking”. Texas Transportaton Institute, 4.
Scullion, T., Uzan, J., Hilbrich, S., Chen, P., (2008) “Thickness Design Systems for Pavements Containing Soil-Cement Bases”. Portland Cement Association, PCA R&D SN2863, 51, 4, 22.
Roberts, J.D., “Performance of Cement Modified Soils: A Follow-Up Report,” Transportation Research Record 1089, Transportation Research Board, 1986 U.S. Army Corps of Engineers, (2004). “Soil Stabilization for Pavements.” Unified
Facilities Criteria (UFC), Department of Defense, USA, Washington D.C., 11-12
Web Soil Survey, Natural Resources Conservation Service, USDA http://websoilsurvey.nrcs.usda.gov/app/HomePage.htm

46
APPENDIX
A1 Cost Comparisons for Structural Section Alternatives(Metric)(Reserved)...……47 A2 Cost Comparisons for Structural Section Alternatives(English) ………...………48 B Soil Cement Road Problems, Causes, Prevention and Repair Methods…………49 C1 Soil Cement Construction Specifications (2013)…………………………………..51 C2 Soil Cement Construction Specifications (2014)…………………………………..56 D Evaluation Criteria for Request for Proposal (RFP) Contracts…..……………...63 E1 Soil Cement QA Specifications (3/2013)……………………………………………66 E2 Soil Cement QA Methods (3/2013)………………………………………………….73 F Otta Seal Specifications for Emulsion and for Aggregate………………...………85 G Structural Thickness Design - Soil Cement (4/2014)……………………...………86 H Structural Thickness Design – BST on Aggregate Base (Reserved)……..………90 I 2014 FWD Data Summary – BST on Soil Cement (10/2014)…………….………91 J 2014 FWD Data Summary– BST on Aggregate on Soil Cement (10/2014)……101 K 2014 FWD Data Summary – BST on Aggregate on Geotextile (10/2014)…...…106 L Roadway Materials Testing, Soils ………………………………………..………..112 M Roadway Materials Testing, Aggregate …………………………………………..116 N Roadway Materials Testing, Soil Cement ……………………………………...…124 O Soil Cement Repair Process (Reserved)……………………………………..…….136 P Project Development History Maps………………………………………………..137 Q Richland County Traffic Monitoring Plan ………………………………………..141
47
APPENDIX A1 (METRIC). COST COMPARISONS FOR STRUCTURAL SECTION ALTERNATIVES (RESERVED)

48
APPENDIX A2 (ENGLISH). COST COMPARISONS FOR STRUCTURAL SECTION ALTERNATIVES
Driving
Surface
Support
Structure
Subgrade
Mr from
FWD
Construct
ion (a)
Est
Annual
Mtc (b)
5" HMA 2 to 9" Agg Base 2005 328 12 $900,000 $40,000 600,000 20 $2.83 High
Double BST4" Agg with BASE
ONE2009 127E 1 $450,000 $10,000 10,000 0 $45.33 Low
Double BST8" Agg Base over
Geotex2009 326 2 $350,000 $10,000 6,700 0 $52.57 Moderate
321S 3.5 19,600 1 $20.74
127W 0.75 261,000 9 $1.87
8" Soil Cement 11.3 129W 2 $240,000 $20,000 365,000 12 $1.32 Low
7.4 143E 3 208,000 7 $1.63
9.5 324 3 720,000 24 $0.71
9.7 146W 8 525,000 18 $0.85
7.6 146E 5 950,000 32 $0.62
9.3 201 1.7 $10,000 325,000 11 $1.24
7 321N 3 $15,000 107,000 4 $3.26
3" HMA 4" Base, 12" SC 2012 351 RS 0.4 $505,000 $15,000 12,000,000 400 $0.54 Low
11.3 314 5.5 345,000 12 $1.20
8.4 143W 3 400,000 13 $1.08
8.7 480 1.5 110,000 4 $3.06
12.5 350S 2 3,500,000 117 $0.42
3" Agg/12" SC 2013 350RS 2 10,000,000 333 $0.38
4" Agg/8" SC 11.2 2011 129W 0.7 630,000 21 $1.10
(a) Costs are not included for three to five feet of embankment widening required for HMA and BST/Aggregate base options. Costs shown are
for 26 ft wide asphalt surface over 28 feet wide support section
(e ) Reliabil ity is based on length of maintenance history and miles of road surveyed
(d) Life is based on 75000 legally loaded 80,000 lb trucks per year or about 30,000 ESAL's
(c ) ESAL Life by FWD calculation is increased by ESAL estimate for time between build date and FWD survey
(b) Annual maintenance includes chip seals, patching/structural reinforcement, pavement overlays and gravel replacement for 20 yr period.
Double BST $10,000$480,000
Moderate
Low
$295,000
Moderate
12" Soil CementDouble BST 2012 $300,000 $10,000
Double BST 10" Soil Cement
Double BST
on Geotex10" Soil Cement
2011
$10,000$270,000
Structural Section Costs per Mile
Life in
ESAL's from
FWD (c )
Relative
Reliability
(Mtc &
Life Est)
(e )
Relative
$/ESAL
per mile
Life in
Years
(d)
MilesRd #Year
Built
10" Agg Base
over GeotexModerate$400,000 $10,000
Double BST 2010

49
APPENDIX B. SOIL CEMENT ROAD PROBLEMS, PROBABLE CAUSES, PREVENTION METHODS AND SUGGESTED REPAIR
Type of Problem Probable Cause of Problem Ways to Prevent Problem During Soil
StabilizationSuggested Repair Process
Cement movement by equipment tires prior to mixing
Cement containment berms at shoulder and centerline
Too much grinding overlap at centerline
QA personnel ensure grinder is properly lined up with cement spread
Gaps in cement spreadQA personnel direct additional cement application, or covering of narrow skipped areas with lute.
Low moisture content QA personnel direct remixing with additional moisture
Low cement content QA personnel should stop operation and require additional cement application to what looks correct, favoring rates on the high side.
Out of spec cement content, moisture content, pulverization, compaction, etc
QA personnel ensure that specs are met
Inadequate treatment depthQA personnel ensure treatment depth requirements are met
Very weak subgradeImprove weak area detection process prior to stabilization
Full lane or road width depression normally greater than 10 feet in length
Very weak subgradeImprove weak area detection process prior to stabilization
(1) If desired for safety, put a temporary patch in depression areas. (2) Restabilize by adding 4% cement, mix with water to 12 inch depth, compact with pad foot roller until "walk out" occurs and then shape to proper crown and profile (3) cover immediately with 3" gravel surfacing (4) Tight blade, shape and double chip seal when possible
Same as four step process shown above
Long narrow depression areas and potholes along centerline or shoulders, caused by low cement contents. Detect low strength by DCP or Pick Axe
Short Transverse depressions and/or deep potholes across one lane normally at transverse joints
Ruts in Wheel Tracks
Same as four step process shown above, except mix 3 inches deeper and increase cement application rate to 6%

50
APPENDIX B (CONTINUED). SOIL CEMENT ROAD PROBLEMS, PROBABLE CAUSES, PREVENTION METHODS AND SUGGESTED REPAIR
Type of Problem Probable Cause of Problem Ways to Prevent Problem During Soil
StabilizationSuggested Repair Process
Blade finishing processQA personnel ensure finishing according to specification
Heavy truck traffic on green soil cement
Close road and post personnel 24 hrs/day to control traffic until surface can be covered with treated aggregate for cure and protection
Bleeding BST seal Chip rate too low or asphalt emulsion rate too high
QA personnel to adjust rates after control strip built. Torture test with heavy truck during hot weather to verify rates
Bleeding BST seal pulled off soil cement by vehicle tires, potholes develop
Traffic control allowing vehicles to park on bleeding BST
Close individual road segments and provide detour if possible, use reader boards to notify public at least one day prior to road closure
Longitudinal and transverse shoving of double BST with chips on paving fabric
Asphalt Cement (AC) application rates too high, crown or road grades over 3%
QA personnel to adjust rates after control strip built. Torture test with heavy truck during hot weather to verify rates
(1) Blade all BST and fabric that has shoved to shoulder (2) Add 3" treated gravel (3) Tight blade, shape and Double Chip Seal when Possible
(1) Blot with sand or if necessary chips to control bleeding (2) patch holes with open graded cut back patch mix (OPM or Durapatch) or spray patch
Randomly located uneven rough BST profile where BST built directly on soil cement. Soil cement heavily cracked at the surface or ‘rubblized’.
If under 2" rubblization, (1) blade off loose BST and soil cement, (2) Replace removed surface with treated aggregate at twice the thickness removed. If over 2" rubblization, follow four step process shown above
51
APPENDIX C1 SOIL CEMENT CONSTRUCTION SPECIFICATIONS (2013)
July 1 2013 Edition
SECTION 02233 SUBGRADE SOIL-CEMENT STABILIZATION
PART 1: GENERAL
1.1 DESCRIPTION: Soil-cement shall consist of soil, Portland cement and water proportioned, mixed,
compacted, shaped and cured in accordance with these specifications and shall conform to the lines, grades, thicknesses and typical cross section shown on the drawing.
1.2 Contract Responsibilities: The Engineer as mentioned throughout these specifications will be the representative of the Owner.
1.3 REFERENCES 1.3.1 AASHTO M 85 or ASTM C150 Portland Cement
1.4 QUALITY CONTROL SAMPLING AND TESTING: The contractor will perform quality control as necessary to produce work that meets specifications. Richland County will employ a consulting engineering firm to perform quality assurance.
PART 2: PRODUCTS
2.1 PORTLAND CEMENT: Type II that conforms to AASHTO M85 Specifications 2.2 WATER: Sample water sources at least three working days prior to use for testing and approval. Additional
sampling and testing may be required if water quality appears to change. PART 3: EXECUTION
3.1 EQUIPMENT 3.1.1 Cement Spreader. Spreading equipment shall be able to uniformly distribute the Portland cement to within
5% of the specified amount. The spreader shall have the following capabilities: Onboard weigh scales that provide a weight readout of cement on the spreader.
A tape or ticket printer that is programmed to provide the following information for each cement spread
o Date and time of day for each spread o Width and length of spread in feet o Truck scale weight prior to spread, weight after spread and total weight
applied in pounds o Programmable printout systems are known to be available from (1) Sonic
Industrial Scales (800-584-8191) and (2) Vulcan On-Board Scales (800-237- 0022)
o A copy of all tickets shall be given to the engineer at the end of each day of work. Dual augers or other means to supply cement to the distribution chamber in a continuous and even
flow The capability of spreading an 8 foot wide spread of cement, to a maximum of 100 lbs. of cement per
square yard in one pass. The capability to narrow spread width in two foot increments.
An onboard electronic distance measuring device that measures product spread length within two percent accuracy.
Spreading equipment must limit fugitive dust during spreading of cement so that air quality standards are met.
3.1.2 Mixer. Mixers will be Wirtgen 2500 or equivalent, must be capable of 18 inch mixing depths, and be approved by the Engineer. The equipment must meet the following criteria: Two directional mixing, with both up and down cutting;

52
Cross slope control; Maintain constant mixing depth; Operational depth indicators; Process a minimum of 8 feet wide per pass; Have proper fittings to connect directly to a water truck; Provide a fully computerized, automatic water additive system, so that the amount of water used
during any given period can be read directly, and a gauge to indicate the instantaneous application rate during the mixing operation;
Water flow from each one foot bar segment can be adjusted to obtain uniform moisture contents and to be shut off to prevent double application of water when overlap mixing; Capable of pushing or pulling the water tankers during the mixing process
The Engineer will make the decision as to whether the equipment is equivalent to the above. The spray bar will be inspected each day when requested and if problems are apparent, inspection will be done as often as the Engineer thinks necessary. If the spray bar is considered ineffective, the spray bar or the entire mixer must be replaced. The decision of the Engineer will be final.
3.1.3 Water Trucks, minimum of 3000 gallon, capable of uniform water application for full road width of
28 feet and for feeding water to mixing machines. 3.1.4 Rollers 3.1.4.1 Vibratory Pad/Tamping Foot Roller: Be equipped with a spreader blade and meet the following minimum
requirements: Static weight of 14 tons, 112 tamping feet, 3 inch height with contact area of 17 square inches, and minimum width of 84 inches.
3.1.4.2 Pneumatic Tire Roller: Self-propelled minimum compacting width of 5 feet, minimum gross ballasted weight of 20 tons, adjustable with the range of 200 to 360 pounds per inch of compaction width.
3.1.4.3 Other rollers may be required to meet compaction and finishing required. 3.1.5 Motor Graders or Trimmers: Equipment that can prepare the road surface for stabilization and also shape the
final surface to the tolerances specified. Road surface finishing blade must have a 16 foot moldboard with Topcon or similar grade control, ripper attachment and cutting edge wear not exceeding ½” differential wear.
3.2 CONSTRUCTION METHODS
3.2.1 General. The operations of cement spreading, water application, mixing, shaping, compacting, finishing and
curing shall be continuous and completed in daylight. Operations of cement spreading, water application, mixing, and grading mixed material shall result in a uniform mixture of soil, cement, and water for the full depth and width specified. The total elapsed time between the start of mixing and the completion of finishing shall not exceed 2 hours. Do not leave any cement-roadway mixture undisturbed for more than 30 minutes if it has not been compacted and finished. When rain causes excessive moisture, or the 2-hour time limit is exceeded, reconstruct the entire section. When such reconstruction is necessary, perform the work of reconstruction, and provide the cement required. Responsibility of additional cost will be determined by the Engineer and Prime Contractor. The amount of cement to be used in reconstruction is 25% of the original rate if remixing is started within 4 hours of when the 2 hour time limit violation occurs. The Engineer may stop cement spreading at any point in time that there are difficulties meeting any requirements. The beginning and ending of cement spreads, reinforced sections and reworked areas shall be marked by the QA Consultant “ground man” with lathe offset as determined by the Engineer. The QC consultant will provide a “ground man”, whose sole responsibility is to provide spread stakes and monitor stabilization work; the ground man shall not be the supervisor for the project. The Subcontractor will control and coordinate all items of stabilization work and cease operations whenever any requirements are not met. Work will not resume until the Engineer agrees on the corrective action to be taken.
3.2.2 Seasonal and Weather Limitations. Cement shall not be spread or mixed when the air temperature is below
40 degrees F and falling. Do not spread cement when rain occurs or if the roadway material is muddy or frozen. The Prime Contractor will monitor air quality standards, and shut down operations as required. Seasonal limitation is June 15 to September 30.
3.2.3 Test Strip. The first day of work shall consist of building a test strip of length equal to the planned cement
spread length at a designated location. The Engineer will determine the suitability of the work. If the test strip fails to meet the requirements of this specification, the Subcontractor will be required to build another test strip
53
at the Subcontractors expense. If other test strips are requested by the Engineer for additional experiments, the Subcontractor will be paid time and materials for that work.
3.2.4 Road Surface Preparation. The Subcontractor shall provide an additional motor grader, which will perform
minor restoration of centerline alignment. Reshape crown on tangents to three percent, blend into existing super elevations on curves and recreate a vertical alignment that has no abrupt dips or humps, and pay special attention to all cattle guards and bridge tie-ins. The operator shall establish a centerline during the shaping process and create a small (~ 6 inches) windrow at each shoulder at 14’ from centerline to be used as a guide for cement spreading and mixing operations. Rip the road surface 4 inches deep to control cement flow. After soil stabilization the additional motor grader will do final edge and ditch shaping (See Section 3.2.10). The road surface material and the surface conditions shall be approved by the Engineer before application of cement.
3.2.5 Reinforcement of Weak Subgrade. Designated weak areas of the subgrade will be stabilized with 3% cement
to a depth of 18 inches. These reinforced areas must be compacted until density peaks as determined by density testing. To be completed prior to soil stabilization and a minimum cure time of 24 hours is required.
3.2.6 Application of Cement. The specified rate for cement application and specified treatment depth is shown on
the drawings. Spread rates must be within 5% of this rate. The application rate must be verified by the QA Consultant. Excessive overlaps or skips will not be permitted. No equipment, except that used in spreading and mixing will be allowed to pass over the spread cement, and this equipment shall be operated in such a manner as to avoid displacement of cement. Cement which has been displaced by the Subcontractor’s equipment or other traffic shall be replaced at the Subcontractors expense. The Engineer may increase cement application and depth of mixing where necessary.
3.2.7 Mixing. The two hour time limit for mixing compaction and finishing starts once mixing begins.
The time of day (clock hours) when mixing starts for each section must be marked on the same lathe used for the beginning and ending of the cement application. After the cement has been applied it shall be mixed with the subgrade soil to the specified depth, plus or minus ¾”. Depth checks must be made during the first mixing pass to ensure the specified mixing depth is Obtained. Water shall be applied through the mixing machine during mixing. Care shall be exercised to ensure proper moisture content and uniform distribution at all times. Mixing shall continue until the cement has been sufficiently blended with the soil and water to a uniform color and moisture content, and to prevent the formation of cement balls. Moisture must be checked and adjusted continuously behind the mixer so that moisture contents are between one to three percent above optimum moisture content for the soil-cement mixture. The QA Consultant will determine optimum moisture contents and verify that moisture contents are within specified tolerances. Mixing uniformity and pulverization will be tested by the QA Consultant on a regular basis. Continue pulverizing until a minimum of 80% by weight of the material, exclusive of coarse aggregate, will pass a #4 sieve. More than one mixing pass may be required to obtain the required pulverization, uniform blending of soil, cement and moisture. Rock greater than 3 inches in any dimension must be removed from the road surface prior to compaction. If an objectionable amount of large rock is encountered during mixing, the Subcontractor will pre-rip the road surface to the specified mixing depth and remove large rock prior to spreading Portland cement.
3.2.8 Compaction. Compaction, blading and surface watering must be done concurrently to achieve the required
density and recreate the finished crown and centerline location that existed before mixing. At the start of compaction, the percentage of moisture in the mixture must be within the range specified in Section 3.2.7. The optimum moisture and maximum density shall be determined by the QA Consultant. Moisture-density tests will be run continuously during rolling and roller patterns adjusted such that the highest possible compaction is obtained. The Engineer may accept the section if no more than one of the five most recent density tests are below the 97% density and the failing test is no more than 3 lb. per cubic foot below the specified density. Test locations will be equally represented across and longitudinally along the road surface. Moisture loss by evaporation must be replaced by light applications of water. The time of day when compaction is finished for each section will be marked on the same lath used for the beginning and ending of the cement application.
3.2.9 Finishing. Water curing must be started immediately after Compaction (Subsection 3.2.8) and continued 24
hours per day until the cover seal is placed. The cover seal will be placed (by others) within 6 days of final compaction. After the surface has gained enough strength to prevent marring or other damage, clip, skin, or tight-blade the surface of the cement treated material with a motor grader or subgrade trimmer to a depth not greater than 1/4 in. Remove loosened material and blade off the shoulder. Do not fill or patch low areas with

54
loose material. Roll the clipped surface immediately with a pneumatic tire roller until a smooth surface is attained. Add small increments of water as needed during rolling. Shape and maintain the course and surface in conformity with the typical sections, lines and grades shown on the plans or as directed. Smoothness will be measured to ensure that the finished surface does not have humps or dips in the longitudinal direction greater than ½” inch in 8 feet. Finishing shall be done in such a manner as to produce a smooth, dense surface free of compaction planes, cracks, ridges, or loose material. The Engineer may direct the use of any one or a combination of rollers specified in Section 3.1.4 to eliminate finishing problems. Finished portions of soil-cement that are traveled on by equipment used in constructing an adjoining section shall be protected in such a manner as to prevent equipment from marring or damaging completed work. If damage or marring occurs, the areas shall be repaired
3.2.10 Road-side Shaping. This shall be completed to insure properly shaped in-slopes, ditch and shoulder tie-ins
to the final stabilized road section. Operator shall avoid damage to any stakes throughout shoulders, until all as-built data is recorded by the Engineer.
3.2.11 C o n s t r u c t i o n Joints. Soil-cement stabilization shall be built in a series of parallel lanes of convenient
length with a slight overlap that ensures no area is missed. At the beginning of each day’s construction a straight transverse construction joint shall be formed by cutting back into the completed work. The deviation and straight edge smoothness requirements in Section 3.2.9 apply to all transverse construction joints.
3.2.12 Traffic. Completed sections may be opened when necessary to lightweight local traffic provided soil-cement
has hardened sufficiently to prevent marring or distortion of the surface, and provided the curing is not impaired. Candle type delineators must be placed at 200 foot intervals around treatments until they have cured for at least 24 hours. At least 5 days of curing are required before opening the finished section to normal traffic, unless otherwise directed by the Engineer. Road closed barriers are required during the 5 day curing period. Traffic control shall meet current MUTCD requirements. Traffic control shall be provided by others.
PART 4: MEASUREMENT AND PAYMENT
4.1 Liquidated Damages 4.1.1 This OWNER and CONTRACTOR and/or SUBCONTRACTOR recognize that time is of the essence for this
Contract and that the OWNER will suffer financial loss if the Work is not completed within the times specified in contract. The parties also recognize the delays, expense and difficulties involved in proving in a legal or arbitration preceding the actual loss suffered by the OWNER if the Work is not completed on time. Accordingly, instead of requiring any such proof, OWNER, CONTRACTOR, and/or SUBCONTRACTOR agree that as liquidated damages for delay (but not as a penalty) CONTRACTOR and/or SUBCONTRACTOR shall pay OWNER five thousand dollars ($5, 000.00) for each day that expires after the time specified in the contract, or until the Work is substantially complete. Inclement Weather will not be accounted for during any Liquidated Damage assessment.
4.2 Soil-Cement Stabilization (12” Depth) 4.2.1 This item is measured and paid for by the square yard of road surface stabilized according to the length and
width either specified or agreed to by the Engineer at the time the work is done. The amount paid is based on the contract unit price bid for “Soil-Cement Stabilization” and the quantity determined by the Engineer.
4.2.2 Price and payment is full compensation for the all items of work specified for this item including all labor, equipment, tools, and incidentals.
4.3 Finish, Shape & Compact 4.3.1 This item is measured and paid for by the square yard of road surface finished according to the length and
width either specified or agreed to by the Engineer at the time the work is done. The amount paid is based on the contract unit price bid for “Finish, Shape and Compact” and the quantity determined by the Engineer.
4.3.2 Price and payment is full compensation for the all items of work specified for this item including all labor, equipment, tools, and incidentals.
4.4 Portland Cement Type II 4.4.1 This item is measured and paid for by the ton of (2,000 pounds) for quantities verified by the Engineer as
used on and delivered to the project at the contract unit price bid for “Portland Cement Type II”. Payment for cement will only be made on certified scale “weight for payment” tonnage shown on the shipment bill of ladings that accompany each shipment. No payment will be made for shipments that do not have bill of
55
ladings at the time of delivery. 4.4.2 Price and payment is full compensation for the furnishing, labor, equipment, tools, and incidentals necessary to
complete this item. 4.5 Test Strip Section 4.5.1 This item is measured and paid for by the square yard of test strip section according to the length and width
either specified or agreed to by the Engineer at the time the work is done. The amount paid is based on the contract unit price bid for “Test Strip Section” and the quantity determined by the Engineer.
4.5.2 Price and payment is full compensation for the all items of work specified for this item including all labor, equipment, tools, and incidentals.
4.6 Reinforcement of Weak Subgrade Stabilization 4.6.1 This item is measured and paid for by the square yard of weak subgrade stabilized according to the length
and width either specified or agreed to by the Engineer at the time the work is done. The amount paid is based on the contract unit price bid for “Reinforcement of Weak Subgrade Stabilization” and the quantity determined by the Engineer.
4.6.2 Price and payment is full compensation for all items of work specified for this item including all labor, equipment, tools, traffic control and incidentals.
4.7 Reinforcement of Weak Subgrade Finish, Shape & Compact 4.7.1 This item is measured and paid for by the square yard of weak subgrade finished, shaped & compacted
according to the length and width either specified or agreed to by the Engineer at the time the work is done. The amount paid is based on the contract unit price bid for “Reinforcement of Weak Subgrade Finish, Shape & Compact” and the quantity determined by the Engineer.
4.7.2 Price and payment is full compensation for all items of work specified for this item including all labor, equipment, tools, traffic control and incidentals.
4.8 Pre-Shaping & Final Edge Work 4.8.1 This item is measured and paid for by the mile of road pre-shaped and final edge work according to the length
either specified or agreed to by the Engineer at the time the work is done. The amount paid is based on the contract unit price bid for “Pre-Shaping & Final Edge Work” and the quantity determined by the Engineer.
4.8.2 Price and payment is full compensation for all items of work specified for this item including all labor, equipment, tools, traffic control and incidentals.
END OF SECTION

56
APPENDIX C2 SOIL CEMENT CONSTRUCTION SPECIFICATIONS (2014)
Dec 31, 2014 Edition
SECTION 02233 SUBGRADE SOIL-CEMENT STABILIZATION
PART 1: GENERAL
1.1 DESCRIPTION: Soil-cement shall consist of soil, Portland cement and water proportioned, mixed,
compacted, shaped and cured in accordance with these specifications and shall conform to the lines, grades, thicknesses and typical cross section shown on the drawing.
1.2 Contract Responsibilities: This specification is generally written in the imperative mood where the subject “the Contractor” is implied. The Engineer as mentioned throughout these specifications will be the representative of the Owner.
OWNER USER NOTE
Note: Delete this text box prior to inserting the specification document into a contract package. This
specification is generally designed for projects that exceed five miles in length with less than 15 miles during one
season. Contractor efficiency and weather conditions would influence the amount of work that is realistic for one
season.
This specification reduces the quality and quantity assurance done by the owner (documentation records, sampling and
testing) from what was done in Richland County from 2011 through 2013 and shifts the less sensitive quality and quantity
tasks to the Contractor. “Less sensitive” tasks are ones with lower potential for conflict of interest. The owner must still
monitor what is done by the Contractor in these areas and also take on the responsibility of the most sensitive tasks to control
the risk associated with poor long term performance. One significant difference between what was done before and what is
in this spec, is that there will be little if any test data generated – quality assessment is based on visual inspection of highly
qualified individuals that represent the owner. Two individuals with a good background in materials engineering, soil cement
testing and contract administration should be able to handle the remaining quality and quantity assurance tasks identified
below:
Owner Rep #1: Road berm alignment, cement spread accuracy & uniformity, cement quantity assurance, compaction (pad
foot roller “walk out”), finishing moisture, pneumatic roller compaction, smoothness, final crown, centerline alignment,
density test observations and data interpretations, curing, traffic control, gravel surfacing thickness
Owner Rep #2: Cement flow, mixture moisture, percent pulverization, mixing/treatment depth, mixer alignment & overlap,
mix chamber/water bar cleanout, re‐grind quantity
The following items are suggested for consideration:
1. Reduce contingencies in bids by locating staging areas, designating and pretesting water sources.
2. Reduce traffic control costs by designating traffic by‐pass routes on a map to use during construction.
3. Reduce costs for curing, and long term repairs by placing about 1200 tons of gravel surfacing each day on “ green”
soil cement
4. Reduce bid contingencies by designating a separate road for constructing test strips.
5. Review the “amount of” and “need for” Liquidated Damages in Subsection 4.1
6. Require a mandatory pre‐bid meeting to help avoid the uninformed low bid that ultimately increases long term costs.
Another method to reduce risk (and quite likely long term cost) is to use a Request for Proposal (RFP) type of contract rather
than a competitive bid contract. The increased administrative cost associated with an RFP contract can be offset by making it
a multi‐year renewable contract. Suggested criteria for evaluating RFP contracts for soil cement stabilization are included in
Appendix D.

57
1.3 REFERENCES 1.3.1 AASHTO M 85 or ASTM C150 Portland Cement
1.4 QUALITY AND QUANTITY CONTROL SAMPLING, TESTING AND DOCUMENTATION: Perform quality and
quantity control as necessary to produce work that meets specifications and perform documentation and sampling as specified.
1.5 QUALITY AND QUANTITY ASSURANCE: The Owner will employ an Engineer (or Engineers) to perform quality
and quantity assurance. PART 2: PRODUCTS
2.1 PORTLAND CEMENT: Furnish Type II Portland cement that conforms to AASHTO M85 Specifications. Take
one quart zip lock plastic bag samples of each cement delivery and store in sealed five gallon buckets in a location directed by the Engineer. Label samples with Sample date and number and Bill of Lading number. When directed, test cement in accordance with Richland County QA Method 16 that utilizes ASTM C109 and C778.
2.2 WATER: Furnish water from water sources that has been tested at least three working days prior to use. Conduct tests in accordance with Richland County QA Method 17 that uses ASTM C109, C778 and AASHTO T106. Additional sampling and testing may be required if water quality appears to change. Submit water source test data to the Engineer for approval.
PART 3: EXECUTION
3.1 EQUIPMENT 3.1.1 Cement Spreader. Spreading equipment shall be able to uniformly distribute the Portland cement to within
5% of the specified amount as measured in both longitudinal and transverse directions. The spreader shall have the following capabilities: Digital on board weigh scales that provides a weight readout of cement on the spreader vehicle Dual augers or other means to supply cement to the distribution chamber in a continuous and even
flow The capability of spreading an 8 foot wide spread of cement, to a maximum of 100 lbs. of cement per
square yard in one pass. The capability to narrow spread width in two foot increments. An onboard electronic distance measuring device that measures product spread length within two
percent accuracy. Spreading equipment must limit fugitive dust during spreading of cement so that air quality standards
are met. 3.1.2 Mixer. Mixers will be Wirtgen 2500 or equivalent, must be capable of 18 inch mixing depths, and
be approved by the Engineer. The equipment must meet the following criteria: Cross slope control; Maintain constant mixing depth; Operational depth indicators; Mix a minimum of 8 feet wide per pass; Proper fittings and hitch to connect directly to a water truck; A fully computerized, automatic water additive system, so that the amount of water used during any
given period can be read directly, and a gauge to indicate the instantaneous application rate during the mixing operation;
Water flow from each one foot water bar segment must be adjustable to obtain uniform moisture contents and to be shut off to prevent double application of water when overlap mixing;
Capable of pushing or pulling water trucks during the mixing process
The Engineer will make the decision regarding acceptance or rejection of mixing equipment. The spray bar will be inspected each day when requested and if problems are apparent, inspection will be done as often as the Engineer thinks necessary. If the spray bar is considered ineffective, the spray bar or the entire mixer must be replaced. The decision of the Engineer is final.
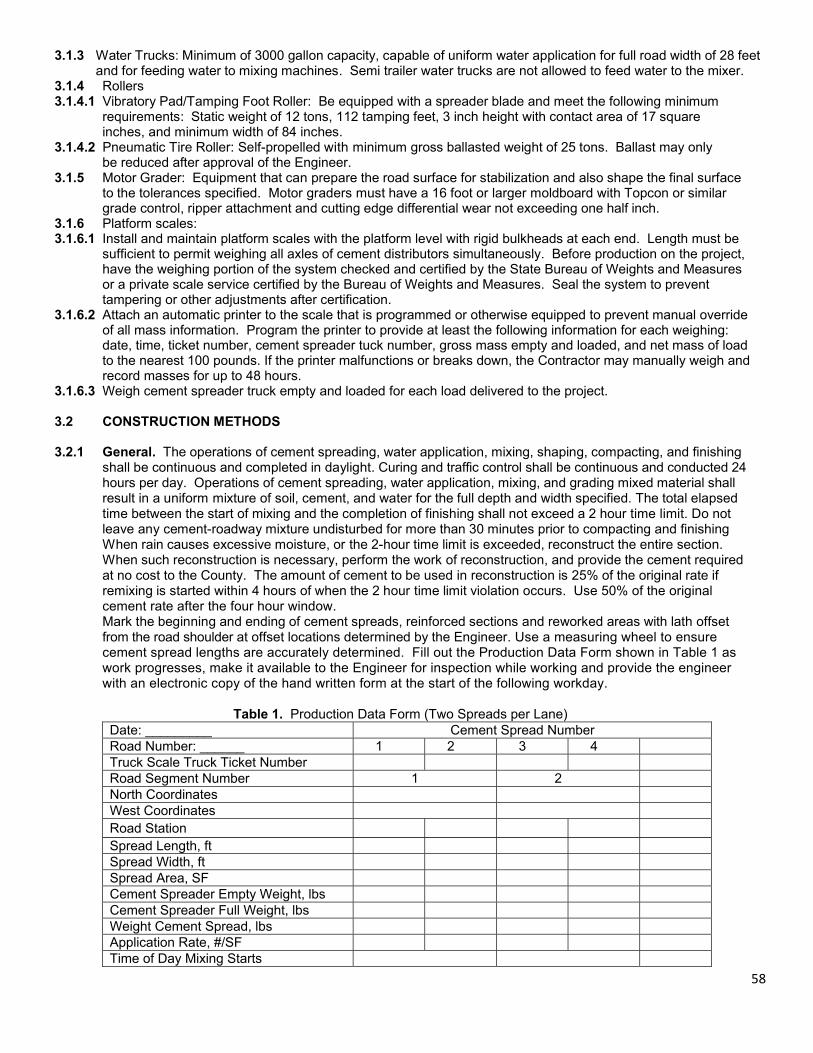
58
3.1.3 Water Trucks: Minimum of 3000 gallon capacity, capable of uniform water application for full road width of 28 feet and for feeding water to mixing machines. Semi trailer water trucks are not allowed to feed water to the mixer.
3.1.4 Rollers 3.1.4.1 Vibratory Pad/Tamping Foot Roller: Be equipped with a spreader blade and meet the following minimum
requirements: Static weight of 12 tons, 112 tamping feet, 3 inch height with contact area of 17 square inches, and minimum width of 84 inches.
3.1.4.2 Pneumatic Tire Roller: Self-propelled with minimum gross ballasted weight of 25 tons. Ballast may only be reduced after approval of the Engineer.
3.1.5 Motor Grader: Equipment that can prepare the road surface for stabilization and also shape the final surface to the tolerances specified. Motor graders must have a 16 foot or larger moldboard with Topcon or similar grade control, ripper attachment and cutting edge differential wear not exceeding one half inch.
3.1.6 Platform scales: 3.1.6.1 Install and maintain platform scales with the platform level with rigid bulkheads at each end. Length must be
sufficient to permit weighing all axles of cement distributors simultaneously. Before production on the project, have the weighing portion of the system checked and certified by the State Bureau of Weights and Measures or a private scale service certified by the Bureau of Weights and Measures. Seal the system to prevent tampering or other adjustments after certification.
3.1.6.2 Attach an automatic printer to the scale that is programmed or otherwise equipped to prevent manual override of all mass information. Program the printer to provide at least the following information for each weighing: date, time, ticket number, cement spreader tuck number, gross mass empty and loaded, and net mass of load to the nearest 100 pounds. If the printer malfunctions or breaks down, the Contractor may manually weigh and record masses for up to 48 hours.
3.1.6.3 Weigh cement spreader truck empty and loaded for each load delivered to the project. 3.2 CONSTRUCTION METHODS
3.2.1 General. The operations of cement spreading, water application, mixing, shaping, compacting, and finishing
shall be continuous and completed in daylight. Curing and traffic control shall be continuous and conducted 24 hours per day. Operations of cement spreading, water application, mixing, and grading mixed material shall result in a uniform mixture of soil, cement, and water for the full depth and width specified. The total elapsed time between the start of mixing and the completion of finishing shall not exceed a 2 hour time limit. Do not leave any cement-roadway mixture undisturbed for more than 30 minutes prior to compacting and finishing When rain causes excessive moisture, or the 2-hour time limit is exceeded, reconstruct the entire section. When such reconstruction is necessary, perform the work of reconstruction, and provide the cement required at no cost to the County. The amount of cement to be used in reconstruction is 25% of the original rate if remixing is started within 4 hours of when the 2 hour time limit violation occurs. Use 50% of the original cement rate after the four hour window.
Mark the beginning and ending of cement spreads, reinforced sections and reworked areas with lath offset from the road shoulder at offset locations determined by the Engineer. Use a measuring wheel to ensure cement spread lengths are accurately determined. Fill out the Production Data Form shown in Table 1 as work progresses, make it available to the Engineer for inspection while working and provide the engineer with an electronic copy of the hand written form at the start of the following workday.
Table 1. Production Data Form (Two Spreads per Lane)
Date: _________ Cement Spread Number Road Number: ______ 1 2 3 4 Truck Scale Truck Ticket Number Road Segment Number 1 2 North Coordinates West Coordinates Road Station Spread Length, ft Spread Width, ft Spread Area, SF Cement Spreader Empty Weight, lbs Cement Spreader Full Weight, lbs Weight Cement Spread, lbs Application Rate, #/SF Time of Day Mixing Starts

59
Time of Day Finishing is Completed Additional Mixing, ft
The Engineer may stop any or all work at any point in time when there are difficulties meeting specification
requirements. The Contractor will control and coordinate all items of stabilization work and cease work whenever any requirements are not met. Work will not resume until the Engineer agrees to corrective action provided by the Contractor.
3.2.2 Seasonal and Weather Limitations. Do not spread cement when (1) air temperature is 40 degrees and
falling, (2) rain occurs or (3) road surface is wet or frozen. Monitor air quality standards, and shut down operations as required. Seasonal limitation is June 15 to September 30. The first 30 days of bad weather shut down will count against contract time.
3.2.3 Test Strip. Prior to work on the specified road(s) build a test strip of length equal to the planned cement
spread length to be used on the rest of the project. Run cement spread test on square yard canvas panels in accordance with Richland County QA Method 4, and check mixing depth (Method 6). The Engineer will determine the suitability of the work. If the test strip fails to meet the requirements of this specification, build another test strip without cost to the Owner
3.2.4 Road Surface Preparation. The Contractor shall perform minor restoration of centerline alignment. Reshape
crown on tangents to three percent, blend into existing super elevations on curves and recreate a vertical alignment that has no abrupt dips or humps, and pay special attention to all cattle guards and bridge tie-ins. Build a centerline and shoulder windrow approximately six inches high to be used as a horizontal alignment guide for cement spreading and containment Rip the road surface at least 4 inches deep to control cement flow caused by mixer and water truck tires. Road surface preparation must be approved by the Engineer before application of cement.
3.2.5 Reinforcement of Weak Subgrade. Stabilize designated weak subgrade areas with 3% cement to a depth of
18 inches. Apply cement, mix and compact the area as specified in Subsections 3.2.6, 3.2.7 and 3.2.8. Weak subgrade compaction must be completed at least 24 hours prior to soil stabilization Record “Production Data” from Table 1 for each reinforcement area.
3.2.6 Application of Cement. Spread cement either on a one lane width segment or a full road width segment. Do
not start spreading cement on another segment until mixing has started on the previous segment. . Spread cement at ___ #/SF for stabilization areas, and ___#/SF for reinforcement areas unless otherwise shown on the drawings. Spread rates must be within 5% of the specified rate. When directed, run cement spread test IAW Method 4. Excessive overlaps or skips will not be permitted. No equipment, except that used in spreading and mixing will be allowed to pass over the spread cement, and this equipment shall be operated in such a manner as to avoid displacement of cement. Cement which has been displaced by any traffic shall be replaced at the Contractors expense. The Engineer may change cement application rates and depth of mixing where necessary.
3.2.7 Mixing. Initial mixing remixing shall be done at a drum speed of 150 RPM and maximum ground speed of 20 feet
per minute. The two hour time limit for mixing, compaction and finishing starts once mixing begins. The time of day (clock hours) when mixing starts for each section must be marked on the same lath used for marking the beginning of the cement application. After the cement has been applied it shall be mixed with the subgrade soil to the specified depth, plus or minus ¾”. When directed, stop forward ground speed, raise mixing drum and measure mixing depth. Make depth checks during the first mixing pass and when directed by the Engineer to ensure the specified mixing depth is obtained.
Add water into the mixing machine mixing chamber during mixing. Care shall be exercised to ensure proper moisture content and uniform distribution at all times. Mixing shall continue until the cement has been sufficiently blended with the soil and water to a uniform color and moisture content, and to prevent the formation of cement balls. The Engineer will adjust moisture continuously behind the mixer so that moisture contents are between one to three percent above optimum moisture content for the soil-cement mixture. The Engineer will direct the amount of water added. Work will stop when the amount of moisture or uniformity is inadequate.
Mixing uniformity and pulverization will be estimated or tested by the Engineer on a regular basis. Mix until a minimum of 80% by weight of the material, exclusive of coarse aggregate, will pass a #4 sieve. More than one mixing pass may be required to obtain the required pulverization, uniform blending of soil, cement and moisture. If additional mixing is required, document the length of remixing for each cement spread on Table 1.

60
Rock greater than 3 inches in any dimension must be removed from the road surface prior to compaction. If an objectionable amount of large rock is encountered during mixing, pre-rip the road surface to the specified mixing depth and remove large rock prior to spreading Portland cement. Clean the mixer water system spray heads and mixing chamber with maximum water flow and drum speed for at least 10 seconds on a hardened road surface after each mixing pass or cement spread.
3.2.8 Compaction and Finishing. Compaction, blading and surface watering must be done concurrently to achieve
the maximum density and recreate the finished crown and centerline location that existed before mixing. Blade berms off the road surface that were used to contain cement in Subsection 3.2.4. At the start of compaction, the percentage of moisture in the mixture must be within the range specified in Section 3.2.7. Moisture loss by evaporation must be replaced by light applications of water. Pad foot roller speed and length of roller operation time is determined by the Engineer. Compaction is non-stop until pad foot “walk out” occurs over the entire area. Pneumatic roll while shaping the surface to the typical section, line and grades shown on the plans. Continue pneumatic rolling within the 2 hour limit or until no displacement occurs.
Smoothness will be measured to ensure that the finished surface does not have humps or dips in the longitudinal direction greater than one inch in eight feet. Finishing shall be done in such a manner as to produce a smooth, dense surface free of compaction planes, cracks, ridges, or loose material. The Engineer may direct the use of any one or a combination of rollers specified in Section 3.1.4 to eliminate finishing problems.
Do not allow construction or loaded cement transport equipment do drive on finished Segments of soil-cement for 48 hours. Wherever the 48 hour time limit is violated, re-stabilize the area with 3% additional cement at no expense to the Owner. The time of day when finishing is completed for each Segment will be marked on the same lath used for the beginning and ending of the cement application.
Perform 10 inch depth direct transmission nuclear gauge density and moisture tests (AASHTO _____) at a minimum 100 foot interval along the roadway at statistically random transverse locations across the road surface. All test data will be recorded and provided to the engineer in the format shown in Table 2.
Table 2. Segment Compaction Data
Date______ Segment Number __ Segment Number __
Road No. _____ Wet
Density Dry
Density %
Moist Wet
Density Dry
Density %
Moisture
3.2.9 Curing. Start water curing immediately after Finishing (Subsection 3.2.8) and continued until gravel surfacing
is placed by the Owner during each day of soil stabilization. 3.2.11 C o n s t r u c t i o n Joints. Soil-cement stabilization shall be built in a series of parallel lanes of convenient
length with a slight overlap that ensures no area is missed. At the beginning of each day’s construction a straight transverse construction joint shall be formed by cutting back into the completed work about five feet. The straight edge smoothness requirements in Section 3.2.8 apply to all transverse construction joints.
3.2.12 Traffic. Provide traffic control and signage in accordance with MUTCD requirements. Reader boards are
required 24 hours prior to starting construction at intersections with major roads to direct traffic to alternate routes. Keep reader boards in place until all treated segments have cured for at least 72 hours. Completed soil cement Segments may be opened to local lightweight local traffic (no trucks) provided soil-cement has been protected with gravel surfacing. Place candle type delineators at 200 foot intervals around treated segments until they have cured for at least 24 hours. Keep road closure signs in place 24 hours per day for three days after construction. Man road closure signs between 5 am and 11 pm each of the three days. Submit a traffic control plan to the Engineer for approval one week prior to starting a new road section.
PART 4: MEASUREMENT AND PAYMENT
4.1 Liquidated Damages 4.1.1 This OWNER and CONTRACTOR and/or SUBCONTRACTOR recognize that time is of the essence for this
Contract and that the OWNER will suffer financial loss if the Work is not completed within the times specified in contract. The parties also recognize the delays, expense and difficulties involved in proving in a legal or arbitration preceding the actual loss suffered by the OWNER if the Work is not completed on time. Accordingly,

61
instead of requiring any such proof, OWNER, CONTRACTOR, and/or SUBCONTRACTOR agree that as liquidated damages for delay (but not as a penalty) CONTRACTOR and/or SUBCONTRACTOR shall pay OWNER five thousand dollars ($5, 000.00) for each day that expires after the time specified in the contract, or until the Work is substantially complete. Inclement Weather will not be accounted for during any Liquidated Damage assessment.
4.2 Soil-Cement Stabilization (12” Depth) 4.2.1 This item is measured and paid for by the square yard of road surface stabilized according to the length and
width either specified or agreed to by the Engineer at the time the work is done. The amount paid is based on the contract unit price bid for “Soil-Cement Stabilization” and the quantity determined by the Engineer.
4.2.2 Price and payment is full compensation for the all items of work specified for this item including all labor, equipment, tools, and incidentals.
4.3 Finish, Shape & Compact 4.3.1 This item is measured and paid for by the square yard of road surface finished according to the length and
width either specified or agreed to by the Engineer at the time the work is done. The amount paid is based on the contract unit price bid for “Finish, Shape and Compact” and the quantity determined by the Engineer.
4.3.2 Price and payment is full compensation for the all items of work specified for this item including all labor, equipment, tools, and incidentals.
4.4 Portland Cement Type II 4.4.1 This item is measured and paid for by the ton (2,000 pounds). Where cement is stored onsite, quantities will
be determined by certified jobsite platform scales that weigh cement spreaders (Subsection 3.1.6). Where cement is transferred from highway haul units directly into cement spreaders, the tonnage quantities on the haul unit Bill of Lading will be used for payment. No payment is made for shipments that do not have a bill of lading at the time of delivery. The amount paid is based on contract unit price bid for “Portland Cement Type II” and the quantity determined by the Engineer. Payment for Portland cement will be made after randomly selected cement samples taken by the contractor pass strength tests.
4.4.2 Price and payment is full compensation for the furnishing, labor, equipment, tools, and incidentals necessary to complete this item.
4.5 Test Strip Section 4.5.1 This item is measured and paid for by the square yard of test strip section according to the length and width
either specified or agreed to by the Engineer at the time the work is done. The amount paid is based on the contract unit price bid for “Test Strip Section” and the quantity determined by the Engineer.
4.5.2 Price and payment is full compensation for the all items of work specified for this item including all labor, equipment, tools, and incidentals.
4.6 Reinforcement of Weak Subgrade Stabilization 4.6.1 This item is measured and paid for by the square yard of weak subgrade stabilized according to the length
and width either specified or agreed to by the Engineer at the time the work is done. The amount paid is based on the contract unit price bid for “Reinforcement of Weak Subgrade Stabilization” and the quantity determined by the Engineer.
4.6.2 Price and payment is full compensation for all items of work specified for this item including all labor, equipment, tools, traffic control and incidentals.
4.7 Reinforcement of Weak Subgrade Finish, Shape & Compact 4.7.1 This item is measured and paid for by the square yard of weak subgrade finished, shaped & compacted
according to the length and width either specified or agreed to by the Engineer at the time the work is done. The amount paid is based on the contract unit price bid for “Reinforcement of Weak Subgrade Finish, Shape & Compact” and the quantity determined by the Engineer.
4.7.2 Price and payment is full compensation for all items of work specified for this item including all labor, equipment, tools, traffic control and incidentals.
4.8 Pre-Shaping 4.8.1 This item is measured and paid for by the mile of road pre-shaped according to the length either specified or
agreed to by the Engineer at the time the work is done. The amount paid is based on the contract unit price bid for “Pre-Shaping” and the quantity determined by the Engineer.
4.8.2 Price and payment is full compensation for all items of work specified for this item including all labor,

62
equipment, tools, traffic control and incidentals. 4.9 Additional Mixing and Pulverization Passes 4.9.1 This item is measured and paid for by the station of road that is remixed for each mixing machine width that
is done under the direction of the Engineer to improve mixing and or pulverization. The amount paid is based on the contract unit price bid for “Additional Mixing and Pulverization Passes” and the quantity determined by the Engineer.
4.9.2 Price and payment is full compensation for all items of work specified for this item including all labor, equipment, tools, traffic control and incidentals.

63
APPENDIX D. EVALUATION CRITERIA FOR REQUEST FOR PROPOSAL (RFP) CONTRACTS
Most state statutes that govern contracting methods allow contracting public service work through
competitive sealed proposals commonly referred to as Request for Proposal (RFP) contracts. RFP contracts
must include evaluation factors and their relative importance. This Appendix contains factors to consider for
evaluation, followed by an example evaluation of four contractors. The relative importance (percentage)
should be reviewed and adjusted as necessary for each contract, depending on job specific factors.
General Factors in State Statutes:
1. 25% History and experience with projects similar to the project under consideration;
2. 5% Financial health;
3. 5% Staff or workforce that is proposed to be committed to the project;
4. 5% Approach to the project;
5. 10% Project costs; and
6. 50% Any additional criteria or factors that reflect the project's characteristics, complexities, or goals.
Additional Criteria to consider for soil cement stabilization projects are shown on the following three pages.
“The purpose of the following questions is to enable the Owner to select the best value. Each Contractor
submitting a proposal must answer the following questions and fill out the forms with required information.
An incomplete response will make your proposal “non responsive”.”
1 Cement:
a. What cement manufacturer will you use for the project? Do you have a backup supplier?
b. Do you have a written contract in force for purchasing the required amount of cement for the project?
c. What method will be used for handling your planned tonnage of cement per day and where is the cement coming from (rail, storage, delivery & loading)?
d. Trucking could be an issue for cement delivery, what is your plan for cement delivery?
e. Will you use on site cement storage or transfer directly into spreader trucks?
f. What type of documentation system do you propose for the tracking of cement quantities ?
2 Weather: Inclement weather is common ‐ how do you plan to handle cement trucking and storage, production, etc. for non‐production hours?
3 Equipment: Provide make, model & year of cement spreaders, mixers, water trucks, graders & Rollers
4 With all of the preceding equipment, do you plan having support personnel & equipment on site each day? (mechanic, mech truck, service truck, parts van)
5 Mixer: How often does your water spray bar need to be cleaned to ensure uniform moisture contents?
6 How will you deal with moisture variations in the soil and hitting the optimum moisture target?
7 What type of Grade controls do you have in your Motor Grader(s) and how do you intend to use them?
8 Road Surface Preparation: What techniques do you plan to use to remove rock larger than 3 inches?

64
9 What machine operational techniques or other measures are you planning to use to ensure that pulverization is maximized (80%, Spec. 3.2.7) at all times and also when wet clays are encountered?
10 What techniques are you willing to use to maximize compaction?
11 Explain the finishing operation you intend to use.
12 Work Schedule: Work days per 14 days, hours of spreading per day, schedule of road sequence, tons/day, subgrade reinforcement?
13 Do you plan to mix full road width or ½ road width? Provide a traffic control plan.
14 What type of “value added “benefits do you provide over and above the contract requirements?
15 Notice to Proceed will be given late June; will that effect your start‐up date? If so, what is your anticipated start date?
16 List any legal action within the last 10 years with you or your subcontractors:
17 Contract History: Provide the following information on the last five soil cement stabilization projects, complete with references: Owner Client Name, Cement Tonnage per day per, Total Tons of Cement, Date of Completion, Owner Contact Name and Phone Number
18 How will you control cement from flowing on the road surface caused by construction equipment prior to mixing?
19 List water source locations and staging areas you plan to use for each road: List County road Number, Water Source, Staging Area Location
20 List subcontractors: Subcontractor//Responsibility
21 List individuals you will use and their years of experience on cement stabilization projects for each of the primary positions of Supervisor, Foreman, Operators
22 Do you understand that you must have traffic control personnel stationed at road closure signs 18 hrs./day to protect soil cement?
23 Is there any part of the specifications that you don’t understand or have questions about?
24 Are you aware a payment and performance bond is required?
25 Public relations are very important with this project, private land use is restricted. Do you have any comments and do you understand the importance of this issue?
26 If only a portion of the work is done, would you still be interested in this project?
27 There is a shortage of lodging, where will your crew reside or stay?
28 Are you familiar with the PCA’s Soil‐Cement Inspector’s Manual?
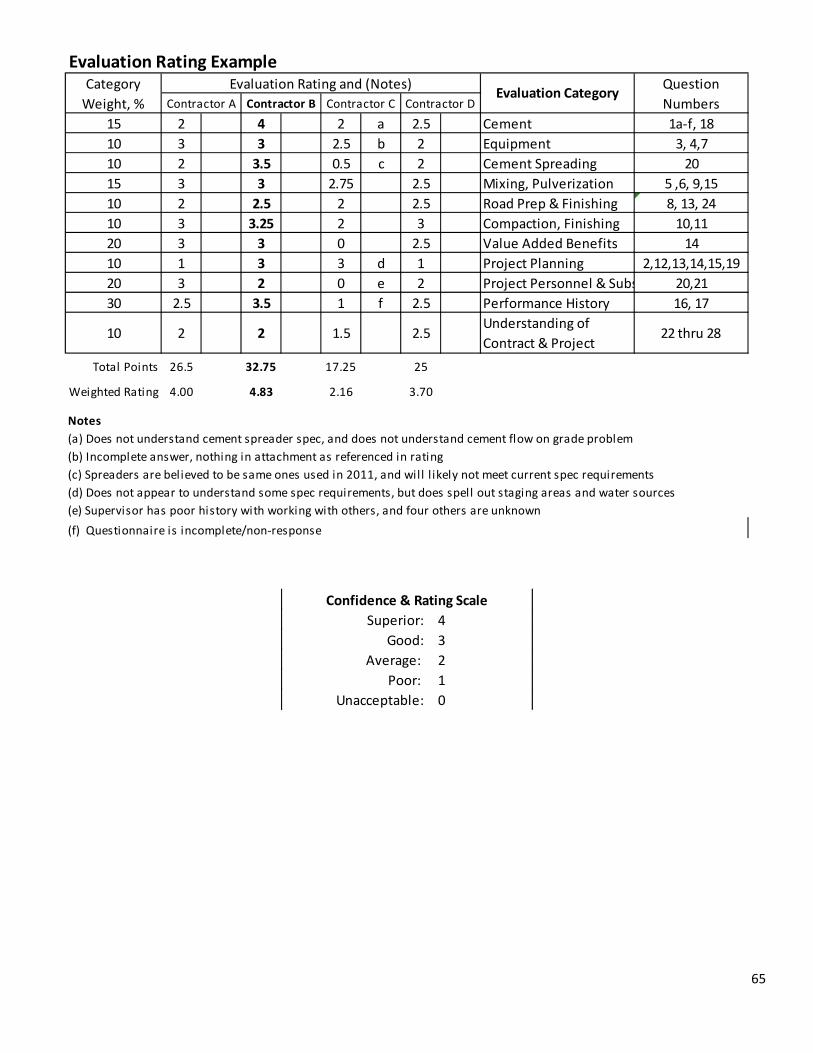
65
Evaluation Rating Example
15 2 4 2 a 2.5 Cement 1a‐f, 18
10 3 3 2.5 b 2 Equipment 3, 4,7
10 2 3.5 0.5 c 2 Cement Spreading 20
15 3 3 2.75 2.5 Mixing, Pulverization 5 ,6, 9,15
10 2 2.5 2 2.5 Road Prep & Finishing 8, 13, 24
10 3 3.25 2 3 Compaction, Finishing 10,11
20 3 3 0 2.5 Value Added Benefits 14
10 1 3 3 d 1 Project Planning 2,12,13,14,15,19
20 3 2 0 e 2 Project Personnel & Subs 20,21
30 2.5 3.5 1 f 2.5 Performance History 16, 17
10 2 2 1.5 2.5Understanding of
Contract & Project 22 thru 28
Total Points 26.5 32.75 17.25 25
Weighted Rating 4.00 4.83 2.16 3.70
Notes
(a) Does not understand cement spreader spec, and does not understand cement flow on grade problem
(b) Incomplete answer, nothing in attachment as referenced in rating
(c) Spreaders are believed to be same ones used in 2011, and will l ikely not meet current spec requirements
(d) Does not appear to understand some spec requirements, but does spell out staging areas and water sources
(e) Supervisor has poor history with working with others, and four others are unknown
(f) Questionnaire is incomplete/non‐response
Category
Weight, %
Evaluation Rating and (Notes) Question
NumbersContractor A Contractor B Contractor C Contractor DEvaluation Category
Superior: 4
Good: 3
Average: 2
Poor: 1
Unacceptable: 0
Confidence & Rating Scale
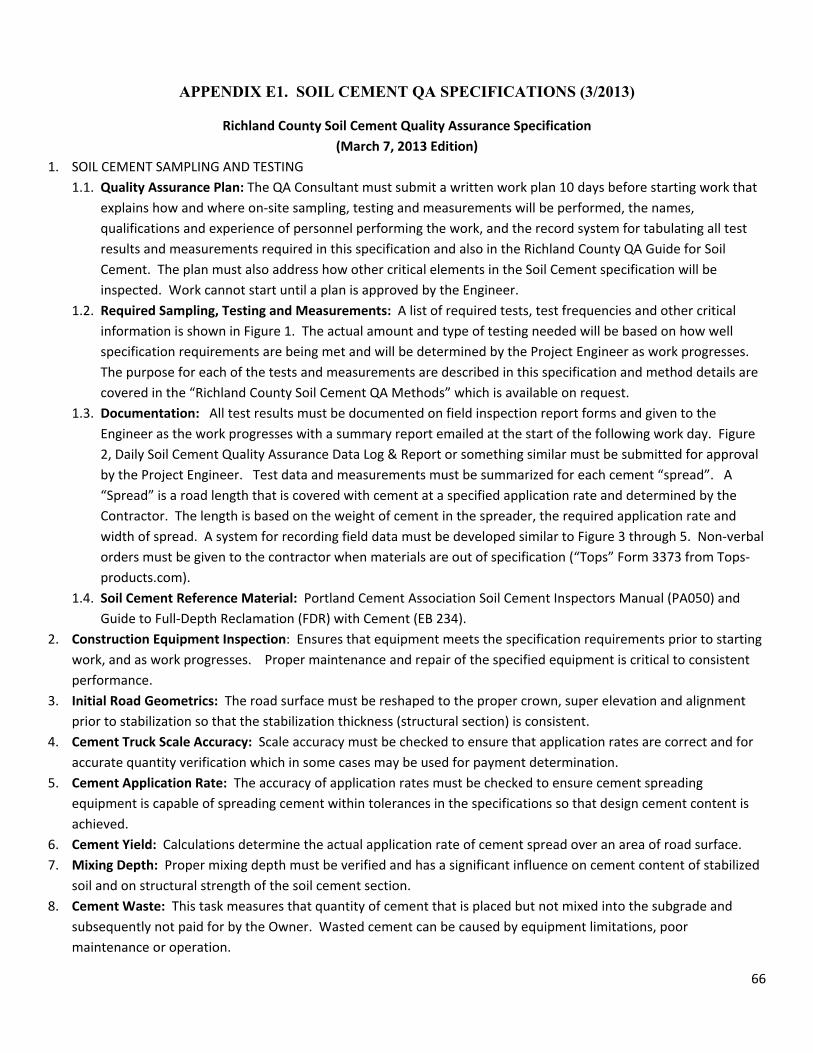
66
APPENDIX E1. SOIL CEMENT QA SPECIFICATIONS (3/2013)
Richland County Soil Cement Quality Assurance Specification
(March 7, 2013 Edition)
1. SOIL CEMENT SAMPLING AND TESTING
1.1. Quality Assurance Plan: The QA Consultant must submit a written work plan 10 days before starting work that
explains how and where on‐site sampling, testing and measurements will be performed, the names,
qualifications and experience of personnel performing the work, and the record system for tabulating all test
results and measurements required in this specification and also in the Richland County QA Guide for Soil
Cement. The plan must also address how other critical elements in the Soil Cement specification will be
inspected. Work cannot start until a plan is approved by the Engineer.
1.2. Required Sampling, Testing and Measurements: A list of required tests, test frequencies and other critical
information is shown in Figure 1. The actual amount and type of testing needed will be based on how well
specification requirements are being met and will be determined by the Project Engineer as work progresses.
The purpose for each of the tests and measurements are described in this specification and method details are
covered in the “Richland County Soil Cement QA Methods” which is available on request.
1.3. Documentation: All test results must be documented on field inspection report forms and given to the
Engineer as the work progresses with a summary report emailed at the start of the following work day. Figure
2, Daily Soil Cement Quality Assurance Data Log & Report or something similar must be submitted for approval
by the Project Engineer. Test data and measurements must be summarized for each cement “spread”. A
“Spread” is a road length that is covered with cement at a specified application rate and determined by the
Contractor. The length is based on the weight of cement in the spreader, the required application rate and
width of spread. A system for recording field data must be developed similar to Figure 3 through 5. Non‐verbal
orders must be given to the contractor when materials are out of specification (“Tops” Form 3373 from Tops‐
products.com).
1.4. Soil Cement Reference Material: Portland Cement Association Soil Cement Inspectors Manual (PA050) and
Guide to Full‐Depth Reclamation (FDR) with Cement (EB 234).
2. Construction Equipment Inspection: Ensures that equipment meets the specification requirements prior to starting
work, and as work progresses. Proper maintenance and repair of the specified equipment is critical to consistent
performance.
3. Initial Road Geometrics: The road surface must be reshaped to the proper crown, super elevation and alignment
prior to stabilization so that the stabilization thickness (structural section) is consistent.
4. Cement Truck Scale Accuracy: Scale accuracy must be checked to ensure that application rates are correct and for
accurate quantity verification which in some cases may be used for payment determination.
5. Cement Application Rate: The accuracy of application rates must be checked to ensure cement spreading
equipment is capable of spreading cement within tolerances in the specifications so that design cement content is
achieved.
6. Cement Yield: Calculations determine the actual application rate of cement spread over an area of road surface.
7. Mixing Depth: Proper mixing depth must be verified and has a significant influence on cement content of stabilized
soil and on structural strength of the soil cement section.
8. Cement Waste: This task measures that quantity of cement that is placed but not mixed into the subgrade and
subsequently not paid for by the Owner. Wasted cement can be caused by equipment limitations, poor
maintenance or operation.

67
9. Pulverization: Adequate pulverization is critical to ensure the desired strength and uniformity within the soil
cement structural section since large clumps of untreated soil create weaknesses.
10. Moisture Density Relationship: These tests provide the standard for determining percent compaction and optimum
moisture for evaluating the mix moisture content.
11. Moisture: Moisture measurement during mixing is critical to ensure that there is enough moisture to hydrate the
cement and help achieve compaction.
12. In‐Place Moisture, Density and DCP: Compaction measurements are critical to achieving strength and creating a
dense soil layer resistant to moisture intrusion. Post construction moisture, however, can lead to freeze/thaw, and
or wet/dry cycle deterioration and long term durability issues.
13. Mixing and Finishing Time: The time it takes to mix and compact soil cement must be recorded and is critical
because the hydration of cement starts once it comes in contact with moist soil. Compaction must be completed
prior to the hydration process going very far so that there is enough lubrication from moisture to achieve
compaction and so that the compaction process does not disrupt the hydration process reducing strength.
14. Final Finish Geometrics: The final road surface crown, super elevation and alignment should be very similar to the
initial finish ensuring consistent soil cement thickness.
15. Finish Smoothness: Avoiding ruts and dips is not only critical for a smooth ride on the road surface, but also affects
road surface drainage creating maintenance as well as road safety problems.
16. On‐Going Condition Evaluation: These measurements ensure that the finished soil cement surface stays in good
condition and is cured correctly prior to being covered with the wearing surface consisting of gravel, a bituminous
surface treatment (BST), or a BST over gravel.
17. Portland Cement Quality: Ensures that the cement used on the project has consistent cementitious capability.
18. Mixing Water Quality: The quality of water is important and will be verified since quality can affect cement
hydration and resulting strength of soil cement.
19. Unconfined Compression Strength (UCS): UCS testing ensures that the cement content (cement application rate &
depth of mixing), pulverization, and moisture content are within an acceptable range to produce desired strengths.
This is critical where combinations of soil exist, or where different soils from the mix design are encountered.
20. As Built Drawings: All the different actions and occurrences that take place during construction are critical to
diagnosing problems that occur throughout the life of the soil cement structure. Several examples are where
samples were taken for unconfined compression strength testing, where a change in construction process took
place, or where soft subgrade was encountered and the depth and cement content used to treat the area. Having
all the information on a set of drawings helps in the diagnostic process.

68
Task Type of
Acceptance QA
Method Sampling or Measurement Frequency (a)
NVO (b)
QA
QC
Point of Sampling or Measurement
Split Sample
Reporting Time
QA Plan Visual 1 One per Project x ‐ ‐‐ ‐‐ Prior to Job Start
Construction Equipment Inspection
Visual & Measured
2 Prior to project startup and weekly
(blade Wear, Spreader DMI & Scales, Mixer Spray Bar, Water Truck & Rollers) x x
At Project Staging Area
‐‐ Immediate
Initial Road Geometrics
Measured 3 Measurements on each cement spread each day to ensure
requirements are met x x x
After Initial Road Preparation
‐‐ Immediate
Cement App Rate
Measured 4 Calibration: 3 per Distributor x x Off Project Road ‐‐
Before Starting Work
As Needed based on Visual Estimate of Non Uniformity x x On Project Road ‐‐ Immediate
Cement Yield Measured 5 All cement Spreader Spreads x x x On Project Road ‐‐ Immediate
Mixing Depth Measured 6 Once per day, additional if non‐conforming x x x Behind Mixer ‐‐ Immediate
Cement Waste Measured 7 When cement wasting is significant x x After mixing x Immediate
Pulverization Measured 8 Continuous when difficult to meet spec. As Needed based on Visual
Estimate of Non‐Conformance x
Behind Mixer
‐‐ 15 minutes
Moisture Density
Relationship Tested 9 Once per material type and for various % + #4 x Behind Mixer ‐‐ 3 hours
Moisture Measured
10 Twice per day for first 5 days, x
Behind Mixer ‐‐ ‐‐
Visual Continuous x x x
In Place Density, Moisture & DCP
Tested 11 As necessary for roller pattern, Five Random Tests per Cement Spread x x After Finishing ‐‐ Immediate
Mixing & Finishing Time
Measured 12 Each Cement Spread or mixed area x x After Finishing ‐‐ Immediate
Final Finish Geometrics
Measured 13 Measurements on each cement spread as necessary to ensure
requirements are met x x x
On Project Road after Finishing
‐‐ Immediate
Finish Smoothness
Measured 14 Measurements on each cement spread as necessary to ensure
requirements are met x x x
On Project Road after Finishing
‐‐ Immediate
On Going Evaluation
Visual & Measured
15 Observations & Measurements on each cement spread as necessary to
ensure requirements are met x x
Between Finishing & Covering
‐‐ Hourly
Portland Cement Quality
Tested 16 One per week or when changes suspected x Pneumatic Truck Yes 30Hours
Mixing Water Quality
Tested 17 One per week or whenever sources change x Water Source Yes 24 hours
Unconfined Compression
Tested 18 Two to three times per week and when other issues dictate x Behind Mixer Yes 8 Days
“As Built” Drawings
Visual 19 Update drawings daily x Not applicable ‐‐ 24 hours
Figure 1 – Sampling, Testing and Measurement Requirements Footnotes: (a) As determined by Owner Engineer per ¶ 1.1.2
(b) Nonverbal order to Contractor when out‐of‐spec per ¶ 1.1.3

69
Figure 2. Soil Cement Daily QA Report
StartEndNW
4.23Initial Final Initial Final Initial Final Initial Final Initial Final Initial Final Initial Final Initial Final Initial Final Initial Final Initial Final Initial
0.0 0.0 -2.0 0.0 0.0 0.0 0.0 -0.5
0.0 0.0
0.187 88 95 95
90-0.9 -1.8 1.9 0.9
0.13D M D M D M D M D M D M D M D M D M D M D M D
99.7 -1.0 98.8 -1.9 98.4 -1.6 98.4 0.4 99.0 1.2 97.9 -2.2 98.5 -3.1 98.7 -2.0 96.7 -1.2 98.6 -3.1 98.0 -1.4 97.8
96.4 -1.7 97.2 -1.7 96.7 -2.5 98.9 -0.4 97.1 -2.4 98.2 -1.7 97.3 -4.4 97.7 -2.9 97.7 0.4 94.7 -4.1 97.8 -4.2 98.7
98.3-1.4
Curing(next day)
WaterCement
Document'n
-1.4 -3.8
1.8
Soil-cement 12"-18"
OK OK OK OK OK OK OK
Traffic DCP (mm/blow)
visual - OK
visual - OK
visual - OK
Intersection S-1 S-2 S-3 S-4 S-5 S-6 S-7 S-8 S-9 S-10 S-11
-1.8
2.50
-1
-2 -2 -2
98.1 98.0
0.0 0.0 1.0 0.0
1.33 1.00
OK
3.0
97.6 98.7 98.1 98.1
2.02.5 (retreated out-of-spec area @
25% app. rate)1.6
OK
-2.1 0.0 -2.0
-0.9
OK
-23 -2 -1
13
Y Y Y
14.0
111+72 L 107+95 L
1.8
+0.7% at one loc Y Y
YY Y
OK
YY Y Y
1049.821' 1049.821' 1049.824'
23.00 7.50 2.50 3.50
0.0
96.7 98.3
4738.395'4738.332' 4738.576'4738.516'4738.452'
122+97 L 119+22 L 115+46 L 111+72 L 107+95 L 104+21 L 100+20 L
1049.813'
104+21 L122+97 L 119+22 L
1049.8
4738.84738.832'4738.768'4738.703'4738.638'Starting Coordinates
Crown, %
124+97 L 115+46 L 100+20 L 96+20 L 92+20 L 88+20
96+20 L 92+20 L 88+20 L 84+30
Surface Finish
Duration, Mix to Finish, hrs
4.50
4 -1
7 Day UCS
0 Hr by DCP12-24 Hr by DCP
4738.300'
530
87
36-48 Hr by DCP60-72 Hr by DCP 69
Rutting
QA
Tec
h #
3Q
A L
ab T
ech
nic
ian
% of Max Dry Density (D) (Spec: 97% min)
Relation to Opt Moist, ±% (M)
Average M, %Average D, %
As-Builts/Daily Report
% Crown, in ±0.5% tolerance?Smoothness, 3/4" dev. in 14 ft
Check all that
apply:Raveling
Low MoistureDelamination
Moisture (visual check)
4738.293'
1049.800'
Error From Target, ±% (Spec: ± 5%)
Average (absolute)
Cement Spread Rate
QA
Tec
hn
icia
n #
1
DateSpread ID No. (SS= Soft Spot)
QA
Tec
hn
icia
n #
2
Mixing Pass:
Deviation from Target, ± in. (Spec: ± 3/4 in.)
Compacted Mixing Depth
Average (final, abs)
Average (final)
Relation to Optimum, ±% (Spec: plus 1-3%)
Pulverization
Average (final)
Mixing Moisture Content
(nuclear)
124+97 L
Rd 119
% Soil Pulverized (Spec: 80% min)
Road Geometrics
Spread Location
Width, ft
Station
Alignment (visual)
9/7/2012
1
88
Strength, psi
Cement/H2O Quality
4-7 days by DCP
115.0
Moisture Density Curve
Opt Moist, %Max DD, pcf
Values
One-pt (OP) / Curve (MD)
91 48
Cracking
Cement Cubes, % of control
Y
XX
1 2 3 4 5 6 7 8 9 10 11 12
X
Irregular Surface,
Delamination and Unbonded Soil 1'
x 30' L edge
Irregular Surface,
Delamination and Unbonded Soil 1' x 100' L edge; Unbonded Soil from brooming - 1' x 20' L edge
Delamination & Unbonded Soil 1'
x 50' and 1' x 100' L edge
Approx 2' Centerline shif t -
narrow lane
1049.825' 1049.825' 1049.827'
Irregular Surface 6' x
100'
Delamination 1" deep 1' x 3';
Unbonded Soil 2' x 200' L edge
Delamination & Unbonded Soil
1.5' x 75'
Hole at CL Road 2" deep 6" diam; Hole 2" deep R
side 6" x 1'
Irregular Surface,
Delamination and Unbonded Soil 3'
x 150' L edge
X
0.0
Y YY Y
1049.825' 1049.825' 1049.825'
74
OK OK
97.9
OK
-3 -2
95
-0.6
0.5
0 3 -3 -2
0.0
4.002.502.00
97.9 98.2 97.2
-2 5 2 3
-0.4
1.6
-2.5
-1.80
95
-2
74
0.901.90
2.00
-3.6 -2.8 -3.0
64
S e q u e n c e
MD
OK OK
83 63 74
OK OK
-7 -5
74 54 54
DCP, mm/Blow
Compacted Moisture &
Density
Soil-cement 0"-12"
Subgrade
119 146 105 105 105 63 74 74 105 91 119
Unbonded Soil X
visual - OK
Approx 2' Centerline shift -
narrow lane; Rutting 2' x25' and 2' x 20'
No signifdefects n
Delamination 2' x 3' and 3' x 3' L
side
AL
L
On-going Condition
Evaluation & Problem ID
Pre-Chip Seal Surface Condition Observations (after
brooming) 9/13 and 9/14
13 14 15 161 2 3 4 5 6 7 8 9 10 11 12S e q u e n c e
50
60
70
80
90
100
0 10
Percent Pulverization after Mixing
Specification Minimum
Daily Quality Assurance Test Results
70.0
75.0
80.0
85.0
90.0
95.0
100.0
105.0
0 10
Specification Minimum
0
50
100
150
200
250
300
0 10
0 hr Cure
12‐24 Hr Cure
36‐48 Hr Cure
60‐72 Hr Cure
4‐7 day cure
Threshold for Traffic
Percent Compaction
Strengthby DCP, psi(based on correlation by Kleyn, 1983)
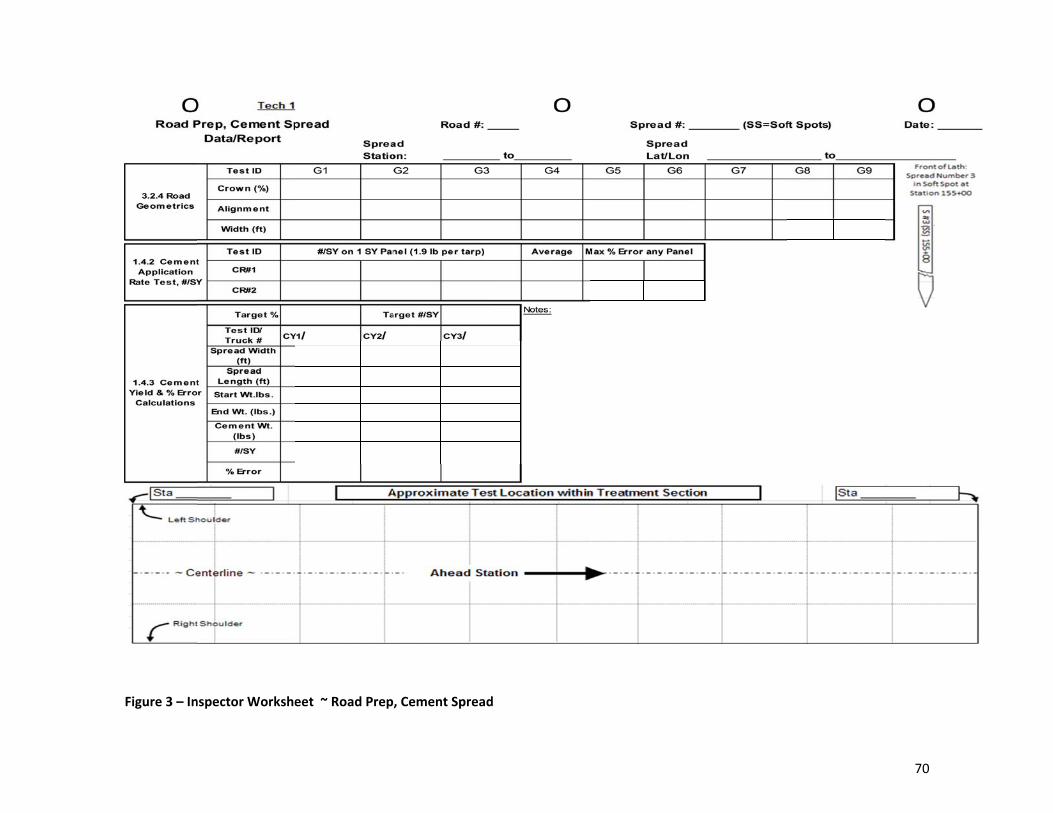
Figure 3 – Innspector Worksheeet ~ Road Prep, Cement Spreadd
70
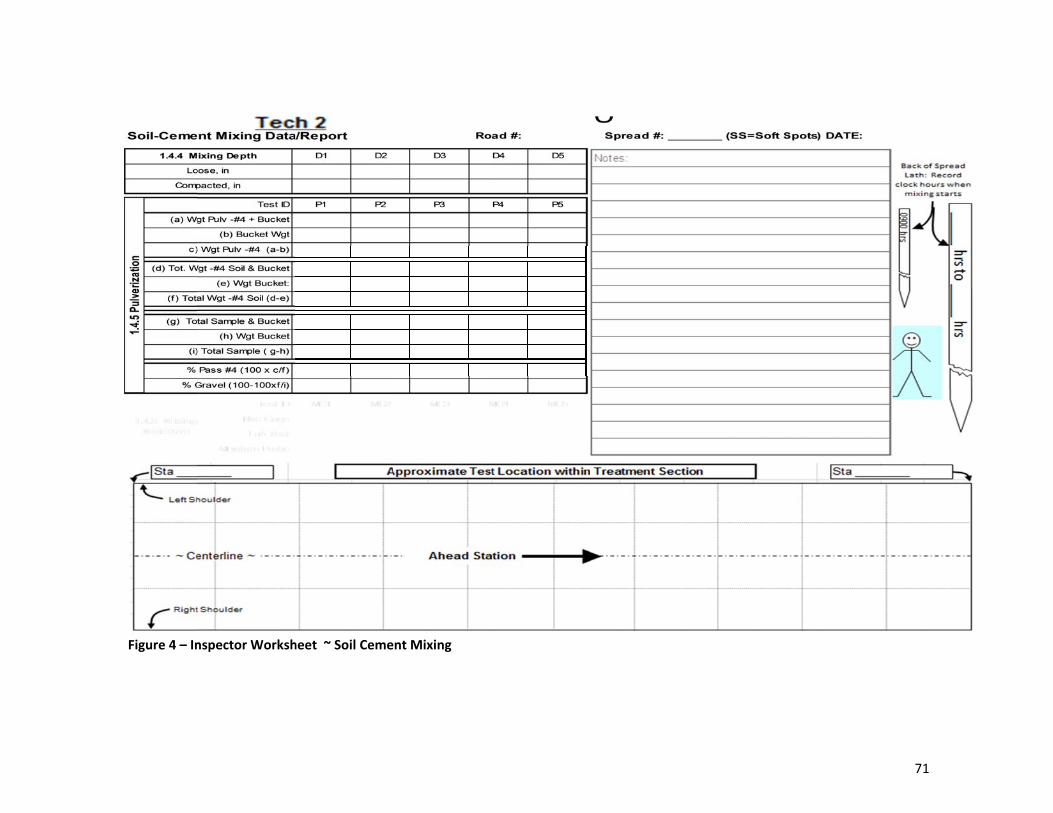
Figure 4 – Innspector Workshheet ~ Soil Cement Mixing
71

Figure 5 – In
nspector Worksheeet ~ Compactio
on
72

73
APPENDIX E2. SOIL CEMENT QA METHODS (3/2013)
Richland County QA Methods for Soil Cement
(March 7, 2013 Edition)
1. PURPOSE: This guide provides non‐standard testing and measurement method details to be used
for quality assurance/control on soil cement construction in Richland County Montana. The
frequency of testing is covered in Figure 1 of the QA specification. Each field technician must have a
digital camera and hand held calculator. Personal Protective Equipment (PPE) (hard had, ear plugs,
dust mask, eye protection, gloves, etc.) are not comprehensively covered in this guide.
Identification of hazards and the selection and wearing of equipment is the testing technicians’
responsibility.
2. CONSTRUCTION EQUIPMENT INSPECTION
2.1. Scope: Compare equipment to be used on the project with that shown in the proposal and in
the Subgrade Soil Cement Stabilization specification. Determine if the contractor’s equipment
meets specification requirements. Conduct periodic checks to ensure equipment is properly
maintained, cleaned, and wear parts are replaced.
2.2. Apparatus
2.2.1. 25 foot tape measure
2.2.2. Measuring wheel: Rolatape Professional Series 400 or equal
2.2.3. Liquid filled tire pressure gauge (0 to 60 psi)
2.3. Measurements Methods
2.3.1. Blade width and cutting edge wear:
Purpose: Wear on cutting edges can cause poor road surface drainage and road
surface defects.
Measurement Method: Measure cutting edge width at the start of the project to see
if it conforms to the specified minimum. Measure wear by taking several
measurements from the top of the cutting edge at the high and low wear points.
Subtract the maximum from the minimum measurement to determine cutting edge
wear.
2.3.2. Cement Spreader Distance Measuring Instrument (DMI).
Purpose: The accuracy of the spreader DMI controls the accuracy of cement spread,
which is critical for achieving the desired soil cement strength and for ensuring costly
cement is used accurately.
Measurement: Use the measuring wheel to periodically check the accuracy of the
DMI. The DMI and measuring wheel measurements should be within 2% of each
other.
2.3.3. Cement Spreader Truck Scale Accuracy

74
All Methods: Conduct measurements on level ground, record initial and final
readings of the truck scale readout. If truck scales are adjusted for accuracy,
observe and document the process used and conduct another truck scale accuracy
test.
Method A: Certified Weights of Cement: Obtain a copy of the bill of lading for a
cement shipment that can be completely transferred to the cement spreader.
Determine the gross weight of cement in the hauling unit. After transferring cement
to the spreader, observe a contractor’s representative hit the hauling unit body with
the rubber mallet close to the discharge hose to ensure all cement was transferred
to the cement spreader. A hollow sound should be heard. If the spreader cannot
hold all the cement in the hauling unit, empty the spreader, then continue the data
collection process for the remainder of the cement in the hauling unit.
Method B: Certified Scales: Record and photograph the certification seal on the
platform scales. Observe the platform scale zero weight and both the empty and full
weights of the cement distributor.
Report: Determine the weight of cement loaded on the distributor from Certified
Weights or Certified Scales and calculate the percent difference between that weight
and weights determined from the spreader truck scale readout. Notify the
Contractor of out of spec measurements with Non‐Verbal Orders and report them on
the notes section of the Daily QA report.
2.3.4. Mixer tire size uniformity and air pressure:
Purpose: Tire size uniformity and air pressure influence mixing depth and should be
checked on a regular basis.
Measurement: Initially check tire sizes for uniformity and after tire changes
thereafter. Ask a contractor’s representative to check tire pressure uniformity
between all tires. Tire pressure should be within 5 psi.
2.3.5. Mixer spray bar functioning
Purpose: Mixer water spray bars are continually bombarded with wet soil, Portland
cement and rocks, so each orifice within the mixing chamber needs to be checked
each day to ensure that uniform moisture contents are achieved in the soil cement.
Method for Cleaning Spraying Nozzles/Drum Housing: Refer to Wirtgen Model 2500
Manual that indicates: “Check on numerous occasions daily during machine
operation and after finishing work. Remove both lids from the drum housing and
carry out visual inspection to ensure that large lumps of material are not stuck inside.
If material is stuck inside which cannot be removed by the normal cleaning function,
fully raise the milling drum and then run it until the material lumps are removed. “
Ensure that each nozzle works by observing their performance when each of the 16
water bar valves are cycled on and off.
2.3.6. Water truck spray pattern, water leaks
75
Purpose: The water curing process is intended to prevent moisture loss caused by
evaporation which can lead to reduced strengths and cracking of soil cement. Over
application of water runs off the road surface and can saturate and also weaken the
surface. Satisfactory spray patterns are necessary to ensure entire treated road
surface is covered to a damp condition without excess water oversaturating and
potentially weakening the surface.
Inspection: Ensure that there are no significant water leaks and that the spray
pattern distributes a uniform amount of water across the total width of the treated
road surface. Although no tolerances have been established, cookie sheets with
raised sides laid cross the road width can be used to measure the variations in
application rate.
2.3.7. Roller size, weight and ballast
Purpose: Based on previous experience, specific types of equipment have proven
successful in achieving compaction of soil cement. Initial inspection must determine
if the equipment is acceptable and subsequent inspections must be made to ensure
that ballast has not changed.
Inspection: Photograph each piece of equipment, along with contractor’s equipment
number and manufacturer’s specification placard. If the required information is not
available on the equipment itself, do an internet search to verify conformance.
Inspect ballast by either removing water hatches or weighing the roller on a certified
scale.
2.4. REPORT:
2.4.1. Take one photo of each piece of equipment that shows the manufacturer and model
number, the contractor’s equipment number, and another photo of the manufacturer’s
placard that provides additional information on gross weight, water capacity, etc.
2.4.2. Each time equipment is checked, make note that inspections were conducted and record
out of specification issues in the “pertinent notes” area of the daily quality assurance form,
and use non‐verbal order forms to notify the contractor.
3. Initial Road Geometrics:
3.1. Scope: Make measurements of the shaped road surface to ensure compliance with the
requirements for width, crown and super elevation. Drive the road surface to detect areas in
the vertical alignment where problems may exist and make measurements where appropriate.
3.2. Apparatus
3.2.1. 30 foot tape measure or measuring wheel
3.2.2. 8 foot straight edge
3.2.3. Smart level
3.2.4. Level Rod

76
3.3. Measurement Method: Make measurements of the shaped road surface to ensure
compliance with the requirements for width, crown and super elevation. Drive the road
surface to detect areas in the vertical alignment where problems may exist and document their
location by road station.
3.3.1. Road Width: Measure with tape measure or measuring wheel.
3.3.2. Crown: Check crown on tangents where problems are apparent. Lay straight edge
across width of lane, place smart‐level on straight edge and take reading.
3.3.3. Super Elevation: Check road cross slope at staked locations on curves. Lay straight edge
across width of lane, place smart‐level on straight edge and take reading.
3.4. Report: Work closely with contractor’s grade checker to ensure corrections are made in a
timely manner. Record measurements on the inspector worksheets. Notify the Contractor of
out of spec measurements with Non‐Verbal Orders and report them on the notes section of the
Daily QA report. Provide the Engineer with station locations of possible vertical alignment
problems.
4. CEMENT APPLICATION RATE
4.1. Scope: Verify cement application rate and uniformity when requested by the Project Engineer,
or when visual observations indicate discrepancy or issues with uniformity of spread.
4.2. Apparatus
4.2.1. Hand held digital scale with accuracy of 0.10 or better (100 lb. capacity Sallter/Samson or
equal)
4.2.2. Six each, one square yard heavy canvas panels with all edges hemmed and grommet at
each corner.
4.2.3. 50 each 60 penny nails
4.2.4. Claw hammer, 24 oz. minimum
4.2.5. Measuring wheel: Rolatape Professional Series 400 or equal
4.2.6. PPE: Gloves, dust masks and eye protection
4.2.7. Inverted can spray paint (florescent orange)
4.3. Measurement Method
4.3.1. Spreader Calibration: Place four canvas panels across the road (spread width) to check
transverse spread uniformity and two down the road for longitudinal uniformity
measurement. Transvers panels should be placed in the center portion of a 100 foot long
spread. Dig a ½” deep trough along the leading edge of the panel with the claw of the
hammer and nail the panel down through each grommet. Paint the location of each panel
on the adjacent lane outside the spread width. If the cement spread does not look
uniform, stop the spreader truck prior to covering canvas panels. After cement spreading,
carefully locate the edges and corners of the panels and remove nails. Pick up the canvas
panel at each corner, being careful not to lose any cement and weigh with the digital scale.
Calculate the application rate on a per panel basis and compare each panel to the required
77
rate to determine percent uniformity. Percent accuracy is determined by Cement Yield
measurements.
4.3.2. Spreader Verification: Where application rate testing is necessary to verify visual
problems, place panels in locations that measure rates in the problem areas. Follow the
procedures indicated above.
4.4. Calculations: Percent Uniformity = 100 x (weight cement on canvas)/(target weight of
cement per SY)
4.5. Report: Report test results on the inspector worksheet and at the end of each day transfer
data to the Daily QA Report. Immediately report all out of spec measurements to the
Contractor using a non‐verbal order that identifies test locations and percent uniformity for
each panel reported to the nearest 0.1%
5. CEMENT YIELD:
5.1. Scope: Determine the cement application rate based on cement weight applied and area
covered by the cement spreader. If longitudinal application rates do not appear uniform, stop
the spread immediately and run yield tests every 50 to 100 feet. The Cement Application Rate
test (QA/QC Guide Method 4) may also be used to determine longitudinal variations. If
transverse or longitudinal rates do not appear uniform, stop the spread immediately and run
the Cement Application Rate test.
5.2. Apparatus
5.2.1. Measuring wheel: Rolatape Professional Series 400 or equal
5.2.2. Hand held GPS device
5.2.3. Inverted can spray paint, florescent orange
5.2.4. Lath and hammer or hatchet for driving
5.2.5. Permanent markers for marking lath
5.3. Measurement: Verify the length of spread from the electronic Distance Measurement
Instrument (DMI) by using a measuring wheel. Determine the weight cement used by
comparing the weight at the beginning of the spread to that at the end of the spread.
Determine the area covered by multiplying the length by DMI (or measuring wheel) times the
planned mixing width.
5.4. Calculations: Calculate the cement application rate per square yard by dividing the weight of
cement applied according to truck scales by the areas covered in square yards. Calculate the
percent error of the each spread by dividing the actual rate applied by the target rate, then
multiplying by 100. Report results to the nearest one percent.
5.5. Staking: Locate cement spread lath according to the approved spread length, at least 30 feet
from the road shoulder. Mark lath as indicated in Figure 3 of the Soil Cement QA specification.
5.6. Report: Report test results on the inspector worksheet and at the end of each day transfer
data to the Daily QA Report for each spread. Immediately report all out of spec measurements
to the Contractor using a non‐verbal order. Maintain a daily log of the cement distributor load

78
weights, area covered, calculated rate in lbs./SY and GPS location (with hand held GPS device)
of the end of each cement spread.
6. Mixing Depth:
6.1. Scope: Check the compacted roadbed mixing depth to ensure that percent cement used is as
required and the structural section thickness meets design requirements.
6.2. Apparatus
6.2.1. Pick Axe
6.2.2. Shovel
6.2.3. Measuring Tape or other graduated device at least 24 inches in length
6.2.4. Probe rod, 3/8” diameter with handle
6.2.5. Straight edge, 3 feet + (lath, or something similar) 6.3. Measurement
6.3.1. On the first mixing pass of the day and as necessary thereafter, dig through the
pulverized soil on each side of the mixing pass to a depth where a color change exists due
to lower moisture content. Measure to the top of the undisturbed ground to determine
roadbed mixing depth in inches.
6.3.2. Compare depth measured with mixing machine settings. Retest as necessary to ensure
depths are within tolerances.
6.3.3. Immediately adjacent to the hole dug for depth measurement, push the probe rod
through the pulverized soil that has been compacted by the mixer tires. Stop pushing the
probe when greater resistance is encountered. Make a mark on the probe that coincides
with the top of the undisturbed adjacent ground. Extract the probe and measure the
depth to the mark. Compare depth measured by probing with the depth by digging a
hole. Use the probing method for periodic depth checks if results are comparable.
6.4. Report: Record all measurements to the nearest 1/4" inch on the inspector worksheet and at
the end of each day transfer data to the Daily QA Report. Immediately report all out of spec
measurements to the Contractor using a non‐verbal order that indicates depths and
measurement locations.
7. CEMENT WASTE
7.1. Scope: When directed by the Project Engineer, collect and weigh cement that was not mixed
into the subgrade at several locations that represent typical amounts of the cement wasted and
calculate the percentage and tons of cement wasted over the entire spread length
7.2. Apparatus
7.2.1. Flat bottom scoop, shovel, etc.
7.2.2. Plastic 5 gallon bucket
7.2.3. Hand held digital scale with accuracy of 0.10 or better (100 lb. capacity Salter/Samson or
equal)

79
7.2.4. Tape Measure, 30 foot length
7.2.5. Measuring wheel: Rolatape Professional Series 400 or equal
7.3. Measurements: Use various scoops or shovels to pick up cement that has flowed or has been
pushed outside the mixing width at three or more typical areas along the cement spread. Place
the cement in a 5 gallon bucket and weigh. Measure the total length of each area sampled and
calculate the tons of cement wasted within each cement spread.
7.4. Report: Report test results on the inspector worksheet and at the end of each day transfer
data to the Daily QA Report. Immediately report the tons of cement wasted to the project
engineer using a non‐verbal order. Also record the amount of wasted cement in the daily log
of cement applied in the Cement Yield Test (QA/QC Guide Method #6).
8. PULVERIZATION TESTING 8.1. Scope: Measure pulverization after mixing and identify areas that do not meet the minimum
requirements. Take additional measurements of areas that are remixed. Inform contractor of test results as soon as they become available. Develop a feel for the percentage so that the approximate percentage can be determined visually when not close to the minimum spec limit. After developing a confidence level in visual estimation, only run tests when pulverization appears close to the minimum specified.
8.2. Apparatus 8.2.1. Number 4 sieve, 12 inch diameter 8.2.2. Plastic 5 gallon bucket 8.2.3. Gloves 8.2.4. Hand held digital scale with accuracy of 0.10 or better (50 lb. capacity Salter/Samson or
equal)
8.2.5. Shovel and hand held scoop 8.3. Measurements: Select an area between the mixer wheel tracks for sampling. Dig to the
bottom of the mixed material and take about a 5 lb. sample along the vertical side of the hole that represents the total depth of pulverized soil. Place the soil in the bucket and weigh. Hand sieve the sample, manipulating the soft pulverized clumps through the sieve. Weigh the minus #4 material and discard. Use sufficient force to make all the hard clumps pass the sieve. Weigh the plus #4 gravel retained on the sieve. Calculate the percent pulverization by the following formula. % Pulverization = 100 x (a)/(b‐c) (a) weight of minus #4 (b) weight of original sample (c ) weight of plus #4 gravel
8.4. Report: Report test results to the nearest whole percent on the inspector worksheet and at the end of each day transfer data to the Daily QA Report. Immediately report all out of spec measurements to the project engineer using a written note.
9. MOISTURE DENSITY RELATIONSHIP
9.1. Scope: Utilize the standard proctor test on pulverized soil cement mixtures. Complete the testing process in two hours from the time cement is mixed with the soil to the time that compaction is completed. Develop a family of curves for the different soils that are encountered.

80
9.2. Apparatus 9.2.1. Sampling Tools (Plastic 5 gallon bucket, shovel, etc.) 9.2.2. Standard Proctor, ASTM D558 Method B 9.2.3. Family of Curves, AASHTO T272
9.3. Sample: Obtain a sample of pulverized soil from three or more locations across the treated width within a 100 foot long road segment. Samples should be close to optimum moisture. Hand squeeze samples to estimate optimum. Take additional samples when soil type or percent coarse aggregate changes are apparent. Discard plus ¾” material and do not substitute#4 by ¾”. Single point proctor tests may be used to judge if mixed materials are close to optimum.
9.4. Test Method: The following two exceptions to the ASTM method are required so the field characteristics are maintained in the samples: (1) two hour completion time limits and (2) do not reduce soil clods to minus #4. Compact enough specimens for four or more moisture density points, and retain a split for determination of percent pulverization and percent coarse aggregate.
9.5. Report: Record the location of tests and the test results on the inspector worksheet and at the end of each day transfer sample location, maximum density and optimum moisture data to the Daily QA Report.
10. MOISTURE
10.1. Scope: Perform standard gravimetric moisture content tests and hand squeeze soil in conjunction with moisture density tests to develop a visual relationship that is useful when estimating moisture behind the mixing machine. Continually determine soil moisture suitability when mixing is performed. . Convey the need for more or less moisture to contractor QC personnel and occasionally test to verify hand squeeze estimates.
10.2. Apparatus: 10.2.1. Refer to AASHTO T265 10.2.2. One gallon zip lock bags
10.3. Measurements: After estimating moisture by hand squeezing, take a representative sample behind the mixing machine, then run laboratory moisture content tests as required to develop a relationship that ensures the mixed moisture is between 1 and 3 percent above optimum immediately after mixing. Tightly squeeze mixed soil in the palm of the hand until a cast is formed that will fracture with only slight pressure applied by the thumb and fingertips. Normally, small amounts moisture are evident on the palm of the hand when just above optimum.
10.4. Report: Report laboratory test results according to AASHTO T265 on the inspector worksheet and at the end of each day transfer data to the Daily QA Report. Immediately notify the project engineer with a written note when the contractor refuses to take corrective action.
11. IN‐PLACE MOISTURE, DENSITY & DCP
11.1. Scope: Perform in place moisture density tests with a nuclear gauge to establish roller patterns that produce acceptable densities when requested by the Project Engineer and when different soils are encountered. Perform acceptance tests after surface finishing has been completed on each cement spread. When required perform Dynamic Cone Penetration tests

81
at direct transmission sites and provide data in terms of penetration per blow for the compacted layer and underlying subgrade.
11.2. Apparatus: 11.2.1. Refer to AASHTO T‐224, T272, T310 and ASTM D 6951‐03 (12” probe required) 11.2.2. Non‐verbal order forms
11.3. Measurements: 11.3.1. In‐Place Moisture Density: Run all in‐place moisture density tests at a 10 inch depth to
account for any possible influence of underlying subgrade. Determine the best seat orientation of the gauge by moving the gauge around the direct transmission hole. Select the maximum density by using the family of curves (AASHTO T272) and field moisture contents along with corrections for coarse particles (using AASHTO T‐224 and % coarse particles from pulverization testing) when appropriate.
11.3.2. Dynamic Cone Penetrometer: When required by Engineer perform DCP tests at in‐place moisture density sites to provide additional density confirmation or for correlation purposes.
11.4. Report: Report test results on the inspector worksheet and at the end of each day transfer data to the Daily QA Report. Immediately report all out of spec measurements to the Contractor using a non‐verbal order. 11.4.1. In Place Moisture Density: Report wet, dry and maximum densities, as well as percent
moisture and percent compaction. 11.4.2. DCP: Provide data in terms of penetration per blow for the compacted layer and when
required, the underlying subgrade.
12. MIXING AND FINISHING TIME 12.1. Scope: Continuously monitor the time it takes from when mixing starts to when
finishing is completed on each cement spread. 12.2. Apparatus:
12.2.1. Timepiece that displays time of day 12.2.2. Marker for lath
12.3. Measurements: Write the time of day mixing starts and finishing is completed on the lath that are driven for cement yield measurement (QA/QC Method 6). Calculate the time required for mixing and finishing
12.4. Report: Write elapsed time on the inspector worksheet and if not within the 2 hour time limit, notify the Contractor with a non‐verbal order so the construction process can be changed. At the end of each day, record elapsed time for each spread on the Daily QA Report.
13. FINAL FINISH and GEOMETRICS
13.1. Scope: Make measurements of the shaped road surface to ensure compliance with the requirements for treated width, crown and super elevation. Drive the road surface to detect areas in the vertical alignment where problems may exist and make measurements where appropriate. Inspect the final finish and geometrics by 6 pm each day so that corrections can be made.
13.2. Apparatus: 13.2.1. 30 foot tape measure or measuring wheel
82
13.2.2. 8 foot straight edge
13.2.3. Smart level
13.2.4. Swede Board
13.2.5. Level Rod
13.2.6. Hand level
13.2.7. Inverted can spray paint (florescent orange)
13.3. Measurements: Measure the finished road surface to ensure compliance with the requirements for treated width, crown and super elevation. Use an 8 foot straight edge and electronic level for slope measurements. The number of measurements depends on measurement consistency which must be reviewed by the Project Engineer. Drive the road surface to detect areas in the vertical alignment where problems may exist and make measurements where appropriate.
13.4. Report: Areas that do not meet specification requirements must be outlined with paint and a written note passed to the Project Engineer so the defect can be corrected in a timely manner. Record measurements on the Inspector Worksheet and transfer information to the notes section of the Daily QA Report.
14. FINISHED SMOOTHNESS
14.1. Scope: Make measurements of the finished surface to detect rutting and marring 14.2. Apparatus
14.2.1. 8 foot straight edge
14.2.2. Smart level
14.2.3. Thickness blocks and tape measure
14.2.4. Inverted can spray paint (florescent orange)
14.3. Measurements: Measure smoothness (surface dips and humps) in both transverse and longitudinal directions with 8 foot straight edge and tape measure or thickness blocks. The number of measurements depends on measurement consistency which must be reviewed by the Project Engineer. Drive the road surface to detect areas in the vertical alignment where problems may exist and make measurements where appropriate.
14.4. Report: Areas that do not meet specification requirements must be painted outlined with paint and a written note passed to the Project Engineer so the defect can be corrected in a timely manner. Record measurements on the Inspector Worksheet and transfer information to the notes section of the Daily QA Report.
15. ON‐GOING CONDITION EVALUATION
15.1. Scope: After soil cement has been finish bladed and prior to being covered with a wearing course material, make observations and where appropriate make measurements of areas of the road surface that become damaged or are not cured properly. Areas of concern are surface marring, rutting, cracking and inadequate curing.
15.2. Apparatus 15.2.1. 8 foot straight edge
15.2.2. Smart level
15.2.3. Thickness blocks
83
15.2.4. Inverted can spray paint (florescent orange)
15.3. Measurements: Measure defective areas where road surface problems develop (marring, rutting cracking, inadequately cured dry surface, etc.)
15.4. Report: Paint defective areas, take photographs where necessary, make a written summary of the areas for the Project Engineer’s review, note areas on the Inspector Worksheet and on the Daily QA Report at the end of each day.
16. PORTLAND CEMENT 16.1. Scope: Strength test a mixture of Portland cement (sampled from hauling units), sand
and water. Perform the same tests with a control cement and compare compressive strengths. Retest specimens where necessary to verify results.
16.2. Apparatus 16.2.1. One gallon zip lock bags 16.2.2. Plastic five gallon buckets with lids 16.2.3. Refer to ASTM C109
16.3. Samples 16.3.1. Control sample of Portland cement, preferably from the soil cement mix design testing. 16.3.2. Portland cement delivered to the project and sampled from bulk hauling units. 16.3.3. Distilled water 16.3.4. Graded standard sand (ASTM C778)
16.4. Procedure: For both the control and project cement samples, follow procedures in ASTM C109 for making a set of three mortar cubes for each type of cement. Flow tests are not required. Store specimens in molds for 24 hours in the moist cabinet prior to compression testing.
16.5. Report: Report compressive strength for each mortar cube for both the control sample and the project sample of Portland cement. Record results on Daily QA Report.
17. MIXING WATER
17.1. Scope: Strength test a mixture of project water, control cement and sand. Perform the same tests with distilled water and compare compressive strengths. Sample water sources at least three working days prior to use and as directed thereafter.
17.2. Apparatus 17.2.1. New glass containers 17.2.2. Refer to ASTM C109
17.3. Samples 17.3.1. Control sample of Portland cement, preferably from the soil cement mix design testing. 17.3.2. Project water 17.3.3. Distilled water 17.3.4. Graded standard sand (ASTM C778)
17.4. Procedure: For both the control and project water samples, follow procedures in AASHTO T106 for making a set of three mortar cubes for each type of water. Flow tests are not required. Store specimens for 24 hours in the moist cabinet prior to compression testing.
17.5. Report: Report compressive strength for each mortar cube for sample sets made with both distilled water and project water. Record results on Daily QA Report.
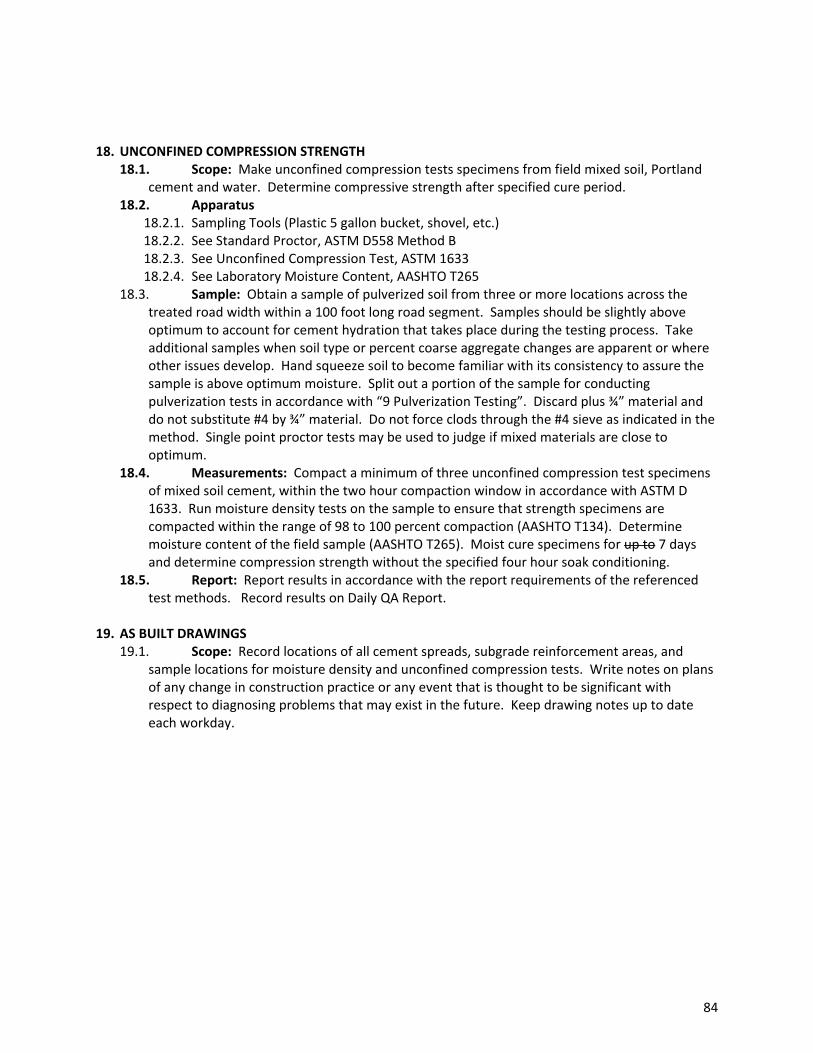
84
18. UNCONFINED COMPRESSION STRENGTH
18.1. Scope: Make unconfined compression tests specimens from field mixed soil, Portland cement and water. Determine compressive strength after specified cure period.
18.2. Apparatus 18.2.1. Sampling Tools (Plastic 5 gallon bucket, shovel, etc.) 18.2.2. See Standard Proctor, ASTM D558 Method B 18.2.3. See Unconfined Compression Test, ASTM 1633 18.2.4. See Laboratory Moisture Content, AASHTO T265
18.3. Sample: Obtain a sample of pulverized soil from three or more locations across the treated road width within a 100 foot long road segment. Samples should be slightly above optimum to account for cement hydration that takes place during the testing process. Take additional samples when soil type or percent coarse aggregate changes are apparent or where other issues develop. Hand squeeze soil to become familiar with its consistency to assure the sample is above optimum moisture. Split out a portion of the sample for conducting pulverization tests in accordance with “9 Pulverization Testing”. Discard plus ¾” material and do not substitute #4 by ¾” material. Do not force clods through the #4 sieve as indicated in the method. Single point proctor tests may be used to judge if mixed materials are close to optimum.
18.4. Measurements: Compact a minimum of three unconfined compression test specimens of mixed soil cement, within the two hour compaction window in accordance with ASTM D 1633. Run moisture density tests on the sample to ensure that strength specimens are compacted within the range of 98 to 100 percent compaction (AASHTO T134). Determine moisture content of the field sample (AASHTO T265). Moist cure specimens for up to 7 days and determine compression strength without the specified four hour soak conditioning.
18.5. Report: Report results in accordance with the report requirements of the referenced test methods. Record results on Daily QA Report.
19. AS BUILT DRAWINGS
19.1. Scope: Record locations of all cement spreads, subgrade reinforcement areas, and sample locations for moisture density and unconfined compression tests. Write notes on plans of any change in construction practice or any event that is thought to be significant with respect to diagnosing problems that may exist in the future. Keep drawing notes up to date each workday.

85
Appendix F. Otta Seal Specifications for Emulsion and Aggregate
Otta Seal Specification for High Float Emulsion, HF125S
Otta Seal Specification for Graded Aggregate
Tests on Emulsion Min Max
Viscosity, Saybolt Furol, Seconds at 50o C 35 150
Residue by Distillation, % by Mass 65
Demulsibility, %, 50 ml 0.1 N CaCl2 75
Oil Portion of Distillate, volume/Mass, % 1.0 4.0Sieve Test, % by Mass 0.1Storage Stability Test, 24 hr, % by Mass 1Coating TestCoating ability & water resistance ASTM D244:
Coating, dry aggregate goodCoating, after spraying fairCoating, wet aggregate fairCoating, after spraying fair
Adhesion Agent, % by Weight of Residue Note C
Tests on Distillation Residue
Penetration at 25oC, 5s, 100g 125 225
Solubility Trichloroethylene % by Mass 97.5
Float Test at 60oC, s 1200
Ductility, 25oC, 5cm/min, cm 40
Note A: Certificate of Compliance and test reports are required.
Note C: The emulsion must include an adhesion agent and suppliers should cover costs for such in their bids. The actual amount of adhesion agent must be determined by ASTM D 244 with aggregate from the planned source after contract award."
Note B: Follow ASTM D244, except that the mixture of limestone and emulsified asphalt shall be capable of being mixed vigorously for 5 minutes, at the end of which period the stone shall be thoroughly and uniformly coated. The mixture shall then be completely immersed in tap water and the water poured off. The stone shall not be less than 90% coated.
Note B
HF125S (Note A)Requirement
Min Max16 mm (5/8") 100 100 100
12 mm (1/2") 82 94 979 mm (3/8") 69 86 88
4.75 mm (#4) 48 67 531.18 mm (#16) 23 38 35425 um (#40) 14 26 2775 um (#200) 4 10 5.3
Gradation Limits, % PassingSieve Size
2011 Field Samples, 4 ea.

86
Appendix G Structural Thickness Design – Soil Cement
ESAL: 1,000,000
Subgrade Mr, psi:
3000
FWD Do, mils: 160
Max Subgrade Microstrain:
480
Max Stress Ratio
0.60
Design Option
Thickness, inches
Esc, psi6% min for Frost
8% max for shrinkage cracking
1 16 >100 6% OK Two Layers
2 14 >140 6% OK Two Layers
3 12 >170 OK No Single Layer4 <12 wont work5
Step 2: Determine subgrade modulus. Use either a DCP and charts, or FWD & DCP
(preferred option) for the average deflection directly under a 6,000 lb load (Do) from tests
conducted in the Spring season. Use Graph 1 to determine Subgrade Mr from FWD
maximum deflection, Do
Thickness Design Outline: Page one provides and example solution with a step by step process that uses graphs shown on page two and three. Page 4 is a blank form of page one that should help keep the process organized.
Thickness Design Steps with an Example Design DataStep 1: Assume a design traffic ESAL value.
Step 3: Use Graph 2 to determine allowable subgrade strain for the design ESAL.
Step 4: Use Graph 3 to determine maximum allowable stress ratio limit for the Soil Cement layer based on design traffic ESAL.
Sep 5: Use Graph 4 and the maximum subgrade strain to
identify options of soil cement layer thicknesses possible for the design
Subgrade Mr. Thicknesses correlating for Esc between 100 and
200 are suggested.
Step 6: Use Graph 5 and the
maximum stress ratio to determine
which options from Step 5 are
acceptable based on the design Subgrade Mr
Step 7: Use Graph 6 to determine
the minimum cement
content for each
acceptable design option
Step 8: Selecting the best option requires engineering judgment
when consideration of the following criteria
OK at any Esc 5.3
OK at any Esc 6.8
Step 9: Recommendations:
Alternative A: Pretreat all known weak areas with 3%
cement to 18" depth to raise the average subgrade
Mr, followed by 12 % treatment @ 8% Cement. Alternative B: Treat 12" depth at 8% Cement and
Lower Design Traffic ESAL value from 1,000,000 to
750,000
Cement content for Lean Clay Soils Maximum One
Layer depth equals 12". Two layers
increase cost
OK at any Esc 8.88" won't work No 8" won't work
y = 480035x‐0.997
R² = 0.9999
0
2,000
4,000
6,000
8,000
10,000
12,000
14,000
0 50 100 150 200
Subgrad
e M
r psi
Do‐Max Deflection‐Mils
Graph 1. Subgrade Mr vs Max Deflections ( From CR 351 Tests on Subgrade)
Load 5.‐6.7k Mr
Norm 6k Mr
Power (Norm 6k Mr)

87
400
500
600
700
800
900
1000
0 500 1000 1500 2000
Subgrad
e M
icrostrain
ESALS X 1000 ( Asphalt Institute Equation)
Graph 2. Subgrade Strain VS ESALS
y = 1.4723x-0.134
R² = 0.9857
0.40
0.50
0.60
0.70
0.80
0.90
1.00
0 500 1000 1500 2000
Str
ess
Rat
io
18 kip ESALs ( x 1000 )
Graph 3. Stress Ratio vs ESALs
Calc Values
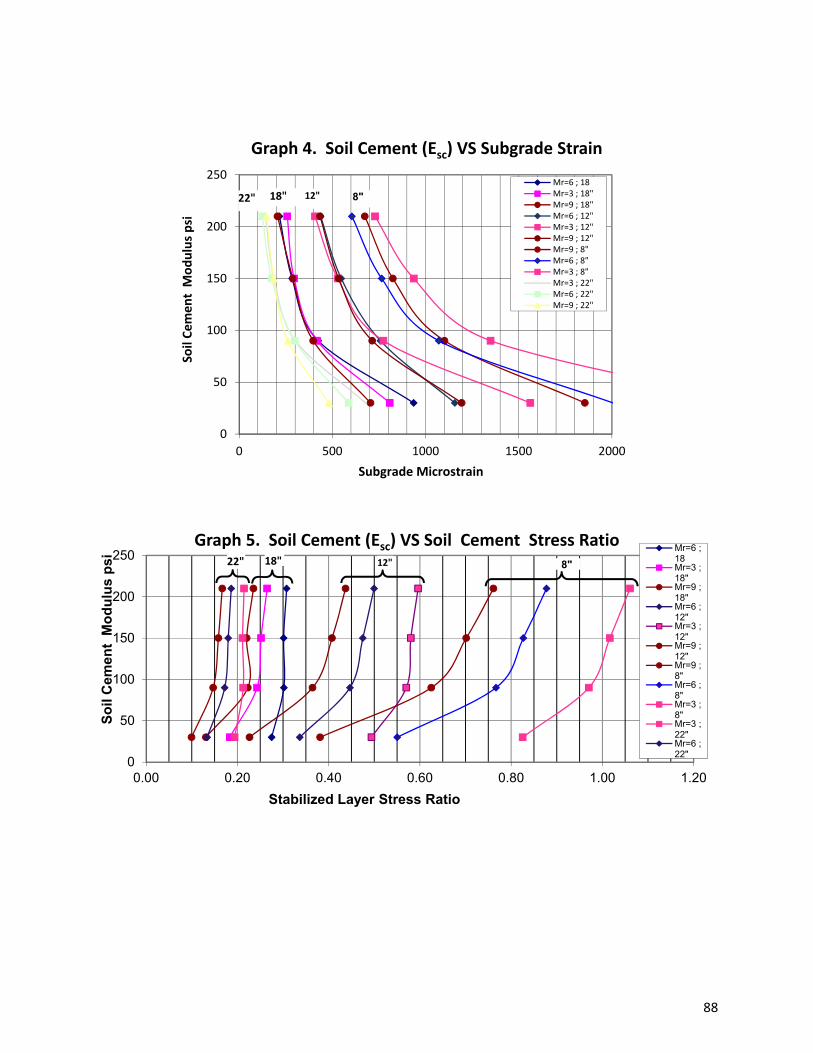
88
0
50
100
150
200
250
0 500 1000 1500 2000
Soil Cement M
odulus psi
Subgrade Microstrain
Graph 4. Soil Cement (Esc) VS Subgrade Strain
Mr=6 ; 18Mr=3 ; 18"Mr=9 ; 18"Mr=6 ; 12"Mr=3 ; 12"Mr=9 ; 12"Mr=9 ; 8"Mr=6 ; 8"Mr=3 ; 8"Mr=3 ; 22"Mr=6 ; 22"Mr=9 ; 22"
8"22" 18" 12"
0
50
100
150
200
250
0.00 0.20 0.40 0.60 0.80 1.00 1.20
So
il C
emen
t M
od
ulu
s p
si
Stabilized Layer Stress Ratio
Graph 5. Soil Cement (Esc) VS Soil Cement Stress RatioMr=6 ;18Mr=3 ;18"Mr=9 ;18"Mr=6 ;12"Mr=3 ;12"Mr=9 ;12"Mr=9 ;8"Mr=6 ;8"Mr=3 ;8"Mr=3 ;22"Mr=6 ;22"
8"22" 18" 12"

89
y = 0.0208e0.0086x
R² = 0.9995
3%
4%
5%
6%
7%
8%
9%
50 70 90 110 130 150 170
Cement %
ESC of Soil Cement , psi x 1000
Graph 6. Soil Cement (ESC) VS Cement Content
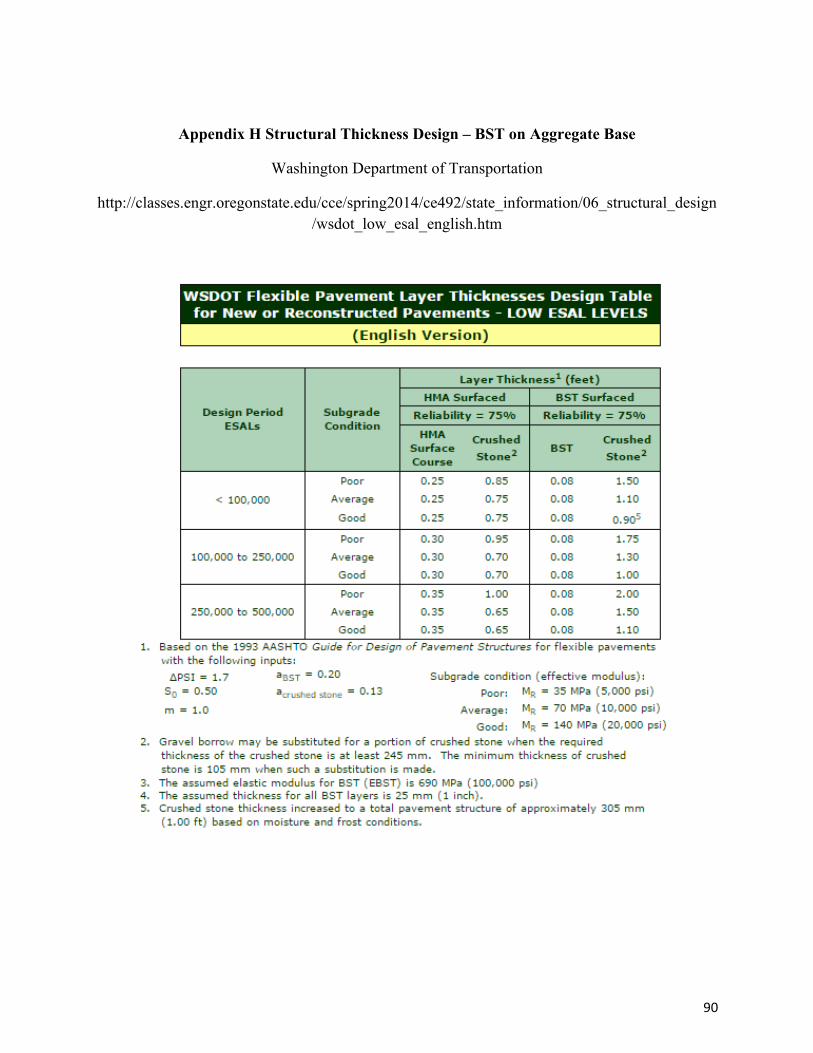
90
Appendix H Structural Thickness Design – BST on Aggregate Base
Washington Department of Transportation
http://classes.engr.oregonstate.edu/cce/spring2014/ce492/state_information/06_structural_design/wsdot_low_esal_english.htm

91
APPENDIX I – 2014 FWD DATA SUMMARY – BST ON SOIL CEMENT

92
(0) (8) (12) (18) (24) (36) (48) (60) d1 d2 d3
Avg 8.6 23.4 19.4 16.5 13.0 10.2 5.8 4.1 2.8 10.0 #DIV/0! #DIV/0! #DIV/0!
Max 8.9 38.2 31.0 25.9 19.8 14.7 8.1 5.6 3.8 15.0 0.0 0.0 0.0
Min 8.1 12.7 11.7 10.8 8.4 6.7 3.2 2.7 1.9 7.1 0.0 0.0 0.0
Std Dev 0.2 6.8 5.0 3.9 2.7 1.9 1.0 0.6 0.4 1.8 #DIV/0! #DIV/0! #DIV/0!
Subgrade Mr based on the average load and deflection shown above: 9.8
15.61 8.8 23.0 18.3 15.5 12.8 10.5 6.3 4.6 3.3 9.3
15.65 8.6 20.6 15.9 13.4 10.4 8.2 4.7 3.6 2.7 11.6
CR: 129W FWD Date: 5‐2014 Structural Section: BST‐SC MP:0.7 to 2.2
Coord‐
inates
LoadDeflection, mils (inches from Load Center) Subgrade
Mr (AASHTO)
GPR Layer Thickness , in.
0
5
10
15
20
25
30
35
40
45
15.5 16 16.5 17 17.5 18Subgrade M
r & M
ax Deflection
West Coordinates
CR 129W, BST‐SC MP 0.7 to 2.2, May 2014
Max Deflection, mils
Subgrade Mr, psi x 1000
(0) (8) (12) (18) (24) (36) (48) (60) d1 d2 d3
Avg 6.0 15.7 12.4 10.3 7.9 6.0 3.4 2.4 1.7 11.9 #DIV/0! #DIV/0! #DIV/0!
Max 6.3 29.7 20.5 17.4 13.6 10.1 5.2 3.9 2.8 16.8 0.0 0.0 0.0
Min 5.6 8.0 6.3 5.6 4.6 3.9 2.6 1.8 1.3 7.2 0.0 0.0 0.0
Std Dev 0.2 6.3 4.2 3.0 1.9 1.3 0.6 0.4 0.3 2.2 #DIV/0! #DIV/0! #DIV/0!
Subgrade Mr based on the average load and deflection shown above: 11.6
15.66 5.9 29.7 19.6 13.9 8.8 6.4 3.3 2.3 1.8 10.9
15.83 6.1 20.6 16.0 11.4 7.5 5.4 2.8 1.8 1.3 13.8
CR: 129W FWD Date: 9‐2014 Structural Section: BST‐SC MP:0.7 to 2.2
Coord‐
inates
LoadDeflection, mils (inches from Load Center) Subgrade
Mr (AASHTO)
GPR Layer Thickness , in.
‐5
5
15
25
35
45
15.5 16 16.5 17 17.5 18
Subgrade M
r & M
ax Deflection
West Coordinates
CR 129W, BST‐SC MP 0.7 to 2.2, Sep 2014
Max Deflection, mils
Subgrade Mr, psi x 1000GPS Malfunction?

93
(0) (8) (12) (18) (24) (36) (48) (60) d1 d2 d3
Avg 8.8 35.5 29.7 25.5 19.9 15.5 8.7 6.0 4.2 7.0 #DIV/0! #DIV/0! #DIV/0!
Max 9.7 60.9 49.3 38.6 30.4 24.0 13.5 9.2 6.3 13.2 0.0 0.0 0.0
Min 7.9 13.5 11.5 10.3 9.0 7.6 4.9 3.5 2.5 4.1 0.0 0.0 0.0
Std Dev 0.4 11.6 8.8 7.0 4.8 3.5 2.0 1.3 0.9 1.8 #DIV/0! #DIV/0! #DIV/0!
Subgrade Mr based on the average load and deflection shown above: 6.7
46.89 9.3 55.3 46.1 38.5 29.4 22.2 10.3 6.7 4.9 5.4
46.73 9.2 49.2 38.5 29.9 20.4 13.1 5.5 3.6 2.6 9.1
46.57 9.7 20.9 17.7 16.1 13.9 11.5 6.5 4.9 3.6 9.6
CR: 143E FWD Date: 5‐2014 Structural Section: BST‐SC MP: 0 to 3.0
Coord‐
inates
LoadDeflection, mils (inches from Load Center) Subgrade
Mr (AASHTO)
GPR Layer Thickness , in.
0.0
10.0
20.0
30.0
40.0
50.0
60.0
70.0
42.5 43 43.5 44 44.5 45 45.5 46 46.5 47 47.5
Subgrade
Mr & M
as Deflection
East Coordinates
CR 143 E, BST‐SC, May 2014Max Deflextion, milsSubgrade Mr psi x 1000
(0) (8) (12) (18) (24) (36) (48) (60) d1 d2 d3
Avg 6.0 24.9 19.7 16.4 12.2 9.0 5.1 3.5 2.5 8.0 #DIV/0! #DIV/0! #DIV/0!
Max 6.6 44.6 33.3 26.5 18.8 13.0 7.4 5.2 3.7 13.0 0.0 0.0 0.0
Min 5.5 9.3 8.3 7.7 6.8 5.4 2.6 2.0 1.4 5.0 0.0 0.0 0.0
Std Dev 0.2 8.2 6.0 4.4 2.8 1.9 1.1 0.7 0.5 1.7 #DIV/0! #DIV/0! #DIV/0!
Subgrade Mr based on the average load and deflection shown above: 7.7
46.9 5.9 44.6 33.2 26.5 18.8 12.7 6.5 4.4 3.2 5.5
46.73 5.9 38.9 27.4 20.2 13.3 8.6 4.2 2.8 1.9 8.5
46.57 6.5 12.9 11.8 10.8 9.5 7.1 4.6 3.0 2.1 10.1
CR: 143E FWD Date: 9‐2014 Structural Section: BST‐SC MP: 0 to 3.0
Coord‐
inates
LoadDeflection, mils (inches from Load Center) Subgrade
Mr (AASHTO)
GPR Layer Thickness , in.
0.0
5.0
10.0
15.0
20.0
25.0
30.0
35.0
40.0
45.0
50.0
43 43.5 44 44.5 45 45.5 46 46.5 47 47.5
Subgrade
Mr & M
as Deflection
East Coordinates
CR 143 E, BST‐SC, Sep 2014Max Deflextion, mils
Subgrade Mr psi x 1000
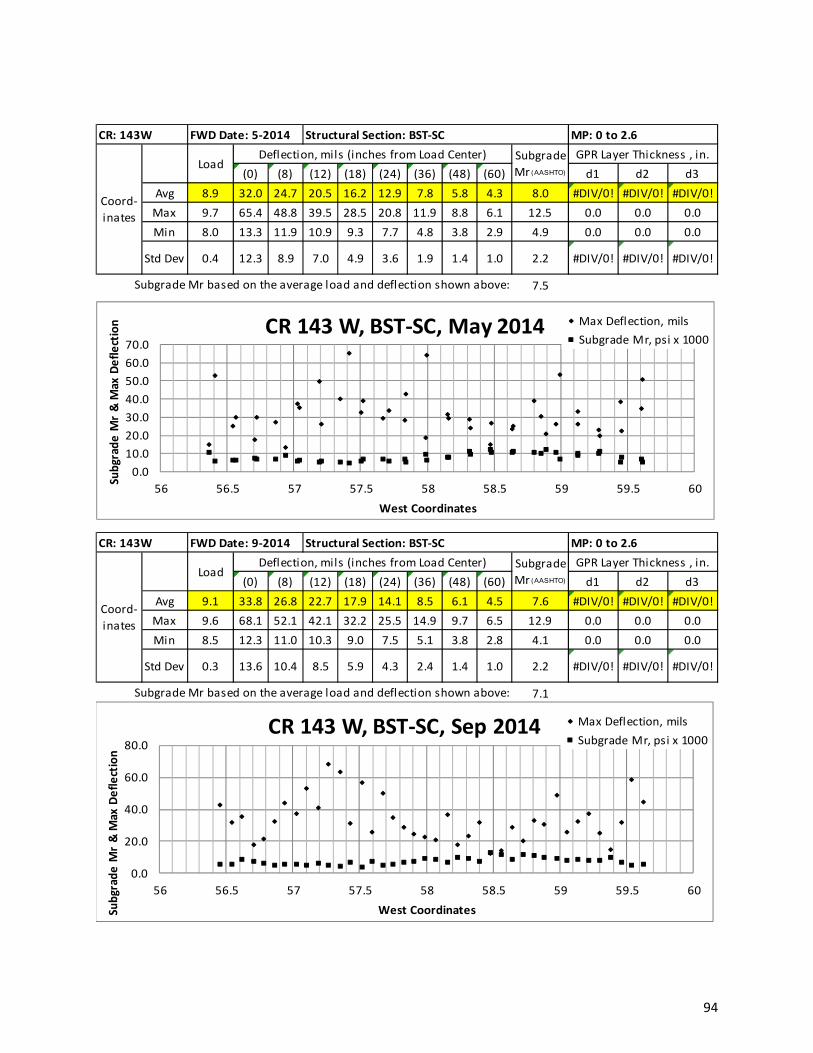
94
(0) (8) (12) (18) (24) (36) (48) (60) d1 d2 d3
Avg 8.9 32.0 24.7 20.5 16.2 12.9 7.8 5.8 4.3 8.0 #DIV/0! #DIV/0! #DIV/0!
Max 9.7 65.4 48.8 39.5 28.5 20.8 11.9 8.8 6.1 12.5 0.0 0.0 0.0
Min 8.0 13.3 11.9 10.9 9.3 7.7 4.8 3.8 2.9 4.9 0.0 0.0 0.0
Std Dev 0.4 12.3 8.9 7.0 4.9 3.6 1.9 1.4 1.0 2.2 #DIV/0! #DIV/0! #DIV/0!
Subgrade Mr based on the average load and deflection shown above: 7.5
56.37 9.1 14.8 12.4 11.3 9.9 8.5 6.0 4.6 3.3 10.8
56.55 8.8 25.3 21.1 18.8 16.5 14.1 9.4 7.2 5.7 6.4
CR: 143W FWD Date: 5‐2014 Structural Section: BST‐SC MP: 0 to 2.6
Coord‐
inates
LoadDeflection, mils (inches from Load Center) Subgrade
Mr (AASHTO)
GPR Layer Thickness , in.
0.0
10.0
20.0
30.0
40.0
50.0
60.0
70.0
56 56.5 57 57.5 58 58.5 59 59.5 60
Subgrade M
r & M
ax Deflection
West Coordinates
CR 143 W, BST‐SC, May 2014 Max Deflection, mils
Subgrade Mr, psi x 1000
(0) (8) (12) (18) (24) (36) (48) (60) d1 d2 d3
Avg 9.1 33.8 26.8 22.7 17.9 14.1 8.5 6.1 4.5 7.6 #DIV/0! #DIV/0! #DIV/0!
Max 9.6 68.1 52.1 42.1 32.2 25.5 14.9 9.7 6.5 12.9 0.0 0.0 0.0
Min 8.5 12.3 11.0 10.3 9.0 7.5 5.1 3.8 2.8 4.1 0.0 0.0 0.0
Std Dev 0.3 13.6 10.4 8.5 5.9 4.3 2.4 1.4 1.0 2.2 #DIV/0! #DIV/0! #DIV/0!
Subgrade Mr based on the average load and deflection shown above: 7.1
56.55 9.0 32.1 26.8 23.8 19.8 16.5 10.9 7.8 6.0 5.7
56.71 9.4 17.7 14.6 13.7 12.2 11.1 8.7 7.0 5.6 7.7
CR: 143W FWD Date: 9‐2014 Structural Section: BST‐SC MP: 0 to 2.6
Coord‐
inates
LoadDeflection, mils (inches from Load Center) Subgrade
Mr (AASHTO)
GPR Layer Thickness , in.
0.0
20.0
40.0
60.0
80.0
56 56.5 57 57.5 58 58.5 59 59.5 60
Subgrade M
r & M
ax Deflection
West Coordinates
CR 143 W, BST‐SC, Sep 2014 Max Deflection, mils
Subgrade Mr, psi x 1000

95
(0) (8) (12) (18) (24) (36) (48) (60) d1 d2 d3
Avg 8.9 24.1 20.7 18.1 14.7 12.0 7.3 5.4 3.9 8.9 #DIV/0! #DIV/0! #DIV/0!
Max 9.4 62.4 48.1 39.6 28.7 21.2 12.3 9.3 6.8 16.4 0.0 0.0 0.0
Min 7.6 7.0 6.7 6.2 5.9 5.2 3.5 3.0 2.3 4.8 0.0 0.0 0.0
Std Dev 0.3 12.8 10.0 8.0 5.5 4.0 2.0 1.5 1.0 2.8 #DIV/0! #DIV/0! #DIV/0!
Subgrade Mr based on the average load and deflection shown above: 8.1
33.63 9.2 17.7 16.9 15.8 14.0 12.3 8.7 6.6 4.9 7.5
33.47 9.1 11.9 9.6 8.3 7.0 5.8 3.8 3.0 2.3 16.0
CR: 146E FWD Date: 5‐2014 Structural Section: BST‐SC MP: 0 to 5.1 (9 to 14.1)
Coord‐
inates
LoadDeflection, mils (inches from Load Center) Subgrade
Mr (AASHTO)
GPR Layer Thickness , in.
0
10
20
30
40
50
60
70
28 29 30 31 32 33 34
Subgrade M
r & M
ax Deflection
West Coordinates
CR 146E BST‐SC, May 2014Max Deflection, mils
(0) (8) (12) (18) (24) (36) (48) (60) d1 d2 d3
Avg 8.9 21.8 18.5 16.2 13.3 10.9 7.1 5.1 3.6 9.8 #DIV/0! #DIV/0! #DIV/0!
Max 9.4 58.1 47.8 39.3 29.6 22.4 12.0 8.8 6.4 20.1 0.0 0.0 0.0
Min 8.4 5.6 5.5 5.2 4.8 4.3 3.2 2.6 1.9 4.8 0.0 0.0 0.0
Std Dev 0.2 10.7 8.3 6.7 4.9 3.7 2.1 1.5 1.1 3.4 #DIV/0! #DIV/0! #DIV/0!
Subgrade Mr based on the average load and deflection shown above: 8.8
33.63 9.4 18.2 16.7 15.6 13.5 11.8 8.4 6.3 4.7 8.0
33.46 9.4 10.0 8.9 8.2 7.0 6.1 4.2 3.1 2.3 15.8
CR: 146E FWD Date: 9‐2014 Structural Section: BST‐SC MP: 0 to 5.1 (9 to 14.1)
Coord‐
inates
LoadDeflection, mils (inches from Load Center) Subgrade
Mr (AASHTO)
GPR Layer Thickness , in.
0
10
20
30
40
50
60
70
28 29 30 31 32 33 34
Subgrade M
r & M
ax Deflection
West Coordinates
CR 146E BST‐SC, Sep 2014Max Deflection, mils
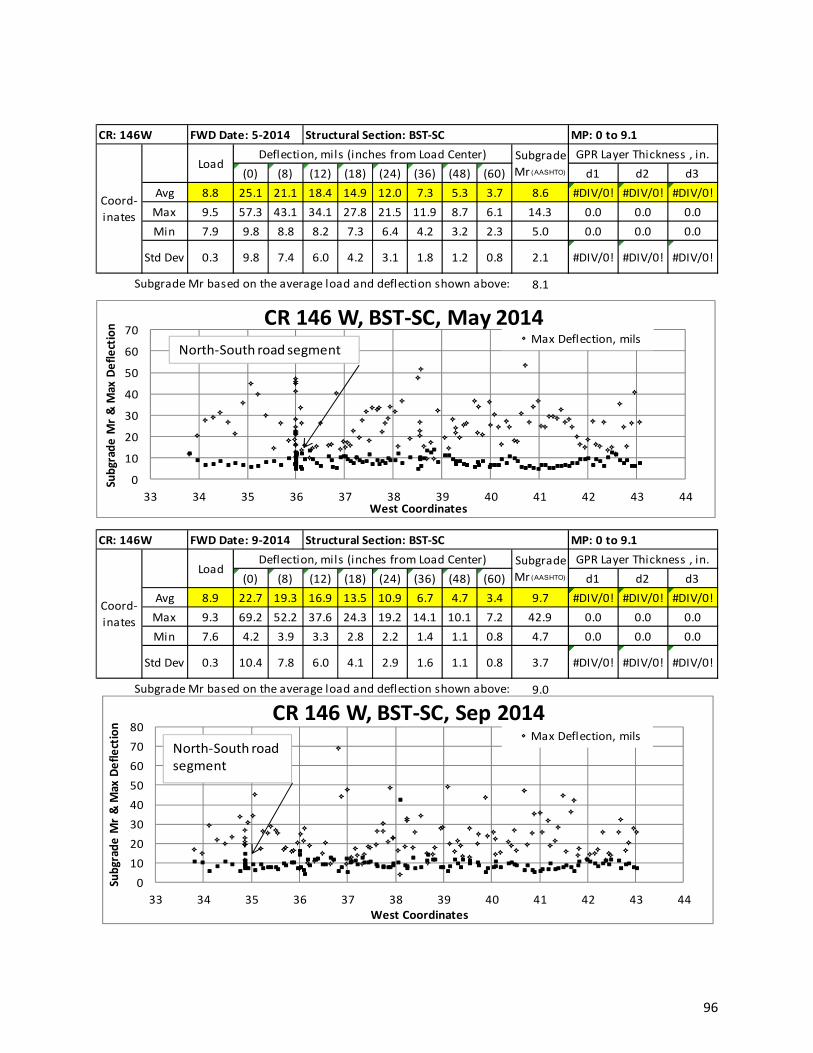
96
(0) (8) (12) (18) (24) (36) (48) (60) d1 d2 d3
Avg 8.8 25.1 21.1 18.4 14.9 12.0 7.3 5.3 3.7 8.6 #DIV/0! #DIV/0! #DIV/0!
Max 9.5 57.3 43.1 34.1 27.8 21.5 11.9 8.7 6.1 14.3 0.0 0.0 0.0
Min 7.9 9.8 8.8 8.2 7.3 6.4 4.2 3.2 2.3 5.0 0.0 0.0 0.0
Std Dev 0.3 9.8 7.4 6.0 4.2 3.1 1.8 1.2 0.8 2.1 #DIV/0! #DIV/0! #DIV/0!
Subgrade Mr based on the average load and deflection shown above: 8.1
42.96 8.8 40.7 35.2 28.5 21.6 16.8 9.2 6.1 4.2 6.3
42.8 9.1 15.7 14.4 13.1 11.4 10.0 7.1 5.5 4.1 9.0
CR: 146W FWD Date: 5‐2014 Structural Section: BST‐SC MP: 0 to 9.1
Coord‐
inates
LoadDeflection, mils (inches from Load Center) Subgrade
Mr (AASHTO)
GPR Layer Thickness , in.
0
10
20
30
40
50
60
70
33 34 35 36 37 38 39 40 41 42 43 44
Subgrade M
r & M
ax Deflection
West Coordinates
CR 146 W, BST‐SC, May 2014Max Deflection, mils
North‐South road segment
(0) (8) (12) (18) (24) (36) (48) (60) d1 d2 d3
Avg 8.9 22.7 19.3 16.9 13.5 10.9 6.7 4.7 3.4 9.7 #DIV/0! #DIV/0! #DIV/0!
Max 9.3 69.2 52.2 37.6 24.3 19.2 14.1 10.1 7.2 42.9 0.0 0.0 0.0
Min 7.6 4.2 3.9 3.3 2.8 2.2 1.4 1.1 0.8 4.7 0.0 0.0 0.0
Std Dev 0.3 10.4 7.8 6.0 4.1 2.9 1.6 1.1 0.8 3.7 #DIV/0! #DIV/0! #DIV/0!
Subgrade Mr based on the average load and deflection shown above: 9.0
42.96 9.1 27.8 23.3 20.2 16.0 12.7 7.5 5.0 3.5 8.3
42.8 9.1 16.4 14.0 12.9 11.0 9.5 6.7 4.9 3.6 9.8
CR: 146W FWD Date: 9‐2014 Structural Section: BST‐SC MP: 0 to 9.1
Coord‐
inates
LoadDeflection, mils (inches from Load Center) Subgrade
Mr (AASHTO)
GPR Layer Thickness , in.
0
10
20
30
40
50
60
70
80
33 34 35 36 37 38 39 40 41 42 43 44
Subgrade M
r & M
ax Deflection
West Coordinates
CR 146 W, BST‐SC, Sep 2014Max Deflection, mils
North‐South road segment

97
(0) (8) (12) (18) (24) (36) (48) (60) d1 d2 d3
Avg 8.9 25.6 21.1 17.8 14.1 11.2 7.2 4.8 3.5 9.2 #DIV/0! #DIV/0! #DIV/0!
Max 9.5 42.2 33.4 27.9 20.9 16.1 10.7 6.9 5.0 14.8 0.0 0.0 0.0
Min 8.4 12.7 10.7 9.5 8.0 6.7 3.9 2.8 1.9 5.9 0.0 0.0 0.0
Std Dev 0.3 9.3 7.1 5.5 3.7 2.5 1.5 0.9 0.7 2.2 #DIV/0! #DIV/0! #DIV/0!
Subgrade Mr based on the average load and deflection shown above: 8.8
0 9.2 14.0 12.1 11.0 9.6 8.2 7.5 4.0 2.9 11.0
0.124 8.9 28.7 24.6 21.0 16.9 13.4 7.2 5.2 3.8 7.8
CR: 201 FWD Date: 5‐2014 Structural Section: BST‐Fabric‐SC MP: 0 to 1.6
Coord‐
inates
LoadDeflection, mils (inches from Load Center) Subgrade
Mr (AASHTO)
GPR Layer Thickness , in.
0.0
10.0
20.0
30.0
40.0
50.0
0 0.2 0.4 0.6 0.8 1 1.2 1.4 1.6 1.8Subgrade M
r & M
ax Deflection
Mile Post
CR 201, BST‐Fabric‐SC, May 2014Max Deflection, mils
Subgrade Mr, psi x 1000
(0) (8) (12) (18) (24) (36) (48) (60) d1 d2 d3
Avg 8.9 25.1 20.3 17.7 13.9 11.0 6.7 4.6 3.3 9.7 #DIV/0! #DIV/0! #DIV/0!
Max 9.3 51.1 36.7 32.0 24.2 18.1 11.0 7.2 4.8 16.7 0.0 0.0 0.0
Min 8.2 9.0 8.1 7.5 6.6 5.7 3.8 2.8 1.9 5.7 0.0 0.0 0.0
Std Dev 0.3 11.0 7.7 6.1 4.3 3.1 1.6 1.0 0.7 2.7 #DIV/0! #DIV/0! #DIV/0!
Subgrade Mr based on the average load and deflection shown above: 9.0
0 9.1 15.1 12.4 11.1 9.1 7.5 5.0 3.5 2.5 13.1
0.125 8.7 29.0 23.2 19.1 14.4 11.0 6.3 4.4 3.3 9.0
CR: 201 FWD Date: 9‐2014 Structural Section: BST‐Fabric‐SC MP: 0 to 1.6
Coord‐
inates
LoadDeflection, mils (inches from Load Center) Subgrade
Mr (AASHTO)
GPR Layer Thickness , in.
0.0
10.0
20.0
30.0
40.0
50.0
60.0
0 0.2 0.4 0.6 0.8 1 1.2 1.4 1.6 1.8Subgrade M
r & M
ax Deflection
Mile Post
CR 201, BST‐Fabric‐SC, Sep 2014
Max Deflection, mils
Subgrade Mr, psi x 1000
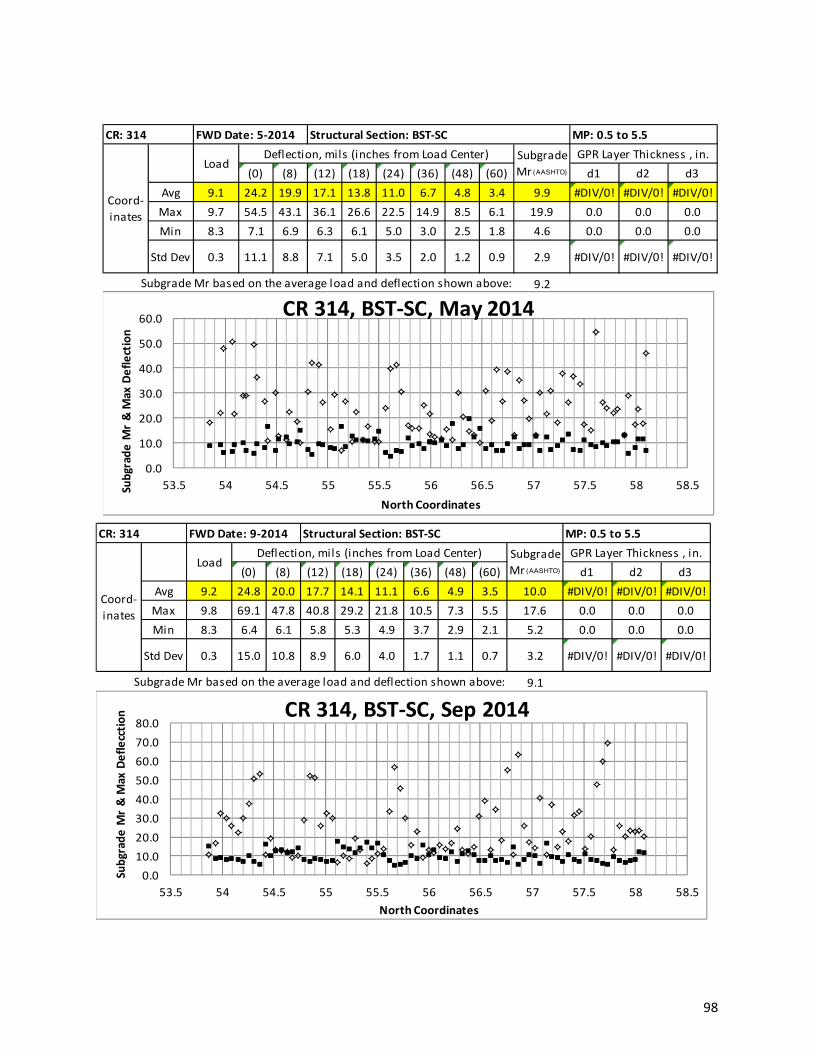
98
(0) (8) (12) (18) (24) (36) (48) (60) d1 d2 d3
Avg 9.1 24.2 19.9 17.1 13.8 11.0 6.7 4.8 3.4 9.9 #DIV/0! #DIV/0! #DIV/0!
Max 9.7 54.5 43.1 36.1 26.6 22.5 14.9 8.5 6.1 19.9 0.0 0.0 0.0
Min 8.3 7.1 6.9 6.3 6.1 5.0 3.0 2.5 1.8 4.6 0.0 0.0 0.0
Std Dev 0.3 11.1 8.8 7.1 5.0 3.5 2.0 1.2 0.9 2.9 #DIV/0! #DIV/0! #DIV/0!
Subgrade Mr based on the average load and deflection shown above: 9.2
53.98 9.1 47.7 41.2 36.1 25.9 18.4 8.5 5.7 3.8 6.4
54.09 9.3 21.6 17.5 14.8 12.7 10.5 6.5 4.4 4.4 9.4
CR: 314 FWD Date: 5‐2014 Structural Section: BST‐SC MP: 0.5 to 5.5
Coord‐
inates
LoadDeflection, mils (inches from Load Center) Subgrade
Mr (AASHTO)
GPR Layer Thickness , in.
0.0
10.0
20.0
30.0
40.0
50.0
60.0
53.5 54 54.5 55 55.5 56 56.5 57 57.5 58 58.5Subgrade M
r & M
ax Deflection
North Coordinates
CR 314, BST‐SC, May 2014
(0) (8) (12) (18) (24) (36) (48) (60) d1 d2 d3
Avg 9.2 24.8 20.0 17.7 14.1 11.1 6.6 4.9 3.5 10.0 #DIV/0! #DIV/0! #DIV/0!
Max 9.8 69.1 47.8 40.8 29.2 21.8 10.5 7.3 5.5 17.6 0.0 0.0 0.0
Min 8.3 6.4 6.1 5.8 5.3 4.9 3.7 2.9 2.1 5.2 0.0 0.0 0.0
Std Dev 0.3 15.0 10.8 8.9 6.0 4.0 1.7 1.1 0.7 3.2 #DIV/0! #DIV/0! #DIV/0!
Subgrade Mr based on the average load and deflection shown above: 9.1
53.87 9.8 10.8 9.0 7.7 6.8 6.1 4.6 3.6 2.8 15.1
53.98 9.2 32.6 25.4 20.3 15.4 11.8 6.5 4.6 3.5 9.0
CR: 314 FWD Date: 9‐2014 Structural Section: BST‐SC MP: 0.5 to 5.5
Coord‐
inates
LoadDeflection, mils (inches from Load Center) Subgrade
Mr (AASHTO)
GPR Layer Thickness , in.
0.0
10.0
20.0
30.0
40.0
50.0
60.0
70.0
80.0
53.5 54 54.5 55 55.5 56 56.5 57 57.5 58 58.5
Subgrade M
r & M
ax Deflecction
North Coordinates
CR 314, BST‐SC, Sep 2014

99
(0) (8) (12) (18) (24) (36) (48) (60) d1 d2 d3
Avg 9.0 34.0 28.0 23.9 18.5 14.3 8.1 5.7 4.1 7.6 #DIV/0! #DIV/0! #DIV/0!
Max 9.9 74.2 55.4 41.7 29.3 21.6 12.2 8.6 6.3 12.4 0.0 0.0 0.0
Min 7.7 14.5 13.2 12.1 10.4 8.9 4.5 3.3 2.4 4.5 0.0 0.0 0.0
Std Dev 0.5 13.7 9.8 7.4 4.7 3.1 1.6 1.1 0.8 1.8 #DIV/0! #DIV/0! #DIV/0!
Subgrade Mr based on the average load and deflection shown above: 7.2
55.1 8.5 65.4 50.8 40.1 29.3 21.6 12.2 8.6 6.3 4.5
55.21 8.5 65.4 50.8 40.1 29.3 21.6 12.2 8.6 6.3 4.5
CR: 321 N FWD Date: 5‐2014 Structural Section: BST‐Fabric‐SC MP: 3.5 to 6.9
Coord‐
inates
LoadDeflection, mils (inches from Load Center) Subgrade
Mr (AASHTO)
GPR Layer Thickness , in.
0
10
20
30
40
50
60
70
80
55 55.5 56 56.5 57 57.5 58
Subgrade M
r & M
ax Deflection
North Coordinates
CR 321 N, BST‐Fabric‐SC, May 2014
Max Deflection, mils
(0) (8) (12) (18) (24) (36) (48) (60) d1 d2 d3
Avg 6.0 23.3 18.5 15.4 11.5 8.5 4.9 3.5 2.5 8.3 #DIV/0! #DIV/0! #DIV/0!
Max 6.6 62.9 45.1 34.9 22.2 13.3 8.9 6.1 4.4 14.2 0.0 0.0 0.0
Min 4.9 7.1 6.5 6.1 5.3 4.4 2.9 2.2 1.6 4.9 0.0 0.0 0.0
Std Dev 0.4 11.5 7.8 5.6 3.4 2.1 1.2 0.7 0.5 2.0 #DIV/0! #DIV/0! #DIV/0!
Subgrade Mr based on the average load and deflection shown above: 7.9
55.24 6.0 35.0 26.8 20.6 14.6 10.4 5.7 4.0 3.1 6.5
55.35 5.6 62.9 45.1 34.9 22.2 13.3 6.3 4.1 3.5 4.9
CR: 321 N FWD Date: 9‐2014 Structural Section: BST‐Fabric‐SC MP: 3.5 to 6.9
Coord‐
inates
LoadDeflection, mils (inches from Load Center) Subgrade
Mr (AASHTO)
GPR Layer Thickness , in.
0
10
20
30
40
50
60
70
55 55.5 56 56.5 57 57.5 58
Subgrade M
r & M
ax Deflection
North Coordinates
CR 321 N, BST‐Fabric‐SC, Sep 2014
Max Deflection, milsSubrade Mr, psi x 1000

100
(0) (8) (12) (18) (24) (36) (48) (60) d1 d2 d3
Avg 8.6 33.9 27.3 23.0 17.7 13.7 7.7 5.7 4.2 7.6 #DIV/0! #DIV/0! #DIV/0!
Max 9.4 86.6 73.4 53.2 32.8 24.5 12.1 8.5 6.1 12.9 0.0 0.0 0.0
Min 7.1 13.1 12.1 11.1 9.6 7.8 3.8 3.1 2.2 4.2 0.0 0.0 0.0
Std Dev 0.5 19.0 13.3 10.0 5.9 3.8 1.9 1.3 0.9 2.2 #DIV/0! #DIV/0! #DIV/0!
Subgrade Mr based on the average load and deflection shown above: 7.1
0.124 8.9 36.7 31.0 26.1 19.2 14.7 7.9 5.6 3.9 7.2
0.249 8.8 37.8 29.6 24.4 19.0 14.9 8.4 6.4 4.9 6.6
LoadDeflection, mils (inches from Load Center) Subgrade
Mr (AASHTO)
GPR Layer Thickness , in.
CR: 324 FWD Date: 5‐2014 Structural Section: BST‐SC MP: 0 to 3
Coord‐
inates
0
20
40
60
80
100
0 0.5 1 1.5 2 2.5 3
Subgrade M
r & M
ax Deflection
Mile Post
CR 324, BST‐SC May 2014
Max Deflection, mils
Subgrade Mr, psi x 1000
Area to be rebuilt Aug 2014
(0) (8) (12) (18) (24) (36) (48) (60) d1 d2 d3
Avg 7.5 21.3 16.9 14.6 11.2 8.8 5.5 3.9 2.9 9.8 ##### ##### #####
Max 9.3 62.4 43.7 31.0 18.6 14.1 9.3 7.4 5.6 16.2 0.0 0.0 0.0
Min 5.3 7.5 6.7 6.2 5.1 3.8 2.4 2.0 1.5 6.4 0.0 0.0 0.0
Std
Dev1.6 11.7 7.8 5.8 3.9 2.8 1.8 1.2 1.0 2.7 ##### ##### #####
Subgrade Mr based on the average load and deflection shown above: 9.2
0.124 9.2 27.8 24.1 21.3 16.5 12.8 7.7 5.2 3.7 8.1
0.249 9.3 24.1 20.5 17.6 13.9 11.2 7.1 5.4 4.3 8.6
CR: 324 FWD Date: 9‐2014 Structural Section: BST‐SC MP: 0.54 to 0.73
Coord‐
inates
LoadDeflection, mils (inches from Load Center)
Subgr
ade
Mr
GPR Layer Thickness
in
0
10
20
30
40
50
60
70
0 0.5 1 1.5 2 2.5 3
Subgrade Mr & M
ax Deflection
Mile Post
CR 324, BST‐SC, Sep 2014
Max Deflection, milsArea rebuilt Aug 2014

101
APPENDIX J – 2014 FWD DATA SUMMARY – BST AND HMA ON AGGREGATE ON SOIL CEMENT
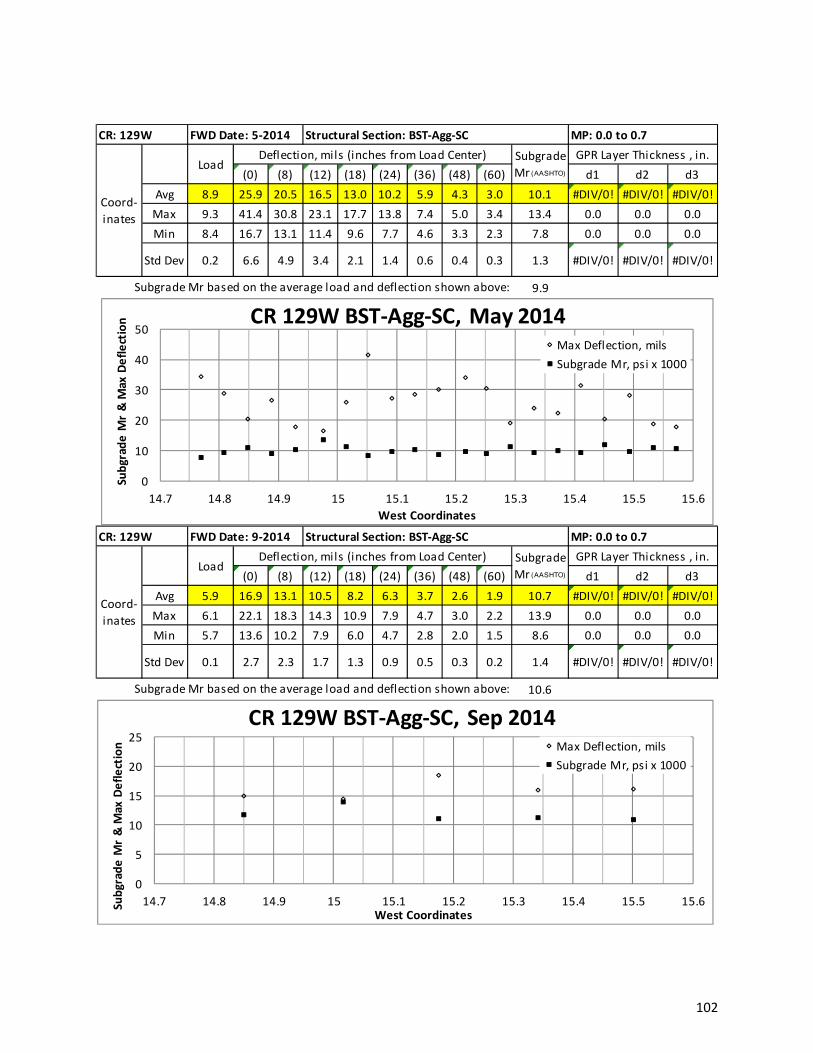
102
(0) (8) (12) (18) (24) (36) (48) (60) d1 d2 d3
Avg 8.9 25.9 20.5 16.5 13.0 10.2 5.9 4.3 3.0 10.1 #DIV/0! #DIV/0! #DIV/0!
Max 9.3 41.4 30.8 23.1 17.7 13.8 7.4 5.0 3.4 13.4 0.0 0.0 0.0
Min 8.4 16.7 13.1 11.4 9.6 7.7 4.6 3.3 2.3 7.8 0.0 0.0 0.0
Std Dev 0.2 6.6 4.9 3.4 2.1 1.4 0.6 0.4 0.3 1.3 #DIV/0! #DIV/0! #DIV/0!
Subgrade Mr based on the average load and deflection shown above: 9.9
14.77 8.8 34.4 28.5 22.9 17.7 13.8 7.4 5.0 3.3 7.8
14.81 9.0 29.0 22.2 18.2 14.0 11.0 6.3 4.6 3.3 9.3
CR: 129W FWD Date: 5‐2014 Structural Section: BST‐Agg‐SC MP: 0.0 to 0.7
Coord‐
inates
LoadDeflection, mils (inches from Load Center) Subgrade
Mr (AASHTO)
GPR Layer Thickness , in.
0
10
20
30
40
50
14.7 14.8 14.9 15 15.1 15.2 15.3 15.4 15.5 15.6
Subgrade M
r & M
ax Deflection
West Coordinates
CR 129W BST‐Agg‐SC, May 2014Max Deflection, mils
Subgrade Mr, psi x 1000
(0) (8) (12) (18) (24) (36) (48) (60) d1 d2 d3
Avg 5.9 16.9 13.1 10.5 8.2 6.3 3.7 2.6 1.9 10.7 #DIV/0! #DIV/0! #DIV/0!
Max 6.1 22.1 18.3 14.3 10.9 7.9 4.7 3.0 2.2 13.9 0.0 0.0 0.0
Min 5.7 13.6 10.2 7.9 6.0 4.7 2.8 2.0 1.5 8.6 0.0 0.0 0.0
Std Dev 0.1 2.7 2.3 1.7 1.3 0.9 0.5 0.3 0.2 1.4 #DIV/0! #DIV/0! #DIV/0!
Subgrade Mr based on the average load and deflection shown above: 10.6
14.85 5.8 15.0 11.2 9.0 7.1 5.6 3.4 2.4 1.7 11.7
15.02 5.9 14.5 10.2 7.9 6.0 4.7 2.8 2.0 1.5 13.9
CR: 129W FWD Date: 9‐2014 Structural Section: BST‐Agg‐SC MP: 0.0 to 0.7
Coord‐
inates
LoadDeflection, mils (inches from Load Center) Subgrade
Mr (AASHTO)
GPR Layer Thickness , in.
0
5
10
15
20
25
14.7 14.8 14.9 15 15.1 15.2 15.3 15.4 15.5 15.6Subgrade M
r & M
ax Deflection
West Coordinates
CR 129W BST‐Agg‐SC, Sep 2014Max Deflection, mils
Subgrade Mr, psi x 1000

103
(0) (8) (12) (18) (24) (36) (48) (60) d1 d2 d3
Avg 9.1 17.5 13.0 10.5 8.9 7.4 4.4 3.5 2.5 14.4 #DIV/0! #DIV/0! #DIV/0!
Max 9.5 40.7 24.9 18.9 15.0 11.8 8.0 6.3 4.8 21.1 0.0 0.0 0.0
Min 8.8 8.4 6.2 5.3 4.8 4.3 2.9 2.4 1.8 7.9 0.0 0.0 0.0
Std Dev 0.2 8.1 5.5 4.3 3.1 2.4 1.3 0.9 0.7 3.7 #DIV/0! #DIV/0! #DIV/0!
Subgrade Mr based on the average load and deflection shown above: 13.4
41.31 8.9 49.7 38.4 30.0 21.4 15.6 8.6 6.3 4.9 6.4
41.28 9.0 48.2 39.4 29.8 21.1 15.6 8.2 6.0 4.6 6.7
MP: 0 to 1.0
Coord‐
inates
LoadDeflection, mils (inches from Load Center) Subgrade
Mr (AASHTO)
GPR Layer Thickness , in.
CR: 348 Sid Cir FWD Date: 5‐2014 Structural Section: BST‐Agg‐SC
0
10
20
30
40
50
40.4 40.5 40.6 40.7 40.8 40.9 41 41.1 41.2 41.3
Subgrade M
r & M
ax Deflection
North Coordinates
CR 348 Sid Cir, BST‐Agg‐SC, May 2014
Max Deflections, mils
Subgrade Mr, psi x 1000
(0) (8) (12) (18) (24) (36) (48) (60) d1 d2 d3
Avg 6.0 10.1 7.3 5.8 4.7 3.9 2.6 2.1 1.6 16.3 #DIV/0! #DIV/0! #DIV/0!
Max 6.2 37.0 27.0 18.4 10.4 6.4 4.1 3.3 2.8 20.7 0.0 0.0 0.0
Min 5.4 5.7 4.2 3.7 3.3 3.0 2.0 1.6 1.2 7.9 0.0 0.0 0.0
Std Dev 0.2 8.3 6.0 3.9 1.9 1.0 0.6 0.5 0.4 3.7 #DIV/0! #DIV/0! #DIV/0!
Subgrade Mr based on the average load and deflection shown above: 15.4
= 5.9 20.7 15.7 12.6 9.4 7.0 3.7 2.6 1.9 10.0
= 6.1 11.9 8.8 7.1 5.7 4.7 2.8 2.1 1.5 14.4
CR: 348 Sid Cir FWD Date: 9‐2014 Structural Section: BST‐Agg‐SC MP: 0 to 1.0
Coord‐
inates
LoadDeflection, mils (inches from Load Center) Subgrade
Mr (AASHTO)
GPR Layer Thickness , in.
0
10
20
30
40
40.4 40.5 40.6 40.7 40.8 40.9 41 41.1 41.2 41.3Subgrade M
r & M
ax Deflection
North Coordinates
CR 348 Sid Cir, BST‐Agg‐SC, Sep 2014Max Deflection, mils
Subgrade Mr, psi x 1000

104
(0) (8) (12) (18) (24) (36) (48) (60) d1 d2 d3
Avg 8.8 16.5 12.8 10.8 9.4 7.9 5.1 4.1 3.1 12.1 #DIV/0! #DIV/0! #DIV/0!
Max 9.4 39.8 27.4 20.0 15.0 12.2 8.1 6.3 4.7 26.6 0.0 0.0 0.0
Min 8.1 7.1 5.1 4.4 4.2 3.4 2.1 1.9 1.4 7.6 0.0 0.0 0.0
Std Dev 0.3 5.6 4.1 3.2 2.4 2.0 1.3 0.9 0.7 3.5 #DIV/0! #DIV/0! #DIV/0!
Subgrade Mr based on the average load and deflection shown above: 11.4
0.436 8.7 17.4 13.3 11.0 9.4 8.0 5.5 4.3 3.3 10.9
0.499 8.7 17.8 14.6 12.5 10.1 7.5 4.1 3.2 2.4 12.9
MP: 0.4 to 2.6
Coord‐
inates
LoadDeflection, mils (inches from Load Center) Subgrade
Mr (AASHTO)
GPR Layer Thickness , in.
CR: 350 Rau Sch FWD Date: 5‐2014 Structural Section: BST‐Agg‐SC
0
10
20
30
40
50
60
0.0 0.5 1.0 1.5 2.0 2.5 3.0
Subgrade M
r & M
ax Deflection
Mile Post
CR 350 Rau Sch, BST‐Agg‐SC, May 2014Max Deflection, mils
Subgrade Mr, psi x 1000
(0) (8) (12) (18) (24) (36) (48) (60) d1 d2 d3
Avg 8.8 14.6 11.4 9.4 8.0 6.6 4.5 3.6 2.7 14.0 #DIV/0! #DIV/0! #DIV/0!
Max 9.2 52.2 31.8 19.6 15.2 12.9 6.9 5.3 4.0 24.4 0.0 0.0 0.0
Min 7.9 7.4 5.5 4.5 4.3 3.7 2.6 2.1 1.4 7.5 0.0 0.0 0.0
Std Dev 0.3 7.7 4.9 3.2 2.3 1.9 1.1 0.8 0.6 3.8 #DIV/0! #DIV/0! #DIV/0!
Subgrade Mr based on the average load and deflection shown above: 13.1
0.497 8.8 10.0 8.6 7.7 6.7 5.5 3.4 2.7 2.1 16.8
0.621 8.8 21.2 16.5 13.0 10.5 8.4 5.3 4.1 3.2 10.9
CR: 350 Rau Sch FWD Date: 9‐2014 Structural Section: BST‐Agg‐SC MP: 0.4 to 2.6
Coord‐
inates
LoadDeflection, mils (inches from Load Center) Subgrade
Mr (AASHTO)
GPR Layer Thickness , in.
0
10
20
30
40
50
60
0.0 0.5 1.0 1.5 2.0 2.5 3.0
Subgrace M
r & M
ax Deflection
Mile Post
CR 350 Rau Sch, BST‐Agg‐SC, Sep 2014
Max Deflection, mils
Subgrade Mr, psi x 1000

105
(0) (8) (12) (18) (24) (36) (48) (60) d1 d2 d3
Avg 9.1 9.6 7.6 6.4 5.5 4.9 3.8 3.4 2.8 16.4 #DIV/0! #DIV/0! #DIV/0!
Max 9.5 12.0 10.0 9.1 8.2 7.3 5.2 4.3 3.4 19.7 0.0 0.0 0.0
Min 8.8 7.3 5.8 4.9 4.4 3.8 2.9 2.7 2.3 11.5 0.0 0.0 0.0
Std Dev 0.3 1.4 1.4 1.4 1.3 1.1 0.7 0.5 0.4 2.7 #DIV/0! #DIV/0! #DIV/0!
Subgrade Mr based on the average load and deflection shown above: 16.0
40.1 9.1 12.0 9.8 7.7 6.0 4.8 3.7 3.3 2.7 16.1
40.05 9.0 9.9 6.9 5.3 4.6 4.1 3.5 3.1 2.6 17.7
CR: 350 Rau Sch FWD Date: 5‐2014 Structural Section: HMA‐Agg‐SC MP: 0.0 to 0.4
Coord‐
inates
LoadDeflection, mils (inches from Load Center) Subgrade
Mr (AASHTO)
GPR Layer Thickness , in.
0
5
10
15
20
25
30
39.85 39.9 39.95 40 40.05 40.1Subgrade M
r & M
ax Deflection
North Coordinates
CR 350 Rau Sch, HMA‐Agg SC, May 2014Max Deflection, mils
Subgrade Mr, psi x 1000
(0) (8) (12) (18) (24) (36) (48) (60) d1 d2 d3
Avg 9.0 7.1 5.4 4.6 4.1 3.7 3.1 2.7 2.2 21.2 #DIV/0! #DIV/0! #DIV/0!
Max 9.2 8.9 7.4 6.6 6.1 5.6 4.3 3.6 2.8 27.7 0.0 0.0 0.0
Min 8.9 6.3 4.4 3.5 3.1 2.6 2.2 2.0 1.6 14.5 0.0 0.0 0.0
Std Dev 0.1 0.9 1.1 1.2 1.2 1.1 0.8 0.6 0.4 4.8 #DIV/0! #DIV/0! #DIV/0!
Subgrade Mr based on the average load and deflection shown above: 20.3
40.05 9.2 6.5 4.4 3.5 3.1 2.9 2.6 2.3 2.0 24.5
40.05 9.1 6.3 4.6 3.7 3.2 2.6 2.2 2.0 1.6 27.7
CR: 350 Rau Sch FWD Date: 9‐2014 Structural Section: HMA‐Agg‐SC MP: 0.0 to 0.4
Coord‐
inates
LoadDeflection, mils (inches from Load Center) Subgrade
Mr (AASHTO)
GPR Layer Thickness , in.
0
5
10
15
20
25
30
39.85 39.9 39.95 40 40.05 40.1
Subgrade M
r & M
ax Deflection
North Coordinates
CR 350 Rau Sch, HMA‐Agg SC, Sep 2014Max Deflection, mils
Subgrade Mr, psi x 1000

106
APPENDIX K – 2014 FWD DATA SUMMARY – BST ON AGGREGATE ON GEOTEXTILE
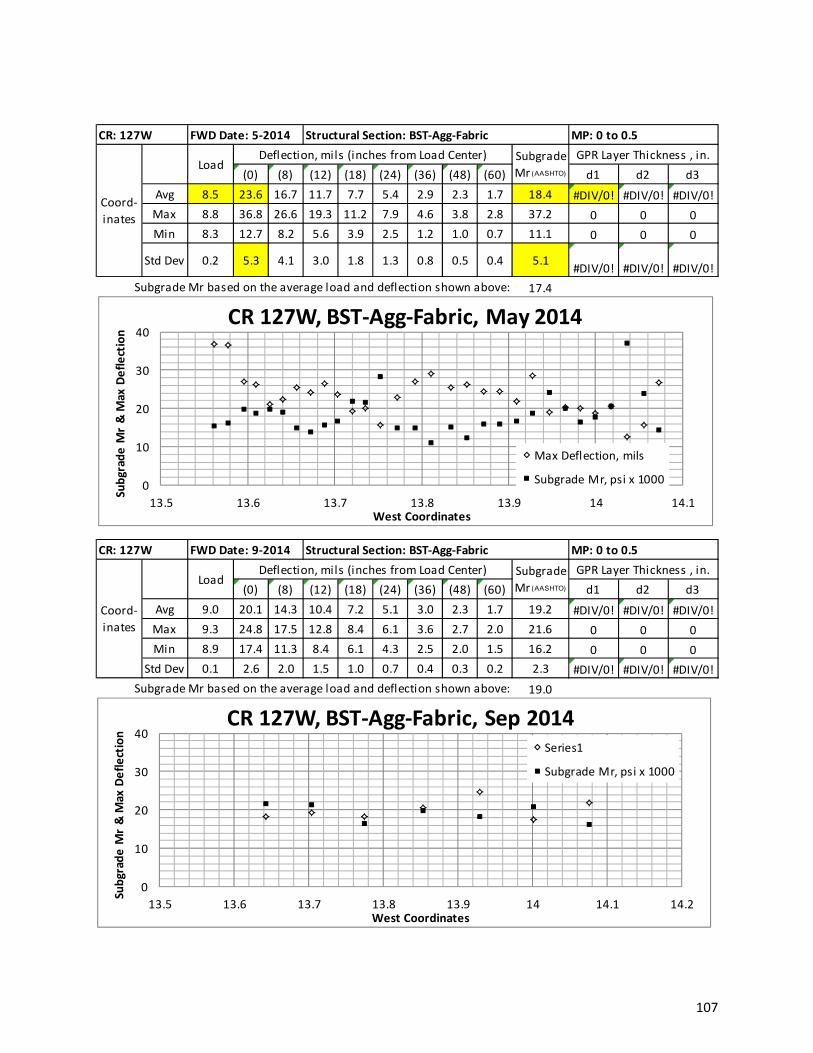
107
(0) (8) (12) (18) (24) (36) (48) (60) d1 d2 d3
Avg 8.5 23.6 16.7 11.7 7.7 5.4 2.9 2.3 1.7 18.4 #DIV/0! #DIV/0! #DIV/0!
Max 8.8 36.8 26.6 19.3 11.2 7.9 4.6 3.8 2.8 37.2 0 0 0
Min 8.3 12.7 8.2 5.6 3.9 2.5 1.2 1.0 0.7 11.1 0 0 0
Std Dev 0.2 5.3 4.1 3.0 1.8 1.3 0.8 0.5 0.4 5.1#DIV/0! #DIV/0! #DIV/0!
Subgrade Mr based on the average load and deflection shown above: 17.4
13.56 8.7 36.8 26.6 19.3 11.2 7.1 2.9 2.2 1.6 15.3
13.58 8.7 36.5 25.5 17.8 10.2 6.5 2.7 2.2 1.7 16.2
CR: 127W FWD Date: 5‐2014 Structural Section: BST‐Agg‐Fabric MP: 0 to 0.5
Coord‐
inates
LoadDeflection, mils (inches from Load Center) Subgrade
Mr (AASHTO)
GPR Layer Thickness , in.
0
10
20
30
40
13.5 13.6 13.7 13.8 13.9 14 14.1
Subgrade M
r & M
ax Deflection
West Coordinates
CR 127W, BST‐Agg‐Fabric, May 2014
Max Deflection, mils
Subgrade Mr, psi x 1000
(0) (8) (12) (18) (24) (36) (48) (60) d1 d2 d3
Avg 9.0 20.1 14.3 10.4 7.2 5.1 3.0 2.3 1.7 19.2 #DIV/0! #DIV/0! #DIV/0!
Max 9.3 24.8 17.5 12.8 8.4 6.1 3.6 2.7 2.0 21.6 0 0 0
Min 8.9 17.4 11.3 8.4 6.1 4.3 2.5 2.0 1.5 16.2 0 0 0
Std Dev 0.1 2.6 2.0 1.5 1.0 0.7 0.4 0.3 0.2 2.3 #DIV/0! #DIV/0! #DIV/0!
Subgrade Mr based on the average load and deflection shown above: 19.0
13.64 8.9 18.2 12.8 9.2 6.4 4.3 2.5 2.0 1.5 21.6
13.78 9.1 18.2 14.0 10.8 8.0 6.1 3.6 2.7 1.9 16.5
CR: 127W FWD Date: 9‐2014 Structural Section: BST‐Agg‐Fabric MP: 0 to 0.5
Coord‐
inates
LoadDeflection, mils (inches from Load Center) Subgrade
Mr (AASHTO)
GPR Layer Thickness , in.
0
10
20
30
40
13.5 13.6 13.7 13.8 13.9 14 14.1 14.2
Subgrade M
r & M
ax Deflection
West Coordinates
CR 127W, BST‐Agg‐Fabric, Sep 2014Series1
Subgrade Mr, psi x 1000

108
(0) (8) (12) (18) (24) (36) (48) (60) d1 d2 d3
Avg 8.7 60.9 37.2 28.7 22.7 14.9 7.3 5.5 4.4 7.3 #DIV/0! #DIV/0! #DIV/0!
Max 9.6 80.5 54.0 40.6 36.0 21.9 10.1 7.5 5.8 10.1 0 0 0
Min 7.9 42.6 16.4 16.5 14.0 9.1 4.4 3.5 3.1 4.6 0 0 0
Std Dev 0.6 13.1 13.6 9.2 8.1 5.0 2.4 1.6 1.1 2.3#DIV/0! #DIV/0! #DIV/0!
Subgrade Mr based on the average load and deflection shown above: 6.7
53.57 9.0 56.3 33.6 31.0 21.2 14.3 7.5 5.5 4.6 7.0
53.66 8.5 80.5 16.4 16.5 36.0 21.9 10.1 7.5 5.8 4.6
CR: 314 FWD Date: 5‐2014 Structural Section: BST‐Agg‐Fabric MP: 0.0 to 0.5
Coord‐
inates
LoadDeflection, mils (inches from Load Center) Subgrade
Mr (AASHTO)
GPR Layer Thickness , in.
0.0
20.0
40.0
60.0
80.0
100.0
53.5 53.55 53.6 53.65 53.7 53.75 53.8
Subgrade M
r & M
ax Deflection
North Coordinates
CR 315, BST‐Agg‐Fabric, May 2014
Max Deflection, mils
Subgrade Mr, psi x 1000
(0) (8) (12) (18) (24) (36) (48) (60) d1 d2 d3
Avg 8.8 49.3 36.8 26.9 17.2 11.5 5.9 4.4 3.5 9.2 #DIV/0! #DIV/0! #DIV/0!
Max 9.1 72.4 51.5 35.9 23.0 15.7 8.4 5.9 4.6 13.3 0 0 0
Min 8.1 29.7 23.0 17.1 11.5 7.7 3.4 3.1 2.3 6.5 0 0 0
Std Dev 0.3 14.0 10.3 6.8 4.0 2.9 1.7 1.0 0.8 2.6 #DIV/0! #DIV/0! #DIV/0!
Subgrade Mr based on the average load and deflection shown above: 8.6
53.57 9.0 39.4 31.0 24.3 16.8 11.9 6.7 5.1 3.9 8.3
53.66 8.9 61.3 49.0 35.9 23.0 15.7 8.4 5.9 4.6 6.5
CR: 314 FWD Date: 9‐2014 Structural Section: BST‐Agg‐Fabric MP: 0.0 to 0.5
Coord‐
inates
LoadDeflection, mils (inches from Load Center) Subgrade
Mr (AASHTO)
GPR Layer Thickness , in.
0.0
10.0
20.0
30.0
40.0
50.0
60.0
70.0
80.0
53.5 53.55 53.6 53.65 53.7 53.75 53.8 53.85
Subgrade M
r & M
ax Deflection
North Coordinates
CR 315, BST‐Agg‐Fabric, Sep 2014Max Deflection, mils
Subgrade Mr, psi x 1000

109
(0) (8) (12) (18) (24) (36) (48) (60) d1 d2 d3
Avg 8.4 62.9 44.2 35.1 22.4 15.1 7.6 5.8 4.7 6.5 #DIV/0! #DIV/0! #DIV/0!
Max 9.5 82.9 65.0 48.8 32.3 21.9 10.5 8.6 6.8 10.9 0 0 0
Min 7.5 35.5 3.8 19.5 12.9 9.0 5.1 3.9 2.9 4.0 0 0 0
Std Dev 0.6 13.1 12.8 6.9 4.1 2.7 1.3 0.9 0.8 1.3#DIV/0! #DIV/0! #DIV/0!
Subgrade Mr based on the average load and deflection shown above: 6.3
52.17 9.0 65.2 54.3 39.2 26.3 18.3 9.6 6.8 5.1 5.7
52.28 9.0 68.9 53.4 40.7 25.7 17.1 7.4 6.3 4.8 6.2
CR: 321N FWD Date: 5‐2014 Structural Section: BST‐Agg‐Fabric MP: 0 to 3.4
Coord‐
inates
LoadDeflection, mils (inches from Load Center) Subgrade
Mr (AASHTO)
GPR Layer Thickness , in.
0
20
40
60
80
100
52 52.5 53 53.5 54 54.5 55 55.5Subgarde M
r & M
ax Deflection
North Coordinates
CR 321 N, MP 0 to 3.4, BST‐Agg‐Fabric, May 2014
Max Deflection, mils Subgrade Mr, psi x 1000
(0) (8) (12) (18) (24) (36) (48) (60) d1 d2 d3
Avg 6.8 39.0 27.8 22.2 14.5 9.7 5.5 4.2 3.3 7.9 #DIV/0! #DIV/0! #DIV/0!
Max 9.2 79.5 55.2 43.5 27.1 15.8 9.3 7.2 5.4 13.3 0 0 0
Min 4.9 0.0 3.5 9.9 6.3 4.3 2.5 1.9 1.4 4.9 0 0 0
Std Dev 1.5 14.3 9.0 7.7 5.0 3.0 1.7 1.3 1.1 1.8#DIV/0! #DIV/0! #DIV/0!
Subgrade Mr based on the average load and deflection shown above: 7.6
52.17 8.7 56.4 43.4 35.8 23.6 15.5 8.8 6.1 4.6 6.2
52.28 9.0 48.1 37.0 27.8 18.5 12.2 6.6 4.7 3.6 8.3
CR: 321N FWD Date: 9‐2014 Structural Section: BST‐Agg‐Fabric MP: 0 to 3.4
Coord‐
inates
LoadDeflection, mils (inches from Load Center) Subgrade
Mr (AASHTO)
GPR Layer Thickness , in.
0
20
40
60
80
100
52 52.5 53 53.5 54 54.5 55 55.5
Subgarde M
r & M
ax Deflection
North Coordinates
CR 321 N, MP 0 to 3.4, BST‐Agg‐Fabric, Sep 2014Max Deflection, mils Subgrade Mr, psi x 1000
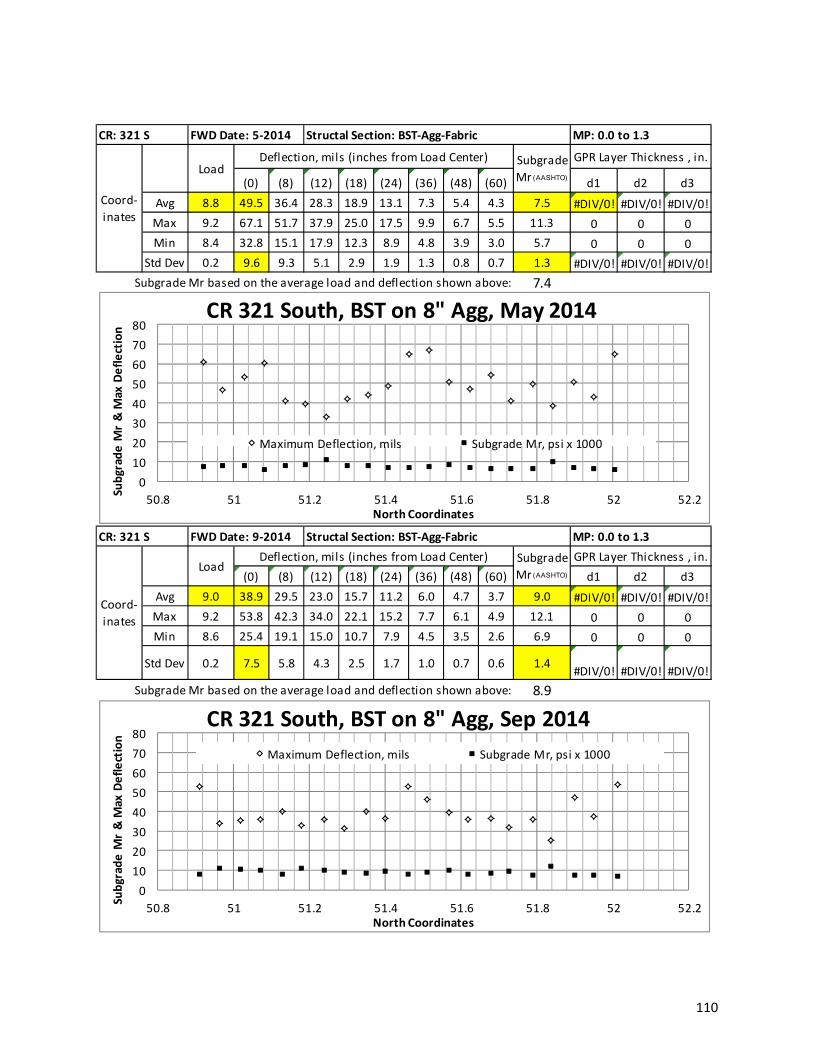
110
(0) (8) (12) (18) (24) (36) (48) (60) d1 d2 d3
Avg 8.8 49.5 36.4 28.3 18.9 13.1 7.3 5.4 4.3 7.5 #DIV/0! #DIV/0! #DIV/0!
Max 9.2 67.1 51.7 37.9 25.0 17.5 9.9 6.7 5.5 11.3 0 0 0
Min 8.4 32.8 15.1 17.9 12.3 8.9 4.8 3.9 3.0 5.7 0 0 0
Std Dev 0.2 9.6 9.3 5.1 2.9 1.9 1.3 0.8 0.7 1.3 #DIV/0! #DIV/0! #DIV/0!
Subgrade Mr based on the average load and deflection shown above: 7.4
51.95 8.9 43.2 34.9 27.2 20.0 14.8 8.9 5.9 4.7 6.7
51.84 9.1 38.3 28.1 20.1 13.4 9.2 5.8 4.3 3.5 10.1
CR: 321 S Structal Section: BST‐Agg‐Fabric
Load
MP: 0.0 to 1.3
Coord‐
inates
FWD Date: 5‐2014
Deflection, mils (inches from Load Center) Subgrade
Mr (AASHTO)
GPR Layer Thickness , in.
0
10
20
30
40
50
60
70
80
50.8 51 51.2 51.4 51.6 51.8 52 52.2
Subgrade M
r & M
ax Deflection
North Coordinates
CR 321 South, BST on 8" Agg, May 2014
Maximum Deflection, mils Subgrade Mr, psi x 1000
(0) (8) (12) (18) (24) (36) (48) (60) d1 d2 d3
Avg 9.0 38.9 29.5 23.0 15.7 11.2 6.0 4.7 3.7 9.0 #DIV/0! #DIV/0! #DIV/0!
Max 9.2 53.8 42.3 34.0 22.1 15.2 7.7 6.1 4.9 12.1 0 0 0
Min 8.6 25.4 19.1 15.0 10.7 7.9 4.5 3.5 2.6 6.9 0 0 0
Std Dev 0.2 7.5 5.8 4.3 2.5 1.7 1.0 0.7 0.6 1.4#DIV/0! #DIV/0! #DIV/0!
Subgrade Mr based on the average load and deflection shown above: 8.9
51.95 8.9 37.4 30.6 25.3 18.4 13.6 7.4 5.4 4.1 7.5
51.84 9.2 25.4 19.1 15.0 10.7 7.9 4.6 3.8 3.0 12.1
CR: 321 S FWD Date: 9‐2014 Structal Section: BST‐Agg‐Fabric MP: 0.0 to 1.3
Coord‐
inates
LoadDeflection, mils (inches from Load Center) Subgrade
Mr (AASHTO)
GPR Layer Thickness , in.
0
10
20
30
40
50
60
70
80
50.8 51 51.2 51.4 51.6 51.8 52 52.2
Subgrade M
r & M
ax Deflection
North Coordinates
CR 321 South, BST on 8" Agg, Sep 2014
Maximum Deflection, mils Subgrade Mr, psi x 1000

111
(0) (8) (12) (18) (24) (36) (48) (60) d1 d2 d3
Avg 6.1 43.6 32.4 24.3 15.5 10.5 5.4 4.0 3.3 6.8 #DIV/0! #DIV/0! #DIV/0!
Max 6.5 66.5 53.5 39.0 24.3 15.5 8.4 5.7 4.8 8.3 0 0 0
Min 5.3 25.8 20.2 15.7 11.4 7.6 3.7 3.0 2.4 4.1 0 0 0
Std Dev 0.3 12.3 10.8 6.8 3.8 2.4 1.3 0.8 0.7 1.3#DIV/0! #DIV/0! #DIV/0!
Subgrade Mr based on the average load and deflection shown above: 6.6
52.17 6.5 66.5 53.5 39.0 24.3 15.5 8.4 5.7 4.5 4.7
52.27 6.5 50.1 38.8 27.8 17.5 11.4 5.5 4.0 3.6 6.5
CR: 326 FWD Date: 5‐2014 Structural Section: BST‐Agg‐Fabric MP: 0 to 1.0
Coord‐
inates
LoadDeflection, mils (inches from Load Center) Subgrade
Mr (AASHTO)
GPR Layer Thickness , in.
0
10
20
30
40
50
60
70
80
52 52.1 52.2 52.3 52.4 52.5 52.6 52.7 52.8 52.9 53Subgrade M
r & M
ax Deflection
North Coordinates
CR 326, BST‐Agg‐Fabric, May 2014
Max Deflection, mils
Subgrade Mr, psi x 1000
(0) (8) (12) (18) (24) (36) (48) (60) d1 d2 d3
Avg 8.9 55.2 38.1 30.7 19.9 13.1 6.8 5.0 4.0 7.9 #DIV/0! #DIV/0! #DIV/0!
Max 9.3 75.8 60.1 42.4 27.4 18.4 9.4 7.0 5.8 10.2 0 0 0
Min 8.5 39.1 18.2 22.9 14.8 9.3 5.3 3.8 3.1 5.2 0 0 0
Std Dev 0.2 10.8 10.6 6.1 3.8 2.7 1.2 0.9 0.7 1.4#DIV/0! #DIV/0! #DIV/0!
Subgrade Mr based on the average load and deflection shown above: 7.7
52.17 8.9 63.7 43.6 33.2 19.7 12.3 5.4 3.8 3.4 8.6
52.39 8.5 75.8 60.1 42.4 27.4 18.4 9.4 7.0 5.8 5.2
CR: 326 FWD Date: 9‐2014 Structural Section: BST‐Agg‐Fabric MP: 0 to 1.0
Coord‐
inates
LoadDeflection, mils (inches from Load Center) Subgrade
Mr (AASHTO)
GPR Layer Thickness , in.
0
10
20
30
40
50
60
70
80
52.1 52.2 52.3 52.4 52.5 52.6 52.7 52.8 52.9 53Subgrade M
r & M
ax Deflection
North Coordinates
CR 326, BST‐Agg‐Fabric, Sep 2014Max Deflection, mils
Subgrade Mr, psi x 1000

112
APPENDIX L– ROADWAY MATERIALS TESTING, SOILS
Subgrade Soil Testing for Stabilization Mix Designs
Bank Run Clay Test Results
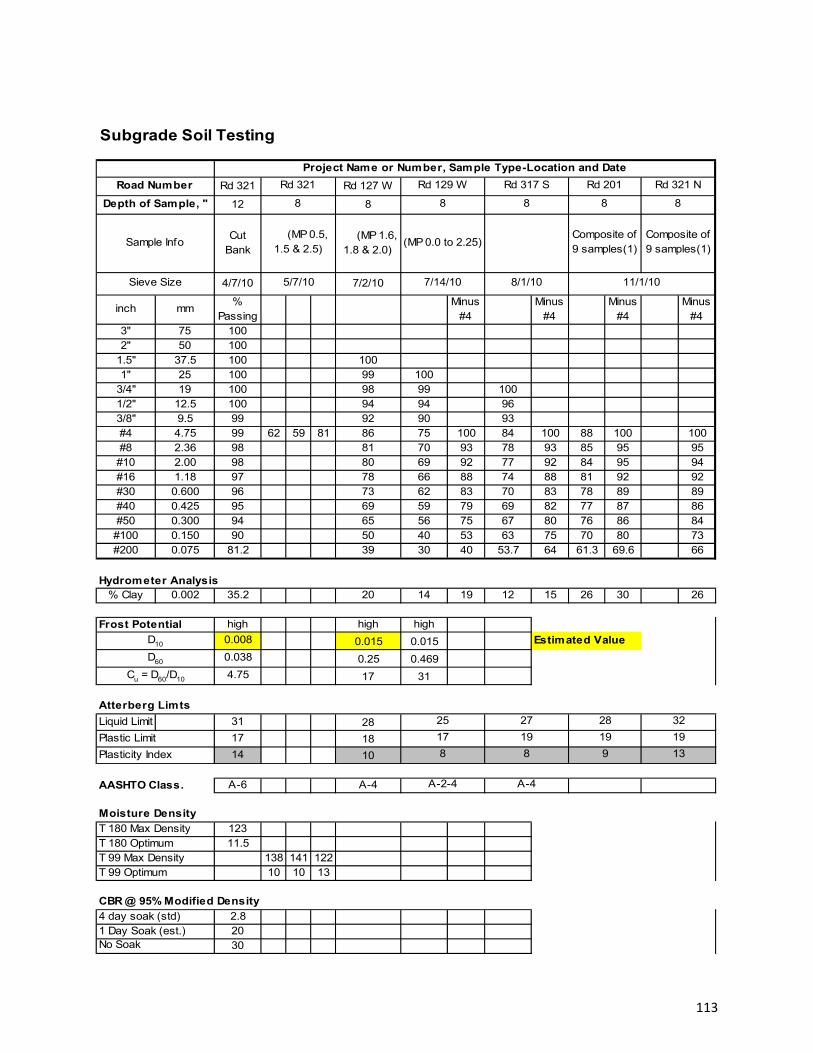
113
Subgrade Soil Testing
Rd 321 Rd 127 W
12 8
Cut Bank
(MP 1.6, 1.8 & 2.0)
4/7/10 7/2/10
inch mm%
PassingMinus
#4Minus
#4Minus
#4Minus
#43" 75 1002" 50 100
1.5" 37.5 100 1001" 25 100 99 100
3/4" 19 100 98 99 1001/2" 12.5 100 94 94 963/8" 9.5 99 92 90 93#4 4.75 99 62 59 81 86 75 100 84 100 88 100 100#8 2.36 98 81 70 93 78 93 85 95 95#10 2.00 98 80 69 92 77 92 84 95 94#16 1.18 97 78 66 88 74 88 81 92 92#30 0.600 96 73 62 83 70 83 78 89 89#40 0.425 95 69 59 79 69 82 77 87 86#50 0.300 94 65 56 75 67 80 76 86 84#100 0.150 90 50 40 53 63 75 70 80 73#200 0.075 81.2 39 30 40 53.7 64 61.3 69.6 66
Hydrometer Analysis% Clay 0.002 35.2 20 14 19 12 15 26 30 26
Frost Potential high high high
0.008 0.015 0.015 Estimated Value
0.038 0.25 0.469
4.75 17 31
Liquid Limit 31 28
Plastic Limit 17 18
Plasticity Index 14 10
AASHTO Class. A-6 A-4
T 180 Max Density 123T 180 Optimum 11.5T 99 Max Density 138 141 122T 99 Optimum 10 10 13
4 day soak (std) 2.81 Day Soak (est.) 20
30
19
13
25
17
8
A-2-4
28
19
9
27
A-4
19
8
Rd 321 N
Composite of 9 samples(1)
8/1/10
32
Cu = D60/D10
Rd 321
(MP 0.0 to 2.25)
Rd 129 W
Composite of 9 samples(1)
Rd 201
7/14/10
Rd 317 S
5/7/10
(MP 0.5, 1.5 & 2.5)
Sieve Size
No Soak
Moisture Density
Atterberg Limts
CBR @ 95% Modified Density
D10
D60
8
Sample Info
Depth of Sample, "
Road Number
8888
Project Name or Number, Sample Type-Location and Date
11/1/10
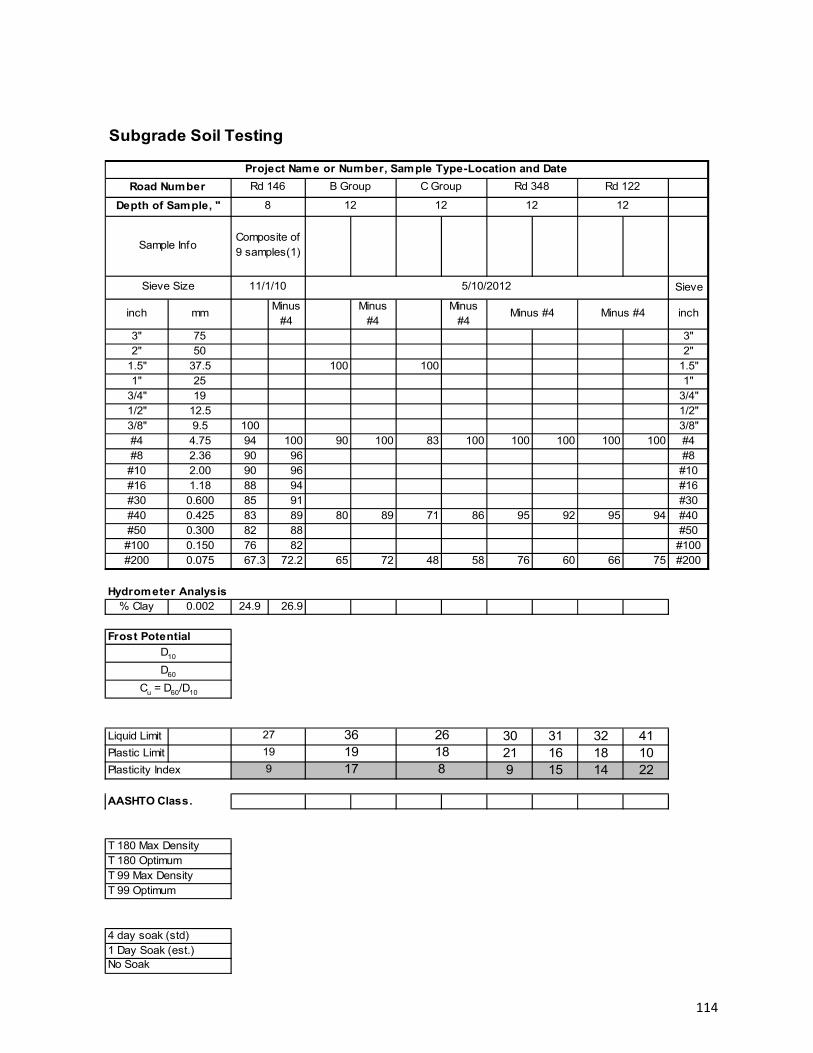
114
Subgrade Soil Testing
Sieve
inch mmMinus
#4Minus
#4Minus
#4inch
3" 75 3"2" 50 2"
1.5" 37.5 100 100 1.5"1" 25 1"
3/4" 19 3/4"1/2" 12.5 1/2"3/8" 9.5 100 3/8"#4 4.75 94 100 90 100 83 100 100 100 100 100 #4#8 2.36 90 96 #8#10 2.00 90 96 #10#16 1.18 88 94 #16#30 0.600 85 91 #30#40 0.425 83 89 80 89 71 86 95 92 95 94 #40#50 0.300 82 88 #50#100 0.150 76 82 #100#200 0.075 67.3 72.2 65 72 48 58 76 60 66 75 #200
Hydrometer Analysis% Clay 0.002 24.9 26.9
Frost Potential
Liquid Limit 30 31 32 41Plastic Limit 21 16 18 10Plasticity Index 9 15 14 22
AASHTO Class.
T 180 Max DensityT 180 Optimum T 99 Max DensityT 99 Optimum
4 day soak (std)1 Day Soak (est.)
5/10/2012
27
19
9
Rd 146
Composite of 9 samples(1)
D10
8
Rd 348
1212
Rd 122
26
C GroupB Group
Minus #4 Minus #4
D60
Cu = D60/D10
No Soak
188
361917
Project Name or Number, Sample Type-Location and Date
Sieve Size 11/1/10
Road Number
Depth of Sample, "
Sample Info
12 12

115
6/12/10 Test Data
Rd 321 Cut Bank
Albin Pit
Clay
Johnson Pit North
Clay4/7/10 Blends P200 PI Clay
inch mm Clay 12 18 1 %P 40 %P 200 %P 2003" 75 Crush 88 42 6.9 12 18.9 12" 50 32 5.3 9 14.3 1
1.5" 37.5 Clay 14 19 21" 25 Crush 86
3/4" 191/2" 12.5 100 Clay 9 15 NP3/8" 9.5 99 Crush 91#4 4.75 99#8 2.36 98 Clay 7 13 NP#10 2.00 98 Crush 93#16 1.18 97 100 100#30 0.600 96 99 99 Clay 5 11 NP#40 0.425 95 99 99 Crush 95#50 0.300 94 99 99
#100 0.150 90 98 98 NP - Non-plastic#200 0.075 81.2 97.7 96.8
Hydrometer Analysis% Clay 35.2 31 31
Liquid Limit 31 32 39Plastic Limit 17 20 19Plasticity Index 14 12 20
T 180 Max Density 123T 180 Optimum 11.5
4 day soak (std) 2.81 Day Soak (Est.) 20
30
Location of Sample & Date
Adding 12% Albin clay to the Albin aggregate sampled on 4/7/10 will result in a low CBR that will rut when wet. Greater than expected amounts of Albin Clay were needed to get PI since the %P40 in the gradation is so high.
6/2/2010
Bank-Run Clay Borrow Source Testing
Albin Gravel & Bank-Run Clay Blends
All values are estimates based on reducing the P40 during crushing from 42 to 32
Albin Pit Gravel (4/7/10) and Albin Pit Clay (6/2/10)
Estimate of Albin Clay needed to achieve Pi in Albin Pit Gravel
Gravel Gradation Total %P 200
PI
No Soak
Sieve Size
CBR @ 95% Modified Density
Type of Test
Gradation
Moisture Density
Atterberg Limits
% Passing

116
APPENDIX M – ROAWAY MATERIALS TESTING , AGGREGATE
Crushed Gravel Gradations 2010
Crushed Chips 2010
Gravel with Scoria Fines and Chloride Additive Test Results
Gravel with Bentonite Clay and Chloride Additive Mix Designs

117
Crushed Gravel 2010
Prevost Nevins Albin PrewittCandee Otta Seal "Chips"
mm .45 Pwr Min Max 4/7/10 5/21/10 4/7/10 4/7/10 4/7/10 8/16/1019 3.762 97 100 3/4" 100 100 100 98 100 96 1009.5 2.754 67 83 3/8 78 84 71 77 75 70 784.75 2.016 48 68 #4 58 57 45 58 57 47 531.18 1.077 25 42 #16 45 39 26 38 46 30 40
0.425 0.680 17 30 #40 41 33 16 32 42 25 280.074 0.310 12 18 #200 9.1 6.6 9.0 18.5 6.9 7.9 5.3
% Clay ~ 2.1 3.2 6.7 ? 1.9% 1 FF 54 46 62 73 ? 52 65% 2 FF 44 42 40 61 ? 16
PI np np 2 np np np np
Sieve SizeGood Grad
LimitsSieve Size
Johnson Pit
#200 Limits when non-plastic minus #40
0
10
20
30
40
50
60
70
80
90
100
0.01 0.1 1 10 100
Pe
rce
nt P
assi
ng
Sieve Size
Gravel Gradation Plot
Johnson 4/7/10
Johnson 5/21/10
Nevins 4/7/10
Lower Spec Limit
Upper Spec Limit
Otta Seal 2011
0
10
20
30
40
50
60
70
80
90
100
0.000 0.500 1.000 1.500 2.000 2.500 3.000 3.500 4.000
Pe
rce
nt P
assi
ng
Sieve Size in mm Raised to 0.45 Power
Gradation Plot to 0.45 Power
Johnson 4/7/10
Johnson 5/21/10
Nevins 4/7/10
Prevost 4/7/10
Albin 4/7/2010"

118
Crushed Chips 2010
Sieve Size
Johnson Pit Chips
(1)
Glendive Chips
Prwitt 1" minus Gravel
(1)
Candee Otta Seal "Chips"
8/22/10 10/7/2010 10/6/20103/4" 100 100 98 1001/2" 87 80 843/8" 51 36 73 78#4 5 2 49 53
#30 27 30#200 0.4 0.7 7.5 5.3
ID T 72 95 na% 1 FF 65% 2 FF
(1) This aggregate never used for chip sealing

119
Gravel with Scoria Fines and Chloride Additive Test Data 70% Retention Desired
Rutting likely when CBR<40
Gravel Source Johnson Pit 5/8" Reject
Johnson Pit 5/8" Reject
Johnson Pit 5/8" Reject
Johnson Pit 5/8" Reject
Johnson Pit 5/8" Reject
Lab No. 11‐1289 11‐1289 12‐1007 12‐1007 12‐1007
Date November 2011 November 2011 February 2012 February 2012 February 2012
% Additive 1 none 1.5% CaCl2 1.3% CaCl2 1.3% CaCl2 1.5% CaCl2
% Additive 2
15% Foss Scoria 15% Weathered Foss Scoria
10% Weathered Foss Scoria
%P 3/4" 100 100 100 100 100
%P #4 63 63 67 69 67
%P #40 47 47 47 49 49
%P #200 5.3 5.3 9.5 11.4 9.7
%P 0.002 mm
% 1 FF 11 11
%P 2 FF
Plasticity Index Non‐plastic Non‐plastic Non‐plastic
CBR at 95% 25 20 40 21 25
% Retention n/a 30 59 79 62
Scoria Source
Foss Pit Reject Foss Reject after
pulverization
Foss Reject after
pulverization & freeze‐thaw
Lab No. 12‐1008 12‐1008 12‐1008
Date February 2012 February 2012 February 2012
%P#4 85 98 98
%P#40 42 56 57
%P#200 28 39 41
% Clay
Liquid Limit
Plastic Limit
Plasticity Index Non Plastic

120
Gravel with Scoria and Chloride Additive Fines Test Data
Gravel Source Johnson Pit Johnson Pit Johnson Pit Johnson Pit Prewitt Pit Prewitt Pit
Lab No. 10‐1113 10‐1113 13‐1059 13‐1059 10‐1371 12‐1078
Date May 2010 May 2010 May 2013 May 2013 August 2010 June 2012
% Additive 1 none 1.5% CaCl2 1.5 CaCl2 1.5% CaCl2 1.5% CaCl2 1.5% CaCl2
% Additive 2 5% Enid Reject
Scoria
10% Enid Reject
Scoria
10% Enid Reject
Scoria
%P 3/4" 100 100 95 96 96 97
%P #4 56 56 53 55 47 59
%P #40 32 32 41 42 25 34
%P #200 6.5 6.5 6.9 9.1 7.9 12.7
%P 0.002 mm 2.1 2.1 1.9
% 1 FF 46 46 47 47 52
%P 2 FF 42 42 16
Plasticity Index Non‐Plastic Non‐Plastic Non‐Plastic Non‐Plastic Non‐Plastic
CBR at 95% 62 57 40 42 57 49
% Retention n/a 33 35 53 43 64
Scoria Source
Enid Reject
(from Johnson
Pit stockpile)
Enid Reject
Lab No. 13‐1060 12‐1074/75
Date May 2013 May 2012
%P#4 91 94
%P#40 72 75
%P#200 50 55
% Clay
Liquid Limit
Plastic Limit
Plasticity Index Non Plastic
70% Retention Desired
Rutting likely when CBR<40

121
Gravel-Clay-Chloride Mix Design Summary and Plots
% MD CBR Ret93.1 31 095.3 66 098.5 84 0
% MD CBR Ret92.8 40 2495.0 70 5697.2 93 72
1.5% CaCl2 & 3.25% Bentonite% MD CBR Ret91.1 26 2395.3 47 9098.3 70 111
% MD CBR Ret93.5 26 095.2 36 097.2 62 0
1.5% CaCl2 % MD CBR Ret91.7 21 0.5697.1 68 0.798.4 96 0.82
Pre
vost
Nev
ins
No Additives
1.5% CaCl2
No Additives
0
10
20
30
40
50
60
70
80
90
100
90.0 95.0 100.0
CB
R,
%
% T 180 Compaction
Nevins Chloride Mix Design
No Additives
1.5% CaCl2
% Retained Calcium
.82%
.70%
.56%
.65%
Rutting Threshold for Hvy Truck Traffic
0
10
20
30
40
50
60
70
80
90
100
90.0 95.0 100.0
CB
R,
%
% T 180 Compaction
Prevost Clay-Chloride Mix Design
No Additives
1.5% CaCl2
1.5% CaCl2, 3.25% Bentonite
% Retained Calcium
.23%
.88%
1.11%
.72%
.56%
.24%
Rutting Threshold for Hvy Truck Traffic

122
Gravel-Clay-Chloride Mix Design Summary and Plots
No Additives% MD CBR Ret94.5 57 095.9 73 096.9 89 0
1.5% CaCl2% MD CBR Ret94.6 70 0.4998.9 108 0.61
1.5% CaCl2 & 3.5% Bentonite% MD CBR Ret95.0 51 0.7596.6 76 0.86
% MD CBR Ret
% MD CBR Ret93.6 41 0.694.9 55 0.6596.4 109 0.74
% MD CBR Ret93.5 35 0.9296.4 58 1.197.6 60 1.24
Joh
nso
n P
it 5
-21-
10
1.5% CaCl2 & 3.5% Bentonite
1.5% CaCl2
No Additives
Pre
wit
Pit
8-2
6-10
% Retained Calcium
.??%
.??%
.??%
.??%
0
10
20
30
40
50
60
70
80
90
100
90.0 95.0 100.0
CB
R, %
% T 180 Compaction
Johnson Pit 5-21-10 Clay-Chloride Mix Design
No Additives
1.5% CaCl2
1.5% CaCl2, 3.5% BentoniteRutting Threshold
for Hvy Truck
% Retained Calcium
.75%
.86%
.61%
.49%
% Retained Calcium
.??%
.??%
.??%
.??%
0
10
20
30
40
50
60
70
80
90
100
90.0 95.0 100.0
CB
R, %
% T 180 Compaction
Prewit Pit Clay-Chloride Mix Design (8/26/10 Sample)
1.5% CaCl2
1.5% CaCl2, 3.5% BentoniteRutting Threshold for
% Retained Calcium
1.01%
.74%
.65%

123
Gravel-Clay-Chloride Mix Design Summary and Plots
% MD CBR Ret0
95.0 25 00
% MD CBR Ret
95.0 20 0.3
1.5% CaCl2 & 3.0% Bentonite% MD CBR Ret
95.0 35 0.55
% MD CBR Ret
95.0 40 0.59
1.3% CaCl2 & 15% Scoria Reject
1.5% CaCl2
Joh
nso
n P
it 5
/8"
Rej
ect
2/20
12
No Additives
0
10
20
30
40
50
60
70
80
90
100
90.0 95.0 100.0
CB
R, %
Johnson Pit 5/8" Clay/Reject Scoria Chloride Mix Design
No Additives
1.5% CaCl2
1.5% CaCl2, 3% Bentonite
1.3% CaCl2, 15% Scoria Reject
Rutting Threshold for Hvy Truck
% Retained Calcium
.55%
.30% 0.0%
.59%
124
APPENDIX N – ROADWAY MATERIALS TESTING, SOIL CEMENT
2010-2012 Richland County Soil Cement Mix Design Summary
2012 Field Unconfined Compression Strength (UCS) Summary
2012 Moisture Density Field Test Data
2012 24 Hour Water and Portland Cement Quality Field Tests

125
3 141
5 199
7 236
3 152
5 228
7 233
5 284
7 375
9 403
5 171
7 232
9 343
5 275
7 322
9 372
5 292
7 305
9 386
5 306
7 416
9 453
Vacuum
Saturation
No s tandard
conditioning done
due to lack of time
2010 ‐ 2012 Richland County Soil Cement Mix Design Summary
25
54
30
9/13/2010
8/18/2010
19
17
PIOpt
Moist
Max
Densit
y
Vacuum
Saturation
2010
317
129
117.5
Standard 4
hour soak
27
Vacuum
Saturation
Standard 4
hour soak
12
14 123.5
13.0
10.9
8
8
Post Cure
Conditioning
%
Cement
7 Day
Unconfined
Strength
Build
YearRoad
Mix
Design
Date
% Pass
#200LL PL
% Pass
0.002
mm
114.5350, etc
(Group C)
140, 147,
480, 314,
etc
(Group B)2012
2011
5/10/2012
5/10/2012
2830703/8/2011
201, 331,
143, 324,
146
115.513.5919
3665
Standard 4
hour soak
Standard 4
hour soak
Standard 4
hour soak109.416.61719
48 26 18 8 14.1

126
0
50
100
150
200
250
300
350
400
450
500
2 3 4 5 6 7 8 9
Unconfined Compression (psi)
Cement Content,
Rd 129 (2010)
4 Hour Soak
Vacuum Saturation
0
50
100
150
200
250
300
350
400
450
500
2 3 4 5 6 7 8 9
Unconfined Compression (psi)
Cement Content,
Rd 317 (2010)
Vacuum Saturation
0
50
100
150
200
250
300
350
400
450
500
2 3 4 5 6 7 8 9
Unconfined Compression (psi)
Cement Content,
Rd 314, 143W, 480,122,348, 123, 350S,351S, 350N (2012)
Group B ~ 4 Hour Soak
Group C ~ 4 Hour Soak
0
50
100
150
200
250
300
350
400
450
500
2 3 4 5 6 7 8 9
Unconfined Compression (psi)
Cement Content,
Rd 201, 321, 143E, 324, 146 (2011)
4 Hour Soak
Vacuum Saturation
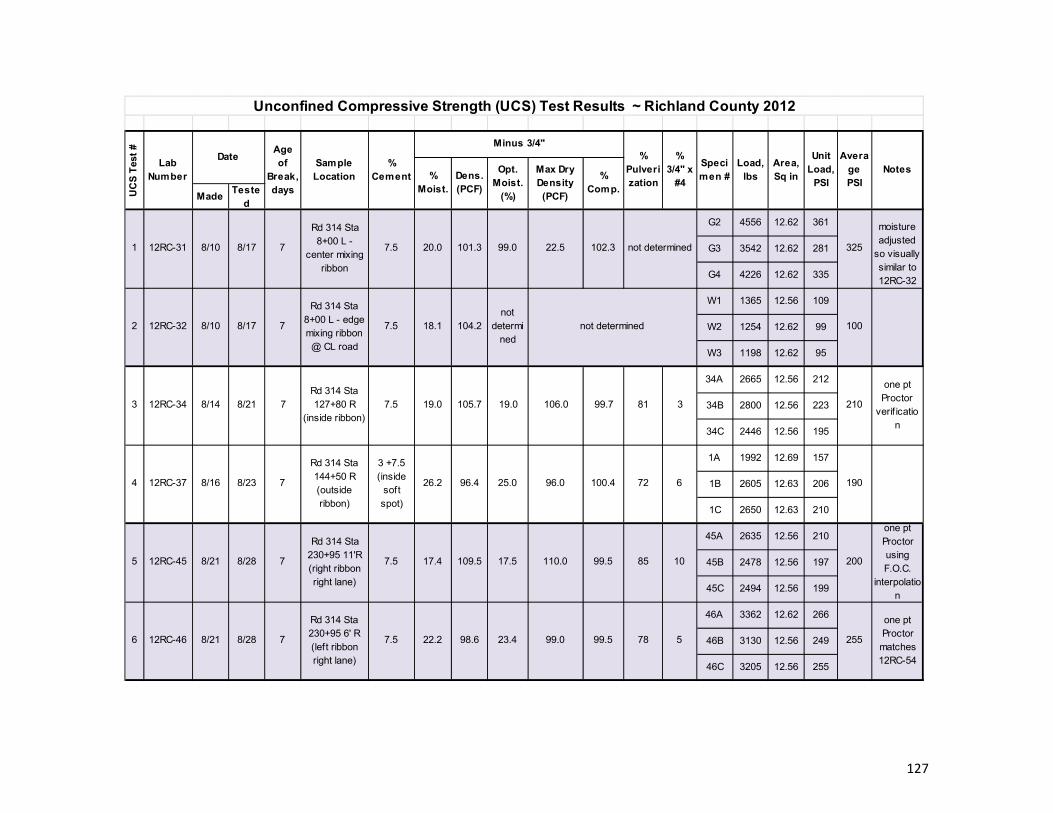
127
MadeTeste
d
G2 4556 12.62 361
G3 3542 12.62 281
G4 4226 12.62 335
W1 1365 12.56 109
W2 1254 12.62 99
W3 1198 12.62 95
34A 2665 12.56 212
34B 2800 12.56 223
34C 2446 12.56 195
1A 1992 12.69 157
1B 2605 12.63 206
1C 2650 12.63 210
45A 2635 12.56 210
45B 2478 12.56 197
45C 2494 12.56 199
46A 3362 12.62 266
46B 3130 12.56 249
46C 3205 12.56 255
not determined
not determined
Unconfined Compressive Strength (UCS) Test Results ~ Richland County 2012
200
Average PSI
210
one pt Proctor matches 12RC-54
one pt Proctor
verif ication
Specimen #
Load, lbs
Area, Sq in
Unit Load,
PSI
UC
S T
est
#
Lab Number
DateAge of
Break, days
Sample Location
% Cement
104.2
% Moist.
22.2 98.6 99.5 78
1
2
3 8/14
8/10
7.55 8/21 8/28 7
100
Rd 314 Sta 127+80 R
(inside ribbon)7.5 19.0 105.7 99.7 381
12RC-31
8/21 7
% Pulverization
% 3/4" x
#4
Rd 314 Sta 8+00 L - edge mixing ribbon @ CL road
7.5 18.1
Minus 3/4"
102.3
72
7
8/17 7
Dens. (PCF)
Max Dry Density (PCF)
22.5 325
% Comp.
Notes
moisture adjusted
so visually similar to 12RC-32
4 8/16 8/23 7
Rd 314 Sta 144+50 R (outside ribbon)
6
8/10 8/17
Rd 314 Sta 8+00 L -
center mixing ribbon
Rd 314 Sta 230+95 11'R (right ribbon right lane)
17.4
101.37.5 20.0
190100.425.0
10
5
109.5 99.5
12RC-466 8/21 8/28
Rd 314 Sta 230+95 6' R (left ribbon right lane)
7 7.5
one pt Proctor using F.O.C.
interpolation
99.0
106.0
96.0
12RC-32
12RC-34
12RC-37
12RC-45 85
255
96.4
Opt. Moist.
(%)
99.0
not determi
ned
19.0
26.2
110.017.5
23.4
3 +7.5 (inside
soft spot)

128
MadeTeste
d
54A 2980 12.56 235
54B 2605 12.56 205
54C 2478 12.56 195
55A 2462 12.56 195
55B 2134 12.56 170
55C 1735 12.56 140
A 3040 12.56 242
B 2510 12.62 199
C 2166 12.62 172
D 2920 12.56 232
E 2542 12.56 202
F 2292 12.56 182
72A 7017 12.56 559
72B 6567 12.56 523
72C 6297 12.56 501
A 2494 12.56 199
B 2620 12.56 209
C 2382 12.56 190
D 3250 12.56 259
E 2800 12.62 222
F 2860 12.56 228
Notes%
Moist.Dens. (PCF)
Opt. Moist.
(%)
Max Dry Density (PCF)
% Comp.
% 3/4" x
#4
Specimen #
Load, lbs
Area, Sq in
Unit Load,
PSI
Average PSI
UC
S T
est
#
Lab Number
DateAge of
Break, days
Sample Location
% Cement
Minus 3/4"%
Pulverization
10
8
6
14.3 110.2 100.6 76 235412RC-7613 9/8 9/15 7
Rd 350 Sta 47+00 6'L
(dow ncrow n side ripped surface)
109.56.0
7 8/28 9/4 8
Rd 143 Sta 121+00 5'L (centerline
mixer)
7.0 19.9 97.4
98.5 86
98.4
Unconfined Compressive Strength (UCS) Test Results ~ Richland County 2012
12RC-558 8/28 9/4 8
Rd 143 Sta 121+00 8'L
(w heel track mixer)
17084
7.0 19.7 100.0 101.5
99.023.5
12RC-689 8/30 9/6 7Rd 480 Sta 17+50 4'L
7.0 18.9 103.7 99.2 86 205104.520.5
12RC-7010 8/31 9/7 7Rd 480 Sta 80+50 10'L
7.0 11.6 114.7 97.2 86 20512118.013.0
12RC-7211 9/7 9/14 7Rd 350 Sta 122+20 10'L
6.0 11.8 113.9 99.0 87 5305115.014.0
12RC-7512 9/8 9/15 7
Rd 350 Sta 47+00 2'L (upcrow n
side ripped surface -
w heel track)
6.0 12.8 108.2 98.4 n/a 2002110.015.5
16.0
12RC-54 21022.0

129
MadeTeste
d
G 1811 12.56 144
H 1636 12.56 130
I 1636 12.56 130
J 2665 12.56 212
K 2665 12.56 212
L 2198 12.56 175
P 3280 12.56 261
Q 3220 12.62 255
R 3145 12.56 250
M 4052 12.5 324
N 3977 12.56 317
O 3310 12.56 264
S 4106 12.62 325
T 4947 12.62 392
U 4391 12.62 348
V 6282 12.62 498
W 7197 12.62 570
X 5697 12.62 451
Load, lbs
Area, Sq in
Unit Load,
PSI
Average PSI
Notes%
Moist.Dens. (PCF)
Opt. Moist.
(%)
Max Dry Density (PCF)
% Comp.
Sample Location
% Cement
Minus 3/4"%
Pulverization
% 3/4" x
#4
Specimen #
Unconfined Compressive Strength (UCS) Test Results ~ Richland County 2012U
CS
Tes
t #
Lab Number
DateAge of
Break, days
42 300Field 12"
FDR w /5% PC
5.0 9.0 120.2 11.0 120.0 100.2
36 255
Lab Prepped 12" FDR w /5% PC
17 12RC-80 9/11 9/18 7
Rd 350 FDR (12" depth)
~Sta -2+10, 4' L
--
7.3 125.1 7.5 126.0 99.3 --
4 200
cement not spread to full lane
w idth (narrow @ inside
16 12RC-74 9/12 9/20 8
Rd 350 - Lab Prepared -
untreated FDR (12") sample blended w ith
5% PC
5.0
15.4 106.4 17.5 105.5 100.9 84
6 135
cement not spread to full lane
w idth (narrow @ inside
15 12RC-78 9/10 9/17 7
Rd 350 Sta 126+50 6' R (w ell w ithin
cement spread)
6.0
15.8 106.7 17.0 108.0 98.8 86
27 505Field 15"
FDR w /7% PC
14 12RC-77 9/10 9/17 7
Rd 350 Sta 126+50 2' R
(Wheel Track - narrow side of spread)
6.0
10.5 121.5 11.5 120.0 101.2 87
35 355
Field 12" FDR w /5% PC repulv
to 15" depth
w /7% PC
19 12RC-86 9/14 9/21 7
Rd 350 FDR (15" depth) ~
Sta -3+10, 10'R
7.0
14.4 113.5 15.0 114.0 99.6 8618 12RC-85 9/14 9/21 7
Rd 350 FDR (prev treated) w /add'l 7% PC to 15" depth
Sta -2+10, 5' L
5 + 7

130
MadeTeste
d
A 3812 12.56 304
B 3572 12.56 284
C 4181 12.56 333
D 4962 12.62 393
E 4887 12.62 387
F 4932 12.62 391
G 2740 12.56 218
H 2785 12.56 222
I 2086 12.56 166
J 4706 12.62 373
K 3467 12.56 276
L 3812 12.56 304
M 7002 12.56 557
N 7272 12.56 579
O 7197 12.56 573
% Moist.
Dens. (PCF)
Opt. Moist.
(%)
Max Dry Density (PCF)
% Comp.
Specimen #
Load, lbs
Area, Sq in
Unit Load,
PSI
Average PSI
Notes
Unconfined Compressive Strength (UCS) Test Results ~ Richland County 2012U
CS
Tes
t #
Lab Number
DateAge of
Break, days
Sample Location
% Cement
Minus 3/4"%
Pulverization
% 3/4" x
#4
not determi
ned15 3157.5 12.9 115.3 14.0 117.0 98.5
75 15 200
23 12RC-106 9/26 10/3 7Rd 123 Sta 17+40 10' L (composite)
6.5 16.0 111.2 16.5 111.5 99.722 12RC-103 9/25 10/3 8Rd 351S Sta 14+20 10' R (composite)
1 30519.2 103.7 21.5 102.0 101.6 5912RC-93 9/18 9/25 7Rd 122 Sta 26+50 10' R (composite)
7.020
3906118.012RC-9421 9/20 9/27 7Rd 348 Sta 5+00 10' L
(composite)12.56.0 11.0 117.9 99.9 94
24 12RC-107 9/27 10/4 7Rd 123 Sta 51+50 10' L (composite)
not determi
ned35 5707.5 23.3 95.0 26.0 97.0 97.9
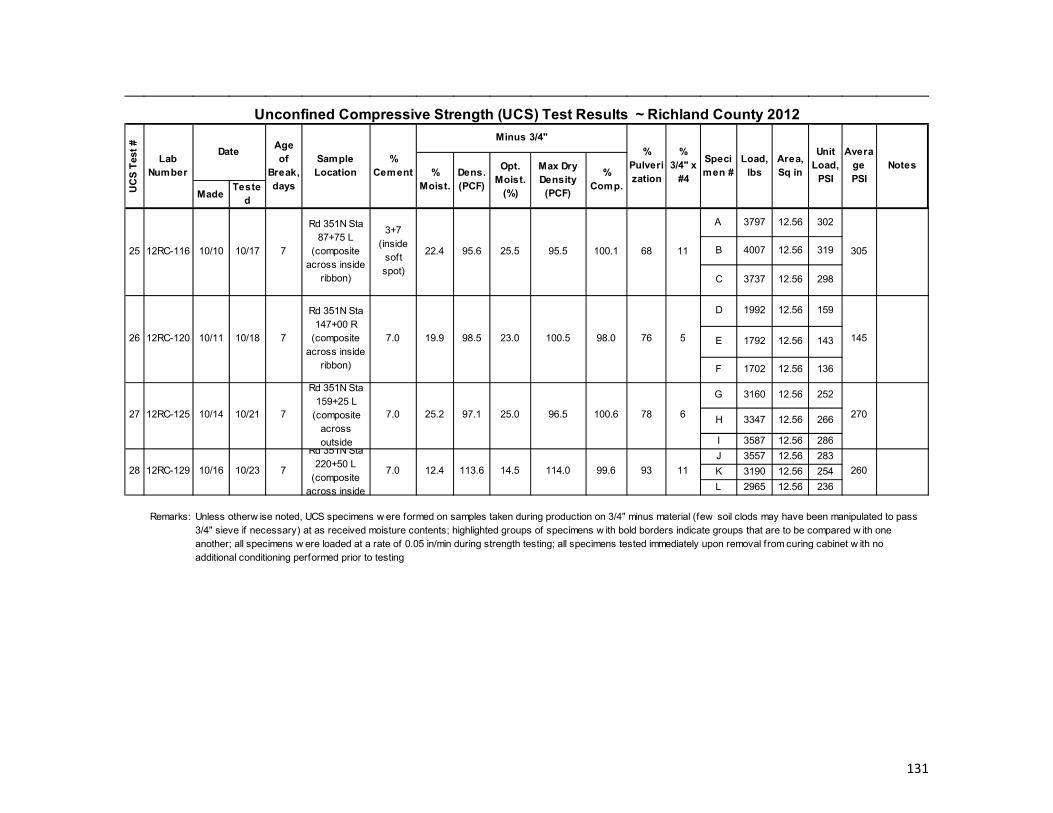
131
MadeTeste
d
A 3797 12.56 302
B 4007 12.56 319
C 3737 12.56 298
D 1992 12.56 159
E 1792 12.56 143
F 1702 12.56 136
G 3160 12.56 252
H 3347 12.56 266
I 3587 12.56 286
J 3557 12.56 283
K 3190 12.56 254
L 2965 12.56 236
Unit Load,
PSI
Average PSI
Notes%
Moist.Dens. (PCF)
Opt. Moist.
(%)
Max Dry Density (PCF)
% Comp.
Minus 3/4"
% Pulverization
% 3/4" x
#4
Specimen #
Load, lbs
Area, Sq in
UC
S T
est
#
Lab Number
DateAge of
Break, days
Sample Location
% Cement
Unconfined Compressive Strength (UCS) Test Results ~ Richland County 2012
93 11 2607.0 12.4 113.6 14.5 114.0 99.6
76 5 145
28 12RC-129 10/16 10/23 7
Rd 351N Sta 220+50 L
(composite across inside
7.0 19.9 98.5 23.0 100.5
Rd 351N Sta 147+00 R
(composite across inside
ribbon)
98.0
68 11 305
26 12RC-120 10/11 10/18 7
3+7 (inside
soft spot)
22.4 95.6 25.5 95.5 100.125 12RC-116 10/10 10/17 7
Rd 351N Sta 87+75 L
(composite across inside
ribbon)
Remarks: Unless otherw ise noted, UCS specimens w ere formed on samples taken during production on 3/4" minus material (few soil clods may have been manipulated to pass 3/4" sieve if necessary) at as received moisture contents; highlighted groups of specimens w ith bold borders indicate groups that are to be compared w ith one another; all specimens w ere loaded at a rate of 0.05 in/min during strength testing; all specimens tested immediately upon removal from curing cabinet w ith no additional conditioning performed prior to testing
27 12RC-125 10/14 10/21 7
Rd 351N Sta 159+25 L
(composite across outside
78 6 2707.0 25.2 97.1 25.0 96.5 100.6

132
325
100
210
190200
255
210
170
205 205
530
200
235
135
200
300
355
505
305
390
200
315
570
305
145
270260
0
100
200
300
400
500
600
700
1 2 3 4 5 6 7 8 9 10 11 12 13 14 15 17 18 19 20 21 22 23 24 25 26 27 28
UCS Specimens
RD 314 RD 143 RD 348RD 480 RD 350 RD 122 RD 351S RD 123 RD 351N
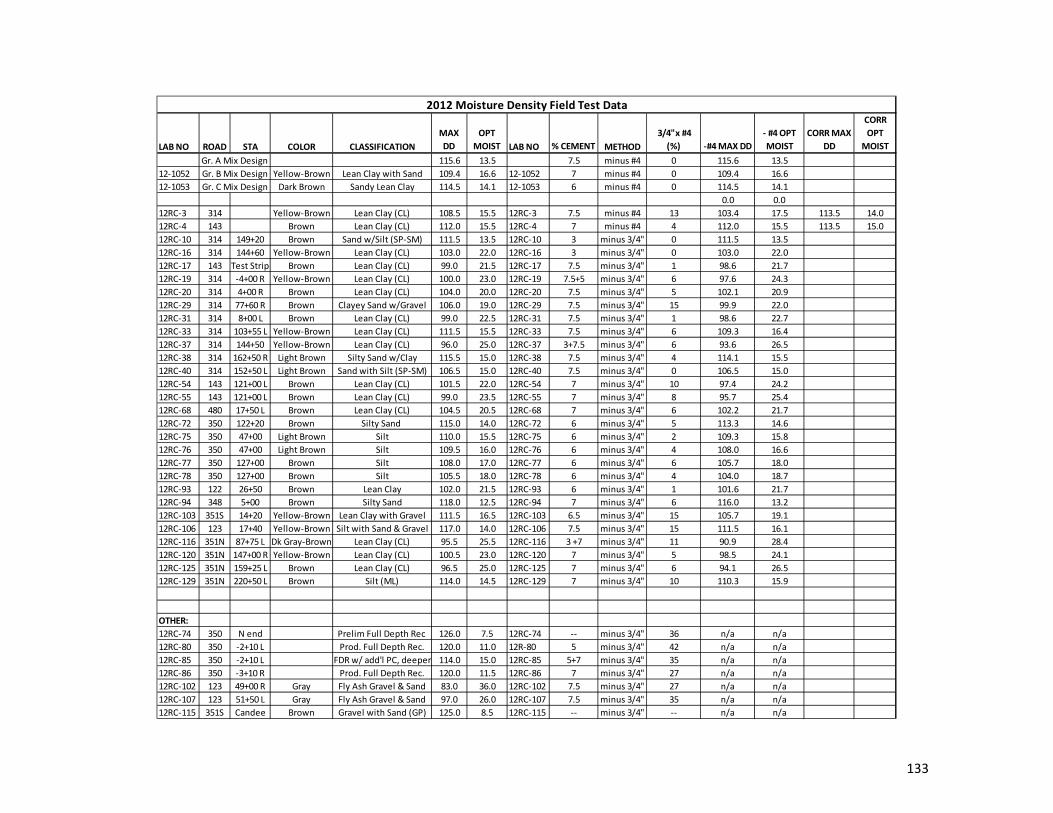
133
LAB NO ROAD STA COLOR CLASSIFICATION
MAX
DD
OPT
MOIST LAB NO % CEMENT METHOD
3/4"x #4
(%) ‐#4 MAX DD
‐ #4 OPT
MOIST
CORR MAX
DD
CORR
OPT
MOIST
115.6 13.5 7.5 minus #4 0 115.6 13.5
12‐1052 Yellow‐Brown Lean Clay with Sand 109.4 16.6 12‐1052 7 minus #4 0 109.4 16.6
12‐1053 Dark Brown Sandy Lean Clay 114.5 14.1 12‐1053 6 minus #4 0 114.5 14.1
0.0 0.0
12RC‐3 314 Yellow‐Brown Lean Clay (CL) 108.5 15.5 12RC‐3 7.5 minus #4 13 103.4 17.5 113.5 14.0
12RC‐4 143 Brown Lean Clay (CL) 112.0 15.5 12RC‐4 7 minus #4 4 112.0 15.5 113.5 15.0
12RC‐10 314 149+20 Brown Sand w/Silt (SP‐SM) 111.5 13.5 12RC‐10 3 minus 3/4" 0 111.5 13.5
12RC‐16 314 144+60 Yellow‐Brown Lean Clay (CL) 103.0 22.0 12RC‐16 3 minus 3/4" 0 103.0 22.0
12RC‐17 143 Test Strip Brown Lean Clay (CL) 99.0 21.5 12RC‐17 7.5 minus 3/4" 1 98.6 21.7
12RC‐19 314 ‐4+00 R Yellow‐Brown Lean Clay (CL) 100.0 23.0 12RC‐19 7.5+5 minus 3/4" 6 97.6 24.3
12RC‐20 314 4+00 R Brown Lean Clay (CL) 104.0 20.0 12RC‐20 7.5 minus 3/4" 5 102.1 20.9
12RC‐29 314 77+60 R Brown Clayey Sand w/Gravel 106.0 19.0 12RC‐29 7.5 minus 3/4" 15 99.9 22.0
12RC‐31 314 8+00 L Brown Lean Clay (CL) 99.0 22.5 12RC‐31 7.5 minus 3/4" 1 98.6 22.7
12RC‐33 314 103+55 L Yellow‐Brown Lean Clay (CL) 111.5 15.5 12RC‐33 7.5 minus 3/4" 6 109.3 16.4
12RC‐37 314 144+50 Yellow‐Brown Lean Clay (CL) 96.0 25.0 12RC‐37 3+7.5 minus 3/4" 6 93.6 26.5
12RC‐38 314 162+50 R Light Brown Silty Sand w/Clay 115.5 15.0 12RC‐38 7.5 minus 3/4" 4 114.1 15.5
12RC‐40 314 152+50 L Light Brown Sand with Silt (SP‐SM) 106.5 15.0 12RC‐40 7.5 minus 3/4" 0 106.5 15.0
12RC‐54 143 121+00 L Brown Lean Clay (CL) 101.5 22.0 12RC‐54 7 minus 3/4" 10 97.4 24.2
12RC‐55 143 121+00 L Brown Lean Clay (CL) 99.0 23.5 12RC‐55 7 minus 3/4" 8 95.7 25.4
12RC‐68 480 17+50 L Brown Lean Clay (CL) 104.5 20.5 12RC‐68 7 minus 3/4" 6 102.2 21.7
12RC‐72 350 122+20 Brown Silty Sand 115.0 14.0 12RC‐72 6 minus 3/4" 5 113.3 14.6
12RC‐75 350 47+00 Light Brown Silt 110.0 15.5 12RC‐75 6 minus 3/4" 2 109.3 15.8
12RC‐76 350 47+00 Light Brown Silt 109.5 16.0 12RC‐76 6 minus 3/4" 4 108.0 16.6
12RC‐77 350 127+00 Brown Silt 108.0 17.0 12RC‐77 6 minus 3/4" 6 105.7 18.0
12RC‐78 350 127+00 Brown Silt 105.5 18.0 12RC‐78 6 minus 3/4" 4 104.0 18.7
12RC‐93 122 26+50 Brown Lean Clay 102.0 21.5 12RC‐93 6 minus 3/4" 1 101.6 21.7
12RC‐94 348 5+00 Brown Silty Sand 118.0 12.5 12RC‐94 7 minus 3/4" 6 116.0 13.2
12RC‐103 351S 14+20 Yellow‐Brown Lean Clay with Gravel 111.5 16.5 12RC‐103 6.5 minus 3/4" 15 105.7 19.1
12RC‐106 123 17+40 Yellow‐Brown Silt with Sand & Gravel 117.0 14.0 12RC‐106 7.5 minus 3/4" 15 111.5 16.1
12RC‐116 351N 87+75 L Dk Gray‐Brown Lean Clay (CL) 95.5 25.5 12RC‐116 3 +7 minus 3/4" 11 90.9 28.4
12RC‐120 351N 147+00 R Yellow‐Brown Lean Clay (CL) 100.5 23.0 12RC‐120 7 minus 3/4" 5 98.5 24.1
12RC‐125 351N 159+25 L Brown Lean Clay (CL) 96.5 25.0 12RC‐125 7 minus 3/4" 6 94.1 26.5
12RC‐129 351N 220+50 L Brown Silt (ML) 114.0 14.5 12RC‐129 7 minus 3/4" 10 110.3 15.9
OTHER:
12RC‐74 350 N end Prelim Full Depth Rec 126.0 7.5 12RC‐74 ‐‐ minus 3/4" 36 n/a n/a
12RC‐80 350 ‐2+10 L Prod. Full Depth Rec. 120.0 11.0 12R‐80 5 minus 3/4" 42 n/a n/a
12RC‐85 350 ‐2+10 L FDR w/ add'l PC, deeper 114.0 15.0 12RC‐85 5+7 minus 3/4" 35 n/a n/a
12RC‐86 350 ‐3+10 R Prod. Full Depth Rec. 120.0 11.5 12RC‐86 7 minus 3/4" 27 n/a n/a
12RC‐102 123 49+00 R Gray Fly Ash Gravel & Sand 83.0 36.0 12RC‐102 7.5 minus 3/4" 27 n/a n/a
12RC‐107 123 51+50 L Gray Fly Ash Gravel & Sand 97.0 26.0 12RC‐107 7.5 minus 3/4" 35 n/a n/a
12RC‐115 351S Candee Brown Gravel with Sand (GP) 125.0 8.5 12RC‐115 ‐‐ minus 3/4" ‐‐ n/a n/a
2012 Moisture Density Field Test Data
Gr. A Mix Design
Gr. B Mix Design
Gr. C Mix Design
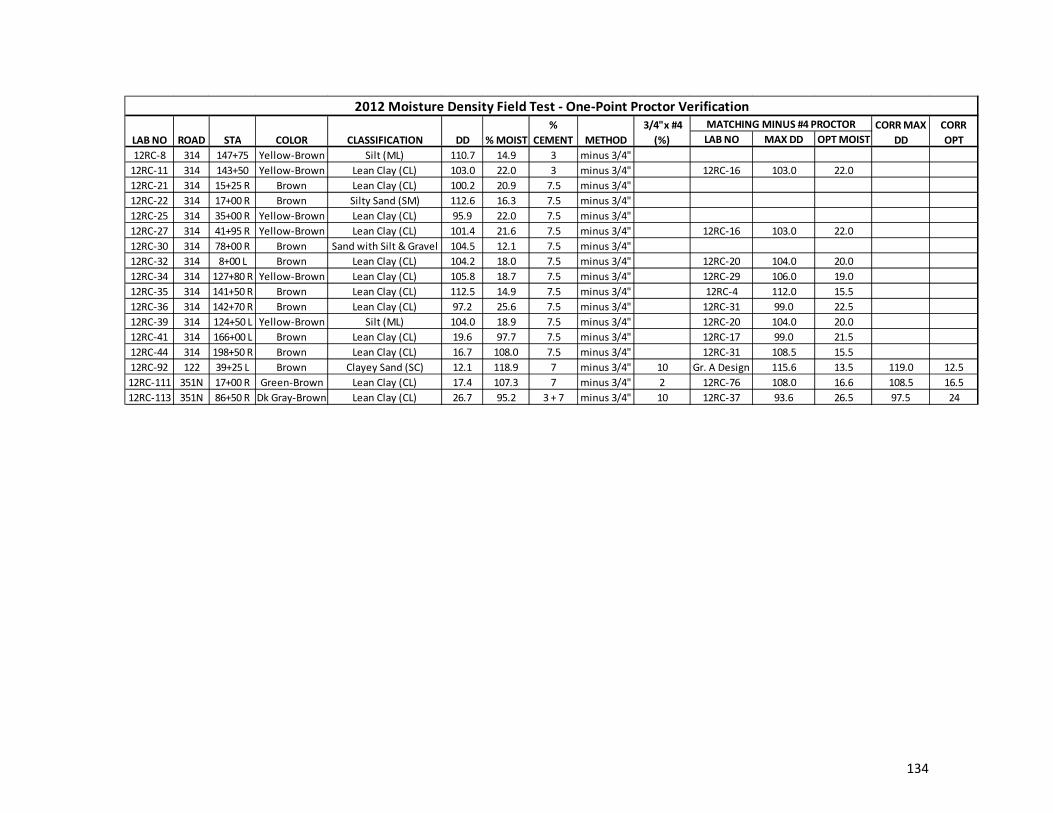
134
LAB NO MAX DD OPT MOIST
12RC‐8 314 147+75 Yellow‐Brown Silt (ML) 110.7 14.9 3 minus 3/4"
12RC‐11 314 143+50 Yellow‐Brown Lean Clay (CL) 103.0 22.0 3 minus 3/4" 12RC‐16 103.0 22.0
12RC‐21 314 15+25 R Brown Lean Clay (CL) 100.2 20.9 7.5 minus 3/4"
12RC‐22 314 17+00 R Brown Silty Sand (SM) 112.6 16.3 7.5 minus 3/4"
12RC‐25 314 35+00 R Yellow‐Brown Lean Clay (CL) 95.9 22.0 7.5 minus 3/4"
12RC‐27 314 41+95 R Yellow‐Brown Lean Clay (CL) 101.4 21.6 7.5 minus 3/4" 12RC‐16 103.0 22.0
12RC‐30 314 78+00 R Brown Sand with Silt & Gravel 104.5 12.1 7.5 minus 3/4"
12RC‐32 314 8+00 L Brown Lean Clay (CL) 104.2 18.0 7.5 minus 3/4" 12RC‐20 104.0 20.0
12RC‐34 314 127+80 R Yellow‐Brown Lean Clay (CL) 105.8 18.7 7.5 minus 3/4" 12RC‐29 106.0 19.0
12RC‐35 314 141+50 R Brown Lean Clay (CL) 112.5 14.9 7.5 minus 3/4" 12RC‐4 112.0 15.5
12RC‐36 314 142+70 R Brown Lean Clay (CL) 97.2 25.6 7.5 minus 3/4" 12RC‐31 99.0 22.5
12RC‐39 314 124+50 L Yellow‐Brown Silt (ML) 104.0 18.9 7.5 minus 3/4" 12RC‐20 104.0 20.0
12RC‐41 314 166+00 L Brown Lean Clay (CL) 19.6 97.7 7.5 minus 3/4" 12RC‐17 99.0 21.5
12RC‐44 314 198+50 R Brown Lean Clay (CL) 16.7 108.0 7.5 minus 3/4" 12RC‐31 108.5 15.5
12RC‐92 122 39+25 L Brown Clayey Sand (SC) 12.1 118.9 7 minus 3/4" 10 Gr. A Design 115.6 13.5 119.0 12.5
12RC‐111 351N 17+00 R Green‐Brown Lean Clay (CL) 17.4 107.3 7 minus 3/4" 2 12RC‐76 108.0 16.6 108.5 16.5
12RC‐113 351N 86+50 R Dk Gray‐Brown Lean Clay (CL) 26.7 95.2 3 + 7 minus 3/4" 10 12RC‐37 93.6 26.5 97.5 24
CORR
OPT % MOIST
%
CEMENT METHOD
3/4"x #4
(%)
MATCHING MINUS #4 PROCTOR CORR MAX
DDLAB NO ROAD STA COLOR CLASSIFICATION DD
2012 Moisture Density Field Test ‐ One‐Point Proctor Verification

135
Control Water Cement
1 7/12/12 12RC‐1 2070 2000
2 7/25/12 12RC‐12/13 1170 1420 1281
3 8/9/12 12RC‐26/28 1870 1860 2225
4 8/30/12 12RC‐56/61 1525 1510 1710
5 9/12/12 12RC‐73/79 1490 1650 1985
6 10/12/12 12RC‐114/117 1265 1370 1365
7 10/16/12 12RC‐99/126 1880 2015 1830
Sequence Date Field Lab No.
Average 1‐day Compressive Strength (psi)
24 Hour Water and Portland Cement Quality Field Test Data
0
500
1000
1500
2000
2500
0 1 2 3 4 5 6 7 8
24 Hour Water & Portland Cement Quality Test Data Plots
Control
Water
Cement
Test Number
1‐day
Compressive Strength, psi

136
APPENDIX O – SOIL CEMENT REPAIR PROCESS (RESERVED)
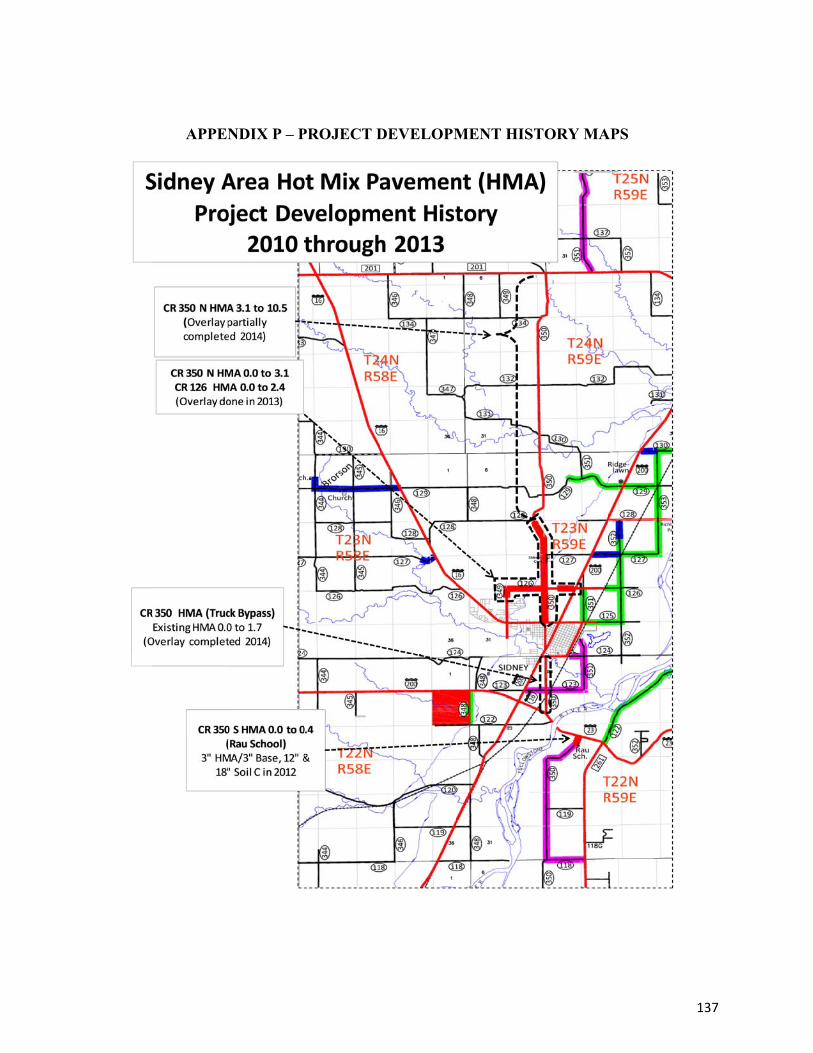
APPENNDIX P – PPROJECT DDEVELOPMMENT HISSTORY MAAPS
137
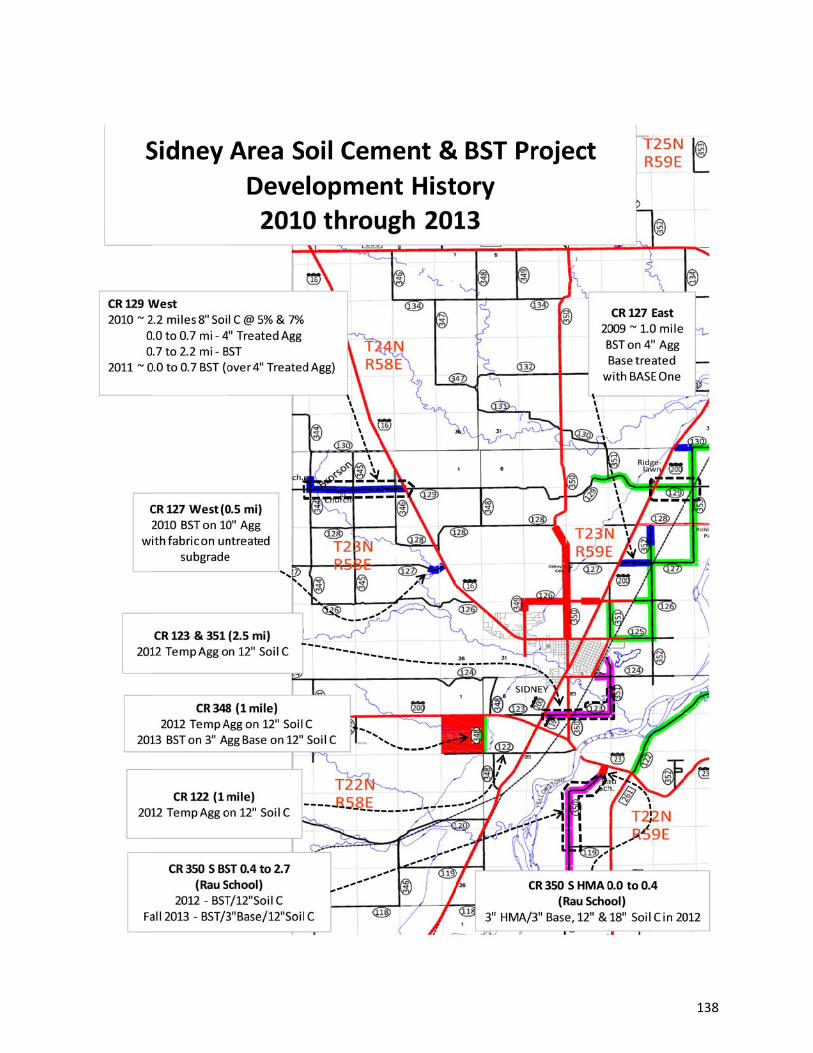
138

139
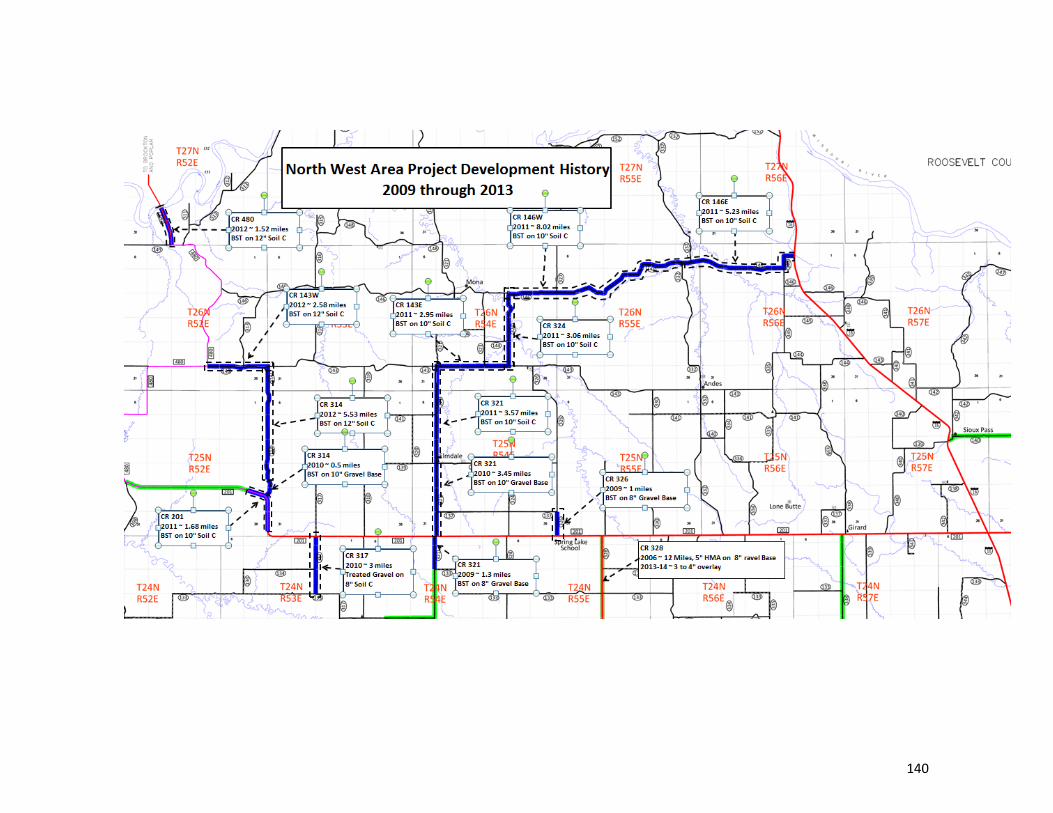
140

141
APPENDIX Q – RICHLAND COUNTY TRAFFIC MONITORING PLAN