soil dynamics and earthquake engineering -...
TRANSCRIPT

Soil Dynamics and Earthquake Engineering 32 (2012) 87–102
Contents lists available at SciVerse ScienceDirect
Soil Dynamics and Earthquake Engineering
0267-72
doi:10.1
n Corr
E-m
journal homepage: www.elsevier.com/locate/soildyn
Rocking-isolated frame structures: Margins of safety against topplingcollapse and simplified design approach
F. Gelagoti, R. Kourkoulis, I. Anastasopoulos, G. Gazetas n
School of Civil Engineering, National Technical University of Athens, Greece
a r t i c l e i n f o
Article history:
Received 1 April 2011
Received in revised form
25 August 2011
Accepted 28 August 2011Available online 15 September 2011
61/$ - see front matter & 2011 Elsevier Ltd. A
016/j.soildyn.2011.08.008
esponding author.
ail address: [email protected] (G. Gazet
a b s t r a c t
This paper aims to explore the limitations associated with the design of ‘‘rocking-isolated’’ frame
structures. According to this emerging seismic design concept, instead of over-designing the isolated
footings of a frame (as entrenched in current capacity–design principles), the latter are under-designed
with the intention to limit the seismic loads transmitted to the superstructure. An idealized 2-storey
frame is utilized as an illustrative example, to investigate the key factors affecting foundation design.
Nonlinear FE analysis is employed to study the seismic performance of the rocking-isolated frame. After
investigating the margins of safety against toppling collapse, a simplified procedure is developed to
estimate the minimum acceptable footing width Bmin, without recourse to sophisticated (and time
consuming) numerical analyses. It is shown that adequate margins of safety against toppling collapse
may be achieved, if the toppling displacement capacity of the frame dtopl (i.e. the maximum horizontal
displacement that does not provoke toppling) is sufficiently larger than the seismic demand ddem. With
respect to the capacity, the use of an appropriate ‘‘equivalent’’ rigid-body is suggested, and shown to
yield a conservative estimate of dtopl. The demand is estimated on the basis of the displacement
spectrum, and the peak spectral displacement SDmax is proposed as a conservative measure of ddem. The
validity and limitations of such approximation are investigated for a rigid-block on rigid-base, utilizing
rigorous analytical solutions from the bibliography; and for the frame structure on nonlinear soil, by
conducting comprehensive nonlinear dynamic time history analyses. In all cases examined, the
simplified SDmax approach is shown to yield reasonably conservative estimates.
& 2011 Elsevier Ltd. All rights reserved.
1. Introduction
Current seismic design dictates that foundation systems mustrespond almost elastically even under strong earthquake shaking.Such code provisions are justified on the basis of the well-established conventional wisdom related to the difficulties inthe (post-seismic) inspection of buried foundations (let alonetheir retrofitting), and on the uncertainties involved in assigningsoil properties. Thus, foundations are designed to sustainincreased loads compared to those of the corresponding column,by introducing appropriate over-strength factors [1,23].
However, over the last years there is a growing awareness thatnon-linear foundation response is not necessarily detrimental andmay even be unavoidable during strong seismic shaking [2–6].Three types of non-linearity at the soil–foundation level arerecognized: (i) sliding at the soil–foundation interface when thetransmitted horizontal force exceeds the available frictional resis-tance, (ii) separation and uplifting of the foundation, when the
ll rights reserved.
as).
seismic overturning moment exceeds a critical value, and (iii)substantial foundation soil yielding to the point of mobilization ofeccentric bearing capacity mechanisms. All these may considerablymodify and limit the transmitted acceleration. The need to expli-citly account for the aforementioned non-linear phenomena incontemporary seismic geotechnical design has emerged from thefact that the intensity of the recorded ground motions in the last 20years has significantly exceeded the design levels. For instanceduring the 1994 Northridge earthquake (Ms¼6.8) the maximumrecorded PGA exceeded 0.90 g; during the 1995 Kobe earthquake(Ms¼7.2) maximum recorded acceleration reached 0.85 g, whilethe 2007 Niigata-ken Oki earthquake produced an acceleration of1.2 g. Correspondingly large were the response spectral accelera-tion levels.
Under such severe seismic shaking, ensuring elastic founda-tion response is apparently a formidable task. In fact, it may evenbe totally undesirable since enormous ductility demands wouldbe imposed on the superstructure. Alternatively, allowing ‘‘plastichinging’’ to develop in the foundation–soil system could bebeneficial for the superstructure by bounding the inertial forcestransmitted to it (through soil yielding, foundation uplifting, orboth) [7–21]. This type of behavior may particularly be desirable

F. Gelagoti et al. / Soil Dynamics and Earthquake Engineering 32 (2012) 87–10288
in retrofitting (existing) structures, which have been designedaccording to outdated seismic codes and which would obviouslybe unable to resist the substantially higher seismic demands ofcontemporary codes.
The potential effectiveness of the mechanisms of uplifting forthe foundation of frame structures has recently been investigatedby Gelagoti et al. [22] for a 2-storey 1-bay frame structure (Fig. 1).Since foundation plastic ‘‘hinging’’ is mainly in the form of rockingand uplifting of the footing, the proposed design concept istermed rocking isolation. Contrary to conventional capacity design,in the rocking isolation approach the footings dimensions areselected so that their moment capacity Mult is smaller than that ofthe corresponding column MC
RD (in that sense the rocking-isolatedfootings are in the ensuing referred to as ‘‘under-designed’’implying that their dimensions are lower than those of theconventionally designed). Hence, in case the earthquake demandexceeds the footing capacity, the latter is intended to uplift thuslimiting the distress transmitted to the column, which subse-quently responds elastically (Fig. 1a). The seismic performance ofa conventionally designed structure (with B¼1.7 m square foot-ings) was compared to a specific rocking-isolation alternative(with smaller B¼1.4 m footings). Through static pushover andnonlinear dynamic time-history analysis (using an ensemble of 24strong motion records), the performance of the rocking-isolatedalternative was found to be advantageous in very strong seismicshaking, well in excess of the design limits (Fig. 1b). Theconventionally designed structure experienced substantialdamage beyond the limit of repair in most examined scenarios,
Conventional Capacity Design
B B
No foundation uplift allowed :e < B/3
Plastic “hinging” at column base
Plastic “hinging” at beams
Under s
shak
“hinginun
Su = 150 kPa
Plastic “hinging” at column base Almost elastic
foundation response
plastic hinging of beams
1.7 m
Fig. 1. Conventional Capacity Design (left column) compared with Rocking-Isolation De
two design alternatives, and (b) plastic strain contours of the deformed model subject
and even collapsed in 3 out of 24 of them. By contrast, therocking-isolation solution survived all seismic excitations sustain-ing minor to repairable column damage, but non-negligibledamage to its beams. Interestingly, (at least for the cases exam-ined) dynamic settlement was shown not to be an issue, providedthat the static safety factor of the under-designed footing underits vertical load were adequately large: FSv44.
However promising the rocking isolation concept may appear,its applicability potential is hinging on a number of critical issues.For a given frame structure, the decrease of foundation width B,and thus subsequently the reduction of the foundation momentcapacity (Mult), is expected to result in more effective rockingisolation. But, unfortunately, this will be directly associated witha decrease of the static safety factor FSv, thus amplifying the riskof augmented foundation rotation, which may lead to topplingcollapse, or of excessive soil yielding and intolerable settlements.
To this end, this paper investigates the margins of safetyagainst toppling collapse of rocking-isolated frame structures,and attempts to develop a simplified design approach to con-servatively estimate the minimum acceptable footing dimension.
2. Problem statement and analysis methodology
The example structure utilized in this study has been pre-sented by Gelagoti et al. [22] and refers to an idealized 5 m wideand 7 m high 2-storey reinforced concrete (RC) frame (Fig. 2a)founded on a stiff (over-consolidated) clay stratum (Su¼150 kPa,
Rocking Isolation Design
b < B
Rocking isolation
prevents column
failure : plastic
“hinging” is guided to
the foundation
b < B
trong seismic
ing plastic
g” of beams is
avoidable
Su = 150 kPa
Soil yielding
plastic hinging of beams
1.4 m
Elastic response
of the column
sign (right column): (a) schematic representation of the mechanisms governing the
ed to extremely severe seismic shaking (Takatori record, Kobe 1995).

-0.4 -0.3 -0.2 -0.1 0 0.1 0.2 0.3 0.4
Soil–Footing interface: contact elements, � = 0.7
Ground floor Beam :
20 x 50 cm, 5�16
Μb1RD = 120 kNm
SV seismic waves
Footing 1 Footing 2
1st floor Beam :
20 x 50 cm, 4�14
Μb2RD = 78 kNm
Colu
mn 1
:
40 x
40 c
m, 8
�20
ΜC
RD =
165
kN
m
Colu
mn 2
:
40 x
40 c
m, 8�
20
ΜC
RD =
165
kN
m
B
-200
-150
-100
-50
0
50
100
150
200
-0.4 -0.3 -0.2 -0.1 0 0.4
M (k
Nm
)
Curvature c (1/m) Curvature c (1/m)
Ground floor column (section a-a’)
a
monotonic
FE cyclic
cult
Mres
cmax ≈ 3 cult
Mult
0.5 m
Ground floor beam (section b-b’)
a’
b b’
Overconsolidated Clay: Su = 150 kPa, Go = 200 MPa
5 m
4 m
3 m
Fig. 2. (a) Geometry, member properties, and outline of the finite element (FE) model: a typical ‘‘slice’’ of the frame is analyzed in plane–strain, taking account of material
(soil and superstructure) and geometric (uplifting and P–D effects) nonlinearities; (b) FE model response under dynamic loading for ground floor columns (left) and beam
(right).
F. Gelagoti et al. / Soil Dynamics and Earthquake Engineering 32 (2012) 87–102 89
Go¼200 MPa). The superstructure was designed using commer-cial structural analysis software, in accordance with [23] and theGreek Seismic code [24], for effective design accelerationAd¼0.36 g and behavior factor q¼3.5.
To meet the conventional design requirements, the foundationminimum width must be B¼1.7 m. If the footing dimension isreduced (following the rocking isolation approach) the latter willrespond to strong seismic shaking either through detachmentfrom the supporting soil or soil yielding. Gelagoti et al. [22]demonstrated that foundation uplifting may be promoted againstexcessive soil yielding by ensuring an adequately high safetyfactor against vertical loads (FSv44), which for the stiff soilconditions of the example problem may be accomplished even
for the extreme case of B¼1.1 m (neglecting of course theeccentricity eoB/3 conventional requirement).
2.1. Numerical modeling
The problem is analyzed through the finite element (FE)method. Assuming plane–strain conditions, a representativeequivalent ‘‘slice’’ of the soil–structure system is modeled, withdue consideration to material (soil and superstructure) andgeometric (uplifting and P�D effects) nonlinearities. In order toachieve ‘‘equivalence’’ between the 2D and the square 3D pro-blems, the Meyerhof [25] and Vesic [26] bearing capacity shapefactor of 1.2 (for square foundation) was applied to the out of

F. Gelagoti et al. / Soil Dynamics and Earthquake Engineering 32 (2012) 87–10290
plane dimension of the soil ‘‘slice’’, following the procedureproposed by Gelagoti et al. [22]. This procedure slightly over-predicts foundation settlement. Soil and footings are modeledwith quadrilateral continuum elements. Nonlinear beam ele-ments are used for the superstructure, which is connected tothe soil through an interface that allows detachment and sliding.Appropriate boundary conditions are used at the lateral bound-aries of the model to realistically reproduce the free-field soilresponse to upward propagating waves. The dynamic response ofthe system is simulated employing nonlinear dynamic timehistory analysis, applying the excitation time history at the baseof the model.
Nonlinear soil behavior is modeled through a simple kinematichardening model, with a Von Mises failure criterion and asso-ciated flow rule [27]. The full description of the model requiresknowledge of only three parameters, i.e. the elastic Young’smodulus E, the ultimate strength sy, and the yield stress so. Theevolution of the kinematic component of the yield stress (a) isdescribed by the expression
_a ¼ E1
soðs�aÞ_epl
�ga_eplð1Þ
where g is a parameter determining the rate of decrease ofkinematic hardening with increasing plastic deformation and sthe current stress.
The same kinematic hardening model is used, as suggested byGerolymos et al. [28], to simulate the nonlinear moment–curvature response of superstructure reinforced concrete (RC)members. Model parameters are calibrated against moment–curvature (M–c) relations, obtained (up to the point of ultimatecurvature cult) through RC cross-section analysis employing theX-tract [29] software. Reasonable hypothesis has been made forthe metaplastic response of RC sections (for cmax4c4cult): theresidual bending moment Mres is presumed equal to 30% of thebending moment capacity [30], and is considered to be attainedfor a curvature cmax¼3cult. Typical calibration results are portrayedin Fig. 2b.
3. Rocking isolation of frames: minimum footing widthrequirement
The minimum footing width must guarantee the ability of thestructure to safely undertake the imposed static and seismic loads,
0
20
40
60
80
100
0
P (k
N)
Β= 1.4 m
Β= 1.2 m
Β= 1.1 m
B decreases
δtopl
3rd Phase: Rocking dominates
0.2 0.4 0.6 0.8 1.0
Plastic yielding of beams
1st
Pha
se
2nd
Pha
se
δ (m)
Fig. 3. (a) Static pushover P–d response of rocking isolated frame supported on B¼1.4 m
the ultimate phase of response, when rocking dominates: beam to column connections
through rigid-body rotation.
avoiding the development of excessive permanent foundationsettlement and rotation. The criterion that must be met for thestatic loads is the obvious requirement of an adequate factor ofsafety FSv43 (typically). In the case of seismic loading, therocking-isolation concept neglects current code requirements,allowing the footing to uplift substantially: the latter is deliber-ately under-designed, so that MultoMC
RD. Apparently, the decreaseof the footing width, and hence of Mult, leads to more effectiverocking isolation. But, unfortunately, such effectiveness is alsodirectly associated with a decrease of FSv, thus leading toincreased foundation rotation and risk of toppling. Hence, thecriterion for seismic loads is the control of the developed founda-tion rotation, so that the structure is maintained operational, andof course safe against toppling collapse. An attempt to set out aprocedure pertaining to the calculation of the minimum allowablefooting width is offered in the ensuing.
3.1. The effect of footing width reduction
Utilizing the aforementioned FE modeling methodology, rock-ing-isolated frame structures (with under-designed footings)were subjected to pushover loading. The response in terms ofhorizontal reaction force P vs. displacement d (at the center ofmass) is displayed in Fig. 3a. Based on such results, Gelagoti et al.[22] identified three distinct phases that describe the response ofrocking-isolated frames to monotonically imposed horizontaldisplacement. During the first phase, the frame reacts throughflexural deformation up to the initiation of plastic hinging on thebeams, when the framing action (development of a pair ofopposite axial forces) slowly begins to deteriorate. With increas-ing displacement, foundation uplifting initiates as well (secondphase). During the third phase, beam-to-column connectionshave been reduced to plastic hinges, and all of the imposeddisplacement is undertaken by footing rotation until the completetoppling collapse of the structure. Pushover analyses revealed(Fig. 3a) that the width of the footing controls the topplingdisplacement dtopl of the frame: decreasing the footing dimensionresults in lower dtopl. Apparently, as also indicated by the constantslope of the P–d curve, during this third phase the flexuralresponse is almost negligible, and the behavior up-to the pointof incipient toppling is totally rocking-dominated. Therefore, thestructure during this ultimate phase may be considered to havevanished to a hybrid system consisting of two 1-dof oscillatorskinematically connected with the two hinged beams (Fig. 3b).
hf
B
δtopl ≈ ϑult hf
H
1.2
ult
, 1.2 m, and 1.1 m footings; (b) schematic illustration of the frame system during
have vanished to hinges and the whole frame reacts to the imposed displacement

F. Gelagoti et al. / Soil Dynamics and Earthquake Engineering 32 (2012) 87–102 91
To ensure adequate margins of safety against toppling col-lapse, the toppling displacement of the frame dtopl (i.e., thecapacity) must be larger than the seismic demand ddem:
ddemodtopl ð2Þ
During the third rocking-dominated phase, the displacement d atthe center of mass of the structure may be easily calculated asd¼yhf, where hf is the height of the center of mass and y thefooting rotation. So, apparently dtopl¼yulthf, where yult is the frametoppling rotation. Hence, the problem of developing a simplifiedprocedure to assess the minimum footing width to guaranteesafety against earthquake-induced displacement, reduces todeveloping a simplified procedure to estimate ddem and dtopl.
4. Simplified procedure to estimate the toppling capacity ofthe frame
Through the previously described FE pushover analysis of theframe–soil system, it is possible to obtain ‘‘accurately’’ themoment–rotation curve for the two footings (Fig. 4a), takingaccount of strength degradation due to second-order (P–D) effects,and hence estimate the frame toppling displacement capacity dtopl
on the basis of the minimum toppling rotation of either of itsfootings (the right one, in this case).
Obviously, the estimation of the exact dtopl of a frame rockingon non-linear soil entails tedious numerical modeling of both thesuperstructure (of possibly complex geometry) and the founda-tion soil, taking account of both material and geometric non-linearities. This may hinder the applicability of the rockingisolation concept—hence the need for a simplified procedure isproposed, to conservatively estimate the toppling displacementcapacity based solely on the geometry of the frame. To this end,the frame–soil system is gradually decomposed following a two-
step procedure, as explained in the ensuing.
4.1. 1st step: equivalent 1-dof system response
Initially, it is attempted to reduce the frame to an appropriate1-dof oscillator of the same footing width B and critical topplingdisplacement capacity dtopl with the original frame structure. It iswell known that the toppling rotation yult of a 1-dof system ofwidth B rocking on compliant inelastic soil will depend on itsaxial load and height. However, as demonstrated by Gelagoti et al.[22], both the actual axial load N as well as the moment to shearratio M/Q acting on the foundation level (which determines the1-dof system lever arm or height) constantly fluctuate, thus
Ove
rtur
ning
Mom
ent M
(kN
m)
Rotation (rad)
Right fo
Left foo
0
40
80
120
160
0 0.1 0.2ult
Idealized 1-dof system
frameult1-dof
Fig. 4. Moment–rotation (M–y) response of the two (B¼1.4 m) frame footings (produce
the response of idealized equivalent 1-dof system (dotted line).
hindering the selection of unique values, which could be able toreproduce the original frame footing behavior.
Moreover, the moment–rotation curve of a 1-dof system (ofconstant lever arm and load) subjected to displacement controlledpushover loading (FE simulation), clearly manifests a qualitativedisagreement with those produced for each footing during push-over of the complete frame (Fig. 4). Following these observations,the reproduction of the exact frame footing response by means ofa simple 1-dof system would be apparently meaningless, and isdefinitely not intended at this stage. Instead, it only involves theassessment of the proper load and height of the equivalent 1-dofsystem that would facilitate a conservative estimate of the actualframe footing toppling rotation (i.e., that of the right footing).
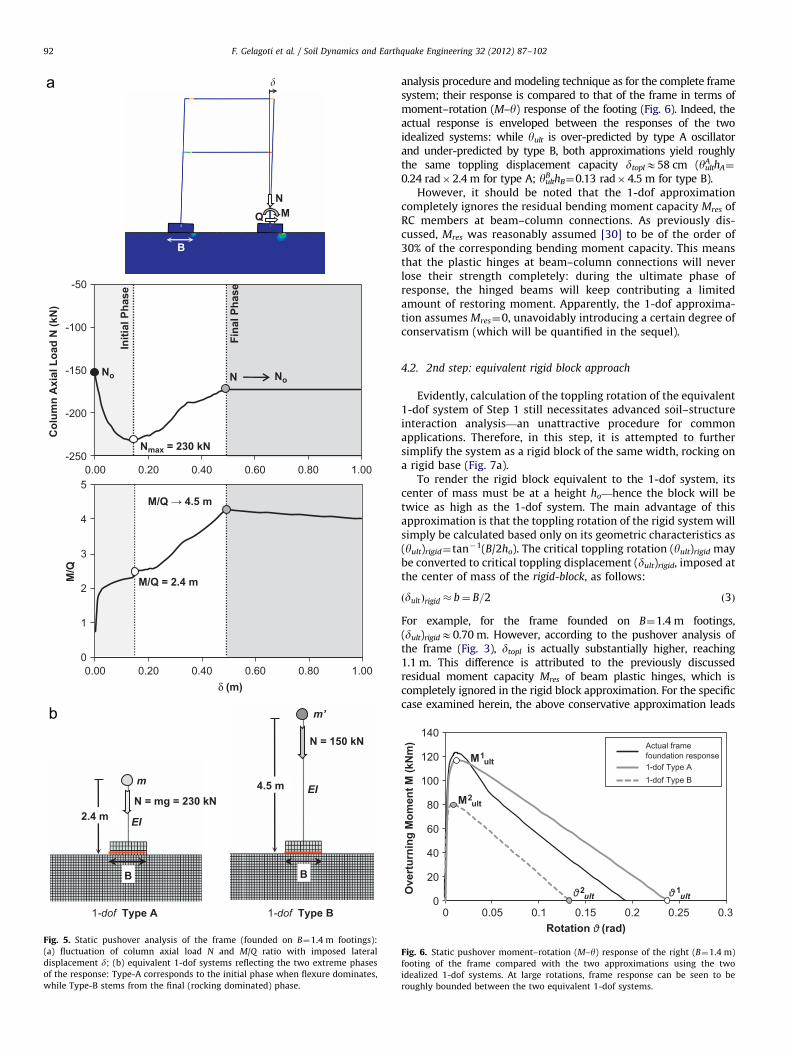
To this end, Fig. 5 plots the evolution of axial load N and of theM/Q ratio (of the right footing of the frame) against the imposedlateral displacement d, during monotonic pushover analysis theframe. Evidently, during the bending dominated first phase of theresponse, the axial load (Fig. 5a) on the right footing increasesfrom its initial value No¼150 kN due to the dead load of thesuperstructure, to Nmax¼230 kN. At the same time, i.e. before thedevelopment of plastic hinging in the beams, the ratio M/QE2.4 isroughly equivalent to what would be computed on the basis ofconventional elastic static analysis of the frame. In the subsequentphase, as the framing action diminishes due to plastic hinging ofthe beams, the axial load reduces until the frame has vanished tothe idealized hinged system discussed earlier, while M/Q asymp-totically approaches 4.4 m, i.e. the height of the center of mass ofthe system. After that point, during the third phase, the axial loadmaintains a constant value NENo, whereas M/Q slightly decreases.
In view of this behavior, two idealized 1-dof systems are envi-sioned corresponding to the N and M/Q values acting on the rightfooting at the two previously identified limiting states (Fig. 5b):
(a)
otin
ting
d thr
Type A, which corresponds to the ultimate stage of flexuralresponse: a 1-dof system with mass m¼Nmax/gE2.3 Mg,(corresponding to Nmax¼230 kN) at height hA¼2.4 m. Notethat hA may be readily calculated through conventionalpseudo-static analysis of the structure, utilizing any commer-cial structural analysis software.
(b)
Type B, which reflects the fully hinged system state during therocking-dominated phase: a 1-dof system with mass m¼No/gE1.5 Mg (corresponding to N¼150 kN, as computed for theseismic load combination) at height hB¼4.4 m.These two ‘‘equivalent’’ 1-dof systems have been subjected todisplacement controlled pushover loading, following exactly the same
g
0.3
Mult
ult
M/QN
B
Idealized 1-dof system
ough displacement-controlled pushover loading of the frame), compared with
-250
-200
-150
-100
-50
0.00 0.20 0.40 0.60 0.80 1.00
0
1
2
3
4
5
0.00 0.20 0.40 0.60 0.80 1.00
δ (m)
Col
umn
Axi
al L
oad
N (k
N)
M/Q
M/Q = 2.4 m
No
Nmax = 230 kN
N No
M/Q → 4.5 m
Initi
al P
hase
Fina
l Pha
se
N = mg = 230 kN
m
2.4 m
B
EI
N = 150 kN
4.5 m
B
m’
1-dof Type B
EI
�
M
B
QN
1-dof Type A
Fig. 5. Static pushover analysis of the frame (founded on B¼1.4 m footings):
(a) fluctuation of column axial load N and M/Q ratio with imposed lateral
displacement d; (b) equivalent 1-dof systems reflecting the two extreme phases
of the response: Type-A corresponds to the initial phase when flexure dominates,
while Type-B stems from the final (rocking dominated) phase.
F. Gelagoti et al. / Soil Dynamics and Earthquake Engineering 32 (2012) 87–10292
analysis procedure and modeling technique as for the complete framesystem; their response is compared to that of the frame in terms ofmoment–rotation (M–y) response of the footing (Fig. 6). Indeed, theactual response is enveloped between the responses of the twoidealized systems: while yult is over-predicted by type A oscillatorand under-predicted by type B, both approximations yield roughlythe same toppling displacement capacity dtoplE58 cm (yult
A hA¼
0.24 rad�2.4 m for type A; yultB hB¼0.13 rad�4.5 m for type B).
However, it should be noted that the 1-dof approximationcompletely ignores the residual bending moment capacity Mres ofRC members at beam–column connections. As previously dis-cussed, Mres was reasonably assumed [30] to be of the order of30% of the corresponding bending moment capacity. This meansthat the plastic hinges at beam–column connections will neverlose their strength completely: during the ultimate phase ofresponse, the hinged beams will keep contributing a limitedamount of restoring moment. Apparently, the 1-dof approxima-tion assumes Mres¼0, unavoidably introducing a certain degree ofconservatism (which will be quantified in the sequel).
4.2. 2nd step: equivalent rigid block approach
Evidently, calculation of the toppling rotation of the equivalent1-dof system of Step 1 still necessitates advanced soil–structureinteraction analysis—an unattractive procedure for commonapplications. Therefore, in this step, it is attempted to furthersimplify the system as a rigid block of the same width, rocking ona rigid base (Fig. 7a).
To render the rigid block equivalent to the 1-dof system, itscenter of mass must be at a height ho—hence the block will betwice as high as the 1-dof system. The main advantage of thisapproximation is that the toppling rotation of the rigid system willsimply be calculated based only on its geometric characteristics as(yult)rigid¼tan�1(B/2ho). The critical toppling rotation (yult)rigid maybe converted to critical toppling displacement (dult)rigid, imposed atthe center of mass of the rigid-block, as follows:
ðdultÞrigid � b¼ B=2 ð3Þ
For example, for the frame founded on B¼1.4 m footings,(dult)rigidE0.70 m. However, according to the pushover analysis ofthe frame (Fig. 3), dtopl is actually substantially higher, reaching1.1 m. This difference is attributed to the previously discussedresidual moment capacity Mres of beam plastic hinges, which iscompletely ignored in the rigid block approximation. For the specificcase examined herein, the above conservative approximation leads
Rotation (rad)
Ove
rtur
ning
Μom
ent M
(kN
m)
0
20
40
60
80
100
120
140
0 0.05 0.1 0.15 0.2 0.25 0.3
Actual frame
foundation response
1-dof Type A
1-dof Type B
1ult
2ult
M2ult
M1ult
Fig. 6. Static pushover moment–rotation (M–y) response of the right (B¼1.4 m)
footing of the frame compared with the two approximations using the two
idealized 1-dof systems. At large rotations, frame response can be seen to be
roughly bounded between the two equivalent 1-dof systems.

M (k
Nm
)
(rad)
h
“Equivalent” 1-dof system
“Equivalent” Rigid Block
Rigid Base
ult
Su = 150 kPa
Frame system
frame
1-dofult
Center of mass
h
B = 1.4 m B = 1.4 m
Rigid base
FSv ≈ 5
ult
Su = 150 kPa
rigid
-150
-100
-50
0
50
100
150
-0.3 -0.2 -0.1 0 0.1 0.2 0.3
ultrigid
1-dofult
B = 1.4 m
Fig. 7. (a) Problem decomposition: rocking-isolated frame on nonlinear soil (left); initial approximation of an ‘‘equivalent’’ idealized 1-dof system on the same nonlinear
soil (middle); and further approximation to an ‘‘equivalent’’ rigid block rocking on rigid base. (b) Comparison of moment–rotation (M–y) response (produced through
pushover loading) of the ‘‘equivalent’’ idealized 1-dof system with FSv¼5 (B¼1.4 m footings), with that of the rigid block on rigid base.
F. Gelagoti et al. / Soil Dynamics and Earthquake Engineering 32 (2012) 87–102 93
to under-estimation of roughly 30% of dtopl (it will depend on Mres,and the number of participating beams).
Moreover, the rigid-block approximation inherently impliesthree additional fundamental assumptions:
(i)
The rigid block assumption ignores the flexibility of thesystem. However, as shown earlier, during the third phaseof response the effect of system flexibility is negligible sincethe behavior is rocking-dominated and bending is minimal.(ii)
The possible contribution of higher modes of vibration (form-dof structures) is ignored. Yet, according to Bielak [31], whoinvestigated the response of fixed base systems, the con-tributions of the second and higher modes to the overturningmoment at the base of any classical linear system whosefundamental mode is given by a straight line vanishidentically.
(iii)
The rigid base assumption makes it impossible to capture theeffect of soil compliance. Yet, the latter is expected to benegligible on the rocking response provided that the factor ofsafety against vertical loads is high enough—a key prerequi-site of the rocking isolation concept.
To better illustrate the validity of the rigid-base approximation,static pushover analysis of the following systems is employed:(a) the equivalent 1-dof system with footing B¼1.4 m lying on ahomogenous clayey soil of undrained shear strength Su assumingFSvE5, and (ii) the geometrically equivalent rigid-block resting on
a rigid-base. As shown in Fig. 7b, the M–y (moment–rotation)response of the rigid-block on rigid-base reasonably approximatesthat of the 1-dof system for large FSv values. Naturally, theapproximation is not valid for smaller safety factors, when soilyielding cannot be considered negligible. In general, and based onadditional results not shown herein, the rigid-block on rigid-base
approximation may be considered reasonable for FSv44, which isin any case the lower allowable limit for all practical purposes.
5. Simplified approach for seismic displacement demand
As previously discussed, the estimation of the lower acceptable
footing width requires combined knowledge of its displacementcapacity dtopl and earthquake demand ddem. Assuming that dtopl
can be conservatively estimated on the basis of the rigid-block on
rigid-base approximation, the problem reduces to establishing aprocedure to obtain conservatively the displacement demandddem for a specific seismic motion. An initial rational approachtowards this could be that proposed by Priestley et al. [33], whoestimate ddem of a motion based on the displacement spectrum ofan equivalent 1-dof oscillator, SD(Teff).
However, in accord with the relevant bibliography (e.g. [16,32]),Teff of a rocking system constantly changes during shaking, risingfrom zero (in the case of a rigid block ‘‘tied’’ to its base) to infinityonce the toppling condition has been met (Fig. 8). Hence, Teff
cannot be known a-priori and consequently SD(Teff) cannot be

H = 2h
B = 2b
ϑ
mg �
toppling :
> � or � > b
�
Effe
ctiv
e Pe
riod
T
Imposed displacement δ
∞
Fig. 8. Rigid block lying on a rigid base: (a) problem geometry; and (b) evolution of effective period T with displacement d. At the state of incipient toppling, T tends to
infinity.
0
4
8
12
16
0 2 4 6 8 10 0 2 4 6 8 10
Overturning Area
αg
ap
αg ap
Overturning Area
Overturning Area
ωp/ p
p = 2.14 rad/s
α= 0.25 rad
Overturning Area
+a
–a
tSine pulse
R
ωp/ p
p = 2.14 rad/s
α= 0.25 rad
p = 2.00 rad/s
α= 0.35 rad
p = 2.00 rad/s
α= 0.35 rad
0
4
8
12
16
Cosine pulse
–a
t
+a
R
“Unsafe” prediction
“Unsafe” prediction
Analytical solution
Approximate method
Fig. 9. Comparison of the simplified method (based on the maximum spectral displacement SDmax) with the rigorous analytical solution of [39] for a rigid body rocking on
a rigid base, subjected to idealized base excitation: one-cycle sine pulse (left column) and one-cycle cosine pulse (right column). Non-dimensional toppling acceleration
ap/ag as a function of the normalized excitation frequency op/p, for: (a) a smaller block of p¼2.14 rad/s and a¼0.25 rad, and (b) a larger block of p¼2.0 rad/s and
a¼0.349 rad.
F. Gelagoti et al. / Soil Dynamics and Earthquake Engineering 32 (2012) 87–10294
easily defined: although [33] had proposed an iterative simplifiedmethod to compute Teff and estimate the rotation y of a rockingsystem on the basis of SD, Makris and Konstantinidis [34] haveshown that rocking response cannot be approximated by 1-dofoscillator-based methodologies, as the two systems are fundamen-tally different (stiffness, damping, and restoring mechanisms).
Taking account of the above limitations, the peak spectraldisplacement SDmax is proposed as a conservative measure of the
upper bound displacement demand (i.e. independently of Teff).Note that SDmax is only adopted as a conservative index of themaximum anticipated seismic displacement demand, which willnot necessarily develop during seismic shaking. The validity andlimitations of this simplified approximation are investigated inthe following sections for two classes of problems: (i) for a rigid-
block on a rigid-base, and (ii) for the frame structure on nonlinearsoil. Extensive studies have been reported in the literature for the

F. Gelagoti et al. / Soil Dynamics and Earthquake Engineering 32 (2012) 87–102 95
first problem, which have resulted in rigorous analytical solu-tions; the investigation of the second class of problems will bemade employing numerical simulations.
6. Validation of the simplified (SDmax) approach for a rigidblock on rigid base
The issue of earthquake-induced rocking of rigid blocks on rigid
base has been studied very thoroughly over the last decades[7,32,35–38], revealing the sensitive and highly nonlinear natureof the problem. Most researchers (e.g. [16,39]) conclude that theoverturning (or toppling) of such structures is quite unpredictable– if not chaotic – even for idealized cycloidal pulses as excitation.Hence, attempting to accurately quantify the toppling potential ofa seismic motion (for a given rigid block) utilizing the simplifiedSDmax criterion would be overly optimistic. Instead, the presentstudy attempts to validate SDmax as a conservative upper-bound ofearthquake displacement demand ddem, for which toppling willnot take place, for a rigid block on rigid base subjected to:(a) cycloidal (sine and cosine) pulses, and (b) Ricker wavelets.
6.1. Rigid block subjected to sine and cosine pulses
A rigid block of width B¼2b and height H¼2h (Fig. 8) ischaracterized by its slenderness ratio a¼tan�1(b/h) and thefrequency parameter p
p¼ffiffiffiffiffiffiffiffiffiffiffiffiffiffi3g=4R
pð4Þ
Notice that the latter can be seen as a measure of the dynamiccharacteristics of the block and decreases with the size of the
aRicker pulse
(fE, a )t
R
fE (Hz)
0
1
2
3
4
Medium–size block : Electrical Transformer
Overturning Area
p = 3.14 rad/s
α = 0.25 rad
0 0.5 1 1.5 2 2.5 3
(g)
Fig. 10. Comparison of the simplified method (based on SDmax) with the numerical solu
Ricker pulses. Toppling acceleration ap as a function of excitation frequency fE for: (a) a
block (electrical transformer) of p¼3.14 rad/s and a¼0.25 rad, and (c) a large-size blo
block. Zhang and Makris [39] investigated analytically the tran-sient rocking response of free-standing rigid blocks subjected totrigonometric (sine and cosine pulses) base excitation. Theyconcluded that under one-cycle cycloidal excitation the blockmay topple either after one impact (mode 1), or without impact(mode 2), while a surprising ‘‘safe region’’ exists between the twomodes. These rigorous analytical results are used herein as ayardstick to ensure that the SDmax approach is indeed capable ofproducing reasonable-conservative estimates.
Two example problems are studied: a ‘‘large’’ block of p¼2.0 rad/sand a¼0.35 rad, and a ‘‘small’’ block of p¼2.14 rad/s and a¼0.25 rad.Both are subjected to one-cycle sine and cosine pulses of amplitude a
and cyclic frequencyop. The acceleration amplitude required to causeoverturning of the block is defined as the toppling acceleration ap.Fig. 9 compares the simplified SDmax approach with the analyticalsolution of Zhang and Makris [39]. The non-dimensional topplingacceleration ap/ag is plotted as a function of normalized excitationfrequency op/p for a sine (left column) and a cosine pulse (rightcolumn). The shaded areas in Fig. 9a and b depict the overturningareas of the two rigid blocks. Evidently, the non-dimensional topplingacceleration ap/ag increases exponentially with op/p, which meansthat it increases with both increasing excitation frequency and
increasing size of the block ð1=ppffiffiffiRpÞ. The simplified approach is
employed to compute the pulse acceleration amplitude (ap)SD
required to produce a displacement spectrum with SDmax equal tothe toppling displacement dult of each block: dult¼40 cm for the largeblock (p¼2.0 rad/s); dult¼63 cm for the smaller one (p¼2.14 rad/s).By no means should this be viewed as an attempt of capturing thedetailed complex response. For the sine pulse, the simplified approachprovides a conservative estimate of ap for the whole frequency range.However, for the cosine pulse it provides a conservative estimate for
Small–size block : Cemetery tomb
OverturningArea
p = 3.38 rad/s
α = 0.16 rad
0
1
2
3
4
Large–size block :
fE (Hz)
0
1
2
3
4
OverturningArea
p = 0.76 rad/s
α = 0.30 rad
Slender Building
0 0.5 1 1.5 2 2.5 3
Analytical solution
Approximate method
(g)
tion of Gerolymos et al. [28,38] for a rigid body rocking on a rigid base, excited by
small-size block (tombstone) of p¼3.38 rad/s and a¼0.16 rad, (b) a medium-size
ck (slender building) of p¼0.76 rad/s and a¼0.30 rad.

Plastic hinges fully developed
�
F. Gelagoti et al. / Soil Dynamics and Earthquake Engineering 32 (2012) 87–10296
lower and higher values of the frequency ratio (op/pr1.8 andop/pZ4.3), becoming marginally unconservative for intermediatefrequencies (1.8oop/po4.3). But this latter ‘‘unsafe area’’ is ofnegligible practical significance for the systems under consideration:for low rise frames p ranges between 0.6opo1, and consequentlythe ratio op/p is always greater than 4 for pulse periods Tpo1.6 s(i.e., almost the complete earthquake period range).
Μ (k
Nm
)
40
60
80
Right Footing
Left Footing
Localized Soil plastification
Β = 1.1m
6.2. Rigid block subjected to Ricker pulses
Although the preceding analysis has yielded encouragingresults, the simplified SDmax approach needs to be further vali-dated against more realistic – yet still idealized – pulses. To thisend, SDmax predictions are compared to rigorous numerical analy-sis results, referring to the overturning of rigid blocks subjected toRicker pulses. Gerolymos et al. [38], based on validated numericalanalysis results, employed artificial neural networks to deriveclosed-form analytical expressions for predicting the overturningacceleration ap, as a function of rigid block geometry (a and p) andexcitation frequency fE for three example problems: (i) a small-size block of a¼0.16 rad and p¼3.38 rad/s, simulating a cemetery
tomb; (ii) a medium-size block of a¼0.25 rad and p¼3.14 rad/s,simulating an electrical transformer; and (iii) a large-size block ofa¼0.30 rad and p¼0.76 rad/s, simulating a slender building.
Fig. 10 depicts the comparison of the simplified SDmax-basedprediction with the more rigorous solution of Gerolymos et al.[38], in terms of toppling acceleration ap as a function ofexcitation frequency fE of the Ricker pulse (the shaded areasrepresent the overturning regions of the three rigid blocks,according to the rigorous solution). Interestingly, for these morerealistic ground motions, increasing the block size increases theconservatism of the simplified SDmax-based method, in accordwith our previous observation.
0
20
0 0.05 0.1 0.15 0.2
ult = 0.143frame
(rad)
Fig. 11. Static pushover analysis of the example frame with B¼1.1 m footings:
(a) deformed mesh with superimposed plastic strain contours, just before toppling
collapse; and (b) M–y response of the two frame footings. The moment capacity
and the ultimate rotation yult of the two frame footings are affected by the
fluctuation of the axial load N and the M/Q ratio.
7. Validation of the simplified approach for the 2-storeyframe on inelastic soil
In the previous sections, the SDmax approach was validated forrigid blocks on a rigid base, subjected to idealized pulses. Thissection further verifies the effectiveness of the simplifiedapproach for the actual problem: the 2-storey frame founded onnonlinear soil, subjected to Ricker pulses and real seismic records.
The analysis is conducted for the same example frame foundedon B¼1.1 m footings (Fig. 11a): the minimum footing dimensionthat satisfies the criterion of FSv43 (for static loads). Based on theM–y response of the two frame footings (Fig. 11b), the topplingrotation is yframe
ult ¼ 0:143rad, corresponding to dtopl¼71 cm (at thecenter of mass of the frame). Note that according to the rigid-block approximation dtopl¼55 cm (due to the previously dis-cussed assumption of Mres¼0 at beam plastic hinges).
Therefore, according to the simplified approach any motionwith SDmaxodtopl should not provoke toppling of the frame.Hence, the validation of the simplified approach will consist ofshaking the frame (at the base of the FE model) with seismicexcitations (Ricker wavelets and real records), appropriatelyscaled (in amplitude) so that their SDmax is marginally lower thanthe toppling displacement dtopl of the frame (e.g., SD�¼0.9dtopl).[Note that for the considered stiff soil profile, the 1-d soilamplification is negligible].
In an attempt to further investigate the safety margins pro-vided by the SDmax approach, the applied seismic excitations aresubsequently also scaled to SDmax¼1.1dtopl (¼78 cm), denotedhereafter SDþ .
7.1. Ricker pulses
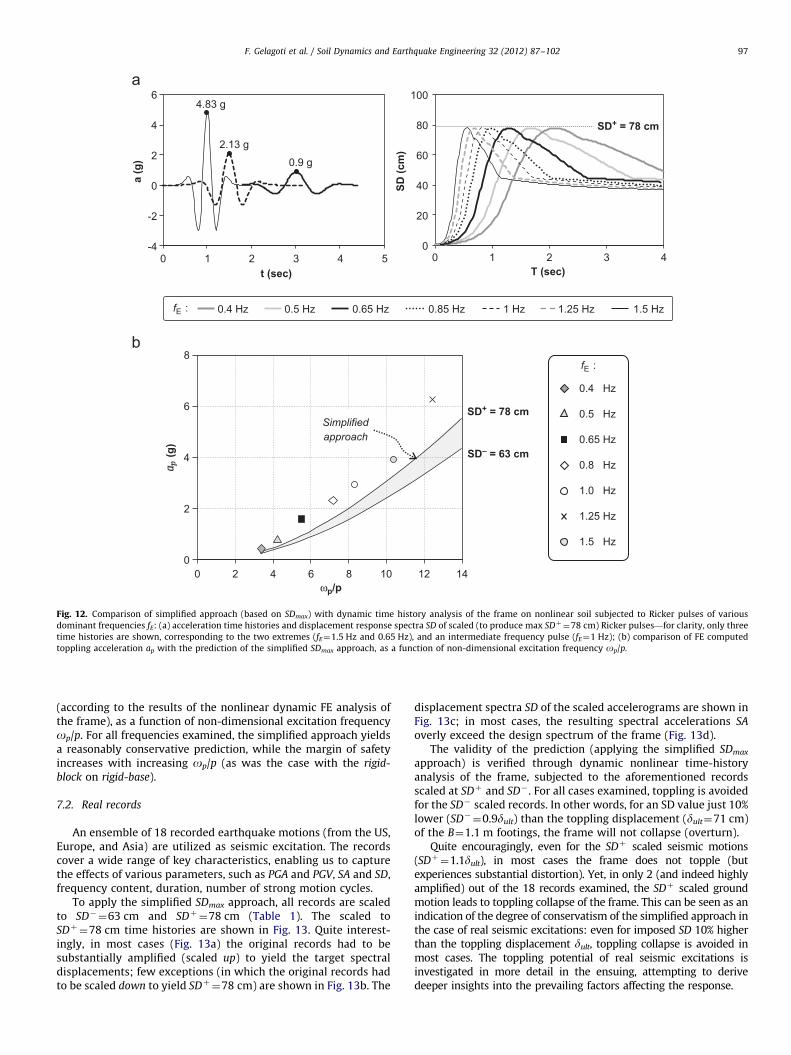
Ricker pulses of seven different characteristic frequencies,fE¼0.4, 0.5, 0.65, 0.85, 1.0, 1.25, and 1.5 Hz, are utilized. All pulsesare scaled so that their SDmax is equal to SDþ or SD� (Fig. 12a).Hence, their scaled (to yield SDmax) acceleration amplitude is thepredicted toppling acceleration (ap)SD of the system, according thesimplified method.
The validity of this prediction is verified through nonlineardynamic FE time-history analysis of the frame, subjected to theseven Ricker pulses, progressively increasing their amplitude untilcollapse (i.e., toppling of the frame). The minimum accelerationamplitude of each motion, which provokes (toppling) collapseconstitutes the ‘‘actual’’ (rigorously computed) toppling accelera-tion ap. Fig. 12b compares the predicted (ap)SD toppling accelera-tion (applying the simplified SDmax approach) to the actual ap
0
2
4
6
8
0 2 4 6 8 10 12 14
ωp/p
Simplified approach
SD+ = 78 cm
SD– = 63 cm
0.4 Hz
0.5 Hz
0.65 Hz
0.8 Hz
1.0 Hz
1.25 Hz
1.5 Hz
0
20
40
60
80
100
0 1 2 3 4
t (sec)
a (g
)
SD (c
m)
SD+ = 78 cm
T (sec)
4.83 g
-4
-2
0
2
4
6
0 1 2 3 4 5
2.13 g
0.9 g
0.5 Hz 0.65 Hz 0.85 Hz0.4 Hz 1 Hz 1.25 Hz 1.5 HzfE :
fE :
(g)
Fig. 12. Comparison of simplified approach (based on SDmax) with dynamic time history analysis of the frame on nonlinear soil subjected to Ricker pulses of various
dominant frequencies fE: (a) acceleration time histories and displacement response spectra SD of scaled (to produce max SDþ¼78 cm) Ricker pulses—for clarity, only three
time histories are shown, corresponding to the two extremes (fE¼1.5 Hz and 0.65 Hz), and an intermediate frequency pulse (fE¼1 Hz); (b) comparison of FE computed
toppling acceleration ap with the prediction of the simplified SDmax approach, as a function of non-dimensional excitation frequency op/p.
F. Gelagoti et al. / Soil Dynamics and Earthquake Engineering 32 (2012) 87–102 97
(according to the results of the nonlinear dynamic FE analysis ofthe frame), as a function of non-dimensional excitation frequencyop/p. For all frequencies examined, the simplified approach yieldsa reasonably conservative prediction, while the margin of safetyincreases with increasing op/p (as was the case with the rigid-block on rigid-base).
7.2. Real records
An ensemble of 18 recorded earthquake motions (from the US,Europe, and Asia) are utilized as seismic excitation. The recordscover a wide range of key characteristics, enabling us to capturethe effects of various parameters, such as PGA and PGV, SA and SD,frequency content, duration, number of strong motion cycles.
To apply the simplified SDmax approach, all records are scaledto SD�¼63 cm and SDþ¼78 cm (Table 1). The scaled toSDþ¼78 cm time histories are shown in Fig. 13. Quite interest-ingly, in most cases (Fig. 13a) the original records had to besubstantially amplified (scaled up) to yield the target spectraldisplacements; few exceptions (in which the original records hadto be scaled down to yield SDþ¼78 cm) are shown in Fig. 13b. The
displacement spectra SD of the scaled accelerograms are shown inFig. 13c; in most cases, the resulting spectral accelerations SA
overly exceed the design spectrum of the frame (Fig. 13d).The validity of the prediction (applying the simplified SDmax
approach) is verified through dynamic nonlinear time-historyanalysis of the frame, subjected to the aforementioned recordsscaled at SDþ and SD�. For all cases examined, toppling is avoidedfor the SD� scaled records. In other words, for an SD value just 10%lower (SD�¼0.9dult) than the toppling displacement (dult¼71 cm)of the B¼1.1 m footings, the frame will not collapse (overturn).
Quite encouragingly, even for the SDþ scaled seismic motions(SDþ¼1.1dult), in most cases the frame does not topple (butexperiences substantial distortion). Yet, in only 2 (and indeed highlyamplified) out of the 18 records examined, the SDþ scaled groundmotion leads to toppling collapse of the frame. This can be seen as anindication of the degree of conservatism of the simplified approach inthe case of real seismic excitations: even for imposed SD 10% higherthan the toppling displacement dult, toppling collapse is avoided inmost cases. The toppling potential of real seismic excitations isinvestigated in more detail in the ensuing, attempting to derivedeeper insights into the prevailing factors affecting the response.

Table 1Scale factors applied to each record to achieve the required peak spectral displacement SD, and summary of analysis results (toppling or not).
Record Earthquake Original PGA (g) For SD2563 cm For SD1578 cm
Scale factor Scaled PGA (g) Toppling Scale factor Scaled PGA (g) Toppling
Treasure-Island Loma Prieta, 1989 0.08 5.47 0.44 NO 7 0.56 NO
Kalamata O.T.E Kalamata, Greece, 1986 0.25 3.5 0.88 NO 4.48 1.12 NO
ElCentro000 ElCentro, 1940 0.31 2.35 0.73 NO 3 0.93 NO
GIC090 San Sanvaldor, 1986 0.69 1.99 1.38 NO 2.55 1.76 YES
Lucerne000 Landers, 1992 0.68 1.7 1.16 NO 2.18 1.48 NO
Izmit Kocaeli, 1999 0.22 1.42 0.31 NO 1.82 0.4 NO
JMA000 Kobe, 1995 0.82 1.34 1.09 NO 1.71 1.4 YES
Duzce-Bolu000 Duzce, 1999 0.73 1.22 0.89 NO 1.56 1.14 NO
Erzincan-ew Erzincan, 1992 0.49 1.09 0.53 NO 1.39 0.68 NO
Rinaldi218 Northridge, 1994 0.83 1.02 0.84 NO 1.3 1.08 NO
Sylmar Olive view-090 Northridge, 1994 0.6 1.02 0.61 NO 1.3 0.78 NO
Jensen Filtration Plant-292 Northridge, 1994 0.59 0.8 0.47 NO 1.02 0.6 NO
Pacoima Dam254 San Fernado, 1971 1.22 0.78 0.95 NO 1 1.22 NO
Takatori000 Kobe, 1995 0.61 0.53 0.32 NO 0.67 0.41 NO
Tabas-LN Iran, 1978 0.84 0.47 0.39 NO 0.6 0.5 NO
Duzce000 Duzce, 1999 0.35 0.42 0.15 NO 0.54 0.19 NO
Lucerne275 Landers, 1992 0.7 0.38 0.27 NO 0.49 0.34 NO
Duzce270 Duzce, 1999 0.54 0.38 0.2 NO 0.48 0.26 NO
0
20
40
60
80
100
0 2 4 6 80
2
4
6
8
0 0.5 1 1.5 2 2.5
1.08 g
1.40 g
Rinaldi218scaled+ JMA000scaled+
Tr. Islandscaled+
0.56g
Kalamatascaled+
1.12g
El Centro000scaled+
0.94g1.31g
Pacoima Dam254scaled+ Lucerne000scaled+
Duzce270scaled-0.26g
0.18g
Duzce180scaled-
0.34g
Lucerne275scaled-
Duzce-Bolu000scaled+
1.15g
Erzincanscaled+
0.68g
Izmitscaled+0.40g Sylmarscaled+0.79g
San Salvadorscaled+
1.76g
Tabasscaled-0.50g
Jensen292scaled+
0.6g
1.48g
SD (c
m)
SD+ = 78 cm
SA (g
)
2.0
1.0
0
-1.0
-2.0
a (g
)
0 5 10 15 20 25 30
t (sec)
Takatoriscaled-0.41g
Lucerne000
JMA000
San Salvador
Ricker1
T (sec)T (sec)
Fig. 13. Real records of devastating earthquakes, used as seismic excitation for the dynamic analysis of the rocking-isolated frame: (a) scaled up (in most cases) to achieve
SDþ¼78 cm, or (b) scaled down to achieve SDþ¼78 cm; (c) corresponding displacement response spectra, and (d) acceleration response spectra of the scaled seismic
motions—four ground motions are distinguished and are further discussed.
F. Gelagoti et al. / Soil Dynamics and Earthquake Engineering 32 (2012) 87–10298
F. Gelagoti et al. / Soil Dynamics and Earthquake Engineering 32 (2012) 87–102 99
8. Insight on ground motion toppling potential
A number of factors affect the toppling potential of a seismicmotion while, naturally, PGA alone is not an adequate descriptor(e.g. [16,32]). Aiming to better quantify the toppling potential of aground motion, a destructiveness measure is defined, termedhereafter cumulative impact pulse velocity
Vimp,max ¼max9Vimp9¼max
Z ttot
0ða�ayieldÞdt
�������� ð5Þ
where ttot is the total duration of the ground motion and a theacceleration of the seismic motion; ayield is defined as the mini-mum acceleration that provokes uplifting when applied pseudo-statically, and can be computed as follows:
ayield ¼ ðSAÞDMfooting
ult
MCRD
ð6Þ
where (SA)D is the design spectral acceleration of the frame,Mfooting
ult the overturning moment capacity of the footing, andMC
RD the bending moment capacity of the corresponding column.The role of the aforementioned parameters and the effectivenessof Vimp,max is investigated in the sequel for the example problem ofthe frame founded on B¼1.1 m footings on nonlinear soil, withayield¼0.15 g.
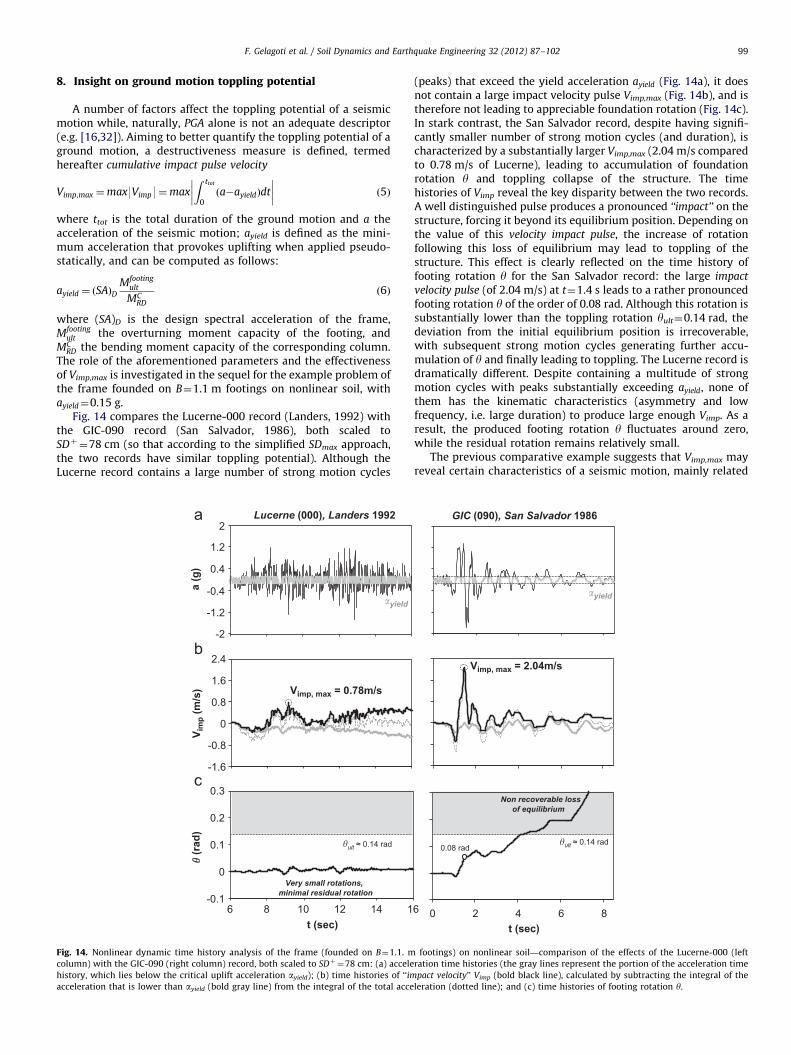
Fig. 14 compares the Lucerne-000 record (Landers, 1992) withthe GIC-090 record (San Salvador, 1986), both scaled toSDþ¼78 cm (so that according to the simplified SDmax approach,the two records have similar toppling potential). Although theLucerne record contains a large number of strong motion cycles
-1.6
-0.8
0
0.8
1.6
2.4
Lucerne (000), Landers 1992
t (sec)
a (g
) (r
ad)
V im
p (m
/s) Vimp, max = 0.78m/s
�yield
-0.1
0
0.1
0.2
0.3
6 8 10 12 14 1
Very small rotations, minimal residual rotation
2
1.2
0.4
-0.4
-1.2
-2
ult ≈ 0.14 rad
Fig. 14. Nonlinear dynamic time history analysis of the frame (founded on B¼1.1. m
column) with the GIC-090 (right column) record, both scaled to SDþ¼78 cm: (a) accele
history, which lies below the critical uplift acceleration ayield); (b) time histories of ‘‘im
acceleration that is lower than ayield (bold gray line) from the integral of the total acce
(peaks) that exceed the yield acceleration ayield (Fig. 14a), it doesnot contain a large impact velocity pulse Vimp,max (Fig. 14b), and istherefore not leading to appreciable foundation rotation (Fig. 14c).In stark contrast, the San Salvador record, despite having signifi-cantly smaller number of strong motion cycles (and duration), ischaracterized by a substantially larger Vimp,max (2.04 m/s comparedto 0.78 m/s of Lucerne), leading to accumulation of foundationrotation y and toppling collapse of the structure. The timehistories of Vimp reveal the key disparity between the two records.A well distinguished pulse produces a pronounced ‘‘impact’’ on thestructure, forcing it beyond its equilibrium position. Depending onthe value of this velocity impact pulse, the increase of rotationfollowing this loss of equilibrium may lead to toppling of thestructure. This effect is clearly reflected on the time history offooting rotation y for the San Salvador record: the large impact
velocity pulse (of 2.04 m/s) at t¼1.4 s leads to a rather pronouncedfooting rotation y of the order of 0.08 rad. Although this rotation issubstantially lower than the toppling rotation yult¼0.14 rad, thedeviation from the initial equilibrium position is irrecoverable,with subsequent strong motion cycles generating further accu-mulation of y and finally leading to toppling. The Lucerne record isdramatically different. Despite containing a multitude of strongmotion cycles with peaks substantially exceeding ayield, none ofthem has the kinematic characteristics (asymmetry and lowfrequency, i.e. large duration) to produce large enough Vimp. As aresult, the produced footing rotation y fluctuates around zero,while the residual rotation remains relatively small.
The previous comparative example suggests that Vimp,max mayreveal certain characteristics of a seismic motion, mainly related
0 2 4 6 8
GIC (090), San Salvador 1986
ult ≈ 0.14 rad
Non recoverable loss of equilibrium
6
t (sec)
Vimp, max = 2.04m/s
�yield
0.08 rad
footings) on nonlinear soil—comparison of the effects of the Lucerne-000 (left
ration time histories (the gray lines represent the portion of the acceleration time
pact velocity’’ Vimp (bold black line), calculated by subtracting the integral of the
leration (dotted line); and (c) time histories of footing rotation y.

0
1
2
3
0 0.5 1 1.5 2 2.5 3
SA (g
)
T (sec)
-1.2
-0.8
-0.4
0
0.4
0.8
3 5 7 9 11 13 15
t (sec)
JMA
Ricker, fE = 1 Hz
a (g
)
Fig. 15. Comparison of the JMA(000) record with a Ricker 1 (i.e., fE¼1 Hz) pulse,
scaled to match the PGA of the record: (a) acceleration time histories, and
(b) elastic acceleration response spectra SA.
-1.6
-0.8
0
0.8
�yield
1.87m/s
-0.4
-0.3
-0.2
-0.1
0
0.1
5 10 15 20
Non recoverable lossof equilibrium
JMA (000), Kobe 1995
a (g
) (r
ad)
V im
p (m
/s)
t (sec)25
25
25
1.6
-2.4
-1.6
-0.8
0
0.8
1.6
ult ≈ 0.14 rad
Fig. 16. Nonlinear dynamic time history analysis of the frame (founded on B¼1.1. m
column) with the Ricker 1 pulse (right column), both scaled to SDþ¼78 cm: (a) accele
history, which lies below the critical uplift acceleration ayield); (b) time histories of ‘‘i
acceleration (dotted line) minus the acceleration that is lower than ayield (bold gray lin
F. Gelagoti et al. / Soil Dynamics and Earthquake Engineering 32 (2012) 87–102100
to the existence of impact velocity pulses. However, as it will beshown in the sequel through a different example, Vimp,max alone isnot sufficient to describe the toppling potential of a strongmotion. For this purpose, the JMA-000 record (Kobe, 1995) iscompared with a Ricker 1 pulse (i.e., fE¼1 Hz). As shown inFig. 15a, the Ricker 1 pulse (scaled with respect to PGA) matchesquite well with the prevailing strong motion pulse of the JMArecord. Quite interestingly, the two motions also match very wellin terms of acceleration response spectra (Fig. 15b), despite theobvious differences of their time histories (the JMA recordcontains a substantial number of strong motion cycles, and muchlarger duration).
In the context of the simplified SDmax approach, the two groundmotions are scaled to SDþ¼78 cm. As shown in Fig. 16a, Ricker1 needs larger PGA (2.2 g) to achieve the same SD with the JMArecord (1.4 g). Despite ‘‘containing’’ a substantially larger impact
pulse velocity Vimp,max¼2.1 m/s (Fig. 16b), than the scaled JMArecord (of Vimp,max¼1.87 m/s), Ricker 1 is clearly inadequate toprovoke toppling collapse of the structure. As shown in Fig. 16c,the first pulse of Ricker 1 generates rotation y of the order of0.09 rad, which is recovered, however, during the next(of opposite direction) cycle of motion. Due to the lack ofsubsequent strong motion pulses, the loss of equilibrium doesnot culminate with toppling. Dramatically different is theobserved system response for the JMA record. While its prevailingstrong motion cycle (at t¼8 s) generates footing rotationy of similar magnitude to Ricker 1, its subsequent strongmotion cycles (which also exceed ayield) produce gradual accumu-lation of y, ultimately resulting to toppling collapse of the frame.This implies that the number of strong motion cycles that exceedayield also plays role in the toppling potential of a seismic motion.
The preceding discussion focused on the safety margins providedby the simplified SDmax approach. For this purpose, all seismicmotions were scaled to a specific value of SDmax (SDþ¼1.1dult).
-2.4
-1.6
-0.8
0
0.8
1.6
2.1m/s
-0.4
-0.3
-0.2
-0.1
0
0.1
1 2 3
Significant residual rotationbut no toppling
Ricker 1 pulse
t (sec)4
4
4
2.4
-1.6
-0.8
0
0.8
1.6
2.4
�yield
0.09 rad
ult ≈ 0.14 rad
footings) on nonlinear soil—comparison of the effects of the JMA-000 record (left
ration time histories (the gray lines represent the portion of the acceleration time
mpact velocity’’ Vimp (bold black line), calculated as the time integral of the total
e); and (c) time histories of footing rotation y.

F. Gelagoti et al. / Soil Dynamics and Earthquake Engineering 32 (2012) 87–102 101
Yet, to achieve SDþ some of the records had to be un-realisticallyscaled by factors as high as 7 (Table 1). In reality, however, suchtremendous seismic motions (e.g. the devastating JMA record scaled-up at 1.4 g) have never been recorded and cannot possibly beconsidered realistic, especially for design purposes. Fig. 17a depictsthe original displacement spectra of all ground motions examined,aiming to reveal their real toppling potential. Observe that despitethe fact that all ground motions have been recorded duringdevastating seismic events, in most cases their SDmax lies well belowthe toppling displacement dult¼71 cm of the B¼1.1 m footings. Infact, only three records (Takatori-000, Jensen-292, and Tabas)
SD (c
m)
T (sec)
0
40
80
120
160
�ult = 71cm
Takatori (000)
Tabas
Jensen (292)
0
200
400
600
0 2 4 6 8
TCU068 (NS)
Düzce (270)
TCU068 (EW)
Düzce (180)
800
SD (c
m)
Fig. 17. Displacement response spectra of the original records used for the
analyses: (a) ‘‘normal’’ devastating records, in many cases characterized by
forward rupture directivity effects—only in three cases (Takatori-000, Tabas,
Jensen-292) SDmax4dult; (b) ‘‘special cases’’ of near-source motions characterized
by fling-step effects.
�yield
a (g
)
t (sec)
-0.4
-0.2
0
0.2
0.4
0 5 10 15 20 25
(rad
)
Fig. 18. Nonlinear dynamic time history analysis of the frame subjected to seismic exci
history (the gray-shaded line represents the portion of the acceleration time history, wh
exceeds ayield; (b) time history of footing rotation y.
exceed dult and had to be scaled-down. This observation is ofparticular importance, since it implies that toppling can be quiteimprobable for real seismic motions, even in case of occurrence ofextremely strong earthquakes (such as the ones deliberately selectedfor analysis), and even for extremely under-designed footings(B¼1.1 m).
8.1. The paradox of the Chi-Chi record
Although the selected records cover a wide range of seismicmotions, none of them is characterized by fling-step effects—adifferent category of near-source effects, associated with largepermanent displacement rather than a large velocity pulse. Asshown in the examples of Fig. 17b, such ground motions arecharacterized by excessively large spectral displacements. Forexample, the TCU-068 records (Chi–Chi, Taiwan 1999) yield SDmax
of the order of several meters, i.e. almost an order of magnitudelarger than dult. With such large SDmax, according to the simplifiedmethod the structure would easily be lead to toppling collapse. Tounravel the response of the system when subjected to this specialcategory of near-source seismic motions, additional analyses areconducted utilizing the original records of Fig. 17b (withoutscaling). Quite remarkably, even for the very extreme case of theTCU-068(NS) record (Fig. 18a), the footing experiences almostnegligible rotation y (Fig. 18b), and the structure is not lead totoppling collapse.
As paradox as this may appear, it is explainable on the basis ofthe acceleration time history. Despite the large SDmax, the yieldacceleration ayield is only slightly exceeded, and not for a longduration. This implies that the long-period (almost quasi-static)component of the seismic motion, which is responsible for theexcessive SDmax, is not really exceeding ayield and, therefore,cannot lead to toppling. As clearly seen in Fig. 18a, the accelera-tion pulses that do exceed ayield are of much higher frequency, andare not associated with the excessively large SDmax of the record.This example reveals the notable conservatism of the simplifiedapproach, for such special cases of near source seismic motionscharacterized by fling-step effects.
9. Summary and conclusions
In the present study nonlinear FE modeling was employed tostudy the seismic performance of rocking-isolated frame struc-tures. After investigating the margins of safety of such systemsagainst toppling collapse, a first attempt was made to develop asimplified procedure to estimate the minimum acceptable footingwidth Bmin. It was shown that adequate margins of safety againsttoppling collapse may be achieved, if the toppling displacement
-0.06
-0.04
-0.02
0
0.02
0 5 10 15 20 25
t (sec)
tation with the TCU-068 (NS) record (Chi–Chi, Taiwan 1999): (a) acceleration time
ich lies below the yield acceleration ayield—only a very small portion of the record

F. Gelagoti et al. / Soil Dynamics and Earthquake Engineering 32 (2012) 87–102102
capacity of the frame dtopl is sufficiently larger than the seismicdisplacement demand ddem.
With respect to the capacity, the use of an appropriate‘‘equivalent’’ rigid-body is suggested, and shown to yield a con-servative estimate of dtopl (which is under-estimated by roughly30% for the frame structure examined herein). This conservatismstems from the inherent assumptions of the simplified approach,according to which the residual (i.e., for c4cult) bending momentMres of RC members is completely ignored. In this study, Mres wasreasonably assumed [30] to be of the order of 30% of thecorresponding bending moment capacity, which means that thehinged beams will keep contributing a limited amount of restor-ing moment.
The demand is estimated on the basis of the displacementspectrum, and the peak spectral displacement SDmax is proposedas a conservative measure of ddem. The validity and limitations ofsuch approximation were investigated: (a) for a rigid-block onrigid-base, utilizing rigorous analytical solutions from the biblio-graphy, and (b) for the frame structure on nonlinear soil, byconducting nonlinear dynamic time history analyses. In all casesexamined, the simplified SDmax approach was shown to yieldreasonably conservative estimates of the toppling acceleration ap.In fact, even for imposed SDmax 10% higher than the topplingdisplacement dult, toppling collapse was avoided in most cases(the frame toppled in only 2 out of the 18 seismic excitations).This can be seen as an indication of the degree of conservatism ofthe simplified SDmax approach, for real seismic excitations.
In an attempt to gain further insight on the toppling potential ofreal ground motions, a destructiveness index was defined, termedhereafter maximum impact pulse velocity Vimp,max (see Eq. (4)). Itwas shown that the toppling potential is a function not only of theimposed PGA or SDmax , but also of Vimp,max and the number ofstrong motion cycles for which the yield acceleration of thesystem ayield (see Eq. (5)) is exceeded.
Acknowledgement
The financial support for this paper has been provided underthe research project ‘‘DARE’’, which is funded through the Eur-opean Research Council’s (ERC) ‘‘IDEAS’’ Program, in Support ofFrontier Research–Advanced Grant, under Contract/number ERC–2–9–AdG228254–DARE.
References
[1] NEHRP. NEHRP recommended provisions for seismic regulations for newbuildings and other structures, part 1, provisions, FEMA 368. Washington,DC: Federal Emergency Management Agency; 2000.
[2] Paolucci R, Pecker A. Seismic bearing capacity of shallow strip foundation ondry soils. Soils and Foundations 1997;37(3):95–105.
[3] Pecker A. Capacity design principles for shallow foundations in seismic areas.In: Proceedings of the 11th European Conference on Earthquake Engineering.A.A. Balkema Publishing; 1998.
[4] Pecker A. Aseismic foundation design process, lessons learned from twomajor projects: the Vasco de Gama and the Rion Antirion bridges. In:Proceedings of the ACI International Conference on Seismic Bridge Designand Retrofit. University of California at San Diego, La Jolla, USA; 2003.
[5] FEMA 356. Prestandard and commentary for the seismic rehabilitation ofbuildings. 2000.
[6] Gazetas G, Apostolou M, Anastasopoulos I. Seismic uplifting of foundationson soft soil, with examples from Adapazari (Izmit 1999, Earthquake).In: Proceedings of the BGA International Conference on Found Innov,Observations, Design and Practice, Dundee, Scotland; September 25, 2003.p. 37–50.
[7] Psycharis I, Jennings P. Rocking of slender rigid bodies allowed to uplift.Earthquake Engineering and Structural Dynamics 1983;11:57–76.
[8] Yim CS, Chopra AK. Earthquake response of structures with partial uplift onWinkler foundation. Earthquake Engineering and Structural Dynamics 1984;12:263–81.
[9] Martin GR, Lam IP. Earthquake resistant design of foundations: retrofit ofexisting foundations. In: Proceedings of the GeoEng 2000 Conference,Melbourne; 2000.
[10] Pecker A, Pender MJ. Earthquake resistant design of foundations: newconstruction, invited paper. GeoEng 2000;1:313–32.
[11] Faccioli E, Paolucci R, Vivero G. Investigation of seismic soil–footing interac-tion by large scale cyclic tests and analytical models. In: Proceedingsof the 4th International Conference on Recent Advances in GeotechnicalEarthquake Engineering and Soil Dynamics, Paper no. SPL-5, San Diego,California; 2001.
[12] Kutter BL, Martin G, Hutchinson TC, Harden C, Gajan S, Phalen JD. Status reporton study of modeling of nonlinear cyclic load–deformation behavior of shallowfoundations, University of California, Davis, PEER Workshop; March 2003.
[13] Harden C, Hutchinson T. Investigation into the effects of foundation uplift onsimplified seismic design procedures. Earthquake Spectra 2006;22(3):663–92.
[14] Gajan S, Kutter BL. Capacity, settlement, and energy dissipation of shallowfootings subjected to rocking. Journal of Geotechnical and GeoenvironmentalEngineering, ASCE 2008;134(8):1129–41.
[15] Kawashima K, Nagai T, Sakellaraki D. Rocking seismic isolation of bridgessupported by spread foundations. In: Proceedings of the 2nd Japan–GreeceWorkshop on Seismic Design, Observation, and Retrofit of Foundations,Tokyo, Japan; April 3–4 2007. p. 254–65.
[16] Apostolou M, Gazetas G, Garini E. Seismic response of slender rigid structureswith foundation uplifting. Soil Dynamics and Earthquake Engineering 2007;27(7):642–54.
[17] Paolucci R, Shirato M, Yilmaz MT. Seismic behaviour of shallow foundations:shaking table experiments vs numerical modelling. Earthquake Engineeringand Structural Dynamics 2008;37:577–95.
[18] Chatzigogos CT, Pecker A, Salencon J. Macroelement modeling of shallowfoundations. Soil Dynamics and Earthquake Engineering 2009;29(6):765–81.
[19] Algie TB, Pender MJ, Orense RP, Wotherspoon LM. Dynamic field testing ofshallow foundations subject to rocking. In: Proceedings of the 2009 NZSEEConference, Christchurch, New Zealand; April 2009.
[20] Pender MJ, Algie TB, Wotherspoon LM, Davies MCR, Toh JCW. Earthquakeinduced residual displacements of shallow foundations. In: Proceedings ofthe 2009 NZSEE Conference, Christchurch, New Zealand; April 2009.
[21] Anastasopoulos I, Gazetas G, Loli M, Apostolou M, Gerolymos N. Soil Failurecan be used for earthquake protection of structures. Bulletin of EarthquakeEngineering 2010;8:309–26.
[22] Gelagoti F, Kourkoulis R, Anastasopoulos I, Gazetas G. Rocking isolation offrames founded on isolated footings. Journal of Earthquake Engineering andStructural Dynamics, accepted for publication.
[23] EC8. Design provisions for earthquake resistance of structures, part 5:foundations, retaining structures and geotechnical aspects, prEN. 1998–5European Committee for Standardization, Brussels; 2000.
[24] EAK. Greek seismic code, Organization of seismic planning and protection,Athens, Greece; 2000 [in Greek].
[25] Meyerhof GG. Some recent research on the bearing capacity of foundations.Canadian Geotechnical Journal 1963;1(1):6–26.
[26] Vesic AS. Analysis of ultimate loads of shallow foundations. Journal of SoilMechanics Foundation Division, ASCE 1973;1973(99):45–73.
[27] Anastasopoulos I, Gelagoti F, Kourkoulis R, Gazetas G, in press. Simplifiedconstitutive model for simulation of cyclic response of shallow foundations:validation against laboratory tests. Journal of Geotechnical and Geoenvir-onmetal Engineering—ASCE, doi:10.1061/(ASCE)GT.1943-5606.0000534.
[28] Gerolymos N, Gazetas G, Tazoh T. Seismic response of yielding pile in non-linear soil. In: Proceedings of the 1st Greece–Japan Workshop, SeismicDesign, Observation, and Retrofit of Foundations, Athens; 2005, 11–12October. p. 25–36.
[29] Imbsen & Associates, Inc. XTRACT—cross section analysis program forstructural engineer, Ver. 3.0.3, California; 2004.
[30] Vintzileou E, Tassios TP, Chronopoulos M. Experimental validation of seismiccode provisions for RC columns. Engineering Structures 2007;29:1153–64.
[31] Bielak J. Base moment for a class of linear Systems. Journal of the EngineeringMechanics Division 1969;95.
[32] Makris N, Roussos Y. Rocking response of rigid blocks under near sourceground motions. Geotechnique 2000;50(3):243–62.
[33] Priestley MJN, Evison RJ, Carr AJ. Seismic response of structures free to rockon their foundations. Bulletin of the New Zealand National Society forEarthquake Engineering 1978;11(3):141–50.
[34] Makris N, Konstantinidis D. The rocking spectrum and the limitations ofpractical design methodologies. Earthquake Engineering and StructuralDynamics 2003;32(2):265–89.
[35] Housner GW. The behavior of inverted pendulum structures during earth-quakes. Bulletin of the Seismological Society of America 1963;53(2):404–17.
[36] Ishiyama Y. Review and discussion on overturning of bodies by earthquakemotions. Building Research Institute, Research paper 85, Ministry of Con-struction, Japan; 1980.
[37] Koh AS, Spanos P, Roesset JM. Harmonic rocking of rigid block on flexiblefoundation. Journal of Engineering Mechanics, ASCE 1986;112(11):1165–80.
[38] Gerolymos N, Apostolou M, Gazetas G. Neural network analysis of over-turning response under near-fault type excitation. Earthquake Engineeringand Engineering Vibration 2005;4(2):213–28.
[39] Zhang J, Makris N. Rocking response of free-standing blocks under cycloidalpulses. Journal of Engineering Mechanics, ASCE 2001;127(5):473–83.