soil management for restoration and profit – improving ...smartagriplatform.com/resources/watts -...
TRANSCRIPT

Soil management for restoration and profit –
improving soil structure Chris Watts & Jackie Stroud
Rothamsted Research, Harpenden, Herts., AL5 2JQ
http://www.rothamsted.ac.uk/

1. Introduction. Roth & long-term experiments
2. Soil structure
3. Organic matter: Management and benefits
4 Organic amendments: FYM, Straw, (crop residues) AD, Compost
5 Soil strength and drying
6 Tillage
7 Yield potential, attainable yields & actual yields

1 Introduction. Roth & long-term experiments

Sir John Bennett Lawes
Sir Joseph Henry Gilbert
Earliest Rothamsted experiment started 1843

Rothamsted
Woburn

Rothamsted: (Batcombe soil series) A silty clay loam, c.25% clay over clay-with-flints, overlying chalk. Classed as a Chromic Luvisol (FAO) or Aquic Paleudalf (USDA)
Woburn (Cottenham soil series) approx 10 m west of
here also on Greensand ridge:
A sandy loam, c.10% clay overlying sand. Classed as Cambic Arenosol (FAO) or Typic Udipsamment (USDA)
Soil Textures

The climate is cool, temperate Average, annual rainfall (30 year mean) is:-
•Rothamsted: 733 mm
•Woburn: 652 mm
Average, annual mean air temperature is c.9.5oC
Weather

Broadbalk Winter Wheat experiment, started 1843
Hoosfield Spring Barley experiment, started 1852
Rothamsted LTEs

Woburn LTEs
Organic Manuring experiment, started 1964
Ley-Arable experiment, started 1938 – Also Rothamsted ley-arable experiments


Note on previous slide Note 170 years of experiment 1 Different fertilizer manure regimes 2 Management 1950’s liming; 1960’s herbicide, 1970’s crop rotations,
1980’s fungicides and growth regulators 3 Continuous evolution in wheats but giant leap early 1960s (green
revolution) short straw able to use higher rates of N 4 Note Yield plateau 1990 on except 2014. Why? Address this later. So far we have been unable to detect a clear benefit of enhanced SOM for wheat yields on Broadbalk, but with newer higher yielding varieties having greater demands for water nutrients perhaps this may change in future. In 2014 we achieved yields of over 13t/ha for a new winter wheat variety (Crusoe) grown on Broadbalk.


2 Soil structure

Importance of Soil Structure
• Soil structure is the arrangement of soil particles and of the pore spaces between them. It includes the size shape and arrangement of aggregates when primary particles are clustered together into larger separate units. (0.1µm clay particle to 10 cm clod).
• Hierarchical nature of soil structure
• Several different mechanisms and processes within the soil are involved in controlling structure: soil type, physical chemistry, organic matter
• Likewise, the structure influences the processes

Importance of Soil Structure
Soil structure has a significant influence on virtually all processes the occur within the soil. Some examples:
• Water infiltration – hence the amount of water that is stored in the soil, available to plants, runoff, erosion.
• Aeration – needed for root growth and other biological activity – organic matter turnover.
• Strength and stability – strong soils can impede root growth and are difficult to cultivate.
• Physical pore structure defines habitats for a range of biota.

Soil stability & resilience
There is little advantage to having a soil with an ideal geometrical structure if it does not persist
• Soil structural stability: Ability of structure to resist imposed stresses without change in its structural form.
• Examples of imposed stresses include: rapid wetting, contact with free water, raindrop impact, wheel traffic
• Cultivations are often designed to modify soil structure.
• Resilience the ability of soil structure to recover once stress has been removed.

Mobile Rainfall Simulator
• Mobile rainfall simulator designed to give a standard storm on 1 m2;
• raindrop size (D50 = 1.7 mm), travelling at the correct speed 7.5 m/s.
• Adjustable intensity 12 mm/h to 100+ mm/h
• Energy 20 J/m2 at intensity of 47 mm/h @ 1 year return period for 10 min duration.
• Note colour of runoff. Suspended sediment

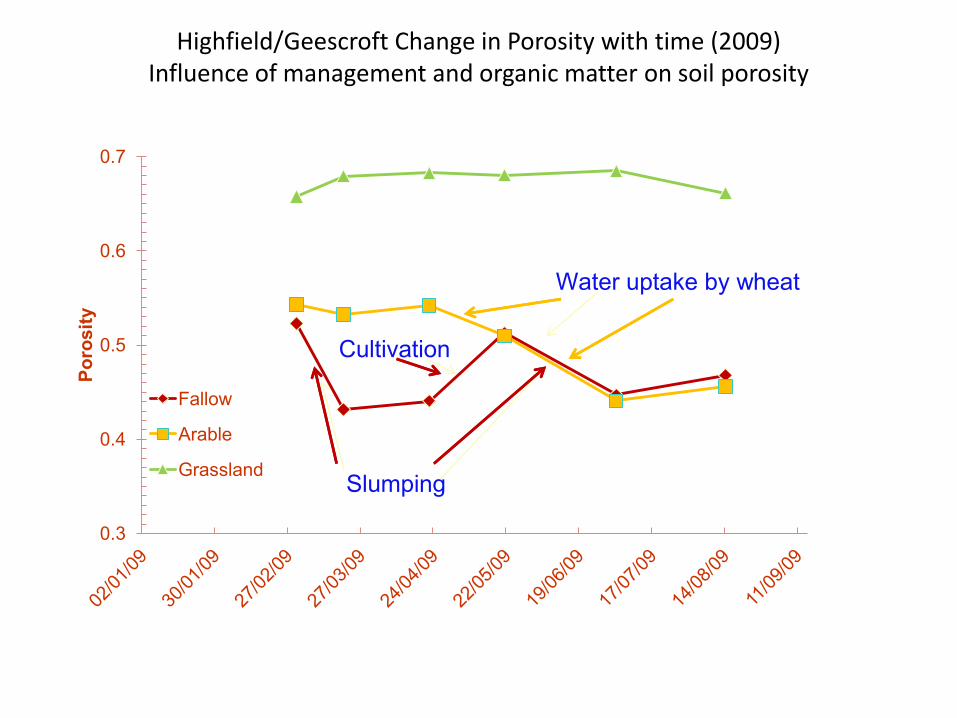
Highfield/Geescroft Change in Porosity with time (2009) Influence of management and organic matter on soil porosity
0.3
0.4
0.5
0.6
0.7
Po
ros
ity
Fallow
Arable
Grassland
Cultivation
Water uptake by wheat
Slumping

3 Organic matter: benefits and management


Ways of maintaining SOM in arable cropping
1. Ley-arable farming – i.e. intermittent pasture
2. Add crop residues
3. Add manures or other organic “wastes”
4. Break or cover crops …………………………………………………..
5. Minimise tillage • small effect, mainly redistribution
• but useful to concentrate SOM near surface
• other benefits
6. Grow plants with larger roots (breeding)
7. Grow larger crops by using fertilizers (small effect)


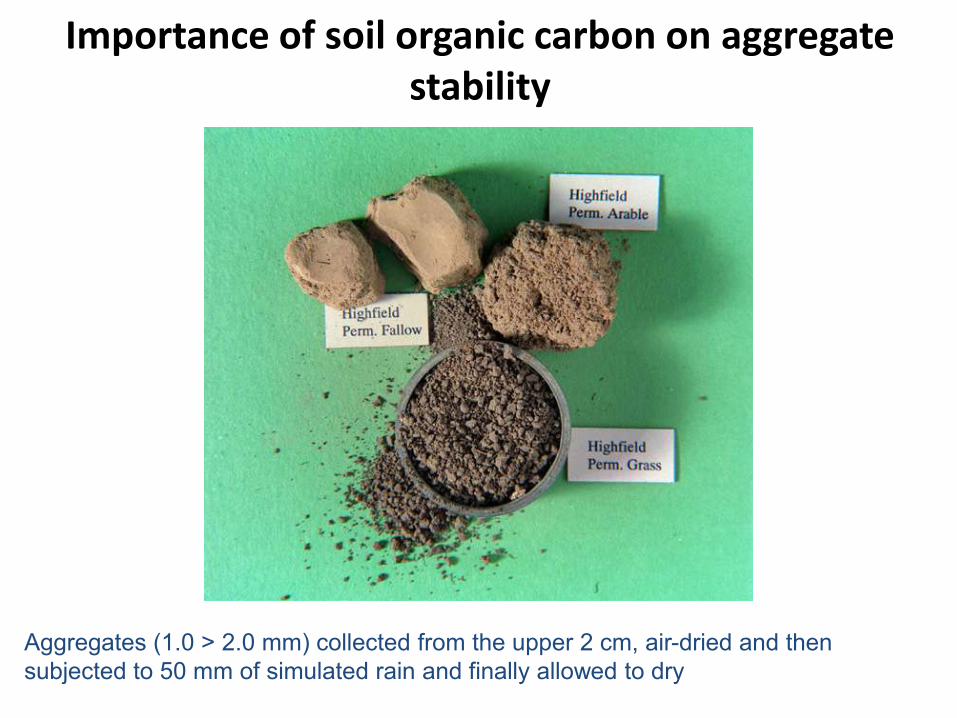
Importance of soil organic carbon on aggregate stability
Aggregates (1.0 > 2.0 mm) collected from the upper 2 cm, air-dried and then
subjected to 50 mm of simulated rain and finally allowed to dry

4 Organic amendments: FYM, Straw, (crop residues) AD, Compost

0.00
0.50
1.00
1.50
2.00
2.50
0 4.5 9 18
% C
in
to
ps
oil
, 0
-23
cm
Rate of straw applied t/ha/yr
7 years
11 years
22 years
Effect of 22 years of straw incorporation on soil %C
(Rothamsted, 25% clay – 3 rates of straw)
Very small SOC increase at “normal”
straw application rate

0.00
0.20
0.40
0.60
0.80
1.00
1.20
1.40
0 4.5 9 18
% C
in
to
ps
oi,
0-2
3 c
m
Rate of straw applied t/ha/yr
11 years 22 years
Effect of 22 years of straw incorporation on soil %C (note C in sandy soil is only 50% of that in silty clay loam)
(Woburn, 9% clay – 3 rates of straw)

Electron micrographs of Highfield soils
Sample + Grass
Control
Sample + biochar
Fungal hyphae
extracellular polymeric substances (EPS)?


where knowledge grows
Rothamsted Research
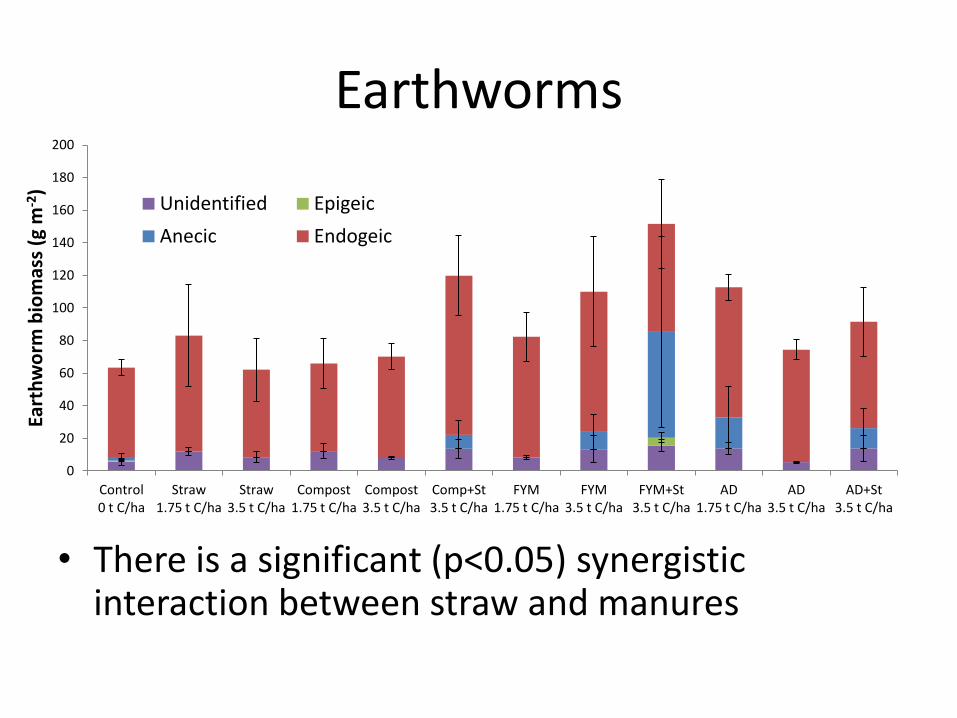
Earthworms
0
20
40
60
80
100
120
140
160
180
200
Control 0 t C/ha
Straw 1.75 t C/ha
Straw 3.5 t C/ha
Compost 1.75 t C/ha
Compost 3.5 t C/ha
Comp+St 3.5 t C/ha
FYM 1.75 t C/ha
FYM 3.5 t C/ha
FYM+St 3.5 t C/ha
AD 1.75 t C/ha
AD 3.5 t C/ha
AD+St 3.5 t C/ha
Eart
hw
orm
bio
mas
s (g
m-2
)
Unidentified Epigeic
Anecic Endogeic
• There is a significant (p<0.05) synergistic interaction between straw and manures

5. Soil strength & drying

Date
1/3 1/4 1/5 1/6 1/7 1/8
Pen
etro
met
er p
ress
ure
(MP
a)
0
1
2
3
4
Date
01/04 01/05 01/06 01/07
Mat
ric p
oten
tial (
kPa)
-500
-400
-300
-200
-100
0
limiteddrying
no irrigation
well watered
no irrigation
well watered
limiteddrying
The matric potential and penetrometer strength of soil under different irrigation regimes in a field of wheat. Note the greatly increased strength of soil after only limited drying, and the low matric potential of non-irrigated soil. The colours correspond to the same irrigation treatments.
Different irrigation regimes

The influence of soil strength on crop yield dry matter as controlled by irrigation, field traffic & soil type
Q Penetrometer Resistance, MPa
0.0 0.5 1.0 1.5 2.0 2.5 3.0 3.5
Dry
Ma
tte
r Y
ield
, kg
/ha
600
800
1000
1200
1400
1600
1800
2000
2006 Un-compacted sand2006 Compacted sand2006 Un-compacted clay2006 Compacted clay2004 No irrigation2004 Limited drying2004 Well-watered
Strong correlation between lower strength soil (penetrometer) and greater dry matter yield. Strength controlled by irrigation or wheeling in 2 soil types.

In the field: measuring soil drying. Electrical Resistive Tomography (ERT) (with Lancaster)
Resistivity (Wm)Dry zone beneath crop
Distance (m)
Electrode
1357
A M N B M N BA
Surveylevel
The resistivity image above is from an ERT survey with 96 electrodes positioned at 0.3m spacing along 12 plots of wheat at Woburn. The green rectangles show the crop boundaries. High resistive zones (in red) are where moisture content is reduced due to crop use. The different wheats show contrasting drying footprints – some extending to 0.6m and deeper.
Electrical current is injected between electrodes A and B (above) and voltage measured between electrodes M and N. The electrode spacing controls the depth and width of sensitivity. By carrying out measurements at different electrode spacing and different positions we essentially probe the subsurface.

Seasonal drying patterns under 11 wheat varieties (+ fallow) measured using ERT technique
Woburn - Butt Close. Sandy soil. (note drying restricted to top 50 cm)
41
Dep
th (
m)
14 June
21 June
28 June
10 July
2 Aug
0
More resistive More conductive
t0 = 16 May
5 10 15 20 25 30 X (m) Measurement error <2% RMS

Seasonal drying patterns under 11 wheat varieties (+ fallow) measured using ERT technique
Woburn – Warren Field. Silt-clay-loam. (note soil drying to greater depth than sandy soil)
42
Dep
th (
m)
13 June
20 June
27 June
9 July
1 Aug
0
More resistive More conductive
t0 = 13 May
5 10 15 20 25 30 X (m) Measurement error <5% RMS

Ratio inversion ERT
43
Butt Close
Warren Field
More resistive More conductive
14 June 20 June 28 June 10 July 2 August
13 June 27 June 9 July 1 August

Root or pore count cm-1
0 10 20 30 40 50
Depth
cm
0
20
40
60
80
100
BattalionHybrid HystarRht 3Rht CRobigusPore count SED for root count data
Measuring root distributions with the core-break method
Cores 9 cm in diameter were taken to a depth of 1m following anthesis in 2014. The cores were then broken every 10 cm to reveal the soil surface. These were then photographed and used to count the number of roots and pre-existing pores.
Examples of two photographs (35mm wide and 30 mm)
P<0.001
Soil below 40 cm may be inherently too strong for wheat roots because of weight of soil above but have to rely on pre-existing pores

6 Tillage – an indicator of soil strength and structure

Draught Force (A MEASURE of SOIL STRENGTH)
Draught Force
Strain gauged frame (to measure draught forces)
Laser proximity sensors (depth & front furrow width)
Doppler radar sensor (forward speed)
Measure force to pull plough (draught) We know depth and width of work Force/area = strength Therefore able to map soil strength.

Broadbalk Wheat Experiment (est 1843). Soil strength mapped by measuring plough draught

Clay % Specific draught, kPa
0 m 50 m 100 m0 m
50 m
100 m
150 m
200 m
250 m
300 m
Clay, %
Strip Numbers20
19 17 15 13 11 09 07 05 2.2 01
18 16 14 12 10 08 06 03 2.1
18
19
20
21
22
23
24
25
26
27
28
29
30
31
32
33
34
35
36
37
38
Continuous wheat
1
6
Continuous wheat
Sections
0
(straw incorporated)
Continuous wheat
2
Rotation (2nd wheat)
3Rotation (3rd wheat)
4
Rotation (forage maize)
5
Rotation (winter oats)
Continuous wheat(restricted fungicides)
7Rotation (1st wheat)
8
(no herbicides)
9Continuous wheat
0 m 50 m 100 m0 m
50 m
100 m
150 m
200 m
250 m
300 mSpecific
50
55
60
65
70
75
80
85
90
95
100
105
110
115
120
125
130
135
140
Draught, kPa
Continuous wheat
1
6
Continuous wheat
Sections
0
(straw incorporated)
Continuous wheat
2
Rotation (2nd wheat)
3Rotation (3rd wheat)
4
Rotation (forage maize)
5
Rotation (winter oats)
Continuous wheat(restricted fungicides)
7Rotation (1st wheat)
8
(no herbicides)
9Continuous wheat
Strip Numbers20
19 17 15 13 11 09 07 05 2.2 01
18 16 14 12 10 08 06 03 2.1
PLOUGH DRAUGHT AT BROADBALK, ROTHAMSTED

Crop management & Plough Draught (Mineral Fertilizer)
Treatment
N0 N1 N2 N3 N4 N6 FYM
SO
C, S
oil
org
anic
Carb
on, g/g
0.0
0.5
1.0
1.5
2.0
2.5
3.0
S, S
pecific
dra
ught, k
Pa
0
10
20
30
40
50
60
70
80
90
100
Kg N/ha 0 48 96 144 192 288 (35 t FYM)
Histogram shows addition of mineral N has small effect on SOC compared to long-term additions of FYM

Crop management & Plough Draught (Mineral Fertilizer)
Treatment
N0 N1 N2 N3 N4 N6 FYM
SO
C, S
oil
org
anic
Carb
on, g/g
0.0
0.5
1.0
1.5
2.0
2.5
3.0
Yie
ld, M
g/h
a
0
1
2
3
4
5
6
7
S, S
pecific
dra
ught, k
Pa
0
10
20
30
40
50
60
70
80
90
100
Kg N/ha 0 48 96 144 192 288 (35 t FYM)
Much larger crops + roots associated with increased mineral N & FYM

Crop management & Plough Draught (Mineral Fertilizer)
Treatment
N0 N1 N2 N3 N4 N6 FYM
SO
C, S
oil
org
anic
Carb
on, g/g
0.0
0.5
1.0
1.5
2.0
2.5
3.0
S, S
pecific
dra
ught, k
Pa
72
74
76
78
80
82
84
86
88
90
Yie
ld, M
g/h
a
0
1
2
3
4
5
6
7
Kg N/ha 0 48 96 144 192 288 (35 t FYM)
Bigger crops result in lower soil strength; as a result of better soil structure? Biological tillage so sustainable intensification

7 Yield potential, attainable yields & actual yields


Concluding comments
• Soil structure has a significant influence on virtually all processes occurring in the soil.
• Managing soils in ways that maintain or increase organic matter will have a positive effect on soil structure.
• Soil management is a key component in maximising crop yield.

acknowledgements
• Jackie Stroud
• Tom Sizmur
• Andy MacDonald
• David Powlson
• Andy Whitmore
• Richard Whalley
• Pete Shanahan (Lancaster University)
• Andy Binley (Lancaster University)