-soil water investigation repor - california
TRANSCRIPT
FINAL REPORT ORMOND BEACH WETLAND RESTORATION
GENERAL SITE-WIDE INVESTIGATION FOR SOIL REUSE OPTIONS
Prepared for: Aspen Environmental Group
30423 Canwood Street, Suite 215 Agoura Hills, California 91301-4316
Tel: (818) 597-3407 Attn: Susan Walker
Submitted by: AMEC Earth & Environmental, Inc.
9210 Sky Park Court, Suite 200 San Diego, California 92123
(858) 300-4300
November 2006
Project No. 4151001200
Aspen Environmental Group Final Report Ormond Beach Wetland Restoration General Site-Wide Investigation for Soil Reuse Options November 2006
4151001200\R1106-035_V2.doc Page ii
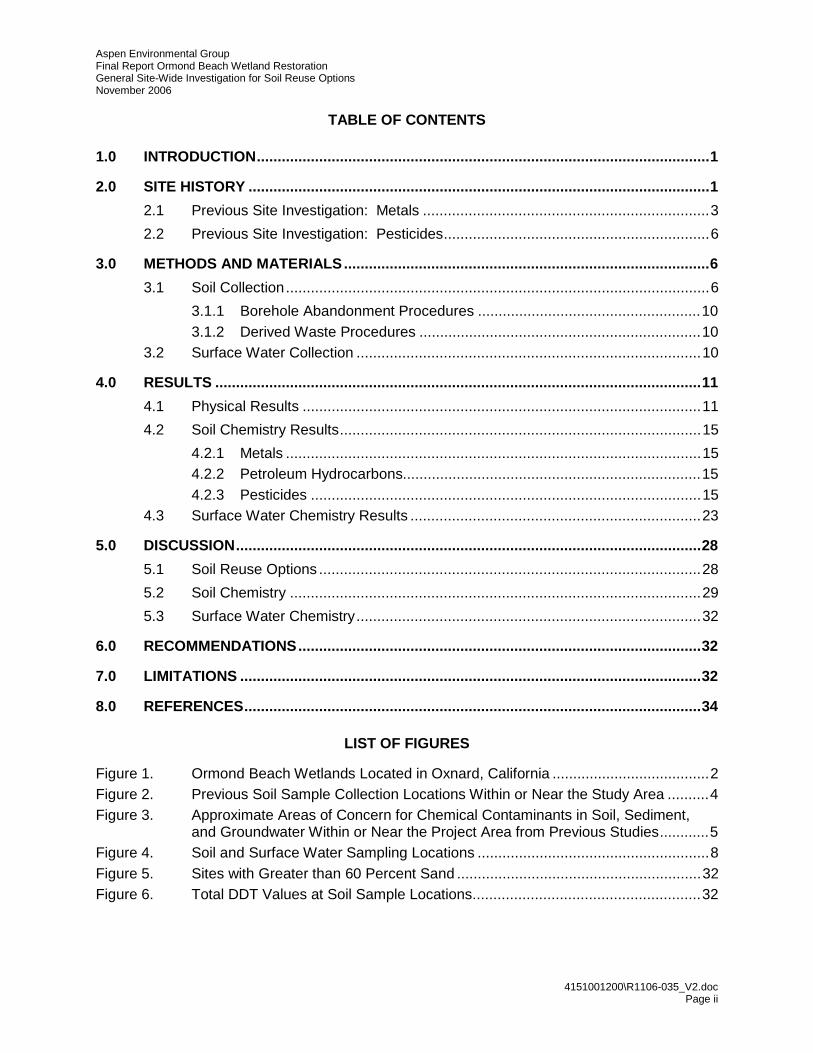
TABLE OF CONTENTS
1.0 INTRODUCTION.............................................................................................................1
2.0 SITE HISTORY ...............................................................................................................1
2.1 Previous Site Investigation: Metals .....................................................................3
2.2 Previous Site Investigation: Pesticides................................................................6
3.0 METHODS AND MATERIALS........................................................................................6
3.1 Soil Collection......................................................................................................6
3.1.1 Borehole Abandonment Procedures ......................................................103.1.2 Derived Waste Procedures ....................................................................10
3.2 Surface Water Collection ...................................................................................10
4.0 RESULTS .....................................................................................................................11
4.1 Physical Results ................................................................................................11
4.2 Soil Chemistry Results.......................................................................................15
4.2.1 Metals ....................................................................................................154.2.2 Petroleum Hydrocarbons........................................................................154.2.3 Pesticides ..............................................................................................15
4.3 Surface Water Chemistry Results ......................................................................23
5.0 DISCUSSION................................................................................................................28
5.1 Soil Reuse Options ............................................................................................28
5.2 Soil Chemistry ...................................................................................................29
5.3 Surface Water Chemistry...................................................................................32
6.0 RECOMMENDATIONS.................................................................................................32
7.0 LIMITATIONS ...............................................................................................................32
8.0 REFERENCES..............................................................................................................34
LIST OF FIGURES
Figure 1. Ormond Beach Wetlands Located in Oxnard, California ......................................2Figure 2. Previous Soil Sample Collection Locations Within or Near the Study Area ..........4Figure 3. Approximate Areas of Concern for Chemical Contaminants in Soil, Sediment,
and Groundwater Within or Near the Project Area from Previous Studies............5Figure 4. Soil and Surface Water Sampling Locations ........................................................8Figure 5. Sites with Greater than 60 Percent Sand ...........................................................32Figure 6. Total DDT Values at Soil Sample Locations.......................................................32

Aspen Environmental Group Final Report Ormond Beach Wetland Restoration General Site-Wide Investigation for Soil Reuse Options November 2006
4151001200\R1106-035_V2.doc Page iii
LIST OF TABLES
Table 1. Detail of Completed Borings ................................................................................9Table 2. Grain Size Results Summary.............................................................................12Table 3. Soil Physical Results Summary .........................................................................14Table 4. Soil Chemistry Results – Metals ........................................................................16Table 5. Soil Chemistry Results – Total Petroleum Hydrocarbons (C7-C44)....................17Table 6. Soil Chemistry Results – PCBs and Pesticides..................................................20Table 7. Surface Water Chemistry Results – General Chemistry.....................................24Table 8. Surface Water Chemistry Results – Metals........................................................25Table 9. Surface Water Chemistry Results – TPH (C7-C44)............................................26Table 10. Surface Water Chemistry Results – PCBs and Pesticides .................................27
LIST OF APPENDICES
Appendix A Chemical Results from Previous Studies ......................................................... A-1 Appendix B Detailed Sample Collection Maps .................................................................... B-1 Appendix C Soil Boring Logs............................................................................................... C-1 Appendix D Sample Photographs ....................................................................................... D-1 Appendix E City of Oxnard/County of Ventura Drilling Permits........................................... E-1 Appendix F Well Sealing Records....................................................................................... F-1 Appendix G Grain Size Results ...........................................................................................G-1 Appendix H Soil Chemistry Results..................................................................................... H-1 Appendix I Surface Water Chemistry Results ......................................................................I-1
Aspen Environmental Group Final Report Ormond Beach Wetland Restoration General Site-Wide Investigation for Soil Reuse Options November 2006
4151001200\R1106-035_V2.doc Page iv
LIST OF ACRONYMS AND ABBREVIATIONS
AMEC AMEC Earth & Environmental, Inc.
Aspen Aspen Environmental Group
ASTM American Society for Testing and Materials
bgs below ground surface
CCC criteria continuous concentration
CMC criteria maximum concentration
CTR California Toxics Rule
DDD Dichloro-diphenyl-dichloroethane
DDE Dichloro-diphenyl-dichloroethylene
DDT Dichloro-diphenyl-trichloroethane
EPA U.S. Environmental Protection Agency
ER-L effects range-low
ER-M effects range-median
ft foot/feet
GPS global positioning system
HASP Health and Safety Plan
in inch/inches
LAR limited access rig
mg/kg milligram per kilogram
mg/L milligram per liter
MLLW mean lower low water
MWD Metropolitan Water District
NAVD North American Vertical Datum
NBS National Bureau of Standards
NBVC Naval Base Ventura County
ND non-detect
OSHA Occupational Safety and Health Administration
PAH polycyclic aromatic hydrocarbons
PCB polychlorinated biphenyl
PEL probable effects level
QA/QC quality assurance/quality control
RWQCB Regional Water Quality Control Board
Aspen Environmental Group Final Report Ormond Beach Wetland Restoration General Site-Wide Investigation for Soil Reuse Options November 2006
4151001200\R1106-035_V2.doc Page v
SAP Sampling and Analysis Plan
SCC California State Coastal Conservancy
SU Salinity Unit
TEL threshold effects level
TOC total organic carbon
TPH total petroleum hydrocarbons
µg/kg micrograms per kilogram
µg/L microgram per liter
m micrometer
USACE U.S. Army Corps of Engineers
USCS Unified Soil Classification System
WMU Waste Management Unit
Aspen Environmental Group Final Report Ormond Beach Wetland Restoration General Site-Wide Investigation for Soil Reuse Options November 2006
4151001200\R1106-035_V2.doc Page 1
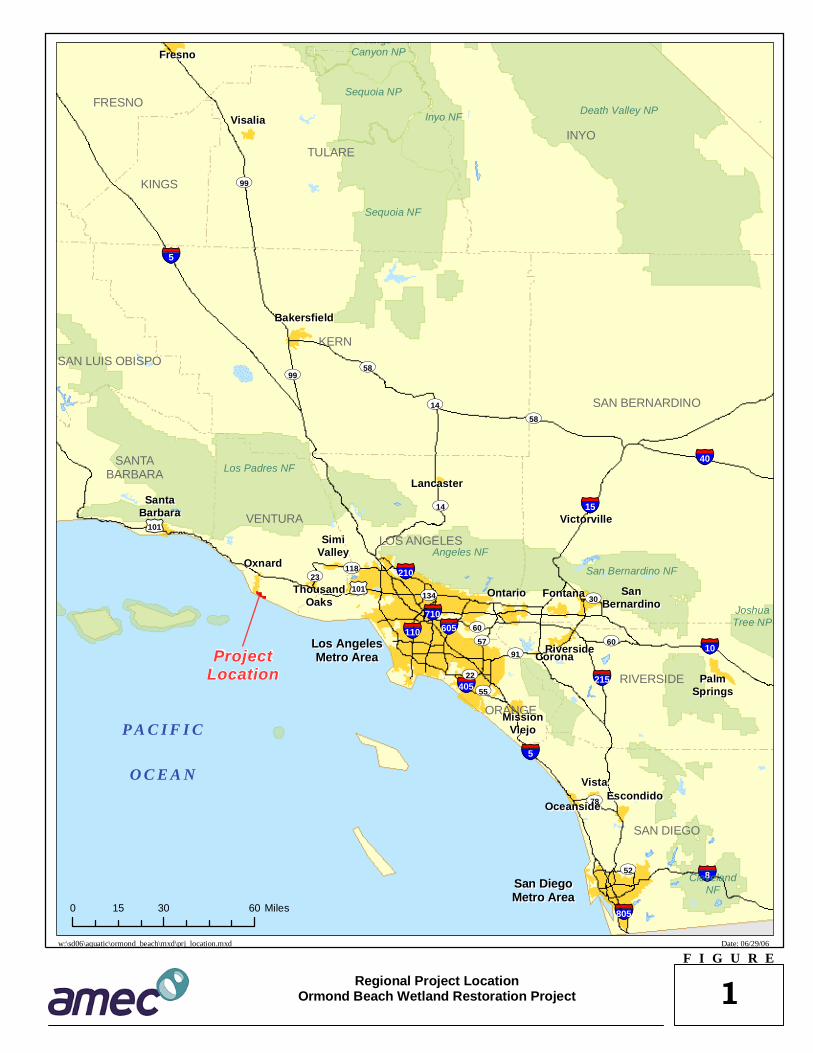
1.0 INTRODUCTION
The California State Coastal Conservancy (SCC) is studying the feasibility of restoring the Ormond Beach Wetlands located in Oxnard, California (Figure 1). A major component of the wetland restoration feasibility study consists of determining the physical and chemical characteristics of the soils and waters within the project area. During an initial phase of the study, AMEC Earth & Environmental, Inc. (AMEC) reviewed numerous documents pertaining to chemical contamination in the soils and sediment in and around the proposed restoration area. The information was summarized in a report titled “Ormond Beach Wetland Restoration Project - Soil Contaminant Review, January 2005” (AMEC 2005). Contained within the report was a list of data gaps pertaining to potential soil and sediment contaminants within the proposed restoration area. Three key data gaps identified were: 1) lack of sediment characterization data in large areas of the site, 2) no samples collected deeper than 5 feet (ft) below ground surface (bgs), and 3) lack of testing for some constituents of concern.
To address the data gaps discussed above, AMEC was contracted by Aspen Environmental Group (Aspen) to conduct general site-wide soil and surface water investigations of the proposed project site. The study involved collection of 30 soil samples and 10 surface water samples positioned throughout the footprint. This report details the sample collection methods employed, and the soil and water chemistry and soil grain size results. The study results are compared to available sediment and water quality ecological effects guidelines to assess the levels of chemical contaminants in the test media. In addition, the physical test results (i.e., grain size) are evaluated to assess their potential for beneficial reuse options (e.g., beach nourishment, habitat enhancement).
The purpose of this site evaluation is to provide a general snapshot of the physical and chemical characteristics of soils and waters within the proposed Ormond Beach Wetland Restoration study area described in the site-specific Sampling and Analysis Plan (SAP) (AMEC 2006). This general assessment is not an exhaustive analysis of each conceivable issue of potential concern. This study has not evaluated/assessed any potential impacts of chemicals contained within the study area on human health and it should not be used for this purpose. The professional opinions in this report are based in part on the interpretation of data from discrete sampling locations that may not represent conditions at unsampled locations.
2.0 SITE HISTORY
The Ormond Beach Wetland Restoration site is located in the City of Oxnard, Ventura County, California. It is situated northwest of Mugu Lagoon and Naval Base Ventura County (NBVC) Point Mugu (Figure 1). The wetland restoration site has several onsite and adjacent former and current uses that could be potential sources of chemical contamination. The site is located adjacent to a former metal recycling facility (currently owned by Alpha and Omega Development, but formerly known as the Halaco Engineering foundry site and slag disposal pile), agricultural fields, an industrial drain, and other agricultural and industrial uses.
w:\sd06\aquatic\ormond_beach\mxd\prj_location.mxd
Regional Project LocationOrmond Beach Wetland Restoration Project
San DiegoMetro AreaSan DiegoMetro Area
Los AngelesMetro Area
Los AngelesMetro Area
UV14
UV58
UV58
§̈¦5
§̈¦8
§̈¦15
£¤101
§̈¦10
§̈¦40
§̈¦5
§̈¦215
£¤101
UV99
UV118
UV60
UV91
UV78
§̈¦805
§̈¦210
§̈¦405
UV60
UV57
UV30
UV22
§̈¦605§̈¦110
UV52
UV23
UV55
UV134
UV99
§̈¦710
UV14
ClevelandNF
San Bernardino NF
Angeles NF
Sequoia NF
Los Padres NF
Inyo NF
JoshuaTree NP
Death Valley NP
Sequoia NP
KingsCanyon NP
EscondidoEscondidoVistaVista
OceansideOceanside
MissionMissionViejoViejo
PalmPalmSpringsSprings
RiversideRiverside
FontanaFontana
CoronaCorona
VictorvilleVictorville
OntarioOntario SanSanBernardinoBernardino
ThousandThousandOaksOaks
SimiSimiValleyValley
OxnardOxnard
LancasterLancaster
BakersfieldBakersfield
VisaliaVisalia
SantaSantaBarbaraBarbara
FresnoFresno
SAN DIEGO
ORANGE
RIVERSIDE
LOS ANGELES
VENTURA
SANTABARBARA
SAN LUIS OBISPO
KERN
SAN BERNARDINO
KINGS
TULAREINYO
FRESNO
Date: 06/29/06
F I G U R E
1
P A C I F I C
O C E A N
ProjectLocation
0 30 6015 Miles
Aspen Environmental Group Final Report Ormond Beach Wetland Restoration General Site-Wide Investigation for Soil Reuse Options November 2006
4151001200\R1106-035_V2.doc Page 3
The restoration area consists of these subareas:
• 309 acres north and east of the Alpha and Omega Development slag pile, 277 acres of which was recently acquired by The Nature Conservancy and the SCC from the City of Oxnard / Metropolitan Water District (MWD) (referred to as the former City of Oxnard/MWD Property);
• The 265-acre former Edison Property now owned by the SCC; • Approximately 340 acres of the Southland Sod Farm (the portion south of McWane
Boulevard if this roadway were extended from Edison Drive to Arnold Road); • The triangular Hueneme Parcel and property between J Street Drain and the northwest
boundary of the SCC’s 265-acre property, which are owned by the City of Oxnard; • The Ventura County Game Preserve (approximately 600 acres); • The approximately 5-acre parcel bounded by Perkins Road/Hueneme Road/Magellan
Avenue owned by the City of Oxnard, and the remaining approximately 33 acres that lay north of the railroad tracks and south of Hueneme Road owned by various parties; and
• The Agromin Parcel (approximately 24 acres).
Several drains (e.g., Oxnard Industrial Drain) and drainage ditches (e.g., Oxnard Drainage Ditch #3) that carry stormwater, agricultural runoff, and other wastewaters also traverse the site. These drains and ditches might serve as a source and/or sink for contaminated soils and waters.
There have been several site contaminant investigations conducted within and adjacent to the proposed wetland restoration site. These studies were performed since the mid-1990s for numerous purposes (e.g., Phase I and II assessments and installation restorations studies). No hazardous waste levels of contaminants were detected in any of the studies. The study sites and sample collection locations from these previous studies are depicted in Figure 2. Figure 3 identifies the approximate locations (based on the study results summarized below) where chemical contaminants were found in elevated concentrations in soil, sediment, or water. Detailed chemical results from some of the historical studies are presented in Appendix A.
The major findings of the previous contaminant studies conducted in and adjacent to the Ormond Beach Wetland Restoration site are summarized below. The findings from these previous studies were used to assist in the development of this general site-wide soil and water investigation.
2.1 Previous Site Investigation: Metals
There are two locations within the project boundary where metal contamination may be an issue. This includes areas adjacent to the former Halaco site and the former Edison property.
There appears to be evidence indicating metals from the former Halaco Waste Management Unit (WMU) have migrated into the proposed restoration area in soils and groundwater. This evidence is based upon the following report findings.
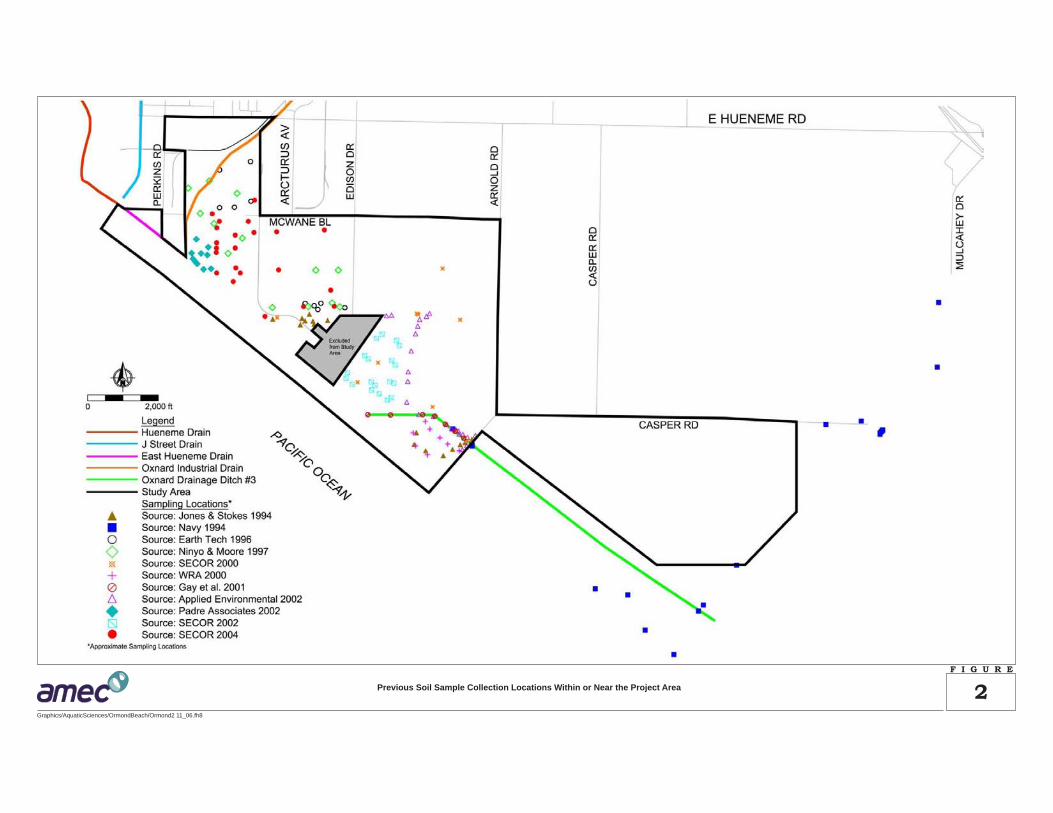
Previous Soil Sample Collection Locations Within or Near the Project Area
F I G U R E
2Graphics/AquaticSciences/OrmondBeach/Ormond2 11_06.fh8
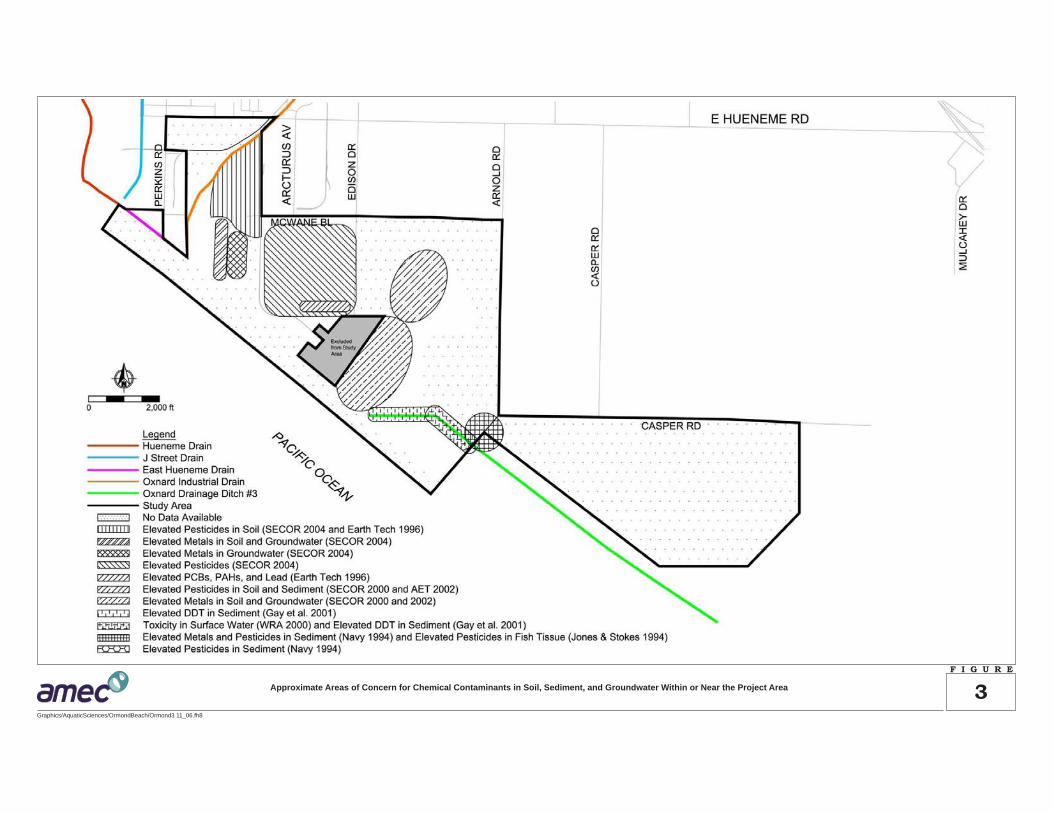
Approximate Areas of Concern for Chemical Contaminants in Soil, Sediment, and Groundwater Within or Near the Project Area
F I G U R E
3Graphics/AquaticSciences/OrmondBeach/Ormond3 11_06.fh8
Aspen Environmental Group Final Report Ormond Beach Wetland Restoration General Site-Wide Investigation for Soil Reuse Options November 2006
4151001200\R1106-035_V2.doc Page 6
• Heavy metals within the former City of Oxnard/MWD property are moderately (>effects range low [ERL]) to significantly (>effects range median [ERM]) elevated immediately adjacent to the former Halaco site (SECOR 2004) (note: ERLs and ERMs are discussed in detail in Section 4.2). The U.S. Army Corps of Engineers (USACE) and Regional Water Quality Control Board (RWQCB) will likely require further soil delineation of this area before granting permits.
• Metals in groundwater are elevated (>California Toxics Rule [CTR]) immediately adjacent to the former Halaco site and farther to the east (SECOR 2004). The continued migration of heavy metals in groundwater could have an impact on the success of the wetland restoration project.
To address the level of contamination at and adjacent to the former Halaco site, the Environmental Protection Agency (EPA) Emergency Response and Site Mitigation team began conducting a full investigation of the 40-acre site on 19 June 2006. This includes extensive sampling of the disposal site east of the engineering facility, as well as numerous adjacent areas. The results of the EPA’s study will be used to complement the results of this investigation. Results from the EPA’s study are estimated to be available in fall 2006.
There may also be residual metal contamination in the groundwater at the former Edison tank farm. The concentrations of metals in the soil at this site are low and the contaminant source has been removed; therefore, no long-term impacts from reuse of the material at this site are expected.
2.2 Previous Site Investigation: Pesticides
Chlorinated pesticides are persistent contaminants that may impact the success of the restoration project if they are exposed to aquatic and/or aquatic-associated organisms (e.g., birds or mammals entering or drinking contaminated water or eating contaminated sediments) and enter the food chain. Previous studies indicate that pesticides may be elevated at several areas within the project boundary. The studies indicate that pesticide levels (particularly Dichloro-diphenyl-trichloroethane [DDT] and metabolites and toxaphene) are significantly elevated (>ERM) in the cultivated land portion (west of Edison Drive and south of McWane Boulevard) of the former City of Oxnard/MWD property and within surface soils of the Southland Sod Farm. In addition, numerous pesticides were found in significantly elevated concentrations in sediment and fish tissue samples collected in Oxnard Drainage Ditch #3.
3.0 METHODS AND MATERIALS
This section discusses the soil and surface water collection program for the current site-wide investigation. Soil and surface water collection, handling, and preservation activities followed the procedures outlined in the site-specific SAP (AMEC 2006).
3.1 Soil Collection
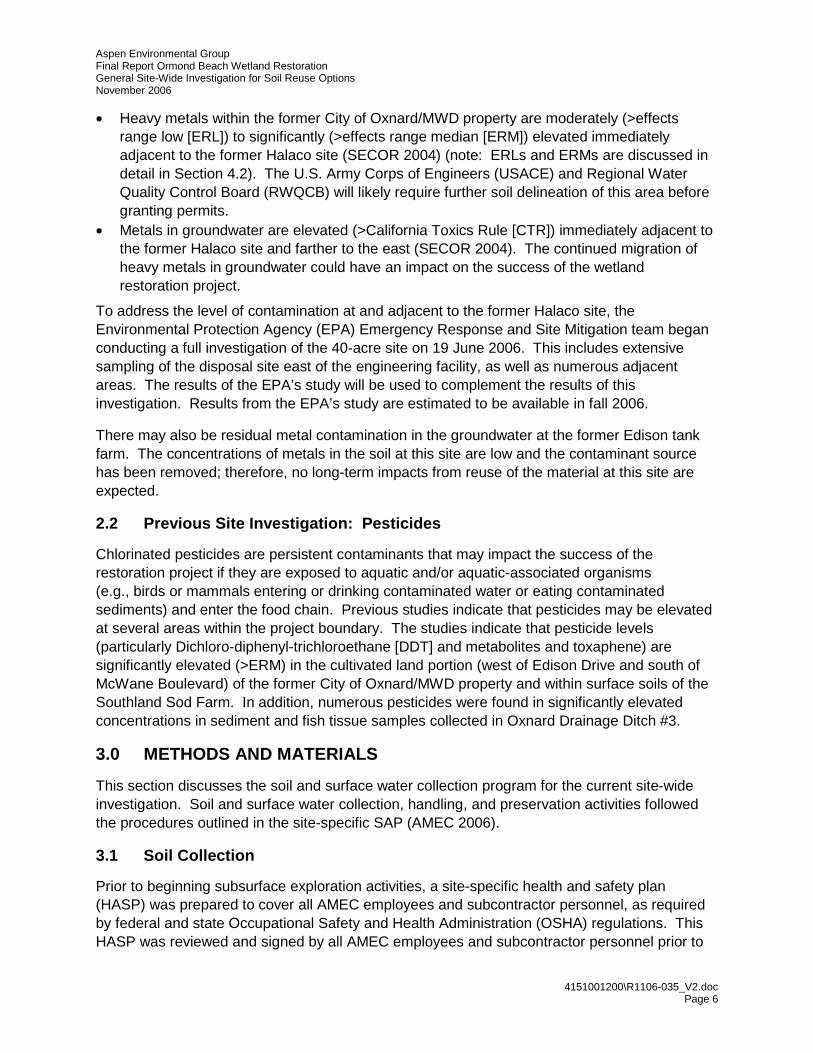
Prior to beginning subsurface exploration activities, a site-specific health and safety plan (HASP) was prepared to cover all AMEC employees and subcontractor personnel, as required by federal and state Occupational Safety and Health Administration (OSHA) regulations. This HASP was reviewed and signed by all AMEC employees and subcontractor personnel prior to
Aspen Environmental Group Final Report Ormond Beach Wetland Restoration General Site-Wide Investigation for Soil Reuse Options November 2006
4151001200\R1106-035_V2.doc Page 7
beginning work. Underground utilities were located through public services 2 days prior to beginning field work in accordance with California State law. Due to the widespread spacing of the sampling locations, underground utilities also were located using a private utility location subcontractor (EPL, Inc. of Garden Grove, California). These location services were performed on 1 and 5 September, and 11 October 2006. No underground utility lines were identified by EPL that would obstruct the planned boring locations.
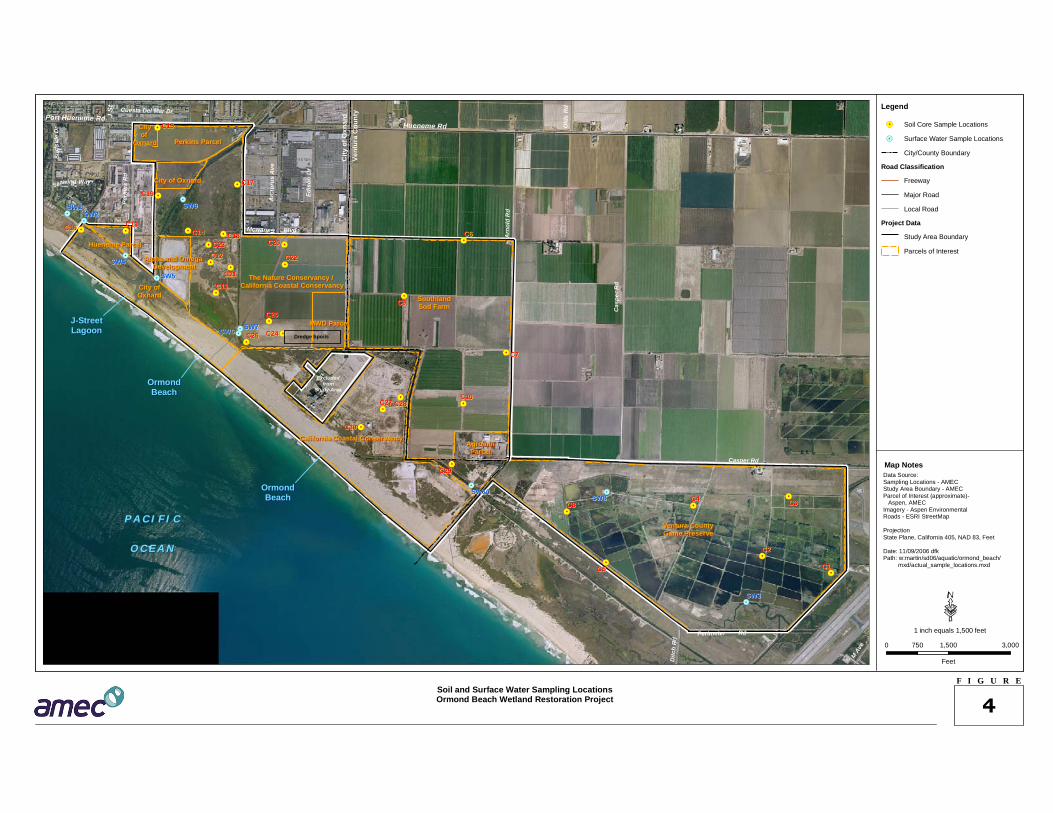
Soil boring was performed at 30 locations spread out over the entire study area (Figure 4; Appendix B). The collection sites were pre-placed in areas that: 1) were of interest to Aspen and SCC, 2) would provide adequate coverage of the entire study area, 3) were accessible, and 4) were determined to provide the restoration team with the information needed to move into the next phase of the study. Proposed collection sites were identified in the study SAP. Several of the originally proposed collection sites needed to be moved to new, adjacent locations based on access issues.
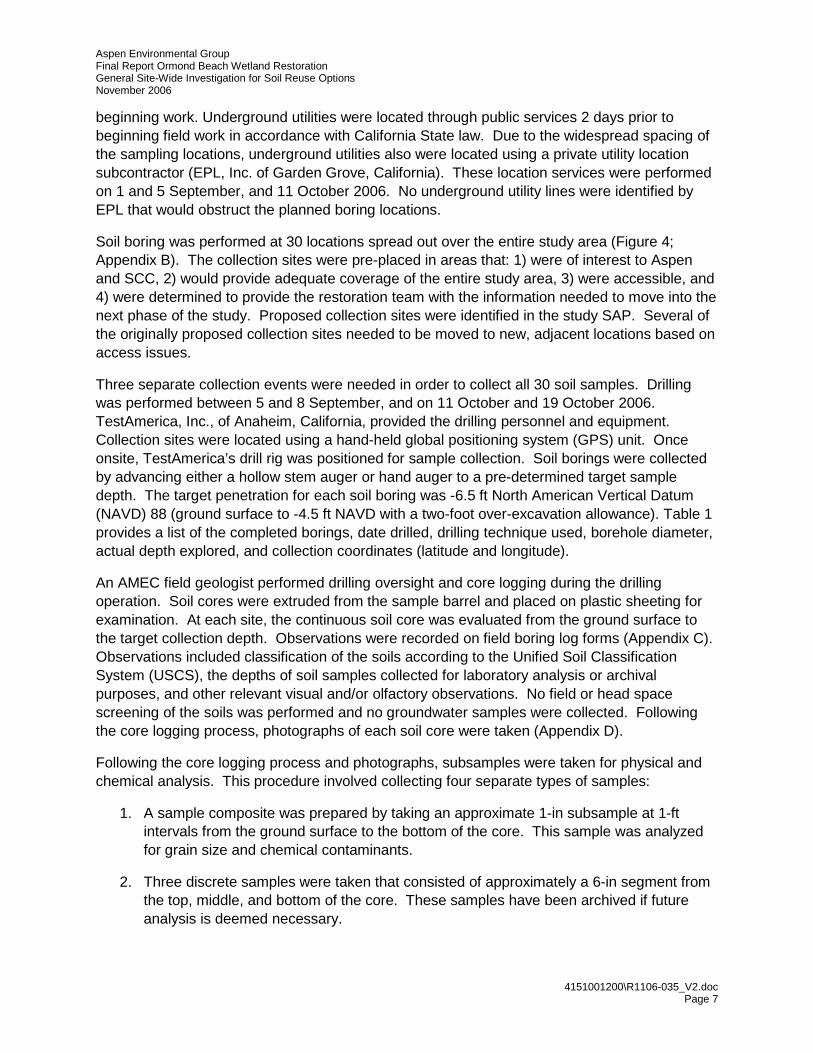
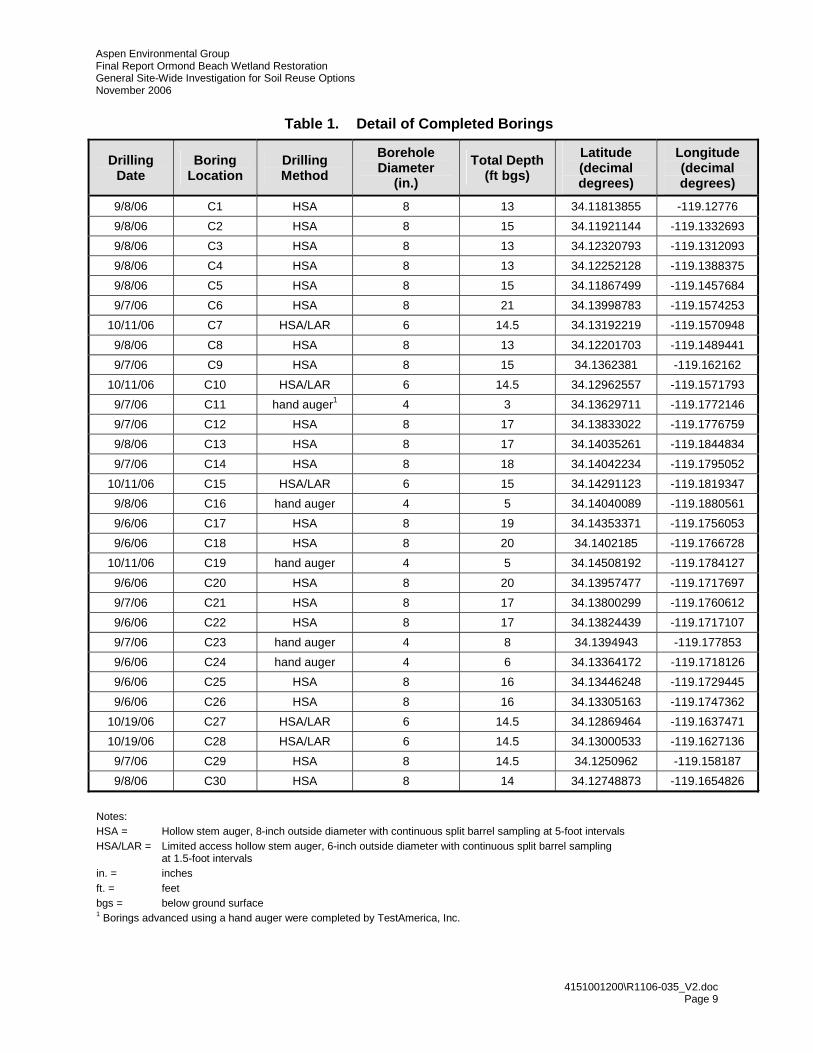
Three separate collection events were needed in order to collect all 30 soil samples. Drilling was performed between 5 and 8 September, and on 11 October and 19 October 2006. TestAmerica, Inc., of Anaheim, California, provided the drilling personnel and equipment. Collection sites were located using a hand-held global positioning system (GPS) unit. Once onsite, TestAmerica’s drill rig was positioned for sample collection. Soil borings were collected by advancing either a hollow stem auger or hand auger to a pre-determined target sample depth. The target penetration for each soil boring was -6.5 ft North American Vertical Datum (NAVD) 88 (ground surface to -4.5 ft NAVD with a two-foot over-excavation allowance). Table 1 provides a list of the completed borings, date drilled, drilling technique used, borehole diameter, actual depth explored, and collection coordinates (latitude and longitude).
An AMEC field geologist performed drilling oversight and core logging during the drilling operation. Soil cores were extruded from the sample barrel and placed on plastic sheeting for examination. At each site, the continuous soil core was evaluated from the ground surface to the target collection depth. Observations were recorded on field boring log forms (Appendix C). Observations included classification of the soils according to the Unified Soil Classification System (USCS), the depths of soil samples collected for laboratory analysis or archival purposes, and other relevant visual and/or olfactory observations. No field or head space screening of the soils was performed and no groundwater samples were collected. Following the core logging process, photographs of each soil core were taken (Appendix D).
Following the core logging process and photographs, subsamples were taken for physical and chemical analysis. This procedure involved collecting four separate types of samples:
1. A sample composite was prepared by taking an approximate 1-in subsample at 1-ft intervals from the ground surface to the bottom of the core. This sample was analyzed for grain size and chemical contaminants.
2. Three discrete samples were taken that consisted of approximately a 6-in segment from the top, middle, and bottom of the core. These samples have been archived if future analysis is deemed necessary.
AgrominParcel
AgrominParcel
Hueneme ParcelHueneme Parcel
Alpha and Omega Development
Alpha and Omega Development
City ofOxnardCity ofOxnard
California Coastal ConservancyCalifornia Coastal Conservancy
Ventura CountyGame PreserveVentura CountyGame Preserve
SouthlandSod FarmSouthlandSod Farm
Perkins ParcelPerkins Parcel
City of OxnardCity of Oxnard
The Nature Conservancy / California Coastal Conservancy
The Nature Conservancy / California Coastal Conservancy
MWD ParcelMWD Parcel
Cityof
Oxnard
Cityof
Oxnard
Dredge Spoils
J-StreetLagoonJ-StreetLagoon
OrmondBeach
OrmondBeach
OrmondBeach
OrmondBeach
Excludedfrom
Study Area
Vent
ura
Cou
nty
City
ofO
xna r
d
Cas
per R
d
Casper Rd
Ditc
h R
d
Surf
side
Dr
Arn
old
Rd
Arc
turu
s A
ve
Old
s R
d
Edis
on D
r
Perimeter Rd
Mcwane Blvd
Perk
ins
Rd
Cuesta Del Mar Dr
Seawind Way
Hueneme Rd
M Ave
J St
Port Hueneme Rd
C10C10
C7C7
C28C28C27C27
C19C19
C15C15
C16C16 C13C13
C1C1
C3C3
C5C5
C8C8C4C4
C2C2
C30C30
C9C9
C6C6
C29C29
C23C23
C11C11
C12C12
C21C21
C14C14 C18C18
C17C17
C22C22
C26C26 C24C24
C25C25
C20C20
SW10SW10
SW9SW9
SW8SW8
SW7SW7SW6SW6
SW5SW5
SW3SW3
SW4SW4
SW2SW2SW1SW1
P A C I F I C
O C E A N
P A C I F I C
O C E A N
Legend
Soil Core Sample Locations
Surface Water Sample Locations
City/County Boundary
Road Classification
Freeway
Major Road
Local Road
Project Data
Study Area Boundary
Parcels of Interest
F I G U R E
4
1 inch equals 1,500 feet
0 1,500 3,000750
Feet
Map Notes
Soil and Surface Water Sampling LocationsOrmond Beach Wetland Restoration Project
Data Source:Sampling Locations - AMECStudy Area Boundary - AMECParcel of Interest (approximate)- Aspen, AMECImagery - Aspen EnvironmentalRoads - ESRI StreetMap
ProjectionState Plane, California 405, NAD 83, Feet
Date: 11/09/2006 dfkPath: w:martin/sd06/aquatic/ormond_beach/ mxd/actual_sample_locations.mxd
Aspen Environmental Group Final Report Ormond Beach Wetland Restoration General Site-Wide Investigation for Soil Reuse Options November 2006
4151001200\R1106-035_V2.doc Page 9
Table 1. Detail of Completed Borings
DrillingDate
Boring Location
DrillingMethod
Borehole Diameter
(in.)
Total Depth (ft bgs)
Latitude(decimal degrees)
Longitude(decimal degrees)
9/8/06 C1 HSA 8 13 34.11813855 -119.12776
9/8/06 C2 HSA 8 15 34.11921144 -119.1332693
9/8/06 C3 HSA 8 13 34.12320793 -119.1312093
9/8/06 C4 HSA 8 13 34.12252128 -119.1388375
9/8/06 C5 HSA 8 15 34.11867499 -119.1457684
9/7/06 C6 HSA 8 21 34.13998783 -119.1574253
10/11/06 C7 HSA/LAR 6 14.5 34.13192219 -119.1570948
9/8/06 C8 HSA 8 13 34.12201703 -119.1489441
9/7/06 C9 HSA 8 15 34.1362381 -119.162162
10/11/06 C10 HSA/LAR 6 14.5 34.12962557 -119.1571793
9/7/06 C11 hand auger1 4 3 34.13629711 -119.1772146
9/7/06 C12 HSA 8 17 34.13833022 -119.1776759
9/8/06 C13 HSA 8 17 34.14035261 -119.1844834
9/7/06 C14 HSA 8 18 34.14042234 -119.1795052
10/11/06 C15 HSA/LAR 6 15 34.14291123 -119.1819347
9/8/06 C16 hand auger 4 5 34.14040089 -119.1880561
9/6/06 C17 HSA 8 19 34.14353371 -119.1756053
9/6/06 C18 HSA 8 20 34.1402185 -119.1766728
10/11/06 C19 hand auger 4 5 34.14508192 -119.1784127
9/6/06 C20 HSA 8 20 34.13957477 -119.1717697
9/7/06 C21 HSA 8 17 34.13800299 -119.1760612
9/6/06 C22 HSA 8 17 34.13824439 -119.1717107
9/7/06 C23 hand auger 4 8 34.1394943 -119.177853
9/6/06 C24 hand auger 4 6 34.13364172 -119.1718126
9/6/06 C25 HSA 8 16 34.13446248 -119.1729445
9/6/06 C26 HSA 8 16 34.13305163 -119.1747362
10/19/06 C27 HSA/LAR 6 14.5 34.12869464 -119.1637471
10/19/06 C28 HSA/LAR 6 14.5 34.13000533 -119.1627136
9/7/06 C29 HSA 8 14.5 34.1250962 -119.158187
9/8/06 C30 HSA 8 14 34.12748873 -119.1654826
Notes: HSA = Hollow stem auger, 8-inch outside diameter with continuous split barrel sampling at 5-foot intervals HSA/LAR = Limited access hollow stem auger, 6-inch outside diameter with continuous split barrel sampling
at 1.5-foot intervals in. = inches ft. = feet bgs = below ground surface 1 Borings advanced using a hand auger were completed by TestAmerica, Inc.
Aspen Environmental Group Final Report Ormond Beach Wetland Restoration General Site-Wide Investigation for Soil Reuse Options November 2006
4151001200\R1106-035_V2.doc Page 10
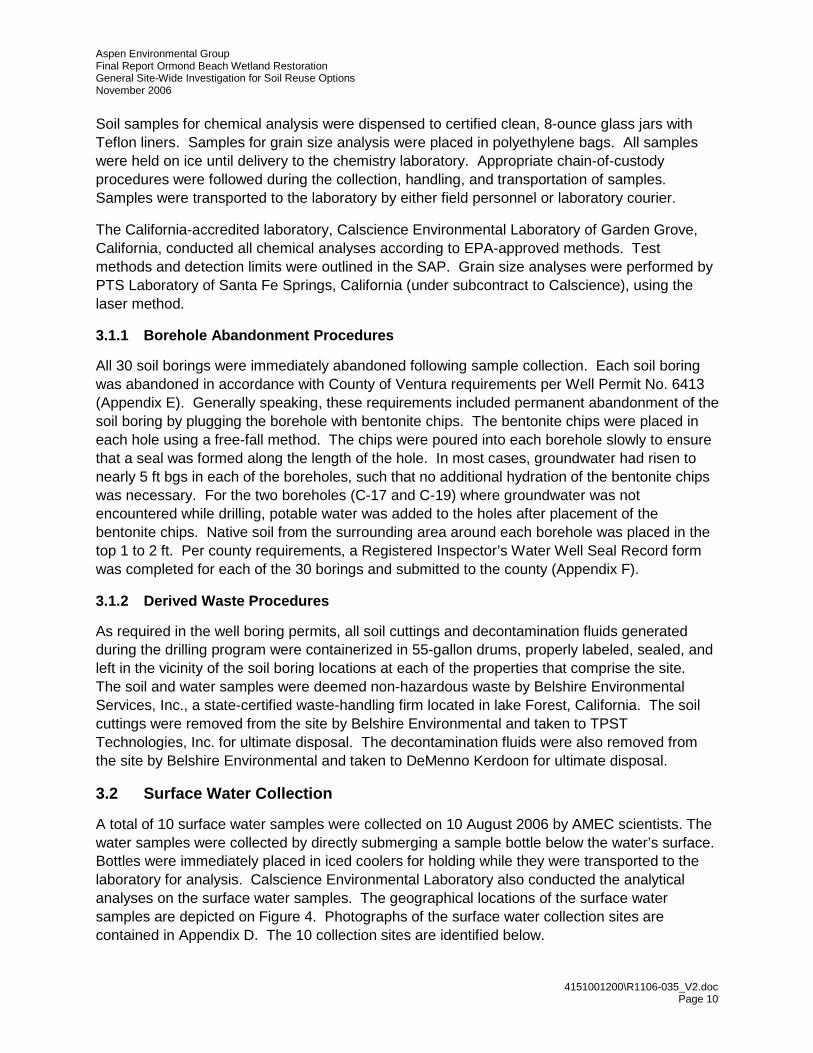
Soil samples for chemical analysis were dispensed to certified clean, 8-ounce glass jars with Teflon liners. Samples for grain size analysis were placed in polyethylene bags. All samples were held on ice until delivery to the chemistry laboratory. Appropriate chain-of-custody procedures were followed during the collection, handling, and transportation of samples. Samples were transported to the laboratory by either field personnel or laboratory courier.
The California-accredited laboratory, Calscience Environmental Laboratory of Garden Grove, California, conducted all chemical analyses according to EPA-approved methods. Test methods and detection limits were outlined in the SAP. Grain size analyses were performed by PTS Laboratory of Santa Fe Springs, California (under subcontract to Calscience), using the laser method.
3.1.1 Borehole Abandonment Procedures
All 30 soil borings were immediately abandoned following sample collection. Each soil boring was abandoned in accordance with County of Ventura requirements per Well Permit No. 6413 (Appendix E). Generally speaking, these requirements included permanent abandonment of the soil boring by plugging the borehole with bentonite chips. The bentonite chips were placed in each hole using a free-fall method. The chips were poured into each borehole slowly to ensure that a seal was formed along the length of the hole. In most cases, groundwater had risen to nearly 5 ft bgs in each of the boreholes, such that no additional hydration of the bentonite chips was necessary. For the two boreholes (C-17 and C-19) where groundwater was not encountered while drilling, potable water was added to the holes after placement of the bentonite chips. Native soil from the surrounding area around each borehole was placed in the top 1 to 2 ft. Per county requirements, a Registered Inspector’s Water Well Seal Record form was completed for each of the 30 borings and submitted to the county (Appendix F).
3.1.2 Derived Waste Procedures
As required in the well boring permits, all soil cuttings and decontamination fluids generated during the drilling program were containerized in 55-gallon drums, properly labeled, sealed, and left in the vicinity of the soil boring locations at each of the properties that comprise the site. The soil and water samples were deemed non-hazardous waste by Belshire Environmental Services, Inc., a state-certified waste-handling firm located in lake Forest, California. The soil cuttings were removed from the site by Belshire Environmental and taken to TPST Technologies, Inc. for ultimate disposal. The decontamination fluids were also removed from the site by Belshire Environmental and taken to DeMenno Kerdoon for ultimate disposal.
3.2 Surface Water Collection
A total of 10 surface water samples were collected on 10 August 2006 by AMEC scientists. The water samples were collected by directly submerging a sample bottle below the water’s surface. Bottles were immediately placed in iced coolers for holding while they were transported to the laboratory for analysis. Calscience Environmental Laboratory also conducted the analytical analyses on the surface water samples. The geographical locations of the surface water samples are depicted on Figure 4. Photographs of the surface water collection sites are contained in Appendix D. The 10 collection sites are identified below.
Aspen Environmental Group Final Report Ormond Beach Wetland Restoration General Site-Wide Investigation for Soil Reuse Options November 2006
4151001200\R1106-035_V2.doc Page 11
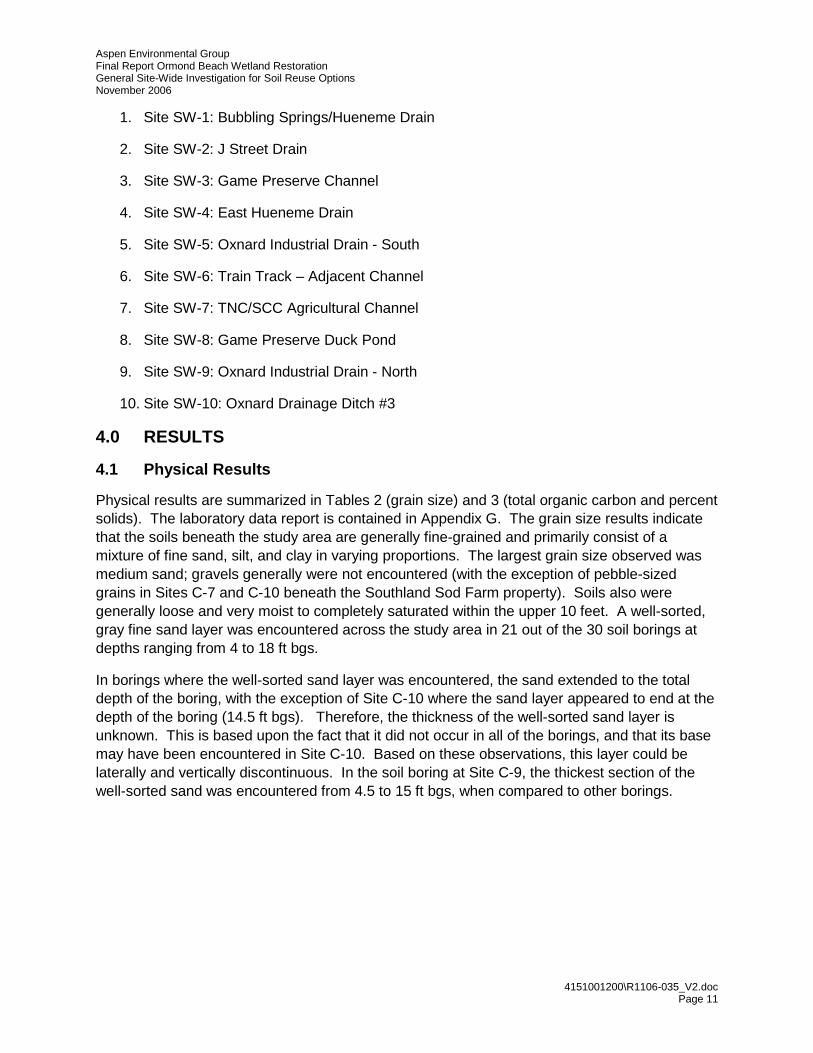
1. Site SW-1: Bubbling Springs/Hueneme Drain
2. Site SW-2: J Street Drain
3. Site SW-3: Game Preserve Channel
4. Site SW-4: East Hueneme Drain
5. Site SW-5: Oxnard Industrial Drain - South
6. Site SW-6: Train Track – Adjacent Channel
7. Site SW-7: TNC/SCC Agricultural Channel
8. Site SW-8: Game Preserve Duck Pond
9. Site SW-9: Oxnard Industrial Drain - North
10. Site SW-10: Oxnard Drainage Ditch #3
4.0 RESULTS
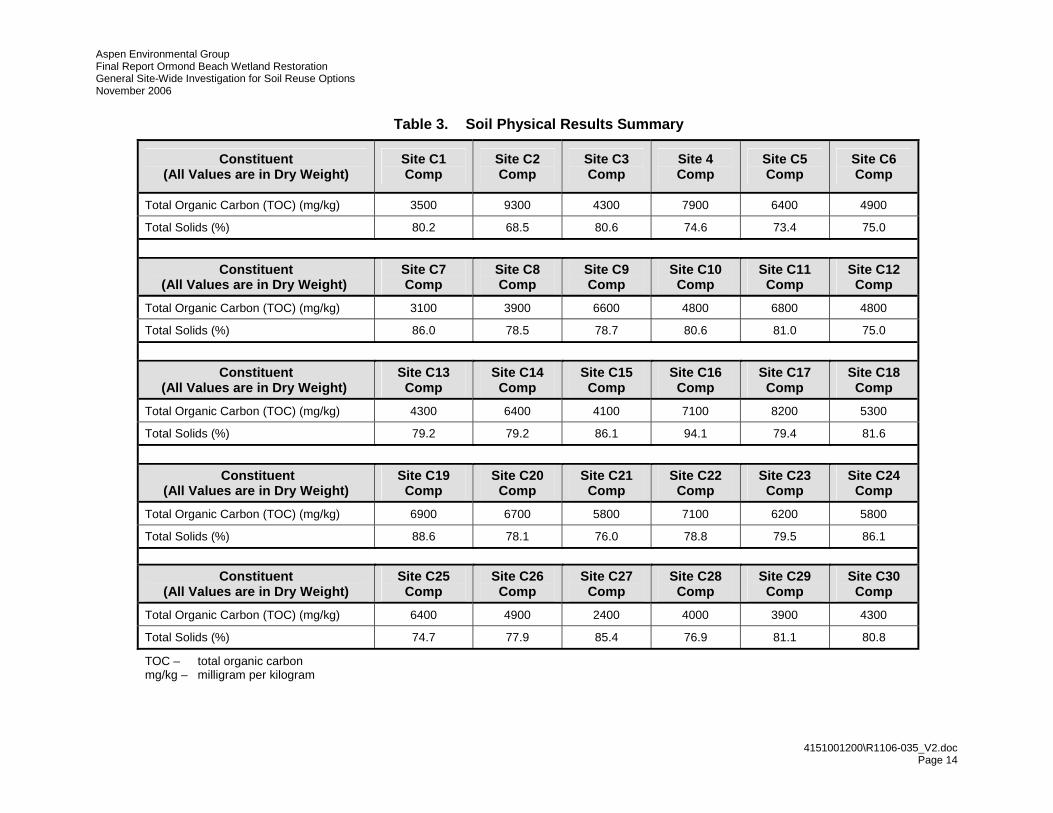
4.1 Physical Results
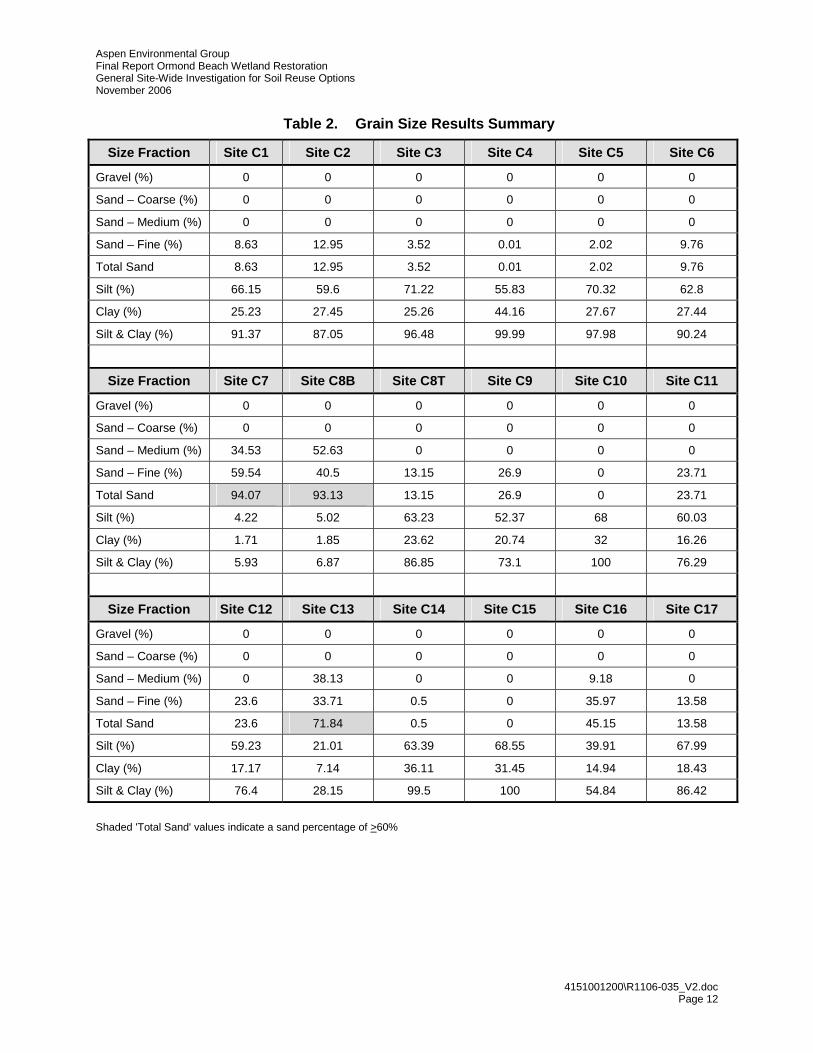
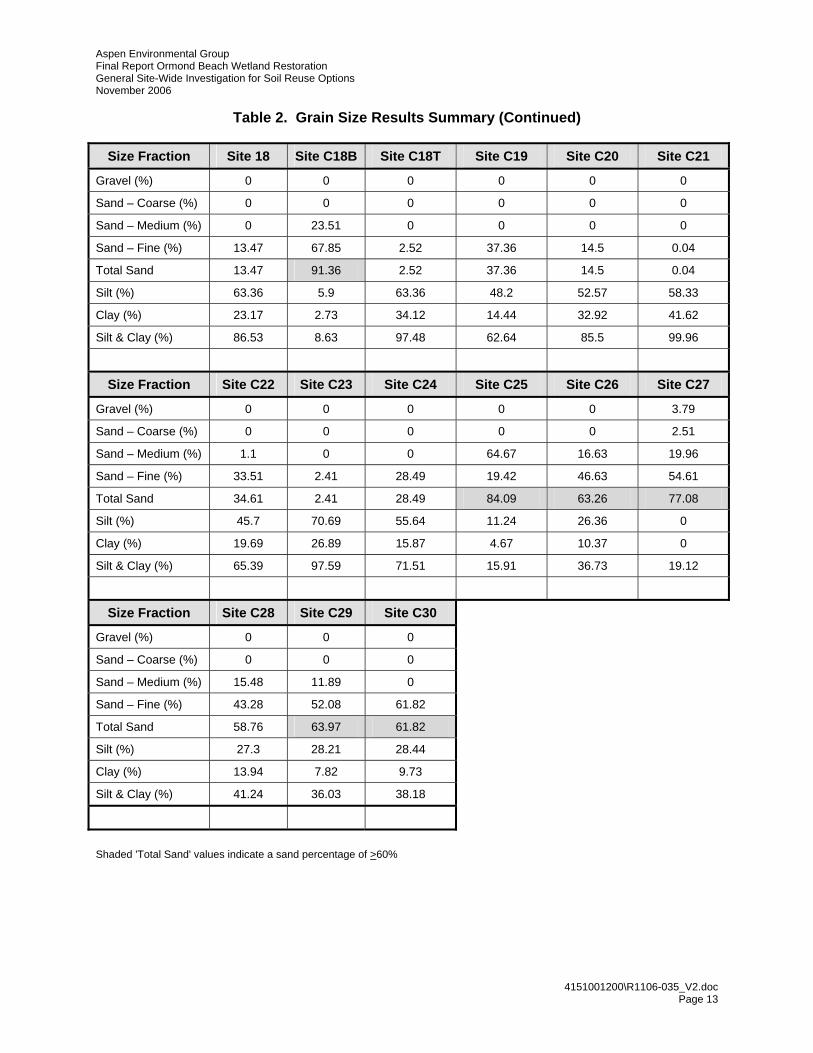
Physical results are summarized in Tables 2 (grain size) and 3 (total organic carbon and percent solids). The laboratory data report is contained in Appendix G. The grain size results indicate that the soils beneath the study area are generally fine-grained and primarily consist of a mixture of fine sand, silt, and clay in varying proportions. The largest grain size observed was medium sand; gravels generally were not encountered (with the exception of pebble-sized grains in Sites C-7 and C-10 beneath the Southland Sod Farm property). Soils also were generally loose and very moist to completely saturated within the upper 10 feet. A well-sorted, gray fine sand layer was encountered across the study area in 21 out of the 30 soil borings at depths ranging from 4 to 18 ft bgs.
In borings where the well-sorted sand layer was encountered, the sand extended to the total depth of the boring, with the exception of Site C-10 where the sand layer appeared to end at the depth of the boring (14.5 ft bgs). Therefore, the thickness of the well-sorted sand layer is unknown. This is based upon the fact that it did not occur in all of the borings, and that its base may have been encountered in Site C-10. Based on these observations, this layer could be laterally and vertically discontinuous. In the soil boring at Site C-9, the thickest section of the well-sorted sand was encountered from 4.5 to 15 ft bgs, when compared to other borings.
Aspen Environmental Group Final Report Ormond Beach Wetland Restoration General Site-Wide Investigation for Soil Reuse Options November 2006
4151001200\R1106-035_V2.doc Page 12
Table 2. Grain Size Results Summary
Size Fraction Site C1 Site C2 Site C3 Site C4 Site C5 Site C6
Gravel (%) 0 0 0 0 0 0
Sand – Coarse (%) 0 0 0 0 0 0
Sand – Medium (%) 0 0 0 0 0 0
Sand – Fine (%) 8.63 12.95 3.52 0.01 2.02 9.76
Total Sand 8.63 12.95 3.52 0.01 2.02 9.76
Silt (%) 66.15 59.6 71.22 55.83 70.32 62.8
Clay (%) 25.23 27.45 25.26 44.16 27.67 27.44
Silt & Clay (%) 91.37 87.05 96.48 99.99 97.98 90.24
Size Fraction Site C7 Site C8B Site C8T Site C9 Site C10 Site C11
Gravel (%) 0 0 0 0 0 0
Sand – Coarse (%) 0 0 0 0 0 0
Sand – Medium (%) 34.53 52.63 0 0 0 0
Sand – Fine (%) 59.54 40.5 13.15 26.9 0 23.71
Total Sand 94.07 93.13 13.15 26.9 0 23.71
Silt (%) 4.22 5.02 63.23 52.37 68 60.03
Clay (%) 1.71 1.85 23.62 20.74 32 16.26
Silt & Clay (%) 5.93 6.87 86.85 73.1 100 76.29
Size Fraction Site C12 Site C13 Site C14 Site C15 Site C16 Site C17
Gravel (%) 0 0 0 0 0 0
Sand – Coarse (%) 0 0 0 0 0 0
Sand – Medium (%) 0 38.13 0 0 9.18 0
Sand – Fine (%) 23.6 33.71 0.5 0 35.97 13.58
Total Sand 23.6 71.84 0.5 0 45.15 13.58
Silt (%) 59.23 21.01 63.39 68.55 39.91 67.99
Clay (%) 17.17 7.14 36.11 31.45 14.94 18.43
Silt & Clay (%) 76.4 28.15 99.5 100 54.84 86.42
Shaded 'Total Sand' values indicate a sand percentage of >60%
Aspen Environmental Group Final Report Ormond Beach Wetland Restoration General Site-Wide Investigation for Soil Reuse Options November 2006
4151001200\R1106-035_V2.doc Page 13
Table 2. Grain Size Results Summary (Continued)
Size Fraction Site 18 Site C18B Site C18T Site C19 Site C20 Site C21
Gravel (%) 0 0 0 0 0 0
Sand – Coarse (%) 0 0 0 0 0 0
Sand – Medium (%) 0 23.51 0 0 0 0
Sand – Fine (%) 13.47 67.85 2.52 37.36 14.5 0.04
Total Sand 13.47 91.36 2.52 37.36 14.5 0.04
Silt (%) 63.36 5.9 63.36 48.2 52.57 58.33
Clay (%) 23.17 2.73 34.12 14.44 32.92 41.62
Silt & Clay (%) 86.53 8.63 97.48 62.64 85.5 99.96
Size Fraction Site C22 Site C23 Site C24 Site C25 Site C26 Site C27
Gravel (%) 0 0 0 0 0 3.79
Sand – Coarse (%) 0 0 0 0 0 2.51
Sand – Medium (%) 1.1 0 0 64.67 16.63 19.96
Sand – Fine (%) 33.51 2.41 28.49 19.42 46.63 54.61
Total Sand 34.61 2.41 28.49 84.09 63.26 77.08
Silt (%) 45.7 70.69 55.64 11.24 26.36 0
Clay (%) 19.69 26.89 15.87 4.67 10.37 0
Silt & Clay (%) 65.39 97.59 71.51 15.91 36.73 19.12
Size Fraction Site C28 Site C29 Site C30
Gravel (%) 0 0 0
Sand – Coarse (%) 0 0 0
Sand – Medium (%) 15.48 11.89 0
Sand – Fine (%) 43.28 52.08 61.82
Total Sand 58.76 63.97 61.82
Silt (%) 27.3 28.21 28.44
Clay (%) 13.94 7.82 9.73
Silt & Clay (%) 41.24 36.03 38.18
Shaded 'Total Sand' values indicate a sand percentage of >60%
Aspen Environmental Group Final Report Ormond Beach Wetland Restoration General Site-Wide Investigation for Soil Reuse Options November 2006
4151001200\R1106-035_V2.doc Page 14
Table 3. Soil Physical Results Summary
Constituent (All Values are in Dry Weight)
Site C1 Comp
Site C2 Comp
Site C3 Comp
Site 4 Comp
Site C5 Comp
Site C6 Comp
Total Organic Carbon (TOC) (mg/kg) 3500 9300 4300 7900 6400 4900
Total Solids (%) 80.2 68.5 80.6 74.6 73.4 75.0
Constituent (All Values are in Dry Weight)
Site C7 Comp
Site C8 Comp
Site C9 Comp
Site C10 Comp
Site C11 Comp
Site C12 Comp
Total Organic Carbon (TOC) (mg/kg) 3100 3900 6600 4800 6800 4800
Total Solids (%) 86.0 78.5 78.7 80.6 81.0 75.0
Constituent (All Values are in Dry Weight)
Site C13 Comp
Site C14 Comp
Site C15 Comp
Site C16 Comp
Site C17 Comp
Site C18 Comp
Total Organic Carbon (TOC) (mg/kg) 4300 6400 4100 7100 8200 5300
Total Solids (%) 79.2 79.2 86.1 94.1 79.4 81.6
Constituent (All Values are in Dry Weight)
Site C19 Comp
Site C20 Comp
Site C21 Comp
Site C22 Comp
Site C23 Comp
Site C24 Comp
Total Organic Carbon (TOC) (mg/kg) 6900 6700 5800 7100 6200 5800
Total Solids (%) 88.6 78.1 76.0 78.8 79.5 86.1
Constituent (All Values are in Dry Weight)
Site C25 Comp
Site C26 Comp
Site C27 Comp
Site C28 Comp
Site C29 Comp
Site C30 Comp
Total Organic Carbon (TOC) (mg/kg) 6400 4900 2400 4000 3900 4300
Total Solids (%) 74.7 77.9 85.4 76.9 81.1 80.8
TOC – total organic carbon mg/kg – milligram per kilogram
Aspen Environmental Group Final Report Ormond Beach Wetland Restoration General Site-Wide Investigation for Soil Reuse Options November 2006
4151001200\R1106-035_V2.doc Page 15
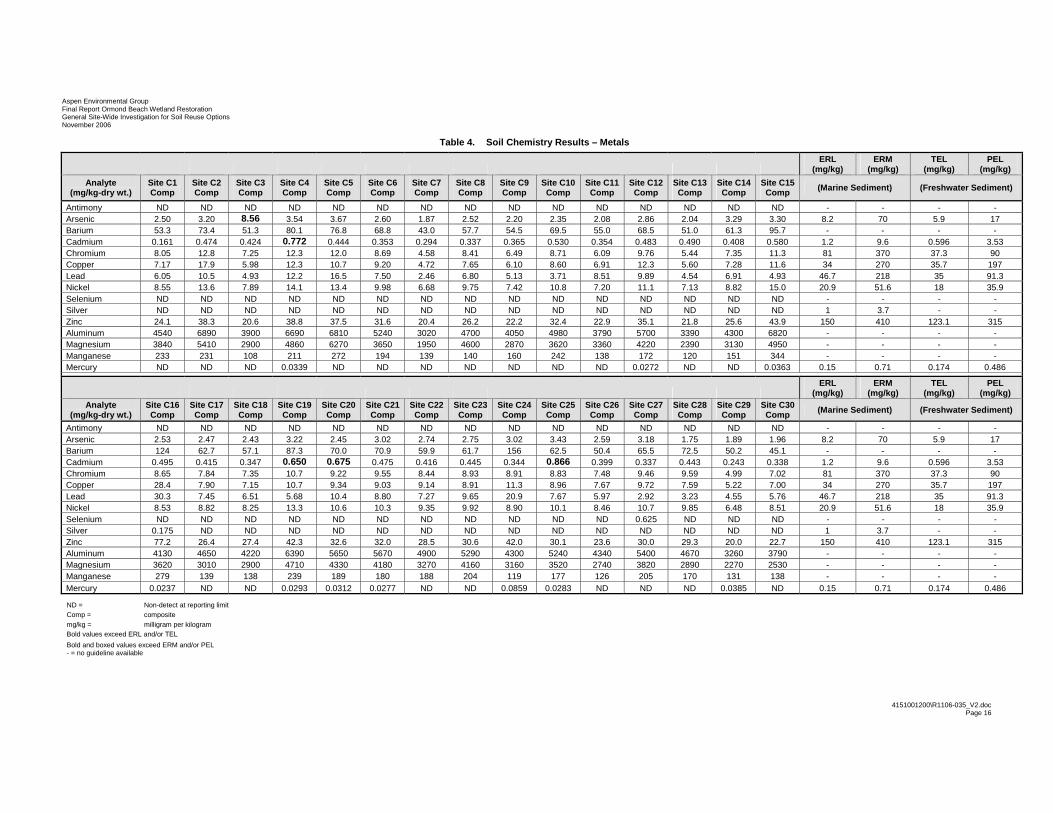
4.2 Soil Chemistry Results
Soil chemistry results are summarized in Tables 4 through 6. The laboratory data reports are contained in Appendix H. For the most part, the soil samples throughout the study area were free of chemical contaminants, with several exceptions.
At this early stage in the wetland restoration feasibility study, it is unknown where excavated soils might be placed. Comparing the study results to the marine and freshwater guidelines described below is helpful in predicting if toxic effects might occur as a result of the future unconfined aquatic disposal of the study site soil.
For comparison purposes, the soil chemistry results listed in Tables 4 through 6 are compared to applicable marine and freshwater sediment quality guidelines. The marine guidelines, ERLs and ERMs, are used to form a general opinion as to whether the chemical levels found in marine sediments are likely to have adverse impacts on sensitive organisms (Buchman 1999). These guidelines were derived by compiling empirical study data. The ERL is defined as the lower tenth percentile concentration of the available sediment toxicity data compiled. The ERM is the median concentration of the compilation of toxic samples. The freshwater threshold effects level (TEL) and probable effects level (PEL) were derived in a similar manner to the marine sediment guidelines; however, the TEL represents the geometric mean of the 15th
percentile concentration of the toxic effects data set. The PEL is the geometric mean of the 50 percent of impacted, toxic samples. Essentially, toxic effects are rarely expected to occur at concentrations less that the ERL or TEL, while toxic effects are likely to occur at concentrations above the ERM or PEL.
4.2.1 Metals
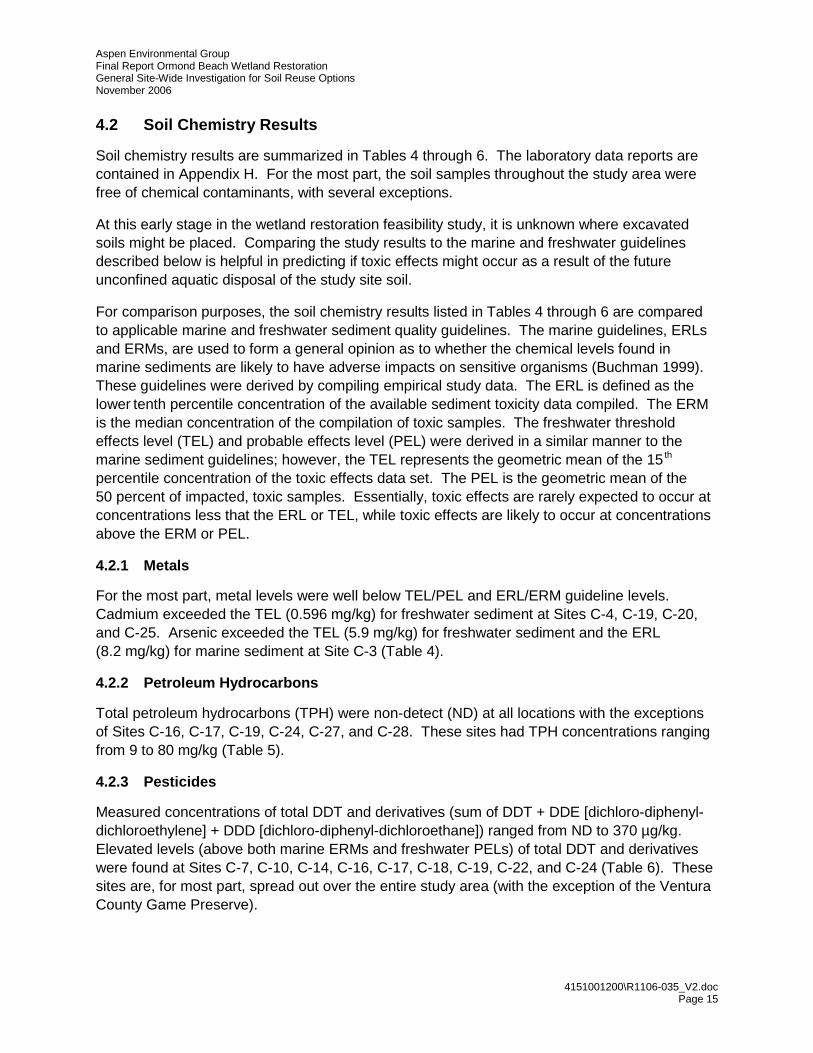
For the most part, metal levels were well below TEL/PEL and ERL/ERM guideline levels. Cadmium exceeded the TEL (0.596 mg/kg) for freshwater sediment at Sites C-4, C-19, C-20, and C-25. Arsenic exceeded the TEL (5.9 mg/kg) for freshwater sediment and the ERL (8.2 mg/kg) for marine sediment at Site C-3 (Table 4).
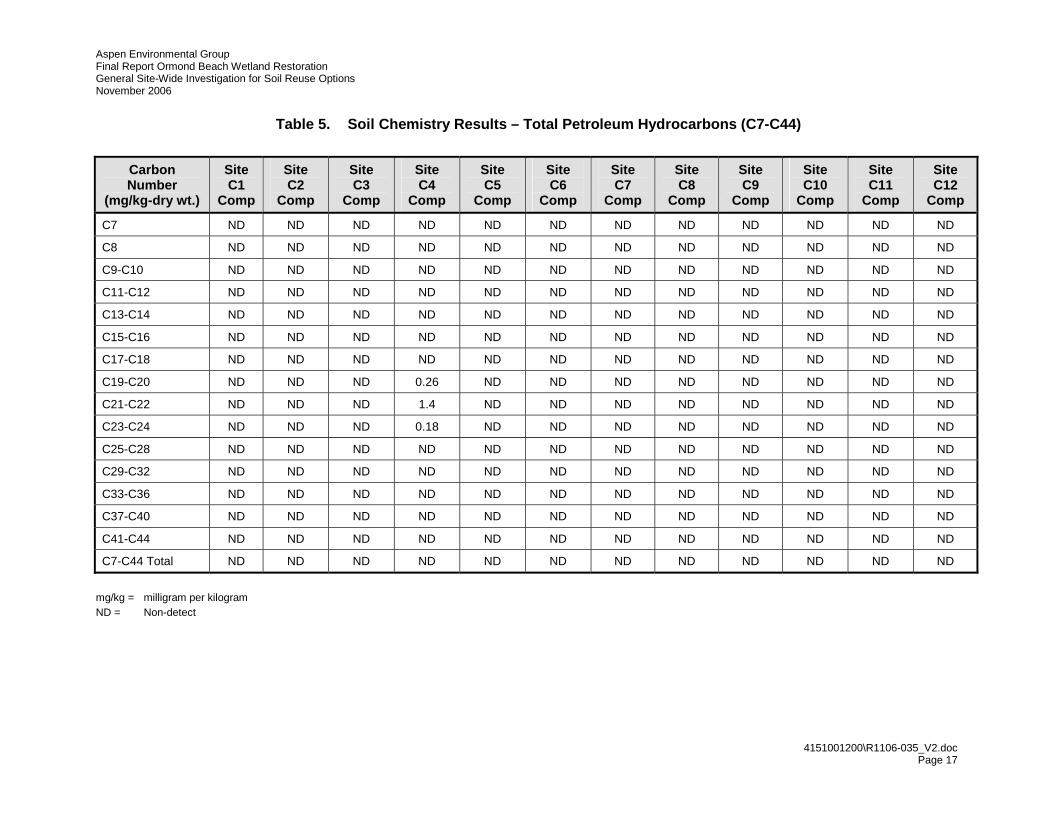
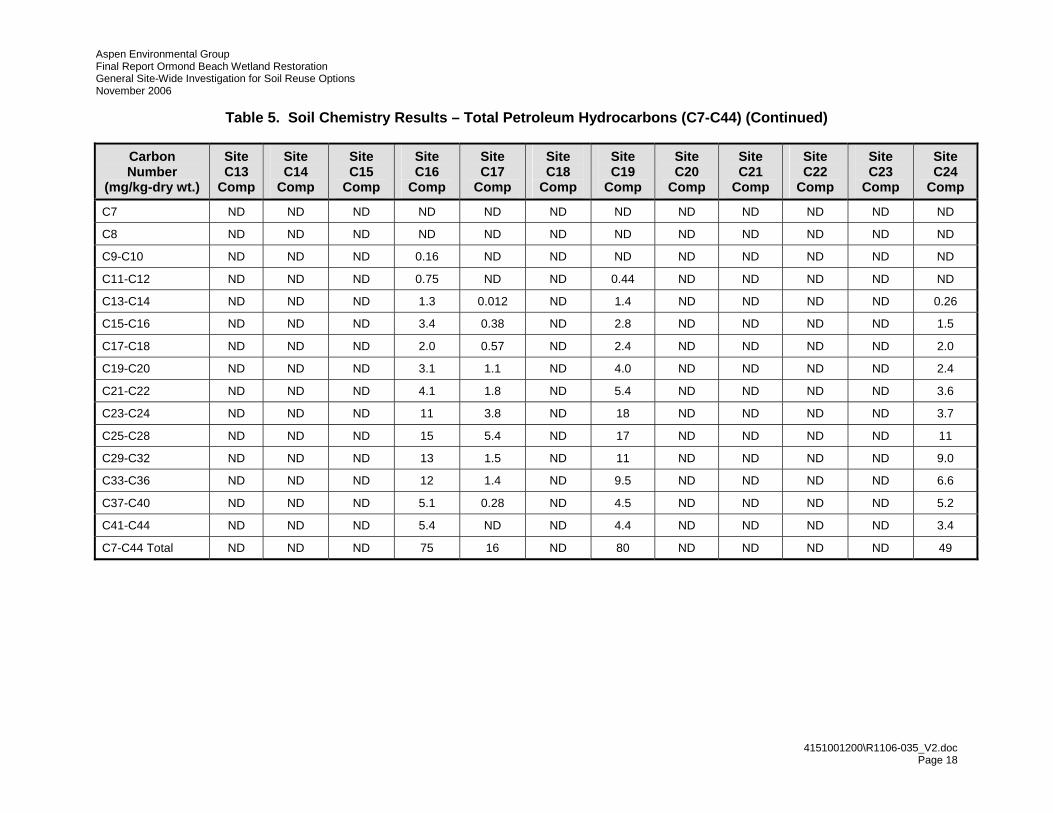
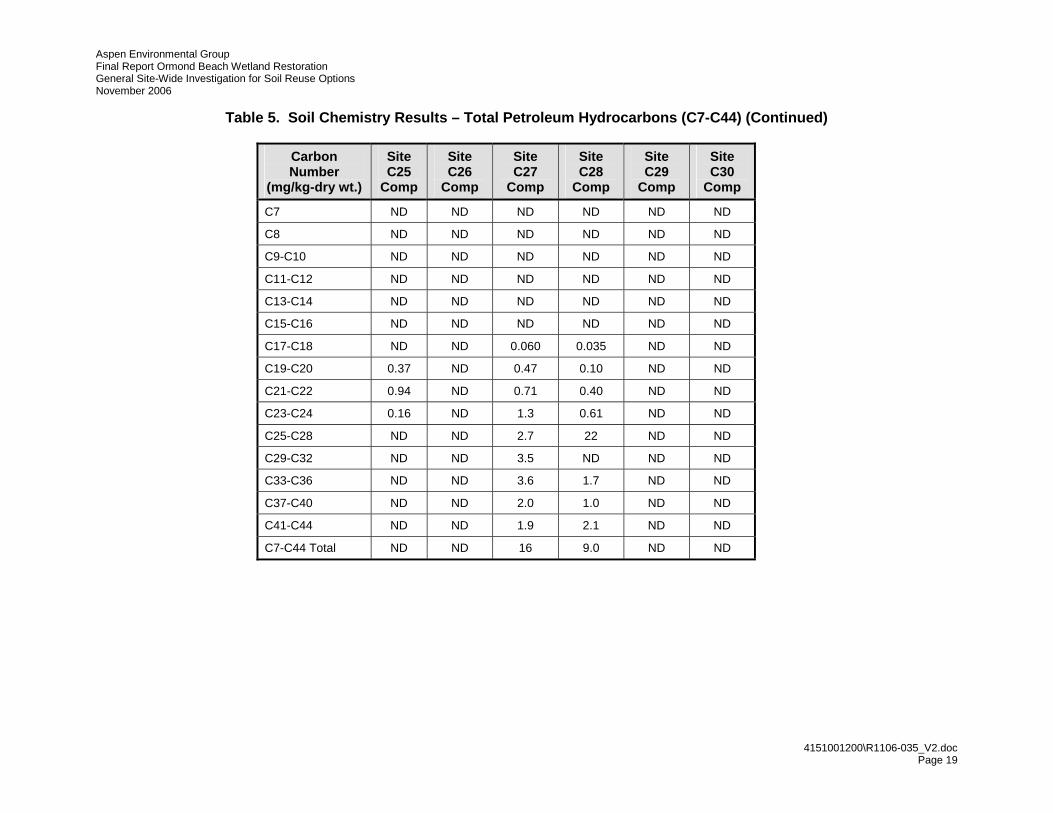
4.2.2 Petroleum Hydrocarbons
Total petroleum hydrocarbons (TPH) were non-detect (ND) at all locations with the exceptions of Sites C-16, C-17, C-19, C-24, C-27, and C-28. These sites had TPH concentrations ranging from 9 to 80 mg/kg (Table 5).
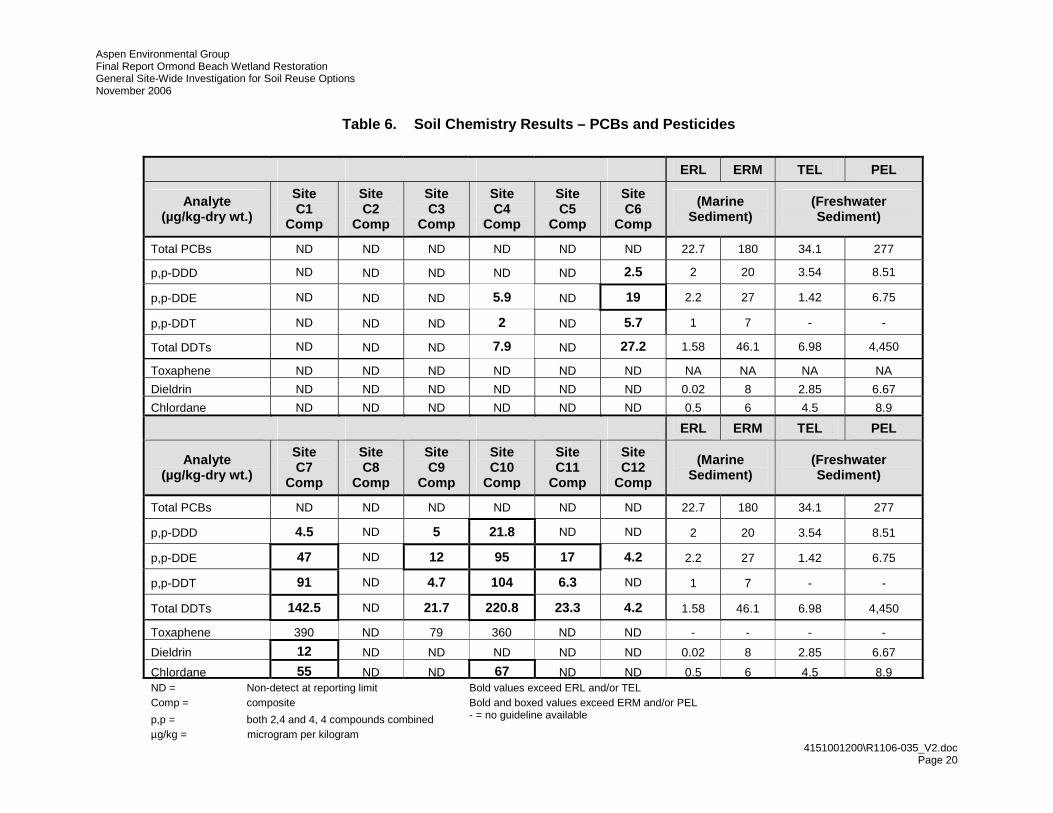
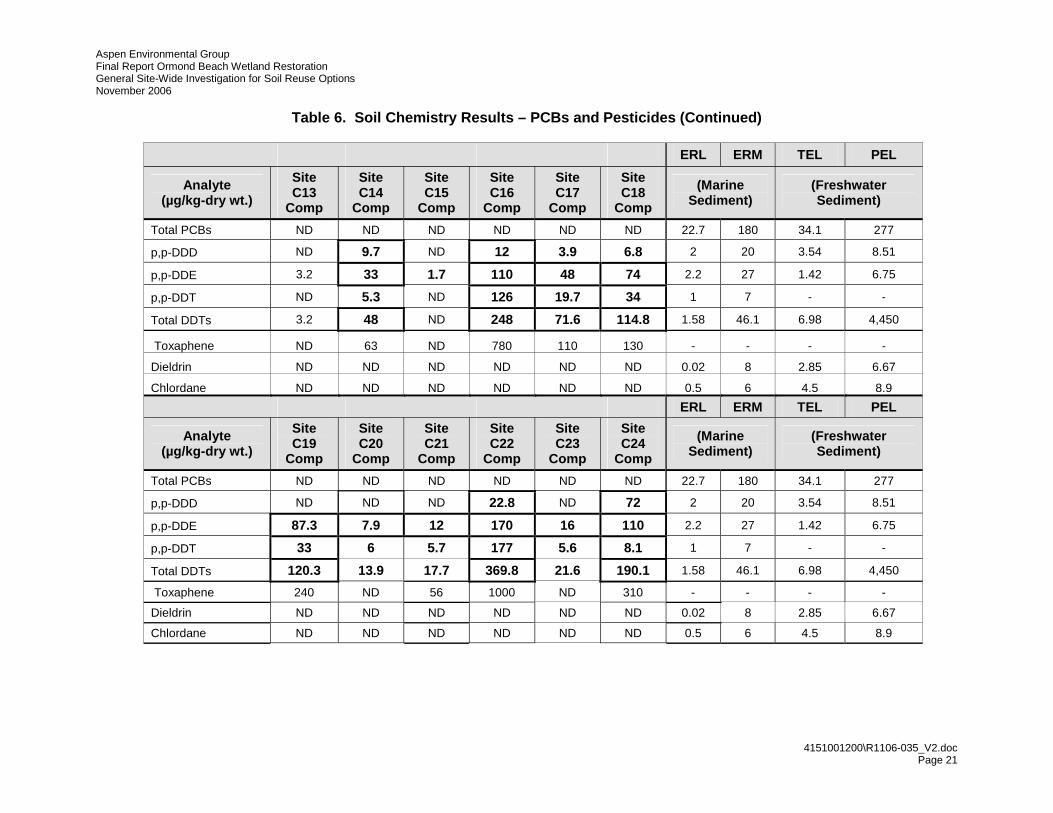
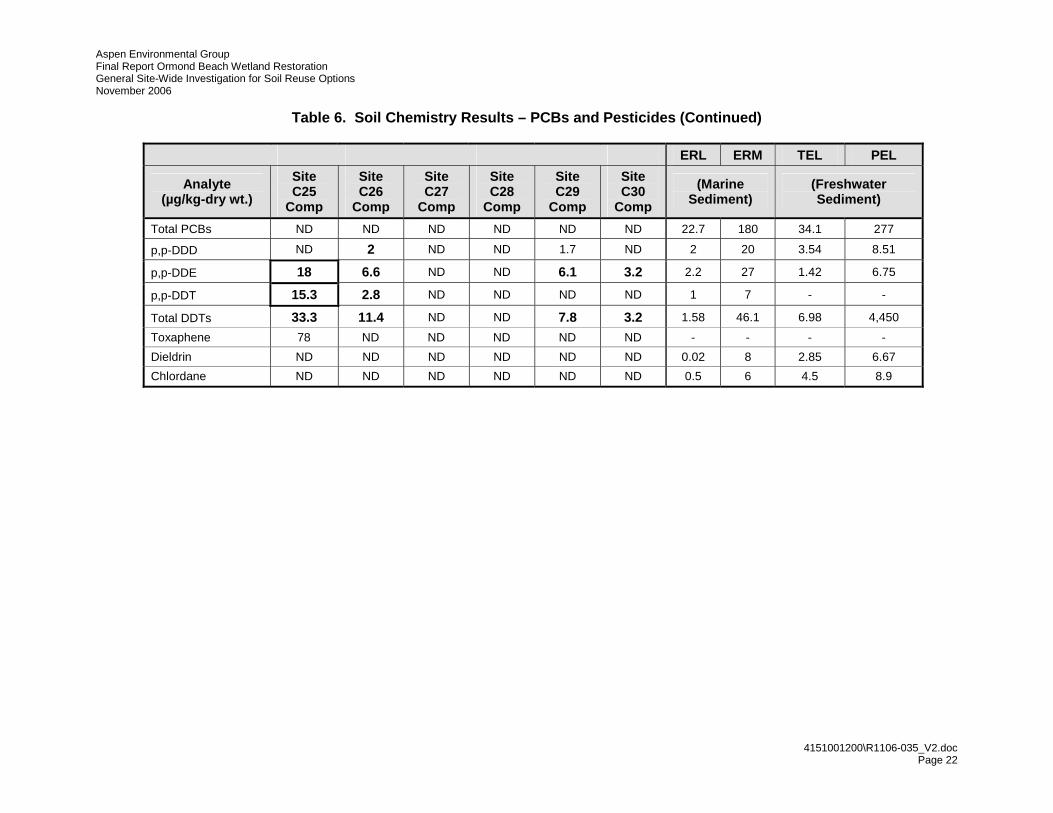
4.2.3 Pesticides
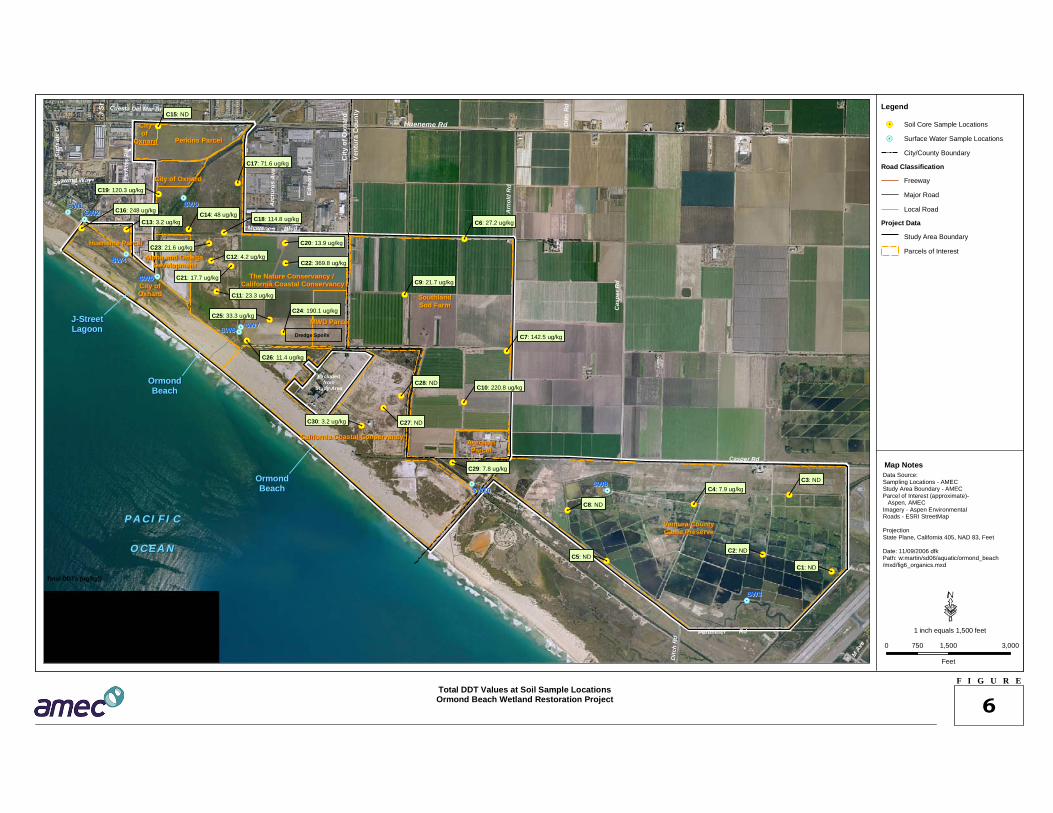
Measured concentrations of total DDT and derivatives (sum of DDT + DDE [dichloro-diphenyl-dichloroethylene] + DDD [dichloro-diphenyl-dichloroethane]) ranged from ND to 370 µg/kg. Elevated levels (above both marine ERMs and freshwater PELs) of total DDT and derivatives were found at Sites C-7, C-10, C-14, C-16, C-17, C-18, C-19, C-22, and C-24 (Table 6). These sites are, for most part, spread out over the entire study area (with the exception of the Ventura County Game Preserve).
Aspen Environmental Group Final Report Ormond Beach Wetland Restoration General Site-Wide Investigation for Soil Reuse Options November 2006
4151001200\R1106-035_V2.doc Page 16
Table 4. Soil Chemistry Results – Metals
ERL (mg/kg)
ERM (mg/kg)
TEL (mg/kg)
PEL (mg/kg)
Analyte (mg/kg-dry wt.)
Site C1 Comp
Site C2 Comp
Site C3 Comp
Site C4 Comp
Site C5 Comp
Site C6 Comp
Site C7 Comp
Site C8 Comp
Site C9 Comp
Site C10 Comp
Site C11 Comp
Site C12 Comp
Site C13 Comp
Site C14 Comp
Site C15 Comp (Marine Sediment) (Freshwater Sediment)
Antimony ND ND ND ND ND ND ND ND ND ND ND ND ND ND ND - - - - Arsenic 2.50 3.20 8.56 3.54 3.67 2.60 1.87 2.52 2.20 2.35 2.08 2.86 2.04 3.29 3.30 8.2 70 5.9 17 Barium 53.3 73.4 51.3 80.1 76.8 68.8 43.0 57.7 54.5 69.5 55.0 68.5 51.0 61.3 95.7 - - - - Cadmium 0.161 0.474 0.424 0.772 0.444 0.353 0.294 0.337 0.365 0.530 0.354 0.483 0.490 0.408 0.580 1.2 9.6 0.596 3.53 Chromium 8.05 12.8 7.25 12.3 12.0 8.69 4.58 8.41 6.49 8.71 6.09 9.76 5.44 7.35 11.3 81 370 37.3 90 Copper 7.17 17.9 5.98 12.3 10.7 9.20 4.72 7.65 6.10 8.60 6.91 12.3 5.60 7.28 11.6 34 270 35.7 197 Lead 6.05 10.5 4.93 12.2 16.5 7.50 2.46 6.80 5.13 3.71 8.51 9.89 4.54 6.91 4.93 46.7 218 35 91.3 Nickel 8.55 13.6 7.89 14.1 13.4 9.98 6.68 9.75 7.42 10.8 7.20 11.1 7.13 8.82 15.0 20.9 51.6 18 35.9 Selenium ND ND ND ND ND ND ND ND ND ND ND ND ND ND ND - - - - Silver ND ND ND ND ND ND ND ND ND ND ND ND ND ND ND 1 3.7 - - Zinc 24.1 38.3 20.6 38.8 37.5 31.6 20.4 26.2 22.2 32.4 22.9 35.1 21.8 25.6 43.9 150 410 123.1 315 Aluminum 4540 6890 3900 6690 6810 5240 3020 4700 4050 4980 3790 5700 3390 4300 6820 - - - - Magnesium 3840 5410 2900 4860 6270 3650 1950 4600 2870 3620 3360 4220 2390 3130 4950 - - - - Manganese 233 231 108 211 272 194 139 140 160 242 138 172 120 151 344 - - - - Mercury ND ND ND 0.0339 ND ND ND ND ND ND ND 0.0272 ND ND 0.0363 0.15 0.71 0.174 0.486
ERL (mg/kg)
ERM (mg/kg)
TEL (mg/kg)
PEL (mg/kg)
Analyte (mg/kg-dry wt.)
Site C16 Comp
Site C17 Comp
Site C18 Comp
Site C19 Comp
Site C20 Comp
Site C21 Comp
Site C22 Comp
Site C23 Comp
Site C24 Comp
Site C25 Comp
Site C26 Comp
Site C27 Comp
Site C28 Comp
Site C29 Comp
Site C30 Comp (Marine Sediment) (Freshwater Sediment)
Antimony ND ND ND ND ND ND ND ND ND ND ND ND ND ND ND - - - - Arsenic 2.53 2.47 2.43 3.22 2.45 3.02 2.74 2.75 3.02 3.43 2.59 3.18 1.75 1.89 1.96 8.2 70 5.9 17 Barium 124 62.7 57.1 87.3 70.0 70.9 59.9 61.7 156 62.5 50.4 65.5 72.5 50.2 45.1 - - - - Cadmium 0.495 0.415 0.347 0.650 0.675 0.475 0.416 0.445 0.344 0.866 0.399 0.337 0.443 0.243 0.338 1.2 9.6 0.596 3.53 Chromium 8.65 7.84 7.35 10.7 9.22 9.55 8.44 8.93 8.91 8.83 7.48 9.46 9.59 4.99 7.02 81 370 37.3 90 Copper 28.4 7.90 7.15 10.7 9.34 9.03 9.14 8.91 11.3 8.96 7.67 9.72 7.59 5.22 7.00 34 270 35.7 197 Lead 30.3 7.45 6.51 5.68 10.4 8.80 7.27 9.65 20.9 7.67 5.97 2.92 3.23 4.55 5.76 46.7 218 35 91.3 Nickel 8.53 8.82 8.25 13.3 10.6 10.3 9.35 9.92 8.90 10.1 8.46 10.7 9.85 6.48 8.51 20.9 51.6 18 35.9 Selenium ND ND ND ND ND ND ND ND ND ND ND 0.625 ND ND ND - - - - Silver 0.175 ND ND ND ND ND ND ND ND ND ND ND ND ND ND 1 3.7 - - Zinc 77.2 26.4 27.4 42.3 32.6 32.0 28.5 30.6 42.0 30.1 23.6 30.0 29.3 20.0 22.7 150 410 123.1 315 Aluminum 4130 4650 4220 6390 5650 5670 4900 5290 4300 5240 4340 5400 4670 3260 3790 - - - - Magnesium 3620 3010 2900 4710 4330 4180 3270 4160 3160 3520 2740 3820 2890 2270 2530 - - - - Manganese 279 139 138 239 189 180 188 204 119 177 126 205 170 131 138 - - - - Mercury 0.0237 ND ND 0.0293 0.0312 0.0277 ND ND 0.0859 0.0283 ND ND ND 0.0385 ND 0.15 0.71 0.174 0.486
ND = Non-detect at reporting limit Comp = composite mg/kg = milligram per kilogram Bold values exceed ERL and/or TEL
Bold and boxed values exceed ERM and/or PEL - = no guideline available
Aspen Environmental Group Final Report Ormond Beach Wetland Restoration General Site-Wide Investigation for Soil Reuse Options November 2006
4151001200\R1106-035_V2.doc Page 17
Table 5. Soil Chemistry Results – Total Petroleum Hydrocarbons (C7-C44)
Carbon Number
(mg/kg-dry wt.)
Site C1
Comp
Site C2
Comp
Site C3
Comp
Site C4
Comp
Site C5
Comp
Site C6
Comp
Site C7
Comp
Site C8
Comp
Site C9
Comp
Site C10
Comp
Site C11
Comp
Site C12
Comp
C7 ND ND ND ND ND ND ND ND ND ND ND ND
C8 ND ND ND ND ND ND ND ND ND ND ND ND
C9-C10 ND ND ND ND ND ND ND ND ND ND ND ND
C11-C12 ND ND ND ND ND ND ND ND ND ND ND ND
C13-C14 ND ND ND ND ND ND ND ND ND ND ND ND
C15-C16 ND ND ND ND ND ND ND ND ND ND ND ND
C17-C18 ND ND ND ND ND ND ND ND ND ND ND ND
C19-C20 ND ND ND 0.26 ND ND ND ND ND ND ND ND
C21-C22 ND ND ND 1.4 ND ND ND ND ND ND ND ND
C23-C24 ND ND ND 0.18 ND ND ND ND ND ND ND ND
C25-C28 ND ND ND ND ND ND ND ND ND ND ND ND
C29-C32 ND ND ND ND ND ND ND ND ND ND ND ND
C33-C36 ND ND ND ND ND ND ND ND ND ND ND ND
C37-C40 ND ND ND ND ND ND ND ND ND ND ND ND
C41-C44 ND ND ND ND ND ND ND ND ND ND ND ND
C7-C44 Total ND ND ND ND ND ND ND ND ND ND ND ND
mg/kg = milligram per kilogram ND = Non-detect
Aspen Environmental Group Final Report Ormond Beach Wetland Restoration General Site-Wide Investigation for Soil Reuse Options November 2006
4151001200\R1106-035_V2.doc Page 18
Table 5. Soil Chemistry Results – Total Petroleum Hydrocarbons (C7-C44) (Continued)
Carbon Number
(mg/kg-dry wt.)
Site C13
Comp
Site C14
Comp
Site C15
Comp
Site C16
Comp
Site C17
Comp
Site C18
Comp
Site C19
Comp
Site C20
Comp
Site C21
Comp
Site C22
Comp
Site C23
Comp
Site C24
Comp
C7 ND ND ND ND ND ND ND ND ND ND ND ND
C8 ND ND ND ND ND ND ND ND ND ND ND ND
C9-C10 ND ND ND 0.16 ND ND ND ND ND ND ND ND
C11-C12 ND ND ND 0.75 ND ND 0.44 ND ND ND ND ND
C13-C14 ND ND ND 1.3 0.012 ND 1.4 ND ND ND ND 0.26
C15-C16 ND ND ND 3.4 0.38 ND 2.8 ND ND ND ND 1.5
C17-C18 ND ND ND 2.0 0.57 ND 2.4 ND ND ND ND 2.0
C19-C20 ND ND ND 3.1 1.1 ND 4.0 ND ND ND ND 2.4
C21-C22 ND ND ND 4.1 1.8 ND 5.4 ND ND ND ND 3.6
C23-C24 ND ND ND 11 3.8 ND 18 ND ND ND ND 3.7
C25-C28 ND ND ND 15 5.4 ND 17 ND ND ND ND 11
C29-C32 ND ND ND 13 1.5 ND 11 ND ND ND ND 9.0
C33-C36 ND ND ND 12 1.4 ND 9.5 ND ND ND ND 6.6
C37-C40 ND ND ND 5.1 0.28 ND 4.5 ND ND ND ND 5.2
C41-C44 ND ND ND 5.4 ND ND 4.4 ND ND ND ND 3.4
C7-C44 Total ND ND ND 75 16 ND 80 ND ND ND ND 49
Aspen Environmental Group Final Report Ormond Beach Wetland Restoration General Site-Wide Investigation for Soil Reuse Options November 2006
4151001200\R1106-035_V2.doc Page 19
Table 5. Soil Chemistry Results – Total Petroleum Hydrocarbons (C7-C44) (Continued)
Carbon Number
(mg/kg-dry wt.)
Site C25
Comp
Site C26
Comp
Site C27
Comp
Site C28
Comp
Site C29
Comp
Site C30
Comp
C7 ND ND ND ND ND ND
C8 ND ND ND ND ND ND
C9-C10 ND ND ND ND ND ND
C11-C12 ND ND ND ND ND ND
C13-C14 ND ND ND ND ND ND
C15-C16 ND ND ND ND ND ND
C17-C18 ND ND 0.060 0.035 ND ND
C19-C20 0.37 ND 0.47 0.10 ND ND
C21-C22 0.94 ND 0.71 0.40 ND ND
C23-C24 0.16 ND 1.3 0.61 ND ND
C25-C28 ND ND 2.7 22 ND ND
C29-C32 ND ND 3.5 ND ND ND
C33-C36 ND ND 3.6 1.7 ND ND
C37-C40 ND ND 2.0 1.0 ND ND
C41-C44 ND ND 1.9 2.1 ND ND
C7-C44 Total ND ND 16 9.0 ND ND
Aspen Environmental Group Final Report Ormond Beach Wetland Restoration General Site-Wide Investigation for Soil Reuse Options November 2006
4151001200\R1106-035_V2.doc Page 20
Table 6. Soil Chemistry Results – PCBs and Pesticides
ERL ERM TEL PEL
Analyte (µg/kg-dry wt.)
Site C1
Comp
Site C2
Comp
Site C3
Comp
Site C4
Comp
Site C5
Comp
Site C6
Comp
(Marine Sediment)
(Freshwater Sediment)
Total PCBs ND ND ND ND ND ND 22.7 180 34.1 277
p,p-DDD ND ND ND ND ND 2.5 2 20 3.54 8.51
p,p-DDE ND ND ND 5.9 ND 19 2.2 27 1.42 6.75
p,p-DDT ND ND ND 2 ND 5.7 1 7 - -
Total DDTs ND ND ND 7.9 ND 27.2 1.58 46.1 6.98 4,450
Toxaphene ND ND ND ND ND ND NA NA NA NA
Dieldrin ND ND ND ND ND ND 0.02 8 2.85 6.67
Chlordane ND ND ND ND ND ND 0.5 6 4.5 8.9
ERL ERM TEL PEL
Analyte (µg/kg-dry wt.)
Site C7
Comp
Site C8
Comp
Site C9
Comp
Site C10
Comp
Site C11
Comp
Site C12
Comp
(Marine Sediment)
(Freshwater Sediment)
Total PCBs ND ND ND ND ND ND 22.7 180 34.1 277
p,p-DDD 4.5 ND 5 21.8 ND ND 2 20 3.54 8.51
p,p-DDE 47 ND 12 95 17 4.2 2.2 27 1.42 6.75
p,p-DDT 91 ND 4.7 104 6.3 ND 1 7 - -
Total DDTs 142.5 ND 21.7 220.8 23.3 4.2 1.58 46.1 6.98 4,450
Toxaphene 390 ND 79 360 ND ND - - - -
Dieldrin 12 ND ND ND ND ND 0.02 8 2.85 6.67
Chlordane 55 ND ND 67 ND ND 0.5 6 4.5 8.9 ND = Non-detect at reporting limit Bold values exceed ERL and/or TEL Comp = composite Bold and boxed values exceed ERM and/or PEL
p,p = both 2,4 and 4, 4 compounds combined - = no guideline available
µg/kg = microgram per kilogram
Aspen Environmental Group Final Report Ormond Beach Wetland Restoration General Site-Wide Investigation for Soil Reuse Options November 2006
4151001200\R1106-035_V2.doc Page 21
Table 6. Soil Chemistry Results – PCBs and Pesticides (Continued)
ERL ERM TEL PEL
Analyte (µg/kg-dry wt.)
Site C13
Comp
Site C14
Comp
Site C15
Comp
Site C16
Comp
Site C17
Comp
Site C18
Comp
(Marine Sediment)
(Freshwater Sediment)
Total PCBs ND ND ND ND ND ND 22.7 180 34.1 277
p,p-DDD ND 9.7 ND 12 3.9 6.8 2 20 3.54 8.51
p,p-DDE 3.2 33 1.7 110 48 74 2.2 27 1.42 6.75
p,p-DDT ND 5.3 ND 126 19.7 34 1 7 - -
Total DDTs 3.2 48 ND 248 71.6 114.8 1.58 46.1 6.98 4,450
Toxaphene ND 63 ND 780 110 130 - - - -
Dieldrin ND ND ND ND ND ND 0.02 8 2.85 6.67
Chlordane ND ND ND ND ND ND 0.5 6 4.5 8.9
ERL ERM TEL PEL
Analyte (µg/kg-dry wt.)
Site C19
Comp
Site C20
Comp
Site C21
Comp
Site C22
Comp
Site C23
Comp
Site C24
Comp
(Marine Sediment)
(Freshwater Sediment)
Total PCBs ND ND ND ND ND ND 22.7 180 34.1 277
p,p-DDD ND ND ND 22.8 ND 72 2 20 3.54 8.51
p,p-DDE 87.3 7.9 12 170 16 110 2.2 27 1.42 6.75
p,p-DDT 33 6 5.7 177 5.6 8.1 1 7 - -
Total DDTs 120.3 13.9 17.7 369.8 21.6 190.1 1.58 46.1 6.98 4,450
Toxaphene 240 ND 56 1000 ND 310 - - - -
Dieldrin ND ND ND ND ND ND 0.02 8 2.85 6.67
Chlordane ND ND ND ND ND ND 0.5 6 4.5 8.9
Aspen Environmental Group Final Report Ormond Beach Wetland Restoration General Site-Wide Investigation for Soil Reuse Options November 2006
4151001200\R1106-035_V2.doc Page 22
Table 6. Soil Chemistry Results – PCBs and Pesticides (Continued)
ERL ERM TEL PEL
Analyte (µg/kg-dry wt.)
Site C25
Comp
Site C26
Comp
Site C27
Comp
Site C28
Comp
Site C29
Comp
Site C30
Comp
(Marine Sediment)
(Freshwater Sediment)
Total PCBs ND ND ND ND ND ND 22.7 180 34.1 277
p,p-DDD ND 2 ND ND 1.7 ND 2 20 3.54 8.51
p,p-DDE 18 6.6 ND ND 6.1 3.2 2.2 27 1.42 6.75
p,p-DDT 15.3 2.8 ND ND ND ND 1 7 - -
Total DDTs 33.3 11.4 ND ND 7.8 3.2 1.58 46.1 6.98 4,450
Toxaphene 78 ND ND ND ND ND - - - -
Dieldrin ND ND ND ND ND ND 0.02 8 2.85 6.67
Chlordane ND ND ND ND ND ND 0.5 6 4.5 8.9
Aspen Environmental Group Final Report Ormond Beach Wetland Restoration General Site-Wide Investigation for Soil Reuse Options November 2006
4151001200\R1106-035_V2.doc Page 23
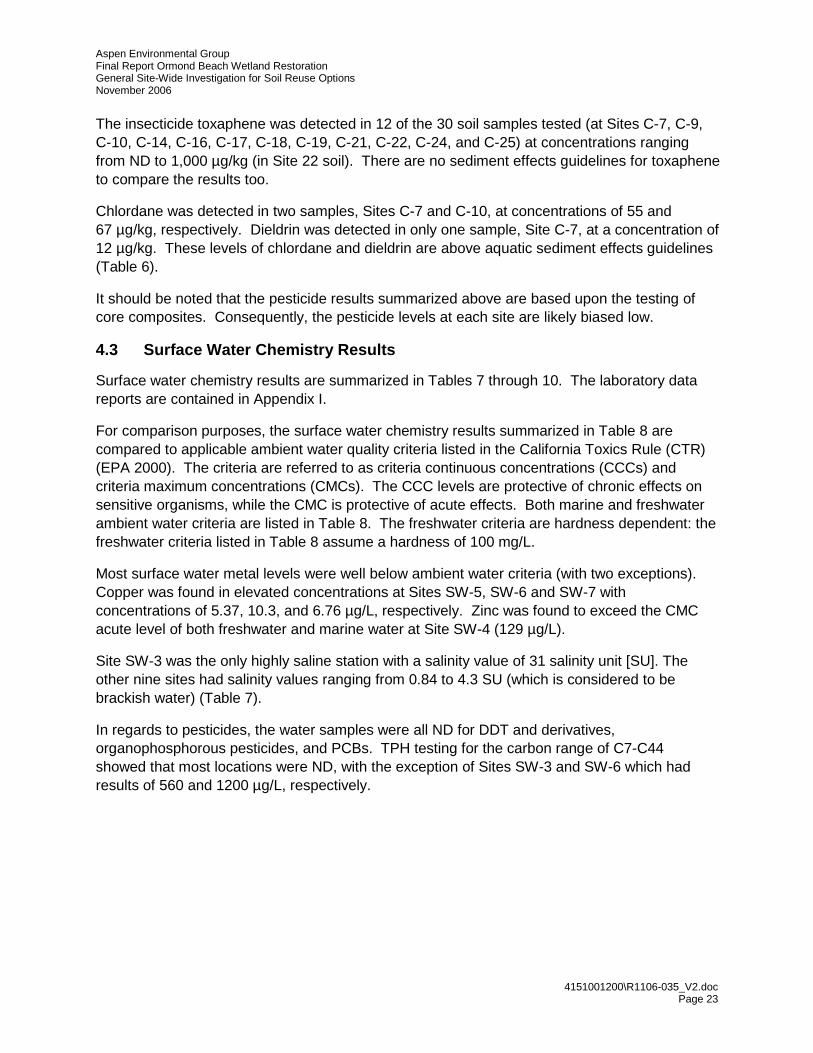
The insecticide toxaphene was detected in 12 of the 30 soil samples tested (at Sites C-7, C-9, C-10, C-14, C-16, C-17, C-18, C-19, C-21, C-22, C-24, and C-25) at concentrations ranging from ND to 1,000 µg/kg (in Site 22 soil). There are no sediment effects guidelines for toxaphene to compare the results too.
Chlordane was detected in two samples, Sites C-7 and C-10, at concentrations of 55 and 67 µg/kg, respectively. Dieldrin was detected in only one sample, Site C-7, at a concentration of 12 µg/kg. These levels of chlordane and dieldrin are above aquatic sediment effects guidelines (Table 6).
It should be noted that the pesticide results summarized above are based upon the testing of core composites. Consequently, the pesticide levels at each site are likely biased low.
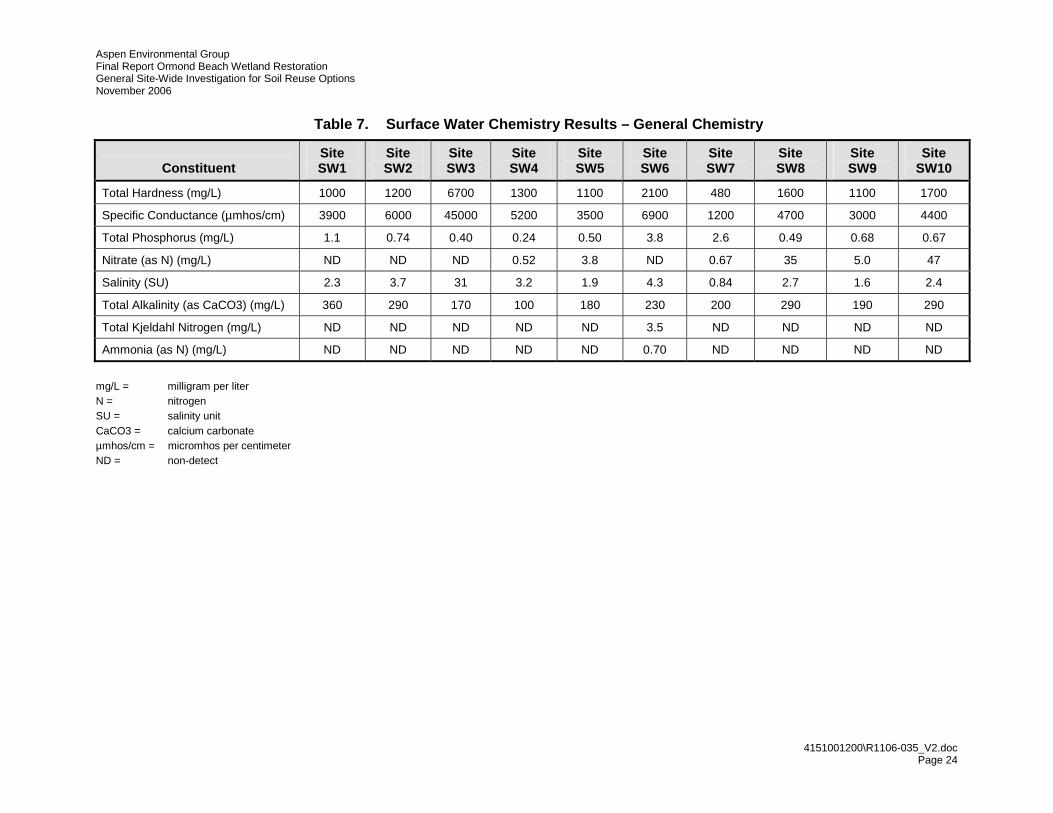
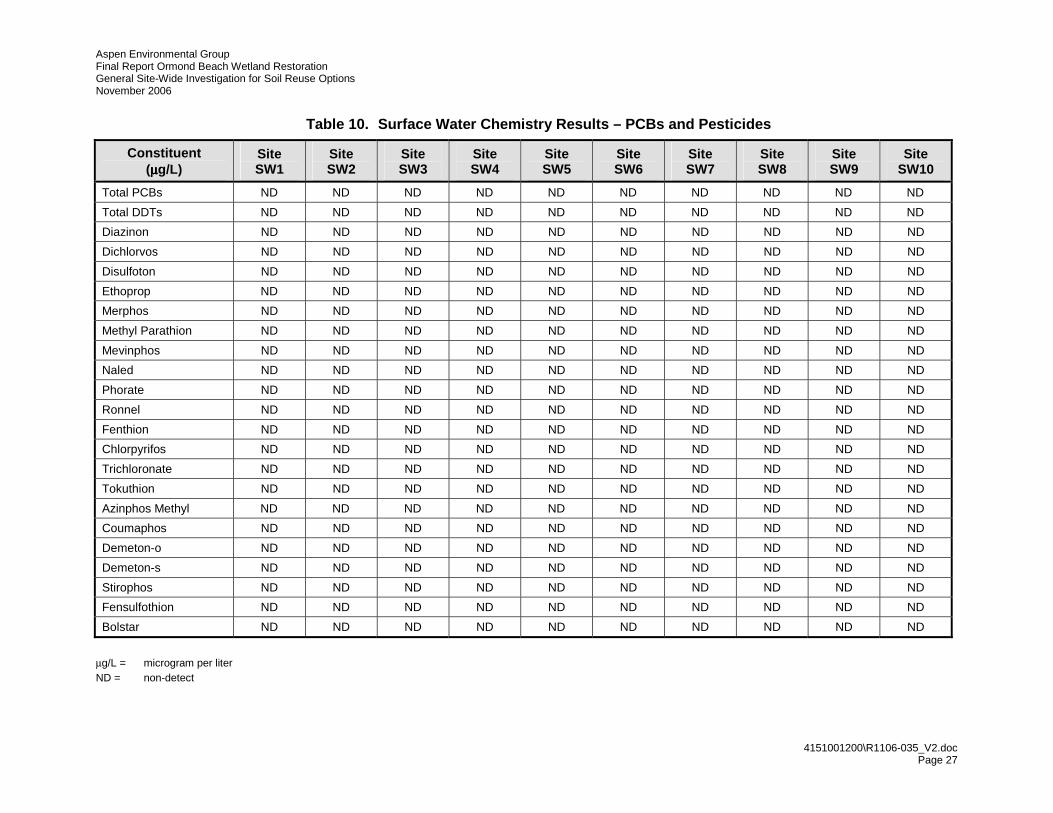
4.3 Surface Water Chemistry Results
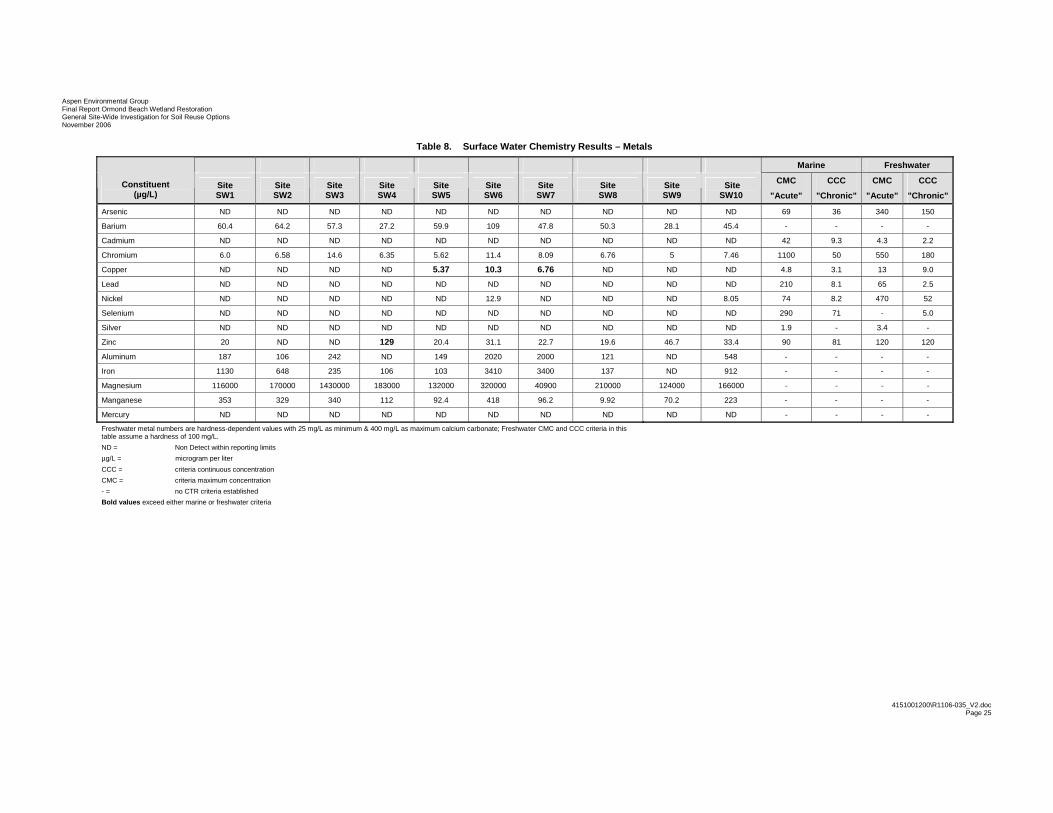
Surface water chemistry results are summarized in Tables 7 through 10. The laboratory data reports are contained in Appendix I.
For comparison purposes, the surface water chemistry results summarized in Table 8 are compared to applicable ambient water quality criteria listed in the California Toxics Rule (CTR) (EPA 2000). The criteria are referred to as criteria continuous concentrations (CCCs) and criteria maximum concentrations (CMCs). The CCC levels are protective of chronic effects on sensitive organisms, while the CMC is protective of acute effects. Both marine and freshwater ambient water criteria are listed in Table 8. The freshwater criteria are hardness dependent: the freshwater criteria listed in Table 8 assume a hardness of 100 mg/L.
Most surface water metal levels were well below ambient water criteria (with two exceptions). Copper was found in elevated concentrations at Sites SW-5, SW-6 and SW-7 with concentrations of 5.37, 10.3, and 6.76 µg/L, respectively. Zinc was found to exceed the CMC acute level of both freshwater and marine water at Site SW-4 (129 µg/L).
Site SW-3 was the only highly saline station with a salinity value of 31 salinity unit [SU]. The other nine sites had salinity values ranging from 0.84 to 4.3 SU (which is considered to be brackish water) (Table 7).
In regards to pesticides, the water samples were all ND for DDT and derivatives, organophosphorous pesticides, and PCBs. TPH testing for the carbon range of C7-C44 showed that most locations were ND, with the exception of Sites SW-3 and SW-6 which had results of 560 and 1200 µg/L, respectively.
Aspen Environmental Group Final Report Ormond Beach Wetland Restoration General Site-Wide Investigation for Soil Reuse Options November 2006
4151001200\R1106-035_V2.doc Page 24
Table 7. Surface Water Chemistry Results – General Chemistry
Constituent Site SW1
Site SW2
Site SW3
Site SW4
Site SW5
Site SW6
Site SW7
Site SW8
Site SW9
Site SW10
Total Hardness (mg/L) 1000 1200 6700 1300 1100 2100 480 1600 1100 1700
Specific Conductance (µmhos/cm) 3900 6000 45000 5200 3500 6900 1200 4700 3000 4400
Total Phosphorus (mg/L) 1.1 0.74 0.40 0.24 0.50 3.8 2.6 0.49 0.68 0.67
Nitrate (as N) (mg/L) ND ND ND 0.52 3.8 ND 0.67 35 5.0 47
Salinity (SU) 2.3 3.7 31 3.2 1.9 4.3 0.84 2.7 1.6 2.4
Total Alkalinity (as CaCO3) (mg/L) 360 290 170 100 180 230 200 290 190 290
Total Kjeldahl Nitrogen (mg/L) ND ND ND ND ND 3.5 ND ND ND ND
Ammonia (as N) (mg/L) ND ND ND ND ND 0.70 ND ND ND ND
mg/L = milligram per liter N = nitrogen SU = salinity unit CaCO3 = calcium carbonate µmhos/cm = micromhos per centimeter ND = non-detect
Aspen Environmental Group Final Report Ormond Beach Wetland Restoration General Site-Wide Investigation for Soil Reuse Options November 2006
4151001200\R1106-035_V2.doc Page 25
Table 8. Surface Water Chemistry Results – Metals
Marine Freshwater
CMC CCC CMC CCCConstituent (µg/L)
Site SW1
Site SW2
Site SW3
Site SW4
Site SW5
Site SW6
Site SW7
Site SW8
Site SW9
Site SW10 "Acute" "Chronic" "Acute" "Chronic"
Arsenic ND ND ND ND ND ND ND ND ND ND 69 36 340 150
Barium 60.4 64.2 57.3 27.2 59.9 109 47.8 50.3 28.1 45.4 - - - -
Cadmium ND ND ND ND ND ND ND ND ND ND 42 9.3 4.3 2.2
Chromium 6.0 6.58 14.6 6.35 5.62 11.4 8.09 6.76 5 7.46 1100 50 550 180
Copper ND ND ND ND 5.37 10.3 6.76 ND ND ND 4.8 3.1 13 9.0
Lead ND ND ND ND ND ND ND ND ND ND 210 8.1 65 2.5
Nickel ND ND ND ND ND 12.9 ND ND ND 8.05 74 8.2 470 52
Selenium ND ND ND ND ND ND ND ND ND ND 290 71 - 5.0
Silver ND ND ND ND ND ND ND ND ND ND 1.9 - 3.4 -
Zinc 20 ND ND 129 20.4 31.1 22.7 19.6 46.7 33.4 90 81 120 120
Aluminum 187 106 242 ND 149 2020 2000 121 ND 548 - - - -
Iron 1130 648 235 106 103 3410 3400 137 ND 912 - - - -
Magnesium 116000 170000 1430000 183000 132000 320000 40900 210000 124000 166000 - - - -
Manganese 353 329 340 112 92.4 418 96.2 9.92 70.2 223 - - - -
Mercury ND ND ND ND ND ND ND ND ND ND - - - -
Freshwater metal numbers are hardness-dependent values with 25 mg/L as minimum & 400 mg/L as maximum calcium carbonate; Freshwater CMC and CCC criteria in this table assume a hardness of 100 mg/L.
ND = Non Detect within reporting limits
µg/L = microgram per liter
CCC = criteria continuous concentration
CMC = criteria maximum concentration
- = no CTR criteria established
Bold values exceed either marine or freshwater criteria

Aspen Environmental Group Final Report Ormond Beach Wetland Restoration General Site-Wide Investigation for Soil Reuse Options November 2006
4151001200\R1106-035_V2.doc Page 26
Table 9. Surface Water Chemistry Results – TPH (C7-C44)
Carbon Number (µµµµg/L)
Site SW1
Site SW2
Site SW3
Site SW4
Site SW5
Site SW6
Site SW7
Site SW8
Site SW9
Site SW10
C7 ND ND ND ND ND ND ND ND ND ND
C8 ND ND ND ND ND 17 ND ND ND ND
C9-C10 ND ND ND ND ND 3.8 ND ND ND ND
C11-C12 ND ND 6.5 ND 0.067 30 ND ND 2.3 ND
C13-C14 ND ND 11 ND 11 60 ND ND 9.0 ND
C15-C16 9.1 ND 12 3.1 12 78 ND ND ND ND
C17-C18 19 2.2 31 13 15 120 ND 1.0 ND 4.6
C19-C20 33 9.1 62 31 33 170 14 78 7.6 10
C21-C22 59 9.7 49 23 36 120 15 8.6 7.6 12
C23-C24 30 4.8 39 28 46 130 13 5.2 6.9 10
C25-C28 87 16 96 72 97 140 36 12 4.0 7.1
C29-C32 63 25 110 59 72 170 38 20 16 18
C33-C36 42 17 100 33 33 130 29 11 12 13
C37-C40 17 8.9 16 11 13 15 29 18 14 9.6
C41-C44 9.3 6.7 20 2.7 2.4 11 12 10 8.3 2.8
C7-C44 Total ND ND 560 ND ND 1200 ND ND ND ND
µg/L = microgram per liter ND = non-detect
Aspen Environmental Group Final Report Ormond Beach Wetland Restoration General Site-Wide Investigation for Soil Reuse Options November 2006
4151001200\R1106-035_V2.doc Page 27
Table 10. Surface Water Chemistry Results – PCBs and Pesticides
Constituent (µµµµg/L)
Site SW1
Site SW2
Site SW3
Site SW4
Site SW5
Site SW6
Site SW7
Site SW8
Site SW9
Site SW10
Total PCBs ND ND ND ND ND ND ND ND ND ND
Total DDTs ND ND ND ND ND ND ND ND ND ND
Diazinon ND ND ND ND ND ND ND ND ND ND
Dichlorvos ND ND ND ND ND ND ND ND ND ND
Disulfoton ND ND ND ND ND ND ND ND ND ND
Ethoprop ND ND ND ND ND ND ND ND ND ND
Merphos ND ND ND ND ND ND ND ND ND ND
Methyl Parathion ND ND ND ND ND ND ND ND ND ND
Mevinphos ND ND ND ND ND ND ND ND ND ND
Naled ND ND ND ND ND ND ND ND ND ND
Phorate ND ND ND ND ND ND ND ND ND ND
Ronnel ND ND ND ND ND ND ND ND ND ND
Fenthion ND ND ND ND ND ND ND ND ND ND
Chlorpyrifos ND ND ND ND ND ND ND ND ND ND
Trichloronate ND ND ND ND ND ND ND ND ND ND
Tokuthion ND ND ND ND ND ND ND ND ND ND
Azinphos Methyl ND ND ND ND ND ND ND ND ND ND
Coumaphos ND ND ND ND ND ND ND ND ND ND
Demeton-o ND ND ND ND ND ND ND ND ND ND
Demeton-s ND ND ND ND ND ND ND ND ND ND
Stirophos ND ND ND ND ND ND ND ND ND ND
Fensulfothion ND ND ND ND ND ND ND ND ND ND
Bolstar ND ND ND ND ND ND ND ND ND ND
µg/L = microgram per liter ND = non-detect
Aspen Environmental Group Final Report Ormond Beach Wetland Restoration General Site-Wide Investigation for Soil Reuse Options November 2006
4151001200\R1106-035_V2.doc Page 28
5.0 DISCUSSION
The purpose of this study is to provide a general site-wide assessment of the soil and surface water within the Ormond Beach Wetland Restoration site boundary. The assessment involved characterizing soil grain size and chemical contamination as well as surface water chemistry. This study was prompted by the fact that previous studies conducted within the project footprint did not provide adequate information to make informed decisions regarding soils or surface water. While this study is more focused, it is not a definitive evaluation of the restoration site. Based upon the results contained in this report, additional focused studies will likely be deemed necessary as the restoration project proceeds in to more advanced stages (e.g., environmental review in accordance with CEQA and NEPA).
This investigation involved assessment in large areas that previously had been unstudied, including: the Ventura County Game Preserve; the triangular ‘Hueneme Parcel’ owned by the City of Oxnard west of where Perkins Road dead ends; the City of Oxnard’s property bounded by Hueneme Road and Perkins Road (the site of an advanced water purification facility, which is currently under construction); and portions of Southland Sod Farm. In addition to expanding the lateral dataset into unstudied area, this study involved collection of soil samples to depths previously unsampled (i.e., -6.5 ft NAVD), and testing of chemical constituents omitted from prior sampling and testing programs.
5.1 Soil Reuse Options
A key question for every wetland restoration project is where to dispose of and/or beneficially reuse excavated soils. Beneficial reuse options for excavated soils include beach nourishment, nearshore placement for littoral cell replenishment, river berm or levee construction, upland fill for contouring or revegetation, and structural fill. The preferred option for many coastal restoration projects is beach nourishment. This option provides a cost-effective method of disposing of excavated soils, while also providing a much needed benefit to eroding southern California beaches.
General guidelines for the suitability of dredged or excavated material for beach nourishment include:
• Physically compatible material meeting Clean Water Act §230.60 criteria (see below); or, • Physically compatible material with contamination levels equal to or less than beach
materials found at the nourishment site; or, • Chemically compatible material that passes Tier III testing and does not exceed
contamination levels acceptable for ecological and human receptor exposure.
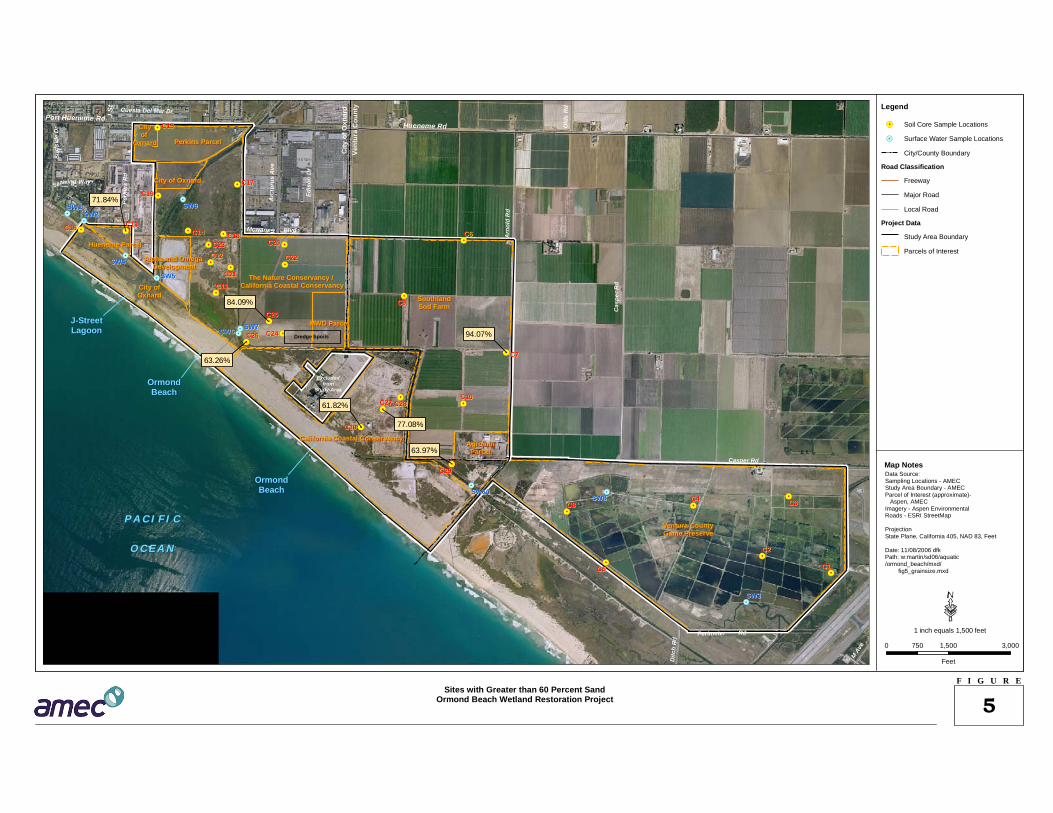
Clean Water Act §230.60(a), in part, states that the dredged or fill material will most likely to be free from chemical, biological, or other pollutants where it is composed primarily of sand, gravel, or other naturally occurring inert material. Grain size results dictate whether the sediment qualifies to be used for nearshore or onshore beach nourishment. In general, sediment to be used for on-beach nourishment purposes should be greater than 80 percent sand and greater than 0.075 mm. In addition, it should be similar to the material already present at the proposed receiver beach. For nearshore placement (>30 ft deep), the percentage of sand needed would

Aspen Environmental Group Final Report Ormond Beach Wetland Restoration General Site-Wide Investigation for Soil Reuse Options November 2006
4151001200\R1106-035_V2.doc Page 29
be less than 80 percent. For this study, 60 percent was chosen as a level at which nearshore placement might be considered (this is not based upon any regulatory criteria or guidance).
The sites with greater than 60 percent sand are identified on Table 2 and in Figure 5. This includes Sites C-7 (94.07 percent), C-13 (71.84 percent), C-25 (84.09 percent), C-26 (63.26 percent), C-27 (77.08 percent), C-29 (63.97 percent), and C-30 (61.82 percent). It should be noted that these samples represent top-to-bottom core composites. There are also likely to be lenses of sand found within distinct strata at the various boring locations. For the most part however, when sand was observed in the samples not listed above, it was typically found near the bottom of the core (15-20 ft bgs). Grain size sub-samples were taken within two of the sandy bottom portions, and their percent sand was high (91 percent at C18B and 93 percent at C8B). These results indicate that disposal alternatives in addition to beach placement will likely need to be pursued.
General guidelines for the suitability of dredged or excavated material for use as fill material to construct levees, create uplands habitat, and provides wetlands cover include:
• For levees - physically compatible material that contains a relatively low amount of organic material and soil with low cohesion (e.g., cobbles, pebbles, gravel, and sand). Some levels of contamination might be acceptable for levee core material that will be isolated from the surrounding environment.
• For upland habitat and wetlands cover - physically compatible material that contains a relatively low amount of organic material and soil with low cohesion (e.g., cobbles, pebbles, gravel, and sand). Some levels of contamination might be acceptable for material that is covered and, hence, isolated from the surrounding environment. The cover material that is exposed to the surrounding environment would have to be relatively clean of contaminants such that the potential for harm to human and ecological receptors is within acceptable limits. In addition, the physical and chemical characteristics of the material should be sufficient to allow for successful establishment of the target vegetation (e.g., coastal sage scrub in the upland areas and pickleweed in the high coastal salt marsh areas).
5.2 Soil Chemistry
The soil chemical analyses indicate that the study area is essentially free of metal and organic (e.g., petroleum hydrocarbons, PCB) chemical contamination, with the exception of the total DDT. Detectable levels of the pesticides total DDT and toxaphene were found throughout the study site. A geographical depiction of the total DDT results is presented in Figure 6. The total organochlorine pesticide levels observed in the study area may affect the reuse options that are pursued. Soils with the highest concentrations of pesticides may be precluded from disposal in areas that are in contact with the aquatic environment and sensitive aquatic receptors. In addition, the pesticide results reported in this study report are based upon the testing of core composites. Consequently, the pesticide levels at each site are likely biased low.
Additional analysis of these results, as well as further testing, may be necessary when specific soil reuse options are being evaluated.
AgrominParcel
AgrominParcel
Hueneme ParcelHueneme Parcel
Alpha and Omega Development
Alpha and Omega Development
City ofOxnardCity ofOxnard
California Coastal ConservancyCalifornia Coastal Conservancy
Ventura CountyGame PreserveVentura CountyGame Preserve
SouthlandSod FarmSouthlandSod Farm
Perkins ParcelPerkins Parcel
City of OxnardCity of Oxnard
The Nature Conservancy / California Coastal Conservancy
The Nature Conservancy / California Coastal Conservancy
MWD ParcelMWD Parcel
Cityof
Oxnard
Cityof
Oxnard
Dredge Spoils
J-StreetLagoonJ-StreetLagoon
OrmondBeach
OrmondBeach
OrmondBeach
OrmondBeach
Excludedfrom
Study Area
Vent
ura
Cou
nty
City
ofO
xna r
d
Cas
per R
d
Casper Rd
Ditc
h R
d
Surf
side
Dr
Arn
old
Rd
Arc
turu
s A
ve
Old
s R
d
Edis
on D
r
Perimeter Rd
Mcwane Blvd
Perk
ins
Rd
Cuesta Del Mar Dr
Seawind Way
Hueneme Rd
M Ave
J St
Port Hueneme Rd
C10C10
C7C7
C28C28C27C27
C19C19
C15C15
C16C16 C13C13
C1C1
C3C3
C5C5
C8C8C4C4
C2C2
C30C30
C9C9
C6C6
C29C29
C23C23
C11C11
C12C12
C21C21
C14C14 C18C18
C17C17
C22C22
C26C26 C24C24
C25C25
C20C20
SW10SW10
SW9SW9
SW8SW8
SW7SW7SW6SW6
SW5SW5
SW3SW3
SW4SW4
SW2SW2SW1SW1
P A C I F I C
O C E A N
P A C I F I C
O C E A N
Legend
Soil Core Sample Locations
Surface Water Sample Locations
City/County Boundary
Road Classification
Freeway
Major Road
Local Road
Project Data
Study Area Boundary
Parcels of Interest
F I G U R E
5
1 inch equals 1,500 feet
0 1,500 3,000750
Feet
Map Notes
Sites with Greater than 60 Percent SandOrmond Beach Wetland Restoration Project
Data Source:Sampling Locations - AMECStudy Area Boundary - AMECParcel of Interest (approximate)- Aspen, AMECImagery - Aspen EnvironmentalRoads - ESRI StreetMap
ProjectionState Plane, California 405, NAD 83, Feet
Date: 11/08/2006 dfkPath: w:martin/sd06/aquatic/ormond_beach/mxd/ fig5_grainsize.mxd
71.84%
84.09%
77.08%
61.82%
94.07%
63.26%
63.97%
AgrominParcel
AgrominParcel
Hueneme ParcelHueneme Parcel
Alpha and Omega Development
Alpha and Omega Development
City ofOxnardCity ofOxnard
California Coastal ConservancyCalifornia Coastal Conservancy
Ventura CountyGame PreserveVentura CountyGame Preserve
SouthlandSod FarmSouthlandSod Farm
Perkins ParcelPerkins Parcel
City of OxnardCity of Oxnard
The Nature Conservancy / California Coastal Conservancy
The Nature Conservancy / California Coastal Conservancy
MWD ParcelMWD Parcel
Cityof
Oxnard
Cityof
Oxnard
C19: 120.3 ug/kg
C30: 3.2 ug/kg
C11: 23.3 ug/kg
C12: 4.2 ug/kgC22: 369.8 ug/kg
C25: 33.3 ug/kg
C20: 13.9 ug/kg
C1: ND
C5: NDC2: ND
C13: 3.2 ug/kgC14: 48 ug/kg
C17: 71.6 ug/kg
C15: ND
C26: 11.4 ug/kg
C24: 190.1 ug/kg
C21: 17.7 ug/kg
C18: 114.8 ug/kg
C23: 21.6 ug/kg
C9: 21.7 ug/kg
C6: 27.2 ug/kg
C10: 220.8 ug/kg
C7: 142.5 ug/kg
C28: ND
C27: ND
C29: 7.8 ug/kg
C8: ND
C4: 7.9 ug/kgC3: ND
C16: 248 ug/kg
Dredge Spoils
J-StreetLagoonJ-StreetLagoon
OrmondBeach
OrmondBeach
OrmondBeach
OrmondBeach
Excludedfrom
Study Area
Vent
ura
Cou
nty
City
o fO
xnar
d
Cas
per R
d
Casper Rd
Ditc
h R
d
Surf
side
Dr
Arn
old
Rd
Arc
turu
s A
ve
Old
s R
d
Edis
on D
r
Perimeter Rd
Mcwane Blvd
Perk
ins
Rd
Cuesta Del Mar Dr
Seawind Way
Hueneme Rd
M Ave
J St
SW10SW10
SW9SW9
SW8SW8
SW7SW7SW6SW6
SW5SW5
SW3SW3
SW4SW4
SW2SW2SW1SW1
P A C I F I C
O C E A N
P A C I F I C
O C E A N
Legend
Soil Core Sample Locations
Surface Water Sample Locations
City/County Boundary
Road Classification
Freeway
Major Road
Local Road
Project Data
Study Area Boundary
Parcels of Interest
F I G U R E
6
1 inch equals 1,500 feet
0 1,500 3,000750
Feet
Map Notes
Total DDT Values at Soil Sample LocationsOrmond Beach Wetland Restoration Project
Data Source:Sampling Locations - AMECStudy Area Boundary - AMECParcel of Interest (approximate)- Aspen, AMECImagery - Aspen EnvironmentalRoads - ESRI StreetMap
ProjectionState Plane, California 405, NAD 83, Feet
Date: 11/09/2006 dfkPath: w:martin/sd06/aquatic/ormond_beach/mxd/fig6_organics.mxd
Total DDTs (ug/kg))
Aspen Environmental Group Final Report Ormond Beach Wetland Restoration General Site-Wide Investigation for Soil Reuse Options November 2006
4151001200\R1106-035_V2.doc Page 32
5.3 Surface Water Chemistry
Surface water chemistry concentrations were low and typical of what is commonly found in surface runoff associated drainages. Copper (three stations) and zinc (one station) were found slightly above ambient water criteria. No sediment samples were collected from the drainages where surface water sampling was performed. Sediments in these drainages may have elevated levels of contaminants; in particular DDT, which was found to be present in soil samples over much of the study area.
6.0 RECOMMENDATIONS
This section provides two recommendations that might be considered as logical “next steps” for the soil reuse evaluation portion of the Ormond Beach Wetland Restoration Project.
1. Based upon the composite organochlorine pesticides results presented in this report, it is recommended that the archive samples be analyzed (top, middle, and bottom core samples) to determine the actual organochlorine pesticide levels closer to the ground surface, as well as with depth in the sediment column. It should be determined at what depth soil pesticide levels reach or approach non-detect. This information will be invaluable in determining the volume of pesticide-containing soils that will need to be removed from the project area with possible agricultural reuse.
2. Due to the elevated levels of organochlorine pesticides in the study area, it would be useful to analyze for other types of pesticides (e.g., organophosphorous, pyrethroid), and possibly herbicides in the sample archives. It may be useful to discuss recent pesticide use practices with farmers or the local agricultural extension agency to help identify the analytes to be tested.
7.0 LIMITATIONS
This report and recommendations are provided for the sole use of Aspen Environmental Group, Inc. and the California Coastal Conservancy for the sole purposes outlined therein, and for the site under study. These documents may not be relied upon by any third party without the prior written agreement of AMEC.
AMEC services have been performed in accordance with the normal and reasonable standard of care exercised by similar professionals performing services under similar conditions and geographic locations. Except for our stated standard of care, no other warranties or guarantees are offered as part of AMEC’s contracted services.
The findings contained herein are relevant to the dates of AMEC's site visits and should not be relied upon to represent conditions at later dates. In the event that changes in the nature, usage or layout of the property or nearby properties are made, the conclusions and recommendations contained in this report may not be valid. If additional information becomes available, it should be provided to AMEC so that the original conclusions and recommendations can be modified as necessary.
Aspen Environmental Group Final Report Ormond Beach Wetland Restoration General Site-Wide Investigation for Soil Reuse Options November 2006
4151001200\R1106-035_V2.doc Page 33
The purpose of an environmental site assessment is to reasonably evaluate the potential for adverse impact from past practices at a given property or neighboring properties. In performing an environmental site assessment, it is understood that a balance must be struck between a reasonable inquiry into the environmental issues and an exhaustive analysis of each conceivable issue of potential concern. The professional opinions in this report are based in part on the interpretation of data from discrete sampling locations that may not represent conditions at unsampled locations.
Finally, it should be noted that no subsurface exploration can be thorough enough to exclude the possible presence of contaminants at a given site. In cases where contaminants have not been discovered through exploration, this should not be construed as a guarantee that contaminants do not exist. At a given site, environmental conditions may exist that cannot be identified by visual observation. Where sample collection and testing have been performed, AMEC's professional opinions are based in part on the interpretation of data from discrete sampling locations that may not represent conditions at unsampled locations.
The findings contained herein are relevant to the dates of the AMEC Site visit and should not be relied upon to represent conditions later. In the event that changes in the nature, usage, or layout of the property or nearby properties are made, the conclusions and recommendations contained in this report may not be valid. If additional information becomes available, it should be provided to AMEC so the original conclusions and recommendations can be modified as necessary.
The boring logs and related information included in this report are indicators of subsurface conditions only at the specific locations and times noted. Subsurface conditions, including groundwater levels, at other locations of the subject site may differ significantly from conditions that, in the opinion of AMEC, exist at the sampling locations. Note, too, that the passage of time may affect conditions at the sampling location.
The analyses and recommendations contained in this report are based on data obtained from subsurface exploration. The methods used indicate subsurface conditions only at the specific locations where samples were obtained, only at the time they were obtained, and only to the depths penetrated. Samples cannot be relied on to accurately reflect the strata variations that usually exist between sampling locations. In addition, soil samples tested in this study were composites prepared by combining multiple samples taken from various depths in the soil column. These results do not represent the exact chemical concentration at a discreet depth in the soil column tested.
The recommendations presented in this report are based upon a limited number of subsurface samples obtained from widely spaced sampling locations. The samples may not fully indicate the nature and extent of the variations that actually exist between sampling locations.
Aspen Environmental Group Final Report Ormond Beach Wetland Restoration General Site-Wide Investigation for Soil Reuse Options November 2006
4151001200\R1106-035_V2.doc Page 34
8.0 REFERENCESAMEC 2005. Ormond Beach Wetland Restoration Project - Soil Contaminant Review, January.
AMEC 2006. Final Draft, Ormond Beach Wetland Restoration, Site-Wide Soil/Surface Water Investigation, Sampling and Analysis Plan. Prepared for Aspen Environmental Group. July.
Applied Environmental Technologies, Inc. 2002. Report of a Limited Sediment Assessment of a Portion of the Oxnard Drainage District Ditch, Edison Drive to the North Side of Arnold Road, Oxnard, California. February 19.
Buchanan, M.F., 1999. NOAA Screening Quick Reference Tables, NOAA HAZMAT Report 99-1, Seattle, WA, Coastal Protection and Restoration Division, National Oceanic and Atmospheric Administration, 12 pages.
Earth Tech. 1996. Phase I Environmental Site Assessment Report, Former Western LNG Terminal/Baldwin Homes Property, Oxnard, California. December.
Environmental Protection Agency (EPA) 2000. Water Quality Standards; Establishment of Numeric Criteria for Toxic Pollutants for the State of California; Rule (20 CFE Part 131). May 18.
Gay, D., C. Gibson, J. Gress, F. Kaminsky, M. Schulz, and K. Siegler. 2001. Analysis of Contaminants and Potential Effects at the South Ormond Beach Wetland Restoration Site, Ventura County, California. Group Master’s Thesis. University of California, Santa Barbara. June.
Jones & Stokes. 1994. Final Report, South Ormond Beach Wetland Restoration and Management Plan. November. (only Section 2 was reviewed).
Los Angeles Regional Water Quality Control Board. 2003. Characterization of Wastes in Waste Management Unit – Halaco Engineering Co., Oxnard, California (File No. 70-24). Letter from Dennis Dickerson, Executive Officer. September 26.
Lowney Associates. 2001. Geotechnical Investigation, Oxnard Plain Brine Pipeline Phase 1 and 2. November 27.
Lowney Associates. 2002. Supplemental Geotechnical Exploration, Oxnard Plain Brine Two Trenchless Segments. December 10.
Ninyo & Moore. 1997. Phase II Environmental Site Assessment, Baldwin Builders (Ormond Beach) Property, Oxnard, California. January 10.
Padre Associates. 2002. Report of Findings, Characterization/Waste Sampling of Waste Management Unit, Halaco Engineering Co. Facility, Located at 6200 Perkins Road, Oxnard, Ventura County, California. Prepared for Halaco Engineering Company. November.
SECOR. 2000a. Review of Environmental Documents, SCE Tank Farm and Excess Land, Ormond Beach, Oxnard, California. May.
Aspen Environmental Group Final Report Ormond Beach Wetland Restoration General Site-Wide Investigation for Soil Reuse Options November 2006
4151001200\R1106-035_V2.doc Page 35
SECOR. 2000b. Soil, Surface Water, and Groundwater Sampling for Due Diligence, SCE Tank Farm and Excess Land, Ormond Beach, Oxnard, California. July.
SECOR. 2002a. Soil and Groundwater Sampling for Due Diligence, SCE’s Former Tank Farm and Associated Area, Ormond Beach, Oxnard, California. May.
SECOR. 2002b. Risk Evaluation, Proposed Wetlands Creation Project, SCE Ormond Beach Facility, Oxnard, California. May.
SECOR. 2004. Phase 2 Environmental Site Assessment Report, Ormond Beach, Metropolitan Water District/City of Oxnard Property, McWane Boulevard, Oxnard, California. September.
Southern California Edison. 2001. Final Remediation Report. Station Fuels Oil Facilities, Tank Farm Decommissioning, Ormond Beach Generation Station, Oxnard, California. August 31.
URS. 2004a. Technical Work Plan, Additional Site Characterization Investigations, for the Halaco Engineering Facility, Oxnard, California. Prepared for Halaco Engineering Company. April.
URS. 2004b. Technical Work Plan, Supplemental, Waste Management Unit Characterization. Prepared for Halaco Engineering Company. May.
URS. 2004c. Technical Report, Conceptual Closure Plan, Waste Management Unit, for the Halaco Engineering Facility, Oxnard, California. Prepared for Halaco Engineering Company. August.
Wetlands Research Associates. 2000. South Ormond Beach Wetlands Soil and Water Study. July 20.