solar and wind energy resource assessment (swera) · solar and wind energy resource assessment...
TRANSCRIPT

Solar and Wind Energy Resource Assessment (SWERA)
High Resolution Solar Radiation Assessment for Nepal
Final country report prepared by
Christoph Schillings1 Richard Meyer2
Franz Trieb1
1 Deutsches Zentrum für Luft- und Raumfahrt, DLR-Stuttgart, Institut für Technische Thermodynamik,
Pfaffenwaldring 38-40, D-70569 Stuttgart, Germany
2 Deutsches Zentrum für Luft- und Raumfahrt, DLR-Oberpfaffenhofen, Institut für Physik der Atmosphäre, D-82234 Weßling, Germany
submitted to UNEP / GEF
October 2004

Content
1. Method description (satellite data, GHI-method, DNI-method)
2. Model output (GHI, DNI)
3. Comparison with ground measurements (if available)
4. References
Notice
This report was prepared as an account of work within the SWERA project funded by GEF / UNEP. The results presented here were produced by state-of-the-art methods with best-known data. The DLR (Deutsches Zentrum fuer Luft- und Raumfahrt e.V.) does not make any warranty, express or implied, or assumes any legal liability or responsibility for the accuracy, completeness, or usefulness of any information, apparatus, product, or process disclosed, or represents that its use would not infringe privately owned rights. Reference herein to any specific commercial product, process, or service by trade name, trademark, manufacturer, or otherwise does not necessarily constitute or imply its endorsement, recommendation, or favoring by the DLR. This report is electronically available at http://swera.unep.net
Contact the responsible author:
Christoph Schillings DLR - Deutsches Zentrum für Luft- und Raumfahrt, e.V. Pfaffenwaldring 38-40 D - 70569 Stuttgart tel ++49(0)711/6862-784 fax ++49(0)711/6862-783 mail [email protected] www http://www.dlr.de/system

High resolution solar radiation assessment for Nepal, by 1
1 Method description Satellite Data The high resolution solar radiation assessment is based on data of the geostationary satellite Meteosat. Due to the location of the participating SWERA countries, data of Meteosat 7 (M-7) for the years 2000, 2001 and 2002 (for Ghana, Kenya and Ethiopia) and data of Meteosat 5 (M-5) for the years 2000, 2002 and 2003 (for Bangladesh, West-China, Nepal and Sri Lanka) are used. M-5 has its position at 0° latitude and 63° East longitude, M-7 is located at an orbit at 0° latitude and 0° longitude. Figure 1 gives the field of view of both satellites which scans the specific area every 30 minutes with a spatial resolution of 5x5 km².
Figure 1: The solar irradiance data is derived from Meteosat a 0° (red circle) and at 63° East (orange circle). The brightened area marks the quantitatively analyzable region. (Meyer et al., 2004).
Data of the visible (VIS) channel, which gives the reflection of the system earth/atmosphere (including clouds) and data of the infrared (IR) channel, which represents the temperature of the surface and atmosphere, are used for gathering information about the clouds. Both are used in a different way to assess the global horizontal (GHI) and the direct normal radiation (DNI) at ground. Additionally, data of the most important atmospheric components that attenuate the radiation, namely ozone, water vapor and aerosols, are used to take into account the clear-sky conditions of the atmosphere. In the following, the method for deriving DNI based on the DLR method and the method for deriving GHI, based on a combined method of DLR and SUNY, is described. Method for Direct Normal Radiation (DNI) The calculation of DNI bases on the clear-sky model of Bird and Hulstrom (1981) as described in Iqbal (1983) which was modified by Schillings et al. (2004) for taking into account cloudy conditions with irvisAeWVOzonGasRIDNI τττττττ ⋅⋅⋅⋅⋅⋅⋅⋅= 09751.0 (1) Each atmospheric transmittance coefficient τi is calculated separately using atmospheric input data. All equations for calculating the clear-sky transmittances are described in Iqbal (1983).

2 High resolution solar radiation assessment for Nepal, by
Transmittance for Rayleigh scattering
( )[ ]01.184.0 0.10903.0exp ppaR amamm −+−=τ (2) Transmittance for equally distributed gas (mainly O2 and CO2)
( )26.00127.0exp pGas am−=τ (3) Transmittance for ozone
OzonOzon ατ −=1 (4)
( ) ( ) 123035.0 0003.0044.00.1002715.048.1390.11611.0−− ++−+= χχχχχαOzone (5)
amu ⋅=χ , with the vertical ozone layer thickness u in cm[NTP] and the airmass am.
Transmittance for water vapor
WVWV ατ −=1 (6)
( )[ ] 16828.0 385.6034.790.14959.2−
++= γγγαWV (7)
amw ⋅=γ , with the pressure-corrected relative optical path length of precipitable water w in cm[NTP].
Transmittance for aerosols
( )[ ]9108.07088.0873.0 0.1exp paaaAe amkkk −+−=τ (8)
mm aaa kkkµλµλ λλ 5.0|38.0|
35.02758.0==
+= (9)
with the aerosol optical thickness kaλ at the wavelength 0.38 µm und 0.5 µm. Transmittance for clouds
using the visible Cloud-Index CI_vis ( )1.0⋅−= visCI
vis eτ (10) and using the infrared Cloud-Index CI_ir
( )07.0⋅−= irCIir eτ (11)
For the clear-sky atmospheric transmittance, the airmass is needed which is calculated by
[ ] 1.253)50.15(93.88+cos1
−Θ−Θ=
ZZam (12)
The pressure correction is made by
25.1013pamamp ⋅= (13)
with
( )zpp 0001184.0exp0
−= (14)
High resolution solar radiation assessment for Nepal, by 3
The clear-sky radiation is calculated each 20 minutes (10,30,50 minutes of each hour) for the maps and each 5 minutes (5,10,15,…,55,60 minutes each hour) for the time series. The influence of the clouds is taken into account hourly, therefore all maps (monthly and annual average daily sums) and time series are based on an hourly calculation of the radiation. The DLR -model output for DNI is sampled at a 10km spatial resolution. Method for Global Horizontal Radiation (GHI) The calculation of GHI bases on the method of Perez et al (2002) and Ineichen and Perez (2002). GHI is calculated with (Perez et al., 2002) )9.00001.0( +⋅⋅⋅⋅= GhcktmGhcktmGHI (15) with ktm 158.063.222.62.636.2 2345 +⋅−⋅−⋅+⋅−⋅= CICICICICIktm (16) GHI is calculated using the cloud information based on infrared (IR) and visible (VIS) Meteosat data which lead to a single Cloud-Index CI with
)_,_max( irCIvisCICI = (17) For the determination of the clear-sky global irradiance Ghc the new formulation as described in Perez et al (2002) is used with
)01.0exp()))1(21(2exp(cos1 8.10 amTLfhfhamcgIcgGhc Z ⋅−⋅+⋅⋅−⋅Θ⋅⋅= (18)
with
cg1 = (0.0000509 * alt + 0.868) cg2 = (0.0000392 * alt + 0.0387) I0 = Solar constant (eccentricity corrected) Θz = solar zenith angle fh1 = exp(-alt / 8000) fh2 = exp(-alt / 1250) am = elevation corrected air mass alt = altitude in meters TL = Linke turbidity
Due to missing values of the Linke turbidity TL for the parameterization of the clear-sky atmosphere, data of the atmospheric components ozone, water vapor and aerosols are used. These atmospheric data are also used for the DNI. To derive TL from atmospheric data we use the following formulation as described by Ineichen and Perez (2002) with
1)/))ln(1.11(( 0 +⋅⋅= amBI
bTlncl
(19)
with )1/163.0(664.0 fhb += (20) and the clear-sky direct normal irradiance Bncl wvgao3aera0 τττττ ⋅⋅⋅⋅⋅= IBncl (21)

4 High resolution solar radiation assessment for Nepal, by
The calculation of transmittance coefficients τi and the used atmospheric input data are described in the method for the DNI. The clear-sky radiation is calculated each 20 minutes (10,30,50 minutes of each hour) for the maps and each 5 minutes (5,10,15,…,55,60 minutes each hour) for the time series. The influence of the clouds is taken into account hourly, therefore all maps (monthly and annual average daily sums) and time series are based on an hourly calculation of the radiation. The DLR/SUNY-model output for GHI is sampled at a 10km spatial resolution.
Input Data Elevation For the airmass pressure correction, the elevation from the GLOBE database from the USGS U.S. Geological Survey [http://rockyweb.cr.usgs.gov/elevation/dpi_dem.html] is used, (Hastings and Dunbar, 1998).
Figure 2: Elevation from GLOBE.
Ozone The monthly ozone data are taken from TOMS published by the NASA/GSFC TOMS Ozone Processing Team [http://toms.gsfc.nasa.gov/], (McPeters et al., 1998).
Figure 3: Ozon monthly average for February 2003 in [DU] from TOMS
Water vapor The daily water vapor data are taken from the NOAA-CIRES Climate Diagnostics Center in Boulder Colorado, USA (NCEP/NCAR) [http://www.cdc.noaa.gov/] (Kalnay et al., 1996).

High resolution solar radiation assessment for Nepal, by 5
Figure 4: Water vapor daily mean for 7. February 2003 in cm[NTP] from NCEP/ NCAR-Reanalysis
Aerosol The monthly climatological aerosol optical thickness data are taken from NASA-GACP, [http://gacp.giss.nasa.gov/index.html], (Mishchenko et al, 2002).
Figure 5: Aerosol optical thickness for February from NASA-GACP.
Clouds The hourly cloud information are based on half-hourly Meteosat-5 IR and VIS data (© EUMETSAT, 2004). The determination of the cloud indices is described in detail in Mannstein et al. (1999) and Schillings et al. (2004). The basic approach for deriving VIS cloud information is described with
minmax
min_ρρ
ρρ−
−=visCI (22)
where ρ is the actual reflectivity measured by the satellite, ρmin corresponds to the surface albedo and ρmax is the maximum reflectivity measured for overcast cloudy conditions. The similar approach is used for IR-data, with the actual, minimum and maximum brightness temperatures T measured by the satellite:
maxmin
min_TTTT
irCI−−
= (23)
6 High resolution solar radiation assessment for Nepal, by
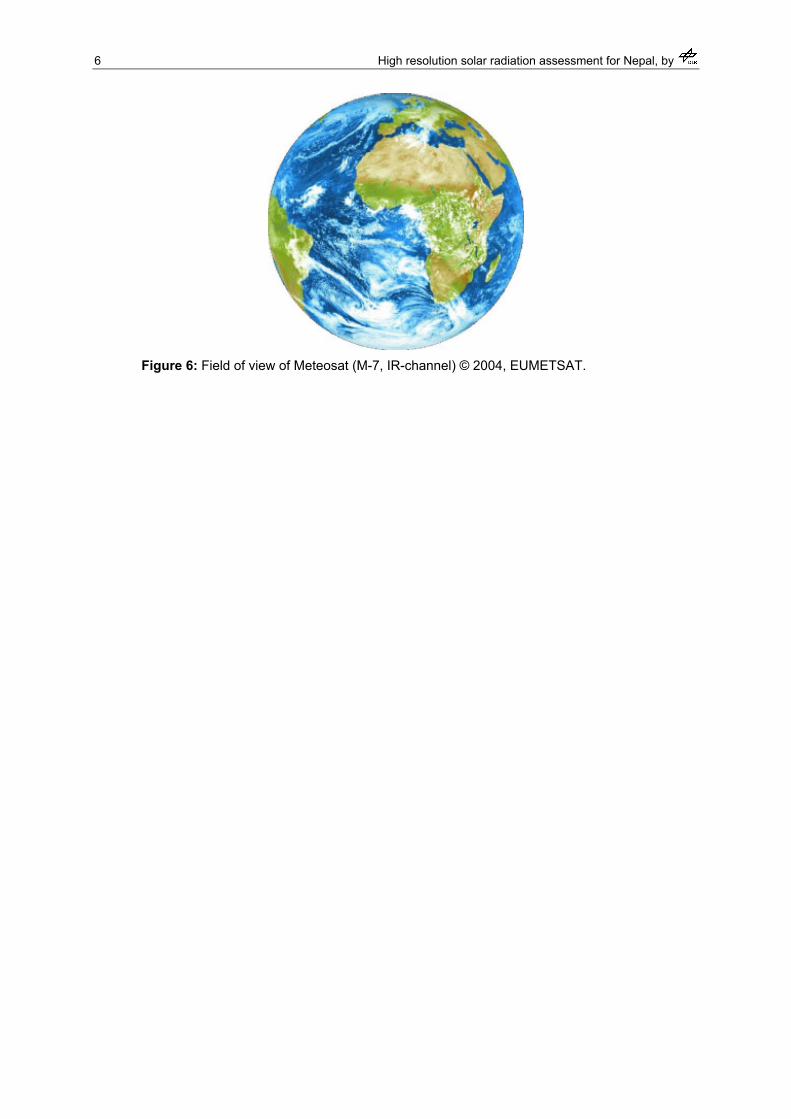
Figure 6: Field of view of Meteosat (M-7, IR-channel) © 2004, EUMETSAT.

High resolution solar radiation assessment for Nepal, by 7
2 Model output The solar radiation is calculated for the complete country for the years 2000, 2001 and 2002. The data are made available in a digital GIS-format (ESRI Vector-Shapefile). Within this report, maps of the annual average daily total sum of GHI and DNI are presented. The complete database (ESRI-Shapefile and MS-Access database) can be downloaded from the SWERA-homepage (http://swera.unep.net). Within the ESRI Vector-Shapefile, 3 annual and 36 monthly average daily total sums of GHI and DNI are given for each 10km x 10km georeferenced pixel as shown in the following figures. Additional, hourly time series for the same time period for several interesting sites are delivered in a separate ASCII-File. Time series The project partners have not yet chosen any sites. Important notice: The following maps show classified values of kWh/m²/day with a common color ramp for all SWERA countries to give a first impression of the solar regime for each country and for easier comparison with other countries. The provided digital GIS data (available at http://swera.unep.net) give the real (and not classified!) values in Wh/m²/day for each georeferenced pixel with a signal resolution of 1 Wh/m²/day.

8 High resolution solar radiation assessment for Nepal, by
Global Horizontal Radiation
Figure 7: Annual average daily total sum of GHI kWh/m²/day for Nepal 2000

High resolution solar radiation assessment for Nepal, by 9
Figure 8: Annual average daily total sum of GHI in kWh/m²/day for Nepal 2002

10 High resolution solar radiation assessment for Nepal, by
Figure 9: Annual average daily total sum of GHI in kWh/m²/day for Nepal 2003

High resolution solar radiation assessment for Nepal, by 11
Direct Normal Radiation
Figure 10: Annual average daily total sum of DNI in kWh/m²/day for Nepal 2000

12 High resolution solar radiation assessment for Nepal, by
Figure 11: Annual average daily total sum of DNI in kWh/m²/day for Nepal 2002

High resolution solar radiation assessment for Nepal, by 13
Figure 12: Annual average daily total sum of DNI in kWh/m²/day for Nepal 2003

14 High resolution solar radiation assessment for Nepal, by
3 Comparison with ground measurement in Nepal No comparison was performed due to missing ground measurement data.
Acknowledgement: All Meteosat data is under copyright of EUMETSAT (© 2004), Darmstadt, Germany. Many thanks for access to the data set go to the crew of the MARF (Meteosat Archive and Retrieval Facility, Darmstadt) and to our colleagues from DLR-DFD (Deutsches Fernerkundungs-Datenzentrum). Data on aerosol is provided by NASA-GACP Global Aerosol Climatology Project. We also acknowledge the use of the water vapor data from the NCEP Reanalysis by NOAA-CIRES Climate Diagnostics Center, Boulder, Colorado, US and the use of the TOMS ozone data provided by the NASA-Goddard Space Flight Center (GSFC), Washington, DC, USA. Special thanks to Rüdiger Buell and Hermann Mannstein at the Institut für Physik der Atmosphäre for doing the archive logistics and cloud data processing of the Meteosat 5 and Meteosat 7 data.
4 References
Bird R.E. and R.L. Hulstrom (1981): Review, evaluation and improvement of direct irradiance models. J. of Sol. Energy Engineering 103, 182-192.
Hastings D.A. and P.K. Dunbar (1998): Development & Assessment of the Global Land One-
km Base Elevation Digital Elevation Model (GLOBE). International Society of Photogrammetry and Remote Sensing (ISPRS) Archives 32 (4), 218-221. (http://www.ngdc.noaa.gov/seg/topo/globe.shtml)
Ineichen P. and R. Perez (2002): A new airmass independent formulation for the Linke
turbidity coefficient. Solar Energy, 73 (3), 151-157. Iqbal M. (1983): An introduction to solar radiation. Academic Press, Toronto. Kalnay E., M. Kanamitsu, R. Kistler, W. Collins, D. Deaven, L. Gandin, M. Iredell, S. Saha, G.
White, J. Woollen, Y. Zhu, A. Leetmaa, R. Reynolds, M. Chelliah, W. Ebisuzaki, W. Higgins, J. Janowiak, K.C. Mo, C. Ropelewski, J. Wang, R. Jenne and D. Joseph (1996): The NMC/NCAR 40-Year Reanalysis Project. Bulletin of the American Meteorological Society 77 (3), 437–472.
Mannstein H., H. Broesamle, C. Schillings and F. Trieb (1999): Using a METEOSAT cloud
index to model the performance of solar-thermal power stations. Procs. of Eumetsat Conference Copenhagen, 239-246.
McPeters R.D. , P. K. Bhartia, A. J. Krueger, J. R. Herman, C. G. Wellemeyer, C. J. Seftor,
G. Jaross, O. Torres, L. Moy, G. Labow, W. Byerly, S. L. Taylor, T. Swissler and R. P. Cebula (1998): Earth Probe Total Ozone Mapping Spectrometer (TOMS) Data Products User's Guide. NASA Technical Publication 1998-206895.
Meyer R., C. Hoyer, E. Diedrich, C. Schillings, S. Lohmann, M. Schroedter-Homscheidt, R.
Buell and F.Trieb (2004): Solar Energy Mining: A High-Quality Satellite-based Service to Provide Direct Solar Radiation for Europe, Brazil, Africa and Asia. Presentation at SolarPaces 2004, Oaxaca, Mexico.

High resolution solar radiation assessment for Nepal, by 15
Mishchenko M., J.E. Penner and D. Anderson (Ed.) (2002): Global Aerosol Climatology Project. Special Issue of Global Aerosol Climate, J. of Atmospheric Science 59 (3).
Perez R., P. Ineichen, K. Moore, M. Kmiecik, C. Chain, R. George and F. Vignola (2002): A
new operational satellite-to-irradiance model - description and validation. Solar Energy, 73 (5), 307-317.
Schillings C., H. Mannstein and R. Meyer (2004): Operational method for deriving high
resolution direct normal irradiance from satellite data. Solar Energy 76, 475-484.