solar-assisted industrial heating€¦ · supports public interest energy research and development...
TRANSCRIPT

E n e r g y R e s e a r c h a n d D e v e l o p m e n t D i v i s i o n F I N A L P R O J E C T R E P O R T
SOLAR-ASSISTED INDUSTRIAL HEATING
APRIL 2014 CE C-500-2015-006
Prepared for: California Energy Commission Prepared by: Gas Technology Institute

Prepared by: Primary Authors: David Cygan Joseph Pondo Gas Technology Institute 1700 S. Mount Prospect Rd. Des Plaines, Illinois 60018 http://www.gastechnology.org Contract Number: PIR-10-002 Prepared for: California Energy Commission Michael Lozano, P.E. Project Manager Virginia Lew Office Manager Industrial/Agricultural/Water End-Use Energy Efficiency Laurie ten Hope Deputy Director RESEARCH AND DEVELOPMENT DIVISION Robert P. Oglesby Executive Director
DISCLAIMER This report was prepared as the result of work sponsored by the California Energy Commission. It does not necessarily represent the views of the Energy Commission, its employees or the State of
California. The Energy Commission, the State of California, its employees, contractors and subcontractors make no warrant, express or implied, and assume no legal liability for the information
in this report; nor does any party represent that the uses of this information will not infringe upon privately owned rights. This report has not been approved or disapproved by the California Energy Commission nor has the California Energy Commission passed upon the accuracy or adequacy of
the information in this report.

ACKNOWLEDGEMENTS
This report was submitted under project number PIR-10-002 from the California Energy Commission. Thanks to the Utilization Technology Development NP, Southern California Gas Company and b2u Solar for financial, engineering, and/or technical support of this project.
i

PREFACE
The California Energy Commission Energy Research and Development Division Program supports public interest energy research and development that will help improve the quality of life in California by bringing environmentally safe, affordable, and reliable energy services and products to the marketplace.
The Energy Research and Development Division conducts public interest Research, Development, and Demonstration (RD&D) projects to benefit California.
The Energy Research and Development Division strives to conduct the most promising public interest energy research by partnering with RD&D entities, including individuals, businesses, utilities, and public or private research institutions.
Energy Research and Development Division efforts are focused on the following RD&D program areas:
• Buildings End-Use Energy Efficiency
• Energy Innovations Small Grants
• Energy-Related Environmental Research
• Energy Systems Integration
• Environmentally Preferred Advanced Generation
• Industrial/Agricultural/Water End-Use Energy Efficiency
• Renewable Energy Technologies
• Transportation
Solar-Assisted Industrial Heating is the final report for the Solar-Assisted Industrial Heating Project (contract number PIR-10-002) conducted by Gas Technology Institute (GTI). The information from this project contributes to Energy Research and Development Division’s Industrial/Agricultural/Water End-Use Energy Efficiency Program.
For more information about the Energy Research and Development Division, please visit the Energy Commission’s website at www.energy.ca.gov/research/ or contact the Energy Commission at 916-327-1551.
ii

ABSTRACT
Gas Technology Institute (GTI) and b2u Solar have completed laboratory performance testing, field sites assessment, and field installation planning of an advanced medium temperature non-tracking, Non-Imaging Concentrator Collector (NICC) driven solar thermal technology. This technology is specific for applications to food processing and other industrial facilities in California. The technology is suitable for industrial process heat applications, displacing natural gas and electricity use. However, the technology is not limited to food processing, and is expected to be replicable in a wide range of facilities across California and elsewhere. With approximately 50,000 industrial plants, California’s industrial sector consumes almost 50 billion kilowatt hours of electricity and over 6 billion therms of natural gas each year. The b2u Solar NICC technology addresses the temperature spectrum between 212°F (100°C) and 392°F (200°C) that has been largely neglected by market incumbents. This range includes a wide variety of heat-driven industrial process applications including double-effect absorption chilling, boiler feedwater and commercial hot water heating, industrial drying, and others. The team designed, constructed, and tested an NICC module on a laboratory-scale thermal loop at GTI over a 12-month period, demonstrating excellent temperature and thermal performance and reliability; assessed two food processing facilities for integration of the NICC technology; and developed an NICC installation manual. The planned field tests have not yet been carried out due to changing business conditions at the original and alternate sites. Based on results of current tests showing the NICC technology performs as expected and is well suited to integration into process heating, the technology is ready for demonstration at an industrial facility in an integrated process heating application.
Keywords: California Energy Commission, non-tracking collector, non-imaging collector, concentrated solar collector, solar thermal, solar process heating, thermal test loop, solar site assessment
Please use the following citation for this report:
Cygan, David; Joseph Pondo. (Gas Technology Institute). 2014. Solar-Assisted Industrial Heating. California Energy Commission. Publication number: CEC-500-2015-006.
iii

TABLE OF CONTENTS
ACKNOWLEDGEMENTS ....................................................................................................................... i
PREFACE ................................................................................................................................................... ii
ABSTRACT .............................................................................................................................................. iii
TABLE OF CONTENTS ......................................................................................................................... iv
LIST OF FIGURES 1 ................................................................................................................................. v
LIST OF TABLES ................................................................................................................................... vii
EXECUTIVE SUMMARY ........................................................................................................................ 1
CHAPTER 1: Solar Thermal Technology ............................................................................................ 3
1.1 Non-Imaging Concentrating Collector (NICC) ..................................................................... 3
1.2 NICC Development Background ............................................................................................. 4
1.3 Current Status of the Technology ............................................................................................ 6
CHAPTER 2: Project Approach .............................................................................................................. 7
2.1 Goals and Objectives ................................................................................................................. 7
2.2 Project Plan.................................................................................................................................. 7
2.2.1 Laboratory Testing ............................................................................................................. 7
2.2.2 Field Testing ........................................................................................................................ 8
2.2.3 Technology Transfer .......................................................................................................... 8
CHAPTER 3: Laboratory Testing at GTI ............................................................................................. 9
3.1 Design and Layout ..................................................................................................................... 9
3.2 Installation ................................................................................................................................. 12
3.3 Performance Characterization ................................................................................................ 22
3.4 Characterization Tests and Results........................................................................................ 24
3.5 Summary ................................................................................................................................... 39
CHAPTER 4: Field Testing ................................................................................................................... 41
4.1 MillerCoors ............................................................................................................................... 41
4.1.1 MillerCoors Facility ......................................................................................................... 42
4.1.2 100 kWth System ............................................................................................................... 45
iv

4.1.3 500 kWth System ............................................................................................................... 58
4.2 MillerCoors System Performance and Safety Analysis ...................................................... 62
4.2.1 Performance Analysis ...................................................................................................... 62
4.2.2 Safety Analysis ................................................................................................................. 62
4.3 Frito-Lay .................................................................................................................................... 62
CHAPTER 5: Field Installation Manual ............................................................................................. 64
CHAPTER 6: Conclusions ..................................................................................................................... 66
GLOSSARY .............................................................................................................................................. 67
REFERENCES .......................................................................................................................................... 68
LIST OF FIGURES 1
Figure 1: NICC Design (top) and Prototype Panel (bottom) ............................................................... 3
Figure 2: Prototype Unit at UC Merced. ................................................................................................. 5
Figure 3. NICC Demonstration System at NASA Ames ...................................................................... 6
Figure 4: Layout of High Temperature Array at GTI ......................................................................... 11
Figure 5: GTI Thermal Test Loop Piping and Instrumentation Diagram ........................................ 11
Figure 6: Installation of the Solar Array ................................................................................................ 12
Figure 7: Original Dual Manifolds ......................................................................................................... 13
Figure 8: High Temperature Solar Array .............................................................................................. 14
Figure 9: Solar Thermal Loop Control Manifold ................................................................................. 14
Figure 10: Heat Exchanger Mounted Outside the Building ............................................................... 15
Figure 11: Expansion Tank System ........................................................................................................ 15
Figure 12: High Temperature Solar Array Data Collection Display ................................................. 16
Figure 13: Indoor Piping with Insulation ............................................................................................. 17
Figure 14: Collector Manifold with Insulation ..................................................................................... 18
Figure 15: Collector Manifold to Building with Insulation ................................................................ 18
Figure 16: Collector Manifold to Thermal Loop with Insulation ...................................................... 19
Figure 17: Removable Insulation Material on Array Inlet and Outlet Unions ................................ 19
v
Figure 18: Removable Insulation Material on Array Inlet and Outlet Valves ................................. 20
Figure 19: Removable Insulation Material on Valves and Fittings ................................................... 20
Figure 20: b2u Solar NICC Array ........................................................................................................... 21
Figure 21: Thermal Fluid Flow Meter ................................................................................................... 21
Figure 22: Thermal Fluid Pump ............................................................................................................. 22
Figure 23: System Operating Data - Temperatures ............................................................................. 23
Figure 24: System Operating Data – Solar Flux and Temperatures .................................................. 23
Figure 25: Fluid Temperature Variation with Selective Array Exposure ........................................ 25
Figure 26. Typical Sunny Day Performance ......................................................................................... 26
Figure 27: December 13, 2010 Morning around 8:00 AM ................................................................... 27
Figure 28: Close-up of Snow Accumulation Near the Bottom of the Collectors ............................. 27
Figure 29: December 13, 2010 around 13:30 ......................................................................................... 28
Figure 30: Array Performance December 13, 2010 (Snow effect) ...................................................... 28
Figure 31: December 14, 2010 around 13:30 ......................................................................................... 29
Figure 32: Array Performance December 14, 2010 .............................................................................. 29
Figure 33: December 15, 2010 around 11:00 ......................................................................................... 30
Figure 34: Array Performance December 15, 2010 .............................................................................. 30
Figure 35: Solar Loop Data for November 2, 2010 ............................................................................... 32
Figure 36: Solar Loop Analysis for November 2, 2010 ........................................................................ 33
Figure 37: Solar Loop Analysis for October 24, 2011 .......................................................................... 33
Figure 38: Loop Pump Bypass ................................................................................................................ 34
Figure 39: Time of Day Relay ................................................................................................................. 35
Figure 40: Horizontal and Angled Pyranometers ............................................................................... 35
Figure 41: Measurement Comparison of Pryranometers ................................................................... 36
Figure 42: Solar Loop Heat Up ............................................................................................................... 37
Figure 43: Single Stage Absorption Chiller Simulation ...................................................................... 37
Figure 44: Example Screenshot Showing Selected Assumptions ...................................................... 38
Figure 45: Results of TrnSys Simulation ............................................................................................... 39
vi

Figure 46: Aerial Map of the Host Site Location .................................................................................. 43
Figure 47: Host Site Location on a Highway Map............................................................................... 43
Figure 48: Targeted Aerial View of Host Site ....................................................................................... 44
Figure 49: Solar Resource Variability .................................................................................................... 44
Figure 50: Location Site of Solar Array ................................................................................................. 45
Figure 51: Predicted Shading Solar Array ............................................................................................ 46
Figure 52: 100 kWth TrnSys Simulation Model .................................................................................... 46
Figure 53: Yearly Global and Horizontal Irradiance ........................................................................... 48
Figure 54: System Thermal Yield and Efficiency ................................................................................. 49
Figure 55: 10 kW Array Thermal Yield ................................................................................................. 49
Figure 56: 100 kWth Array Specifications .............................................................................................. 50
Figure 57: Exploded View of a Single Manifold Section – One of sixty in the 100 kWth System .. 51
Figure 58: Details of the Manifold Section ............................................................................................ 52
Figure 59: 100 kWth Process and Interconnect Diagram ..................................................................... 53
Figure 60: SCADA Interconnect Diagram ............................................................................................ 55
Figure 61: Analog Out Module .............................................................................................................. 55
Figure 62: Temperature Sensors ............................................................................................................. 56
Figure 63: Analog In/Out Wiring Diagram .......................................................................................... 56
Figure 64: Cariolis Mass Flow Meter with HART/Modbus Gateway .............................................. 57
Figure 65: 500 kWth Array Layout ......................................................................................................... 59
Figure 66: 500 kWth Process and Interconnect Diagram ..................................................................... 60
LIST OF TABLES
Table 1: System Performance Data ........................................................................................................ 24
Table 2: Performance Data from Selective Exposure Testing ............................................................ 25
Table 3: Performance Summary for NASA Ames Installation .......................................................... 31
Table 4: 100 kWth Instrument List .......................................................................................................... 53
Table 5: 100 kWth Equipment List .......................................................................................................... 54
vii

Table 6: 100 kWth Valve List ................................................................................................................... 54
Table 7: 100 kWth Bill of Materials ......................................................................................................... 58
Table 8: 500 kWth Instrument List .......................................................................................................... 60
Table 9: 500 kWth Equipment List .......................................................................................................... 60
Table 10: 500 kWth Valve List ................................................................................................................. 61
Table 11: 500 kWth Bill of Materials ....................................................................................................... 61
viii

EXECUTIVE SUMMARY
Gas Technology Institute (GTI) and b2u Solar have completed laboratory performance testing, field sites assessment, and field installation planning of an advanced medium temperature non-tracking, Non-Imaging Concentrator Collector (NICC) driven solar thermal technology. This technology is specific for applications to food processing and other industrial facilities in California. The technology is suitable for industrial process heat applications, displacing natural gas and electricity use. However, the technology is not limited to food processing, and is expected to be replicable in a wide range of facilities across California and elsewhere. THe NICC driven solar thermal technology is intended to improve energy efficiency, reduce greenhouse gas emissions, and reduce reliance on fossil fuels. With approximately 50,000 industrial plants, California’s industrial sector consumes almost 50 billion kilowatt hours of electricity and over 6 billion therms of natural gas each year. This energy represents 19 percent of the state’s total end-use electricity and 47 percent of the state’s end-use natural gas consumption. Over the past decades, pressures including urbanization; regulations; higher costs for energy, water, and other resources; global competition; and limitations on effluents have motivated the industrial sector to search for ways to reduce energy and water use, while maintaining product quality and increasing productivity.
The specific objectives of the project were:
• To prove the feasibility and safety of implementing medium temperature solar energy to meet a variety of industrial needs within a 24-month time frame
• To prove the possibility of installing a medium temperature solar thermal system at a cost less than $0.38/W
• To prove the NICC technology can achieve a Levelized Cost of Energy (LCOE) of less than $0.032/kWhth
In addition to testing the integrated NICC thermal system, the project addressed the issues of fuel switching, controls, application integration, and carbon abatement. The 392°F (200°C) fluid from the NICC collectors is suitable for direct use for industrial process heating or indirect use to boost process steam production.
The b2u Solar NICC technology addresses the temperature spectrum between 212°F (100°C) and 392°F (200°C) that has been largely neglected by market incumbents. This range includes a wide variety of heat driven industrial process applications including double-effect absorption chilling, boiler feedwater and commercial hot water heating, industrial drying and other processes requiring heat between 212°F (100°C) and 392°F (200°C). The technology pairs an evacuated tube solar collector with an external non-imaging reflector in a non-tracking system. The combination enables NICC to achieve temperatures in excess of 392°F (200°C) at 50 percent efficiency, defined as the percentage of solar energy hitting the collector aperture that is converted to useful heat energy even under heavily cloudy or hazy conditions. This capability separates the proposed technology from market incumbents which cannot attain these temperatures without tracking or direct sunlight. In the course of this project, the team has:
1

• Designed, constructed and tested an NICC module on a laboratory-scale thermal loop at GTI over a 12-month period demonstrating excellent temperature and thermal performance and reliability.
• Assessed procedures for assembling a small batch of panels and system installation and integration with a boiler
• Assessed two food processing facilities for integration of the NICC technology and developed an NICC installation manual.
The planned field tests have not yet been carried out because of changing business conditions at the original and the alternate site. Based on results of current tests showing the NICC technology performs as expected and is well suited to integration into process heating, the technology is ready for demonstration at an industrial facility in an integrated process hearting application.
2

CHAPTER 1: Solar Thermal Technology 1.1 Non-Imaging Concentrating Collector (NICC) The NICC technology illustrated in Figure 1pairs an evacuated tube solar collector with an external non-imaging reflector in a non-tracking system. The combination enables NICC to capture sunlight from an acceptance angle of +/- 60° and achieve temperatures in excess of 392°F (200°C) at 50 percent efficiency This is defined as the percentage of solar energy hitting the collector aperture that is converted to useful heat energy, even under heavily cloudy/hazy conditions. This capability separates the proposed technology from market incumbents which cannot attain these temperatures without tracking or direct sunlight. Competing technologies using flat plate and other evacuated tube collectors exhibit good efficiency characteristics at lower temperatures, but because of heat losses to the surroundings their efficiencies fall off rapidly at higher temperatures( ~176-212°F (80-100°C)) to single digit levels (well below 356°F (180°C)) which are required for efficient process heating applications.
Figure 1: NICC Design (top) and Prototype Panel (bottom)
3

The NICC technology differs from other solar thermal systems as it:
• Provides high value (212-392°F or 100-200°C) temperatures - operation at the upper levels allows driving higher temperature process needs.
• Works in cloudy and hazy conditions – provides solar thermal heat year round throughout the day
• Does not require sun-tracking – simplifies placement and operation, reduces maintenance costs, and improves aesthetics
One of the key advantages of the NICC over competing solar thermal technologies that can achieve 356°F (180°C)+ temperatures is that the NICC can be configured to be extremely low profile (such as wall mounted). Further, the NICC from the outset has been designed to be cost effective and mass producible versus other low and high temperature solutions. Collector costs are targeted to be in the $350/m2 installed range including balance of plant. This compares with installed prices for troughs that are upwards of $800/m2. Even lower performance (sub 248°F or 120°C) evacuated tube collectors are priced at ~$500/m2 in some markets.
In this project, the thermal energy generated by the solar collectors is used to drive key industrial process heat applications at a food/ beverage processing facility – displacing natural gas and electricity use. It is anticipated that the integrated solar thermal application(s) will be replicable in other plants and similar settings across California and elsewhere, improving energy efficiency, reducing greenhouse gas emissions, and reducing reliance on fossil fuels.
1.2 NICC Development Background The NICC technology was developed by b2u in conjunction with Professor Roland Winston, who discovered the field of non-imaging optics, and University of California at Merced (UC-Merced) over the course of five years, 1,2,3,4 and is currently at the early series production and deployment stage.
Prototype units were constructed and characterized at UC Merced’s Atwater campus for the future solar center of excellence. A photograph of one prototype unit attached to a test and measurement system is shown in Figure 2.
4

Figure 2: Prototype Unit at UC Merced.
After some modification and redesign, this unit performed to expectations. As a result, a ‘real world’ system was fabricated, in order to reproduce the results.
Subsequently, a test system with collectors in series, rated at 10 kWth, with full telemetry and a thermal dump, were fabricated so the technology can be thoroughly characterized. Based on satisfactory results a field test of the technology was undertaken. A 10 panel, 10 kWth system, illustrated in Figure 3, was demonstrated at the Ames Research Center of National Aeronautical and Space Administration (NASA), using an evaporative chiller to simulate real-world scale/applications with good results.
5

Figure 3. NICC Demonstration System at NASA Ames
1.3 Current Status of the Technology Starting with testing of conceptual modules at UC-Merced in 2005, the NICC technology has now been successfully demonstrated at a 10 kWth scale with natural gas-assist at GTI for water heating (current project), and at a 25 kWth scale at UC-Merced with natural gas-assist driving a 6.6-ton 2e LiBr chiller. It was also demonstrated at a 10 kWth test scale at NASA Ames using an evaporative chiller to simulate real-world scale/applications. In addition, a 10 kWth array in Gurgaon, India is in operation to power a steam generator that drives a steam water pump and a 50 kWth scale NICC system is driving a 6.6-ton 2e LiBr chiller at Purdue University.
6

CHAPTER 2: Project Approach The project approach was to design an NICC system for process heating applications, validate its ability to generate suitable temperatures and thermal energy when integrated with a thermal loop at the GTI laboratories, install and test the full system at a host site in California to provide process heating in an integrated system and transfer the results to the public.
2.1 Goals and Objectives The goal was to bridge the proven NICC technology with appropriate industrial applications to replace fossil fuels with clean and cost-effective solar energy. By working closely with partners in each target area, GTI ensured that the products are successfully married to the application and produce the results all parties expect.
The specific objectives were:
• To prove the feasibility and safety of implementing medium temperature solar energy to meet a variety of industrial needs within a 24-month time frame
• To prove the possibility of installing a medium temperature solar thermal system at a cost less than $0.38/W
• To prove the NICC technology can achieve a LCOE of less than $0.032/kWhth
2.2 Project Plan The project plan was to secure a host site and field test agreement; conduct validation tests of the NICC process heating approach on a laboratory boiler at GTI while also assessing procedures for assembling a small batch of panel and system installation and integration with the boiler; install and test a complete NICC system in the field to characterize its process heating performance under real-world conditions; design commercial packages for other applications; carry out technology transfer activities and develop a production readiness plan. The team has designed, constructed and conducted testing of an NICC module on a laboratory scale thermal loop at GTI over a 12-month period demonstrating excellent temperature and thermal performance and reliability; assessed several food processing facilities for integration of the NICC technology and developed an NICC installation manual. The planned field tests have not yet been carried out because of changing business conditions at the original and the alternate sites. Based on results of laboratory tests showing the NICC technology performs as expected and is well suited to integration into process heating, the technology is believed ready for demonstration at an industrial facility in an integrated process hearting application.
2.2.1 Laboratory Testing
The laboratory testing plan involved conducting validation tests of the NICC process heating approach on a laboratory boiler at GTI, while also assessing procedures for assembling a small batch of panels and system installation and integration with the boiler. Tests would be carried
7

out on a solar thermal loop to characterize the thermal performance of the NICC technology over a 12-month period. This would include assessment of the system performance during snow and cold weather conditions.
2.2.2 Field Testing
Field testing involved installation and testing of an integrated, 100 kWth NICC package at a host site in California. Specific activities would include securing the necessary permits, installing the NICC package at the host facility and integrating it with the host’s process heating needs, system shakedown, instrumentation calibration, and collecting operations data. Issues related to the solar system were identified and resolved, test results were analyzed, and system reliability was assessed.
2.2.3 Technology Transfer
Technology transfer plan involved developing designs for commercial packages that can be implemented to other solar thermal applications, such as commercial HVAC, boiler augmentation and industrial process heating; preparing and implementing a technology transfer plan explaining how the knowledge gained will be made available to the public; and preparing a production readiness plan identifying critical production processes, equipment, facilities, personnel resources, and support systems that will be needed to produce and the expected investment threshold to launch the commercial product.
8

CHAPTER 3: Laboratory Testing at GTI Laboratory testing involved conducting validation tests of the NICC technology and process heating approach on a thermal loop at GTI, while also assessing procedures for 1) assembling a small batch of panels, installation of the system and its integration with a boiler. Tests were carried out to characterize the thermal performance of the NICC technology over a 12-month period. This included assessment of the system performance during snow and cold weather conditions. A number of improvements in system performance and controls were identified and implemented during the tests in consultation with b2u Solar.
3.1 Design and Layout For validation of the NICC technology for process heating applications, a closed solar thermal test loop, based on high temperature thermal transfer fluid, was designed and constructed at GTI’s Distributed Energy Laboratory. The use of oil, versus water, as the thermal transfer fluid was based on the following expected benefits:
• Higher temperature without higher pressure – At 392°F (200°C), the target temperature, the equilibrium vapor pressure of the thermal transfer fluid used, Duratherm 600, is just 0.55 psig. In comparison, the vapor pressure of water at the same temperature would be 230 psig. The oil loop remains sealed during normal operation, however there is a slight pressure increase with temperature in the pipes solely due to the pressure increase of captive air in the pipes with temperature.
• Higher delta T at same flow – The implication is that for the same gravimetric flow rate, the delta T for oil will be about 1.6 times that of water. The benefits of a higher delta T include slightly lower average temperature for the array, for a given output temperature. This in turn translates into slightly lower heat loss.
Use of oil as thermal transfer fluid however, has some drawbacks but these were believed less consequential than the benefits:
• Handling and disposal – While it is easy to fill-up the loop or drain it, when water is the thermal fluid, without any environmental considerations, it is certainly not the case with oil. For the latter oil must be kept in approved storage containers, fill the loop through a funnel or a small pump, and collect the oil in used-up oil containers when draining the loop. Used-up oil will need to be disposed at a recycling center. Additionally, the system must be watched for leaks and a containment basin was needed to ensure there was no ground contamination.
• Water moisture – Water residues have the potential of affecting the performance of the loop in several ways including air and steam bubbles in the tubes and other parts of the system, caused by boiling water. Pressure build-up, due to boiling water, when the air vent is closed (which is the normal position) would accelerate oxidation of thermal oil. Based on earlier experiments, it was determined essential that all water be removed
9

from the closed loop before filling it with oil. The procedure for eliminating water consists of draining the loop, blowing compressed air through it and disassembling as many pieces as possible and letting them dry.
• Viscosity at low temperature – While the viscosity of water remains essentially the same in the temperature range of interest, this is not the case for oil. The implication of this change in viscosity of oil is that, for a given flow, the pressure at the pump needs to be much greater at low temperature than at high temperature.
• Flammability – Duratherm 600 has a flash point of 435°F (224°C) and a fire point of 464°F (240°C). While it is unlikely that these temperatures can be achieved in normal operation, one will need to take additional precautions when welding or brazing around the loop.
The key components of the GTI thermal loop include the solar array, a thermal fluid pump, a flow meter and an air-cooled heat exchanger representing the load. Temperature and pressure gauges are incorporated to allow these measurements at different points in the loop. For installation of the high temperature solar array and its integration with the thermal loop, a suitable location close to the loop was identified and designs were developed. It was decided to install a total of ten collectors (20 m2) initially with plans for expansion. The collectors were oriented in two rows of five with a header in between. Pier details and layout was prepared as shown in Figure 4.
A piping and instrumentation diagram, illustrated in Figure 5, was prepared for the thermal loop. The design features include automatic flow control through the thermal loop based upon the outlet temperature from the solar array. For initial commissioning and testing operation of the thermal loop, a fan driven air cooled heat exchanger was utilized to provide a thermal load to the loop. Based upon the operating climate conditions at GTI, it was decided to use Duratherm LT, which allows operation at colder temperatures and eliminates the need for heat tracing of the piping system, as the thermal transfer fluid.
10

Figure 4: Layout of High Temperature Array at GTI
Figure 5: GTI Thermal Test Loop Piping and Instrumentation Diagram
Outside Lab W
all
T-201
PSV-201
LG201
LSL201
RH501
TE501
BP501
WS501
WD501
WEATHERSTATION
TE502
PANEL
TE102A
TE101
PI202
PI201
V-202
TE301
TE302
FUTURE SUPPLY
FUTURE RETURN
V-304
V-302
V-208
P-201
V-303
V-301
Lab Roof
Lab Wall
V-205
V-104
SC201
HS202
V-102
F
FT-201
V-204
T-202
V-209
V-101
V-206
V-207
ES 120 VAC/60HZ
V-103
V-201 V-203
¾” C
oppe
r Tub
e Ty
pe L ¾
” Cop
per T
ube
Type
L
HE-301HS201
JY201
TIC201
HS301
JY301
ES 120 VAC/60HZ
HCV-301TE
102B
TI102
TI201
TI301
11

3.2 Installation Installation of the high temperature solar array and its integration with the modified thermal loop was subsequently carried out. A series of concrete piers, ten in total, were installed to provide a solid level foundation. The array has a Southern exposure and is about two feet above grade with the height less on the North row of piers (dictated by the slope of the pavement). A structure was constructed on the foundation to mount two rows of five collectors with a common header mounted between the rows. As shown in Figure 6, there are ten collectors (20 m2 total) each rated for 3,412 Btu/hr (1 kWth) output. The system was designed to accommodate the expected 350°F (176.7°C) output temperature from the solar array.
Figure 6: Installation of the Solar Array
Several problems were encountered during the installation process. The most challenging was alignment of the manifolds from collector to collector. Figure 7 shows the original dual manifolds. During leak testing multiple leaks were identified. In each case the leak was at the interface between the 1-1/4 inch copper header and the connecting pipe. Several unsuccessful attempts were made to solder or braze the troubled areas. A redesign of the manifold was subsequently undertaken due to the installation issues encountered. The dual manifolds were modified to a single manifold that is dual sided. Several other minor modifications were also implemented including: a change in material selection to Navy brass to allow for brazing if necessary, flanging the 1-1/4 inch copper header on each end, and the addition of ¾ inch copper expansion loops to allow for thermal expansion.
12

Figure 7: Original Dual Manifolds
The Piping and Instrumentation Diagram (P&ID) was used as the basis for procuring materials and components and installing the thermal loop piping and associated equipment and instruments. Electrical control design drawings were prepared and used to fabricate control panels for operation of the high temperature solar thermal test loop. The control panels include a variable frequency motor drive for the circulation pump and thermal loop temperature controller. Installation of controls and connection to the data acquisition system was completed.
Based on the experience gained during installation of the solar array at GTI, b2u Solar revisited the industrial design, adding the necessary robustness and cost reductions as needed. A supply chain to deliver product in high volume was also established.
Figures 8 through 11 show the complete setup of high temperature solar thermal test loop. It consists of thermal transfer fluid supply and return lines connected on left side of the array; a control manifold including a central control box, digital flow meter and fluid pump installed inside the building and a heat exchanger mounted outside the building; and an expansion tank system installed on the roof of the building. Initial commissioning and operation shakedown testing were carried out without completion of system thermal insulation. The reasons for this were twofold. Testing of the loop without the insulation allowed the system to be inspected for any leaks of the thermal fluid in the piping system and allowed for easier repair. During the initial commissioning several small leaks were identified and repaired. This testing also allowed for evaluation of the system heat losses and provided a good comparison of pre and post thermal insulation performance of the system. Figure 12 shows the screen display of data acquisition system of high temperature test loop. The display shows the inlet and outlet fluid temperatures of solar array and heat exchanger respectively as well as the fluid flow rate in real time.
13

Figure 8: High Temperature Solar Array
Figure 9: Solar Thermal Loop Control Manifold
14

Figure 10: Heat Exchanger Mounted Outside the Building
Figure 11: Expansion Tank System
15

Figure 12: High Temperature Solar Array Data Collection Display
Following successful commissioning of the uninsulated system, several insulation contractors were consulted to evaluate insulation options for the test loop, and in particular best ways to insulate the solar array manifold that will allow for replacement of solar tubes without major rework of thermal insulation. In addition, the contractors were asked to recommend preferred insulation materials for use with a system utilizing the hot thermal transfer fluid. Given cost considerations and system safety, larger systems most likely will use multiple insulation materials. Based on contractor recommendations and internal assessments, it was decided that closed cell insulation material would be preferred because of its possible exposure to the hot thermal fluid. Use of closed cell insulation would prevent wicking of the thermal fluid into the insulation material to reduce any potential for fire risk. The identified current closed cell insulation materials costs were determined to be approximately twice that of more standard insulation material for the temperature range of interest and also estimated to require additional labor for installation. An approach suggested by one thermal system vendor was to use close cell insulation for eighteen inches on each side of possible leak locations such as valves, flanges, and threaded connections and standard open cell insulation products on the remainder of the system. A search was carried out to identify vendors to supply a removable insulation product with closed cell insulation for use on valves and unions both for indoor and outdoor use. The purpose for this insulation was primarily for maintenance and safety by reducing the touch temperature of the uninsulated components. A prefabricated solution that can be cut to length in the field was identified and procured.
Subsequently, closed cell foam glass insulation was applied to system’s process piping with all valves; couplings, flanges, and equipment connections left open. A flexible coated high
16

temperature wrap material was identified and installed on the solar array manifold assembly, expansion joints, flow meter and pump head. Pictures of the insulated system are shown in Figures 13 through 16. The removable insulation material, based on closed cell insulation installed on valves and union locations is shown in Figures 17 through 19. Figures 20, 21 and 22 show the b2u Solar NICC array, the thermal fluid flow meter and the thermal fluid pump respectively.
An adjustable damper was fabricated and installed to allow for some adjustment in the amount of thermal load dissipated by the fan coil during system operation.
Figure 13: Indoor Piping with Insulation
17

Figure 14: Collector Manifold with Insulation
Figure 15: Collector Manifold to Building with Insulation
18

Figure 16: Collector Manifold to Thermal Loop with Insulation
Figure 17: Removable Insulation Material on Array Inlet and Outlet Unions
19

Figure 18: Removable Insulation Material on Array Inlet and Outlet Valves
Figure 19: Removable Insulation Material on Valves and Fittings
20

Figure 20: b2u Solar NICC Array
Figure 21: Thermal Fluid Flow Meter
21

Figure 22: Thermal Fluid Pump
3.3 Performance Characterization Figures 23 and 24 present the temperature and heat flux performance of the high temperature solar thermal test loop without insulation on July 12, 2010, and Table 1 compares results with and without system insulation from July/August and October 2010 respectively. As illustrated in Figure 23, during the July 12, 2010 test, the thermal transfer fluid temperature reached about 225°F (107.2°C) at the outlet of solar array. There was roughly 10 to 15°F (5.6 to 8.3°C) temperature loss through the system without insulation and the maximum heat flux reached was about 1000 W/m2. As illustrated in Table 1, the maximum array outlet temperatures reached during the tests without and with insulation were 212°F (100°C) was 268°F (131.1°C) respectively, while the respective maximum temperature gains were 55°F (30.6°C) and 52°F (28.9°C) and the maximum thermal outputs were 7.1 kWth and 6.5 kWth. Without insulation, the line losses were in the range of 21.1 to 23.3 percent, averaging 21.7 percent of the array thermal output for the array inlet piping, and in the range of 27.5 to 30 percent, averaging 29.3 percent of the array thermal output for the array outlet piping. With insulation, the line losses were in the range of 16.7 to 30.4 percent, averaging 20.4 percent of the array thermal output for the array inlet piping, and in the range of 12.5 to 21.7 percent, averaging 18.5 percent of the array thermal output for the array outlet piping.
22

Figure 23: System Operating Data - Temperatures
Figure 24: System Operating Data – Solar Flux and Temperatures
0
50
100
150
200
250
7/12/2010 0:00 7/12/2010 6:00 7/12/2010 12:00 7/12/2010 18:00 7/13/2010 0:00
TIME, M/DD/YYYY
TEM
PERA
TURE
, F
0
20
40
60
80
100
TEM
PERA
TURE
, F
Solar Array (SA) Inlet Temperature
SA Outlet Temperature
Heat Exchanger (HE) Inlet Temperature
HE Outlet Temperature
SA Temperature Gain
Heat Loss from SA outlet to HE Inlet
Heat Loss from HE outlet to SA Inlet
0
50
100
150
200
250
7/12/2010 0:00 7/12/2010 6:00 7/12/2010 12:00 7/12/2010 18:00 7/13/2010 0:00
TIME, M/DD/YYYY
TEM
PERA
TURE
, F
0
400
800
1200
1600
2000
SOLA
R FL
UX,
W/m
2
Solar Array Inlet Temperature
Solar Array Outlet Temperature
Solar Array Temperature Gain
Solar Flux
23

Table 1: System Performance Data
3.4 Characterization Tests and Results A series of tests was conducted to evaluate the flow distribution in the solar array. A tarp was used to cover selected potions of the array Four conditions were tested: 1) expose top row of the array, 2) cover the full array, 3) expose bottom row of the array, and 4) expose the full array. When the tests were conducted, there was one failed tube (loss of vacuum) in the bottom row. Therefore the array only operated with a total of 59 evacuated tubes. Figure 25 shows the fluid temperature variation in and out of the array during the test and Table 2 highlights the performance data. Test period 1 represents test condition one and so on. The data in the table are normalized for the number of operating tubes. The different periods in the figure and the table refer to the four tests. The test data indicate that the top row of tubes appear to draw more energy than the bottom row with respect to the performance of the entire array. The same trend is evident after the data are normalized to compensate for the failed tube in the bottom row. It is possible that the increased heat loss of the failed tube could have acted as a heat sink reducing the output of the bottom row. During the test it was also found that the array picks up a fair amount of solar energy from the diffused light passing through the tarp used for testing. Therefore the measured array efficiency was 118 percent and 101 percent in period 1 and 3 respectively because of the diffused light energy from the covered section. The overall array efficiency of the entire solar array with 59 tubes was ~76 percent at ~ 230°F (110°C).
Fluild Array Array
Load Load Sola
r Delta Delta Delt
a Delta Flow Temp
In Temp Out Temp
In Temp Out Radiatio
n Temp Temp Tem
p Temp Date Time (GPM) (Deg
F) (Deg F) (Deg
F) (Deg F) W/
m 2 (Deg F) BT
U KWH KW (Deg
F) BTU KWH K
W (Deg F) BTU KW
H KW (Deg F) BT
U KWH KW
8/13/2010 8:58
AM 2.1 10
6 123 118 110 516 1
6 6,949 122.
2 2.0 8 3,30
5 58.1 1.0 4 1,48
3 26.1 0.4 5 2,16
1 38.0 0.6 8/13/201
0 10:52 AM 2.
1 150 18
9 178 158 459 40 17,29
8 304.2 5.
1 20 8,758 154.
0 2.6 8 3,678 64.
7 1.1 11 4,86
1 85.5 1.4 8/13/201
0 12:28 PM 2.
1 155 20
6 190 166 913 51 22,69
3 399.0 6.
7 23 10,199 179.
3 3.0 12 5,254 92.
4 1.5 16 7,24
1 127.3 2.1 8/13/201
0 1:51 PM 2.
1 158 20
4 191 168 673 46 20,31
8 357.3 6.
0 23 10,026 176.
3 2.9 11 4,658 81.
9 1.4 13 5,63
4 99.1 1.7
7/30/2010 11:48
AM 2.1 15
7 212 196 169 884 5
5 24,167 425.
0 7.1 27 11,90
8 209.4 3.5 12 5,18
5 91.2 1.5 1
6 7,074 124.4 2.
1 10/14/201
0 8:58 AM 2.
1 89 10
8 103 94 281 19 8,00
4 140.7 2.
3 9 3,938 69.
3 1.2 5 2,244 39.
5 0.7 4 1,821 32.0 0.
5 10/14/2010 10:52
AM 2.1 16
4 199 192 171 486 3
5 15,482 272.2 4.
5 21 9,405 165.4 2.8 7 3,01
7 53.0 0.9 7 3,06
1 53.8 0.9 10/14/201
0 12:28 PM 2.
1 145 17
1 167 150 398 26 11,40
7 200.6 3.3 17 7,295 128.
3 2.1 5 2,122 37.
3 0.6 5 1,990 35.0 0.
6 10/14/2010 1:51
PM 2.1 13
1 150 147 134 306 1
9 8,356 146.9 2.
4 13 5,924 104.2 1.7 3 1,32
6 23.3 0.4 3 1,10
5 19.4 0.3
10/15/2010 12:45
PM 2.0 21
6 268 257 225 755 5
2 22,037 387.5 6.
5 32 13,630 239.
7 4.0 9 3,906 68.
7 1.1 11 4,50
1 79.1 1.3
Array Performance After Insulation
Array Performance Prior Insulation
Array Performance at High Temperature
Array Performance at High Temperature
Thermal Load Input Array Inlet Line
Loss Array Outlet Line Loss Thermal Array
Output Thermal Loop Data
24

Figure 25: Fluid Temperature Variation with Selective Array Exposure
Table 2: Performance Data from Selective Exposure Testing
Below data are normalized by number of tubes Perio
d No. of
Evacuated Tube
Energy Input from
Array (Measured)
Energy Input from Array (Calculated by subtracting energy input from covered
section)
Theoretical Energy Input from
Array
Array Efficiency (Measured
)
Array Efficiency (Calculate
d)
kWth kWth kWth % % 1 30 0.17 0.14 0.14 118.31 96.10 2 59
(Covered) 0.03 0.00 0.00 --- ---
3 29 0.14 0.12 0.14 101.06 81.27 4 59 0.11 --- 0.14 75.79 ---
After review of the operational data gathered to date, b2u Solar suggested operation of the array closer to 320°F (160°C). In order to increase the operating temperature of the array, the fan coil was turned off on the thermal load of the loop to reduce the thermal load on the system. This reduced the delta T across the fan coil to approximately 41°F (22.8°C). Currently, at peak sun, the thermal loop has been operating at temperatures of about 302°F (150°C) with a thermal fluid flow of 2 GPM. Figure 26 highlights the data for a typical sunny day.
0
0.1
0.2
0.3
0.4
0.5
0.6
0.7
0.8
0.9
1
100
120
140
160
180
200
220
240
260
280
300
10:00 11:00 12:00 13:00 14:00 15:00
SOLA
R R
ADIA
TIO
N, K
W/m
2
TEM
PERA
TURE
, oF
TIME, HR:MIN
Solar Array Inlet
Solar Array Outlet
Solar Radiation
Period 1 Period 2 Period 3 Period 4
25

Figure 26. Typical Sunny Day Performance
During a break between tests, inspection of the collector tubes indicated two tube failures as evident from the loss of vacuum in the tube assemblies. These tubes were replaced. Several other tubes also appeared to have low vacuum as indicated by higher exterior touch temperatures. Visually the silver getter material looked normal on the tubes in question. The tubes were continued to be monitored and any visually deficient tubes identified were closely inspected and replaced as necessary. The authors believe the abnormal rate of tube failure was a direct result of stress placed on the complete array during installation. The entire array was assembled in the horizontal plane and then raised to the appropriate incline. During this process the entire array flexed from side to side.
Following these tests and after a winter storm followed by several days of clear weather, data were gathered on performance of the array and also on time required for clearing of the snow from the collector surface. The data indicate surprising performance with diffused light with a snow cover across the tubes and reflectors. Based upon observations during the first snow storm encountered at the GTI test site location the array requires up to three clear days for complete snow clearing of the tubes and reflectors. Pictures and daily performance data are illustrated in Figures 27 through 34. The peak array outlet temperatures under clear and sunny skies dropped close to 180°F (82.2°C) in the presence of significant snow coverage versus over 300°F (148.9°C) with clear collectors.
0
200
400
600
800
1000
0
60
120
180
240
300
12/8/10 0:00 12/8/10 4:48 12/8/10 9:36 12/8/10 14:24 12/8/10 19:12 12/9/10 0:00
SOLA
R FL
UX, W
/m2
TEM
PERA
TURE
, o F
TIME, MM/D/YY HR:MIN
Array Inlet
Array Outlet
Solar Flux
26

Figure 27: December 13, 2010 Morning around 8:00 AM
Figure 28: Close-up of Snow Accumulation Near the Bottom of the Collectors
27

Figure 29: December 13, 2010 around 13:30
Figure 30: Array Performance December 13, 2010 (Snow effect)
0
60
120
180
240
300
12/13/10 0:00 12/13/10 4:48 12/13/10 9:36 12/13/10 14:24 12/13/10 19:12 12/14/10 0:00TIME, MM/D/YY HR:MIN
TEM
PERA
TURE
, o F
0
200
400
600
800
1000
SOLA
R FL
UX,
W/m
2
Array Inlet
Array Outlet
Solar Flux
28
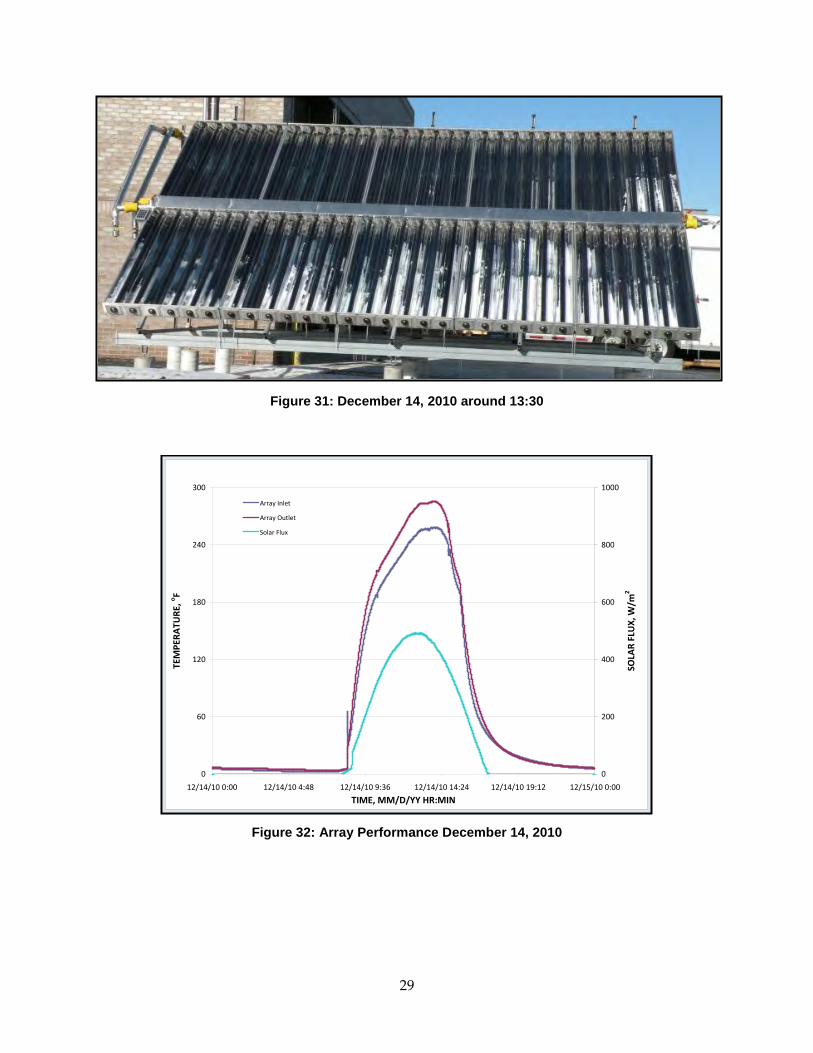
Figure 31: December 14, 2010 around 13:30
Figure 32: Array Performance December 14, 2010
0
60
120
180
240
300
12/14/10 0:00 12/14/10 4:48 12/14/10 9:36 12/14/10 14:24 12/14/10 19:12 12/15/10 0:00TIME, MM/D/YY HR:MIN
TEM
PERA
TURE
, o F
0
200
400
600
800
1000
SOLA
R FL
UX,
W/m
2
Array Inlet
Array Outlet
Solar Flux
29

Figure 33: December 15, 2010 around 11:00
Figure 34: Array Performance December 15, 2010
Table 3 summarizes measured total Global Horizontal Irradiation (GHI), Direct Normal Irradiation (DNI), and Diffuse Horizontal Irradiance (DHI) on September 2-3, 2010 on the NASA, Ames test loop. The system installed at NASA is similar to the one installed at GTI. It has 10 NICC panels with 19.2 m2 aperture area rated for 10 kWth. The design is 50 percent
0
60
120
180
240
300
12/15/10 0:00 12/15/10 4:48 12/15/10 9:36 12/15/10 14:24 12/15/10 19:12 12/16/10 0:00TIME, MM/D/YY HR:MIN
TEM
PERA
TURE
, o F
0
200
400
600
800
1000
SOLA
R FL
UX,
W/m
2
Array Inlet
Array Outlet
Solar Flux
30

efficient at ~ 356°F (180°C); conditions used expect a DNI of 80 percent, or 800 W/m2 and the DHI to make up the 20 percent. b2u Solar has estimated the GHI efficiency at 55 percent.
The estimated thermal outputs of two different collector troughs (tracking) and flat panel (non-tracking) are compared with NICC output. It is worth noting that NICC efficiency is largely correlated to the daily GHI at the ratio around 0.58.
Table 3: Performance Summary for NASA Ames Installation
GTI worked with b2u Solar to conduct a preliminary cost estimate of the NICC solar thermal loop for the market. The cost of the project depends on the array size. b2u Solar estimated that a small demo array such as the GTI/NASA installations, excluding balance of system, would cost roughly $600/m2. This equates to $1.20/Wth or a LCOE of $0.08 per kWhel electricity in an 'average' solar insolation environment. For example, the LCOE will be slightly higher in the Chicago area since it has about 20 percent lower solar resource than average.
For larger array sizes such as 100 kWth to 500 kWth, b2u Solar estimated the price at $400/m2 or $0.80/Wth (peak) or roughly five cents per kWhel electricity on a LCOE basis. b2u Solar found other technology that could provide similar temperatures (i.e. Sopogy, Chromasun, etc) were currently priced at or above $600/m2. b2u Solar was expecting the ability to sell, with a reasonable margin, at $200/m2 in their first market entrenched year.
During summer, the solar array at GTI continued operation without any down time or operator intervention. The ambient temperature and the length of the solar day increased during summer resulting in higher output temperatures from the array. Under these conditions, the fan was activated on the thermal load to increase delivery demand on the array based upon this increase in outlet temperatures. Also during summer, two solar tube failures were experienced due to loss of vacuum in the tube assemblies as indicated by the lack of silver getter material on the tube end. These two tube assemblies were subsequently replaced.
During fall, the array continued operation without any down time or operator intervention. The ambient temperatures and the lengths of the solar day continually decreased resulting in lower output temperatures from the array. The fan was turned off on the thermal load to decrease delivery demand on the array based upon this decrease in outlet temperatures. Two solar tube failures were experienced due to loss of vacuum in the tube assemblies as indicated by the lack of silver getter material on the end of the tubes.
Failure of the file generation program of the data acquisition system was also experienced. This failure took some time to be identified and unfortunately resulted in some loss of data. The program and approach to data transfer and storage were subsequently corrected.
31
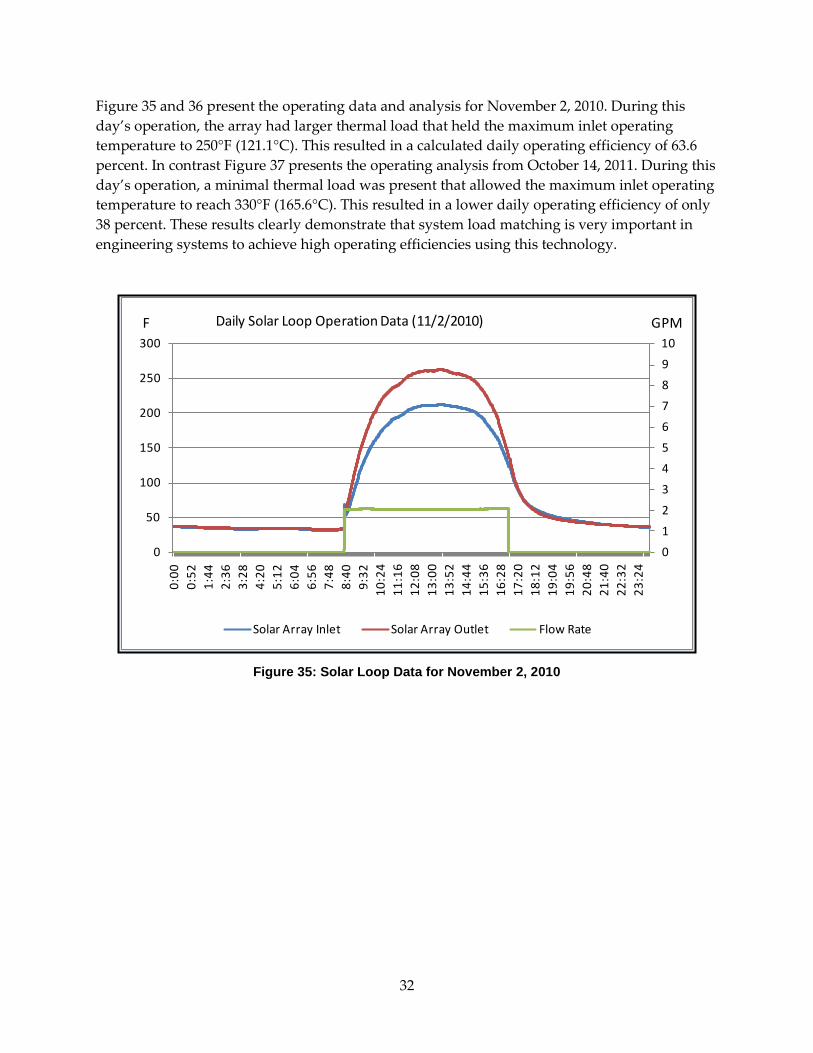
Figure 35 and 36 present the operating data and analysis for November 2, 2010. During this day’s operation, the array had larger thermal load that held the maximum inlet operating temperature to 250°F (121.1°C). This resulted in a calculated daily operating efficiency of 63.6 percent. In contrast Figure 37 presents the operating analysis from October 14, 2011. During this day’s operation, a minimal thermal load was present that allowed the maximum inlet operating temperature to reach 330°F (165.6°C). This resulted in a lower daily operating efficiency of only 38 percent. These results clearly demonstrate that system load matching is very important in engineering systems to achieve high operating efficiencies using this technology.
Figure 35: Solar Loop Data for November 2, 2010
012345678910
0
50
100
150
200
250
300
0:00
0:52
1:44
2:36
3:28
4:20
5:12
6:04
6:56
7:48
8:40
9:32
10:2
411
:16
12:0
813
:00
13:5
214
:44
15:3
616
:28
17:2
018
:12
19:0
419
:56
20:4
821
:40
22:3
223
:24
Solar Array Inlet Solar Array Outlet Flow Rate
F GPMDaily Solar Loop Operation Data (11/2/2010)
32

Figure 36: Solar Loop Analysis for November 2, 2010
Figure 37: Solar Loop Analysis for October 24, 2011
0.00%
10.00%
20.00%
30.00%
40.00%
50.00%
60.00%
70.00%
80.00%
90.00%
100.00%
0
2
4
6
8
10
12
14
0:00
0:50
1:40
2:30
3:20
4:10
5:00
5:50
6:40
7:30
8:20
9:10
10:0
010
:50
11:4
012
:30
13:2
014
:10
15:0
015
:50
16:4
017
:30
18:2
019
:10
20:0
020
:50
21:4
022
:30
23:2
0
Qout Total Global Horizontal * Collector Area Efficiency
kW EfficiencyDaily Solar Loop Thermal Input, Output, Efficiency (11/2/2010)
0.00%
10.00%
20.00%
30.00%
40.00%
50.00%
60.00%
70.00%
80.00%
90.00%
100.00%
0
2
4
6
8
10
12
14
0:00
0:50
1:40
2:30
3:20
4:10
5:00
5:50
6:40
7:30
8:20
9:10
10:0
010
:50
11:4
012
:30
13:2
014
:10
15:0
015
:50
16:4
017
:30
18:2
019
:10
20:0
020
:50
21:4
022
:30
23:2
0
Qout Total Global Horizontal * Collector Area Efficiency
kW EfficiencyDaily Solar Loop Thermal Input, Output, Efficiency (10/24/2011)
33

During the fall of 2011, six failed (lost vacuum) solar tubes were replaced in the solar array. Two tubes were replaced in the top tier and four in the bottom tier. Also during this down time several other modifications were completed to aid in further performance testing of the array. The most significant change was to increase the system turn-down by installation of a manually controlled bypass loop around the thermal transfer fluid circulation pump. This modification was performed to allow for testing of thermal transfer fluid loop flows less than two gallons a minute which could not be achieved with the pump speed control alone. The second modification was to install a time of day relay for control of the loop pump rather than the sun light relay that had been used. This change allowed for system to begin heating up earlier in the day regardless of the weather conditions to maximize the testing time around the solar noon. The final modification was to add an additional pyranometer mounted at 44 degrees to the horizon which is close to the same angle at the solar array (42 degrees) for comparison to the pyranometer mounted horizontally. The pump bypass loop, time of day relay, and the angle pyranometer are shown in Figure 38, 39 and 40 respectively.
Figure 38: Loop Pump Bypass
34

Figure 39: Time of Day Relay
Figure 40: Horizontal and Angled Pyranometers
35

Figure 41 compares measurements from the two differently orientated pyranometers under conditions representing a typical clear sunny day in November at the GTI laboratory location. As shown, the angled pyranometer is better able to capture and measure the solar radiation striking the array without the use of any correction factors.
Following these tests, additional tests were performed under conditions mimicking operation of a single stage absorption chiller coupled to the solar array. Test times were limited by the amount of solar radiation available this time of year at the test location. The testing was conducted by first heating up the solar panel and balance of loop equipment such as the piping, by varying the fluid flow rate. This was found to reduce the time to achieve test temperature could be reduced allowing for increased test duration. A typical heat up sequence is presented in Figure 42. After reaching the operating temperature required for operation of a single stage absorption chiller the fan coil was manually controlled to provide the anticipated thermal load of a typical single stage chiller system. Because of the limited daylight hours available the test was limited to only about three hours of operation. The test was conducted on November 12, 2011 and the data are summarized in Figure 43.
Figure 41: Measurement Comparison of Pryranometers
0
0.2
0.4
0.6
0.8
1
1.2
0:00 2:24 4:48 7:12 9:36 12:00 14:24 16:48 19:12 21:36 0:00Pyranometer Pyranometer 44 degree
kW/m2 TotalGlobal Horizontal Measurement, Nov 17th, 2011
36

Figure 42: Solar Loop Heat Up
Figure 43: Single Stage Absorption Chiller Simulation
0
2
4
6
8
10
12
14
16
18
20
3045607590
105120135150165180195210225240255270
7:30 7:45 7:59 8:13 8:28 8:42 8:57 9:11 9:25 9:40 9:54 10:09 10:23 10:37
Solar Array Inlet Solar Array Outlet Flow Rate
F GPM
High flow heat up the piping;Low flow heat up the collector.
0
2
4
6
8
10
12
14
16
18
20
3045607590
105120135150165180195210225240255270
7:30 7:59 8:28 8:57 9:25 9:54 10:23 10:52 11:21 11:49 12:18 12:47 13:16 13:45 14:13 14:42
Solar Array Inlet Solar Array Outlet Flow Rate
F GPMSolar Loop Operation Data, Nov 12th, 2011
Preheating Single Stage Absorption Chiller Mimic
37

To assess the thermal energy performance of the solar system, TrnSys 17 simulation was carried out assuming a cooling load. Two sets of weather data, from Chicago and Phoenix were used as input to the model. The collector was installed at local latitudes facing direct south (azimuth angle 0, Chicago latitude 42 degree, Phoenix latitude 34 degree). Figure 44 is a screenshot showing some of the key parameters.
Figure 44: Example Screenshot Showing Selected Assumptions
Other inputs to the model included:
• Chilled water set point - 44°F (6.667°C)
• Chilled water inlet temperature - 54°F (12.22°C)
• Chilled water flow rate - 2750 kg/hr (12.11 GPM)
• Cooling water inlet temperature - 82.4°F (28°C)
• Cooling water flow rate - 5400 kg/hr (23.78 GPM)
• Gas burner has infinite capacity and can always meet the outlet set point of 175°C (347°F). This is also the absorption chiller generator inlet temperature
• Gas burner, (boiler) efficiency - 100 percent, (84 percent)
• Combustion Efficiency - 100 percent, (82.5 percent)
38

• Pump has a constant flow rate of 1136 kg/hr (5 GPM), is sized for a 16 kWth Absorption Chiller, and has no electricity consumption
• Pump is controlled 24/7 for a whole year and 8am-6pm for a whole year
Figure 45 shows the results of the TrnSys simulation indicating a 13 percent reduction in natural gas load in Chicago and a 39 percent reduction in natural gas load in Phoenix by using solar cooling.
Figure 45: Results of TrnSys Simulation
3.5 Summary The following summarizes key conclusions drawn based on results of the laboratory testing of NICC technology at GTI:
• Non-tracking collector able to reach over 302°F (150°C)with 50 percent efficiency
• In the presence of significant snow coverage the array outlet temperatures achieved 180°F (82.2°C)
Simulation Results
0
20000
40000
60000
80000
100000
120000
140000
160000
Gas Cooling Solar Cooling Chicago Solar Cooling Phoenix
Absorption Chiller Burner Solar
Annual kWh 24/7 Operation
0
20000
40000
60000
80000
100000
120000
140000
160000
Gas Cooling Solar Cooling Chicago Solar Cooling Phoenix
Absorption Chiller Burner Solar
Annual kWh 8am - 6pm Operation
13.36% Reduction
39% Reduction
39

• Optical and thermal design lead to higher energy density and less heat loss than other non-tracking collectors
• Ability to utilize diffuse light leads to less variable performance than concentrating collectors
• Higher efficiency than concentrating tracking collectors in the area and GHI is higher than DNI
• Angled pyranometer is better able to capture and measure the solar radiation striking the array without the use of any correction factors
• Collector requires three days of clear weather to fully melt snow from covered collectors
• Proper design of manifold is important to prevent potential leaks.
40

CHAPTER 4: Field Testing Planned field testing involved installation and testing of an integrated, 100 kWth NICC package at an industrial food processing host site in California. Specific activities planned included securing the necessary permits, installing the NICC package at the host facility and integrating it with the host’s process heating needs, system shakedown, instrumentation calibration, and collecting operations data. Issues related to the solar system were planned to be identified and resolved, test results analyzed, and system reliability assessed.
The majority of efforts focused on assessing the proposed MillerCoors facility in Irwindale, California. This involved identifying suitable process heating applications for the NICC technology at the site, developing design packages and costs for 100 kWth and 500 kWth systems, and negotiating a 3-way field test agreement between GTI, MillerCoors and b2u Solar. In late 2012, after MillerCoors staff informed GTI that they were no longer interested in hosting the demonstration project; the project team successfully identified an alternate host site for the demonstration. Owned and operated by Frito-Lay, the alternate site was located in Rancho Cucamonga, California. Subsequent efforts focused on evaluating the site for suitable applications of the NICC process heating technology, and negotiating a field test agreement. Several potential uses of the solar generated heat were identified and the list was narrowed to generate steam to support various process needs.
4.1 MillerCoors During the laboratory testing phase of the project, a dialogue was initiated with the Utilities Manager at MillerCoors, the proposed field test site. Their plant had evolved significantly over the past two years since the originally proposal was submitted.
A teleconference was conducted among the team members. GTI, b2u Solar and MillerCoors staff participated in the call. An introductory presentation to b2u Solar technology was provided. Several applications of interest were identified by the MillerCoors staff. These included: pasteurization process line, waste water treatment facility, standby boiler, and heat recovery steam generator.
A draft Field Trial Agreement that defines the rights and responsibilities of the team members was subsequently generated and transmitted to MillerCoors. Subsequently, the balance of system was generated for their facility. Based on the specific application, it was decided that the solar field will consist of 100 kWth at 800 W/m2 DNI, 200 W/m2 GHI with 47 percent DNI efficiency and 54 percent GHI efficiency at 365°F (185°C) working fluid temperature.
The project at MillerCoors continually incurred delays due to an ongoing project at the site that required the attention of the MillerCoors engineering personnel. GTI continued to engage both MillerCoors and b2u Solar and made significant efforts to progress the activities and limit the impact of these delays on the project. These efforts included:
41

• Holding multiple discussions with the local gas utility, Southern California Gas Company to leverage their relationship with the host site to move the progress of installation forward
• Finalizing the preparation of the system performance and safety estimation for the proposed solar system design for the MillerCoors project
• Developing designs and costs for the proposed 100 kWth as well as a 500 kWth system at the request of MillerCoors
• Generating and proving to MillerCoors a detailed analysis of capital expenditures for the 500 kWth solar array at the request of MillerCoors. This analysis indicated that the installed capital expenditures of $893,000 are reduced after incentives and rebates to $55,100.
• Coordinating with b2u Solar on establishing the system specifications and quality assurance/quality control guidelines documentation
• Participating in critical project review conference call with the Energy Commission project manager and attempts at setting up a conference call with MillerCoors staff to review their commitment to this project and the required installation dates for continuation of this project.
As discussed earlier, however, the MillerCoors staff informed GTI in late 2012 that they were no longer interested in hosting the demonstration project.
4.1.1 MillerCoors Facility
The MillerCoors facility was located at 15801 East First Street; Irwindale, California: Latitude 34.1262, Longitude -117.939, annual average DNI 6.92 kWh/m2, and annual average GHI 5.35 kW/m2. Figure 46 shows the aerial map of the site and Figure 47 shows the highway map. Figure 48 shows a targeted aerial view of the host site and Figure 49 shows the calculated solar resource variability at this location. At the request of the host site, applications of both a 100 kWth and a 500 kWth system were assessed.
42

Figure 46: Aerial Map of the Host Site Location
Figure 47: Host Site Location on a Highway Map
43

Figure 48: Targeted Aerial View of Host Site
Figure 49: Solar Resource Variability
44

4.1.2 100 kWth System
The 100 kWth system, at 365°F (185°C) working fluid temperature generates 800 W/m2 GHI requiring 200 m2 of collectors and has a 47 percent DNI efficiency and 54 percent GHI efficiency, while a 500 kWth system requires 1000 m2 of panels delivering similar efficiencies.
To specify the equipment for the MillerCoors facility, a performance analysis for the site location was conducted. The specific purpose of this analysis was to identify the solar energy available for driving the proposed retrofit system. The site location is presented below in Figure 50 with a close up view of the proposed solar array placement on top of the roof shown in the right photograph.
Figure 50: Location Site of Solar Array
Selection of this location for this array was verified by a commercially available solar computer model that is used to evaluate solar project locations to determine possible shading effects either from structures or form the array hardware configuration to be deployed at proposed sites. Figure 51 presents the output from the computer model and shows the possible percent shading based upon the time of day and month of operation. The output was based upon one meter spacing between the two solar panels, both placed at a thirty four degree tilt. The results clearly show that the site selected provides for a good location of the solar array with very little shading except during the marginal solar season for this site of November through January.
Additional computer modeling was then carried out to predict the level of solar array performance based upon the available solar irradiance and the expected performance of NICC. Figure 52 is a screen shot of the TrnSys Simulation model for NICC system at MillerCoors illustrating the key components and listing key input assumptions.
45

Figure 51: Predicted Shading Solar Array
Figure 52: 100 kWth TrnSys Simulation Model
46

The values used for the GHI and DNI were the best that were available from Naval Research Laboratory (NRL), Solar and Wind Resource Assessment Tool (SWERA) or NASA at the time of this analysis. Figure 53 compares monthly and annual DNI for the NICC technology (concentrating solar collectors) with GHI of horizontal flat plate collectors. On an average annual basis, the 6.92 kWh/m2 DNI for NICC is 30 percent higher than the 5.35 kWh/m2 GHI for flat plate collectors.
Based upon these data, thermal yield performance and efficiency tables were developed. Note that these values scale linearly with the size of the array so yields for other system sizes can be determined by multiplying the yield data by the size ratio. The thermal yield performance and efficiencies are presented in Figure 54. The yield data is broken down my months reflecting the seasonal changes in the available solar energy and averages and totals are also provided. The efficiency table is broken down by DNI and GHI yields and an overall efficiency. Figure 55 shows the monthly average yield for a 10 kW sized array at this location. Yields for 100 kWth and 500 kWth systems will be 10 and 50 times larger respectively.
47

Figure 53: Yearly Global and Horizontal Irradiance
48
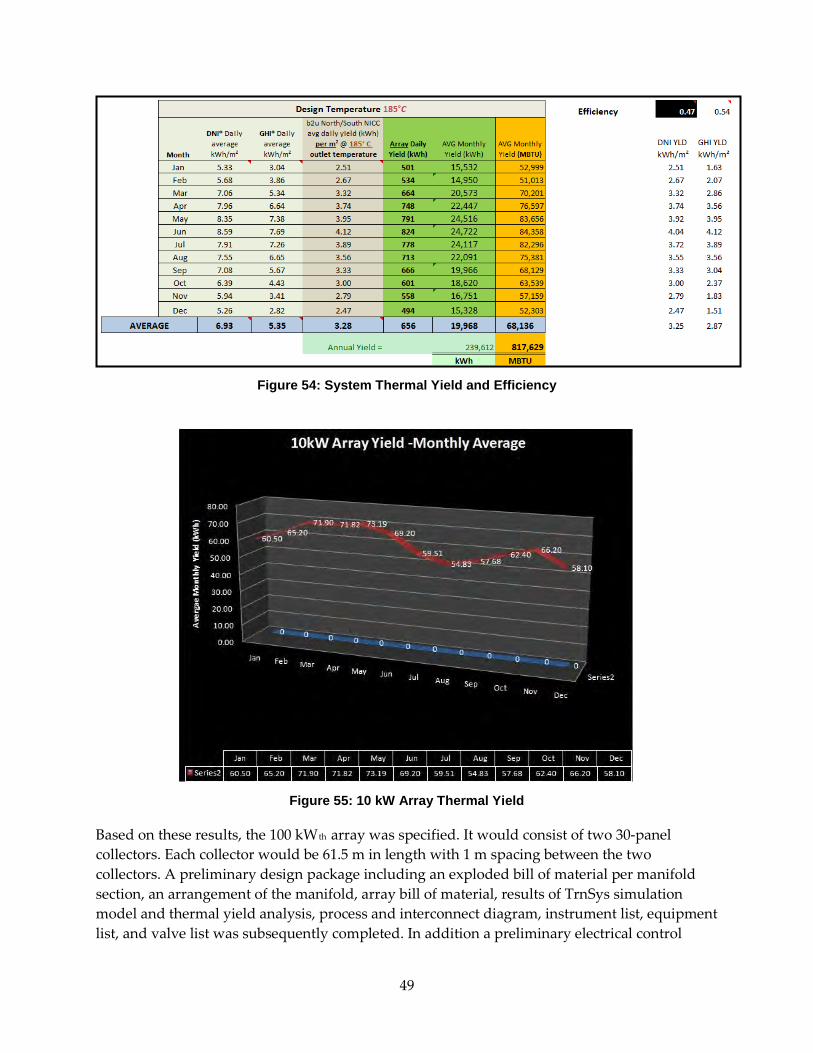
Figure 54: System Thermal Yield and Efficiency
Figure 55: 10 kW Array Thermal Yield
Based on these results, the 100 kWth array was specified. It would consist of two 30-panel collectors. Each collector would be 61.5 m in length with 1 m spacing between the two collectors. A preliminary design package including an exploded bill of material per manifold section, an arrangement of the manifold, array bill of material, results of TrnSys simulation model and thermal yield analysis, process and interconnect diagram, instrument list, equipment list, and valve list was subsequently completed. In addition a preliminary electrical control
49

design document was also generated and installed system costs were developed. Figure 56 shows the estimated performance of the panel based on 1 m spacing between arrays at 34° Tilt. The panel consists of 2 array segments, each with 30 panels. The length of the arrays was 61.5 m, the depth and the height of the tilt were 1.12 m and 1.66 m respectively, while the depth of the array was 4.17 m and its spacing was 3.05 m. The figure also shows different views of the panel design and assembly.
Figure 56: 100 kWth Array Specifications
50

Figure 57 shows components of a single manifold section that consists of 10 collectors, together with their part numbers, brief descriptions and quantities. The figure also lists respective numbers of the drawing with further details. There are a total of 18 key components and 168 individual pieces that make up a single manifold.
Figure 57: Exploded View of a Single Manifold Section – One of sixty in the 100 kWth System
51

Figure 58 shows different views of an assembled manifold section with dimensions. Each of the manifold sections was 2.05 m (80.7”) x 2.05 m (80.7”) x 0.268 m (10.6”) high.
Figure 58: Details of the Manifold Section
52
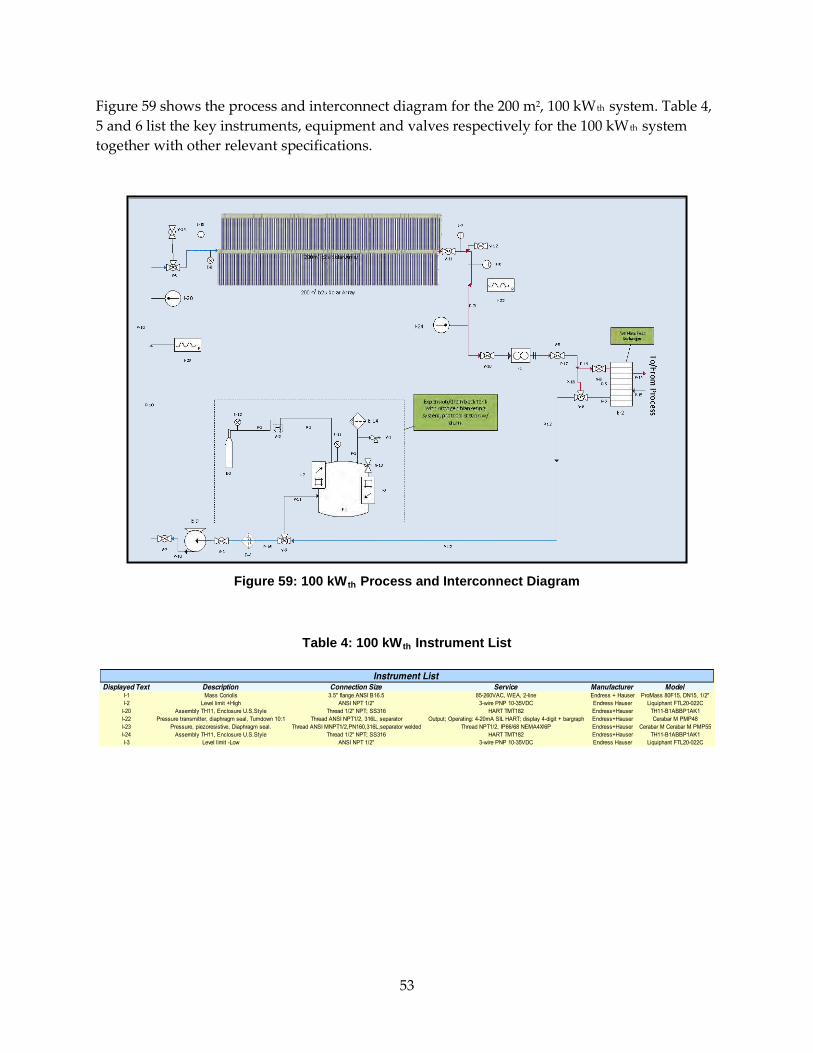
Figure 59 shows the process and interconnect diagram for the 200 m2, 100 kWth system. Table 4, 5 and 6 list the key instruments, equipment and valves respectively for the 100 kWth system together with other relevant specifications.
Figure 59: 100 kWth Process and Interconnect Diagram
Table 4: 100 kWth Instrument List
53

Table 5: 100 kWth Equipment List
Table 6: 100 kWth Valve List
Figure 60 shows the Supervisory Control and Data Acquisition (SCADA) diagram and Figure 61 through 64 provide additional details of the instrumentation, controls and data acquisition system. Table 7 illustrates the bill of materials for the 100 kWth system.
54

Figure 60: SCADA Interconnect Diagram
Figure 61: Analog Out Module
55

Figure 62: Temperature Sensors
Figure 63: Analog In/Out Wiring Diagram
56

Figure 64: Cariolis Mass Flow Meter with HART/Modbus Gateway
57

Table 7: 100 kWth Bill of Materials
4.1.3 500 kWth System
Similar to the 100 kWth system, the 500 kWth system, at 365°F (185°C) working fluid temperature generates 800 W/m2 GHI irradiance requiring 1000 m2 of collectors and has a 47 percent DNI efficiency and 54 percent GHI efficiency.
The 500 kWth array consists of 300, 3.33 m2 NICC panels. Five panels constitute an array segment with 3 segments forming a branch. The panels segments are arranged into 10 branches of 30 m2 each, as illustrated in Figure 65. Similar to the 100 kWth system, a preliminary design package for the 500 kWth system including an exploded bill of material per manifold section, an arrangement of the manifold, array bill of material, results of TrnSys simulation model and thermal yield analysis, process and interconnect diagram, instrument list, equipment list, and valve list was completed. In addition a preliminary electrical control design document was also generated and installed system costs were developed. Only design and system components that are different from the 100 kWth system are discussed here. The other components and arrangements are similar to those in the 100 kWth system and are shown in Figures 50, 52, 53, 55,
58

57, 58 and 60 to 64. Figure 66 shows the process and interconnect diagram for the 500 kWth system
Table 8, 9 and 10 list the key instruments, equipment and valves respectively together with other relevant specifications and Table 11 illustrates the bill of materials for the 500 kWth system.
Figure 65: 500 kWth Array Layout
59

Figure 66: 500 kWth Process and Interconnect Diagram
Table 8: 500 kWth Instrument List
Table 9: 500 kWth Equipment List
60

Table 10: 500 kWth Valve List
Table 11: 500 kWth Bill of Materials
61
4.2 MillerCoors System Performance and Safety Analysis 4.2.1 Performance Analysis
The performance analysis of the system in relation to the MillerCoors facility was discussed in Section 4.1.2 and the results were presented in Figure 50 through 55.
4.2.2 Safety Analysis
The b2u Solar’s NICC is composed of recyclable materials, consisting primarily of glass, aluminum, and copper. A non-toxic thermal transfer fluid, DuraTherm 600, is employed in lieu of water so that phase change is avoided to preclude explosive potential that can occur with steam or other such mediums. This permits the system to operate at or slightly above atmospheric pressure, greatly reducing the possibility of rupture and/or leakage.
Thermal transfer fluid has been used in industry for over 20 years now for process heat. DowTherm, for example, is used by Proctor & Gamble in their consumer products division while a number of industries have switched to thermal transfer fluid to avoid the loss of energy when steam must be condensed and to allow for unattended operation.
Insulation fires are a distinct possibility when using synthetic paraffin thermal transfer fluids. B2u Solar has minimized the potential for these through the use of an aerogel insulation material that minimize wicking, coupled with an aluminum manifold enclosure which channels any potential leakage along a gutter-like path from unit to unit. At the terminus of this channel, a collection point with a float and transmitter is used to alert of a potential leak. The system targets the medium temperature realm between 275-392°F (135-200°C), staying below the ignition/flash point of most materials and the concentration level is such as to not be able to present an open ignition source, as found with trough and other higher concentration solar designs. All b2u Solar components are manufactured by ISO 9001 certified contract manufacturers and suppliers under strict quality control guidelines. Routine audits are undertaken by quality supply engineers in order to insure adherence to design metrics and reliability targets. A Continuous Improvement Program (CIP) targets further refinements and the reduction of opportunities for failure while a constant drive towards COGS reduction is also maintained.
4.3 Frito-Lay Following withdrawal of MillerCoors, the project team explored alternate sites to host the demonstration. The Frito-Lay plant located in Bakersfield, California was contacted and the plant personnel expressed interest in the project.
A site meeting took place on October 30, 2012. Representatives from GTI, b2u Solar, and Southern California Gas Company met with the Utilities Manager for Frito-Lay and his staff. The attributes of the technology were presented. Several potential uses of the solar generated heat were identified and the list was narrowed to generating steam to support various process needs.
62

A preliminary analysis was prepared for the Frito-Lay plant located in Bakersfield, California. The b2u Solar array (30 m x 8 m ground cover, 200 m2 of collector area) was proposed for the grass area at the south end of the facility, located a significant distance from take-off points for steam in support of various process needs. The thermal transfer fluid would be circulated through an unfired steam generator to supply the necessary steam directly into the processes, regulated by pneumatic valves between the primary steam supply and related processes. The valves would be downstream of the primary steam supply such that any shortfall of b2u steam production would be met by the existing steam supply. The fit was difficult since the entire plant operates at 300 psig steam pressure. The b2u Solar system is capable of supplying steam at 150 psig. Unfortunately the demand for lower pressure steam was not present at this facility.
Discussions occurred with Frito-Lay on possible alternate sites located in Buena Park and Rancho Cucamonga. Both sites require low pressure steam capable of being generated by the solar array. Interest was secured from the Rancho Cucamonga facility and a site visit occurred. The project team met the Maintenance & Engineering Director and his staff. Together the group was able to identify three potential applications for the solar array (preheat makeup water to the condensate tank, sanitation water, and process steam). The facility used lower pressure steam (150 psig, 338 °F (170°C)), as discussed, and substantial hot water for sanitation. The b2u Solar array can contribute to each application.
A draft Field Trail Agreement documenting the rights and responsibilities of GTI, partners, subcontractors, and the host site operator during the field demonstration period was provided to Frito-Lay for approval. Several progressive revisions to the agreement have occurred.
63

CHAPTER 5: Field Installation Manual A Field Installation Manual was developed specifically for installation of a 200 m2 b2u Solar collector array at the MillerCoors facility located at 15801 East First Street, Irwindale, CA 91702. It could serve as a possible reference document for professional and qualified installers to assist with installation of the b2u Solar NICC panels. The manual has been prepared for installers who have the necessary know how and experience to correctly install the collectors to ensure efficient and reliable operation. Installation, operation and maintenance details of components supplied by others, such as thermal fluid pump, system controller and valves would generally vary with installation and should be provided by their respective manufacturers/suppliers. These are therefore not discussed.
The manual covers the following topics:
• Safety section discusses safe handling and installation of the system
• Maintenance section discusses general maintenance practices to provide optimum system performance, including cleaning and tube replacement
• Technology section describes the b2u Solar NICC technology
• Site characteristics includes location, site map, average solar resource variability, DNI and GHI
• Collector Specifications specify the following:
o 100 kWtp output @ 800 W/m2 DNI
o 200 W/m2 GHI irradiance
o 47 percent DNI efficiency, 54 percent GHI efficiency @ 185°C working fluid temperature
o 60 manifolds, 3.33 m2 each
o 200 m2 total collector area
• TrnSys Simulation Model illustrates an example of the TrnSys simulation model for the MillerCoors solar process heating system
• Thermal Yield Analysis presents estimated monthly and daily thermal yields, monthly DNI and GHI yield
• Bill of Materials lists and describes the components of the b2u Solar NICC collector
• General Installation Scheme provides information on the location, direction, plane, angle and shading of collector at the MillerCoors facility and discusses custom system design, collector components, collector tubes and collector assembly
64

• Assembly Steps provides detailed panel assembly instructions
• Process and Instrumentation provides the overall process and instrumentation diagram of the solar thermal system, and the valve, instrumentation and equipment lists
• Instrumentation and Controls describes a compact touch-screen Supervisory Control and Data Acquisition (SCADA), SCADA Interconnect Diagram, Analog out Module, temperature sensors monitoring the thermal transfer fluid at the inlet and the outlet of the collectors, Analog In/Out Wiring Diagram, and Coriolis Mass flow Meter with HART/Modbus Gateway
65

CHAPTER 6: Conclusions The following summarizes key conclusions drawn based on results of the laboratory and field testing of NICC technology at GTI:
• Non-tracking collector was able to reach over 150°C (302°F) with 50 percent efficiency during the laboratory tests
• Optical and thermal design lead to higher energy density and less heat loss than other non-tracking collectors
• Ability to utilize diffuse light leads to less variable performance than concentrating collectors
• Higher efficiency than concentrating tracking collectors in the area and GHI is higher than DNI
• Angled pyranometer is better able to capture and measure the solar radiation striking the array without the use of any correction factors
• Collector requires three days of clear weather to fully melt snow from covered collectors
• In the presence of significant snow coverage the array outlet temperatures achieved 180°F (82.2°C)
• Proper design of manifold is important to prevent potential leaks.
66

GLOSSARY Term Definition
CIP Continuous Improvement Program
DHI Diffuse Horizontal Irradiance
DNI Direct Normal Irradiance
GHI Global Horizontal Irradiance
GTI Gas Technology Institute
HVAC Heating, Ventilation and Air Conditioning
LCOE Levelized Cost of Energy
NASA National Aeronautical and Space Administration
NICC Non Imaging Concentrator Collector
NRL Naval Research Laboratory
P&ID Piping and Instrumentation Diagram
PIER Public Interest Energy Research
SCADA Supervisory Control and Data Acquisition
SWERA Solar and Wind Resource Assessment Tool
UC- Merced University of California at Merced
67

REFERENCES
A 25 kWth UC Merced Solar Cooling Project Using Thermodynamically Efficient Technology, Roland Winston, UC Davis, March 28, 2011 (http://solar.ucdavis.edu/files/presentations/2011-winston.pdf)
Delivering BTUs from the Sun: The Untapped Opportunity in Solar, Gary Conley, Nitin Parekh, NREL 25th Industry Growth Forum, October 2012, Denver, Colorado (http://www.industrygrowthforum.org/pdfs/presentation_ancora_imparo.pdf)
Design and Development of Low-Cost, High-Temperature Solar Collectors for Mass Production, Final Project Report, CEC-500-2012-050, May 2012 (http://www.energy.ca.gov/2012publications/CEC-500-2012-050/CEC-500-2012-050.pdf)
Efficient Solar Cooling, Dr. Roland Winston, Heather Poiry, University of California, Merced (http://ucsolar.org/sites/cast/files/public/documents/Poster8.pdf)
68