solar cell radiation environment analysis models …solar cell radiation environment analysis models...
TRANSCRIPT

Solar Cell Radiation
Environment Analysis
Models (SCREAM)
2017 Space Environment Engineering
& Science Applications Workshop
(SEESAW)
Scott R. Messenger, Ph.D.
Principal Space Survivability Physicist
410-993-3976

• Omnidirectional (directional?)
• Energy Spectra (electrons & protons & plasmas)
• Nuclear activation (secondary production)
• Prompt effects (EMP, gammas, neutrons)
p+
COVERGLASS
SUBSTRATE
ACTIVE CELL
PANEL
p+
e-
e-
e-
e-
e-
p+
p+
p+
p+
p+
p+
COVERGLASS
SUBSTRATE
ACTIVE CELL
PANEL
p+
e-
e-
e-
e-
e-
p+
p+
p+
p+
p+
COVERGLASS
SUBSTRATE
ACTIVE CELL
PANEL
p+
e-
e-
e-
e-
e-
p+
p+
p+
p+
p+
protons
electrons
Space Radiation Environment for Solar Arrays
Ionizing and nonionizing radiation
solar UV

Outline
• Space Solar Cell Modelling
• Displacement Damage Dose (DDD) Model
– SCREAM
• SCREAM Success Stories
– TacSat4
– GPS-IIR SV41
– Low Thrust Trajectories (DDD accumulation)
• Summary
3

Space Solar Cell Degradation Prediction:
The Problem
Electron & Proton Ground Irradiation Data (Single Junction GaAs/Ge, 1991)
Electron & Proton Spectra for TacSat4
• To generate ground irradiation data necessary to predict the effect of a space particle energy spectrum on a solar cell
• This is accomplished by reducing the ground data to a characteristic dataset
1.E+06
1.E+07
1.E+08
1.E+09
1.E+10
1.E+11
1.E+12
1.E+13
1.E+14
1.E+15
1.E+16
1.E-02 1.E-01 1.E+00 1.E+01 1.E+02 1.E+03
Inte
gra
l Flu
en
ce
(cm
-2)
Particle Energy (MeV)
TACSAT4 Orbit (700 x 12050 km, 63.4o , 1 year)
Trappped Protons
Solar Event Protons
Trapped Electrons
0.0
0.1
0.2
0.3
0.4
0.5
0.6
0.7
0.8
0.9
1.0
1.0E+09 1.0E+10 1.0E+11 1.0E+12 1.0E+13 1.0E+14 1.0E+15 1.0E+16 1.0E+17
No
rmal
ize
d M
axim
um
Po
we
r
Particle Fluence (#/cm2)
50 keV100 keV200 keV300 keV500 keV1 MeV3 MeV9.5 MeV
0.0
0.1
0.2
0.3
0.4
0.5
0.6
0.7
0.8
0.9
1.0
1.0E+09 1.0E+10 1.0E+11 1.0E+12 1.0E+13 1.0E+14 1.0E+15 1.0E+16 1.0E+17
No
rmal
ize
d M
axim
um
Po
we
r
Particle Fluence (#/cm2)
0.6 MeV1 MeV2.4 MeV12 MeV
Protons
Electrons
GaAs/Ge1 Sun, AM0
25oC
THIS FIGURE IS FOUOTHIS FIGURE IS FOUO

Space Solar Cell Degradation Prediction:
The Solution(s)
1. JPL method RDCs equivalent 1 MeV electron fluence & Cpe
JPL Model Data Collapse
0.0
0.1
0.2
0.3
0.4
0.5
0.6
0.7
0.8
0.9
1.0
1.E+12 1.E+13 1.E+14 1.E+15 1.E+16 1.E+17
Rem
ain
ing
Maxim
um
Po
wer
Equivalent 1 MeV Electron Fluence (cm-2)
GaAs/Ge(1 sun, AM0
Electrons
0.0
0.1
0.2
0.3
0.4
0.5
0.6
0.7
0.8
0.9
1.0
1.E+07 1.E+08 1.E+09 1.E+10 1.E+11 1.E+12
Ream
inin
g M
axim
um
Po
wer
Displacement Damage Dose (MeV/g)
200 keV
300 keV
500 keV
1 MeV
3 MeV
9.5 MeV
12 MeV
2.4 MeV
1 MeV
0.6 MeV
1 MeV Equiv. U235 neutrons
DDD Fit
GaAs/Ge(1 sun, AM0 25oC)
Protons
0.0
0.1
0.2
0.3
0.4
0.5
0.6
0.7
0.8
0.9
1.0
1.E+07 1.E+08 1.E+09 1.E+10 1.E+11 1.E+12
Ream
inin
g M
axim
um
Po
wer
Displacement Damage Dose (MeV/g)
200 keV
300 keV
500 keV
1 MeV
3 MeV
9.5 MeV
12 MeV
2.4 MeV
1 MeV
0.6 MeV
1 MeV Equiv. U235 neutrons
DDD Fit
GaAs/Ge(1 sun, AM0 25oC)
*The heritage JPL model is well documented (1970-2000):H.Y.Tada and J.R.Carter, Solar Cell Radiation Handbook, JPL Pub. 77-56 (1977) – Green Book (Si)
B.Anspaugh, GaAs Solar Cell Radiation Handbook, JPL Pub. 96-9 (1996) – Blue Book (GaAs)
D.C. Marvin , Assessment of Multijunction Solar Cell Performance in Radiation Environments, TOR-00(1210)-1
THIS FIGURE IS FOUO

Space Solar Cell Degradation Prediction:
The Solution(s)
1. JPL method RDCs equivalent 1 MeV electron fluence & Cpe
2. NRL method NIEL displacement damage dose (DDD)
JPL Model Data Collapse NRL/DDD Model Data Collapse
0.0
0.1
0.2
0.3
0.4
0.5
0.6
0.7
0.8
0.9
1.0
1.E+07 1.E+08 1.E+09 1.E+10 1.E+11 1.E+12
Rem
ain
ing
Maxim
um
Po
wer
Displacement Damage Dose (MeV/g)
GaAs/Ge(1 sun, AM0
Electrons
0.0
0.1
0.2
0.3
0.4
0.5
0.6
0.7
0.8
0.9
1.0
1.E+07 1.E+08 1.E+09 1.E+10 1.E+11 1.E+12
Ream
inin
g M
axim
um
Po
wer
Displacement Damage Dose (MeV/g)
200 keV
300 keV
500 keV
1 MeV
3 MeV
9.5 MeV
12 MeV
2.4 MeV
1 MeV
0.6 MeV
1 MeV Equiv. U235 neutrons
DDD Fit
GaAs/Ge(1 sun, AM0 25oC)
Protons
0.0
0.1
0.2
0.3
0.4
0.5
0.6
0.7
0.8
0.9
1.0
1.E+07 1.E+08 1.E+09 1.E+10 1.E+11 1.E+12
Re
am
inin
g M
ax
imu
m P
ow
er
Displacement Damage Dose (MeV/g)
200 keV
300 keV
500 keV
1 MeV
3 MeV
9.5 MeV
12 MeV
2.4 MeV
1 MeV
0.6 MeV
1 MeV Equiv. U235 neutrons
DDD Fit
GaAs/Ge(1 sun, AM0 25oC)
1 MeV Eq. 235U Neutrons
0.0
0.1
0.2
0.3
0.4
0.5
0.6
0.7
0.8
0.9
1.0
1.E+12 1.E+13 1.E+14 1.E+15 1.E+16 1.E+17
Rem
ain
ing
Maxim
um
Po
wer
Equivalent 1 MeV Electron Fluence (cm-2)
GaAs/Ge(1 sun, AM0
Electrons
0.0
0.1
0.2
0.3
0.4
0.5
0.6
0.7
0.8
0.9
1.0
1.E+07 1.E+08 1.E+09 1.E+10 1.E+11 1.E+12
Ream
inin
g M
axim
um
Po
wer
Displacement Damage Dose (MeV/g)
200 keV
300 keV
500 keV
1 MeV
3 MeV
9.5 MeV
12 MeV
2.4 MeV
1 MeV
0.6 MeV
1 MeV Equiv. U235 neutrons
DDD Fit
GaAs/Ge(1 sun, AM0 25oC)
Protons
0.0
0.1
0.2
0.3
0.4
0.5
0.6
0.7
0.8
0.9
1.0
1.E+07 1.E+08 1.E+09 1.E+10 1.E+11 1.E+12
Ream
inin
g M
axim
um
Po
wer
Displacement Damage Dose (MeV/g)
200 keV
300 keV
500 keV
1 MeV
3 MeV
9.5 MeV
12 MeV
2.4 MeV
1 MeV
0.6 MeV
1 MeV Equiv. U235 neutrons
DDD Fit
GaAs/Ge(1 sun, AM0 25oC)
*The advanced NRL/DDD model is well documented (1994-2012):S.R. Messenger, et al., "Modeling solar cell degradation in space: A comparison of the NRL displacement damage
dose and JPL equivalent fluence approaches", Prog. Photovolt.: Res. Appl. vol. 9, pp. 103-121, 2001.
S.R. Messenger, et al., "SCREAM: A new code for solar cell degradation prediction using the displacement damage
dose approach," 35th IEEE PVSC, 2010, p. 1106.
THIS FIGURE IS FOUOTHIS FIGURE IS FOUO
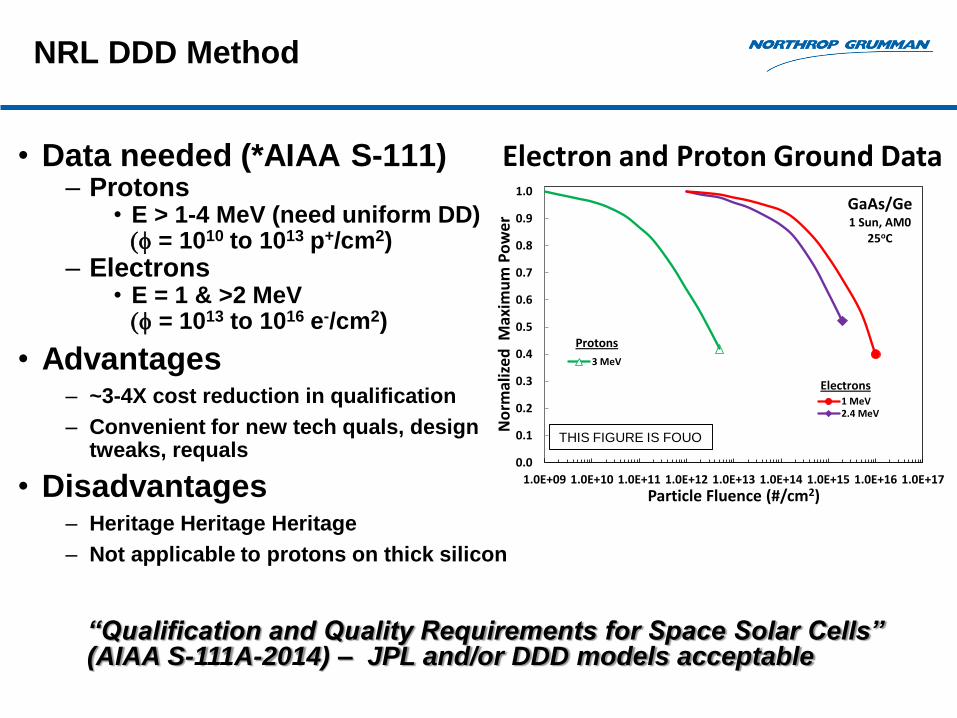
NRL DDD Method
• Data needed (*AIAA S-111)– Protons
• E > 1-4 MeV (need uniform DD)(f = 1010 to 1013 p+/cm2)
– Electrons• E = 1 & >2 MeV(f = 1013 to 1016 e-/cm2)
• Advantages– ~3-4X cost reduction in qualification
– Convenient for new tech quals, design tweaks, requals
• Disadvantages– Heritage Heritage Heritage
– Not applicable to protons on thick silicon
0.0
0.1
0.2
0.3
0.4
0.5
0.6
0.7
0.8
0.9
1.0
1.0E+09 1.0E+10 1.0E+11 1.0E+12 1.0E+13 1.0E+14 1.0E+15 1.0E+16 1.0E+17
No
rmal
ize
d M
axim
um
Po
we
rParticle Fluence (#/cm2)
3 MeV
0.0
0.1
0.2
0.3
0.4
0.5
0.6
0.7
0.8
0.9
1.0
1.0E+09 1.0E+10 1.0E+11 1.0E+12 1.0E+13 1.0E+14 1.0E+15 1.0E+16 1.0E+17
No
rmal
ize
d M
axim
um
Po
we
r
Particle Fluence (#/cm2)
0.6 MeV1 MeV2.4 MeV12 MeV
Protons
Electrons
GaAs/Ge1 Sun, AM0
25oC
Electron and Proton Ground Data
“Qualification and Quality Requirements for Space Solar Cells” (AIAA S-111A-2014) – JPL and/or DDD models acceptable
THIS FIGURE IS FOUO

Space Solar Cell Modeling:
NRL Displacement Damage
Dose (DDD)

NRL Displacement Damage Dose Model for
Solar Cell EOL Calculations
Input Nonionizing Energy Loss (NIEL) Data
(Energy Dependence of Damage
Coefficients)
Determine Characteristic Degradation
Curve vs. DDD (NIEL x Fluence)
(2 e- and 1 p+ energy)
Read Off EOL Value
Determine Incident Particle
Spectrum (e.g. AP8, AE8)
Calculate Slowed-Down
Spectrum (SDS) (Shielding)
Calculate DDD for Mission
(Integrate SDS with NIEL)
*RED – Measurements *Blue – Calculation *Green – Data input
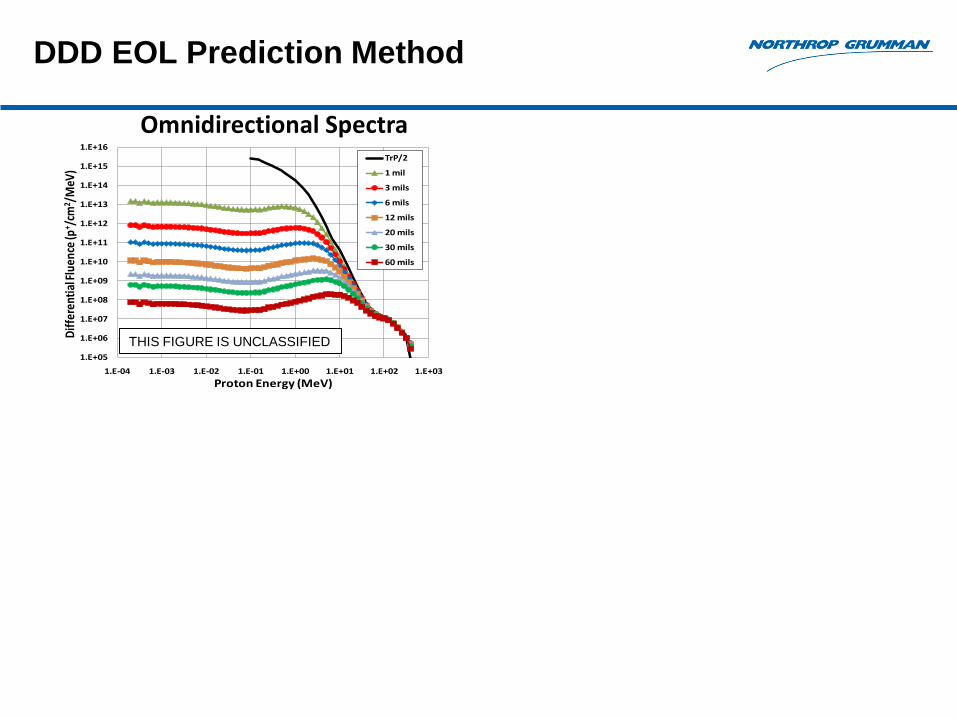
DDD EOL Prediction Method
1.E+05
1.E+06
1.E+07
1.E+08
1.E+09
1.E+10
1.E+11
1.E+12
1.E+13
1.E+14
1.E+15
1.E+16
1.E-04 1.E-03 1.E-02 1.E-01 1.E+00 1.E+01 1.E+02 1.E+03
Dif
fere
ntia
l Flu
ence
(p+ /c
m2 /M
eV)
Proton Energy (MeV)
TrP/2
1 mil
3 mils
6 mils
12 mils
20 mils
30 mils
60 mils
Omnidirectional Spectra
THIS FIGURE IS UNCLASSIFIED

DDD EOL Prediction Method
1.E+05
1.E+06
1.E+07
1.E+08
1.E+09
1.E+10
1.E+11
1.E+12
1.E+13
1.E+14
1.E+15
1.E+16
1.E-04 1.E-03 1.E-02 1.E-01 1.E+00 1.E+01 1.E+02 1.E+03
Dif
fere
ntia
l Flu
ence
(p+ /c
m2 /M
eV)
Proton Energy (MeV)
TrP/2
1 mil
3 mils
6 mils
12 mils
20 mils
30 mils
60 mils
1.E-03
1.E-02
1.E-01
1.E+00
1.E+01
1.E-04 1.E-03 1.E-02 1.E-01 1.E+00 1.E+01 1.E+02 1.E+03
Non
ioni
zing
Ene
rgy
Loss
(MeV
cm2 /g
)
Proton Energy (MeV)
GaAs
Nonionizing Energy Loss (2006)Omnidirectional Spectra
THIS FIGURE IS UNCLASSIFIED THIS FIGURE IS UNCLASSIFIED

DDD EOL Prediction Method
1.E+07
1.E+08
1.E+09
1.E+10
1.E+11
1.E+12
1.E+13
0 10 20 30 40 50 60 70
Dis
plac
emen
t Dam
age
Dos
e (M
eV/g
)
SiO2 Coverglass Thickness (mils)
1.E+05
1.E+06
1.E+07
1.E+08
1.E+09
1.E+10
1.E+11
1.E+12
1.E+13
1.E+14
1.E+15
1.E+16
1.E-04 1.E-03 1.E-02 1.E-01 1.E+00 1.E+01 1.E+02 1.E+03
Dif
fere
ntia
l Flu
ence
(p+ /c
m2 /M
eV)
Proton Energy (MeV)
TrP/2
1 mil
3 mils
6 mils
12 mils
20 mils
30 mils
60 mils
1.E-03
1.E-02
1.E-01
1.E+00
1.E+01
1.E-04 1.E-03 1.E-02 1.E-01 1.E+00 1.E+01 1.E+02 1.E+03
Non
ioni
zing
Ene
rgy
Loss
(MeV
cm2 /g
)
Proton Energy (MeV)
GaAs
Nonionizing Energy Loss (2006)Omnidirectional Spectra
Total Mission DDD
THIS FIGURE IS UNCLASSIFIED
THIS FIGURE IS UNCLASSIFIED THIS FIGURE IS UNCLASSIFIED

DDD EOL Prediction Method
0.3
0.4
0.5
0.6
0.7
0.8
0.9
1.0
1.E+07 1.E+08 1.E+09 1.E+10 1.E+11 1.E+12
Rem
ain
ing
Maxim
um
Po
wer
DDD(protron) and DDD(1 MeV electron) (MeV/g)
GaAs/Ge (AM0, 1 sun, 25oC)
electrons
protons
neutrons
1.E+07
1.E+08
1.E+09
1.E+10
1.E+11
1.E+12
1.E+13
0 10 20 30 40 50 60 70
Dis
plac
emen
t Dam
age
Dos
e (M
eV/g
)
SiO2 Coverglass Thickness (mils)
1.E+05
1.E+06
1.E+07
1.E+08
1.E+09
1.E+10
1.E+11
1.E+12
1.E+13
1.E+14
1.E+15
1.E+16
1.E-04 1.E-03 1.E-02 1.E-01 1.E+00 1.E+01 1.E+02 1.E+03
Dif
fere
ntia
l Flu
ence
(p+ /c
m2 /M
eV)
Proton Energy (MeV)
TrP/2
1 mil
3 mils
6 mils
12 mils
20 mils
30 mils
60 mils
1.E-03
1.E-02
1.E-01
1.E+00
1.E+01
1.E-04 1.E-03 1.E-02 1.E-01 1.E+00 1.E+01 1.E+02 1.E+03
Non
ioni
zing
Ene
rgy
Loss
(MeV
cm2 /g
)
Proton Energy (MeV)
GaAs
Total Mission DDD
Nonionizing Energy Loss (2006)
Pmax Degradation
Omnidirectional Spectra
x
dd
D
DCA
P
DP1log
)(
0
Data Fit (a, C, Dx)
THIS FIGURE IS UNCLASSIFIED
THIS FIGURE IS UNCLASSIFIED
THIS FIGURE IS UNCLASSIFIED THIS FIGURE IS UNCLASSIFIED

SCREAM (Solar Cell Radiation Environment
Analysis Models)
– Excel file driven menus as inputs• Input integral radiation spectra
– Single & multi-spectra, electron and proton
• Shielding material• Nonionizing energy loss (NIEL)• Multilayer shielding• Parametric degradation coefficients(GaAs, ITJ, UTJ, ATJ, Si-electrons, user)
– Output• Slowed-down radiation spectra• End-of-life (EOL) predictions• DDD only options (“ShielDDDose”)• Trajectory capability through “Time
Series Spectra” input option
SCREAM is available by request in CD format
*Contact: Dr. Scott R. Messenger (NGC)

SCREAM Success Stories
• TacSat4 (HEO: 700 km x 12,050 km, 63.4o)
– Used onboard dosimetry (CEASE-II) and solar cell experiment to explain
anomalously large solar array degradation rates
– SCREAM used CEASE-II data to corroborate solar cell experiment (full IV)
data and re-project mission lifetime
• GPS-IIR SV41 (MEO: 20,200 km, 55o)
– GPS has been plagued with anomalous solar array degradation since
onset (many mitigation paths successful, but anomaly continues)
– SCREAM used LANL BDD Detector data to help understand damage
mechanisms and eliminate displacement damage as the anomaly
• Low-Thrust Trajectory Orbit to GEO (LT2GEO)
– Low-thrust trajectories are extreme mass & cost cutting measures
• Spacecraft subjected to extreme proton belts
– SCREAM can simply analyze accumulated DDD to optimize LT trajectory

TacSat4 (HEO: 700 km x 12,050 km, 63.4o)
* Graphic created using AFGEOSPACE (V2.5)
>1 MeV electrons
>10 MeV protons
• NRL satellite launched 27 Sept. 2011 (Kodiak, AK)

TacSat4 (HEO: 700 km x 12,050 km, 63.4o) –
Trapped Protons Dominant
• Maximum Power Degradation on Emcore ATJ Solar Cell
0.65
0.70
0.75
0.80
0.85
0.90
0.95
1.00
9/27/2011 10/27/2011 11/26/2011 12/26/2011 1/25/2012 2/24/2012 3/25/2012
Re
mai
nin
g M
axim
um
Po
we
r
Date of Mission
Measured power exceeds predictions using
AP9 95th worst case environment!
Shielding
6 mils CMG
2 mils DC 93-500
Emcore BTJM 3J
AP9-MC-95th
AP8MIN
AP9Mean
1 year spec

TacSat4 (HEO: 700 km x 12,050 km, 63.4o) –
Trapped Protons Dominant
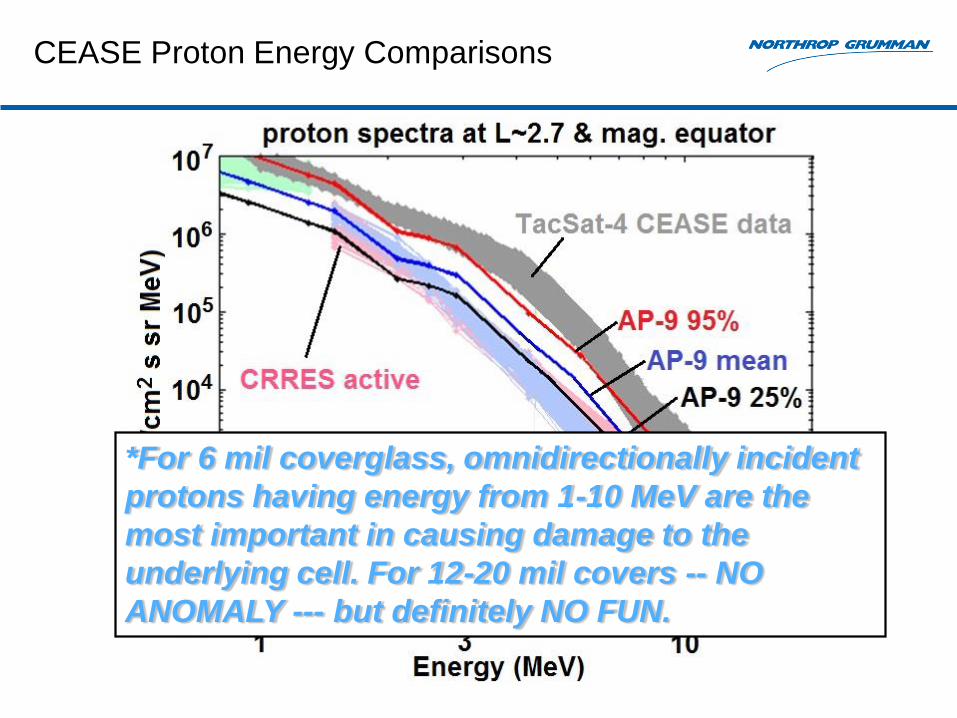
• Two additional payloads on-board– AFRL: CEASE-II dosimeter package
• Several dosimeters (particle fluence, TID, SEE, SC)
• 0.7-80 MeV protons & 0.05-3 MeV electrons
– NRL: Two solar cell experiments yielding full IV curves
• SCE#1: SolAero BTJM (3J w/ 6 mil CMG coverglass)
SCE #1CEASE-II

CEASE Proton Energy Comparisons

CEASE Proton Energy Comparisons
CEASE Proton Energy Comparisons
*For 6 mil coverglass, omnidirectionally incident
protons having energy from 1-10 MeV are the
most important in causing damage to the
underlying cell. For 12-20 mil covers -- NO
ANOMALY --- but definitely NO FUN.

TacSat4 (HEO: 700 km x 12,050 km, 63.4o) –
Trapped Protons Dominant
• SCREAM: Environment data through 6 mil CMG & 2 mil adhesive
0.0E+00
1.0E+07
2.0E+07
3.0E+07
4.0E+07
5.0E+07
6.0E+07
7.0E+07
8.0E+07
9.0E+07
9/14/2011 12/23/2011 4/1/2012 7/10/2012 10/18/2012 1/26/2013 5/6/2013
Dis
pla
cem
en
t D
amag
e D
ose
(M
eV
/g)
Date of Mission
CEASEAP8MINAP9MeanAP9-MC-95th
SCREAM Shielding
6 mils CMG
2 mils DC 93-500
Emcore BTJM 3J
AP9-95th
AP8MIN
AP9Mean
CEASE

0.55
0.60
0.65
0.70
0.75
0.80
0.85
0.90
0.95
1.00
Sep-11 Nov-11 Jan-12 Mar-12 May-12 Jul-12 Sep-12 Nov-12 Jan-13 Mar-13
Re
mai
nin
g P
aram
ete
r
Date of Mission
SOLID: SCREAM calculations using CEASE environment data
DOTTED: Onboard data collected from solar cell experiment
1016 2x10¹⁶(Equiv. 1 MeV electron fluence)
Isc
Voc
Pmax
TacSat4 (HEO: 700 km x 12,050 km, 63.4o) –
Trapped Protons Dominant
• SCREAM: DDD results applied to SolAero ATJ solar cell technology
Shielding
6 mils CMG
2 mils DC 93-500
Emcore ATJ

GPS-IIR (MEO: 20,200 km, 55o)
• SVN41 Launched 10 Nov 2000
*NIM A 482, 653 (2002)

GPS-IIR (MEO: 20,200 km, 55o) – Trapped
Electrons Dominant
• GPS spacecraft have shown anomalous silicon solar array degradation
throughout [>30] year existence (Marvin, 1988)
• Many possibilities posed (coatings, coverglass, contamination, ESD,
radiation environment related) but none confirmed
• GPS III plans on using oversized arrays to maintain necessary EOL levels
0.68
0.70
0.72
0.74
0.76
0.78
0.80
0.82
0.84
0.86
0.88
0.90
0.92
0.94
0.96
0.98
1.001
2/1
0/0
0
12
/10
/01
12
/10
/02
12
/10
/03
12
/10
/04
12
/10
/05
12
/10
/06
12
/10
/07
12
/10
/08
12
/10
/09
Re
mai
nin
g C
urr
en
t at
28
.28
V
~25% deviation
after 9 yrs!
GPS SVN 41 (Block IIR-6)
Solar array
telemetry data
AE8MAX AE8MAX+ESP(50%)
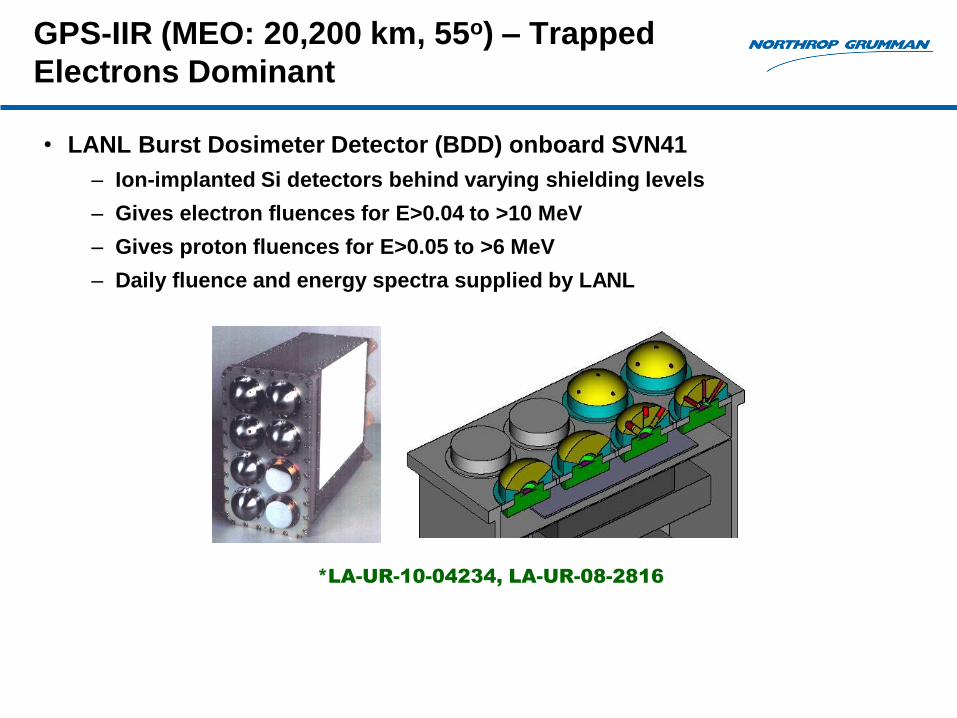
GPS-IIR (MEO: 20,200 km, 55o) – Trapped
Electrons Dominant
• LANL Burst Dosimeter Detector (BDD) onboard SVN41
– Ion-implanted Si detectors behind varying shielding levels
– Gives electron fluences for E>0.04 to >10 MeV
– Gives proton fluences for E>0.05 to >6 MeV
– Daily fluence and energy spectra supplied by LANL
*LA-UR-10-04234, LA-UR-08-2816

GPS-IIR (MEO: 20,200 km, 55o) – Trapped
Electrons Dominant
• SCREAM used BDD data to determine expected Si solar cell degradation
behind 12 mil CMX coverglass
• Displacement damage eliminated from secondary damage mechanism
• Other damage mechanism causing anomaly
0.68
0.70
0.72
0.74
0.76
0.78
0.80
0.82
0.84
0.86
0.88
0.90
0.92
0.94
0.96
0.98
1.00
12/1
0/20
00
12/1
0/20
01
12/1
0/20
02
12/1
0/20
03
12/1
0/20
04
12/1
0/20
05
12/1
0/20
06
12/1
0/20
07
12/1
0/20
08
12/1
0/20
09
Re
mai
nin
g C
urr
en
t @
28
.28
V
AE8MAXAE8MAX + ESP Total (50%)LANL Electrons (JPL Model)LANL Electrons (NRL Model)Solar Array Current @ 28.28 V
Other damage
mechanisms
On-orbit
correction
AE8 not so bad!
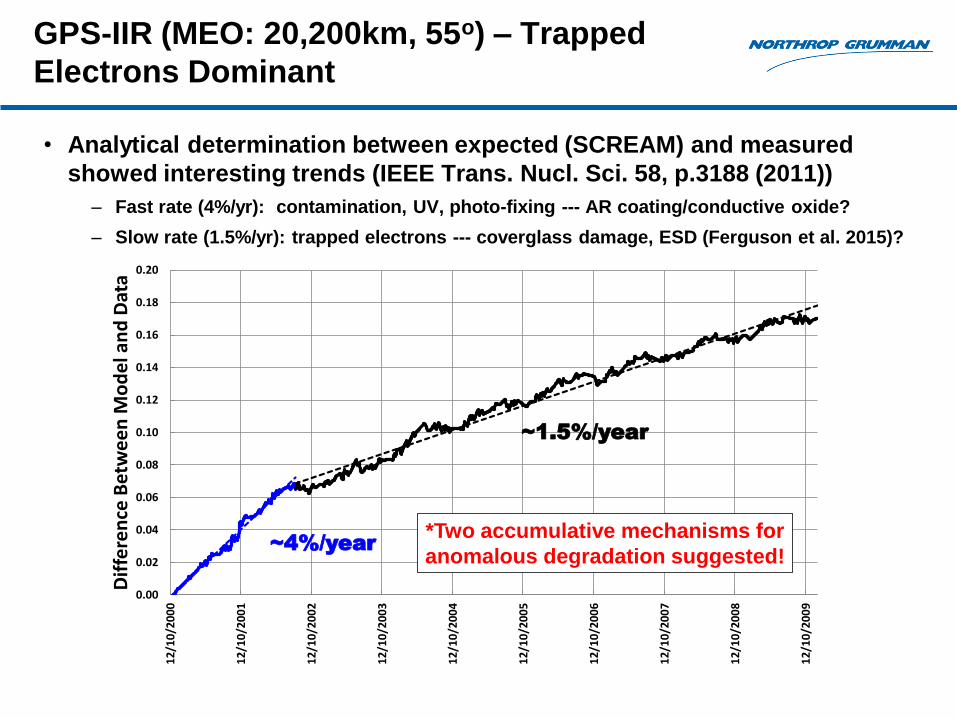
GPS-IIR (MEO: 20,200km, 55o) – Trapped
Electrons Dominant
• Analytical determination between expected (SCREAM) and measured
showed interesting trends (IEEE Trans. Nucl. Sci. 58, p.3188 (2011))
– Fast rate (4%/yr): contamination, UV, photo-fixing --- AR coating/conductive oxide?
– Slow rate (1.5%/yr): trapped electrons --- coverglass damage, ESD (Ferguson et al. 2015)?
0.00
0.02
0.04
0.06
0.08
0.10
0.12
0.14
0.16
0.18
0.20
12/
10
/20
00
12
/10
/20
01
12
/10
/20
02
12
/10
/20
03
12
/10
/20
04
12
/10
/20
05
12
/10
/20
06
12
/10
/20
07
12
/10
/20
08
12
/10
/20
09
Dif
fere
nce
Bet
we
en
Mo
de
l an
d D
ata
~4%/year
~1.5%/year
*Two accumulative mechanisms for
anomalous degradation suggested!

Low-Thrust Trajectory to GEO (LT2GEO)
Trade Off• Reduced Launch Costs
• Increased Payload
• Delayed GEO operations
• More Radiation Exposure
>1 MeV electrons
>10 MeV protons
Graphic created using AFGEOSPACE (V2.5)

Low-Thrust Trajectory to GEO (LT2GEO)
0
10000
20000
30000
40000
50000
60000
12/1/2017 12/31/2017 1/31/2018 3/2/2018 4/2/2018 5/2/2018
Alt
itu
de
(km
)
Date Along Trajectory
“Minimum-Time” Low-Thrust Trajectory
131 days to GEO
*Initial Orbit - GTO

Low-Thrust Trajectory to GEO (LT2GEO)
Electron & Proton Fluxes Along Trajectory (AE8MAX/AP8MAX)
1.0E+00
1.0E+01
1.0E+02
1.0E+03
1.0E+04
1.0E+05
1.0E+06
1.0E+07
0 20 40 60 80 100 120 140
Par
ticl
e F
lux
(#/c
m2/s
)
Days in Mission
AE8MAX (>1 MeV electrons)AP8MAX (>10 MeV protons)

Low-Thrust Trajectory to GEO (LT2GEO) –
Trapped Protons Dominant
DDD Along Trajectory (AE8MAX/AP8MAX)
* Trapped protons dominate the DDD for the LT2GEO transfer
1.0E-02
1.0E-01
1.0E+00
1.0E+01
1.0E+02
1.0E+03
1.0E+04
1.0E+05
0 20 40 60 80 100 120 140
DD
D (
Me
V/g
)
Days in Mission
AP8MAX
AE8MAX
4.83 mils CMG (4 mils CMG & 1 mils adhesive)

Low-Thrust Trajectory to GEO (LT2GEO) –
Trapped Protons Dominant
Solar Cell Degradation (AP8MAX/AE8MAX)
*The LT2GEO transfer significantly degrades both 1J and 3J solar cells
0.70
0.72
0.74
0.76
0.78
0.80
0.82
0.84
0.86
0.88
0.90
0.92
0.94
0.96
0.98
1.00
0 20 40 60 80 100 120 140
Re
ma
inin
g P
ma
x
Days in Mission
4.83 mils CMG (4 mils CMG & 1 mil adhesive, infinite back)
Triple Junction
Single Junction
After further
15 year GEO
parked
environment

Summary
• SCREAM employs the DDD model for solar cell
degradation
– Slab geometry (2p)
• Bonus Capabilities
– Multi-layered shielding
– Time series spectra (on-orbit data, trade studies)
– ShielDDDose (Depth-DDD curves)
• Applications
– Easy interpretation of dosimeter data onboard spacecraft for ORS
• TacSat4 – helped understand extra radiation to project mission lifetime
• GPS – eliminated DDD effects in solar cell to push efforts elsewhere
• LT2GEO – aids in better solar array designs in present low-cost needs
– Not only for solar cells (LEDs, laser diodes, CCDs, etc.)
• Any ground data for which a parametric vs. DDD curve can be created
