solar power, nem and challenges to the traditional utility...
TRANSCRIPT
Solar Power, NEM and Challenges to the Traditional Utility Model
Carrie Cullen Hitt SVP, State Affairs

About SEIA
• Founded in 1974
• U.S. National Trade Association for Solar Energy • 1,000 member companies from around the world • Members from across 50 states • Largest companies in the world as well as small installers
• Our Mission: Build a strong solar industry to power America
• Our Goal: 10 gigawatts (GW) of annual installed solar capacity in the U.S. by 2015
April 8, 2014 © 2013 Solar Energy Industries Association® 2
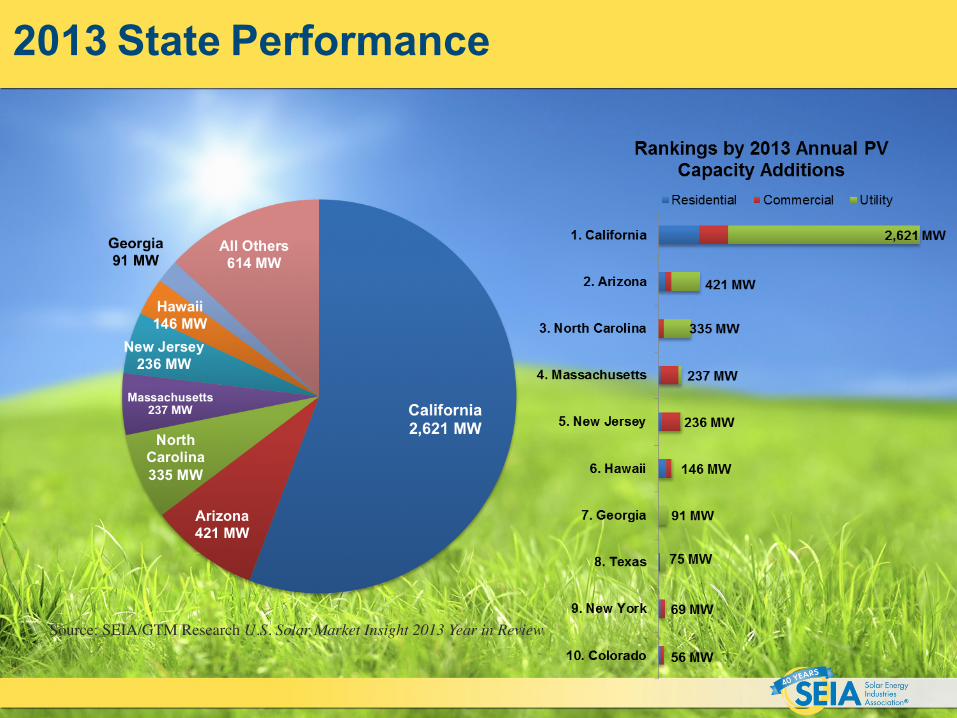
2013 State Performance
Source: SEIA/GTM Research U.S. Solar Market Insight 2013 Year in Review
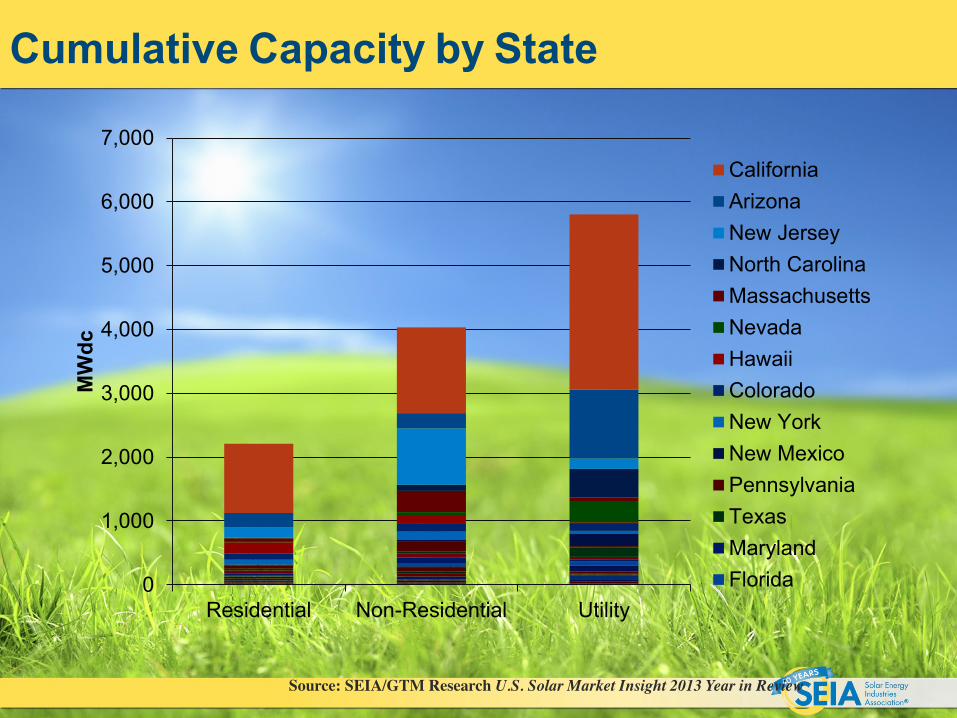
Cumulative Capacity by State
0
1,000
2,000
3,000
4,000
5,000
6,000
7,000
Residential Non-Residential Utility
MWdc
CaliforniaArizonaNew JerseyNorth CarolinaMassachusettsNevadaHawaiiColoradoNew YorkNew MexicoPennsylvaniaTexasMarylandFlorida
Source: SEIA/GTM Research U.S. Solar Market Insight 2013 Year in Review

How does NEM work?
April 8, 2014 © 2013 Solar Energy Industries Association® 5
0 1 2 3 4 5 6 7 8 9 10 11 12 13 14 15 16 17 18 19 20 21 22 23
Energy (k
Wh)
Sample Customer Load by Hour in One Day
Evening
In the evening and night hours, the customer will again pull electricity from the grid. Credits from the exports go toward “netting out” usage on a month-to-month or annual true-up.
Mid-day Morning
In the morning hours when the solar system produces less electricity than needed, the customer will pull electricity from the grid.
In the middle of the day when the solar system produces more energy than is needed onsite, the extra power is exported to the grid and the meter runs backward, building up a credit with the utility.
Retail Customer Retail Customer Solar Generation Used Onsite
Extra Power Exported
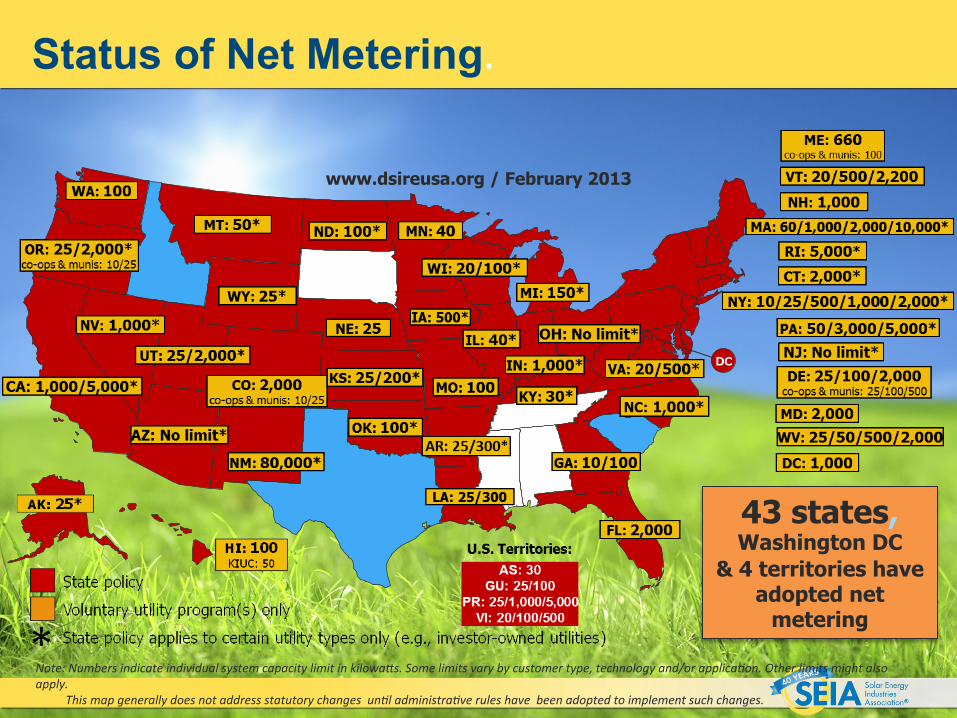
Status of Net Metering.
www.dsireusa.org / February 2013
43 states, Washington DC
& 4 territories have adopted net
metering
Note: Numbers indicate individual system capacity limit in kilowa7s. Some limits vary by customer type, technology and/or applica>on. Other limits might also apply. This map generally does not address statutory changes un>l administra>ve rules have been adopted to implement such changes.
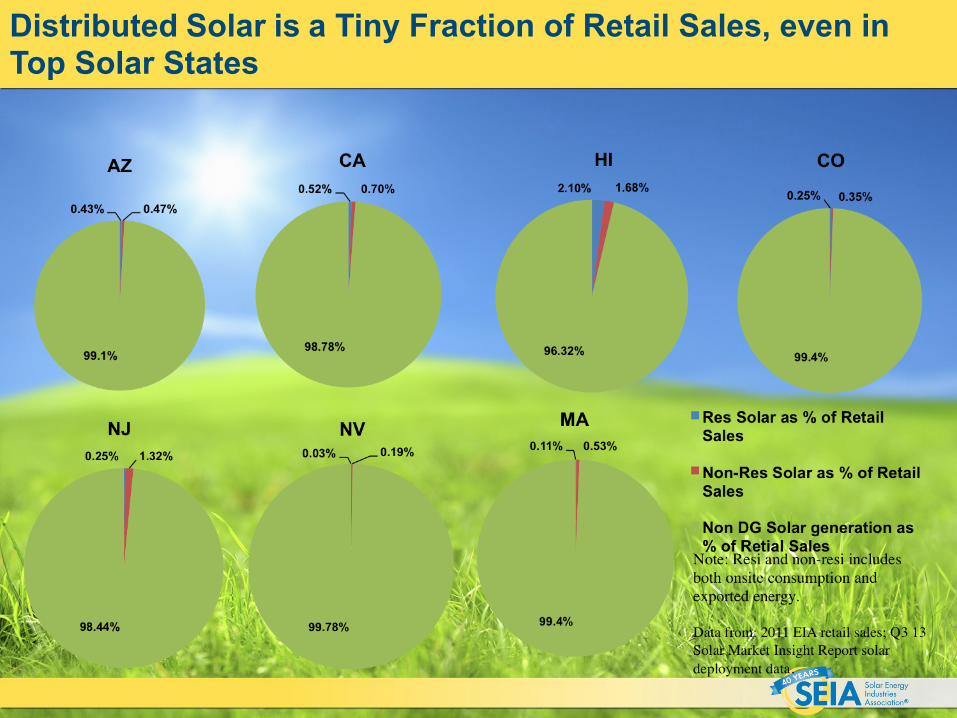
Distributed Solar is a Tiny Fraction of Retail Sales, even in Top Solar States
April 8, 2014 © 2013 Solar Energy Industries Association® 7
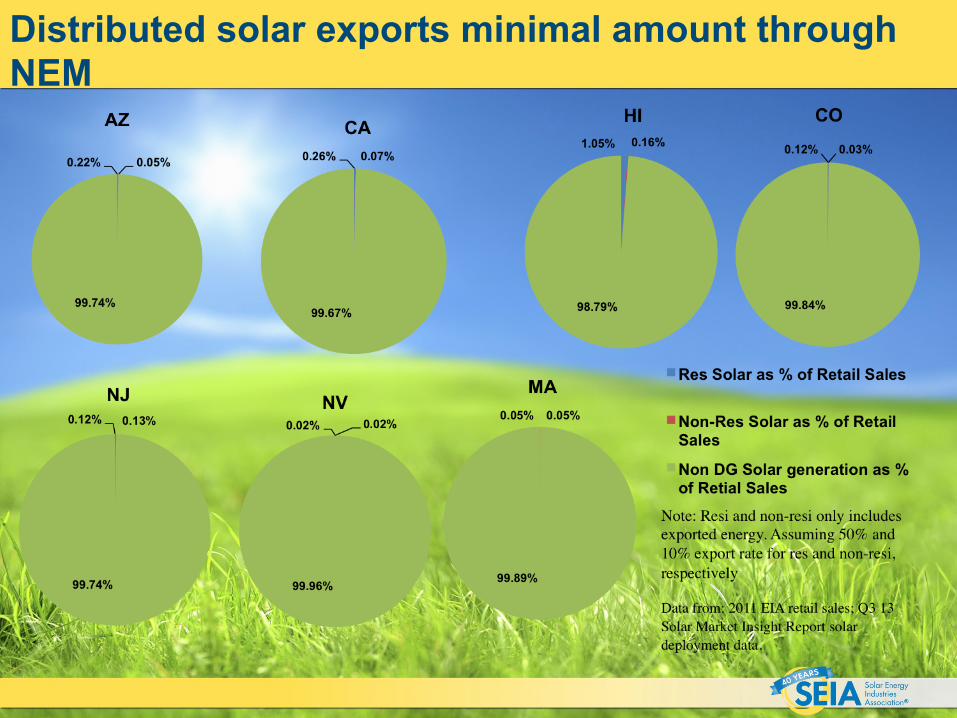
Distributed solar exports minimal amount through NEM
April 8, 2014 © 2013 Solar Energy Industries Association® 8

2014 Net Metering Campaigns/Dockets
DC
Net metering under discussion (including legisla<on, rate cases, C&B studies, or solar valua<on assessment underway or expected to start in 2014)
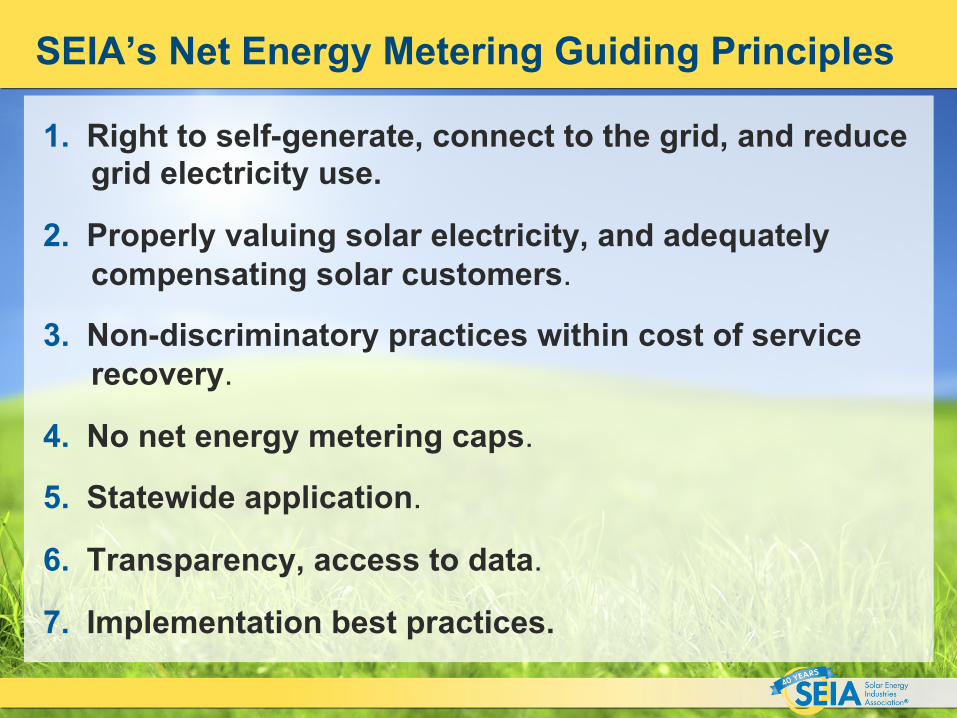
SEIA’s Net Energy Metering Guiding Principles
1. Right to self-generate, connect to the grid, and reduce grid electricity use.
2. Properly valuing solar electricity, and adequately compensating solar customers.
3. Non-discriminatory practices within cost of service recovery.
4. No net energy metering caps.
5. Statewide application.
6. Transparency, access to data.
7. Implementation best practices.

Challenges and Solutions
• Technological and use changes are impacting the grid. Customers have more control and more access to data.
• The vertically integrated/cost of service/guaranteed ROR model faces challenges.
• Acknowledging the change is key • Changing rate design is critical
– Rates can’t be 100% volumetric – Benefits of technological and behavioral change should
be recognized – Fixed costs for services should be valued – Cost recovery could be forward looking
April 8, 2014 © 2014 Solar Energy Industries Association® 11
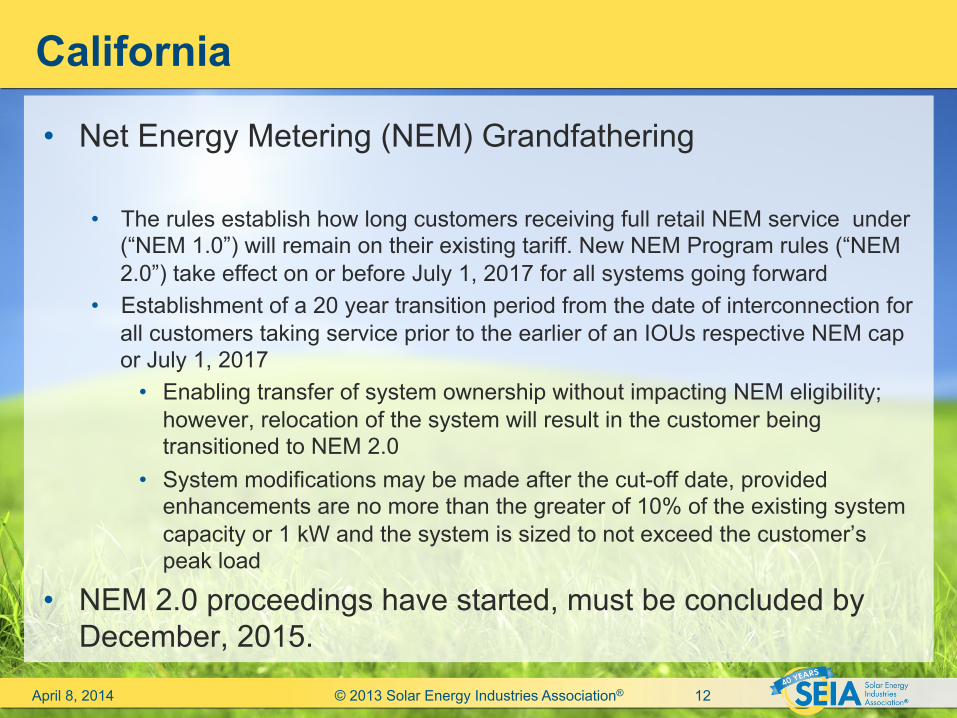
California
• Net Energy Metering (NEM) Grandfathering
• The rules establish how long customers receiving full retail NEM service under (“NEM 1.0”) will remain on their existing tariff. New NEM Program rules (“NEM 2.0”) take effect on or before July 1, 2017 for all systems going forward
• Establishment of a 20 year transition period from the date of interconnection for all customers taking service prior to the earlier of an IOUs respective NEM cap or July 1, 2017
• Enabling transfer of system ownership without impacting NEM eligibility; however, relocation of the system will result in the customer being transitioned to NEM 2.0
• System modifications may be made after the cut-off date, provided enhancements are no more than the greater of 10% of the existing system capacity or 1 kW and the system is sized to not exceed the customer’s peak load
• NEM 2.0 proceedings have started, must be concluded by December, 2015.
April 8, 2014 © 2013 Solar Energy Industries Association® 12

California
• Rate Design • Residential Rate Design OIR
• IOUs’ Phase 2 (summer 2014) rate proposals were restricted to only incremental changes
• IOU proposals for post-2014 rate design submitted Feb 28th most proposed an immediate collapsing of tiers to a two tier structure by 2018, with a fixed charge implemented over time, capped at $10. One utilities proposed TOU be implemented post-2018.
• Commercial Rate Design • PG&E’s GRC Phase 2 proposal limits A-6 eligibility; in settlement
discussions • SCE’s Rate Design Window Application which proposes to retain the
current 150 MW Option R (low demand change high volumetric rate/friendly solar) cap; awaiting a scoping memo
• SDG&E’s Rate Design Window Application which proposes changes to TOU periods for all customers
April 8, 2014 © 2013 Solar Energy Industries Association® 13

Arizona
• “Burns Innovation” docket holding a series of workshops – Intent is to review the major innovations and technological areas that
will have “the greatest potential to impact the current energy utility model”, including:
• Distributed Supply and Storage Resources Enabling Customer Self-supply; Utility-Scale Storage Technology and Transmission and Distribution Automation
• Energy Division will hold a series of NEM informal workshops
– Comments have been submitted re: scope and speaker recommendations
– After the workshops are held, Staff will draft a proposal for the ACC to consider adopting
April 8, 2014 © 2013 Solar Energy Industries Association® 14

Massachusetts
• Legislation: Very active and critical session, currently three Bills Of Interest – H4060/SB1978 Raise NEM CAP and create DPU
review – SEIA sponsored bill – S2030 creates competitive procurement for large solar,
create min bill for NEM customers only – utility sponsored bill
– Rep. Cusack& Sen. Finegold (number TBD) establishes authority for state to conduct RFP for more renewables, including Canadian hydro
April 8, 2014 © 2014 Solar Energy Industries Association® 15

Tuesday, April 8, 14 © 2009 SEIA 16
Minnesota VOST
• MN VOST Docket (E999/M-14-65) • Utility implement at their discretion. • Customer is charged for all energy consumed and
credited for all energy produced (buy all sell all). • A fixed price based on:
– Avoided fuel cost – Plant O&M-fixed & Variable – Avoided Gen Capacity Cost – Avoided Reserve Capacity Cost – Avoided Transmisison Capacity Cost – Avoided Distribution Capacity Cost – Avoided Environmental Cost