solar power unmanned aerial vehicle (uav)
TRANSCRIPT
! "!
SOLAR POWER UNMANNED AERIAL VEHICLE: HIGH ALTITUDE LONG
ENDURANCE APPLICATIONS (HALE-SPUAV)
A project
Presented to
The Faculty of the Department of Mechanical and Aerospace Engineering
San Jose State University
In Partial Fulfillment
Of the Requirements for the Degree
Master of Science
By
Manish R. Bhatt
May 2012

! ""!
! 2012
Manish R. Bhatt
ALL RIGHTS RESERVED
! """!
The Designated Committee Approves the Project Titled
SOLAR POWER UNMANNED AERIAL VEHICLE: HIGH ALTITUDE LONG
ENDURANCE APPLICATIONS (HALE-SPUAV)
By
MANISH R. BHATT
APPROVED FOR THE DEPARTMENT OF MECHANICAL AND AEROSPACE
ENGINEERING
SAN JOSE STATE UNIVERSITY
May 2012
Dr. Nikos Mourtos Committee Chair, San Jose State University
Dr. Periklis Papadopoulos Committee member, San Jose State University
Kanu Vyas Committee member, Boeing Commercial Airplanes
! "#!
ABSTRACT
SOLAR POWER UNMANNED AERIAL VEHICLE: HIGH ALTITUDE LONG
ENDURANCE APPLICATIONS (HALE-SPUAV)
By Manish R Bhatt
This project deals with UAV using solar energy as their only source of
energy for more than 24 hours flight. Using solar panels, it collects the energy
during the day for immediate use but also store the remaining part for the night
flight. The objective is to identify, design and analyze such a reusable solar
power unmanned areal vehicle for high altitude long endurance application with
successful implementation of higher energy density batteries such as Li-su.
A detail analysis has been performed to compare similar airplanes to
study their successes and failure. An aircraft with similar wingspan as NASA
Helios and remarkably less weight, nearly 1135lb, than it is been design. A
weight analysis and power sensitivity analysis were researched, and it was
shown that this aircraft would generate 75kw of power that is greater then the
power available to fly.

! #!
ACKNOWLEDGEMENTS
This project could never have been completed without the endless support
of my committee members, friends and family.
First, I would like to thank Professor Nikos Mourtos for his technical
guidance and knowledge of aircraft design. During the time of my masters he has
provided me an endless support personally and technically. Without him not even
this report also my graduate studies would not have been possible.
Second, I wish to thank Professor Perklis Papadopoulos for his opinions
and recommendations. Throughout my research, he has provided me help
whenever needed and broadened my knowledge and expertise in the field of
CFD.
Third, I would like to thank Kanu Vyas for taking time to tech me in our
chaotic work environment throughout this study.
Finally, I would like to thank my family and my close friends for being
there, without your encouragement I would not be where I am today.
! #"!
TABLE OF CONTENTS LIST OF FIGURES.……….……….……….……….……….……….……..….………X
LIST OF TABLES….……….……….……….……….………...……….……….……XII
1.0 INTRODUCTION.……….……….……….……….……….…………..….……1
1.1 MOTIVATION.……….……….……….……….……….…………...…….….…1
1.2 OBJECTIVE.……….……….……….……….……….……….…....….…….....2
1.3 LITERATURE REVIEW.……….……….……….……….……….……..…..…2
1.3.1 UAV.……….……….……….……….……….……….……….……...….………3
1.3.2 UAV HISTORY AND TIMELINE.……….………………….……..….….…….3
1.3.3 CLASSIFICATION OF UAVs.….…….……….……….……..….……….……6
1.4 SOLAR FLIGHT.……….……….……….……….……….…..…….…………..9
2.0 MISSION SPECIFICATION.……….……….……….………..……….……..13
2.1 MISSION PROFILE.……….……….……….……….………...……….……..13
2.2 MARKET ANALYSIS.……….……….……….……….……..….……….……14
2.3 TECHNICAL AND ECONOMICAL FEASIBILITY.……….…..…….………15
2.4 CRITICAL MISSION REQUIREMENTS.……….……….……..….………..15
3.0 COMPARATIVE STUDY OF SIMILAR AIRPLANES.……….…..….……..15
3.1 MISSION CAPABILITIES AND CONFIGURATION SELECTION.…..….15
3.2 COMPARISON OF IMPORTANT DESIGN PARAMETERS.……………..16
4.0 COMPARATIVE STUDY OF THE AIRPLANE WITH THE SIMILAR
MISSION PERFORMANC.….……….……….……….……..….……….…..17
5.0 SELECTION OF PROPULSION SYSTEM.……….……...….……….…….18
5.1 SELECTION OF NUMBER OF ENGINES.……….…..…….……….……..18
! #""!
5.2 PROPELLER SIZING.……….……….……….…………….……….………..18
6.0 CONFIGURATION SELECTION.……….…………………….……….…….19
6.0 OVERALL CONFIGURATION.……….……….……...…….……….……….19
6.1 WING CONFIGURATION.……….……….………..….……….……….……19
6.2 EMPENNAGE CONFIGURATION.……….……….…………..……….……23
6.3 LANDING GEAR DISPOSITION.……….……….……….……….…………23
6.4 PROPOSED CONFIGURATION.……….……….……….……….…………23
7.0 MISSION WEIGHT ESTIMATES.……….……….……….……….…………24
7.1 COMMENTS.……….……….……….……….……….……….……….……..24
7.2 SOLAR SYSTEM WEIGHTS.……….……….……….……….……….…….24
7.3 AIRFRAME WEIGHT.……….……….……….……….……….……….…….26
8.0 PERFORMANCE CONSTRAINT ANALYSIS.……….……….……….……27
8.1 COMMENTS.……….……….……….……….……….……….……….……..27
8.2 SIZING TO CRUISE SPEED.……….……….……….……….……….…….28
8.3 SIZING TO FAR23 RATE OF CLIMB REQUIREMENTS.……….………..29
8.4 PERFORMANCE SIZING CALCULATION.……….……….……….………29
8.5 POWER REQUIREMENT ANALYSIS.……….……….……….……….…...30
9.0 FUSELAGE DESIGN.……….……….……….……….……….……….…….32
10.0 LANDING GEAR DESIGN.……….……….……….……….……….……….32
11.0 WING, HIGH LIFT SYSTEM, AND LATERAL CONTROLS DESIGN……33
11.1 WING PLANFORM DESIGN.……….……….……….……….……….…….33
11.2 TAPER RATIO.……….……….……….……….……….……….……….…...33
11.3 DIHEDRAL ANGLE.……….……….……….……….……….……….………34

! #"""!
11.4 INCIDENCE ANGLE.……….……….……….……….……….……….……..34
11.5 CONTROL SURFACES.……….……….……….……….……….…………..34
11.6 WING CAD DRAWING.……….……….……….……….……….……….…..36
12.0 EMPENNAGE AND CONTROL ANALYSIS.……….……….……….……..37
12.1 OVERALL EMPENNAGE DESIGN.……….……….……….……….………36
12.2 EMPENNAGE AIRFOIL.……….……….……….……….……….………..…36
12.3 DESIGN OF THE LONGITUDINAL AND DIRECTIONAL CONTROLS…40
13.0 WEIGHT AND BALANCE.……….……….……….……….……….………...40
13.1 COMPONENT WEIGHT BREAKDOWN.……….……….……….…………40
13.1.1 MAXIMUM POWER POINT TRACKER.………….……….……….………40
13.1.2 AVIONICS.……….……….……….……….……….……….……….………..42
13.1.3 MOTORS.……….……….……….……….……….……….……….………...42
13.2 CENTER OF GRAVITY CALCULATION.……….……….……….…………44
14.0 STABILITY ANALYSIS.……….……….……….……….……….……………45
15.0 DRAG POLAR ESTIMATION.……….……….……….……….……….……50
15.1 AIRPLANE ZERO LIFT DRAG.……….……….……….……….……….…..50
15.2 AIRPLANE DRAG POLAR.……….……….……….……….……….……….51
15.3 DISCUSSION.……….……….……….……….……….……….……….…….52
16.0 ENVIRONMENTAL/ECONOMICAL TRADEOFFS.……….……….………52
16.1 ENVIRONMENTAL CONSIDERATION.……….……….……….………….52
16.2 ECONOMIC FEASIBILITY.……….……….……….……….……….……….53
17.0 CONCLUSION/RECOMMENDATION.……….……….……….……….…..54
REFERENCE.……….……….……….……….……….……….……….……….……55
! "$!
APPENDICES.……….……….……….……….……….……….……….……….…...56
APPENDIX A: COMPLETE DESIGN PARAMETERS FOR SIMILAR
AIRCRAFT.……….……….……….……….……….……….……….……….……….57
APPENDIX B: LANDING GEAR POSITIONS.……….……….……….…………...59
APPENDIX C & E: WING & AIRCRAFT CAD DRAWINGS.……….……….…….59
Appendix D: EMPENNAGE CAD DRAWINGS.……….……….……….………….61
APPENDIX F: XFLR5 DATA.……….……….……….……….……….……….…….61
! $!
LIST OF FIGURES
Figure 1: NASA-funded Gossamer Penguin by AeroVironment.……………..……9
Figure 2: NASA Pathfinder Plus.……….……….……….……….………….………10
Figure 3: NASA Centurion.……….……….……….……….……….……….……….11
Figure 4: NASA Helios.……….……….……….……….……….……….…………...12
Figure 5: Mission Profile for HALE-SPUAV.……….……….……….……….……….……….…14
Figure 6: Selig 1223 Airfoil with Unit Length.……….……….……….……….……20
Figure 7: XFLR5 Reynolds Number Legend (0.050 is 50000, 0.1 is 100,000,
etc.).……….……….……….……….……….……….……….……….……….………21
Figure 8: Lift-to-Drag Ratio as a Function of Angle of Attack.……….…………....21
Figure 9: Lift Coefficient as a Function of Angle of Attack.……….……….……….………21
Figure 10: Lift Coefficient as a Function of Drag Coefficient.……….……….……………22
Figure 11: Moment Coefficient as a Function of Angle of Attack.……….……….……..22
Figure 12: HALE-SPUAV proposed configuration.……….……….……….………23
Figure 13: Airframe Mass Prediction Models.……….……….……….……….……….………...26
Figure 14: Correlation between aircrafts speed and power index.……….………28
Figure 15: JavaProp Propeller Parameters Utilized on the HALE-SPUAV.……..31
Figure 16: Aircraft with Ailerons.……….……….……….……….……….……….……….…………..35
Figure 17: Ailerons with Dimensions in Feet.……….……….……….……….……35
Figure 18: XFLR5 Reynolds Number Legend (NACA0012).……….……….……….……38
Figure 19: Lift/Drag Ratio as a Function of Angle of Attack (NACA0012).…………38
Figure 20: Lift Coefficient as a Function of Angle of Attack.……….……………………...38
! $"!
Figure 21: Moment Coefficient as a Function of Angle of Attack.……….……………...38
Figure 22: Lift Coefficient as a Function of Drag Coefficient for NACA 0012
Airfoil.……….……….……….……….……….……….……….……….……….……….……….……….………..39
Figure 24: Solar Converters Inc MPPT.……….……….……….……….………….41
Figure 23: SunSaver MPPT Charge Controller SS-15.……….………….………..42
Figure 25: Mars Electric LLC PMAC Motor.……….……….……….……….……….…………...43
Figure 26: Aircraft CG Locations.……….……….……….……….……….……….……….…………44
Figure 27: Nastran Model to study vertical load.……….……….……….…………46
Figure 28: Vertical displacement of the Wing due to battery load.……….………46
Figure 29: Lift Coefficient as a Function of Angle of Attack for NACA 0012 Airfoil.……….……….……….……….……….……….……….……….……….……….……….……….……….48
Figure 30: Lift Coefficient as a Function of Angle of Attack for Selig 1223 Airfoil.……….……….……….……….……….……….……….……….……….……….……….……….……….48
! $""!
LIST OF TABLES
Table 1: Classification of UAVs.……….……….……….……….……….…………...7
Table 2: Important design parameters for similar aircrafts.……….……….……...16
Table 3: Aircraft Weight Estimates.……….……….……….……….……….……….……….………27
Table 4: Critical mission parameters.……….……….……….……….……….……….……….……27
Table 5: Wing Geometry Values.……….……….……….……….……….……….……….……….…33
Table 6: Dimensions for stabilizers.……….……….……….……….……….……...39
Table 7: Mars Electric LLC PMAC Motor Specs.……….……….……….……….……….……43
Table 8: Component Center of Gravity.……….……….……….……….……….….45
Table 9: Static Margin Variables and Definitions.……….……….……….……….47
Table 10: Drag Polar Comparison.……….……….……….……….……….……….51
! "!
1.0 INTRODUCTION
1.1 MOTIVATION
Today there are more than 11,000 UAVs in service (or planned service) by
the United States Military for various purposes. Although these UAVs provide
tremendous benefits, they fall short on performance due to their power
restrictions; they must either land to be recharged or land for another UAV to
complete the mission. By having the UAV returning every two (2) hours for
recharge can be extremely costly or dangerous for the war fighter, if used on the
battlefield [1].
Increasing battery sizes or the number of batteries, due to the weight
restrictions, cannot solve these problems; weight is proportional to the endurance
of the UAV. With the implementation of solar cells, the UAV would be able to
collect and store solar energy to be used for night time flight, and thus having no
return to recharge (R/R) requirement. Again efficiency would play a drastic role;
all the critical sub-systems must be lightweight and efficient enough to support
the total weight of the UAV.
Without an R/R requirement a war fighter can always depend on the UAV
being able to scan a perimeter prior to entry. Currently, the U.S. military has been
looking for a long endurance low cost surveillance aircraft, similar to this mission
(as defined in Section 3.0) [2]. This design may not only be used for military
purposes, but weather surveillance, and even commercial use.

! #!
1.2 OBJECTIVE
The objective of this mission is a proof of concept, to be implemented into
a fully functional prototype upon approval for specific military and commercial
use. The aircraft’s performance will be highly affected by the efficiencies of the
sub-systems. This UAV will be initially required to:
• Stay aloft for 4 days (96 hours) minimum
• Maintain 75,000 ft max. altitude (day time)
• Maintain 40,000 ft min. altitude (night time)
• Support a 100 lbs payload (excluded from weight of components)
• Achieve autonomous fight (after lift off)
• Return safely without any major damage to body or components
With respect to the mission requirements, the SPUAV shall be able to completely
recharge the onboard batteries using the equipped solar panels. At no time
during the flight is the SPUAV to R/R. The SPUAV shall be able to maintain
enough stored energy after its return to be able to be re-used within 24 hours
maximum (if required). If grounded for long than 24 hours, a recharge is
recommended.
1.3 LITERATURE REVIEW
In this section, a brief history of solar powered aircraft will be discussed,
as well as other UAV electric vehicle studies that have been done over the last
30 years. Detailed mission specification and performance data for the solar
powered UAVs that will be discussed are shown in Appendix A [1].

! $!
1.3.1 UAV
Unmanned Aerial Vehicles, or UAVs, as they have sometimes been
referred to, have only been in service for the last 60 years. UAVs are now an
important addition to many countries air defenses [1,2]. Modern UAVs have
come a long way since the unmanned drones used by the USAF in the 1940s.
These drones were built for spying and reconnaissance, but were not very
efficient due to major flaws in their operating systems. Over the years UAVs have
been developed into the highly sophisticated machines in use today. Modern
UAVs are used for many important applications including coast watch, news
broadcasting, and the most common application, defense [3].
1.3.2 UAV History and Timeline
The concept of unmanned aerial vehicles was first used in the American
Civil War, when the North and the South tried to launch balloons with explosive
devices that would fall into the other side’s ammunition depot and explode [2].
The Japanese for around a month in World War II also used this concept, when
they tried to launch balloons with incendiary and other explosives. The idea was
that high-altitude winds would carry them to the United States, where the
dropping bombs would cause panic. Apparently, both these ideas were not
effective [2].
The United States did use a prototype UAV called Operation Aphrodite in
World War II. It was an attempt to use manned vehicles in an unmanned mode.
However, at that time, the US did not have the technology to launch or control
the aircraft.

! %!
Today’s UAVs owe much to the design of the cruise missiles that were
used in World War II by the US and British forces. At the close of World War II,
Chance Vought Aircraft, a company with no missile experience, was contracted
to develop new machines. What won Vought the contact was that the proposed
test missile would have a landing gear, which would help save cost. This was the
beginning of the UAV [4].
USE OF UAV:
In the 1960s, the US started to develop ‘drones’, which were unmanned
vehicles built for spying and reconnaissance. This was after they lost a manned
spy aircraft to the Russians and a U-2 to Cuba. The first such drone was the
‘Firebee’ drone, a jet propelled by an engine made by Ryan Aeronautical
Company. They were initially used heavily over Communist China in the 1960s,
when major flaws were discovered and corrected [1-3].
The Vietnam War was the first time that UAVs, the drones in particular,
were used extensively in reconnaissance and combat roles. A large number of
Firebee drones, were launched for simple day reconnaissance activities. At first,
they had simple cameras on them. Later, they were equipped with night photos,
communications and electronic intelligence.
Over the last few years, it has been Israel that has been responsible for
much of the development that has happened in the UAV sector. The Hunter and
the Pioneer, which are used extensively by the US military, are direct derivatives
of Israeli systems. The Pioneer was used in the Gulf War to good effect.
Following the Gulf War, officials recognized the importance of unmanned
! &!
systems. The Predator, first an Advanced Technology Demonstration Project,
demonstrated its worth in the skies over the Balkans [4]. Some of the current
versions of the Predator are loaded with Hellfire missiles for attack purposes.
Another popular UAV is the Global Hawk. This is a jet powered UAV that
was used effectively in Afghanistan. It operates at around 60,000 feet, and
carries a wide range of sensors [5].
UAVs that are in use and under development are both long-range and
high-endurance vehicles. The Predator, for instance, can stay in the air for
around 40 hours. The Global Hawk can stay in the air for 24 hours [1,2].
TIMELINE [1,2]:
1922 – First Launch of an unmanned aircraft (RAE 1921 Target) from an aircraft
carrier (HMS Argus).
1924, 3 September – First successful flight by a radio controlled unmanned
aircraft without a safety pilot onboard; performed by the British RAE 1921 Target
1921, which flew 39 minutes.
1933 – First use of an unmanned aircraft as a target drone; performed by a
Fairey Queen for gunnery practice by the British Fleet in the Mediterranean.
1944, 12 June – First combat use of an unmanned aircraft (German Fi-103 “V- I”)
in the cruise missile role.
1944, 19 October - First combat use of an unmanned aircraft (U.S. Navy TDR- 1
attack drone) in the strike role, dropping 10 bombs on Japanese gun positions on
Ballale Island.
1946, 2 April – First use of unmanned aircraft for scientific research; performed
! '!
by a converted Northrop P-61 Black Widow for flights into thunderstorms by the
U.S. Weather Bureau to collect meteorological data.
1955 – First flight of an unmanned aircraft designed for reconnaissance;
performed by the Northrop Radioplane SD-1 Falconer/Observer, later fielded by
the U.S. and British armies.
1960, 12 August – First free flight by an unmanned helicopter; performed by the
Gyrodyne QH-50A at NATC Patuxrnt River, Maryland.
1998, 21 August – First trans-Atlantic crossing by an unmanned aircraft;
Performed by the Insitu Group’s Aerosonde Laima between Bell Island,
Newfoundland, and Benbecula, Outer Hebrides, Scotland.
2001, 22-23 April – First trans-Pacific crossing by an unmanned aircraft;
performed by the Northrop Grumman Global Hawk “Southern Cross II” between
Edwards AFB, California, and RAF Edinburgh, Australia.
1.3.3 Classification of UAVs
UAVs are being classified here in their main 4 categories: micro/mini
UAVs (MAV/mini), typical UAVs (TUAVs), strategic UAVs, and special task UAVs
where only decony and lethal are currently flying [4].
! (!
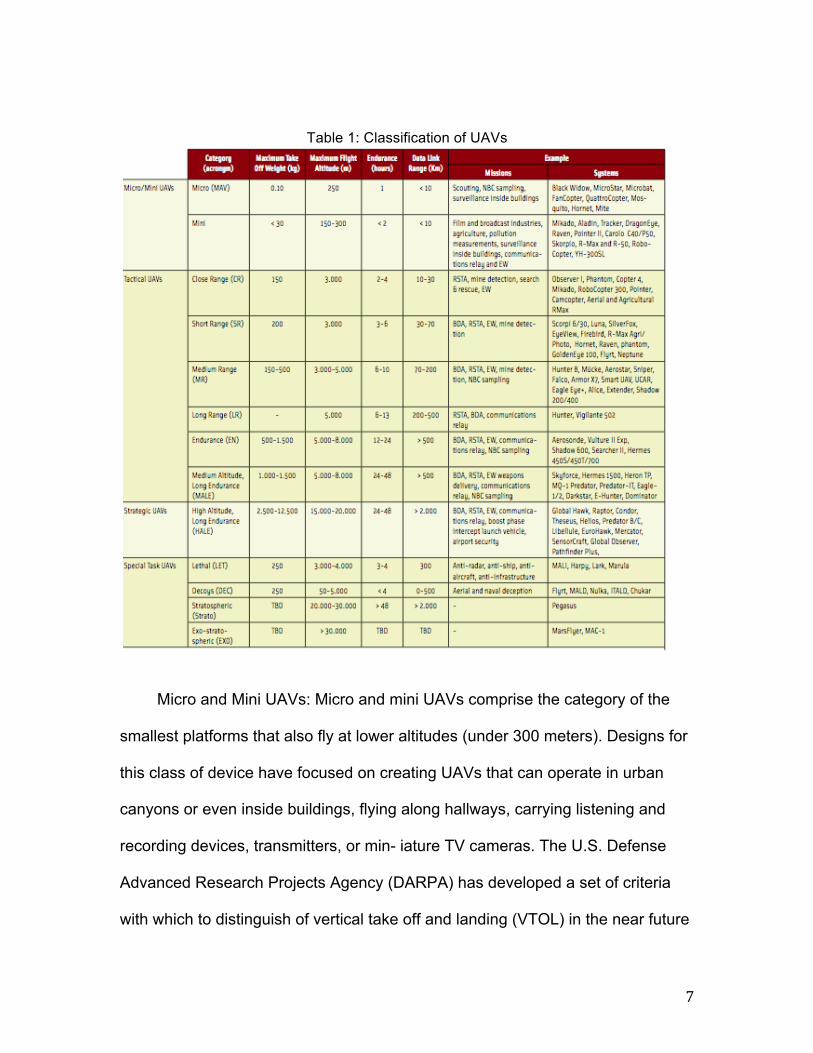
Table 1: Classification of UAVs
Micro and Mini UAVs: Micro and mini UAVs comprise the category of the
smallest platforms that also fly at lower altitudes (under 300 meters). Designs for
this class of device have focused on creating UAVs that can operate in urban
canyons or even inside buildings, flying along hallways, carrying listening and
recording devices, transmitters, or min- iature TV cameras. The U.S. Defense
Advanced Research Projects Agency (DARPA) has developed a set of criteria
with which to distinguish of vertical take off and landing (VTOL) in the near future
! )!
micro UAVs are expected to become more practical and prevalent. Thus, the
prospects are good for micro and mini UAVs to become intelligent “aerial
robwots,” that is, fully autonomous thinking machines [4].
Tactical UAVs: This category includes heavier platforms flying at higher alti-
tudes (from 3,000 to 8,000 meters). Unlike micro and mini UAVs, which are
mostly used for civil/commercial appli- cations, tactical UAVs primarily support
military applications.
Strategic UAVs: HALE platforms are strategic UAVs with a MTOW varying
from 2.500 kilograms up to 12.000 kilograms and a maximum flight altitude of
about 20,000 meters. They are highly automated, with takeoffs and landings
being performed automatically. At any time during its mission the ground control
station (GCS) can control the HALE UAV. Northrop Grumman’s military UAV, the
Global Hawk, with 35 hours of endurance is probably the most wellknown HALE
UAV and offers truly remarkable performance.
An example of a non-military HALE is the electric/solar-powered Helios,
which is some how similar to SPUAV-HALE, from Aerovironment operated by
NASA. The Helios uses solar panels to power electrically driven propellers and
has set an altitude record of about 98500 feet. This UAV’s design offers many
attractive features for civil tasks, such as Earth observation augmenting and
complementing remote sensing satellites. Other HALE UAV applications include
communications, mapping, and atmospheric monitoring.
! *!
1.4 SOLAR FLIGHT
Sunrise I: The first recorded solar flight was achieved by Astro Flight’s Sunrise I
in 1974. It was powered from PV cells mounted on the top surface of its wings,
capable of a maximum of 450 W. It weighed 27.5 lb, and had a 32 ft wingspan.
Sunrise I was damaged in a sand storm in 1975 [2].
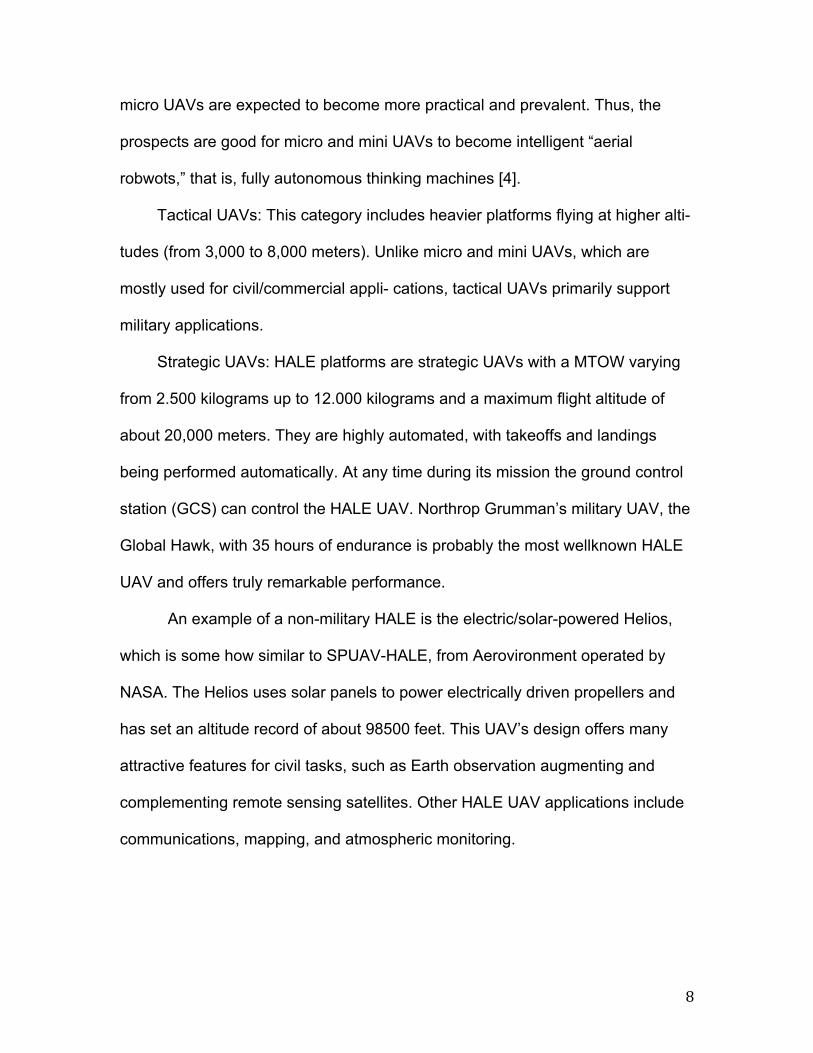
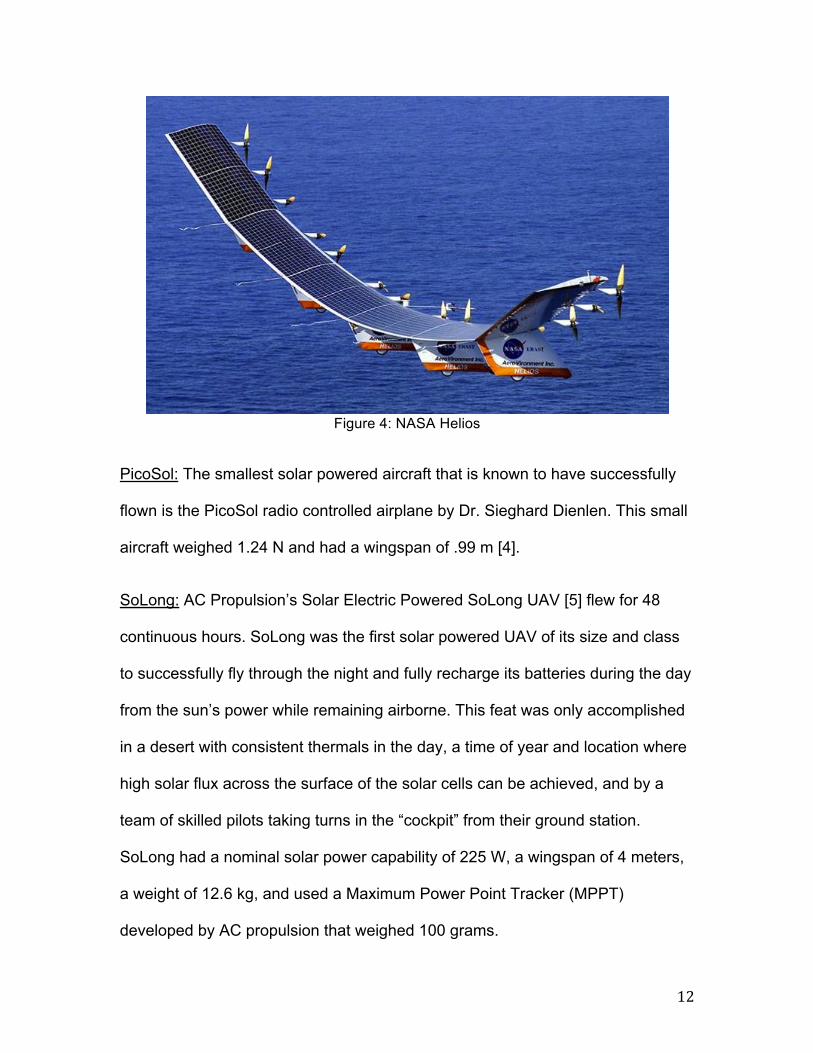
Gossamer Penguin :In 1980, AeroVironment flew the solar powered Gossamer
Penguin above Rogers Dry Lakebed at Edwards, California. This aircraft was
manned, weighed 68 lb without the pilot, used 600 W of power from solar cells,
had a wingspan of 71 ft, and made numerous flights. Its solar panels were fixed
at an angle to achieve high solar energy capture, as shown in Figure 1 [2].
Figure 1: NASA-funded Gossamer Penguin by AeroVironment
Pathfinder: AeroVironment was funded in 1981 to work on a classified solar
powered UAV project for the U.S. government. They built HALSOL (High-Altitude

! "+!
Solar Energy), a UAV that was mothballed for about a decade. HALSOL later
evolved into the solar UAV entitled Pathfinder, shown in Figure 2. Pathfinder
could produce a maximum of 8,000 W from solar cells, weighed 486 lbs, and had
a wingspan of 98 ft. In the mid 1990’s, NASA’s Environmental Research Aircraft
and Sensor Technology (ERAST) program became interested in solar aircraft
and Pathfinder became a part of NASA’s ERAST program. On Sept. 11, 1995,
Pathfinder set an altitude record for solar aircraft by climbing to 50,500 ft. The
National Aeronautic Association presented the NASA- industry team with an
award for one of the "10 Most Memorable Record Flights" in 1995. Pathfinder set
the world altitude record for both propeller driven aircraft and solar powered
aircraft in 1997 with an altitude of 71,530 ft. Pathfinder was later modified by an
increase of wingspan to 121 feet and a replacement of the old PV cells with
newer, more efficient cells. This increased the maximum power potential by
another 4,500 W. This version, called Pathfinder Plus, flew to an altitude of
80,000 ft. in 1998 [3].
Figure 2: NASA Pathfinder Plus

! ""!
Centurion: AeroVironment created Centurion in 1998 (Figure 3). Centurion had a
wingspan of 206 ft, weighed 1,300 lbs, and was powered with a PV array capable
of capturing a maximum of 31 kW of solar power [4].
Figure 3: NASA Centurion
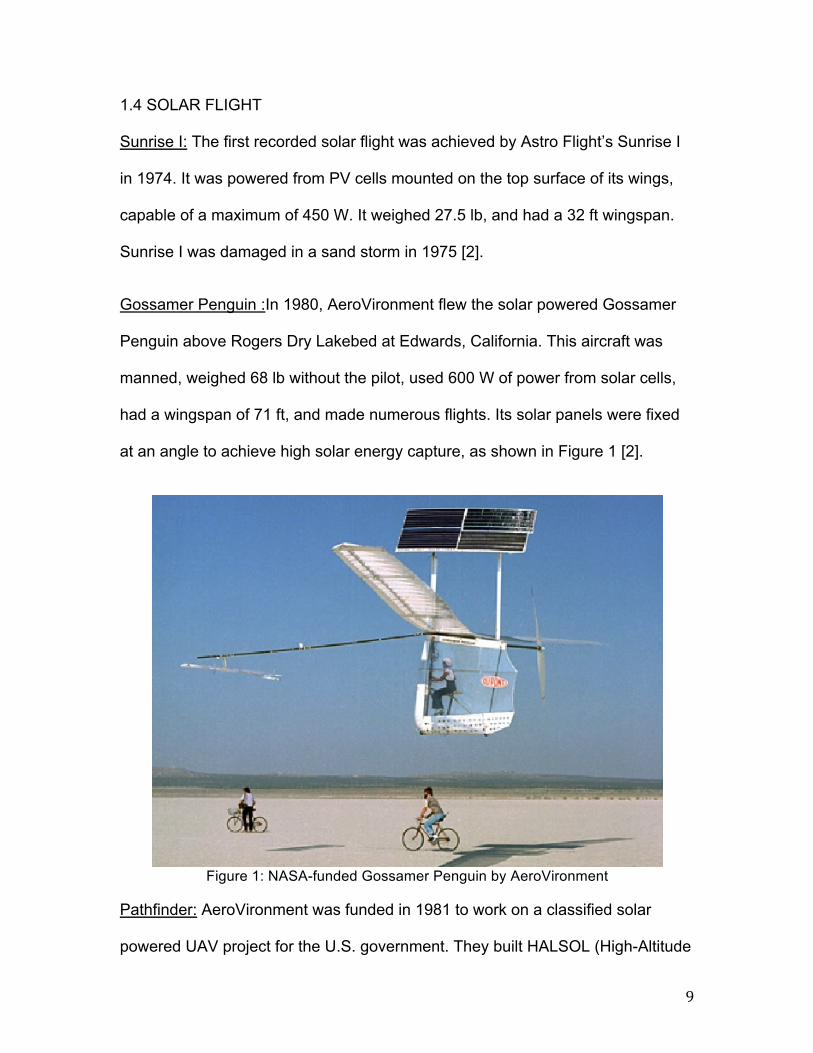
Helios: The latest of the larger NASA funded AeroVironment solar planes was
Helios (Figure 4). Helios set an impressive altitude record of 96,500 ft in the
summer of 2001. It had a wingspan of 247 ft, weighed over 2,000 lbs, and was
powered by a PV array capable of capturing 42 kW of solar power [4]. One hour
into a planned 20-hour test flight, Helios crashed into the Pacific Ocean and was
destroyed in June 2003 [5].
! "#!
Figure 4: NASA Helios
PicoSol: The smallest solar powered aircraft that is known to have successfully
flown is the PicoSol radio controlled airplane by Dr. Sieghard Dienlen. This small
aircraft weighed 1.24 N and had a wingspan of .99 m [4].
SoLong: AC Propulsion’s Solar Electric Powered SoLong UAV [5] flew for 48
continuous hours. SoLong was the first solar powered UAV of its size and class
to successfully fly through the night and fully recharge its batteries during the day
from the sun’s power while remaining airborne. This feat was only accomplished
in a desert with consistent thermals in the day, a time of year and location where
high solar flux across the surface of the solar cells can be achieved, and by a
team of skilled pilots taking turns in the “cockpit” from their ground station.
SoLong had a nominal solar power capability of 225 W, a wingspan of 4 meters,
a weight of 12.6 kg, and used a Maximum Power Point Tracker (MPPT)
developed by AC propulsion that weighed 100 grams.
! "$!
2.0 MISSION SPECIFICATION
2.1 MISSION PROFILE
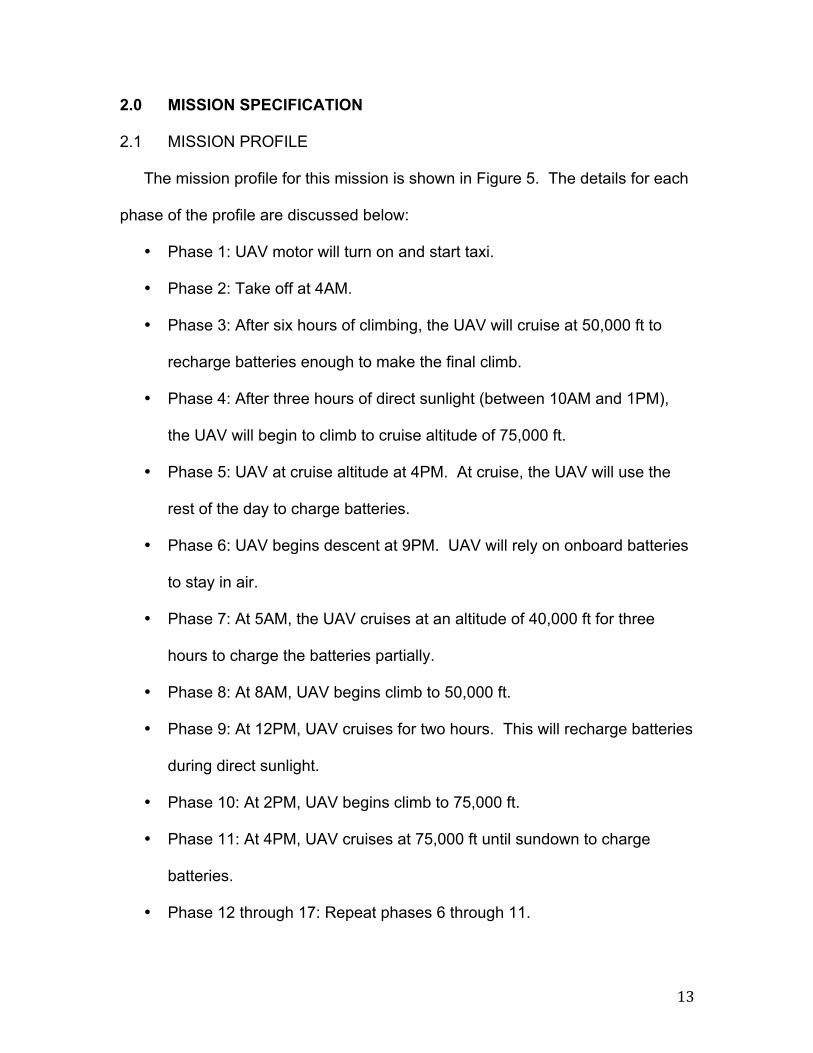
The mission profile for this mission is shown in Figure 5. The details for each
phase of the profile are discussed below:
• Phase 1: UAV motor will turn on and start taxi.
• Phase 2: Take off at 4AM.
• Phase 3: After six hours of climbing, the UAV will cruise at 50,000 ft to
recharge batteries enough to make the final climb.
• Phase 4: After three hours of direct sunlight (between 10AM and 1PM),
the UAV will begin to climb to cruise altitude of 75,000 ft.
• Phase 5: UAV at cruise altitude at 4PM. At cruise, the UAV will use the
rest of the day to charge batteries.
• Phase 6: UAV begins descent at 9PM. UAV will rely on onboard batteries
to stay in air.
• Phase 7: At 5AM, the UAV cruises at an altitude of 40,000 ft for three
hours to charge the batteries partially.
• Phase 8: At 8AM, UAV begins climb to 50,000 ft.
• Phase 9: At 12PM, UAV cruises for two hours. This will recharge batteries
during direct sunlight.
• Phase 10: At 2PM, UAV begins climb to 75,000 ft.
• Phase 11: At 4PM, UAV cruises at 75,000 ft until sundown to charge
batteries.
• Phase 12 through 17: Repeat phases 6 through 11.
! "%!
• Phases 18 through 23: Repeat phase 6 through 11.
• Phase 24: At 9PM, after four consecutive days in flight, UAV beings
descent back to ground only using minimum power.
• Phase 25: At 8AM, UAV lands on runway.
• Phase 26: UAV finishes taxi and powers down.
Figure 5: Mission Profile for HALE-SPUAV
2.2 MARKET ANALYSIS
The primary motivation behind building such an aircraft is the push for
greener aviation. Over the last several years many aerospace companies,
including Boeing, NASA, and LM, have invested in alternative fuel technology
and UAVs. The solar impulse (longer range) and Zephyr’s (longer endurance)
achievements have increased the popularity for solar-powered UAVs, thus
creating a large market for such technology. There has also been a need for
studying and providing alert for various natural disasters such as wildfire. UAV
such as HALE-SPUAV discussed in the report, would be an asset to them. It can
also be used in many military and surveillance application around the globe. The
advancement in technology may also achieve its space applications such as
Marsh surface monitoring.
! "&!
2.3 TECHNICAL AND ECONOMICAL FEASIBILITY
Although solar power UAVs are more expensive to build and research
because of the advanced technology used, they would be more fuel-efficient and
would require less maintenance then the fueled UAVs. Since the solar-powered
UAV will not require any jet fuel, it can save millions of dollars over a long period
of time and help save the environment.
Since the development of NASA’s Helios, only problem have remain prominent is
weight of the batteries require powering the UAV. Development of Lithium-Sulfur
batteries allowed us to reduce the total weight by 50-60 percent with highest
value of energy density. Building the aircraft will relatively simple since all other
products are available in the market such as solar cells, motors, and avionics.
2.4 CRITICAL MISSION REQUIREMENTS
The critical mission requirements that will drive the design of the aircraft
are as follows
• Total endurance will be no less then 96 hours
• Must be capable to achieve cruise altitude of 75000 ft
3.0 COMPARATIVE STUDY OF SIMILAR AIRPLANES
In this section the airplanes that will be studied are Sunrise, Solar challenger,
Pathfinder plus, Centurion, Helios, Solae impulse, Zephyr, and sky sailor.
3.1 MISSION CAPABILITIES AND CONFIGURATION SELECTION
The mission capabilities and configuration selection for the studied aircrafts
are shown in appendix A. As you can see, most of the capabilities of these
! "'!
aircrafts are minimal and used primarily to study the potential of solar powered
long endurance and high altitude flight. Most of the aircraft have closed to flying
wing configuration with multiple propeller driven engines.
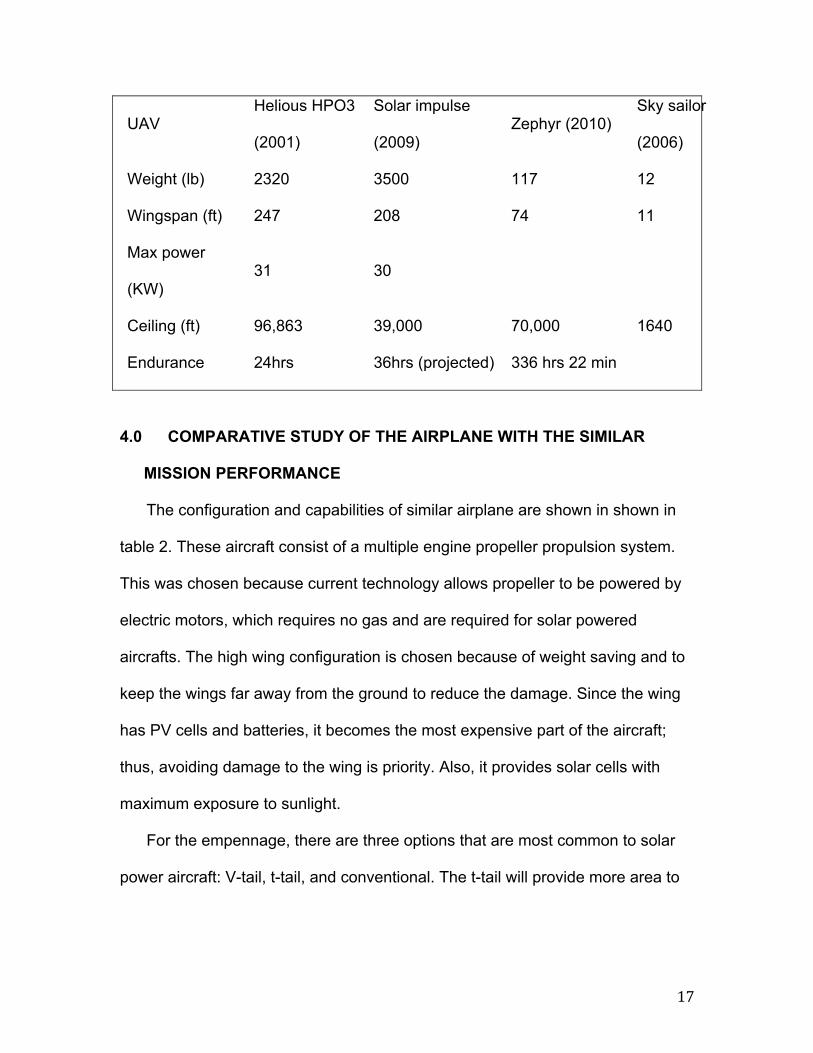
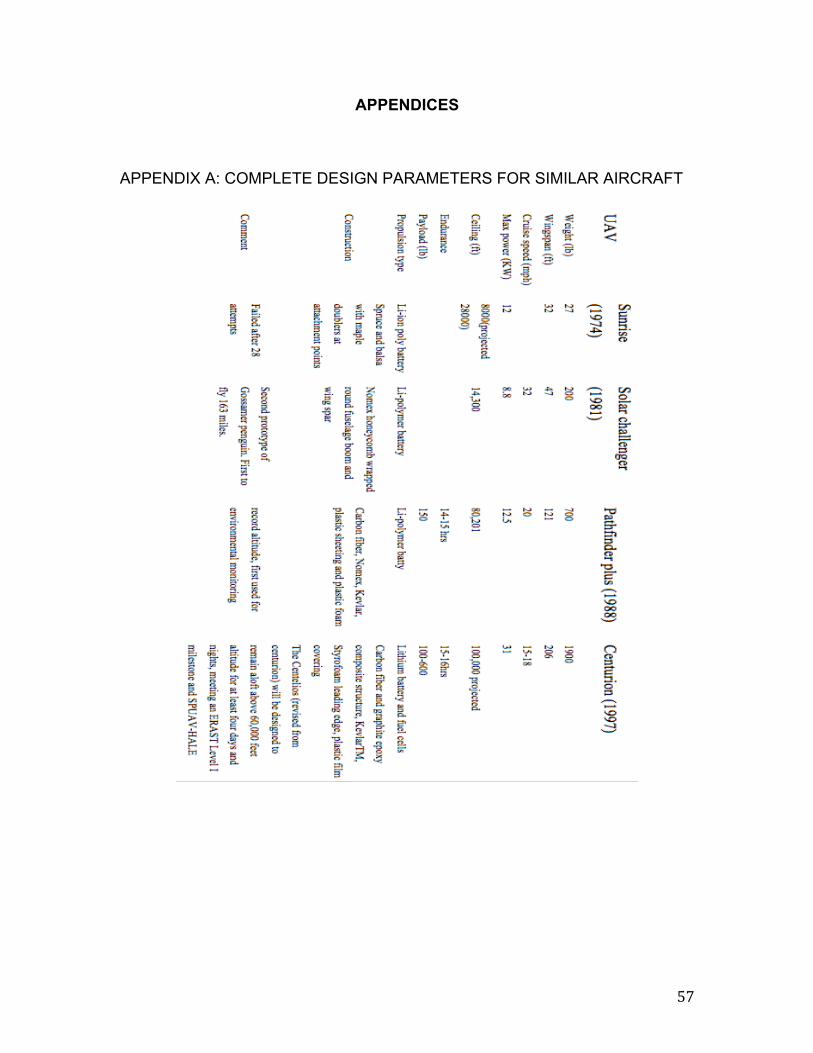
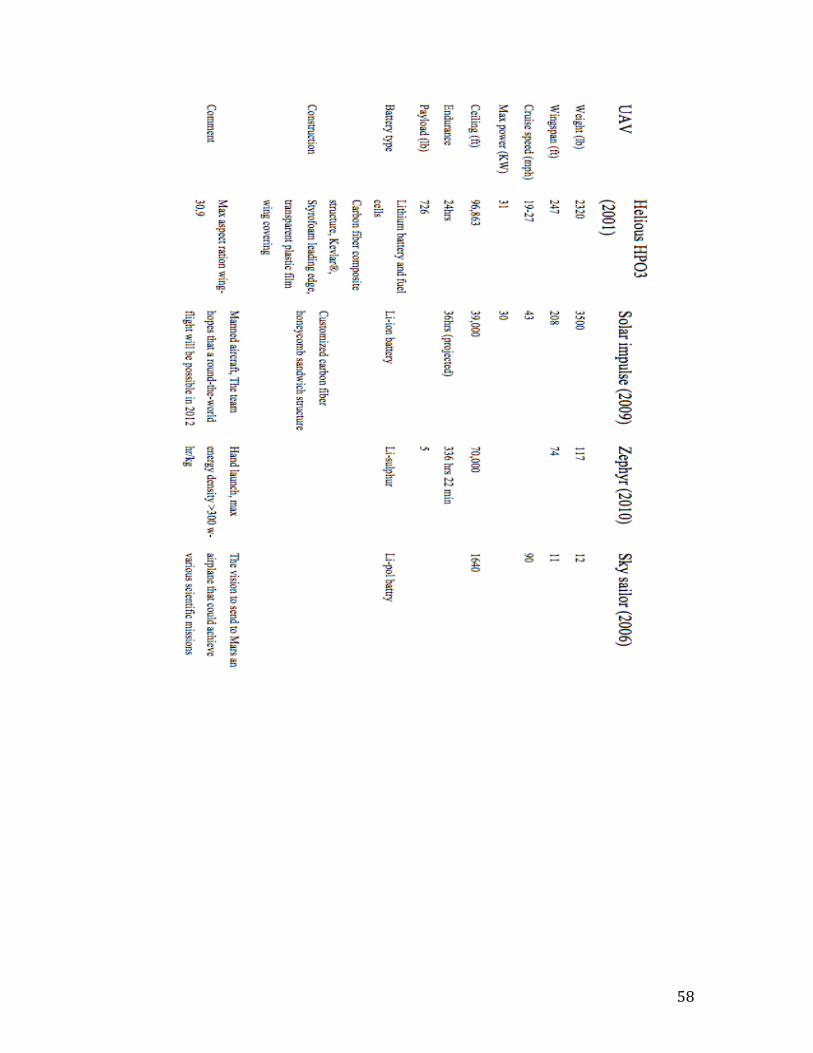
3.2 COMPARISON OF IMPORTANT DESIGN PARAMETERS
The important design parameters are shown in table 2. The complete list of
design parameters for the aircrafts that were studied can be found in appendix A.
If the solar impulse excluded, the total weight of each aircraft does not exceed
2400lb without implementation Li-Su batteries. So weight of HALE-SPUAV
should be remarkably low after using these batteries. No aircraft exceed
wingspan of 240ft and most of them can go up to 75000ft during cruise.
Therefore, to build a successful SPUAV a low weight design with high aspect
ratio and relatively high wingspan is necessary.
Table 2: Important design parameters for similar aircrafts
UAV Sunrise (1974) Solar challenger
(1981)
Pathfinder plus
(1988)
Weight (lb) 27 200 700
Wingspan (ft) 32 47 121
Max power (KW) 12 8.8 12.5
Ceiling (ft) 8000(projected
28000) 14,300 80,201
Endurance 14-15 hrs
! "(!
UAV Helious HPO3
(2001)
Solar impulse
(2009) Zephyr (2010)
Sky sailor
(2006)
Weight (lb) 2320 3500 117 12
Wingspan (ft) 247 208 74 11
Max power
(KW) 31 30
Ceiling (ft) 96,863 39,000 70,000 1640
Endurance 24hrs 36hrs (projected) 336 hrs 22 min !
4.0 COMPARATIVE STUDY OF THE AIRPLANE WITH THE SIMILAR
MISSION PERFORMANCE
The configuration and capabilities of similar airplane are shown in shown in
table 2. These aircraft consist of a multiple engine propeller propulsion system.
This was chosen because current technology allows propeller to be powered by
electric motors, which requires no gas and are required for solar powered
aircrafts. The high wing configuration is chosen because of weight saving and to
keep the wings far away from the ground to reduce the damage. Since the wing
has PV cells and batteries, it becomes the most expensive part of the aircraft;
thus, avoiding damage to the wing is priority. Also, it provides solar cells with
maximum exposure to sunlight.
For the empennage, there are three options that are most common to solar
power aircraft: V-tail, t-tail, and conventional. The t-tail will provide more area to
! ")!
put the solar cells then any other and its less heavy then conventional tail
configuration.
5.0 SELECTION OF PROPULSION SYSTEM
The propulsion system type will be electrical with photovoltaic cells powering
the motors and payload.
5.1 SELECTION OF NUMBER OF ENGINES
Looking at the power requirements there will be multiple engines on the tip of
the wing. The distance between each engine will depend on wing loading and
dihedral of the wing.
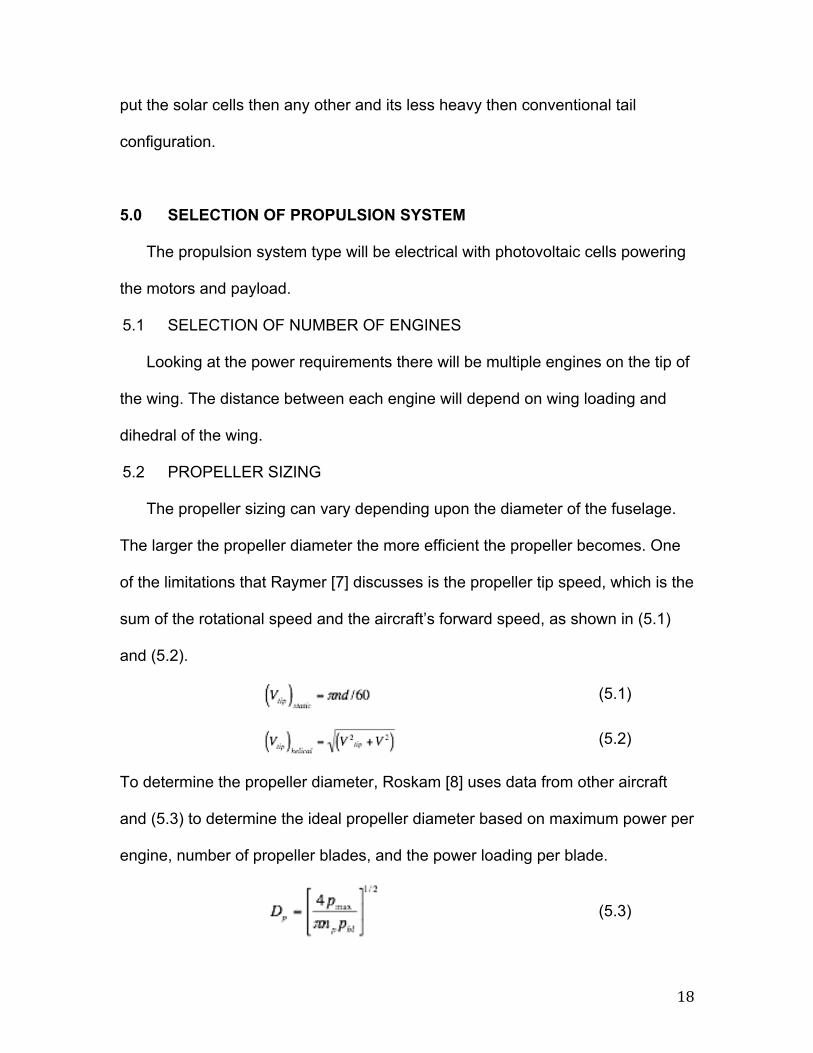
5.2 PROPELLER SIZING
The propeller sizing can vary depending upon the diameter of the fuselage.
The larger the propeller diameter the more efficient the propeller becomes. One
of the limitations that Raymer [7] discusses is the propeller tip speed, which is the
sum of the rotational speed and the aircraft’s forward speed, as shown in (5.1)
and (5.2).
(5.1)
(5.2)
To determine the propeller diameter, Roskam [8] uses data from other aircraft
and (5.3) to determine the ideal propeller diameter based on maximum power per
engine, number of propeller blades, and the power loading per blade.
(5.3)

! "*!
A propeller, which is readily available at the time of the manufacturing, would
be ideal. For the initial selection, propeller with 70 in diameter with advance
composite material will be selected. Design would take high altitude laminar flow
into consideration as its ambient condition.
6.0 CONFIGURATION SELECTION
6.1 OVERALL CONFIGURATION
Based on Roskam, conventional configuration is used for the HALE-SUPAV.
The UAV will not have higher range and thus will preliminary fly on land and if
necessary on water. Adding another alternative fuel system would give more
rang but will also increase complexity and weight, which is not recommended.
6.2 WING CONFIGURATION
The wing selection is a vital part for a HALE-SPUAV because not only should
the wing have good aerodynamic characteristics, but it also must be suitable for
solar cells to be added on to the top of the surface of the wing. For this UAV, a
high cantilever wing will be selected primarily for simplicity and to provide enough
clearance during landing. A high wing also provides lateral stability, which is
needed since there will be minimal stabilizing devices on this type of aircraft. The
geometry of the wing should have negligible sweep because the aircraft will be
operating at low speeds. Sweep will also increase weight and reduce available
solar cell area, both of which will hinder the aircraft’s performance. An initial
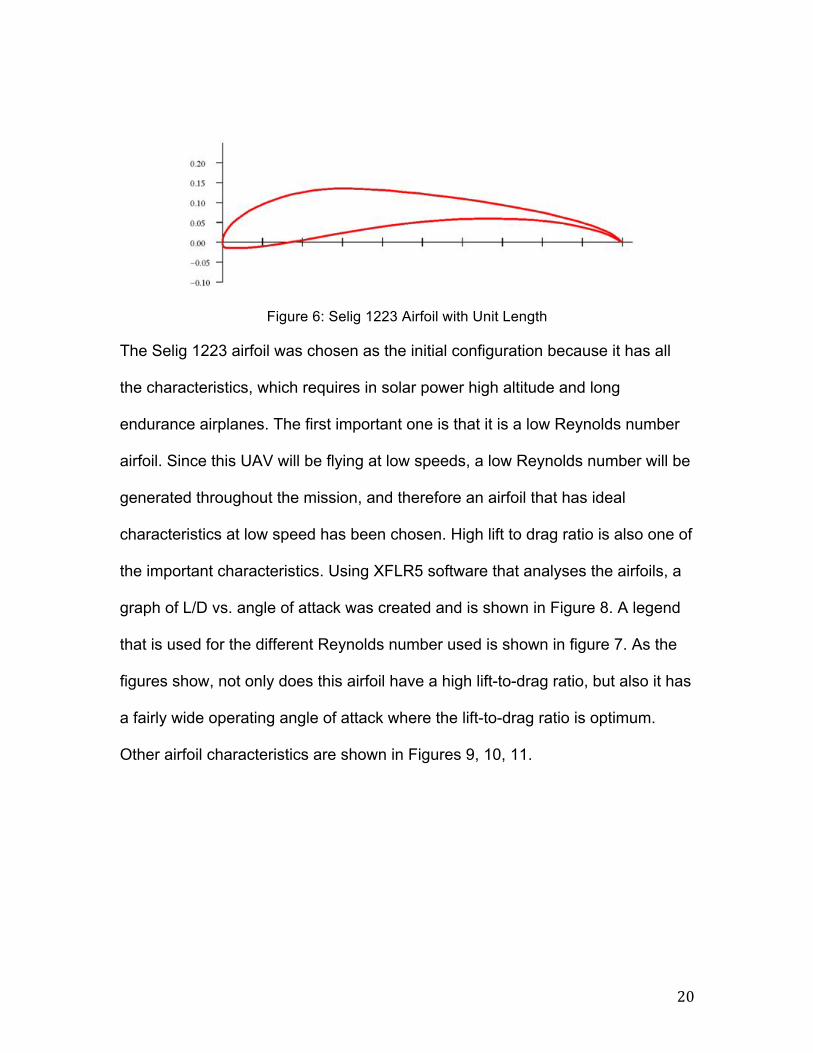
airfoil selection will be the Selig 1223, as shown in Figure 6. This airfoil has
12.14% maximum thickness-to-chord ratio at roughly 20% from the leading edge.
! #+!
Figure 6: Selig 1223 Airfoil with Unit Length
The Selig 1223 airfoil was chosen as the initial configuration because it has all
the characteristics, which requires in solar power high altitude and long
endurance airplanes. The first important one is that it is a low Reynolds number
airfoil. Since this UAV will be flying at low speeds, a low Reynolds number will be
generated throughout the mission, and therefore an airfoil that has ideal
characteristics at low speed has been chosen. High lift to drag ratio is also one of
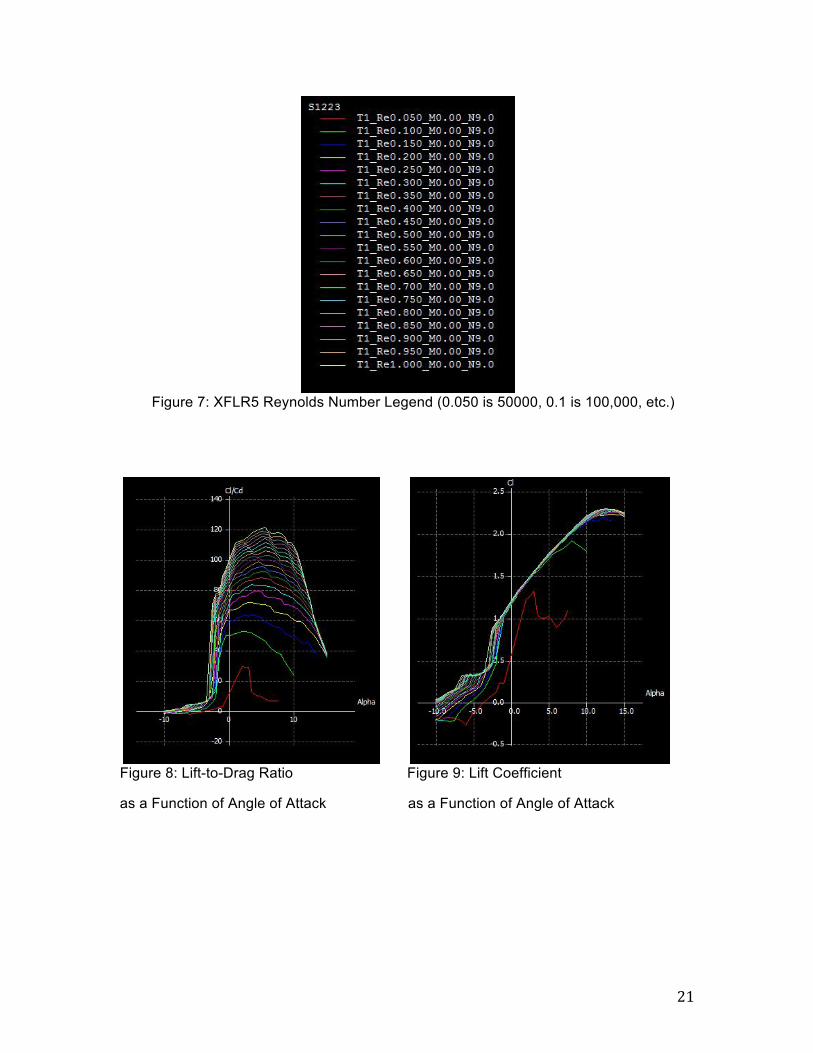
the important characteristics. Using XFLR5 software that analyses the airfoils, a
graph of L/D vs. angle of attack was created and is shown in Figure 8. A legend
that is used for the different Reynolds number used is shown in figure 7. As the
figures show, not only does this airfoil have a high lift-to-drag ratio, but also it has
a fairly wide operating angle of attack where the lift-to-drag ratio is optimum.
Other airfoil characteristics are shown in Figures 9, 10, 11.
! #"!
Figure 7: XFLR5 Reynolds Number Legend (0.050 is 50000, 0.1 is 100,000, etc.)
Figure 8: Lift-to-Drag Ratio Figure 9: Lift Coefficient
as a Function of Angle of Attack as a Function of Angle of Attack
! ##!
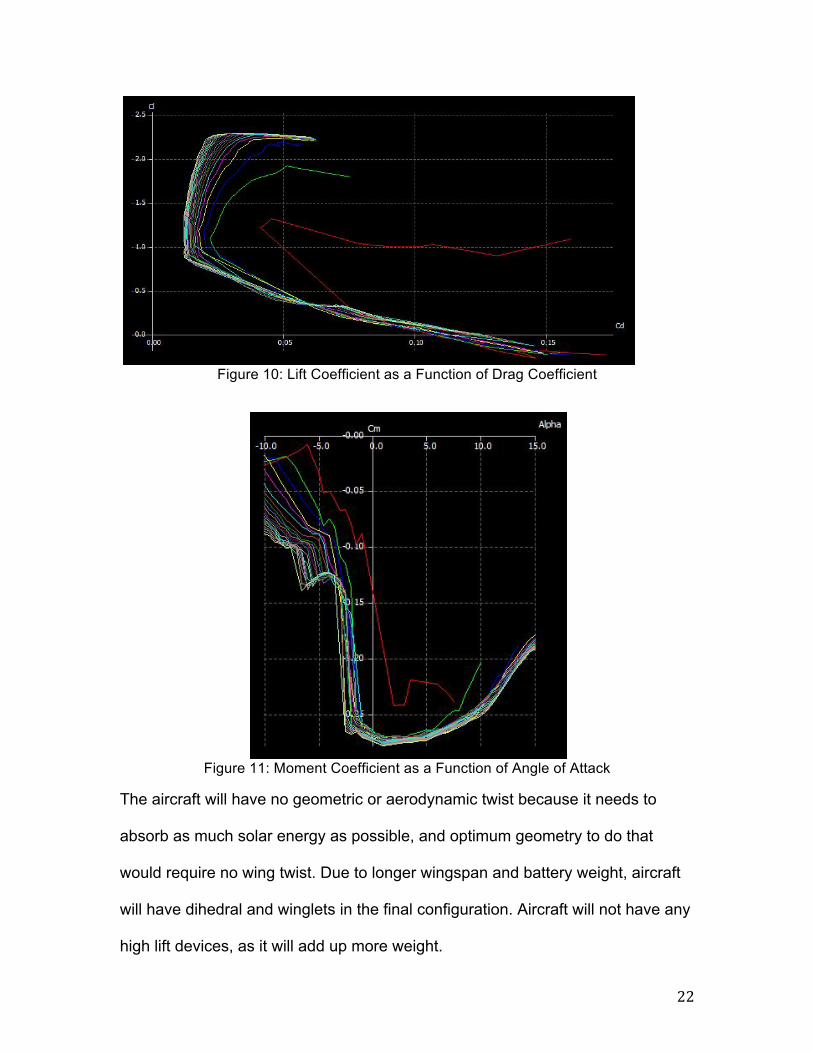
Figure 10: Lift Coefficient as a Function of Drag Coefficient
Figure 11: Moment Coefficient as a Function of Angle of Attack
The aircraft will have no geometric or aerodynamic twist because it needs to
absorb as much solar energy as possible, and optimum geometry to do that
would require no wing twist. Due to longer wingspan and battery weight, aircraft
will have dihedral and winglets in the final configuration. Aircraft will not have any
high lift devices, as it will add up more weight.
! #$!
6.4 EMPENNAGE CONFIGURATION
The HALE-SPUAV will incorporate a t-tail empennage configuration because
it is easy to build and provides more area for solar cells. V-tail might be lighter in
weight but getting maximum solar power is essential for the mission. Thus t-tail
would be the ideal choice.
6.3 LANDING GEAR DISPOSITION
This aircraft will have two landings gear installed. Main landing gear would be
on fuselage and smaller one will be in tail section for support. The skid will also
be considered upon the length of the wing for supporting the wing tips.
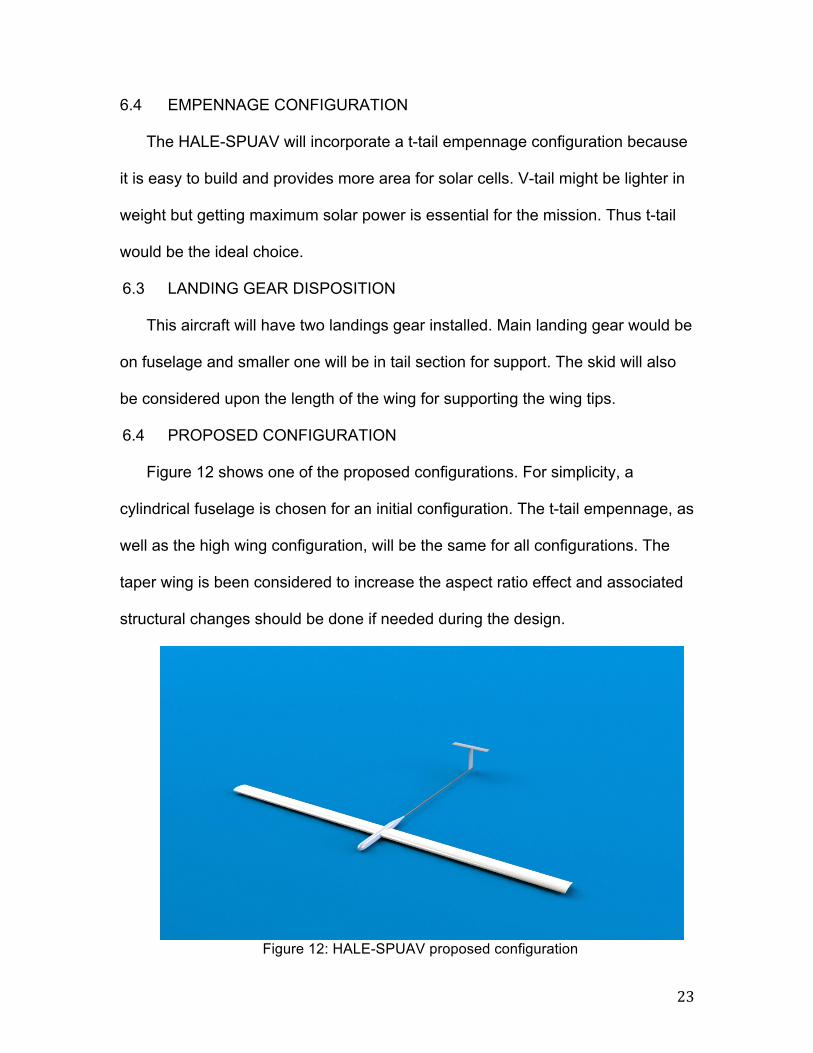
6.4 PROPOSED CONFIGURATION
Figure 12 shows one of the proposed configurations. For simplicity, a
cylindrical fuselage is chosen for an initial configuration. The t-tail empennage, as
well as the high wing configuration, will be the same for all configurations. The
taper wing is been considered to increase the aspect ratio effect and associated
structural changes should be done if needed during the design.
Figure 12: HALE-SPUAV proposed configuration
! #%!
7.0 MISSION WEIGHT ESTIMATES
7.1 COMMENTS
Before the calculation of the weights is determined, a few factors should be
considered: The weight of solar powered aircrafts differ from the weight of the
fuel power aircrafts thus the method to determine it. In most common aircraft, fuel
weight is an important variable when calculating the takeoff weight versus the
empty weight. Since this UAV runs on PV cells, there is no empty weight or fuel
weight present. There for weight analysis cannot be done by using Raymer or
Roskam’s conventional methods. However, Noth [9] goes into detail about weight
prediction models and how it is possible to obtain an appropriate estimate of the
component weight simply by inserting the relative parameters that pertain to the
aircraft. That’s why North’s method will be used for SPUAV.
7.2 SOLAR SYSTEM WEIGHTS
To begin with, power require for steady level flight is been determined. Data
from other HALE SPUAVs are used and found out that at least 20 kW of power
needed for this aircraft. Knowing that this aircraft will need to run on just battery
power throughout the night, then approximated that I would need 240 kW-hr to
have the aircraft fly continuously using just battery power. This value is an
overestimation because throughout the night, we could potentially turn off the
power to the engines and have the aircraft use only the wing’s aerodynamic
properties to float. I understand that this will result in a loss of altitude, but this is
fairly consistent with other HALE SPUAVs.
! #&!
Knowing that 240 kW-hr is needed, Li-Su batteries are chosen with the
assumption that it will be available for commercial use by the end of the design.
For an initial analysis shown in section 2.2 we chose the lithium-sulfur
rechargeable batteries which would give us 400 W-hr/kg instead of normal Li-Po
batteries’ 200 W-hr/kg. Using the nominal capacity and voltage values, number of
battery cell required can be calculated which are 968. Multiplying that value by
how much each battery weighs and I ended up with 260 lbs, which seems much
efficient in comparison to other HALE SPUAVs.
Once batteries have been chosen, number of solar cell and area to
accomplish those solar cells will be calculated. The solar cells will be used are
the Sunpower A-300 primarily because of the high efficiency. It is been
calculated that approximately 610 ft2 of area needed to produce 10 kW. This
number comes from Honsberg & Bowden [10] model for total irradiance of 1.05
kW/m2 for a 37 degree North latitude around June 18-22. The 37°north latitude
corresponds with San Jose, CA. Also, according to Greentech ZONE [11], “the
A-300 silicon solar cell delivers 3-kW in less than 17 square meters.” Using this
information, calculate that using a combination of these solar cells; we can
achieve about 16.4 W/ft2. To get at least 10 kW, required total area would be as
follows:
Using the total solar cell area, mass of the solar cell can be calculated. We
assumed that each solar cell weighs 64 mg/cm2 since literature online says that
the Sunpower A-300 solar cell weighs about twice as much as the RWE-32 solar
! #'!
cell, which weighs 32 mg/cm2. Using this data, total solar cell mass comes to
175 lbs.
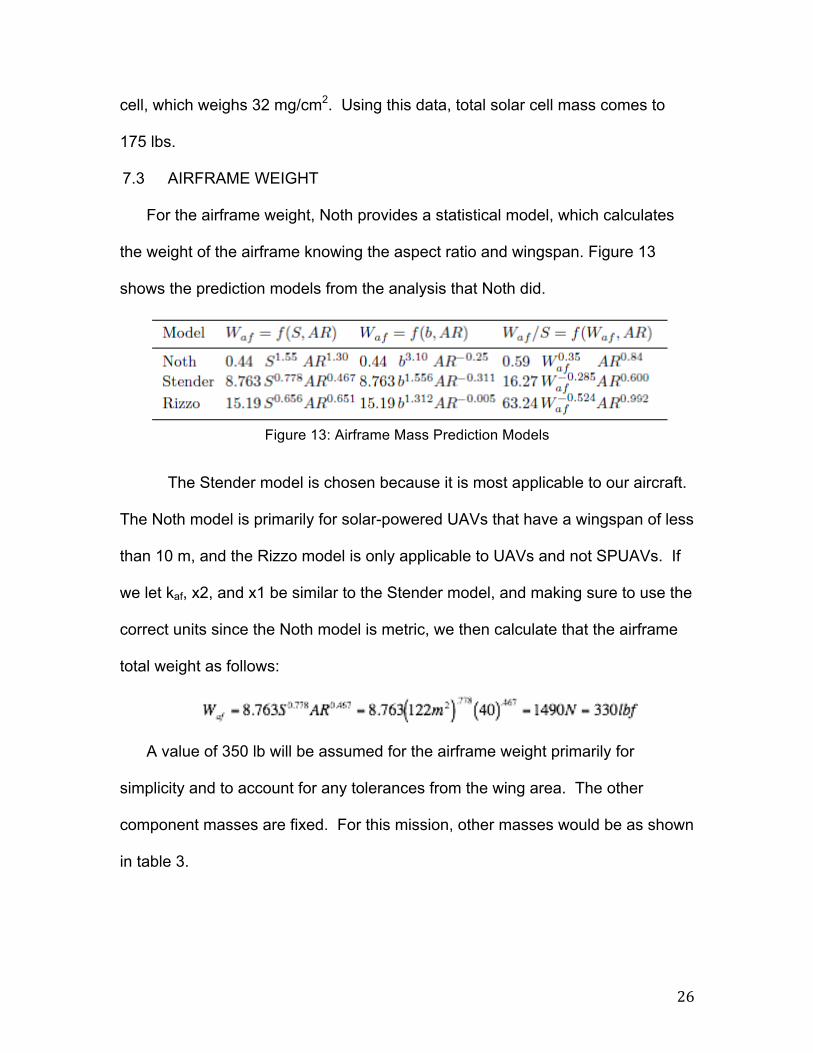
7.3 AIRFRAME WEIGHT
For the airframe weight, Noth provides a statistical model, which calculates
the weight of the airframe knowing the aspect ratio and wingspan. Figure 13
shows the prediction models from the analysis that Noth did.
Figure 13: Airframe Mass Prediction Models
The Stender model is chosen because it is most applicable to our aircraft.
The Noth model is primarily for solar-powered UAVs that have a wingspan of less
than 10 m, and the Rizzo model is only applicable to UAVs and not SPUAVs. If
we let kaf, x2, and x1 be similar to the Stender model, and making sure to use the
correct units since the Noth model is metric, we then calculate that the airframe
total weight as follows:
A value of 350 lb will be assumed for the airframe weight primarily for
simplicity and to account for any tolerances from the wing area. The other
component masses are fixed. For this mission, other masses would be as shown
in table 3.
! #(!
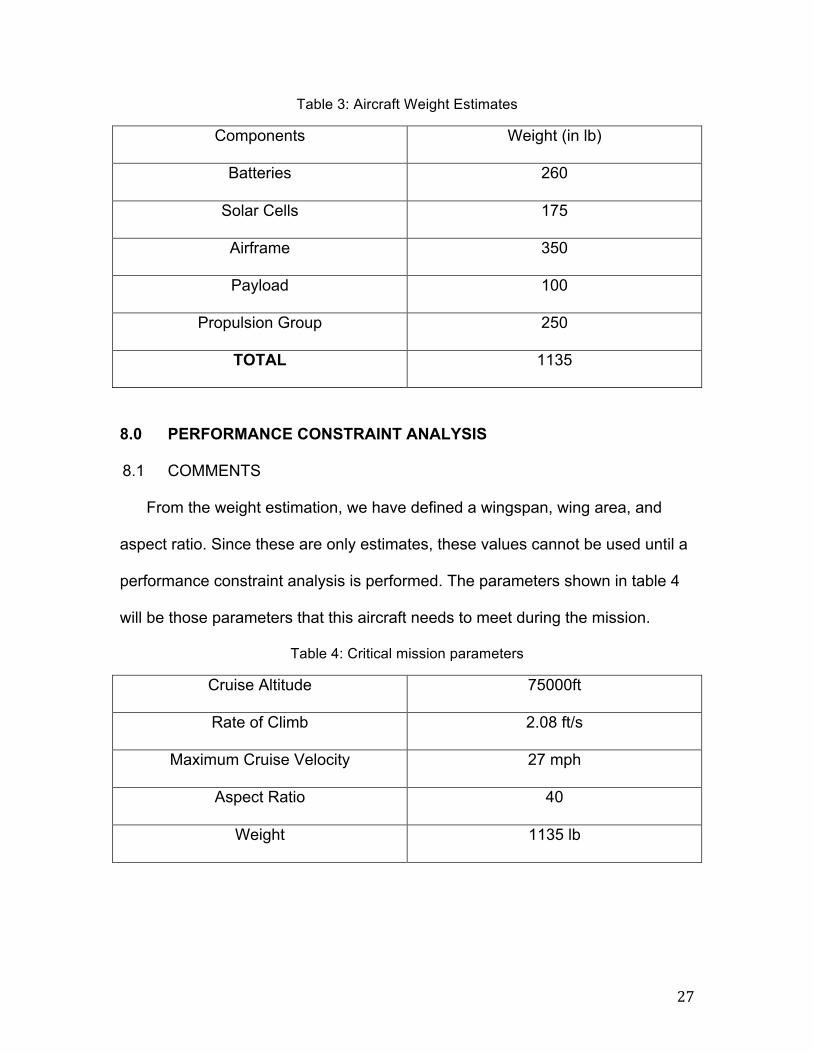
Table 3: Aircraft Weight Estimates
Components Weight (in lb)
Batteries 260
Solar Cells 175
Airframe 350
Payload 100
Propulsion Group 250
TOTAL 1135
8.0 PERFORMANCE CONSTRAINT ANALYSIS
8.1 COMMENTS
From the weight estimation, we have defined a wingspan, wing area, and
aspect ratio. Since these are only estimates, these values cannot be used until a
performance constraint analysis is performed. The parameters shown in table 4
will be those parameters that this aircraft needs to meet during the mission.
Table 4: Critical mission parameters
Cruise Altitude 75000ft
Rate of Climb 2.08 ft/s
Maximum Cruise Velocity 27 mph
Aspect Ratio 40
Weight 1135 lb
! #)!
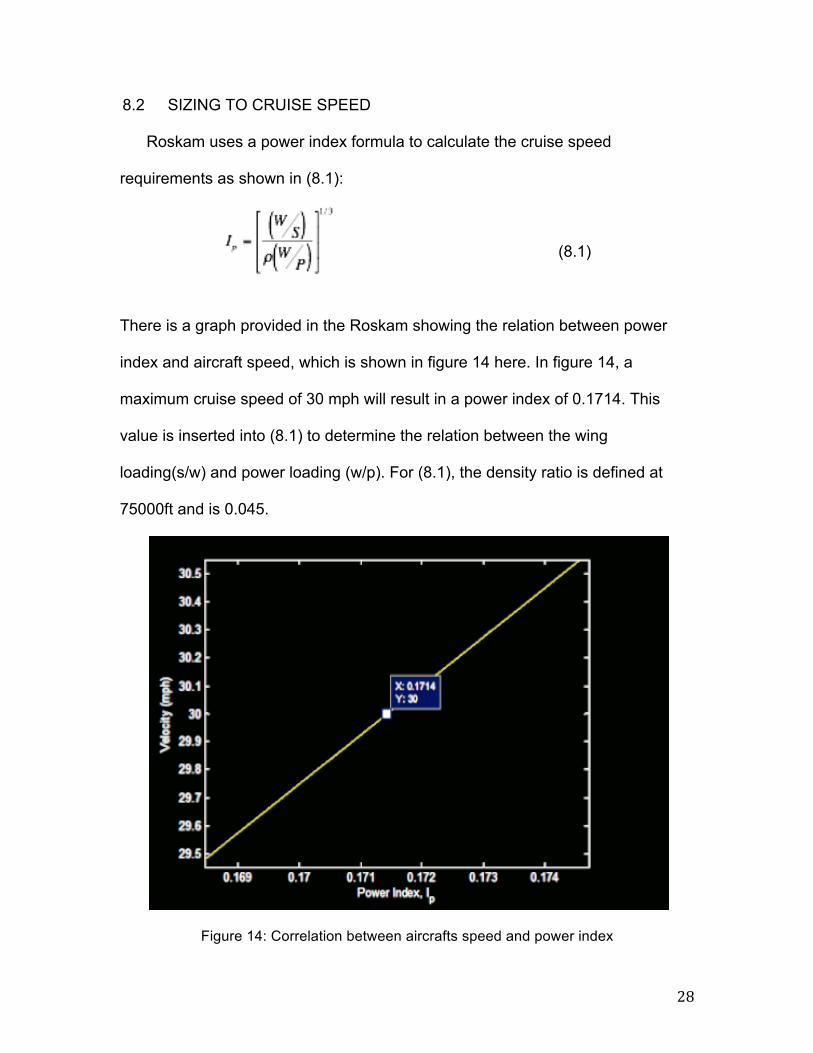
8.2 SIZING TO CRUISE SPEED
Roskam uses a power index formula to calculate the cruise speed
requirements as shown in (8.1):
(8.1)
There is a graph provided in the Roskam showing the relation between power
index and aircraft speed, which is shown in figure 14 here. In figure 14, a
maximum cruise speed of 30 mph will result in a power index of 0.1714. This
value is inserted into (8.1) to determine the relation between the wing
loading(s/w) and power loading (w/p). For (8.1), the density ratio is defined at
75000ft and is 0.045.
Figure 14: Correlation between aircrafts speed and power index
! #*!
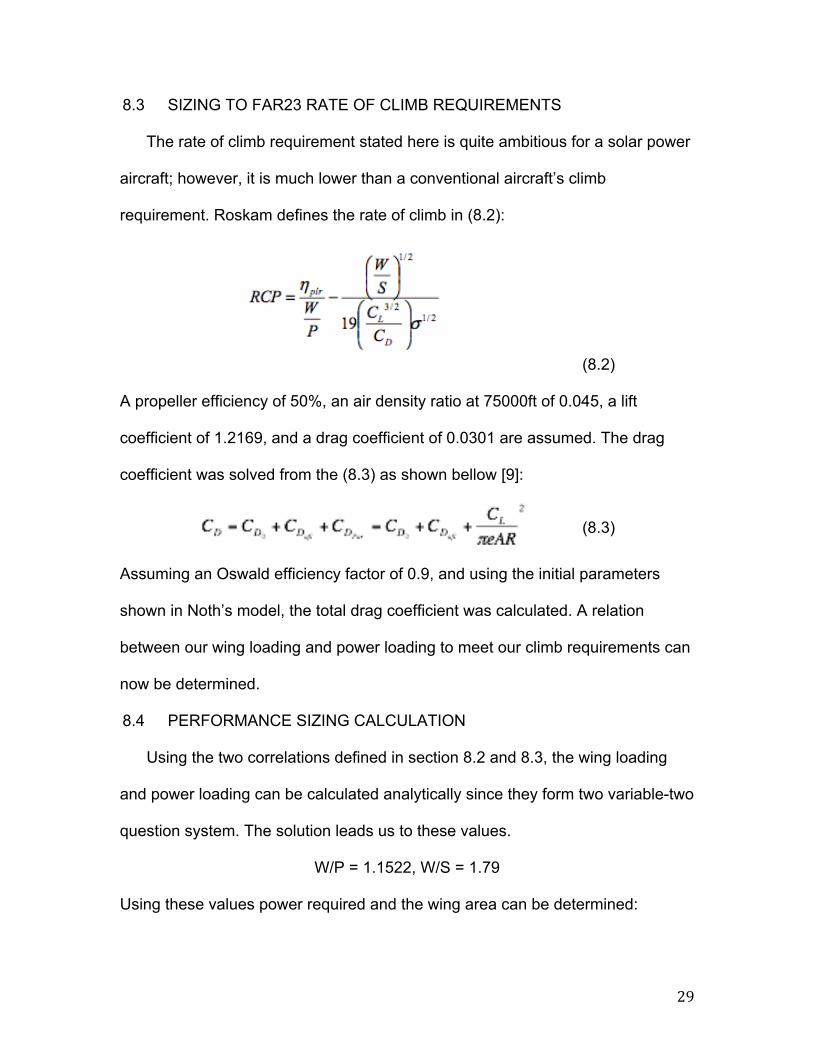
8.3 SIZING TO FAR23 RATE OF CLIMB REQUIREMENTS
The rate of climb requirement stated here is quite ambitious for a solar power
aircraft; however, it is much lower than a conventional aircraft’s climb
requirement. Roskam defines the rate of climb in (8.2):
(8.2)
A propeller efficiency of 50%, an air density ratio at 75000ft of 0.045, a lift
coefficient of 1.2169, and a drag coefficient of 0.0301 are assumed. The drag
coefficient was solved from the (8.3) as shown bellow [9]:
(8.3)
Assuming an Oswald efficiency factor of 0.9, and using the initial parameters
shown in Noth’s model, the total drag coefficient was calculated. A relation
between our wing loading and power loading to meet our climb requirements can
now be determined.
8.4 PERFORMANCE SIZING CALCULATION
Using the two correlations defined in section 8.2 and 8.3, the wing loading
and power loading can be calculated analytically since they form two variable-two
question system. The solution leads us to these values.
W/P = 1.1522, W/S = 1.79
Using these values power required and the wing area can be determined:
! $+!
Using the given aspect ratio of 40, the new wingspan can be solved and which
will be 156ft. Final wingspan may get little longer depending upon the tapper
ratio.
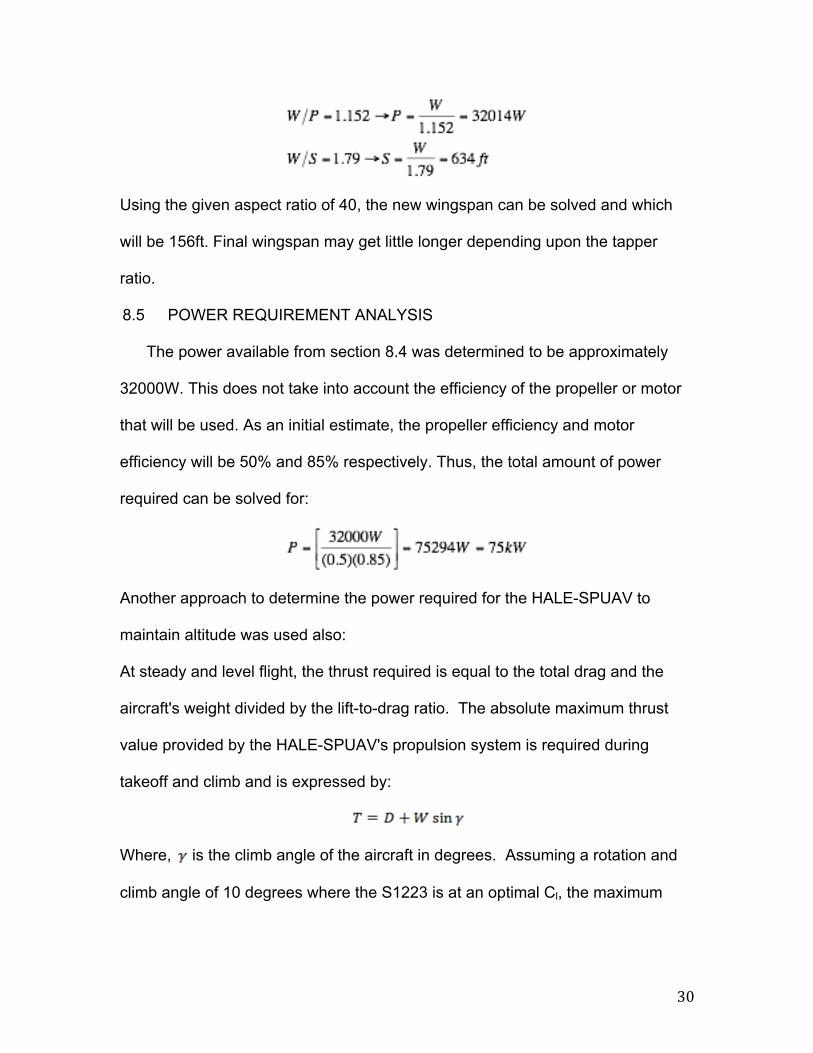
8.5 POWER REQUIREMENT ANALYSIS
The power available from section 8.4 was determined to be approximately
32000W. This does not take into account the efficiency of the propeller or motor
that will be used. As an initial estimate, the propeller efficiency and motor
efficiency will be 50% and 85% respectively. Thus, the total amount of power
required can be solved for:
Another approach to determine the power required for the HALE-SPUAV to
maintain altitude was used also:
At steady and level flight, the thrust required is equal to the total drag and the
aircraft's weight divided by the lift-to-drag ratio. The absolute maximum thrust
value provided by the HALE-SPUAV's propulsion system is required during
takeoff and climb and is expressed by:
Where, is the climb angle of the aircraft in degrees. Assuming a rotation and
climb angle of 10 degrees where the S1223 is at an optimal Cl, the maximum
! $"!
total thrust required is D + 197 pounds. As lift to drag ratio is assumed as 40,
initial thrust should be:
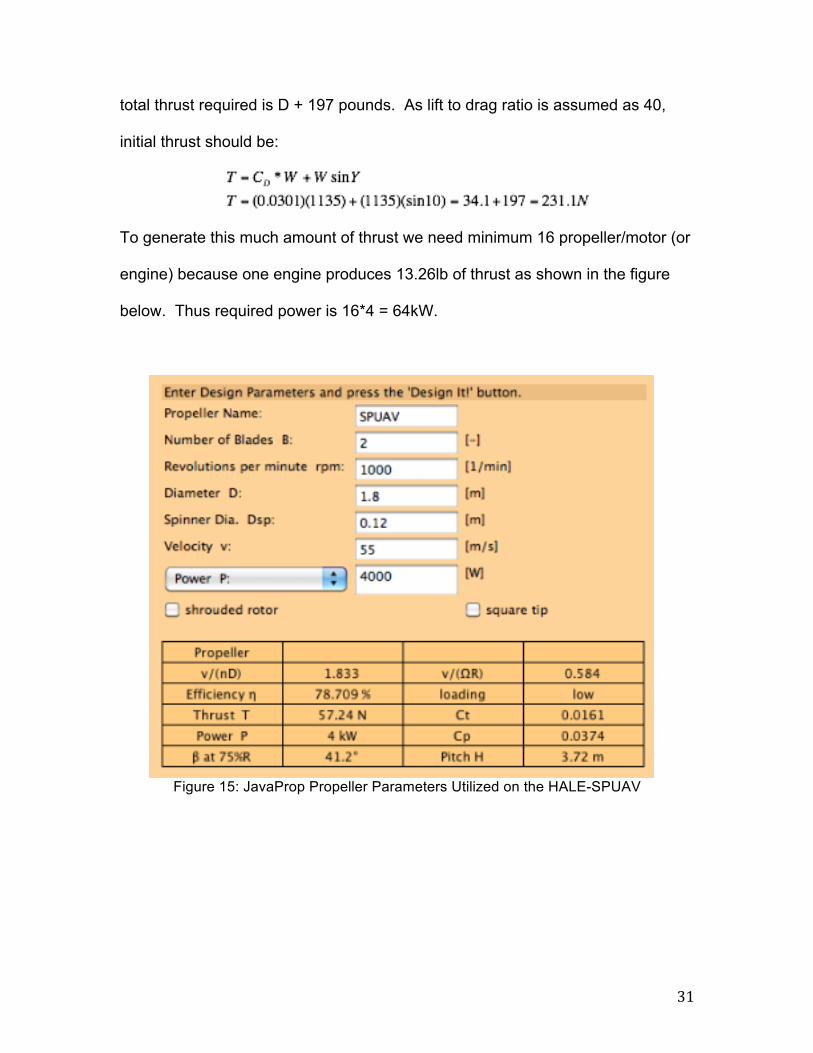
To generate this much amount of thrust we need minimum 16 propeller/motor (or
engine) because one engine produces 13.26lb of thrust as shown in the figure
below. Thus required power is 16*4 = 64kW.
Figure 15: JavaProp Propeller Parameters Utilized on the HALE-SPUAV

! $#!
9.0 FUSELAGE DESIGN
The fuselage geometry is relatively simple since we will not have a cockpit
and the only sizing to consider will be for the payload. The payload will go at the
front of the fuselage, which is 3 ft in diameter and 20 ft long, enough for any kind
of payload that weighs no more than 100 lbs. Past the 20 ft area, the fuselage
diameter is significantly reduced, just enough area for wiring and to hold the
empennage in place. The front landing gear will be placed right where the
leading edge of the aircraft is on the bottom of the fuselage. The rear landing
gear is placed at the end of the fuselage, roughly 91 ft relative to the fuselage tip.
Inside the smaller diameter section of the fuselage, there will be wiring
coming from the empennage. Also, the wiring that is needed for the wings will be
connected to the back end of the larger diameter section of the fuselage (near
the center of the aircraft). Within the space between the larger diameter and the
smaller diameter, there will be the autopilot system, which is needed for this kind
of application, and any extra flight control computers if necessary. See the
Appendix B for CAD drawings of the fuselage.
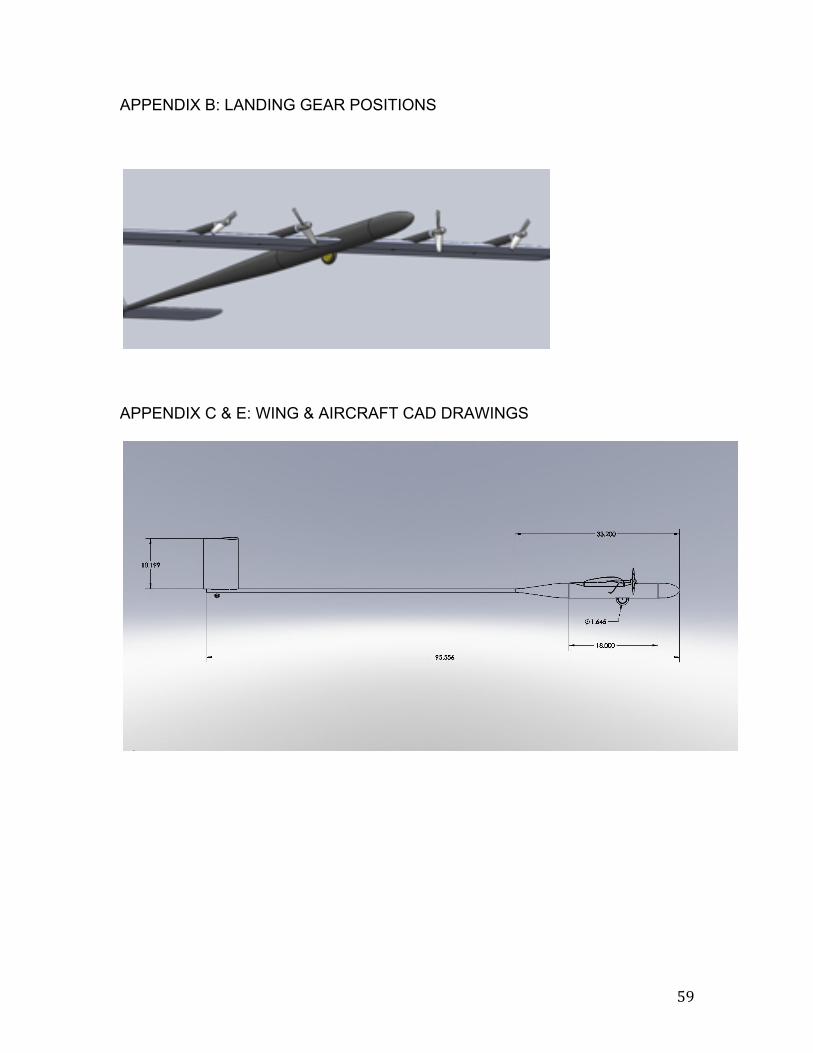
10.0 LANDING GEAR DESIGN
The aircraft will employ a bicycle-type landing gear for minimal complexity, drag,
and weight contribution as shown in Figure 15. This configuration is similar to
that of the U-2 high altitude reconnaissance aircraft, B-52 bomber, and most
sailplanes. Two lightweight wheels will be placed in line with each other along
the longitudinal axis of the fuselage; one slightly forward of the center of lift and
! $$!
the other near the aircraft’s tail. To bypass complications with pneumatic tires
exploding from the greatly decreased pressure at cruise altitudes, the tires will be
filled with lightweight foam instead of compressed air. Appendix B shows UAV
with landing gears.
11.0 WING, HIGH LIFT SYSTEM, AND LATERAL CONTROLS DESIGN
11.1 WING PLANFORM DESIGN
From the power analysis, the gross wing area was determined to be 610
square feet and the aspect ratio is 40. Throughout this section, the taper ratio,
dihedral angle, sweep angle, and twist angle for our wing will be defined and
calculated. Also, any high-lift devices or control surfaces that will be used on the
wing will be discussed.
11.2 TAPER RATIO
Taper ratio is defined as the ratio of the wing tip chord to the wing root
chord. According to Raymer, for the rectangular wings, the ideal taper ratio is
0.45 so that it “produces a lift distribution very close to the elliptical ideal” (p. 56).
Therefore, taking the taper ratio into account to get lift distribution closer to
elliptical. Keeping the wing area constant for solar panels and adjusted our root
chord length and tip chord length. Table 5 shows the results for our straight fixed
rectangular wing with no dihedral or twist.
Table 5: Wing Geometry Values
Root Chord Length 8.12 ft
Tip Chord Length 3.654 ft

! $%!
Wingspan 224.06 ft
Wing Area 610 ft2
Aspect Ratio 38.06
11.3 DIHEDRAL ANGLE
This angle on the wing is to preliminary used for increasing the dihedral
effect of the aircraft. The dihedral effect is rolling moment that results from the
aircraft having a non-zero sideslip angle. Thus, the dihedral is primarily used to
stabilize the aircraft. For this aircraft, small amount of dihedral may be require at
the end of the stability analysis.
11.4 INCIDENCE ANGLE
The incidence angle of the aircraft is the angle between the chord line of
the wing and the longitudinal axis of the fuselage. This value is fixed because it
depends on how the wing is mounted onto the fuselage. Looking at similar
aircraft, zero or very little angle of incidence is used. Therefore for this aircraft,
there will be no incident angle.
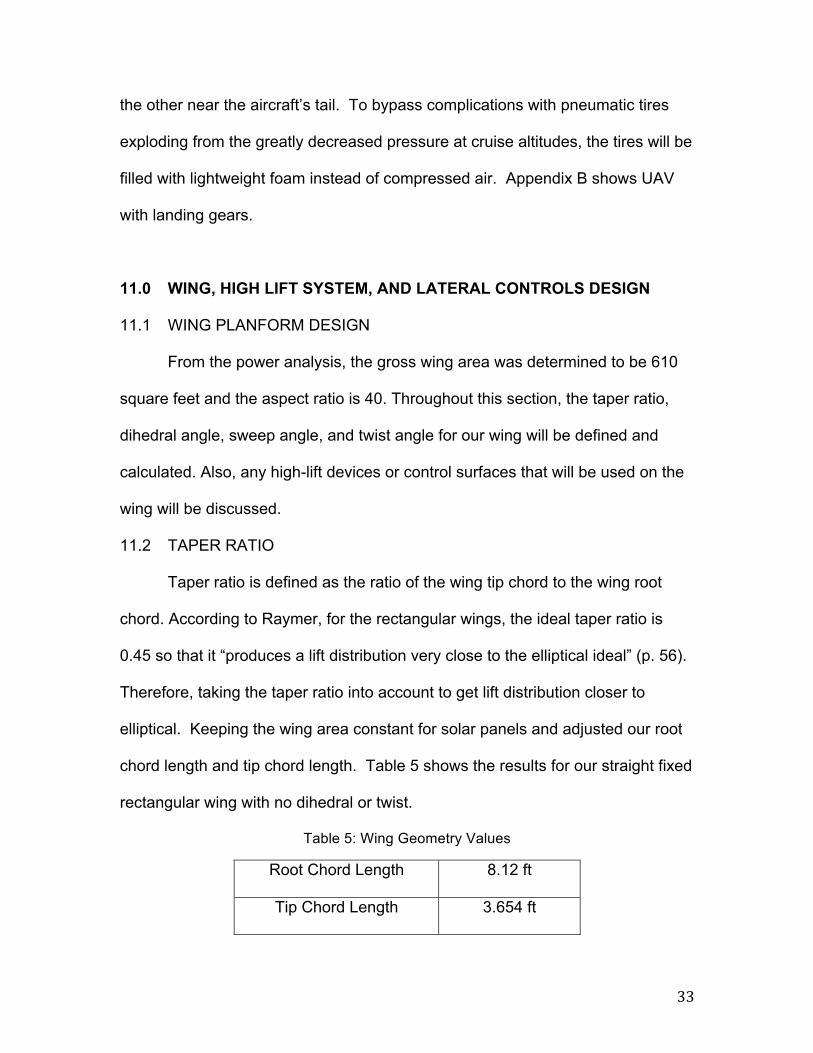
11.5 CONTROL SURFACES
The control surfaces that will be installed on the wing will be ailerons,
which are devices on the trailing edge that help maneuver and control the
aircraft. Since it is required to have a large lift coefficient, Raymer recommended
30% of the wingspan for the aileron length. The wing will also have trim tabs
located on the ailerons so that servos would be able to move the ailerons easier.
The aircraft will be using servos to control the aircraft’s control surfaces that will
! $&!
be able to handle this large aileron length, and will be connected to the aircraft’s
flight control computer in the fuselage. Using Raymer, for a 0.3 ratio of aileron
span to wingspan, historical trends are for the aileron chord to be roughly 0.28-
0.34 the size of the wing chord. The choice was about 20% of the wing chord
because the aircraft need to have enough room for solar panels to go on the
wing. Hence, decreasing the aileron chord would give it a larger area to easily
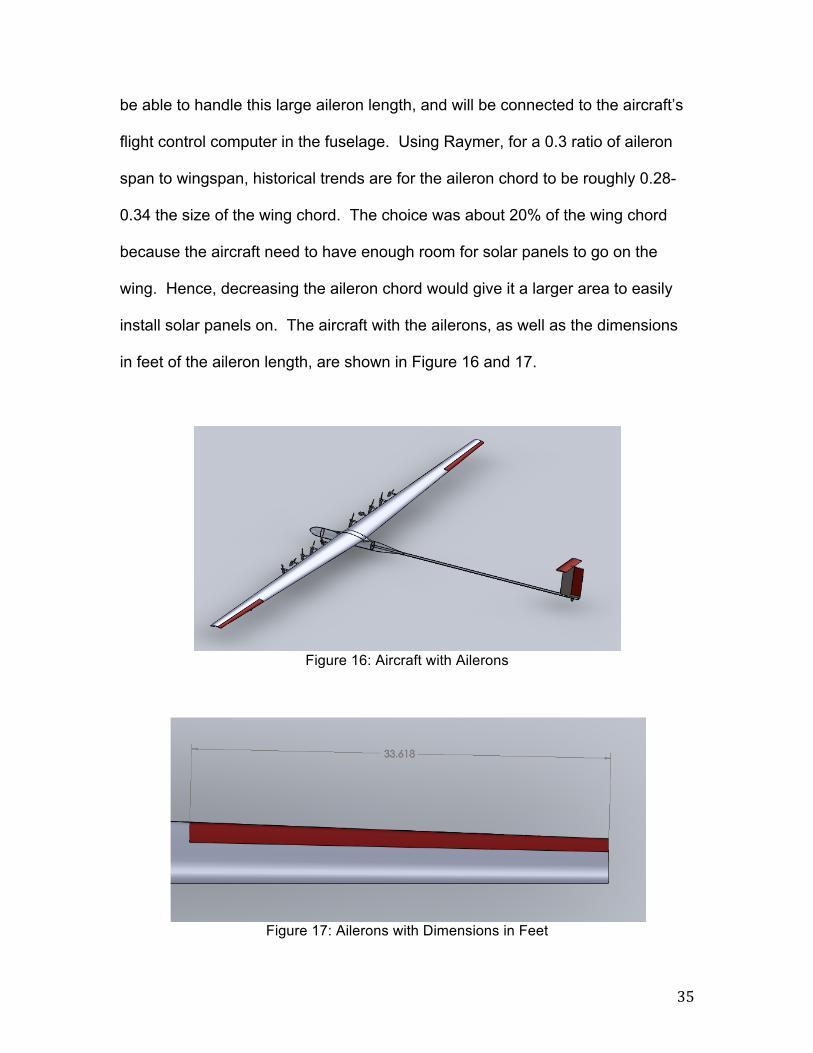
install solar panels on. The aircraft with the ailerons, as well as the dimensions
in feet of the aileron length, are shown in Figure 16 and 17.
Figure 16: Aircraft with Ailerons
Figure 17: Ailerons with Dimensions in Feet
! $'!
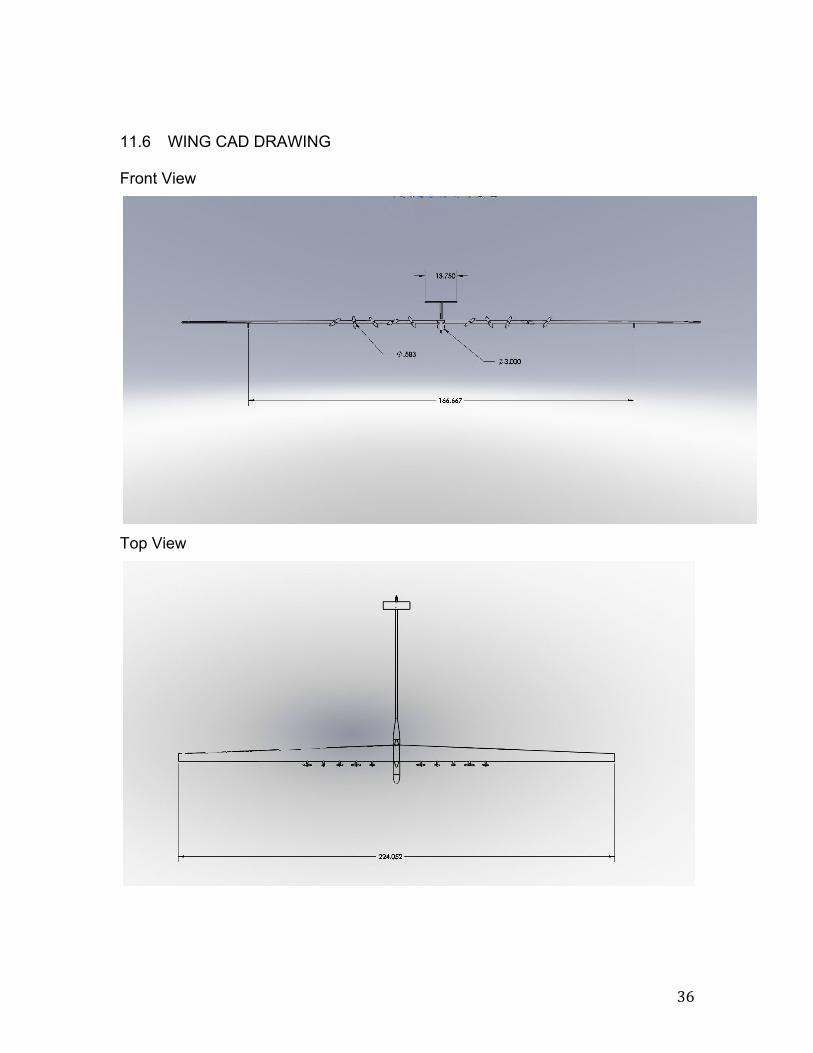
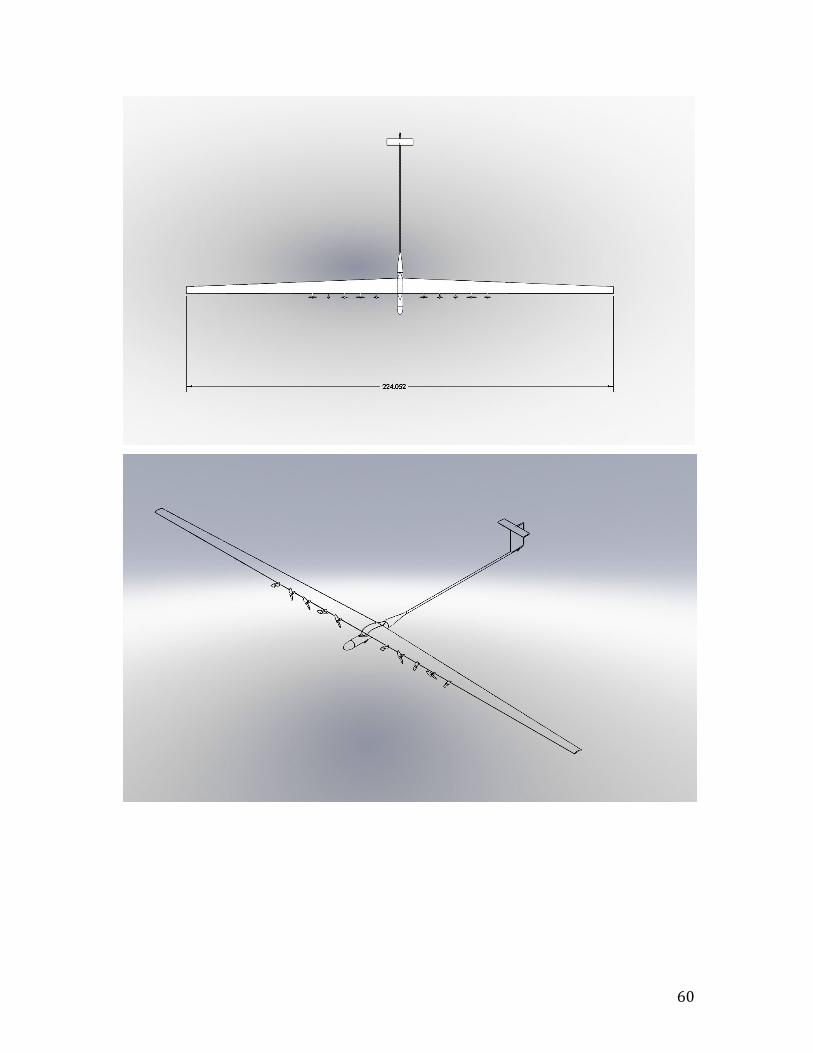
11.6 WING CAD DRAWING
Front View
Top View!
!!!
! $(!
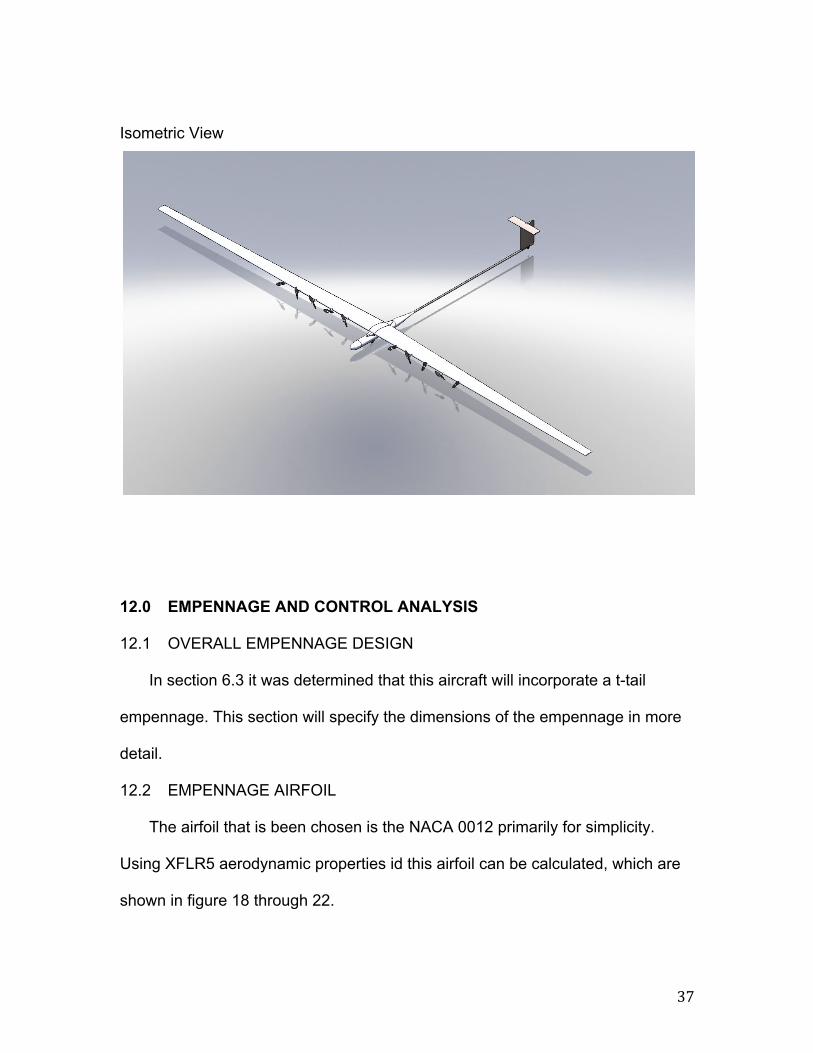
!Isometric View
!!!
12.0 EMPENNAGE AND CONTROL ANALYSIS
12.1 OVERALL EMPENNAGE DESIGN
In section 6.3 it was determined that this aircraft will incorporate a t-tail
empennage. This section will specify the dimensions of the empennage in more
detail.
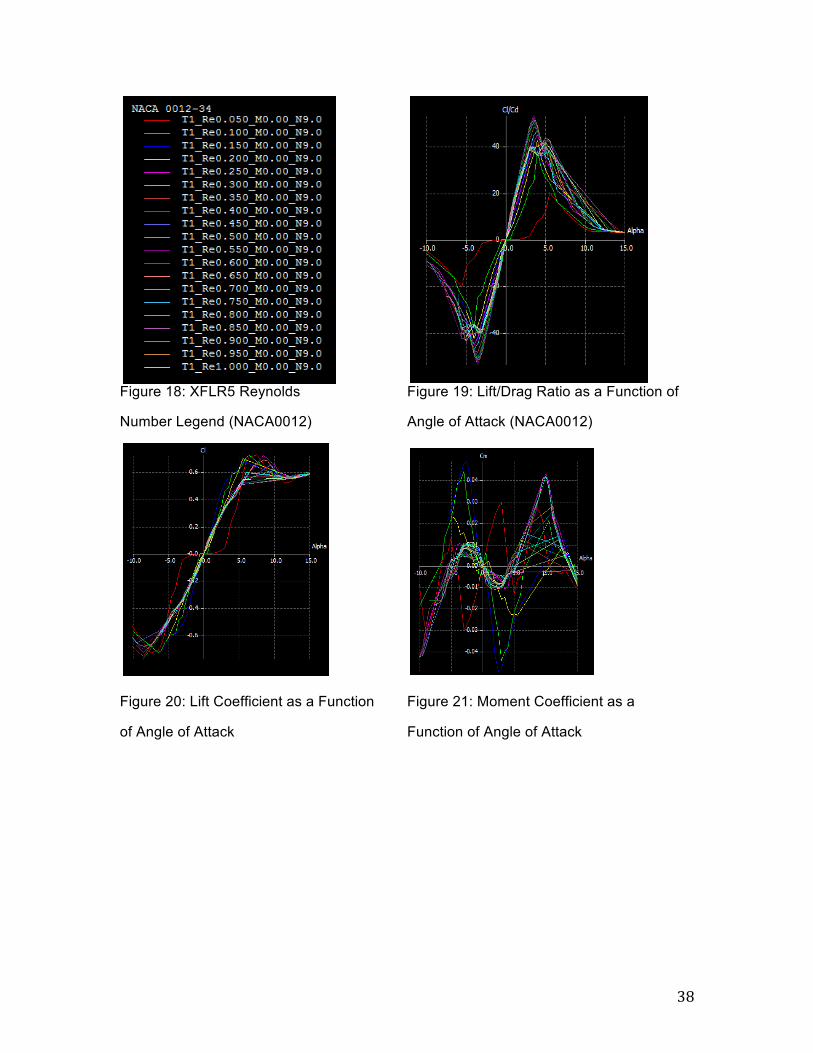
12.2 EMPENNAGE AIRFOIL
The airfoil that is been chosen is the NACA 0012 primarily for simplicity.
Using XFLR5 aerodynamic properties id this airfoil can be calculated, which are
shown in figure 18 through 22.
! $)!
Figure 18: XFLR5 Reynolds Figure 19: Lift/Drag Ratio as a Function of
Number Legend (NACA0012) Angle of Attack (NACA0012)
Figure 20: Lift Coefficient as a Function Figure 21: Moment Coefficient as a
of Angle of Attack Function of Angle of Attack

! $*!
Figure 22: Lift Coefficient as a Function of Drag Coefficient for NACA 0012 Airfoil
For our horizontal and vertical stabilizers, Raymer’s methods for
sailplanes to size the stabilizers are used, and the results are shown in Table 6.
There is no twist or taper for the vertical as well as horizontal stabilizer.
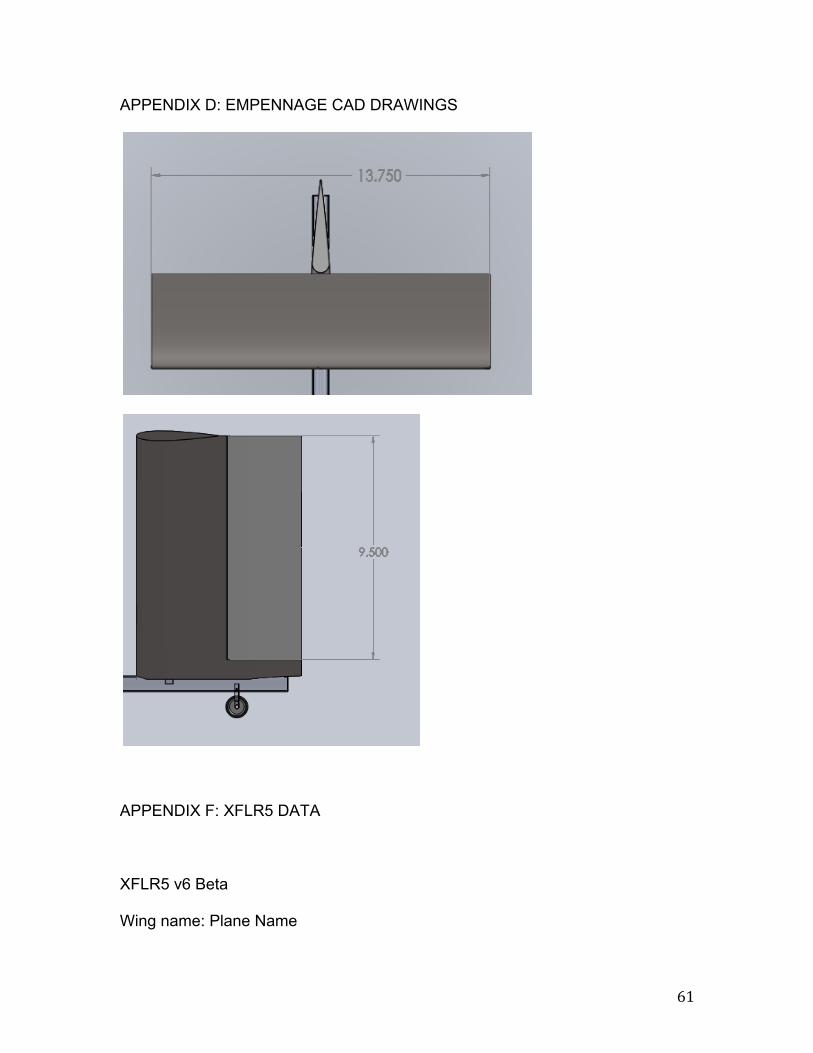
Table 6: Dimensions for stabilizers Horizontal Stabilizer Chord Length 3.5 ft
Horizontal Stabilizer Wingspan 13.75 ft
Vertical Stabilizer Chord Length 7 ft
Vertical Stabilizer Wingspan 10 ft
Stabilator (all moving) Planform Area 25 ft2
Rudder Planform Area 30 ft2
Solar cells will be added to the horizontal stabilizer because there will be a
negligible increase in weight, but an increase in available power, which is ideal.
The setup will be similar to the wing with encapsulation and wiring going through
the spar heading down to the fuselage.

! %+!
12.3 DESIGN OF THE LONGITUDINAL AND DIRECTIONAL CONTROLS
For the pitch and directional control, these stabilizers will be used as
combine action. The horizontal stabilizer will be a stabilator to control pitch. The
stabilator will be hinged to the vertical stabilizer and will be controlled by the pilot
on ground. The servos installed in the aircraft will be able to adjust the stabilator
during flight, and will be able to calculate whether the aircraft is pitch up
(ascending) or pitch down (descending) and adjust as necessary. The vertical
stabilizer will have a rudder as shown appendix D. The servos will be connected
to the flight control computer, which will be located in the fuselage, and will
control the rudder and stabilator deflections.
13.0 WEIGHT AND BALANCE
13.1 COMPONENT WEIGHT BREAKDOWN
13.1.1 Maximum Power point Tracker
In order for the HALE-SPUAV to generate the greatest portion of the
collected sunlight into electricity, the solar panels are usually connected to a
device known as a maximum power point tracker (MPPT). The MPPT is a high
efficiency DC-DC converter with an adjustable gain between the input voltage
(the solar cells) and the output voltage (the batteries). In the case of the HALE-
SPUAV it would be feasible to have a MPPT, which is >95% efficient: this will
allow less power loss to the batteries.
MPPT controllers can be purchased for various applications; however for the
purpose of this project two MPPT controllers were evaluated. The first MPPT
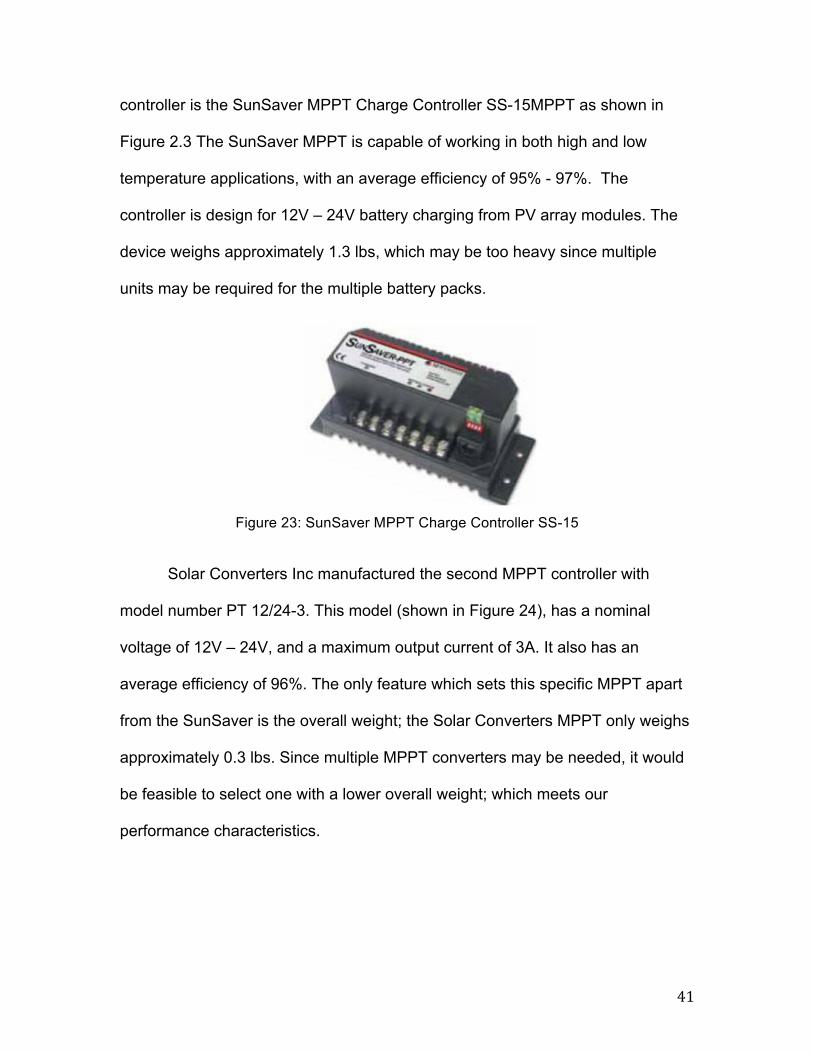
! %"!
controller is the SunSaver MPPT Charge Controller SS-15MPPT as shown in
Figure 2.3 The SunSaver MPPT is capable of working in both high and low
temperature applications, with an average efficiency of 95% - 97%. The
controller is design for 12V – 24V battery charging from PV array modules. The
device weighs approximately 1.3 lbs, which may be too heavy since multiple
units may be required for the multiple battery packs.
Figure 23: SunSaver MPPT Charge Controller SS-15
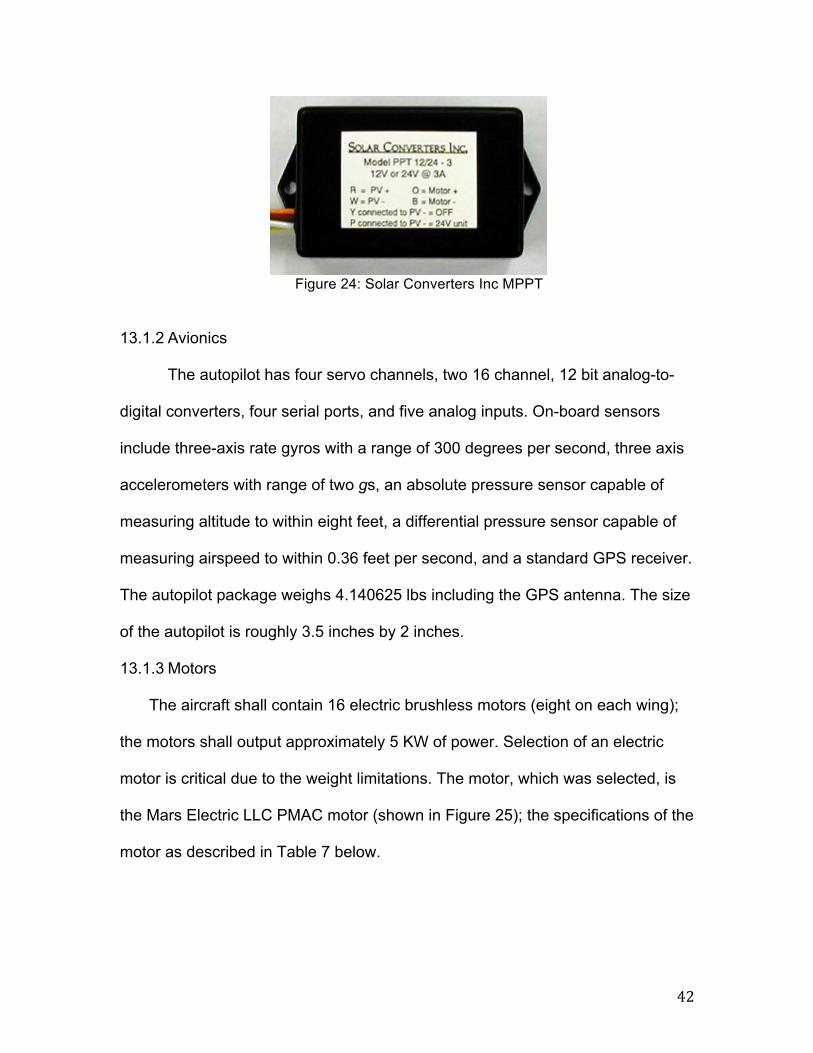
Solar Converters Inc manufactured the second MPPT controller with
model number PT 12/24-3. This model (shown in Figure 24), has a nominal
voltage of 12V – 24V, and a maximum output current of 3A. It also has an
average efficiency of 96%. The only feature which sets this specific MPPT apart
from the SunSaver is the overall weight; the Solar Converters MPPT only weighs
approximately 0.3 lbs. Since multiple MPPT converters may be needed, it would
be feasible to select one with a lower overall weight; which meets our
performance characteristics.
! %#!
Figure 24: Solar Converters Inc MPPT
13.1.2 Avionics
The autopilot has four servo channels, two 16 channel, 12 bit analog-to-
digital converters, four serial ports, and five analog inputs. On-board sensors
include three-axis rate gyros with a range of 300 degrees per second, three axis
accelerometers with range of two gs, an absolute pressure sensor capable of
measuring altitude to within eight feet, a differential pressure sensor capable of
measuring airspeed to within 0.36 feet per second, and a standard GPS receiver.
The autopilot package weighs 4.140625 lbs including the GPS antenna. The size
of the autopilot is roughly 3.5 inches by 2 inches.
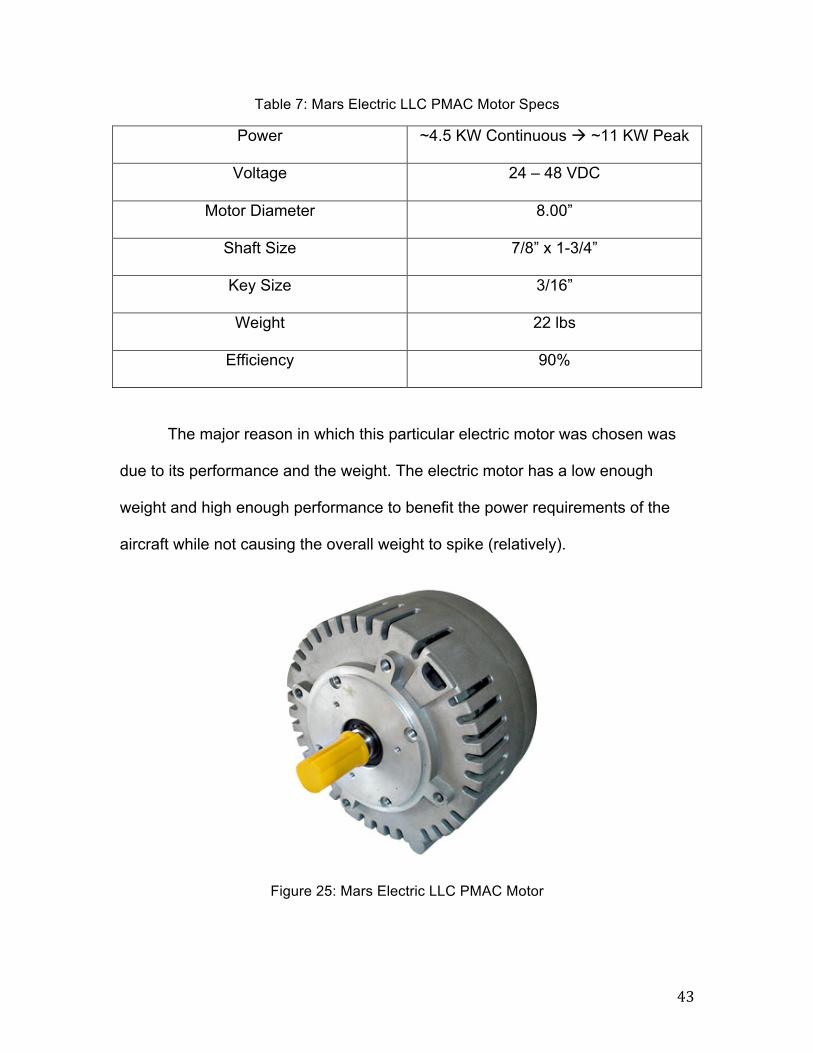
13.1.3 Motors
The aircraft shall contain 16 electric brushless motors (eight on each wing);
the motors shall output approximately 5 KW of power. Selection of an electric
motor is critical due to the weight limitations. The motor, which was selected, is
the Mars Electric LLC PMAC motor (shown in Figure 25); the specifications of the
motor as described in Table 7 below.
! %$!
Table 7: Mars Electric LLC PMAC Motor Specs
Power ~4.5 KW Continuous ! ~11 KW Peak
Voltage 24 – 48 VDC
Motor Diameter 8.00”
Shaft Size 7/8” x 1-3/4”
Key Size 3/16”
Weight 22 lbs
Efficiency 90%
The major reason in which this particular electric motor was chosen was
due to its performance and the weight. The electric motor has a low enough
weight and high enough performance to benefit the power requirements of the
aircraft while not causing the overall weight to spike (relatively).
Figure 25: Mars Electric LLC PMAC Motor

! %%!
13.2 CENTER OF GRAVITY CALCULATION
Now that the aircraft is properly sized, it will be identified where each
component go. Most of the batteries, solar cells, and propulsion group will be
installed onto the wing. It will help to keep wings less dihedral, which is most
important with such a long wingspan. NASA Helios is an example of such
damage. The payload will be located at the quarter chord of the. The airframe will
primarily include the empennage and fuselage weights, and will increase from
our initial estimates because of the high aspect ratio. Figure 21 shows the
distribution of weights and the locations of where the center of gravity would be
located. Some of the batteries would be located in the tip of the fuselage to get
an aircraft center of gravity to be aft of the quarter chord of the wing. The results
of the hand calculations are shown in Table 8 and figure 26.
Figure 26: Aircraft CG Locations
! %&!
Table 8: Component Center of Gravity Component Xcg (relative to tip of fuselage in ft)
Payload 14.472
Batteries in Wing 13.5
Large Part of Fuselage (includes
some batteries)
2
Thin Part of Fuselage 64.335
Vertical Tail 92
Horizontal Tail 90.25
TOTAL 13.92
As shown in figure, the aircraft C.G. is at 14.46ft from the tip of the fuselage and
the quarter chord location of the wing is located at 14.427ft which means the
C.G. is located aft of the quarter chord by 0.01 ft and thus provides a static
longitudinal stability to the aircraft. . For this analysis, we assumed that the
aerodynamic center of the wing and aircraft is located at the quarter chord point
even though the wing is cambered.
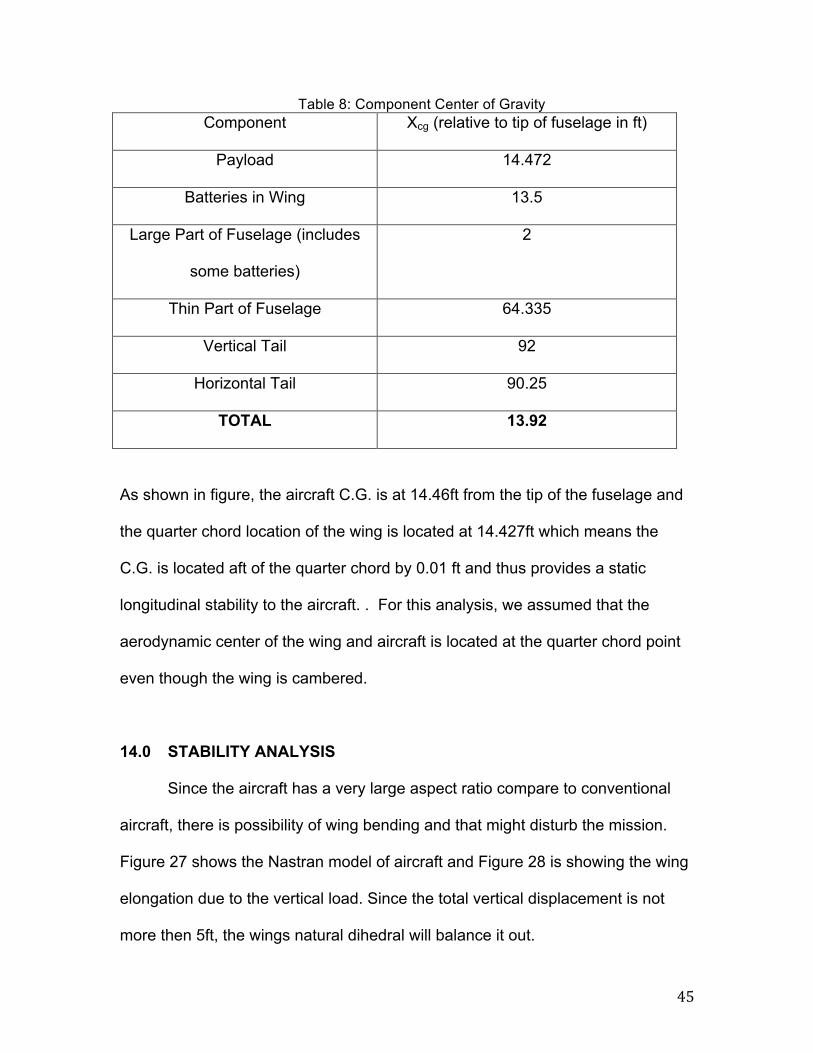
14.0 STABILITY ANALYSIS
Since the aircraft has a very large aspect ratio compare to conventional
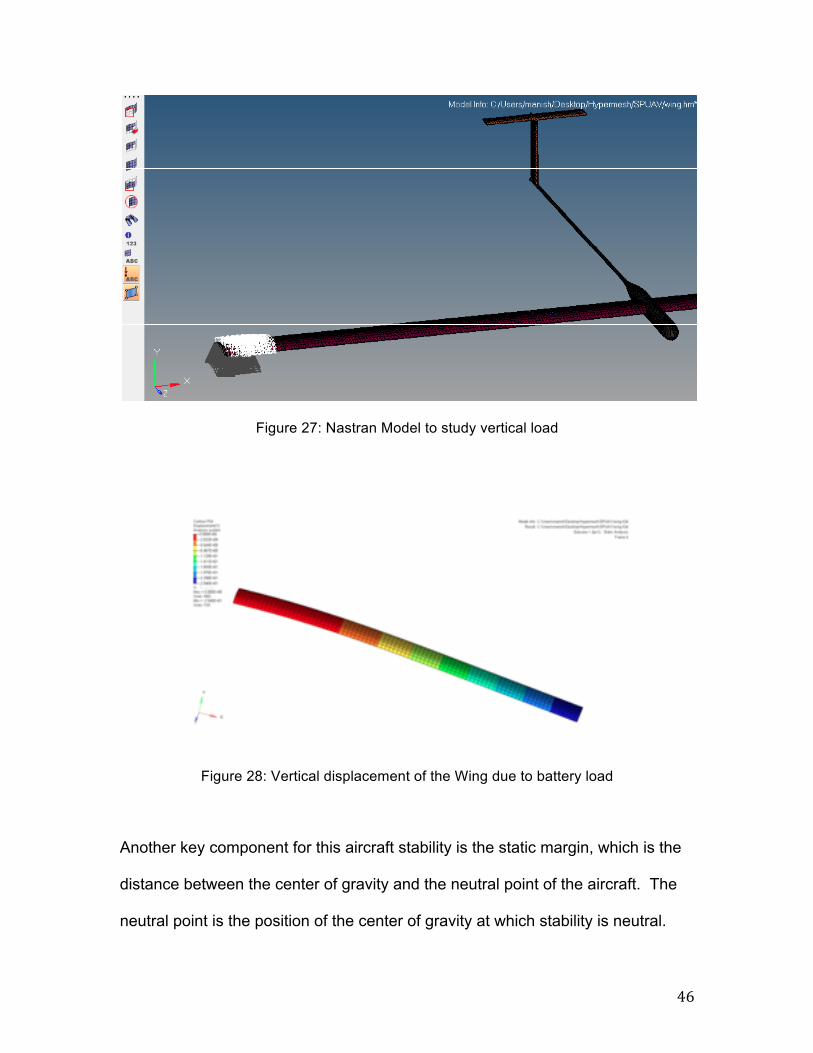
aircraft, there is possibility of wing bending and that might disturb the mission.
Figure 27 shows the Nastran model of aircraft and Figure 28 is showing the wing
elongation due to the vertical load. Since the total vertical displacement is not
more then 5ft, the wings natural dihedral will balance it out.
! %'!
Figure 27: Nastran Model to study vertical load
Figure 28: Vertical displacement of the Wing due to battery load
Another key component for this aircraft stability is the static margin, which is the
distance between the center of gravity and the neutral point of the aircraft. The
neutral point is the position of the center of gravity at which stability is neutral.
!
! %(!
The main variables that affect the neutral point are the horizontal stabilizer area
and the moment area of the horizontal about the aerodynamic center. Using
Desktop Aeronautics software, the static margin can be defined as (14.1).
(14.1)
Table 9 shows the values for our aircraft that are specific to the static margin, as
well as what each variable means.
Table 9: Static Margin Variables and Definitions xc.g. (distance from wing aerodynamic
center back to the c.g)
14.472 ft – 13.92 ft = 0.55 ft
C (reference chord) 8.12 ft
lh (distance from c.g. back to tail a.c.) 91.4 ft – 13.9 ft = 76.5 ft
Sh (horizontal tail reference area) 24.08 ft2
Sw (wing reference area) 610 ft2
CLah (tail lift curve slope) ~0.1
CLaw (wing lift curve slope) ~0.11
dCmc.g.body/da (body c.g. moment
coefficient curve slope)
~ -0.06
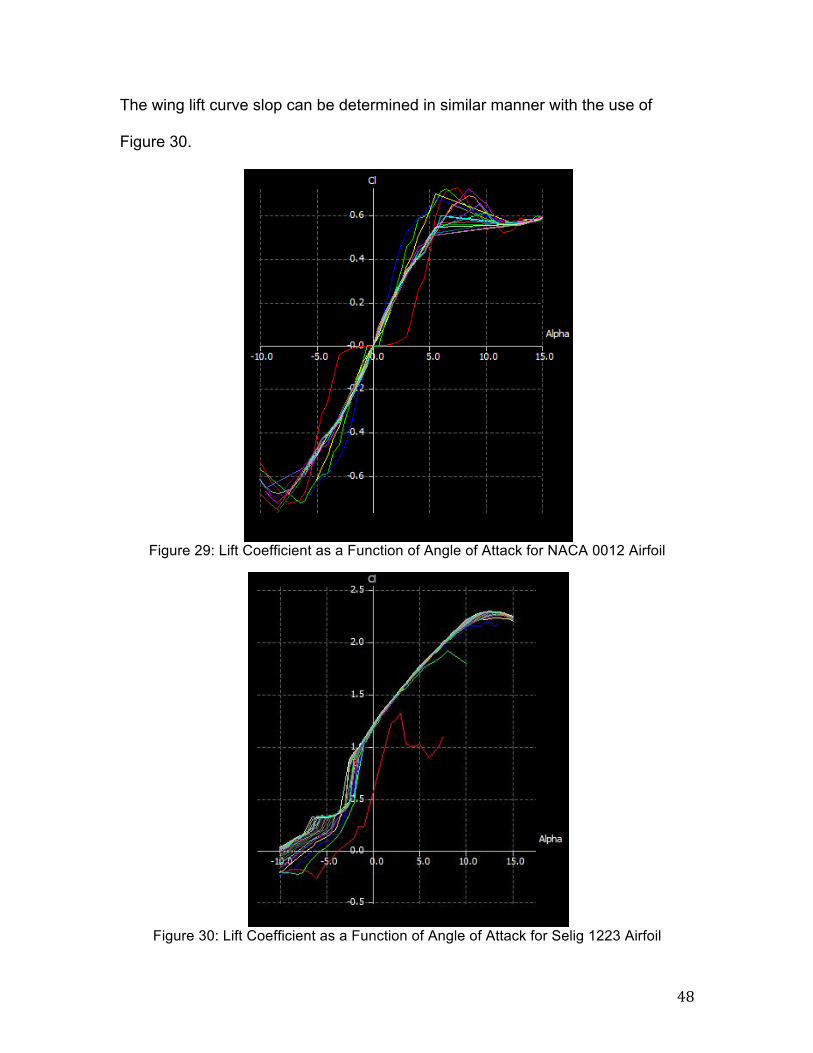
Figure 29 shows the NACA 0012 lift coefficient with the function of angle of
attack. The tail lift curve slope can be found out with this figure:
! %)!
The wing lift curve slop can be determined in similar manner with the use of
Figure 30.
Figure 29: Lift Coefficient as a Function of Angle of Attack for NACA 0012 Airfoil
Figure 30: Lift Coefficient as a Function of Angle of Attack for Selig 1223 Airfoil
! %*!
It can be calculated that the wing lift curve slop is about 0.11 same as above.
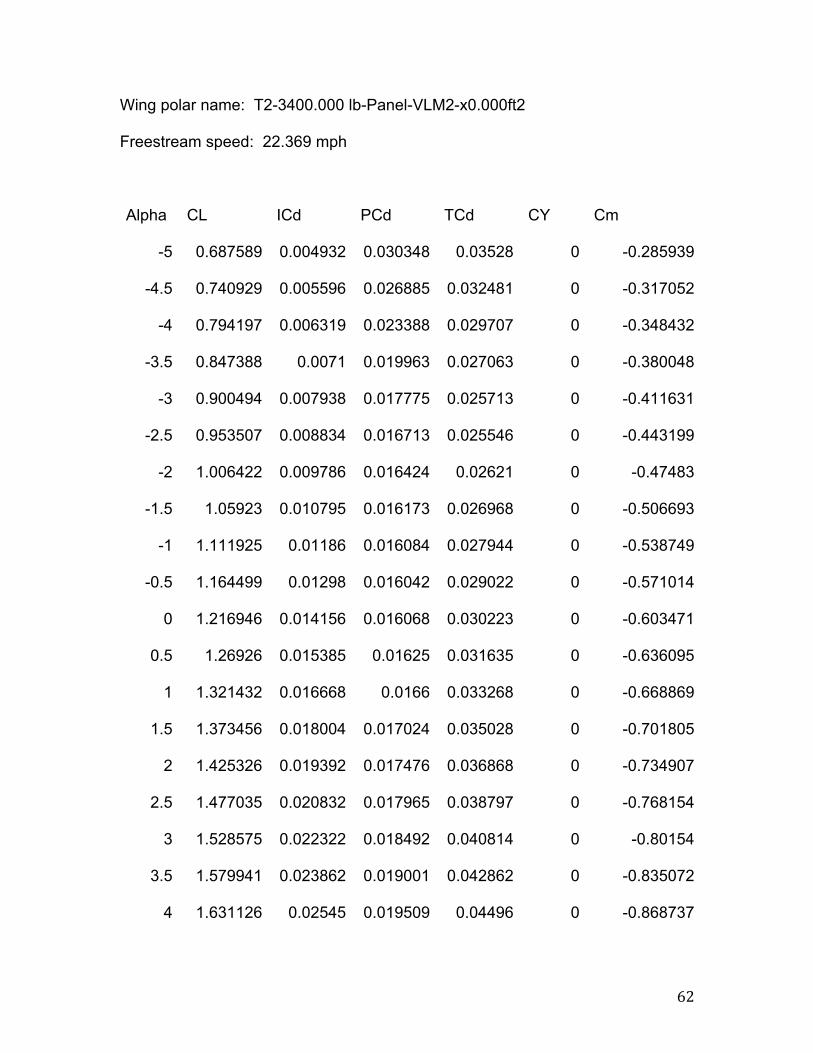
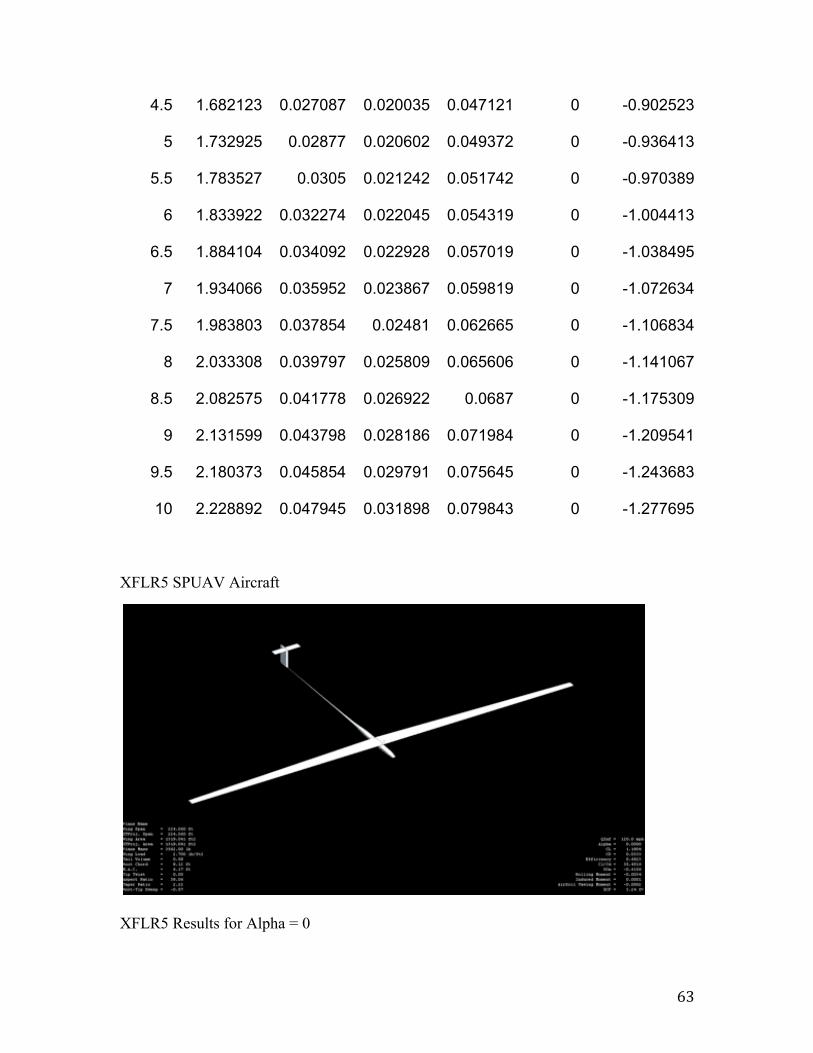
The final calculation that needs to be done is the body center of gravity moment
coefficient curve slope. To do this calculation, XFLR5 data have been used. The
aircraft model has been prepared as shown in the appendix F and it was possible
to get values for the moment coefficient, lift coefficient, and drag coefficient over
a wide range of angle of attack. Looking at Cm from Appendix F, we can see that
the moment coefficient decreases by approximately 0.03 for every half angle of
attack. Thus the body center of gravity moment coefficient curve slope is -0.06
as. Table 9 shows the values for all the variables for the calculation of static
margin.
Plugging the values from Table 8 into the (14.1), it can be said that the static
margin is 63.6%. This is much higher than what is typically found with most
stable aircraft (5% - 40%), but this aircraft is very unconventional. It can be
understand that this high value would push into designing a larger tail for the
aircraft, which is recommended for a future analysis. Also, the aircraft would feel
a bit slow during pitch and yaw movements. In addition, this value shows that
the aircraft is stable aircraft since the center of lift is behind the center of gravity,
which is ideal.
! &+!
15.0 DRAG POLAR ESTIMATION
15.1 AIRPLANE ZERO LIFT DRAG
The airplane’s zero drag calculation will be based on Roskam Part 2
methods of class one drag polar estimation. The total wetted area of the aircraft
will be calculated using (15.1), which is a simplified equation from Roskam that is
specific to this aircraft:
(15.1)
Knowing the maximum thickness of the Seling 1223 airfoil is 12.1%; the total
wing wetted area can be calculated:
For the empennage, (14.1) will be used but specific to horizontal and vertical
stabilizer area. The total empennage area when summing the horizontal and
vertical tail areas is 55 ft2. Since a NACA 0012 airfoil will be used for the
empennage, the maximum thickness of the airfoil is 12%. The total wetted area
would be:
The fuselage-wetted area can be calculated sing (15.2)
(15.2)
In absence of flaps or slats, or any other areas that are needed to account for,
the entire airplane’s wetted area will be sum of three of these, which is 1629.2 ft2.
Roskam’s methods will be sued to calculate equivalence parasite area. Using the
largest skin fiction coefficient of 0.01 from Roskam, the equivalent parasite area
! &"!
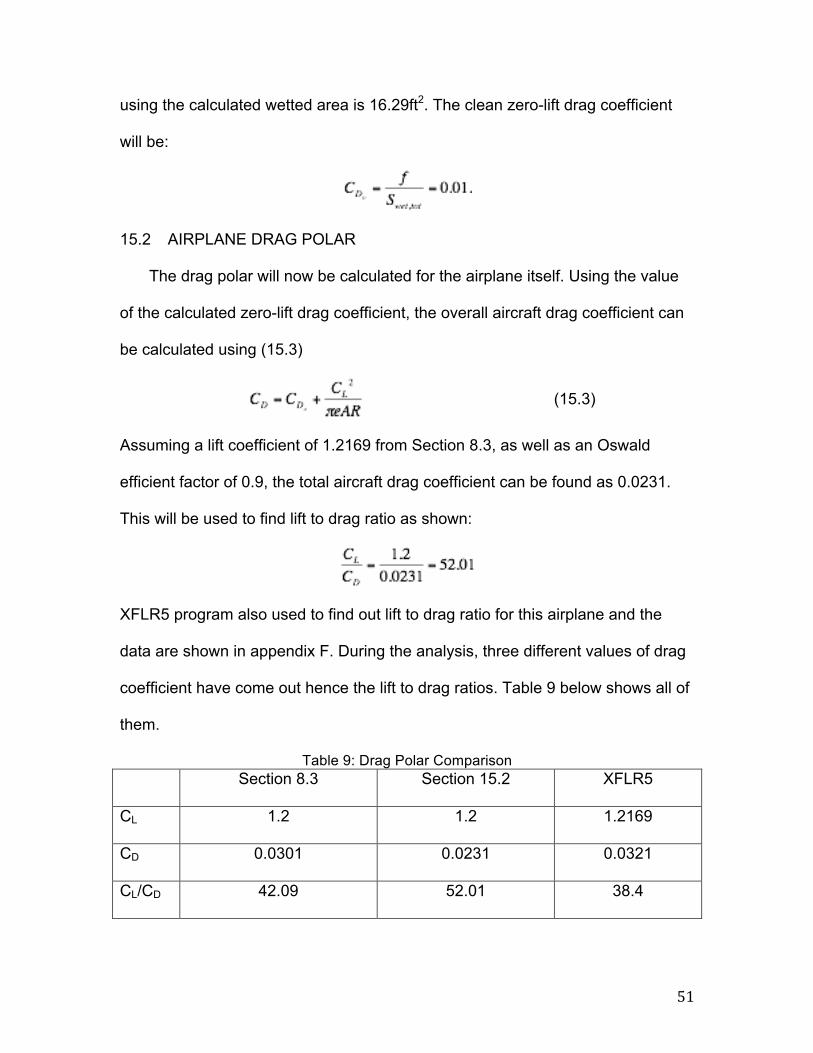
using the calculated wetted area is 16.29ft2. The clean zero-lift drag coefficient
will be:
15.2 AIRPLANE DRAG POLAR
The drag polar will now be calculated for the airplane itself. Using the value
of the calculated zero-lift drag coefficient, the overall aircraft drag coefficient can
be calculated using (15.3)
(15.3)
Assuming a lift coefficient of 1.2169 from Section 8.3, as well as an Oswald
efficient factor of 0.9, the total aircraft drag coefficient can be found as 0.0231.
This will be used to find lift to drag ratio as shown:
XFLR5 program also used to find out lift to drag ratio for this airplane and the
data are shown in appendix F. During the analysis, three different values of drag
coefficient have come out hence the lift to drag ratios. Table 9 below shows all of
them.
Table 9: Drag Polar Comparison Section 8.3 Section 15.2 XFLR5
CL 1.2 1.2 1.2169
CD 0.0301 0.0231 0.0321
CL/CD 42.09 52.01 38.4
! &#!
15.3 DISCUSSION
The drag polar explains in table 9 shows that lift to drag ratio ranges from 38
to 52. The major difference is in section 15.2 analysis because other two have
less difference. The 15.2 analysis does not include fuselage drag coefficient as
other so that analysis should be most inaccurate among others. The average
value between these two approaches can be used in further analysis if needed.
16.0 ENVIRONMENTAL/ECONOMICAL TRADEOFFS
16.1 ENVIRONMENTAL CONSIDERATION
The environmental issues that are related to HALE-SPUAV are few when
compared to a commercial aircraft or model aircraft that uses fuel. However,
there are still few things to consider. First, the battery and the other material are
toxic and are harmful to the environment if the aircraft crashed suddenly or
crashed into the sea. If the aircraft and all materials are not disposed of properly,
this could harm the environment. Another issue is the fact that our aircraft is a
zero fuel emission aircraft, which means that no gasoline or other oil-based fuel,
like bio-fuels, is used. Fuel emission releases carbon dioxide into the atmosphere
and increases the chlorofluorocarbons. That will then increases the green house
effect and rest is all know. Thus it is important to reduce the carbon emission to
preserve the environment.
With the invention and popularity of the hybrid vehicles, this has greatly
reduced the emission from motor vehicles. However, green propulsion yet to gain
enough popularity in our world. In regard to aircrafts specifically, an idea of zero
! &$!
emission aircraft is still not considered since their still needs significant advances
in technology. Bio-fuels for commercial aircraft have been gaining some
popularity, and hydrogen fuel cells are being looked at for the aircraft, but both of
these still use some short of limited energy. Solar energy not only is free of
emission, but also uses sun power directly.
16.2 ECONOMIC FEASIBILITY
The increase in fuel cost over the last few years drive an alternative source
of the energy, whether it is bio-fuels, hydrogen fuel cells, or solar cells. Bio-fuel
has the advantage currently because aviation companies put more funding in the
technology than any other alternative source of energy. The other reason bio-
fuels were chosen is because it would be simple to implement them into the
current commercial aircraft, which would save money since new aircraft would
not have to be build. However, they are the most expensive over the time when
compared to hydrogen fuel cells or solar cells because commercial aircraft will
use millions of pounds of this fuel over next 50 years or so. There will come a
point in time where it would be cheaper to build entirely new aircraft with solar
technology then to use bio-fuel. Therefore not only will solar technology be better
for the environment, but it will also be more cost-effective over a long period of
time when compared to current commercial aircraft fuel.
! &%!
17.0 CONCLUSION / RECOMMENDATION
With the current desire for a greener society, an alternative source of energy
for aircraft is needed. There are many alternative energy solutions that are
promising; including bio-fuel and hydrogen fuel cells, but nothing is as limitless as
solar technology. As, mentioned through out the project, the application of high
altitude long endurance UAVs can potentially be very large, whether it is in
weather surveillance, studying natural disaster, or fire direction. The solar power
UAV design discussed weight 1135lb, has a large wingspan of 224ft, and hold up
to 100lb of payload, which is more then enough for all the surveillance and
autopilot instruments. The advances in solar technology have made it so the
concept of solar powered UAVs and MAVs is not just a theory anymore. Solar
power airplanes are necessary for greener society and can be an important part
of the future of aviation.
! &&!
REFERENCE
1. Wikipedia, (2011). History of solar aircrafts, Retrieved on 01/21/2011 from:
http://www.wikipedia.org/
2. Boucher, R. J., “History of Solar Flight”, 20th Joint Propulsion Conference,
Cincinnati, Ohio, June 11-13, 1984, AIAA-84-1429
3. NASA Facts, “Solar Powered Research”, Dryden Flight Research Center,
Edwards, California 93523
4. Bowman, W. J., Roberts, C., and Vaughan, M., “Development of a Solar
Powered Micro Air Vehicle”, 40th AIAA Aerospace Sciences Meeting and
Exhibit, Reno, Nevada, January 2002, AIAA-2002-0703
5. Berger, B., “NASA Studies Options Following Loss of Helios Vehicle”,
Space News, July 14, 2003,
http://www.space.com/spacenews/archive03/nasaarch_071403.html
6. AC Propulsion, “AC Propulsion’s Solar Electric Powered SoLong UAV”,
2004,
http://www.acpropulsion.com/ACP_PDFs/ACP_SoLong_UAV_48hr_Flight
_200 5-06-05.pdf
7. D.P. Raymer, Aircraft Design: A Conceptual Approach. 2nd Ed., AIAA
Education Series, 1992.
8. J. Roskam, Aircraft Design parts 1-8. Roskam Aviation and Engineering
Corporation, Route 4, Box 274, Ottawa, Kansas, 1985-1990.
! &'!
9. Noth, A. (2008), Design of Solar Powered Airplanes for Continuous Flight
(Doctoral dissertation, ETH Zürich, 2008), ETH Zürich, Sept. 2008.
10. Honsberg & Bowden, (2010). PVCDROM. Section 2.22: Calculation of
Solar Insolation. Retrieved 11/12/2010 from.
http://pvcdrom.pveducation.org/index.html
11. SunPower, (2003). SunPower Announces World’s Most Efficient, Low-
Cost Silicon Solar Cell. Retrieved 11/12/2010 from http://www.en-
genius.net/site/zones/greentechZONE/product_reviews/grnp_060203
! &(!
APPENDICES
APPENDIX A: COMPLETE DESIGN PARAMETERS FOR SIMILAR AIRCRAFT
! &)!
! &*!
APPENDIX B: LANDING GEAR POSITIONS
APPENDIX C & E: WING & AIRCRAFT CAD DRAWINGS
!
! '+!
!
!
! '"!
APPENDIX D: EMPENNAGE CAD DRAWINGS
APPENDIX F: XFLR5 DATA
XFLR5 v6 Beta
Wing name: Plane Name
! '#!
Wing polar name: T2-3400.000 lb-Panel-VLM2-x0.000ft2
Freestream speed: 22.369 mph
Alpha CL ICd PCd TCd CY Cm
-5 0.687589 0.004932 0.030348 0.03528 0 -0.285939
-4.5 0.740929 0.005596 0.026885 0.032481 0 -0.317052
-4 0.794197 0.006319 0.023388 0.029707 0 -0.348432
-3.5 0.847388 0.0071 0.019963 0.027063 0 -0.380048
-3 0.900494 0.007938 0.017775 0.025713 0 -0.411631
-2.5 0.953507 0.008834 0.016713 0.025546 0 -0.443199
-2 1.006422 0.009786 0.016424 0.02621 0 -0.47483
-1.5 1.05923 0.010795 0.016173 0.026968 0 -0.506693
-1 1.111925 0.01186 0.016084 0.027944 0 -0.538749
-0.5 1.164499 0.01298 0.016042 0.029022 0 -0.571014
0 1.216946 0.014156 0.016068 0.030223 0 -0.603471
0.5 1.26926 0.015385 0.01625 0.031635 0 -0.636095
1 1.321432 0.016668 0.0166 0.033268 0 -0.668869
1.5 1.373456 0.018004 0.017024 0.035028 0 -0.701805
2 1.425326 0.019392 0.017476 0.036868 0 -0.734907
2.5 1.477035 0.020832 0.017965 0.038797 0 -0.768154
3 1.528575 0.022322 0.018492 0.040814 0 -0.80154
3.5 1.579941 0.023862 0.019001 0.042862 0 -0.835072
4 1.631126 0.02545 0.019509 0.04496 0 -0.868737
! '$!
4.5 1.682123 0.027087 0.020035 0.047121 0 -0.902523
5 1.732925 0.02877 0.020602 0.049372 0 -0.936413
5.5 1.783527 0.0305 0.021242 0.051742 0 -0.970389
6 1.833922 0.032274 0.022045 0.054319 0 -1.004413
6.5 1.884104 0.034092 0.022928 0.057019 0 -1.038495
7 1.934066 0.035952 0.023867 0.059819 0 -1.072634
7.5 1.983803 0.037854 0.02481 0.062665 0 -1.106834
8 2.033308 0.039797 0.025809 0.065606 0 -1.141067
8.5 2.082575 0.041778 0.026922 0.0687 0 -1.175309
9 2.131599 0.043798 0.028186 0.071984 0 -1.209541
9.5 2.180373 0.045854 0.029791 0.075645 0 -1.243683
10 2.228892 0.047945 0.031898 0.079843 0 -1.277695
XFLR5 SPUAV Aircraft
XFLR5 Results for Alpha = 0

! '%!