solar systems in the desert
TRANSCRIPT

8/4/2019 Solar Systems in the Desert
http://slidepdf.com/reader/full/solar-systems-in-the-desert 1/36
A Study of Very Large Solar Desert Systems
with the Requirements and Benefits to those Nations
Having High Solar Irradiation Potenial
July 2006
Peter MeisenPresident, Global Energy Network Institute (GENI)
www.geni.org [email protected] (619)595-0139
Oliver PochertResearch Associate, Global Energy Network Institute (GENI)
8/4/2019 Solar Systems in the Desert
http://slidepdf.com/reader/full/solar-systems-in-the-desert 2/36
Table of Contents
I) Introduction ............................................................................................................. 3
II) Current situation of world energy and environment........................................... 3
a) Outlook for World Supply / Demand by Region................................................ 4b) The NASA earth at night map ............................................................................. 5c) Africa’s population in the dark ........................................................................... 7
III) World PV Potential using Desert Utilization...................................................... 8
a) World primary energy supply ............................................................................. 9b) PV system feasibility in world deserts (Table 1) .............................................. 10c) Very large scale PV (VLS PV) ........................................................................... 12
IV) Realizing Large Scale PV in the desert -- Genesis Project .............................. 12a) Life Cycle framework of the case study ............................................................ 14b) Requirements to construct a 100 MW VLS PV system................................... 15c) Potential of VLS - PV: Summary of the advantages ....................................... 16
V) Cost trends ............................................................................................................. 16
a) Solar PV System and Module Manufacturing Cost Breakdown.................... 17b) Production costs .................................................................................................. 18
VI) Economic benefits of the PV Roadmap ............................................................. 19
a) U.S. Solar Power Shipment, Installations and Employment .......................... 19b) Total Investment and Jobs Map ........................................................................ 20
VII) Silicon Feedstock Shortage................................................................................ 21
a) Chinese manufacturing cost advantages........................................................... 22b) Alternatives to Silicon Crystalline Cells ........................................................... 23c) Self-Assembling' Solar Cells .............................................................................. 25
VIII. Concentrating Solar Power (CSP) ................................................................... 27 a) SES Dish Stirling System Technology ............................................................... 28b) Trends sterling engine ....................................................................................... 30
IX. Transmission the key requirement .................................................................... 31a) Characteristics of transmission ......................................................................... 31
X. Three VLS solar proposals: resource and markets ............................................ 32a) Gobi desert for China ........................................................................................ 32
b) Concentrating Solar Power for the Mediterranean Region ........................... 33
d )Mojave desert for the US ................................................................................... 35 XI. Summary and Conclusion…………………………………………………...….35

8/4/2019 Solar Systems in the Desert
http://slidepdf.com/reader/full/solar-systems-in-the-desert 3/36
I) Introduction
This paper provides the background research, including planning and implementation of largescale solar energy systems. Ten years ago, Sanyo Electric proposed the Silk Road Genesis Projectto develop large solar arrays in the Gobi Desert and linking to Japan and China using high voltagetransmission lines. Advancements in solar technology, cost reductions and concerns about climatechange are now making large scale solar viable. PV system providers will be keen to develop thisenormous market potential in all desert regions.
II) Current situation of the environment
The current global situation of environmental pollution, climate change and energy demandurgently requires dramatic political, economic and technical decisions -- in order to avoid apotential collapse of environmental and social systems. Around the world, electricity remains thevital component of national and international development. The implementation of renewableenergy resources can provide solutions to these challenges by stimulating the earlyimplementation of economically viable sustainable energy technologies.
Many technological innovations have taken place in the past few years. This development isespecially geared towards increasing efficiencies, lowering the costs and reducing emissions. TheInternational Energy Agency forecasts that world energy demand will grow steadily over the nextfive years despite high prices, thus straining the supply chain. The IEA expects energy demandwill grow at 1.6 percent per year, to nearly 335 million barrels of oil equivalent per day(MBOE/D). The fastest-growing segment of demand will be fuel for electricity generation,followed by transportation and chemical production. Among fossil fuels, coal and natural gasusage will grow at about 1.8 percent each, followed by oil at about 1.4 percent.
Pollution from energy generation accounts
over 50% of all pollution today.
Electric power production is the largest contributor to global warming, acid rain, glacier melt anddisease migration. The California EPA1 estimates that fossil fuel-based power generation has an
environmental health cost of 10.5 cents per kilowatt hour.
Increased production and use of fossil fuels, especially coal, has severe local and regionalimpacts. Locally, air pollution already takes a significant toll on human health. Acid rainprecipitation and other forms of air pollution degrade downwind habitats-- especially lakes,streams, and forests -- plus damaging crops and buildings. One recent study warns that, in theabsence of sulfur abatement measures, acid depositions in parts of China and South Asia couldeventually exceed the critical load for major agricultural crops by a factor of 10 [2]. Without theuse of the best available technology and practices, coal mining leads to land degradation andwater pollution, as does the disposal of hazardous coal ash. On a global level, increased burningof fossil fuels will mean an accompanying rise in greenhouse gas emissions, along with thepotential adverse impacts of global warming and other climate changes.
Nuclear fuel, too, has obvious environmental costs associated with its production and disposal,although nuclear power produces virtually none of the air pollution and carbon dioxide dischargesof fossil fuels.
According to the US Department of Energy, America needs 20,000 megawatts (MW) of new
power generation every year for the next twenty years in order to meet projected demand,
and an additional 2,000,000 MW outside the U.S. over the same period.
The energy demand is growing on the different continents unequally. The demand for energy inthe world has experienced a sudden increase in the developing regions, particularly in Asia, andpredictions are that in 2030, demand will increase by 66% compared to 2000. The Asian region(excluding Japan) will account for almost 40% of that growth.

8/4/2019 Solar Systems in the Desert
http://slidepdf.com/reader/full/solar-systems-in-the-desert 4/36
a) Outlook for World Supply / Demand by Region (Figure 1.)
The World energy outlook for 2030 by Region
To meet this voracious demand without polluting our environment
is not possible without renewable energy.
Among the six primary renewable resources (solar, wind, hydro, geothermal, biomass, ocean),solar energy offers extraordinary potential for three main reasons. First, solar offers totallyharmless operation for the immediate environment: no noise, movement, smoke, dust, waste, norany kind of physical risk. Second, the potential for solar energy generation is virtually unlimited,and will never run out. Lastly, the cost of solar power is expected to compete with conventionalsources within the next few years due to technical improvements and mass production.
“Thinking about the long lead times for the development of energy technology,
it is urgently necessary to seek new energy seeds applicable for the next generation”.
Kosuke Kurokawa , Tokyo University of Technology
Note:
1 California Environmental Protection Agency (http://www.calepa.ca.gov/ )
2. World Energy Council (WEC) and International Institute for Advanced Systems Analysis (IIASA),
Global Energy Perspectives to 2050 and Beyond (WEC, London, and IIASA, Luxemburg, Austria,
1995), pp. 82-86. Exhaustive Information available at World Resource Institute www.wri.org

8/4/2019 Solar Systems in the Desert
http://slidepdf.com/reader/full/solar-systems-in-the-desert 5/36
b) The NASA earth at night map (Figure 2.)
The map below depicts electricity use world-wide on any given evening, highlighting areas of prosperity. Yet 1.6 billion people, 25 % of humanity, remain in the dark. Those people without
access to electricity survive without refrigeration, lighting, or clean water. Nearly all the lights inthis map are supplied via high voltage transmission lines, and 100 nations already exchangepower across borders. To meet the UN Development Goals, a combination of grid-connected andstand alone renewable electricity development will elevate a community out of basic poverty in aan environmentally sustainable manner. While most nations use polluting fossil and nuclear fuels,abundant renewables like hydro, geothermal, biomass, wind and solar exist on every continent.Linking the renewable electricity resources in Africa and South Asia will provide the foundationfor ending hunger and poverty. As you can see in Africa, millions of people have no electricalservices, and denude their local environment by using firewood and cow dung for their dailyenergy needs.
1.6 billion people, 25 % of humanity, remain in the dark

8/4/2019 Solar Systems in the Desert
http://slidepdf.com/reader/full/solar-systems-in-the-desert 6/36
Some facts worth mentioning regarding the lights on the Earth at Night map:
1. The lights in Canada are 58% hydropower while in the United States 91% of electricity comesfrom fossil and nuclear power.2. Brazil gets 83% of its energy from hydropower3. 509 million people in Sub Saharan Africa live in the dark, they have no access to electricity.(compare the map below)4. In Iceland 100% of the energy comes from hydro and geothermal with excess to createhydrogen for fuel cells.5. 99% of Norway’s power is of hydro while 96% in the UK is fossil or nuclear power6. There are a lot of sunlight in South Asia, but 713 million people out of 1.4 billion people inSouth Asia (South Asia: Bangladesh, Bhutan, India, Nepal, Pakistan and Sri Lanka) still have noelectrical services.7. 98% of Chinese people have electricity access, however 82% is produced form fossil andnuclear fuels.8. Australia is blessed with solar, geothermal and tidal resources, but is still using 92% fossil
fuels. In contrast to his neighboring country New Zealand, which gets 68% of their electricityfrom hydro and geothermal.
“The best way to convince anyone about new technologies and practices is to show
them what their friends and neighbors are doing - and many countries on the African
continent have been carrying out important, cutting-edge solar programs for decades”.
Scott Sklar, President of The Stella Group
co-author of "A Consumer Guide to Solar Energy
See the whole Scott Sklar interview:
http://www.renewableenergyaccess.com/rea/news/section?id=15
Source:
NASA Digital Archive
C. Mayhew &. Simmon (NASA / GSFC), NOAA / NGDC, DMSP
Global Energy Network Institute / NASA earth at night map
http://www.geni.org/globalenergy/multimedia/earth-at-night016.gif
CIA World Factbook http://www.cia.gov/cia/publications/factbook/ IEA Energy Statistics http://www.iea.org/Textbase/stats/ World Energy Council http://www.worldenergy.org
8/4/2019 Solar Systems in the Desert
http://slidepdf.com/reader/full/solar-systems-in-the-desert 7/36
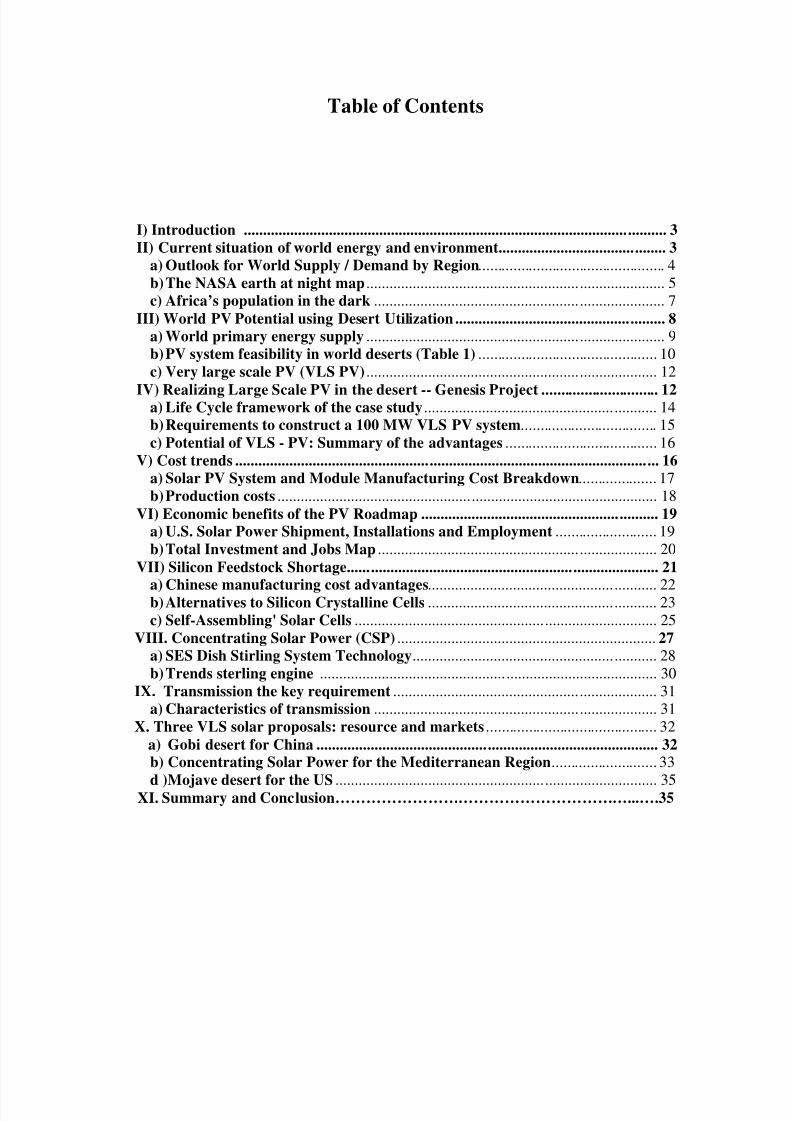
c) Africa’s population mostly in the dark (Figure 3.)
This Map indicates the inhabitants in Africa per sq. km. Compared with the nighttime map, it'sclear that 509 million people (approximately half of all Africans) in Sub-Saharan Africa have noaccess to electricity. For very good reason, Africa is called "the dark continent".
509 million people in Sub-Saharan Africa have no access to electricity
"For the first time in history it is now possible to take care of everybody at a higher
standard of living than any have ever known. Only ten years ago the 'more with less' technology reached the point where this could be done. All humanity now has the
option of becoming enduringly successful."
Buckminster Fuller , 1980.
Visionary engineer from his book "Critical Path"
The Sahara Desert alone can capture enough solar energy to supply all the world’s electricityneeds and more. The potential is there, reported the United Nations Environmental Program
Source:
National Center for Geographic Information and Analyses.
http://www.ncgia.ucsb.edu/pubs/gdp/pop.html
http://www.geni.org/globalenergy/library/buckminster_fuller/index.shtml
8/4/2019 Solar Systems in the Desert
http://slidepdf.com/reader/full/solar-systems-in-the-desert 8/36
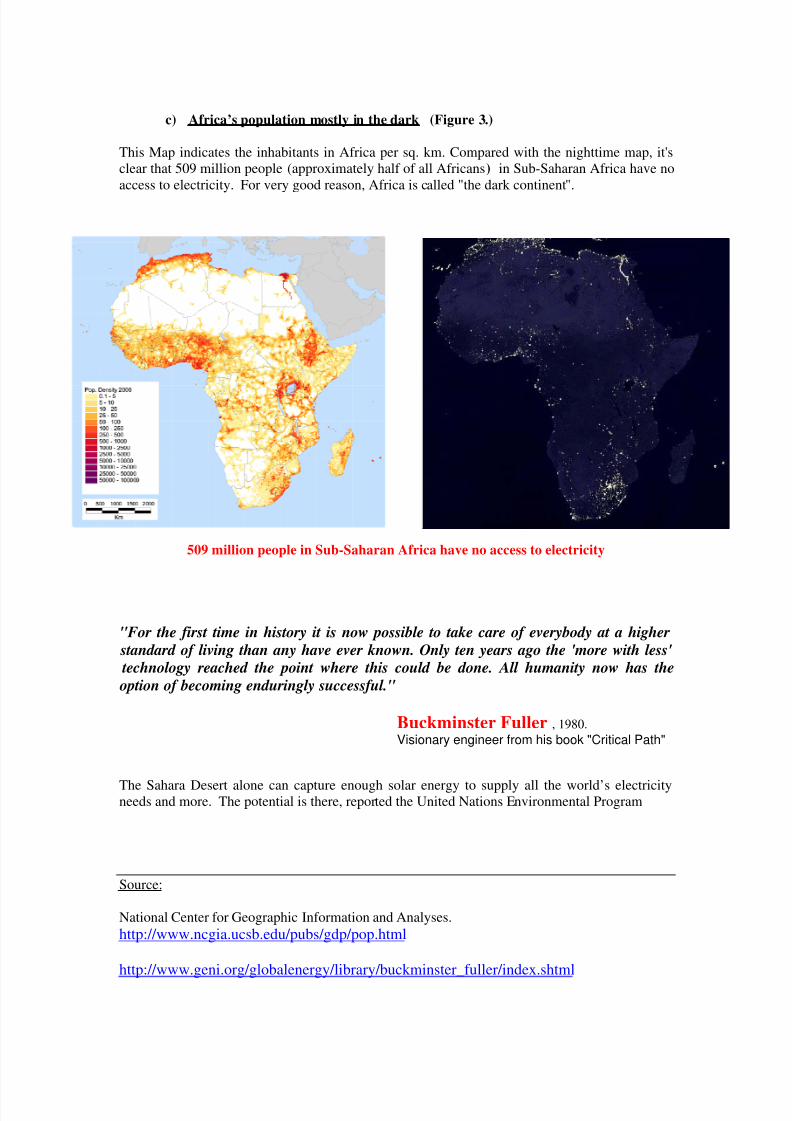
III) World photovoltaic (PV) Potential by Desert Utilization
The theoretical potential of solar energy is enormous -- far beyond what the world could everrequire. With today's PV efficiencies, solar energy from desert regions would be more thanenough to meet all the electricity demand in both industrialized and developing countries.
One third of the planet's landmass is covered by desert, which receives intensive solar radiationevery day. Several experts studies have estimated that using just 4% of the total desert area forsolar systems is sufficient to supply all the electrical energy requirements of the world.From the map below, one can see that strategy would require small desert areas in the Mojave,Sahara, Gobi, India, Angola, Chilean and Australian deserts.
Figure 4. shows the theoretical footprint needed for solar power plants to generate sufficientelectric power in order to meet the energy demand of the World, Europe (EU-25) and Germanyrespectively.
Using the solar radiation of just 4% of the world's desert is sufficient to
meet all world electrical energy requirements today.
Source:
(Data by the German Center of Aerospace (DLR), 2005) Out of a study from the DLR, P. 12 and 26
Further information:http://www.dlr.de/en/desktopdefault.aspx
http://www.trecers.net/concept.html
8/4/2019 Solar Systems in the Desert
http://slidepdf.com/reader/full/solar-systems-in-the-desert 9/36
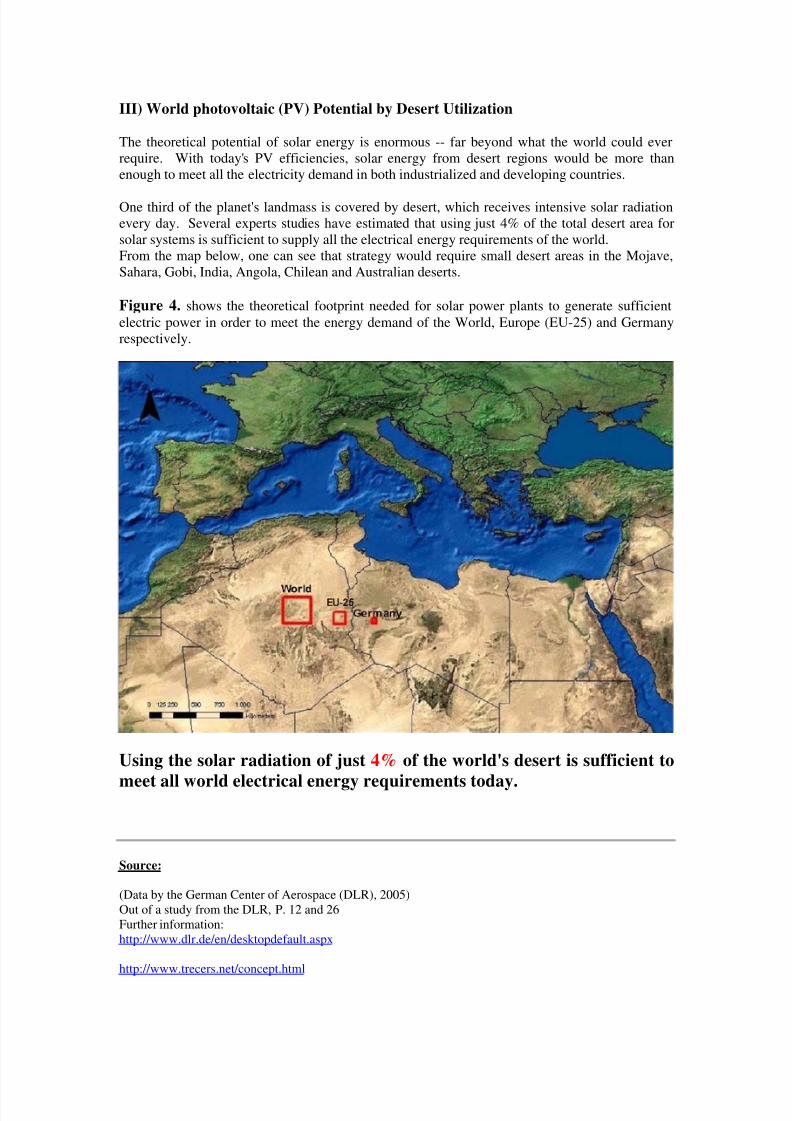
a) World Electricty Consumption
China and India, where economic growth rates are remarkable and major percentages of theirenergy needs are fulfilled by carbon-rich coal, have large desert areas. Therefore, their solarenergy potentials are quite high. Large scale photovoltaic systems would also contribute to theregions economy and would solve the energy supply problem as well as suppress carbon dioxideemission.
In the Gobi desert alone, the total 2357.84 x 103 TWh (8486.67 x 1021Jule) which equals almost20 times the total world primary energy supply 10,723 MTOE (IEA, 2003) (3479.51x1020 Jule)
The possibility of PV technology development into the global network depends upon its resourcepotential first. To show it, energy to be generated by bulk systems over major deserts in the worldis estimated. The desert is unused land and irradiation is much higher than other areas.
PV Solar Energy production from desert region becomes almost
20 times as much as the world primary energy supply.(Figure 5.)
According to Solar Development (2003), by utilizing only 1% of the earths desert
with solar thermal electric generators, it would allow us to produce clean solar
electric energy that can provide more electricity than is currently being produced on
the entire planet by fossil fuels.
Further Information
http://www.iea.org/Textbase/subjectqueries/maps/world/ele.htm
Consumption4,534 TWh
Desert potential154,610TWh
Consumption690.97 TWh
Desert potential70,420TWh
Consumption440.45 TWh
Desert potential1,350,890 TWh
Desert potential662,050 TWh
Desert potential159,050 TWh
Consumption1,581 TWh
Consumption1,152 TWh
Consumption3,171 TWh
Consumption163.95 TWh
Consumption2,996 TWh
Consumption493,76 TWh
World electricity consumption 15,223 TWh
World desert potential 2,357,840 TWh
8/4/2019 Solar Systems in the Desert
http://slidepdf.com/reader/full/solar-systems-in-the-desert 10/36
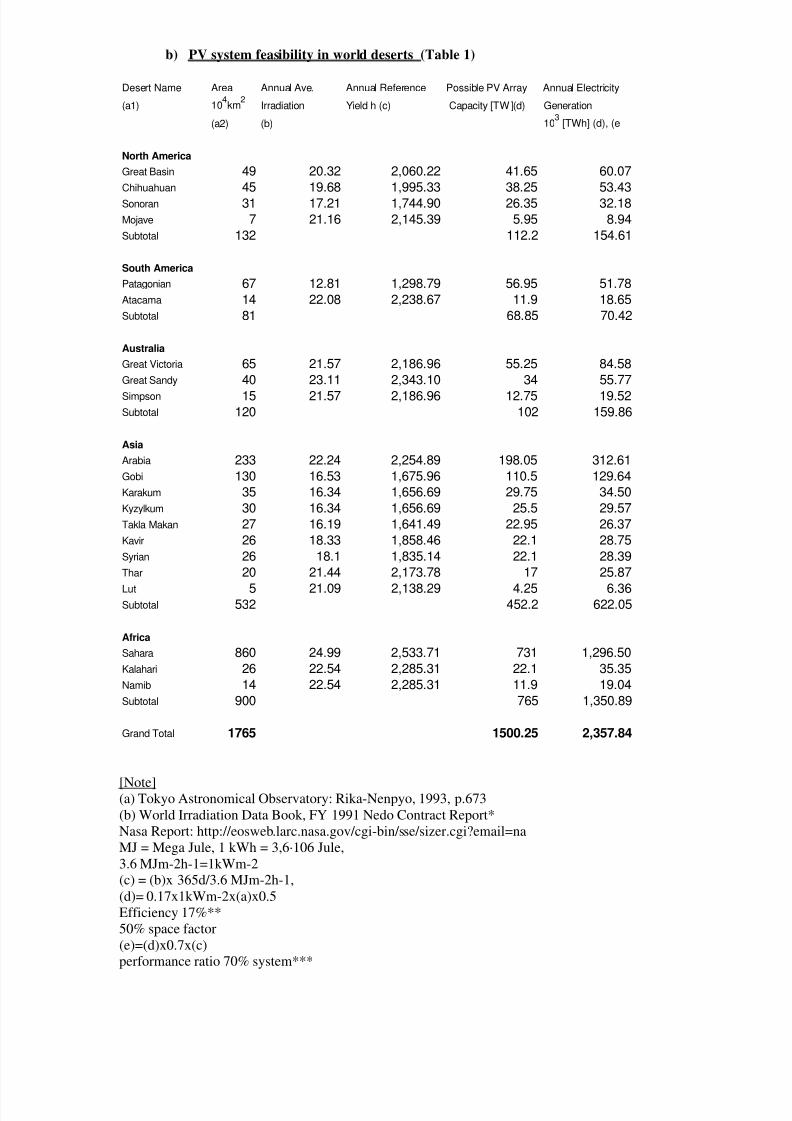
b) PV system feasibility in world deserts (Table 1)
Desert Name Area Annual Ave. Annual Reference Possible PV Array Annual Electricity
(a1) 104km
2Irradiation Yield h (c) Capacity [TW ](d) Generation
(a2) (b) 103
[TWh] (d), (e
North America
Great Basin 49 20.32 2,060.22 41.65 60.07
Chihuahuan 45 19.68 1,995.33 38.25 53.43
Sonoran 31 17.21 1,744.90 26.35 32.18
Mojave 7 21.16 2,145.39 5.95 8.94
Subtotal 132 112.2 154.61
South America
Patagonian 67 12.81 1,298.79 56.95 51.78Atacama 14 22.08 2,238.67 11.9 18.65Subtotal 81 68.85 70.42
Australia
Great Victoria 65 21.57 2,186.96 55.25 84.58Great Sandy 40 23.11 2,343.10 34 55.77
Simpson 15 21.57 2,186.96 12.75 19.52Subtotal 120 102 159.86
Asia
Arabia 233 22.24 2,254.89 198.05 312.61Gobi 130 16.53 1,675.96 110.5 129.64Karakum 35 16.34 1,656.69 29.75 34.50
Kyzylkum 30 16.34 1,656.69 25.5 29.57
Takla Makan 27 16.19 1,641.49 22.95 26.37
Kavir 26 18.33 1,858.46 22.1 28.75
Syrian 26 18.1 1,835.14 22.1 28.39
Thar 20 21.44 2,173.78 17 25.87
Lut 5 21.09 2,138.29 4.25 6.36Subtotal 532 452.2 622.05
Africa
Sahara 860 24.99 2,533.71 731 1,296.50
Kalahari 26 22.54 2,285.31 22.1 35.35
Namib 14 22.54 2,285.31 11.9 19.04
Subtotal 900 765 1,350.89
Grand Total 1765 1500.25 2,357.84
[Note](a) Tokyo Astronomical Observatory: Rika-Nenpyo, 1993, p.673(b) World Irradiation Data Book, FY 1991 Nedo Contract Report*Nasa Report: http://eosweb.larc.nasa.gov/cgi-bin/sse/sizer.cgi?email=naMJ = Mega Jule, 1 kWh = 3,6·106 Jule,3.6 MJm-2h-1=1kWm-2(c) = (b)x 365d/3.6 MJm-2h-1,(d)= 0.17x1kWm-2x(a)x0.5Efficiency 17%**50% space factor(e)=(d)x0.7x(c)performance ratio 70% system***

8/4/2019 Solar Systems in the Desert
http://slidepdf.com/reader/full/solar-systems-in-the-desert 11/36
*Irradiation data is important to start a discussion about the potential of VLS-PV systems. TheJapan Weather Association (JWA) collected irradiation and air temperature data from everymeteorological organization in the world. Data items are monthly means of global irradiation,monthly means of ambient air temperature, and monthly means of snow depth. The data werecollected from 150 countries, from 1600 sites throughout the world available. Monthly globalirradiation was estimated form monthly sunshine duration where there were no irradiation data.
**Calculated for solar cell made of single-crystal silicon with 17% Efficiency
Efficiency is how much of the energy provided by the sun is transformed into electricity.In PV solar cells, made of silicon, positive and negative charge carriers flow freely when lightstrikes the surface of the cell (photoelectric effect), producing direct current (DC) which can thenbe used to power motors or charge batteries. If solar power is to be used by consumers with 110volt alternating current (AC), or if it shall be directly fed into the grid and ‘sold’ (grid coupling),then an inverter is needed.
Efficiency of a solar cell made of single-crystal silicon: about 24 % (laboratory) and 14 to 17 % (production)Efficiency of a solar cell made of polycrystalline silicon: about 18 % (laboratory) and 13 to 17 %(production)Efficiency of a solar cell made of amorphous silicon: about 13 % (laboratory) and 5 to 7 %
(production)Efficiency of a solar cell made from CIS thin film technology: about 13 % (laboratory) and 8 to10 % (production)30.4% sunlight-to-grid conversion efficiency is the current world's record for commercial solargeneration equipment
***Performance Ratio:
Within the realm of Photovoltaic, the term “performance ratio” refers to the relationship betweenactual yield and target yield. The performance ratio of a photovoltaic system is the quotient of alternating current (AC) yield and the nominal yield of the generator’s direct current (DC). Itindicates which portion of the generated current can actually be used. A photovoltaic system witha high Efficiency can achieve a performance ratio over 70 %. The performance ratio is also often
called the Quality Factor (Q). A Solar Module based on crystalline cells can even reach a qualityfactor of 0.85 to 0.95 (performance ratio = 85 - 95 %).
This Chart indicates the PV Potential per continent. As you can see Africa has by far the highest
potential with a generation of 1300.00 in 103(TWH) (Figure 6.)
PV Potential in world deserts
0.00
200.00
400.00
600.00
800.00
1,000.00
1,200.00
1,400.00
1,600.00
North A meric a South A merica A ustralia A sia A frica
Continent
G e n e r a t i o n i n 1 0
3 ( T W h )
Annual Electricity Generation

8/4/2019 Solar Systems in the Desert
http://slidepdf.com/reader/full/solar-systems-in-the-desert 12/36
World Changing writes about the potential for solar energy within Africa
"...solar has the potential to be a life-saver, providing clean energy in the remotest of
locations. With no moving parts, solar panels are harder to make but simpler and
cheaper to maintain than traditional diesel-powered generators, needing only
batteries to store the power accumulated over the course of a sunny
day...Photovoltaics are perhaps the ultimate in leapfrog energy systems. Solar can
be used anywhere the sun shines, without the ongoing expense of trucking in and
consuming fuel. While the maintenance of the systems isn't difficult, it providesopportunities for local business development..."
c) Very Large Scale Photovoltaic (VLS PV)
The size of a VLS-PV system may range from a few megawatts (MW) to many gigawatts (GW),consisting one plant, or an aggregation of many units that are distributed in the same district andoperate in harmony with each other.
The amount of electricity generated by VLS-PV systems can be considered significant for peoplein the district, the nation or for the entire region -- possible interconnecting several nations.
VLS-PV systems can be classified according to the following concepts, based on their location.
land based (arid to semi arid, deserts) water-based (near lakes orinternational waters) to assist in water pumping local options which enable distribution toremote villages in developing countries -- or evenlarge populations centers in developed nations
VLS-PV system in a desert area (Figure 7.)
IV) Realizing Large Scale PV in the desert / Genesis Project
The utility scale systems which have been installed to date are interconnected to the powernetwork, and support electricity demand growth during peak usage times. Masaru Yamano, ViceChairman of Sanyo Electric Co., made public a grand plan for building a network of solar powerstations dotting the deserts of western China, at around 40 degrees north latitude. The Silk RoadGenesis plan is projected to supply electricity to parts of China, neighboring countries and alsocontribute to enhanced development of the deserts: promoting greening, agricultural andindustrial development. This plan has been drafted by researchers from Sanyo Electric, ToshibaCorp, Takenaka Corp. and others. The blueprint calls for construction of solar power plants, each
with a capacity of 100 megawatts, at 139 locations. Ultimately forming a chain, running east towest - a few plants to be built at a time - between 2001 and 2020. Linked by high-voltagetransmission wires, they would form a network capable of supplying about 100 million kilowattsin 2020. As one station would cost some ¥10 billion (= $ 84 million) to build, total investmentwould run to about ¥23 trillion (= $ 200 billion) by 2020.
8/4/2019 Solar Systems in the Desert
http://slidepdf.com/reader/full/solar-systems-in-the-desert 13/36
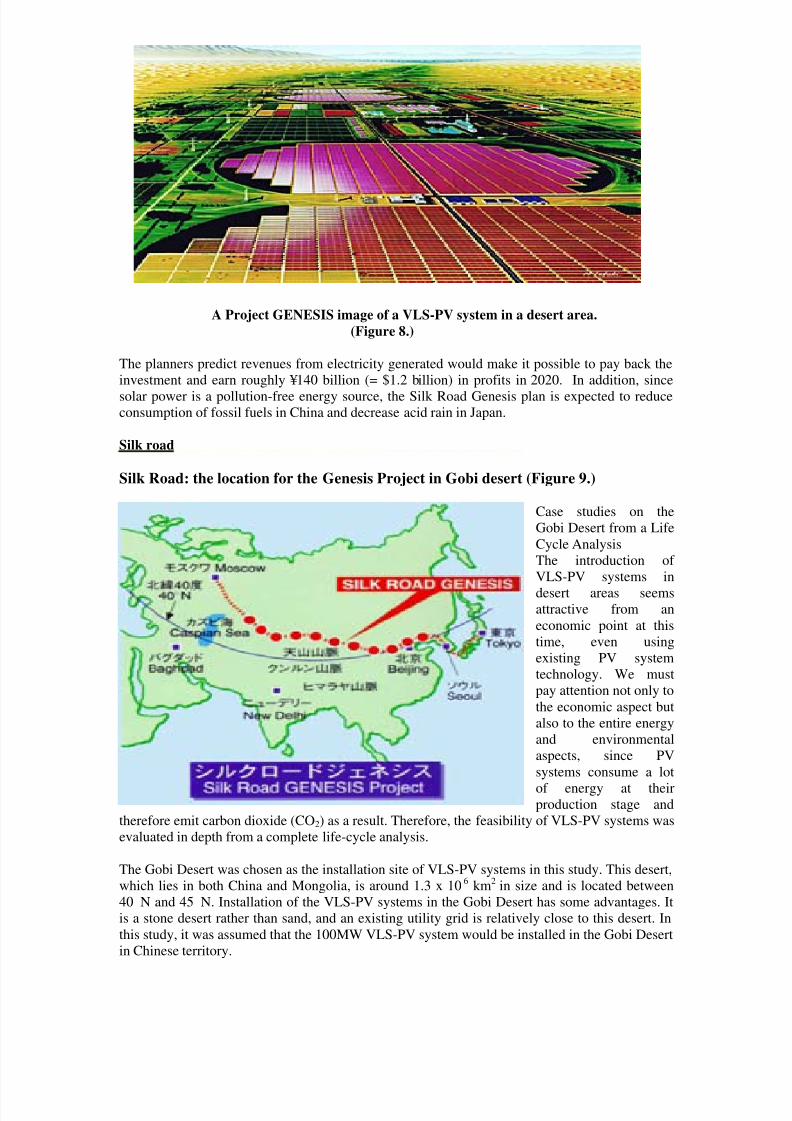
A Project GENESIS image of a VLS-PV system in a desert area.
(Figure 8.)
The planners predict revenues from electricity generated would make it possible to pay back theinvestment and earn roughly ¥140 billion (= $1.2 billion) in profits in 2020. In addition, since
solar power is a pollution-free energy source, the Silk Road Genesis plan is expected to reduceconsumption of fossil fuels in China and decrease acid rain in Japan.
Silk road
Silk Road: the location for the Genesis Project in Gobi desert (Figure 9.)
Case studies on theGobi Desert from a LifeCycle AnalysisThe introduction of VLS-PV systems in
desert areas seemsattractive from aneconomic point at thistime, even usingexisting PV systemtechnology. We mustpay attention not only tothe economic aspect butalso to the entire energyand environmentalaspects, since PVsystems consume a lot
of energy at theirproduction stage and
therefore emit carbon dioxide (CO2) as a result. Therefore, the feasibility of VLS-PV systems wasevaluated in depth from a complete life-cycle analysis.
The Gobi Desert was chosen as the installation site of VLS-PV systems in this study. This desert,which lies in both China and Mongolia, is around 1.3 x 10⁶ km2 in size and is located between40 N and 45 N. Installation of the VLS-PV systems in the Gobi Desert has some advantages. Itis a stone desert rather than sand, and an existing utility grid is relatively close to this desert. Inthis study, it was assumed that the 100MW VLS-PV system would be installed in the Gobi Desertin Chinese territory.
8/4/2019 Solar Systems in the Desert
http://slidepdf.com/reader/full/solar-systems-in-the-desert 14/36
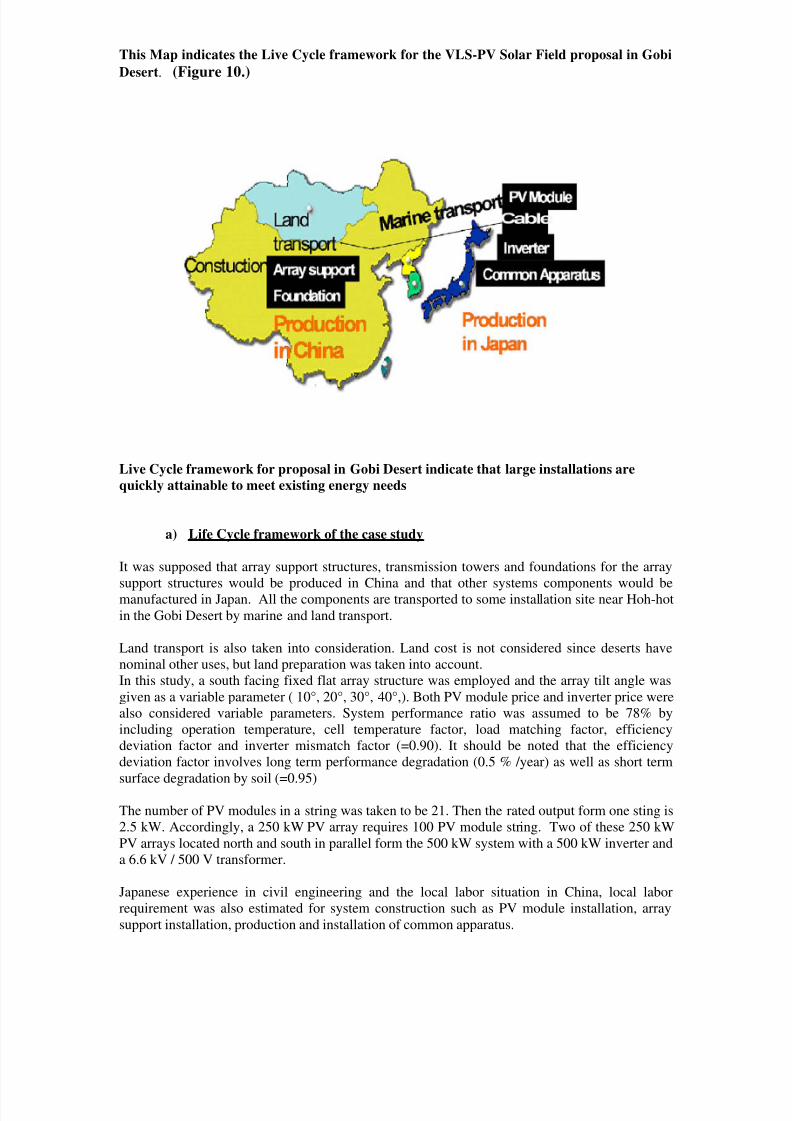
This Map indicates the Live Cycle framework for the VLS-PV Solar Field proposal in Gobi
Desert. (Figure 10.)
Live Cycle framework for proposal in Gobi Desert indicate that large installations are
quickly attainable to meet existing energy needs
a) Life Cycle framework of the case study
It was supposed that array support structures, transmission towers and foundations for the array
support structures would be produced in China and that other systems components would bemanufactured in Japan. All the components are transported to some installation site near Hoh-hotin the Gobi Desert by marine and land transport.
Land transport is also taken into consideration. Land cost is not considered since deserts havenominal other uses, but land preparation was taken into account.In this study, a south facing fixed flat array structure was employed and the array tilt angle wasgiven as a variable parameter ( 10°, 20°, 30°, 40°,). Both PV module price and inverter price werealso considered variable parameters. System performance ratio was assumed to be 78% byincluding operation temperature, cell temperature factor, load matching factor, efficiencydeviation factor and inverter mismatch factor (=0.90). It should be noted that the efficiencydeviation factor involves long term performance degradation (0.5 % /year) as well as short termsurface degradation by soil (=0.95)
The number of PV modules in a string was taken to be 21. Then the rated output form one sting is2.5 kW. Accordingly, a 250 kW PV array requires 100 PV module string. Two of these 250 kWPV arrays located north and south in parallel form the 500 kW system with a 500 kW inverter anda 6.6 kV / 500 V transformer.
Japanese experience in civil engineering and the local labor situation in China, local laborrequirement was also estimated for system construction such as PV module installation, arraysupport installation, production and installation of common apparatus.

8/4/2019 Solar Systems in the Desert
http://slidepdf.com/reader/full/solar-systems-in-the-desert 15/36
.b) Requirements to construct a 100 MW VLS PV system
Table 2 shows a summary of requirements to construct a 100 MW VLS PV system to be
built by nine people working in shifts 24 hours a day. (Table 2.)
Item Unit 10° 20° 30° 40°
Material requirement
PV module1
piece 840000 840000 840000 840000
PV module size m2
0.43 0.43 0.43 0.43
Cable m3
35235 37450 37406 41037
Foundation m3
46487 46487 69391 98801
Common apparatus
Inverter ( with transformer) set 202 202 202 2026.6 kv capacitor set 202 202 202 202
6.6 kv GIS2
set 4 4 4 4
110 kv/6.6kv transformer set 5 5 5 5
110kv GIS2
set 4 4 4 4
2.4 MVA Capacitor set 1 1 1 1
Common power board set 1 1 1 1
Transportation
Heavy oil consumption ton 145 145 147 148
Transmission
Cable km 134 134 134 134
Pylon(steel) ton 742 742 742 742
Foundation ton 1715 1715 1715 1715
Construction
Labour requirement man-year 2711 2752 2831 2911
1The number of PV modules in a string was taken to be 21. (output form one sting is 2.5 kW)
2geographic information system
Summary of total requirements for a 100 MW VLS-PV system in the Gobi Desert
Study Source:Energy from the desert, Editor Kosuke Kurokawa, Published by James & James LtdPhotovoltiac Power Systems Executive Committee of the International Energy Agency.Labor cost for the operation was estimated based on the assumption of a 100 MW VLS-PV system that wasbeing built 24 hours a day by nine persons working in shifts.
The annual labor cost for electrical engineering was assumed for these operators. Maintenancecost was also calculated based on actual results of a PVUSA project, that is the cost of repairparts was 0.084%/year of the total construction cost and labor for maintenance was one personper year.

8/4/2019 Solar Systems in the Desert
http://slidepdf.com/reader/full/solar-systems-in-the-desert 16/36
c) Potential of VLS - PV: Summary of the advantages
The advantages of VLS-PV systems are summarized as follows.
1. It is relatively easy to find suitable land around deserts for large energy production by PVsystems.2. Deserts and semi-arid lands are normally in isolated areas -- causing fewer NIMBY (not in my
backyard) issues.3. The estimated potentials of such areas could supply all world energy needs now and into thefuture as demand grows in the 21st century4. When large-capacity PV installations are constructed, a step by step development is possiblethrough utilizing the modularity of PV systems. According to regional energy needs, plantcapacity can be increased gradually. This offers a simpler energy path for developing areas.5. Even large installations could be developed quickly to meet existing energy needs.6. Remarkable contributions to the global environment can be expected through reduced CO 2 emissions.7. When a VLS-PV system is introduced to a region, other positive economic impacts may occur:such as technology transfer to regional PV industries, new employment and economic growth.
These advantages make it very attractive option and worthy of discussion regarding global energyrequirements of the 21st Century.
“if I where you, I would stop trying to make Saudi Arabia the oil capital of the world and make Saudi Arabia the energy capital of the world. You should take your cash
right now and go out and buy half the solar capacity in the whole world and you
should start at the equator. All the way around the equator and go north and southuntil you put solar power everywhere the weather will tolerate it. You will save the
planet, and get richer.”
Bill Clinton, speech in Saudi Arabia in
January 2006 to 400 business people from the
Persian Gulf.V) Cost trends
Although PV is currently at a disadvantage because of its high cost, PV has the best long termpotential because it has the most desirable set of attributes. The potential for a PV system canvary widely depending on a variety of factors -- including system size, location, customer type,grid connection and technical specifications. For example, for building-integrated systems(BIPV), the cost of the system will vary significantly depending on whether the system is part of a retrofit or is integrated into a new building structure. Another factor that has been shown tohave a significant effect on prices is the presence of a market stimulation measure, which canhave dramatic effects on demand for equipment in the target sector. The installation of PVsystems for grid connected applications is increasing yearly, however the grid-connected market
must still depend upon government incentive programs. The installed cost of grid connectedsystems varies widely in price depending on national support programs and labor costs incountry.
(Figure 11.) shows the component costs of PV system and module prices in the mainmanufacturing countries. Recently, these costs show a slight increase in some markets due to highdemand. Long term, there appears to be a continued downward cost curve.
One way to accelerate that trend is to step up the economies of scale for the typical PV plant.Today, the largest plant has a capacity approaching 100 MW/year. It would take such a plant 10years to produce enough equipment to match the power-generating capacity of one large sizedcoal fired power plant.

8/4/2019 Solar Systems in the Desert
http://slidepdf.com/reader/full/solar-systems-in-the-desert 17/36
Another path towards radically lower cost is technology step change. The technology in use todayis based on crystalline silicon. This is an inherently material intensive technology. It requiresbatch production methods in clean rooms and is now relatively mature. The great hope for thefuture lies with thin film technologies (and even a carbon based product), which are much lessmaterial intensive and sustainable for continuous production processes. They offer the potential toshift to lower cost production methods and higher output
The NREL (National Renewable Energy Laboratory) cost breakdown shows the fraction of thetotal module cost that goes into different module components. Both the PV Roadmap and the
NREL cost assumptions are based on grid-connected systems.
a) Solar PV System and Module Manufacturing Cost Breakdown
The NREL cost breakdown (Figure 11.)
As a result of this cost breakdown, we have cost information for 5 keys elements plusconstruction and installation.The “Module Solar Cells" consists of the actual solar cells, “Module Electrical Materials”
comprises the electrical connections within the module, and “Module Packaging” includes the topsurface, encapsulant, rear layer and frame. The “Inverter” group consists of the inverter. The“Balance of System” has the most components -- consisting of the batteries (where applicable),blocking diode, charge controller, circuit breakers and fuses, meter, switch gear, and wiring.
If there is a decision to bring electricity to the rural areas, then PV is already less
expensive than any other source. If you use special applications like for ventilation,
then solar modules from renewable is cheaper than combustion machines. If people in the developing countries would start to utilize Renewable Energy applications, which
do not cost more than conventional . . . then there is good development. But only if they
would start with this. And they should. This is only the introduction to a long process. If this introduction has stable bases, stable legal frameworks, then the speed will
become faster and faster. The slower steps are always the first steps.
Hermann Scheer, Member of the Bundestag, Member of theGerman House of Parliament, President of EUROSOLAR, General Chairman of the WorldCouncil for Renewable Energy
From an interview with Herman Scheer:
http://www.folkecenter.dk/en/articles/HScheer_aburja.htm

8/4/2019 Solar Systems in the Desert
http://slidepdf.com/reader/full/solar-systems-in-the-desert 18/36
b) Production costs
Production costs are decreasing steadily, and there could be even greater cost reductions with thesecond-generation production line now under construction. First Solar is pursuing a developmentpath that could result in production costs of less than $1 per Watt in high volumes. But this isonly the first step.
Manufacturing the modules represents approximately half the cost of PV power. Other cost
elements include the cost of mounting hardware and electrical components such as inverters, andlabor for installation.
All those elements add up to a typical "installed cost" of around $6 or more per watt today, of which roughly $2.50 is the cost of purchasing PV modules. Lowering PV production costs to $1per watt or less would be a significant achievement and help to improve PV electricity's cost-competitiveness, said NREL's Ken Zweibel. (Project Leader Thin Film PV).
The lowest cost is obtained by optimizing the watts obtained per square foot, the product cost persquare foot, the lifetime, and the installation costs. This means that the manufacturing cost andthe cost of raw materials become very important.
PV Industry Cost/Capacity (DOE/US Industry Partnership)
The graph shows continued progress toward decreasing costs of manufacturingand increasing production capacity. ( Figure 12.)
Further Information:
National Renewable Energy Laboratoryhttp://www.nrel.gov/features/02-04_solar_costs.html

8/4/2019 Solar Systems in the Desert
http://slidepdf.com/reader/full/solar-systems-in-the-desert 19/36
VI) Economic benefits “PV Roadmap”
The “PV Roadmap” is an industry led effort to assess the best mix of research and marketdevelopment supports to accelerate PV development. They predict that with a reasonable set of incentives the solar photovoltaic market in the U.S. could grow more than 30% per year over thenext 20 years, from 340MW of installed capacity to 9600 MW. An increase in PV installations of
this magnitude will produce substantial economic benefits for the states and regions that buildthese installations. Because PV technologies use more labor per MW installed than otherrenewable technologies, the direct job benefits to the regions that install systems are significant.Nevertheless, the economic benefits extend well beyond the immediate installation and evenbeyond the regions where the installations occur. A program of the size documented in the PVRoadmap will create a substantial, new demand for the components and sub-components that gointo a PV installation. In order to fully document the extent of the economic benefits offered bythe PV Roadmap plan the total economic stimulus must be mapped. Manufacturing accounts forthe largest portion of the cost of photovoltaics, and that manufacturing could occur in places otherthan the installation location, bringing economic benefits to other places in the country.
a) U.S. Solar Power Shipment, Installations and Employment (Table 3.)
2004 2010 2015 2020 2030 2050
Job growth in the U.S. -- solar PV could grow more than 30% per year overthe next 20 years, from 340MW of installed capacity to 9600 MW
The size of the potential PV market is used as an input to the REPP Job Locator model(Renewable Energy Policy Project) in order to determine the number and geographic distributionof the jobs created as a result of the Roadmap being pursued.
Here are the summary goals of that effort:• Total installed capacity will increase from 340 MW now to 9,600 MW by 2015.• This represents a $34 billion investment - $27 billion manufacturing and $7 billionfor construction and installation.• Direct employment will increase from 20,000 now to 62,000 by 2015.For comparison, if the PV Roadmap is not implemented and business-as-usual continues,baseline predictions show only 3,800 MW installed by 2015 and only 28,000 jobs

8/4/2019 Solar Systems in the Desert
http://slidepdf.com/reader/full/solar-systems-in-the-desert 20/36
b) Total Investment and Jobs Map
The analysis of the 9,260 MW development proceeds in three steps. The first step is to determinehow the total cost of the new PV development will flow into demand for the various systemcomponents. Next, identify the total demand among the regions of the country. Then allocate themanufacturing investment according to the number of firms in each region with the technicalpotential to manufacture PV components, and the installation costs according to the potential
demand for PV installations. Third, distribute the job allocation according to the same locationinformation for manufacturing and installation. This results in a geographic “map” of investmentand job location. This job allocation will often be determined by state incentive and/or subsidyprograms.
The US Investment and Job Map indicates the benefits of 9260 MW
Solar Energy. Direct employment will increase from 20,000 now to
62,000 by 2015. (Figure 13.)
By investigating thelocation of potential
PV componentmanufacturers andthe location of demand for PVinstallations, thisreport shows howeconomic benefitsfrom pursuing thePV Roadmap wouldflow into the states.While Californiaand Texas take a
large portion of theinvestment, the restis well distributedthroughout thecountry. All but 6states would receivemore than $100 million in investment. The PV Roadmap calculates that the number of jobs in PVwill increase from 20,000 now to 62,000 by 2015. A recent REPP study showed that for PV, 80%of these jobs are in manufacturing, and the other 20% in construction and installation. The totalemployment resulting from the PV Roadmap is spread among states based on the allocatinginvestment. These results indicate that investment in PV could provide economic benefit acrossthe country. The 20 states that would receive the most investment from PV account for 75% of the manufacturing jobs lost in the last 3½ years. The table below shows the top 20 states rankedby received investment, along with job loss demographics.

8/4/2019 Solar Systems in the Desert
http://slidepdf.com/reader/full/solar-systems-in-the-desert 21/36
It is also interesting to examine which states receive the most job
creation relative to the number of jobs lost since the dot.com bust.
The table examines the relative impact of job creation for the top 20 states (Table 4.)
Economic expansion of related industries
If the goals outlined in the PV Roadmap are pursued, the economic impact will spread far beyondthe current active firms. Companies currently engaged in manufacturing processes similar to themanufacturing of photovoltaic system components could potentially transfer their capabilities tothis new market. For example, a company that makes glass plate could potentially begin makingtop surface glass for PV modules; a silicon semiconductor company could begin making silicon
solar cells.
In order to take a look at the size and location of this potential market, REPP uses an approachbased on the North American Industrial Classification System, or NAICS, which the U.S.Census Bureau adopted in 1997. The results of this study indicate that 10,179 firms, locatedacross all 50 states, operate in industries similar to the manufacturing of PV components.
VII) Silicon Feedstock Shortage
China's enormous shortage of polysilicon will become the bottleneck for the solar photovoltaicenergy industry explosion in the coming years. This was stated in the recently released annualreport, Semiconductor -- China's Solar Energy Market Annual Report 2005-2006
This has become the bottleneck to hinder the rapid development of the solar PV energy industry.Additionally, the rather high capital and technical requirements of polysilicon projects, onlymining productivity beyond one thousand tons of silicon can be economically effective andcompetitive.The gap between demand and supply is huge in China. The total demand in 2005 was 2,825 tonswhile the supply was only 130 tons. Currently PV is growing about 50% per year. Since thisgrowth is faster than anticipated, a temporary shortage in silicon feedstock has occurred. Whilethis situation is not unprecedented, the European Photovoltaic Solar Energy Conference reportedon a number of efforts to overcome the situation in the short, mid and long term. Supplies of newsolar grade Si, China's low-cost labor will make it a world contender in turning raw silicon(pictured here) into solar modules for the global market.

8/4/2019 Solar Systems in the Desert
http://slidepdf.com/reader/full/solar-systems-in-the-desert 22/36
Silicon: The bottleneck for the solar photovoltaic energy industry(Figure 14.)
Capacities are projected to meet theadditional material requirements by2007/08. Whether the quantitiesenvisaged will be sufficient to
resolve the bottleneck of requiringmore than 12,000 metric tons of Sifor producing more than 1000 MWof crystalline PV modules remainsto be seen at the next European PVconference in 2006.
a) Chinese manufacturing cost advantages
In addition to labor costs that can be less than $200/month per worker, Chinese solar companiesalso benefit from lower SG&A (Sales, General and Administration or 'cost of doing business')Research & Development, peripheral costs, and tax rate. There is also an expanding solarmanufacturing equipment industry that provides equipment at a fraction of the cost of equipmentmade overseas.
The current generation of Chinese manufactured solar equipment includes module lamination,wafer etch/bath, and mono-crystalline wafer pullers (~$150,000 each). Also there is a growing listof lower cost wet-chemistry suppliers for slurry and aluminum paste. Chinese manufacturinglines tend to be more labor intensive and use more domestic equipment, requiring substantiallylower capital expenditure.
In particular, the Chinese module lines do not run automated assembly equipment and insteadfavor an all-labor approach; the only equipment required are laminators and module testers.Three Chinese polysilicon manufacturers dominate the domestic landscape. Sichuan Xinguang isstill under construction with initial production in 2007, and 2008 planned capacity of 1,250 metrictons. LSCS now has capacity of ~300 tons, and plans 2007 capacity of 1,000 metric tons. ESMcurrently has annual polysilicon production of ~100 tons. Domestic poly production will notaddress near-term poly needs, as most production will not come online until 2008. Spot virginpoly prices are now as high as $200/kg, and many Chinese solar OEMs will happily pay $170/kgto secure poly. High-grade scrap (ingot tops and tails) command $150/kg, while lower end scrap(pot scrap) can command $50-$70/kg. All solar companies are using a mix of scrap and virginpoly to keep their blended poly cost at ~$130/kg. Several Chinese solar companies, inanticipation of a future capital market transaction, have been stockpiling poly in the order of hundreds of metric tons.
Sources:www.renewableenergyaccess.com
20th European Photovoltaic Solar Energy Conference, 6 - 10 June 2005, Barcelona, Spain
http://www.greenjobs.com
Zhao Yuewang, analyst from Analysys International.
Additional information about Silicon Technology, visit the Silicon Technology center at:
http://www.dowcorning.com/content/sitech/

8/4/2019 Solar Systems in the Desert
http://slidepdf.com/reader/full/solar-systems-in-the-desert 23/36
b) Alternatives to Silicon Crystalline Cells
Solar’s Thin Film and Nanotech Revolution
One scientific discovery of the computer semiconductor industry also has great potential in thephotovoltaic (PV) industry: thin-film technology. The "thin film" term comes from the methodused to deposit the film, not from the thinness of the film: thin-film cells are deposited in verythin, consecutive layers of atoms, molecules, or ions. Thin-film cells have many advantages overtheir “thick film” counterparts (polycrystalline cells). For example, they use much less material—the cell's active area is usually only 1 to 10 micrometers thick, whereas thick films typically are100 to 300 micrometers thick.
Also, thin-film cells can usually be manufactured in a large-area process, which can be anautomated, continuous production. Several different deposition techniques can be used, and all of them are potentially less expensive than the ingot-growth techniques required for crystallinesilicon. Thin film photovoltaic solar cells represent the most promising technology for reducingthe cost of solar electrical systems. This technology has the potential to provide low cost solarpower by using non-silicon solar cells, low cost plastic substrates and through currentlyavailable, high volume and inexpensive manufacturing techniques.
The promise of thin film photovoltaics has always been evident. The promise of solar
nanotechnology has recently received significant attention. But neither of these technologies hasyet to become a major player in the global market. With global silicon constraints driving anintensive search for alternatives, the day of thin film and/or nanotechnology may have finallycome. One of the leading technology companies, DayStar, commercially sells non-silicon thinfilm Copper Indium Gallium diSelenide (CIGS) cells that are deposited, rather than printed, on astainless foil.
Thin film amorphous (not crystalline) silicon cells made with a roll to roll process on a stainlesssubstrate are available commercially now. The next generation thin-film cells are based on non-silicon semiconductors, which can absorb the same amount of sunlight as crystalline Silicon butin layers that are at least two orders of magnitude thinner, saving tremendous material costs.
These thin film photovoltaic cells consist of layers of a semiconductor material such as CIGS,Copper Indium diSelenide (CIS) or Cadmium Telluride (CdTe), and applied to a low-costsubstrate, such as plastic. The economic benefit of thin film PV cells is that they use much lesssemiconductor material than the crystalline silicon cells, a lower cost substrate and can use muchless costly manufacturing methods. Thin film cell manufacturers do not talk about price of theirproducts as the products are generally not available to the consumer market, except in somespecialized applications.
By comparison, DayStar is planning on having lower cost, higher volume continuous productionfacilities operating by the end of 2006 which should reduce their costs to about $2.00 per watt.They also project that in full scale production they can reduce costs to $1.00 per watt. This isbased on sales of $18 million for 5.6 MW of panels for the quarter ending June 2005.
The ability to "print" (solution-coat) the most expensive layers of a solar cell onto a low-cost,lightweight, flexible plastic substrates is what makes it possible to reduce manufacturing costs.Printing processes are simple and robust in comparison with other thin-film deposition techniquesand enable unprecedented process throughput with roll-to-roll production methods. This processmakes it possible to produce solar cells that can deliver as much energy and life expectancy asconventional silicon cells and achieve unprecedented cost and production volume advantages.This results in price competitive photovoltaic cells even though the efficiency of thin film cells isless than for crystalline silicone cells.

8/4/2019 Solar Systems in the Desert
http://slidepdf.com/reader/full/solar-systems-in-the-desert 24/36
DARPA (Defense Advanced Research Projects Agency) in conjunction with the U.S. Departmentof Energy's National Renewable Energy (NREL) held a competition to select contractors toconduct further development of thin film PV cells. More than 100 leading technology companiescompeted under this procurement process, with four of them making the final cut and contracts
being awarded to: Nanosolar ($10.3million), Konarka ($6.1 million),Nanosys ($2.3 million) and NREL.By coating or printing photoactivematerials onto a flexible plastic
substrate, energy can be absorbedfrom both the sun and indoorlight. In particular, this technologyhas the potential to provide low costsolar power through currentlyavailable, high volume andinexpensive manufacturingtechniques based on conventionalfilm based processes such as roll toroll manufacturing. To develop theirnanotechnology-enabled solar cellsthey are collaborating with several
United States government agencies.
(Figure 15.)
Non-silicon solar cells: "these cells are cost-effective (1/3 cost of traditional solar)". Howard Burke, President, Konarka
Konarka develops and produces a unique, carbon-based, light-activated power plastic (thin film
solar cells) that are inexpensive, lightweight, flexible and versatile. This material makes itpossible for devices, systems and structures to have their own low-cost embedded sources of renewable power. By integrating energy generation functionality into everyday devices, Konarkaallows manufacturers to offer truly wireless applications. Konarka's material is cost-effective (1/3
of traditional solar), lightweight (1 to 2 oz. per square foot), aesthetically appealing (can becolored and patterned), integrate-able (can be cut to fit), flexible and versatile so as not toincrease or otherwise impede the application's form factor.
Konarka's polymer photovoltaic materials are manufactured in a continuous roll-to-roll processthat is significantly less expensive and capital intensive than the multi-step assembly of traditional solar cells. This proven process, similar to photographic film, is simple, energyefficient, environmentally friendly, replicable to multiple plants and scalable to high volumes.
This technology seems to be moving in the right direction and unless there are unexpectedconstraints, or additional R & D challenges, they should have some substantial reductions in theprice of solar cells in the next few years. With at least four US companies competing, the
chances are good for more breakthroughs. One of the four is DayStar who is claiming their CIGScells on a stainless steel substrate can be produced for $1.00 per watt.
Sources:* National Renewable Energy Laboratory http://www.nrel.gov/news/press/2005/1805_quantum_dot.html References:"As solar gets smaller, it future gets brighter, Nanotechnology could turn rooftops into a sea of power-generatingstations" SDGate.com, 7/11/05Konarka Technologies, Inc., Lowell, MA, http://www.konarka.com/ "For Tech's Sake: Lightweight Solar Power for Mobile Users", Washington Technologies, 2/8/05Nanosolar, Inc, Palo Alto, CA, http://www.nanosolar.com/index.html Nanosys, Palo Alto, CA, http://www.nanosysinc.com/index.html Technology hones the efficiency of sun-powered energy systems. NRELEERE Solar Energy Technologies Program - Thin Films

8/4/2019 Solar Systems in the Desert
http://slidepdf.com/reader/full/solar-systems-in-the-desert 25/36
c) Self-Assembling' Solar Cells
The new photovoltaics are made from "organic" materials, which consist of small carbon-containing molecules, as opposed to the conventional inorganic, silicon-based materials. Thematerials are ultra-thin and flexible and could be applied to large surfaces. Scientists from theUniversity of Princeton, especially electrical engineering professor Stephen Forrest are designing,synthesizing and characterizing molecules that will self-organize from solution into coatingsabout 100 nanometers thick, or about one-thousandth the thickness of a human hair. Molecules inthe layer must be very highly ordered to efficiently transport electrical charge.
Made from "organic" materials (Figure 16.)
Structure is one of the keys to that transformation.Patterns of silicon and oxygen repeat over and overagain in the silicon crystals that comprisecommercially available solar panels.Most naturally occurring materials, called organics,do not repeat their patterns, but Pentacene does.Organic solar cells could be manufactured in aprocess something like printing or spraying thematerials onto a roll of plastic. The cells also could
be made in different colors, making them attractivearchitectural elements or they could be transparentso they could be applied to windows. The cellswould serve as tinting, letting half the light throughand using the other half to generate power. Becauseof these qualities, researchers have pursued organic
photovoltaic films for many years, but have been plagued with problems of efficiency. The firstorganic solar cell, developed in 1986, was 1 percent efficient - that is, it converted only 1 percentof the available light energy into electrical energy. That number stood for about 15 years.
At present the organic versions have an efficiency of 4 percent, according to the
details of the study in the Nov. 29 issue of the journal of Applied Physics Letters,* ( see also at the figure below: Best Research cell Efficiency)
Researchers in are now planning to combine the new materials and techniques. Doing so couldyield at least 5 percent efficiency, which would make the technology attractive to commercialmanufacturers. With further commercial development, organic solar devices would be viable inthe marketplace with 5 to 10 percent efficiency, the researchers estimated. "We think we havepathway for using this and other tricks to get to 10 percent reasonably quickly".
Organic solar cells will be cheaper to make, so in the end the cost of a watt of electricity will belower than that of conventional materials. The technique the researchers discovered also opensnew areas of materials science that could be applied to other types of technology. Solar cells are
made of two types of materials sandwiched together, one that gives up electrons and another thatattracts them, allowing a flow of electricity. The Princeton researchers figured out how to makethose two materials mesh together, like interlocking fingers, so there is more opportunity for theelectrons to transfer.
According to the NREL the efficiency of thin film technologies is close to 16%. Compare the Best Research-Cell Efficiencies in Fig 17 below.
Further Information: U.S. Department of Energy Efficiency andRenewable Energy www1.eere.energy.gov

8/4/2019 Solar Systems in the Desert
http://slidepdf.com/reader/full/solar-systems-in-the-desert 26/36
The key to this advance was to apply a metal cap to the film of material as it is being made. Thecap allowed the surface of the material to stay smooth and uniform while the internalmicrostructure changed and meshed together, which was an unexpected result. The researchersthen developed a mathematical model to explain the behavior, which will likely prove useful increating other micromaterials.
(Figure 17.)
National Renewable Energy Laboratory National Center for Photovoltaics
Best ResearchBest Research--Cell EfficienciesCell Efficiencies
E f f i c i e n c y ( % )
University
of Maine
Boeing
Boeing
Boeing
BoeingARCO
NREL
Boeing
Euro-CIS
200019951990198519801975
NREL/Spectrolab
NREL
NREL
JapanEnergy
Spire
No. CarolinaStateUniversity
Multijunction ConcentratorsThree-junction (2-terminal, monolithic)
Two-junction (2-terminal, monolithic)
Crystalline Si Cells
Single crystal
Multicrystalline
Thin Si
Thin Film Technologies
Cu(In,Ga)Se2CdTe
Amorphous Si:H (stabilized)
Emerging PV
Organic cells Varian
RCA
Solarex
UNSW
UNSW
ARCO
UNSW
UNSW
UNSWSpire
Stanford
Westing-house
UNSWGeorgia Tech
Georgia Tech Sharp
AstroPower
NREL
AstroPower
Spectrolab
NREL
Masushita
Monosolar Kodak
Kodak
AMETEK
PhotonEnergy
UniversitySo. Florida
NREL
NREL
Princeton
UniversityKonstanz NREL
NRELCu(In,Ga)Se2
14x concentration
NREL
UnitedSolar
United Solar
RCA
RCARCA
RCARCA
RCA
026587136
Spectrolab
UniversityCaliforniaBerkeley
Solarex
12
8
4
0
16
20
24
28
32
36
http://www.nrel.gov/ncpv/thin_film/docs/kaz_best_research_cells.ppt * http://scitation.aip.org/dbt/dbt.jsp?KEY=APPLAB
CSC has the best cell efficiency with over 35 percent.
Further Information:
University of PrincetonDepartment of Electrical EngineeringProf. Stephen R. Forresthttp://www.ee.princeton.edu/people/Forrest.php

8/4/2019 Solar Systems in the Desert
http://slidepdf.com/reader/full/solar-systems-in-the-desert 27/36
VIII. Concentrating Solar Power (CSP)
300-900 MW Solar Project Planned for Southern California (Figure 18.)
The world's largest solar facility: The New Solar Energy Project Announced by SouthernCalifornia Edison and Stirling Energy Systems, Inc.
Edison International (NYSE:EIX) subsidiary Southern California Edison (SCE), the nation's
leading purchaser of renewable energy, and Stirling Energy Systems announced an agreementthat could result in construction of a massive, 4,500-acre, about 7 square miles solar generatingstation in the Southern California desert. When completed, the proposed power station would bethe world's largest solar facility, capable of producing more electricity than all other U.S. solarprojects combined. The 20-year power purchase agreement, which is subject to California PublicUtilities Commission approval, calls for development of a 300-megawatt (MW) solar project 70miles northeast of Los Angeles using innovative Stirling dish technology. The agreement includesan option to expand the project to 900 MW.
Planned for Southern California, the world's largest solar facility
Concentrating solar power (CSP) technologies can be a major contributor to our nation's future need for new, clean sources of energy, particularly in the West. A solar
dish farm covering 11 square miles hypothetically could produce as much electricity per year as Hoover Dam, and a farm 100 miles by 100 miles in the southwestern U.S.
could provide as much electricity as is needed to power the entire country.
National Renewable Energy Lab, 2005
Initially Stirling would build a one-MW test facility using 40 of the company's 37-foot-diameterdish assemblies. Subsequently, a 20,000-dish array would be constructed near Victorville, Calif.,during a phased four-year period. The utility-scale Stirling project would provide enough cleanpower to serve 278,000 homes for an entire year," said SCEC chairman John Bryson. "Edison iscommitted to facilitating development of new, environmentally sensitive, renewable energytechnologies to meet the growing demand for electricity here and throughout the U.S."
Source:
http://www.nrel.gov/csp/

8/4/2019 Solar Systems in the Desert
http://slidepdf.com/reader/full/solar-systems-in-the-desert 28/36
Although Stirling dish technology has been successfully tested for 20 years, the SCE-Stirlingproject represents its first major application in the commercial electricity generation field.Experimental models of the Stirling dish technology have undergone more than 26,000 hours of successful solar operation. A six-dish model Stirling power project is currently operating at theSandia National Laboratories in Albuquerque, New Mexico.
Tests conducted by SCE and the Sandia National Laboratories have shown that the Stirling dishtechnology is almost twice as efficient as other solar technologies. These include parabolictroughs which use the sun's heat to create steam that drives turbines similar to those found in
conventional power plants, and photovoltaic cells which convert sunlight directly into electricityby means of semiconducting materials like those found in computer chips.
a) SES Dish Stirling System Technology (Figure 19.)
The Stirling dish technology converts thermal energy to electricity by using a mirror array tofocus the sun's rays on the receiver end of a Stirling engine. The internal side of the receiver thenheats hydrogen gas which expands. The pressure created by the expanding gas drives a piston,crank shaft, and drive shaft assembly much like those found in internal combustion engines butwithout igniting the gas. The drive shaft turns a small electricity generator. The entire energyconversion process takes place within a canister the size of an oil barrel. The process requires nowater and the engine is emission free.
No water is required and the engine is emission freeon this SES Dish Stirling System showed above
89 mirror facets areattached to the frame bythree-point adjustingmounts at specificpoints on thesubassemblies. It isdesigned in fivesubassembly units for
ease of transport andinstallation on site. Twosmall motors, anazimuth drive and anelevation drive, areattached to the pedestaland programmed toswivel the dish on twoaxes, following thesuns progress across thesky during the day. Each morning, the system wakes up, putting it in position to greet the sun,rather like a robotic sunflower. At the end of the day, the system controller commands the
concentrator to tilt down into a “night-stow” position, with the engine at ground level.
Site preparation involves sinking a cement base with an imbedded pedestal to support the dish,with the subassemblies unloaded, bolted together and affixed to the pedestal by two workmen inabout four hours. No crane is required. When final alignment adjustments are made at the factory,the facets are locked into place before the system is shipped so as to eliminate the need foradjusting mirror facets at the site. The subassembly design permits units to be transported to aninstallation site by truck
Source:http://www.stirlingenergy.com/images.asp?Type=solar

8/4/2019 Solar Systems in the Desert
http://slidepdf.com/reader/full/solar-systems-in-the-desert 29/36
The Stirling engine, net solar-to-electric conversion efficiency reaching
30 percent. Each unit can produce up to 25 kilowatts of daytime power.
(Figure 20.)
The Stirling engine’scylinder block incorporates four sealedcylinder assemblies(pistons, piston rods, andconnecting rods domes)along with coolers,regenerators and heaterheads. Concentrated solarenergy heats up self-contained gas (hydrogen)in the Power Conversion
Unit, causing the gas toexpand into the cylinders,moving the cylinders andgenerating electricity.
There is a 90-degreetiming separationbetween adjacentcylinders and the workinggas is exchangedrepeatedly back and forthbetween the sameadjacent cylinders.This cycle is repeated over and over as the engine runs at a steady rate of 1,800 rpm (a low-stress,long duty-life regimen for a conventional gasoline engine).
Unlike familiar auto or truck engines, Stirling engines do not rely upon internal combustion to
drive the pistons and rotate a crankshaft. In fact, there is no combustion at all. Power is generatedby heat transfer from the concentrated solar rays to the working gas in the engine’s heater head,which converts the heat energy into mechanical motion. This power runs the electric generator,which produces electricity with an output of 480 Volts and 60 Hertz, so it is already power-conditioned by the generator’s interface. The generator of each unit in a utility-scale project isconnected by underground wire to a small substation where the power can be transformed into ahigher voltage for more efficient transmission across the grid
SES management forecasts sales of its dish solar Stirling system outside the U.S. are likely tobe concentrated in Spain, the Mediterranean region, and Australia, because there is stronggovernment commitment to solar in these countries. In Spain, for example, there are Royal andParliamentary mandates providing price incentives of up to 20 cents per kilowatt-hour (kWh) for
solar-generated electricity. In the U.S., solar system sales are backed by incentives and/orrequirements for renewable energy technologies in place in several states, including Arizona,California, Connecticut, New Jersey, Pennsylvania, Nevada and Texas. With its superiortechnology, team and market timing, SES is ready to capitalize on these opportunities as theydevelop.
SES estimated that this project will generate, in addition to electricity, 3,000 to 5,000 jobs duringthe construction phase and about 100 to 200 jobs for operation and support of a 500-megawattplant. Including the replacement component manufacturing and all of the community supportrequirements, that somewhere between 350 and 600 on-going jobs will be needed at the site andrelated support.

8/4/2019 Solar Systems in the Desert
http://slidepdf.com/reader/full/solar-systems-in-the-desert 30/36
b) Trends sterling engine
The cost for each prototype unit is about $150,000. Once in production SES estimates that thecost could be reduced to less than $50,000 each, which would make the cost of electricitycompetitive with conventional fuel technologies.
A solar dish farm covering 11 square miles hypothetically could produce as much electricity peryear as Hoover Dam, and a farm 100 miles by 100 miles in the southwestern U.S. could provideas much electricity as is needed to power the entire country. (NREL estimate)
Another application could be to operate as stand-alone units in remote areas off the grid, such asthe Navajo reservation, and supply power to several homes or businesses.
Rendering of SES Dish Stirling Systemused to pump water and support agriculture (Figure 21.)
Stand-alone units have already beendemonstrated as an effective means of
pumping water in rural areas. Withdesertification already a serious problem,large scale Solar systems can slow andprevent deserts from spreading.
Desertification of the worldspreads 30 square meters everyday.
The Sahara Supposition is aproposal to try and Terraform theSahara Desert; to reclaim it for thebenefit of Humanity. Thissolar desert strategy will attempt toredress the balance.
The dish-Stirling system works at higher efficiencies than any other current solar technologies,with a net solar-to-electric conversion efficiency reaching 30 percent. Each unit can produce up to25 kilowatts of daytime power. One of the system’s advantages is that it is “somewhat modular,”and the size of the facility can be scaled up over a period of time. That is compared to atraditional power plant or other large-scale solar technologies that have to be completely builtbefore they are operational.
Sources:
http://www.sandia.gov/news-center/news-releases/2004/renew-energy-batt/Stirling.htmlhttp://www.stirlingenergy.com/solar_overview.htmhttp://www.analogzone.com/grnrept23.htm
8/4/2019 Solar Systems in the Desert
http://slidepdf.com/reader/full/solar-systems-in-the-desert 31/36
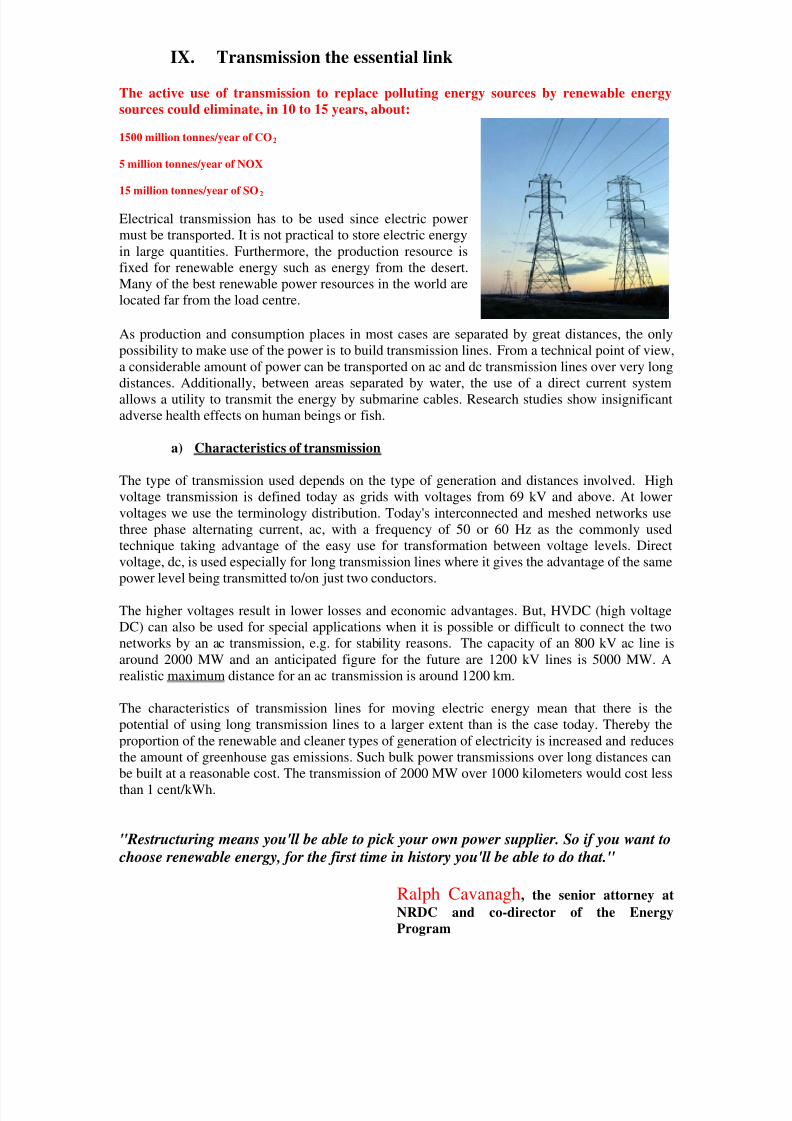
IX. Transmission the essential link
The active use of transmission to replace polluting energy sources by renewable energy
sources could eliminate, in 10 to 15 years, about:
1500 million tonnes/year of CO2
5 million tonnes/year of NOX
15 million tonnes/year of SO2
Electrical transmission has to be used since electric powermust be transported. It is not practical to store electric energyin large quantities. Furthermore, the production resource isfixed for renewable energy such as energy from the desert.Many of the best renewable power resources in the world arelocated far from the load centre.
As production and consumption places in most cases are separated by great distances, the onlypossibility to make use of the power is to build transmission lines. From a technical point of view,a considerable amount of power can be transported on ac and dc transmission lines over very longdistances. Additionally, between areas separated by water, the use of a direct current systemallows a utility to transmit the energy by submarine cables. Research studies show insignificantadverse health effects on human beings or fish.
a) Characteristics of transmission
The type of transmission used depends on the type of generation and distances involved. Highvoltage transmission is defined today as grids with voltages from 69 kV and above. At lowervoltages we use the terminology distribution. Today's interconnected and meshed networks usethree phase alternating current, ac, with a frequency of 50 or 60 Hz as the commonly usedtechnique taking advantage of the easy use for transformation between voltage levels. Directvoltage, dc, is used especially for long transmission lines where it gives the advantage of the samepower level being transmitted to/on just two conductors.
The higher voltages result in lower losses and economic advantages. But, HVDC (high voltageDC) can also be used for special applications when it is possible or difficult to connect the twonetworks by an ac transmission, e.g. for stability reasons. The capacity of an 800 kV ac line isaround 2000 MW and an anticipated figure for the future are 1200 kV lines is 5000 MW. Arealistic maximum distance for an ac transmission is around 1200 km.
The characteristics of transmission lines for moving electric energy mean that there is thepotential of using long transmission lines to a larger extent than is the case today. Thereby theproportion of the renewable and cleaner types of generation of electricity is increased and reducesthe amount of greenhouse gas emissions. Such bulk power transmissions over long distances canbe built at a reasonable cost. The transmission of 2000 MW over 1000 kilometers would cost less
than 1 cent/kWh.
"Restructuring means you'll be able to pick your own power supplier. So if you want to
choose renewable energy, for the first time in history you'll be able to do that."
Ralph Cavanagh, the senior attorney at
NRDC and co-director of the Energy
Program

8/4/2019 Solar Systems in the Desert
http://slidepdf.com/reader/full/solar-systems-in-the-desert 32/36
X. Energy source and market
The largest world desert regions are sometimes near existing transmission lines which make itpossible to more simply add renewable energy from the desert to these grids.
a) Gobi desert for China (Figure 22.)
The Gobi Desert can feed the energy demand of China by adding solar energy on a large scale to
the existing transmission lines. Transmission lines in Baotou, Jining, Hohot are very close to theGobi Desert. It is possible to add significant renewable solar energy on a large scale from theGobi Desert to this existing grid to supply the growing energy demand for China. It is alsopossible with the existing transmission lines to export energy to other countries like Vietnam,Japan and Korea .
Basic facts to China
China is set to overtake the US as the largest producer of greenhouse gases by 2025unless current trends are modified.
7 of the world's 10 most polluted cities are in China
Economic losses and health costs due to pollution alone are equal to 8% of China's GDP(source: the World Bank)
Acid rain in China is widespread, causing severe damage to crops and forests. Theparticulate cloud is now observed over Japan, the northern Pacific and North America
75% of China's energy production is currently from burning coal
Further information onhttp://www.wwfchina.org/english/
http://www.wwfchina.org/english/loca.php?loca=96
8/4/2019 Solar Systems in the Desert
http://slidepdf.com/reader/full/solar-systems-in-the-desert 33/36
The first approach for Gobi Desert
The World Wildlife Fund (WWF) is working to develop a large solar power plant, which wouldsupply power to Dunhuang city, Gansu province. Representatives from China’s National EnergyBureau, the solar energy industry, regional and local governments, and WWF recently met todiscuss the development of a demonstration project for an 8 MWp grid-connected solar PV
photovoltaics plant in the Gobi Desert, Gansu Province.
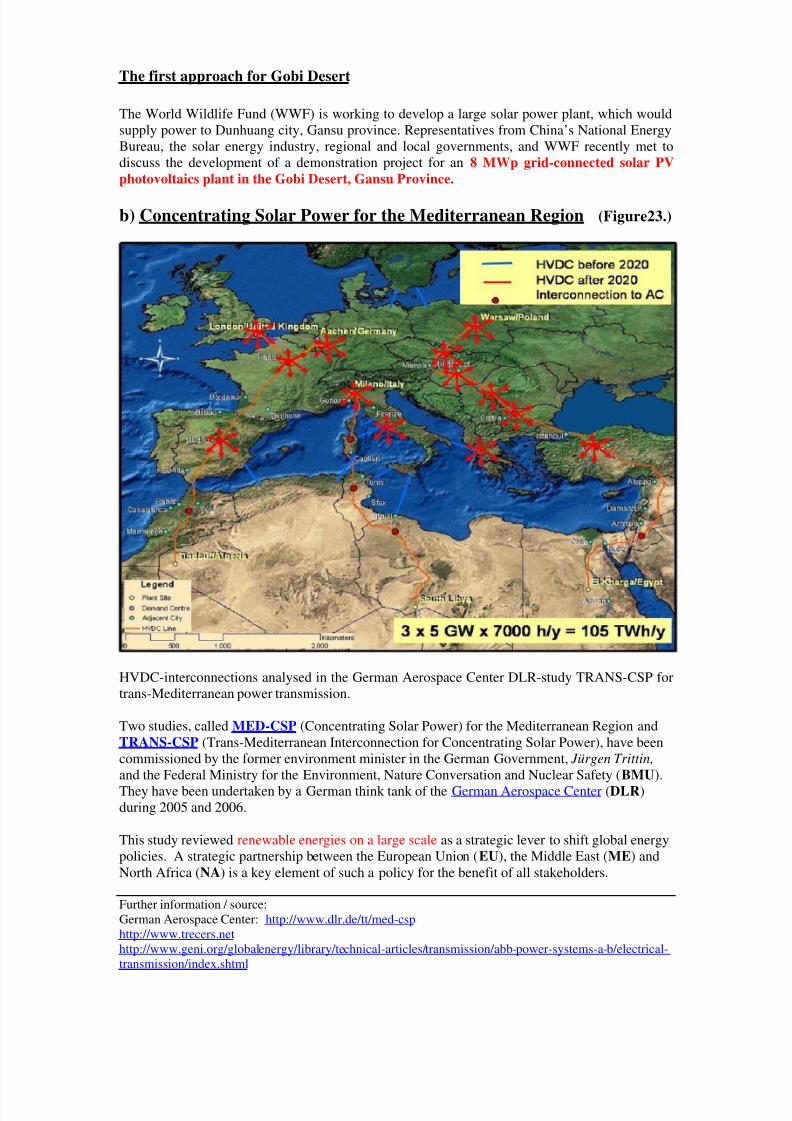
b) Concentrating Solar Power for the Mediterranean Region (Figure23.)
HVDC-interconnections analysed in the German Aerospace Center DLR-study TRANS-CSP fortrans-Mediterranean power transmission.
Two studies, called MED-CSP (Concentrating Solar Power) for the Mediterranean Region andTRANS-CSP (Trans-Mediterranean Interconnection for Concentrating Solar Power), have beencommissioned by the former environment minister in the German Government, Jürgen Trittin,
and the Federal Ministry for the Environment, Nature Conversation and Nuclear Safety (BMU).They have been undertaken by a German think tank of the German Aerospace Center (DLR)during 2005 and 2006.
This study reviewed renewable energies on a large scale as a strategic lever to shift global energypolicies. A strategic partnership between the European Union (EU), the Middle East (ME) andNorth Africa (NA) is a key element of such a policy for the benefit of all stakeholders.
Further information / source:German Aerospace Center: http://www.dlr.de/tt/med-csp http://www.trecers.net http://www.geni.org/globalenergy/library/technical-articles/transmission/abb-power-systems-a-b/electrical-transmission/index.shtml
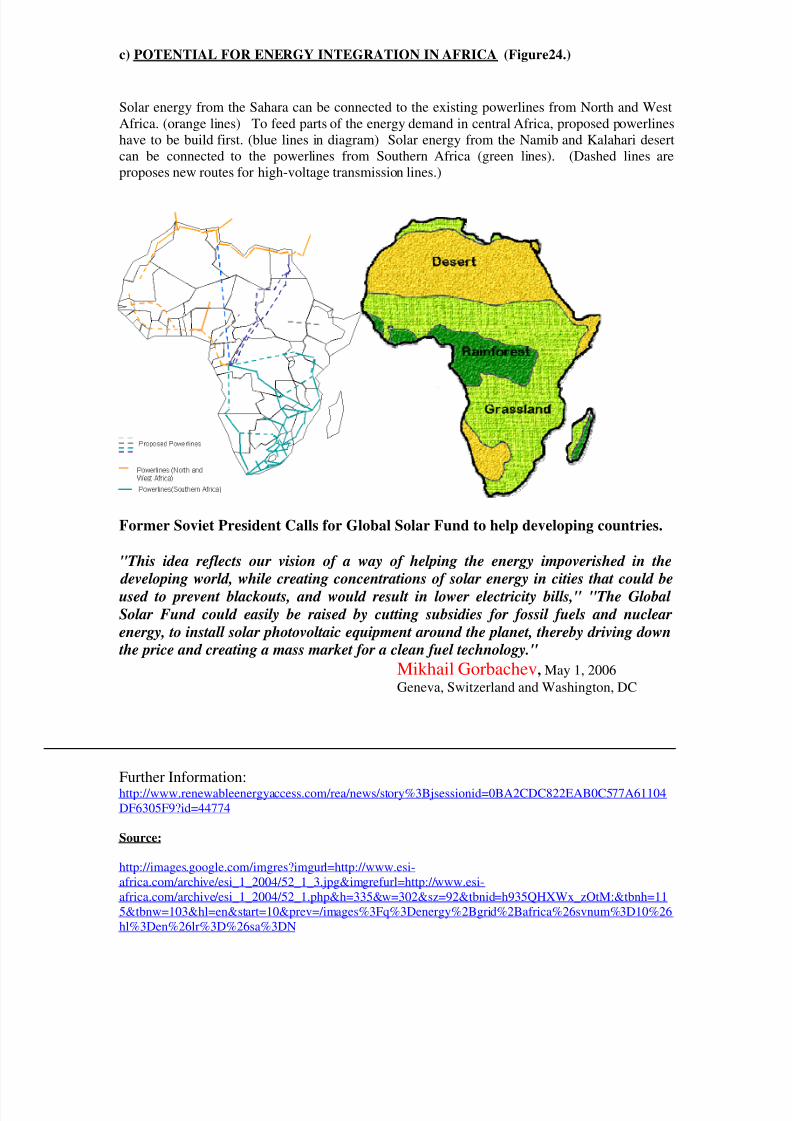
8/4/2019 Solar Systems in the Desert
http://slidepdf.com/reader/full/solar-systems-in-the-desert 34/36
c) POTENTIAL FOR ENERGY INTEGRATION IN AFRICA (Figure24.)
Solar energy from the Sahara can be connected to the existing powerlines from North and WestAfrica. (orange lines) To feed parts of the energy demand in central Africa, proposed powerlineshave to be build first. (blue lines in diagram) Solar energy from the Namib and Kalahari desertcan be connected to the powerlines from Southern Africa (green lines). (Dashed lines areproposes new routes for high-voltage transmission lines.)
Former Soviet President Calls for Global Solar Fund to help developing countries.
"This idea reflects our vision of a way of helping the energy impoverished in the developing world, while creating concentrations of solar energy in cities that could be
used to prevent blackouts, and would result in lower electricity bills," "The Global
Solar Fund could easily be raised by cutting subsidies for fossil fuels and nuclear
energy, to install solar photovoltaic equipment around the planet, thereby driving down the price and creating a mass market for a clean fuel technology."
Mikhail Gorbachev, May 1, 2006
Geneva, Switzerland and Washington, DC
Further Information:http://www.renewableenergyaccess.com/rea/news/story%3Bjsessionid=0BA2CDC822EAB0C577A61104DF6305F9?id=44774
Source:
http://images.google.com/imgres?imgurl=http://www.esi-africa.com/archive/esi_1_2004/52_1_3.jpg&imgrefurl=http://www.esi-africa.com/archive/esi_1_2004/52_1.php&h=335&w=302&sz=92&tbnid=h935QHXWx_zOtM:&tbnh=115&tbnw=103&hl=en&start=10&prev=/images%3Fq%3Denergy%2Bgrid%2Bafrica%26svnum%3D10%26hl%3Den%26lr%3D%26sa%3DN

8/4/2019 Solar Systems in the Desert
http://slidepdf.com/reader/full/solar-systems-in-the-desert 35/36
d) Mojave Desert for the US (Figure 25.)
The existing Power Lines are along the Mojave Desert. Solar energy form the Mojave Desert canbe added to this existing grid of the Western States without significant new investment.
Just 9% of Mojave Desert , a patch of 100 square miles of open space covered with
efficient solar panels, could power all the electricity needs of the US. National Renewable Energy Lab
Visionary engineer, R Buckminster Fuller, sums up the true potential of Very Large Scale
Solar Power from the Deserts in his provocative statement:
“There’s no energy shortage, there’s no energy crisis,
there’s a crisis of ignorance”
Source:
http://www.nrel.gov/solar/

8/4/2019 Solar Systems in the Desert
http://slidepdf.com/reader/full/solar-systems-in-the-desert 36/36
XI. Summary and Conclusion
Transforming the sun’s energy into electricity has evolved from providing power to satellites inspace, to remote off-grid village applications, and to plans for large scale systems in the world'sdeserts. Early schemes for large solar arrays showed the promise of abundant, clean energy. Yet,system costs and low conversion efficiencies kept solar power at the kilowatt scale for the past
three decades.
The potential solar resource from desert regions is truly astounding. Several studies show that theentire global electricity demand could be provided from just 4% of the world's deserts. Many of the grand schemes place large arrays around the equatorial regions with high-voltage transmissionlines delivering that energy to populated areas in the north and south.
Preventing such ideas were the costs of developing photovoltaic cells and the conversion devices.Now, annual industry growth rates of 20% per year and entry by major energy companies hasdriven costs down and efficiencies up.
Policymakers can assist the solar industry by cutting subsidies for fossil fuels and nuclear energy,
providing tax incentives to solar purchasers, thus driving down the costs and creating a massmarket for this clean fuel technology. For example, in the U.S., direct subsidies to nuclear energyamounted to $115 billion between 1947 and 1999 with a further $145 billion in indirect subsidies.In contrast, subsidies to wind and solar combined during the same period totaled only $5.5billion.
With energy demand projected to double in 30 years, mostly from developing nations, thebusiness-as-usual energy scenarios predict dire consequences for the planet. Growing CO2 concentrations in the atmosphere are driving climate change, and transitioning to carbon freeenergy sources is a prime solution. Large solar arrays in deserts (VLS PV and CSP) provide thelargest potential renewable energy resource to meet growing energy demands in a sustainablemanner.
High-voltage transmission grids can carry the electricity over thousands of kilometers fromregions with abundant solar radiation to our cities and industry. This paper offers severalexamples for the Gobi, Sahara and Mojave Deserts -- and utilities in Southern California are nowpursuing 300MW - 900MW VLS photovoltaic (PV) and concentrating solar power (CSP).
The benefits to millions of people through solar energy in desert regions is a sustainable way tosolve both environmental and social problems. We see that large solar power systems could oneday replace fossil fuels as the main energy source for society.