solar trends report for solar citizens -...
TRANSCRIPT

Solar Trends Report for Solar Citizens Authors: Mike Roberts, Jessie Copper, Anna Bruce, Tyce Barton, Navid Haghdadi and Rebecca Hu
Contents Highlights .........................................................................................................................................................2
Introduction ......................................................................................................................................................3
Australian Solar Trends .....................................................................................................................................4
Household PV Still Leads the Way .................................................................................................................4
Commercial and Large Scale Solar Is Catching Up .........................................................................................6
Leading Areas in SA and QLD are Pushing 50% Household Penetration with NSW Areas Emerging..................8
Solar Makes a Big Contribution to Electricity Supply and Emissions Targets ................................................... 10
How Much PV Can Australian Households Host?.............................................................................................. 12
PV Benefits for Different Types of Households .................................................................................................. 15
Solar Savings and Paybacks ....................................................................................................................... 15
Case Studies .............................................................................................................................................. 17
Penrith: North or West? ............................................................................................................................... 19
A young family with 2 school age children in a new development ................................................................ 19
Townsville: Is PV Suitable for Apartments? ................................................................................................... 22
2 young professionals living together in a multi-unit apartment building. ...................................................... 22
Boroondara: Solar for Retirees? ................................................................................................................... 24
A retired couple with a pool. ..................................................................................................................... 24
Case Study Comparison.............................................................................................................................. 26
Methods Used in the Report ............................................................................................................................ 28
Assessment of Residential PV Status ........................................................................................................... 28
PV Capacity and Potential........................................................................................................................ 28
Estimation of Dwelling growth................................................................................................................... 28
Assessment of Residential PV Potential ....................................................................................................... 28
Rooftop PV Potential Using the SunSPoT Tool .......................................................................................... 29
Case Study PV Modelling ............................................................................................................................ 30
Solar Outcomes Analysis for Case Studies................................................................................................ 30

2 | P a g e
APVI/UNSW Solar Trends Report for Solar Citizens
funded by Lord Mayor’s Charitable Foundation
Highlights • Australia leads the world in residential rooftop solar. 21.6% of all houses (excluding apartments)1
in Australia now have a PV system installed. Queensland and South Australia lead with more than 30% of houses having installed a PV system.
• Spatial analysis shows there is still a 43GW to 61GW opportunity for PV installations on Australia’s housing stock including up to 4GW on apartments.
• Distributed solar in Australia generates 8,900GWh of electricity per year, and growing. This is as much as is generated by the Liddell coal-powered plant in the same time.
• Australian homes and businesses investing in solar are contributing 7.4Mt CO2-e emissions abatement (a reduction in 4% of emissions from the electricity sector) towards our national emissions goals.
• Solar is an excellent investment for almost all Australian households, but there are a wide range of savings, depending on the characteristics of household electricity consumption, retail tariffs and roof characteristics. Nevertheless, the majority of households installing a wide range of PV system sizes under different types of tariffs can expect a payback of between 3-7 years.
1 Based on ABS census data for stand-alone and semi-detached houses, assuming 2011-2016 census growth ra tes continue through 2018.

3 | P a g e
APVI/UNSW Solar Trends Report for Solar Citizens
funded by Lord Mayor’s Charitable Foundation
Introduction Australian households have strongly supported solar photovoltaics (PV) over the past decade as a means to reduce their bills and emissions from electricity consumption, making Australia a world leader in household PV uptake. Increasingly businesses are also signing up to solar, both onsite and via power purchase agreements to buy renewable energy from utility scale solar farms. Distributed PV delivered 8,900 GWh and 7.4Mt CO2-e emissions abatement (4% of emissions from the electricity sector) across Australia in 2017-18.
The Federal government has thus far failed to commit to climate or renewables policy for the electricity sector beyond 2020. In this context, the actions of households installing small-scale PV, as well as State government renewable energy targets, and related policy instruments, are critically important for driving Australia’s transition to a lower emissions electricity sector.
In this report, we showcase the growth in solar across Australia, especially in the residential sector. We compare the progress of different states and highlight leading local government areas. While PV is an excellent investment for Australian households and residential uptake of PV has been strong, some groups of households have thus far been largely excluded from the benefits of PV, including those that live in apartments, renters and public housing tenants. In this report, we estimate the potential for PV on residential buildings across Australia, and highlight the untapped potential, including on apartment buildings. In some housing sectors, previously untapped potential is now being realised, with a number of the fastest growing solar areas being strongly supported by social housing solar programs. We analyse solar payback for hundreds of households, and focus in on three case study households that illustrate the impact of solar on different types of families living in different Australian climates, and explore how tariffs and installation decisions can affect the outcomes.

4 | P a g e
APVI/UNSW Solar Trends Report for Solar Citizens
funded by Lord Mayor’s Charitable Foundation
Australian Solar Trends Household PV Still Leads the Way Australia has the highest penetration of residential rooftop PV in the developed world2. Premium feed in tariffs (FiTs) (that were higher than the electricity retail price) for exported energy from PV systems interacted with dramatic price decreases to create a solar boom in Australian States from around 2010. As PV became increasingly cost-effective over this period, by mid 2013, FiTs were rapidly wound back to be close to the wholesale value of the exported energy, and much lower than the retail price. While being criticised by ACCC as a cross subsidy, the small scale incentive (SRES) component of the renewable energy target (RET) has continued to offer valuable support for those households investing in PV and emissions reductions and contributing to our national emissions goals and commitments under the Paris agreement.
Figure 1: Number of PV Systems Installed per Month by State 2008-2018
As PV prices have continued to fall, and with widespread concern over increasing household electricity prices, PV remains popular in all states, with rates of installation across the country steady over the past five years. 21.6% of all houses (excluding apartments)3 in Australia now have a PV system installed.
2 https://theconversation.com/factcheck-qanda-is-australia-the-world-leader-in-household-solar-power-56670 3 Based on ABS census data for stand-alone and semi-detached houses, assuming 2011-2016 census growth ra tes continue through 2018.
0
5000
10000
15000
20000
25000
2008 2009 2010 2011 2012 2013 2014 2015 2016 2017 2018
Num
ber
of N
ew In
stal
latio
ns
NSW ACT VIC QLD SA WA TAS NT

5 | P a g e
APVI/UNSW Solar Trends Report for Solar Citizens
funded by Lord Mayor’s Charitable Foundation
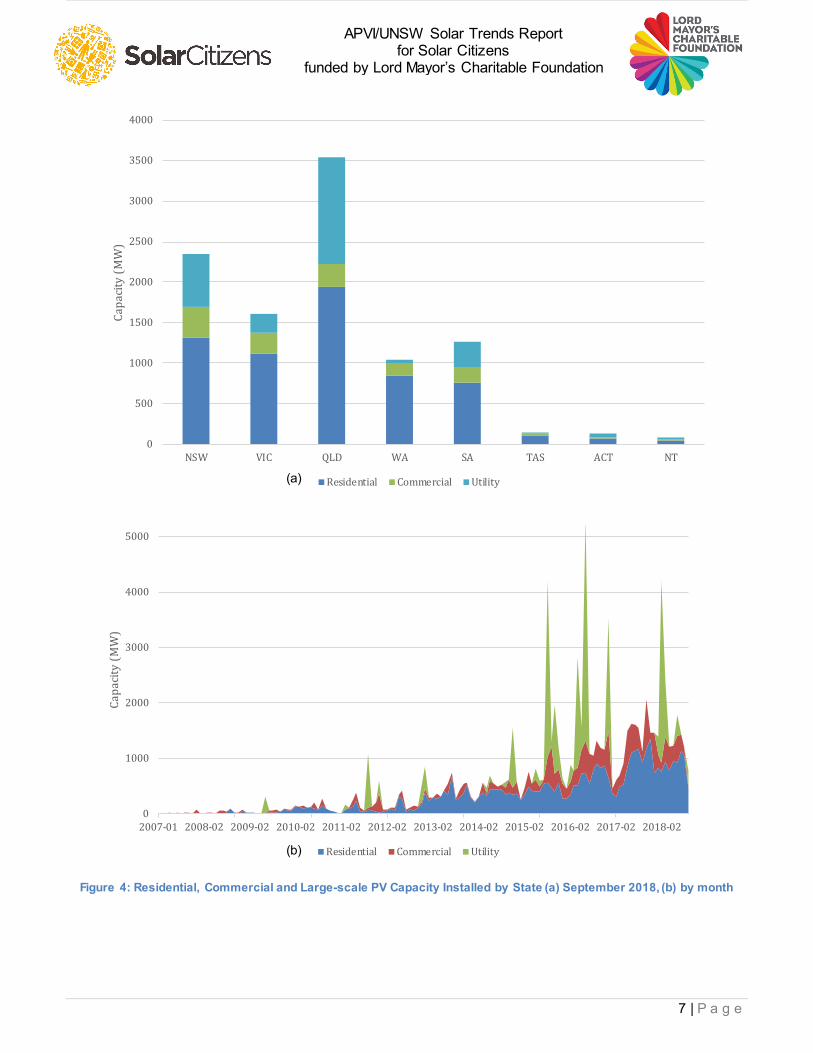
Households in Queensland and South Australia are leading uptake of solar with more than 30% of houses having installed a PV system (Figure 2), while Western Australians are also embracing solar, with over 25% of houses with a PV system. While the number of PV systems being installed is lower than the peaks of 2010-2013, households are also installing larger systems, so the overall capacity of residential PV systems being installed has been strong. The most popular system size range for households is now between 4.5-6.5 kW (Figure 4b).
The main reasons Australian households are installing PV are to reduce their bills, manage the risk of future electricity price rises, and increase self-sufficiency4. Most Australians also agree that the government should be doing more about climate change, and environmental concerns are the next most important reason for installing solar, after financial and self-sufficiency concerns.
Figure 2: Percentage of households by State with a PV system 5
4 https://theconversation.com/are-solar-panels-a-middle-class-purchase-this-survey-says-yes-97614 5 Household PV per dwelling installation rates are adjusted for dwelling growth as described in the method section. System s up to 10kW are normally considered by industry to be installed on residential buildings and those systems 10kW and above to be commercial.
0%
5%
10%
15%
20%
25%
30%
35%
2007 2008 2009 2010 2011 2012 2013 2014 2015 2016 2017 2018
QLD
SA
WA
NSW
VIC
ACT
TAS
NT

6 | P a g e
APVI/UNSW Solar Trends Report for Solar Citizens
funded by Lord Mayor’s Charitable Foundation
Commercial and Large Scale Solar Is Catching Up While residential PV accounts for 61% of installed PV capacity in Australia, in recent years, there has been extremely strong growth in the installation of commercial scale PV systems (10-100kW), with NSW leading this trend from late 2010, QLD and VIC commercial installations accelerating over the past few years and SA and WA also showing strong growth over the period. Commercial scale PV system prices have been decreasing as the industry scales up and gains experience in designing and installing systems of this size and many more businesses are now looking at solar to help manage increases in electricity bills.
Figure 3: Commercial PV Installations
Including residential, commercial and large scale (100kW) PV, there is now over 10GW of PV capacity in Australia6. Over recent months, we have seen very significant growth in large scale solar including large commercial/warehouse rooftop PV and utility-scale solar farms (Figure 4). After a long investment drought, blamed largely on the uncertain investment environment created by the policy vacuum since the axing of the carbon price, we are now seeing large numbers of solar farms constructed and approved. Support from ARENA and the Clean Energy Finance Corporation and State policies (e.g. ACT, QLD and VIC auctions) have been initially responsible for driving this boom, but corporates and government procurement programs now seeking to increase RE consumption are now also driving demand. Retirements of ageing coal plus enormous cost decreases have made utility PV a compelling investment, and developers are rushing to secure access to limited network capacity and take advantage of the remaining value in the RET. Given the long list of solar farms committed and proposed for the NEM7, solar farms and large scale rooftop arrays are likely to make up majority of PV capacity added in the coming years.
6 See http://pv-map.apvi.org.au/analyses. Note total installed capacity in the NEM is around 50GW (https://www.aemo.com.au/Electricity/National-Electricity-Market-NEM/Planning-and-forecasting/Generation-information) 7 https://www.aemo.com.au/Electricity/National-Electricity-Market-NEM/Planning-and-forecasting/Generation-information
0
2000
4000
6000
8000
10000
12000
14000
16000
18000
20000
2007 2008 2009 2010 2011 2012 2013 2014 2015 2016 2017 2018
Num
ber
of C
omm
erci
al In
stal
latio
ns 1
0-10
0kW
NSW QLD VIC SA WA TAS ACT NT
7 | P a g e
APVI/UNSW Solar Trends Report for Solar Citizens
funded by Lord Mayor’s Charitable Foundation
Figure 4: Residential, Commercial and Large-scale PV Capacity Installed by State (a) September 2018, (b) by month
0
500
1000
1500
2000
2500
3000
3500
4000
NSW VIC QLD WA SA TAS ACT NT
Capa
city
(MW
)
Residential Commercial Utility
0
1000
2000
3000
4000
5000
2007-01 2008-02 2009-02 2010-02 2011-02 2012-02 2013-02 2014-02 2015-02 2016-02 2017-02 2018-02
Capa
city
(MW
)
Residential Commercial Utility
(a)
(b)

8 | P a g e
APVI/UNSW Solar Trends Report for Solar Citizens
funded by Lord Mayor’s Charitable Foundation
Leading Areas in SA and QLD are Pushing 50% Household Penetration with NSW Areas Emerging Leading areas for household PV penetration (percentage of houses with a PV system) include areas around Brisbane and Adelaide, and increasingly regional areas (Figure 5).
Figure 5: Heat Map of Percentage of Houses with PV by LGA
Table 1 shows the top 10 LGAs by percentage of houses with a PV system installed. Mallala, just north of Adelaide with solar on almost half its estimated 3439 households, is the leading LGA nationally, while Somerset near Brisbane in SE Queensland and Narrabri in inland Northern NSW come in second and third.
Table 1: Top 10 LGAs by Household PV Penetration
Local Government Area State % of Households with PV
Mallala (DC) SA 47.4
Somerset (R) QLD 45.1
Narrabri (A) NSW 44.8
Lockyer Valley (R) QLD 42.9
Redland (C) QLD 42.6
Light (RegC) SA 42.5
Alexandrina (DC) SA 42.3
Scenic Rim (R) QLD 42.1
Orroroo/Carrieton (DC) SA 41.9
Barossa (DC) SA 41.8

9 | P a g e
APVI/UNSW Solar Trends Report for Solar Citizens
funded by Lord Mayor’s Charitable Foundation
Previous reporting of percentage of PV penetration has compared current PV installation data with census data collected in 2016, therefore not accounting for population growth and overestimating the percentage of homes with PV. The analysis presented here accounts for dwellings growth by assuming growth observed between the 2011 and 2016 censuses is maintained to the present. As well as more accurately estimating PV penetration, this also allows us to estimate the change in PV penetration over time.
While SA and Queensland households are still leading PV uptake, when we look at the growth in PV penetration, most of the top 10 LGAs are in NSW (Table 2). The area with the fastest growth in PV penetration is Brewarrina, west of Bourke in NW NSW. It seems likely that PV and Air Conditioning program of the NSW Government Aboriginal Housing Office is driving this growth. This program aims to provide air conditioning to improve thermal comfort and reduce related health risks in the challenging Western NSW climate, without increasing already high and often unaffordable electricity bills. Analysis of bills of participants in the program in Dubbo revealed solar is creating average annual savings of $590 (22%) off electricity bills8. Coming in at number 10 for household PV growth is Berri and Barerma in SA. Not only are households in the area rapidly getting on board with solar, but the Council is leading development of a 10MW solar farm, involving a PPA with a local winemaker9. The project is being supported by the SA Local Government Infrastructure Partnership, boosting the area’s PV capacity significantly.
Table 2: LGAs with the Fastest Change in Household PV Penetration
2018 % Houses with PV
2017 % Houses with PV
Change in Penetration 2017-2018 (%)
11200 Brewarrina (A) NSW 22.1 10.8 11.3
11150 Bourke (A) NSW 34.0 23.5 10.5
15300 Moree Plains (A) NSW 39.7 29.3 10.4
17950 Warren (A) NSW 35.2 24.9 10.3
11700 Central Darling (A) NSW 30.0 20.3 9.7
31750 Bulloo (S) QLD 26.3 17.2 9.1
17900 Walgett (A) NSW 30.4 21.9 8.5
15850 Narromine (A) NSW 38.0 29.8 8.2
10950 Bogan (A) NSW 28.1 20.5 7.6
40520 Berri and Barmera (DC) SA 38.1 30.5 7.6
8 Papdopoulos, A (2018), Distributed Energy Opportunities for Regional Aboriginal Communities in NSW, Honours Thesis, SPREE, UNSW 9 https://www.berribarmera.sa.gov.au/solarproject
10 | P a g e
APVI/UNSW Solar Trends Report for Solar Citizens
funded by Lord Mayor’s Charitable Foundation
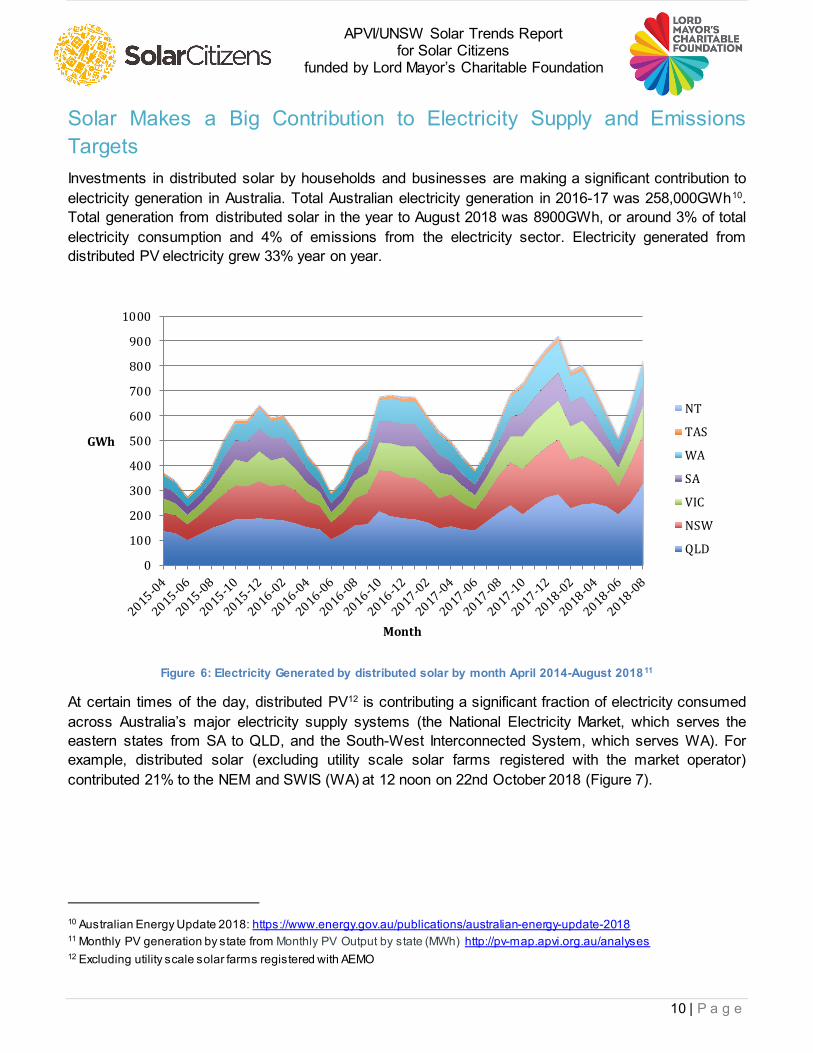
Solar Makes a Big Contribution to Electricity Supply and Emissions Targets Investments in distributed solar by households and businesses are making a significant contribution to electricity generation in Australia. Total Australian electricity generation in 2016-17 was 258,000GWh10. Total generation from distributed solar in the year to August 2018 was 8900GWh, or around 3% of total electricity consumption and 4% of emissions from the electricity sector. Electricity generated from distributed PV electricity grew 33% year on year.
Figure 6: Electricity Generated by distributed solar by month April 2014-August 201811
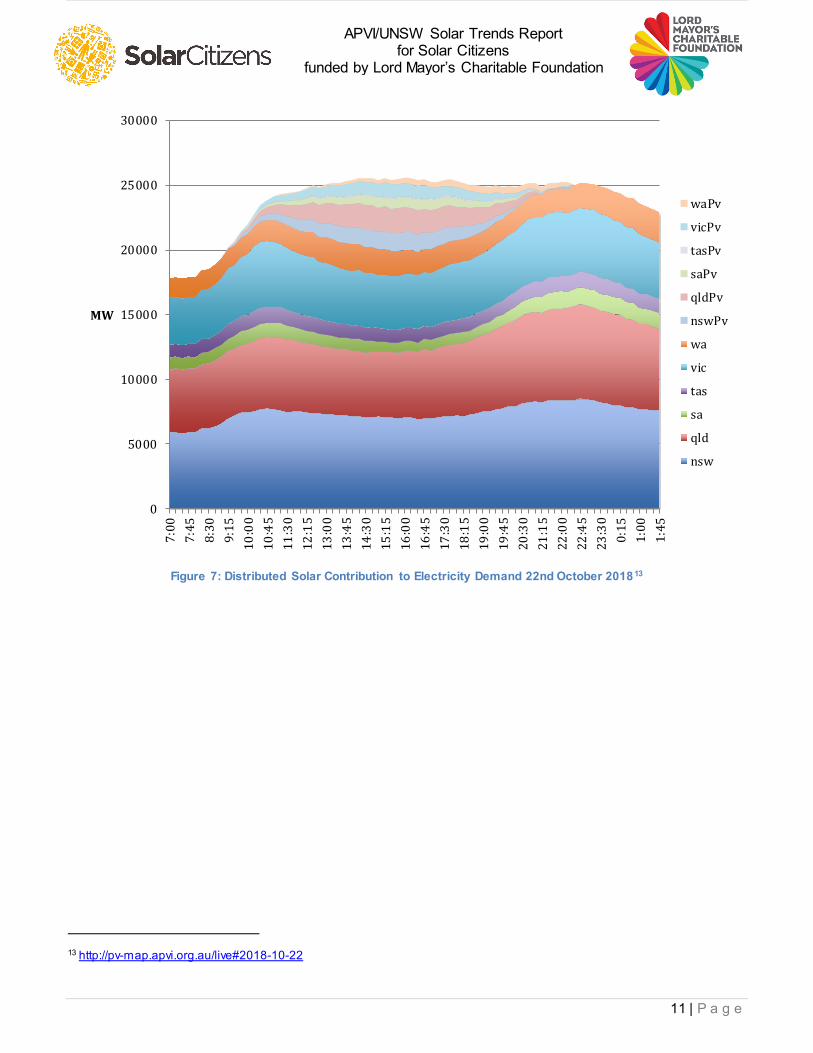
At certain times of the day, distributed PV12 is contributing a significant fraction of electricity consumed across Australia’s major electricity supply systems (the National Electricity Market, which serves the eastern states from SA to QLD, and the South-West Interconnected System, which serves WA). For example, distributed solar (excluding utility scale solar farms registered with the market operator) contributed 21% to the NEM and SWIS (WA) at 12 noon on 22nd October 2018 (Figure 7).
10 Australian Energy Update 2018: https://www.energy.gov.au/publications/australian-energy-update-2018 11 Monthly PV generation by state from Monthly PV Output by state (MWh) http://pv-map.apvi.org.au/analyses 12 Excluding utility scale solar farms registered with AEMO
0
100
200
300
400
500
600
700
800
900
1000
GWh
Month
NT
TAS
WA
SA
VIC
NSW
QLD
11 | P a g e
APVI/UNSW Solar Trends Report for Solar Citizens
funded by Lord Mayor’s Charitable Foundation
Figure 7: Distributed Solar Contribution to Electricity Demand 22nd October 201813
13 http://pv-map.apvi.org.au/live#2018-10-22
0
5000
10000
15000
20000
25000
30000
7:00
7:45
8:30
9:15
10:0
010
:45
11:3
012
:15
13:0
013
:45
14:3
015
:15
16:0
016
:45
17:3
018
:15
19:0
019
:45
20:3
021
:15
22:0
022
:45
23:3
00:
151:
001:
45
MW
waPv
vicPv
tasPv
saPv
qldPv
nswPv
wa
vic
tas
sa
qld
nsw

12 | P a g e
APVI/UNSW Solar Trends Report for Solar Citizens
funded by Lord Mayor’s Charitable Foundation
How Much PV Can Australian Households Host? We estimate there is potential for between 43GW and 61GW of PV installations on Australia’s housing stock. Most of this potential (93.5%) is on houses but between 2.8GW and 4GW is on apartment buildings14 (Figure 8). Although Australia leads the world in household PV, we have only fulfilled about 6GW of this residential PV potential. While 21.6% of stand-alone houses have a PV system, there are still almost 80% that are yet to install PV, while only a very small number of apartments currently have PV. In addition to the unrealised potential on dwellings without solar, many houses with PV could also host a larger system. Some roof surfaces are not well suited to solar because they face away from the parts of the sky with high solar radiation, or due to shading caused by surrounding buildings, trees or small obstructions on the roof. Our estimates, which are therefore based only on roof areas suitable for solar15 indicate that there is significant household solar potential remaining in Australia.
Figure 8: Estimated Existing and Potential Solar Capacity by State, adapted from (Roberts, Copper et al., 2018)
Although PV is an excellent investment for most Australian households, there are barriers to some households accessing solar, especially vulnerable energy consumers (who may have difficulty paying their bills), renters and those that live in apartments. Rented dwellings often do not have PV, since landlords, who would typically make the investment, cannot easily capture the benefits of reduced electricity bills, which flow to tenants.
Of course, it is vulnerable consumers who have the most to gain from solar and energy efficiency, which can significantly reduce electricity bills, lower the risk associated with future electricity price rises, and,
14 Roberts, M., Copper, J. & Bruce, A. (2018), Analysis of Rooftop Solar Potential on Australian Residential Buildings. Asia-Pacific Solar Research Conference, Sydney 2018. http://apvi.org.au/solar-research-conference/ 15 Including areas of no less than 10 contiguous m2, receiving a minimum 80% of the insolation on a horizontal unshaded surface (as detailed in the method).

13 | P a g e
APVI/UNSW Solar Trends Report for Solar Citizens
funded by Lord Mayor’s Charitable Foundation
for the most common sized system, typically pay for itself within 5 years16. Innovative business models that share the benefits between landlords and tenants are now being introduced to make solar more accessible to renters17. While 14% of Australian dwellings are apartments18, very few Australian apartment buildings currently have solar. Although solar to meet common property loads is technically relatively straightforward, the solar investment decision must be collectively made through a strata committee. To supply solar energy to individual apartments is even more complex since roof space is collectively owned by the body corporate under strata title, and decision-making must balance the priorities of owner-occupiers, landlords, tenants, and different types of households. Although state governments in Queensland and ACT have taken tentative steps to reduce the ability of individual apartment owners to obstruct installation of solar systems and other sustainability upgrades to apartment buildings, barriers remain. However, if these challenges can be overcome, embedded networks can be beneficial for apartments as they can allow aggregation of loads to maximise PV self-consumption and provide access to better retail offers19, although they do present administrative complexities. For smaller apartment buildings, innovative arrangements to share PV generation ‘behind the meter’ are emerging which may be simpler to implement.20
However, split incentives between owner-occupiers, landlords and tenants21, as well as between different household types can hamper collaborative approaches, while the regulatory framework of the Australian electricity system is focussed on customers engaging individually in the market rather than acting co-operatively to share energy resources. Although there is significant PV investment potential for apartments (Figure 9), especially those in 2-5 storey buildings, the barriers have thus far prevented most apartments from installing PV. Overall, Australian households have utilised less than a sixth of the potential residential rooftop potential.
Other potential solar solutions for those who don’t own their own roof include:
• Solar gardens – where customers buy a share of a solar farm and receive credits on their electricity bill for the energy generated, and
• Peer to peer energy trading - where householders with PV sell energy they generate but don’t need to their neighbours.
These models are used in other countries and are being trialled in Australia, but are currently hampered by the cost of using the electricity network to deliver the generated energy, even over short distances.
16 Bruce, A. (2018), Financial impacts of solar PV & Airconditioners on Australian households, CRC LCL National Forum 2018. 17 e.g. see Suntenants https://www.suntenants.com 18 ABS. Quick Stats. 29/10/2018; Available from: http://www.abs.gov.au/websitedbs/censushome.nsf/home/quickstats?opendocument&navpos=220
19 Roberts, M., Bruce, A., Magill, I., Collective Prosumerism - Accessing the Potential of Embedded Networks to Increase the Deployment of Distributed Generation on Australian Apartment Buildings, 2018 IEEE International Energy Conference (ENERGYCON) 20 e.g. see Allume Energy https://allumeenergy.com.au 21 Typically, the landlord would pay the capital cost of installing a solar PV system, but the benefit of reduced electricity bills flows to the tenant.

14 | P a g e
APVI/UNSW Solar Trends Report for Solar Citizens
funded by Lord Mayor’s Charitable Foundation
Figure 9: Estimated potential rooftop PV capacity for each state by type of dwelling, adapted from (Roberts, Copper et
al., 2018)

15 | P a g e
APVI/UNSW Solar Trends Report for Solar Citizens
funded by Lord Mayor’s Charitable Foundation
PV Benefits for Different Types of Households Solar PV allows customers to choose to generate energy on their own premises as an alternative to purchasing from the grid. Differences in roofs, local weather, and changing retail offers and tariff arrangements, can affect the impact of PV investments on bills. We assessed the impact of installing PV systems of different sizes on the bills of 300 households in the Ausgrid network area in NSW, and the payback times. We then created case study households in different parts of Australia to illustrate the impact of solar across households with different demographic and appliance ownership characteristics. These characteristics affect daily and seasonal electricity usage patterns and therefore the benefits of installing PV. For example, a retired couple will be home during the day and therefore have a different electricity load profile from a family with young children and parents that work during the day. Our case study households also occupy different building types to highlight the different challenges and opportunities. Overall, we find that despite the differences, solar creates significant savings for all household, PV and tariff combinations, with payback times typically 3-6 years.
Solar Savings and Paybacks Under the CEEM Tariff Tool project22, we assessed bills for 300 solar households in the Augrid area23. Solar savings from the PV systems including a range of different sizes from 2kW were modelled for each household under each of six different flat and time of use tariffs from the three large Australian electricity retailers – Origin, Energy Australia and AGL (Table 3).
Table 3: Tariffs for Solar Savings Modelling – Rates shown are pre-discount
Offer FiT All usage Daily supply Peak Shoulder Off peak Discount
c/kWh c/kWh c/day c/kWh c/kWh c/kWh %
Origin Flat 9.00 31.372 91.729
22%
Origin TOU 9.00
106.535 58.311 26.169 15.862 22%
EA Flat 12.50 32.285 92.51
12%
EA ToU 12.50
106.04 60.39 27.456 16.764 12%
AGL Flat 11.10 31.9 92.4
14%
AGL ToU 11.10
105.6 59.4 25.3 16.5 14%
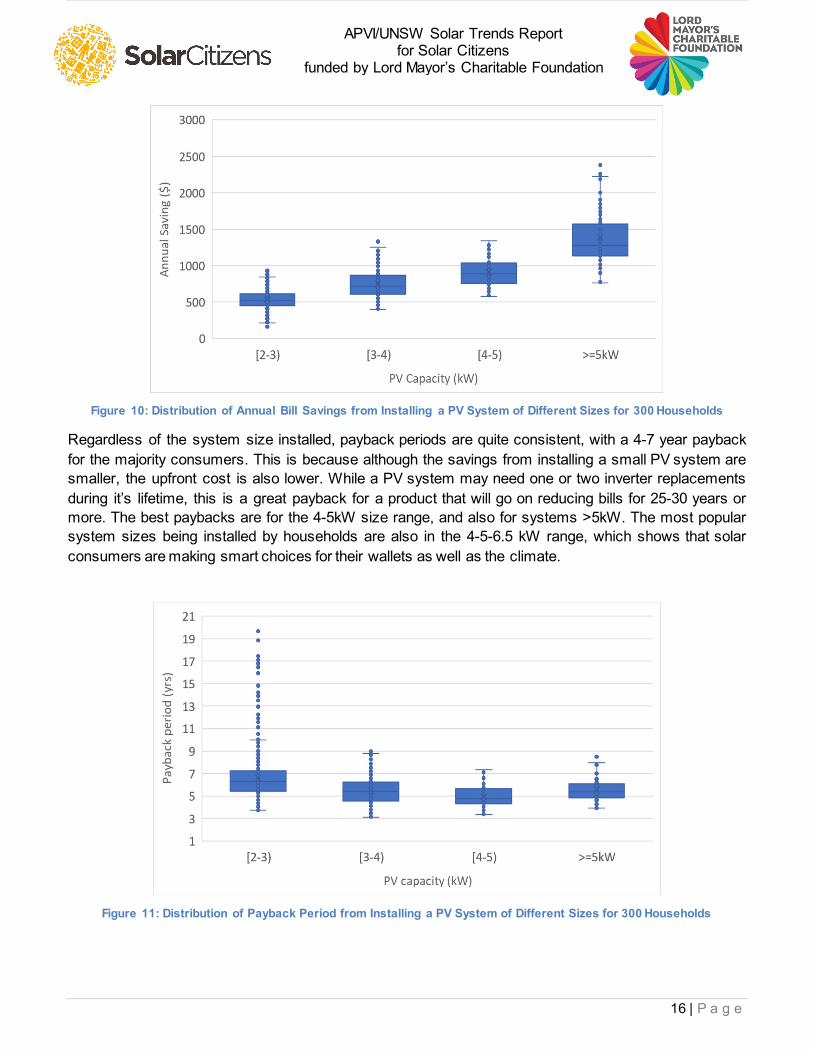
The results of the modelling are shown in Figure 10 and Figure 11. The annual savings for households that install the most popular system sizes of 4-6kW are around $900-$1200.
22 https ://www.researchgate.net/project/Tariff-Design-and-Analysis-TDA-Tool 23 From the Ausgrid 300 Solar Homes data set
16 | P a g e
APVI/UNSW Solar Trends Report for Solar Citizens
funded by Lord Mayor’s Charitable Foundation
Figure 10: Distribution of Annual Bill Savings from Installing a PV System of Different Sizes for 300 Households
Regardless of the system size installed, payback periods are quite consistent, with a 4-7 year payback for the majority consumers. This is because although the savings from installing a small PV system are smaller, the upfront cost is also lower. While a PV system may need one or two inverter replacements during it’s lifetime, this is a great payback for a product that will go on reducing bills for 25-30 years or more. The best paybacks are for the 4-5kW size range, and also for systems >5kW. The most popular system sizes being installed by households are also in the 4-5-6.5 kW range, which shows that solar consumers are making smart choices for their wallets as well as the climate.
Figure 11: Distribution of Payback Period from Installing a PV System of Different Sizes for 300 Households

17 | P a g e
APVI/UNSW Solar Trends Report for Solar Citizens
funded by Lord Mayor’s Charitable Foundation
Case Studies
Our case study households are:
• Penrith, NSW: A young family with 2 school age children in a new development.
• Townsville, QLD: 2 young professionals living together in a multi-unit apartment building
• Boroondara, VIC: A retired couple with a pool
To provide a sense of the context for the case studies, demographic information on the 3 Case Study areas from the 2016 census are shown in Table 4, and PV penetration is shown in Figure 12. While Boroondara has the highest median income, 27% higher than Penrith, it has the lowest PV penetration; Townsville has the highest PV penetration and the lowest median income. This reflects the growing body of evidence that middle and low income Australians are leading the adoption of residential solar.
Table 4: Demongraphic Profiles of Townsville, Penrith and Boondara24
24 ABS. Quick Stats. 29/10/2018; Available from: http://www.abs.gov.au/websitedbs/censushome.nsf/home/quickstats?opendocument&navpos=220

18 | P a g e
APVI/UNSW Solar Trends Report for Solar Citizens
funded by Lord Mayor’s Charitable Foundation
Figure 12: Changes in PV Penetration in the Case Study Areas
Under minimal export tariffs of around 8c/kWh compared to around 30c/kWh retail prices, the amount of energy exported is a significant determinant of the value of the energy generated and the payback time. We therefore assessed case studies with small and large PV systems, under different Solar FiT rates Table 5). Outcomes for each of the case study households if they installed a PV system were assessed by:
1. Modelling Rooftop PV output – Spatial analysis as described in the Method section of this report was used to determine the size, tilt, orientation and shading of the potential PV system, which was then modelled using weather data for the year matching the load data.
2. Creating Load Profiles for the Case Study Households - Load profiles with the appropriate demographic characteristics were selected from the Ausgrid Smart Grid Smart City (SGSC) data set. Using a machine learning algorithm previously developed by Barton (2017)25 these load profiles were transformed to reflect the weather of the case study locations.
3. Assessment of impact of PV system on Electricity Bills – Bills were calculated with and without PV under typical tariffs, including tariffs with high and low FiTs.
Table 5: Case Study Summary
Location Detail PV system size (kW) Solar FiT (c/kWh) System price ($)26
Townsville 3.25 9.4 4095
Boroondara 11 9.9 17600
Boroondara (High FiT) 11 20.0 17600
Penrith West 4 7.7 4080
Penrith West (High FiT) 4 20.0 4080
Penrith North 4 7.7 4080
Penrith North (High FiT) 4 20.0 4080
25 Barton, T. (2017), Impacts and Incentives of Residential Spot Electricity Pricing, Honours Thesis, SPREE UNSW 26 Prices from https://www.solarchoice.net.au/home-solar-system-prices
0%
5%
10%
15%
20%
25%
30%
35%
Penrith 16350
Townsville 37010
Boroondara 21110

19 | P a g e
APVI/UNSW Solar Trends Report for Solar Citizens
funded by Lord Mayor’s Charitable Foundation
Penrith: North or West?
A young family with 2 school age children in a new development Our Penrith case study household has recently bought into one of the many new developments in Penrith, one of the fastest growing LGAs in NSW. Similar to many of their neighbours, the family has two school age children, equal to the Penrith average.
(a) (b)
Figure 13: Penrith Case Study with (a) North-facing roof and (b) West-facing roof
We compared the outcomes if the family lived in a house with a predominantly North facing roof, facing the midday sun, or a predominantly West facing roof, facing the afternoon sun and able to capture the afternoon peak electricity pricing on a Time of Use (ToU) tariff. We modelled the same PV system on two houses in the same new development, one North facing and one West facing (Figure 14).
(a) (b)

20 | P a g e
APVI/UNSW Solar Trends Report for Solar Citizens
funded by Lord Mayor’s Charitable Foundation
Figure 14: Penrith Case Study Load and Solar (a) Summer and (b) Winter
Savings for the Penrith case study were calculated under two tariffs, one with a high solar FiT and one with a low FiT, shown in Table 6.
Table 6: Tariffs Used for the Penrith Case Study
Distribution Area
Retailer Offer Type
Discount included
(%)
Supply Charge (c/day)
Peak (c/kWh)
Shoulder (c/kWh)
Off peak (c/kWh)
Solar FiT
(c/kWh)
Endeavour Origin Standing Offer
15 93 38 31 17 8
Endeavour AGL Solar Savers
0 98 42 35 18 20
Table 7 summarises the key results for the Penrith household with solar, with West or North-facing solar. Table 7: Penrith Household Solar Modelling Inputs and Results
Location Detail Penrith West Penrith West (High FiT)
Penrith North
Penrith North (High FiT)
PV system size (kW) 4
Solar savings ($/year) 648 1185 691 1311
Simple Payback (years) 6.3 3.4 5.9 3.1
CO2 emissions reduction (kg/year)27 4343 4905
Equivalent Olympic swimming pools of CO2
reduction per year28
1.0 1.1
Average Summer Savings ($/day) 2.4 4.1 2.3 4.1
Average Winter Savings ($/day) 1.2 2.2 1.5 2.8
Average Summer self-consumption (%) 27 25
Average Winter self-consumption (%) 23 19
Depending on the feed-in tariff, both North and West-facing systems pay for themselves within 3-6 years for the Penrith household. Although recommended feed-in tariffs are being reduced in several states 29, retailers competing for consumers are paying up to 20c/kWh for solar30, so shopping around can result in
27 Based on http://www.environment.gov.au/system/files/resources/80f603e7-175b-4f97-8a9b-2d207f46594a/files/national-greenhouse-accounts-factors-july-2018.pdf. pg. 20 28 https://www.engineeringtoolbox.com/carbon-dioxide-density-specific-weight-temperature-pressure-d_2018.html (CO2 @ 1 bar, 20C), based on Olympic swimming pool volume 2,500,000 l 29 https://reneweconomy.com.au/nsw-solar-feed-tariff-slashed-44-2018-19-58465/ 30 https://onestepoffthegrid.com.au/queensland-solar-households-hit-pay-dirt-retailers-compete-buy-rooftop-pv-exports/

21 | P a g e
APVI/UNSW Solar Trends Report for Solar Citizens
funded by Lord Mayor’s Charitable Foundation
a good deal, but caution is needed as some higher feed-in tariffs are combined with high energy charges.
Peak PV generation for this young family typically occurs around midday, outside of the peak load times, which are around 6am and 7pm. This is what causes our Penrith household to have comparatively low solar self-consumption (around 20% is consumed by loads within the house, and the rest is exported to the grid), making the adoption of a high solar FiT, or shifting of loads to the middle of the day particularly important. The Western PV orientation does produce energy later in the day at all times of the year compared to the Northern orientation, ultimately resulting in slightly higher rates of solar self-consumption, and thus greater value per kWh produced, because high electricity rates in the evening are offset instead of receiving a lower FiT. The key drawbacks of the west facing system are its:
● Lower production during the morning load peaks ● Lower overall production ● Particularly low production in winter
Overall, therefore the north facing system outperforms the west facing system, with savings $43/year higher under the standard FiT scenario. However, this <7% drop in annual savings of the west facing system compared to the North facing system is unlikely to make or break a solar investment decision, and the figure would be expected to be even less for time of use FiTs, such as those that have been recently introduced in Victoria31. The west facing system could also be more favourable for a household with slightly earlier evening consumption.
31 https://www.energy.vic.gov.au/renewable-energy/victorian-feed-in-tariff
22 | P a g e
APVI/UNSW Solar Trends Report for Solar Citizens
funded by Lord Mayor’s Charitable Foundation
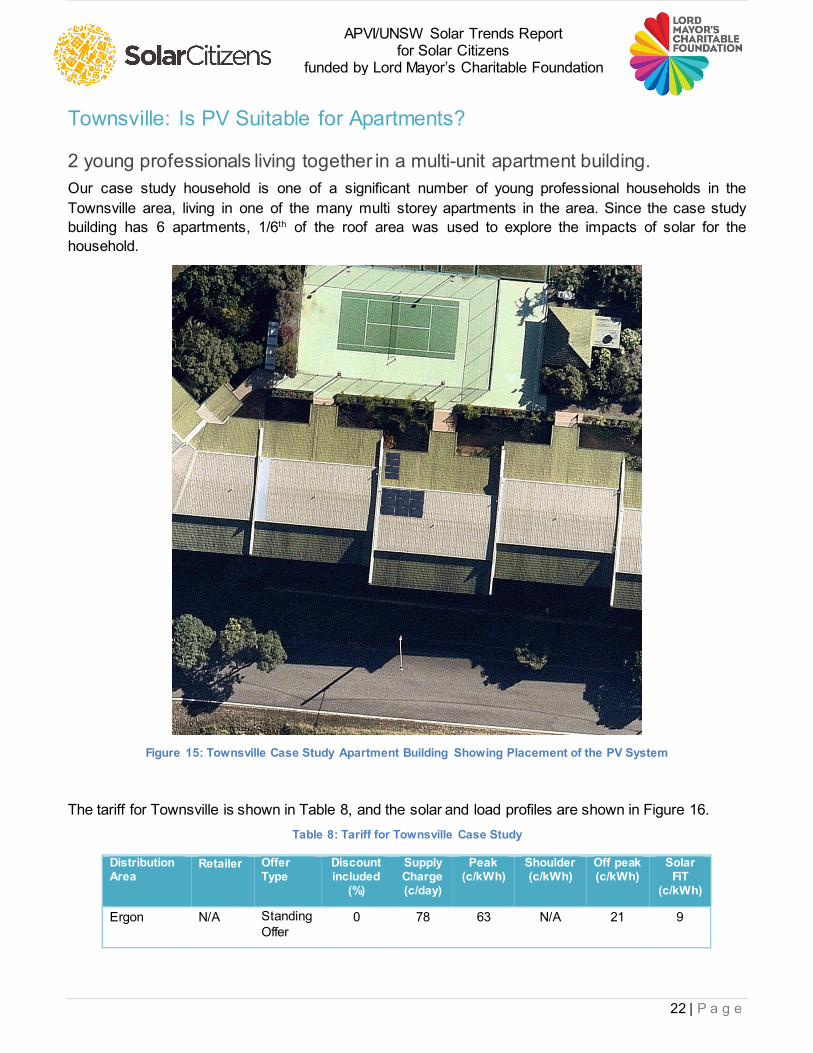
Townsville: Is PV Suitable for Apartments?
2 young professionals living together in a multi-unit apartment building. Our case study household is one of a significant number of young professional households in the Townsville area, living in one of the many multi storey apartments in the area. Since the case study building has 6 apartments, 1/6th of the roof area was used to explore the impacts of solar for the household.
Figure 15: Townsville Case Study Apartment Building Showing Placement of the PV System
The tariff for Townsville is shown in Table 8, and the solar and load profiles are shown in Figure 16. Table 8: Tariff for Townsville Case Study
Distribution Area
Retailer Offer Type
Discount included
(%)
Supply Charge (c/day)
Peak (c/kWh)
Shoulder (c/kWh)
Off peak (c/kWh)
Solar FiT
(c/kWh)
Ergon N/A Standing Offer
0 78 63 N/A 21 9
23 | P a g e
APVI/UNSW Solar Trends Report for Solar Citizens
funded by Lord Mayor’s Charitable Foundation
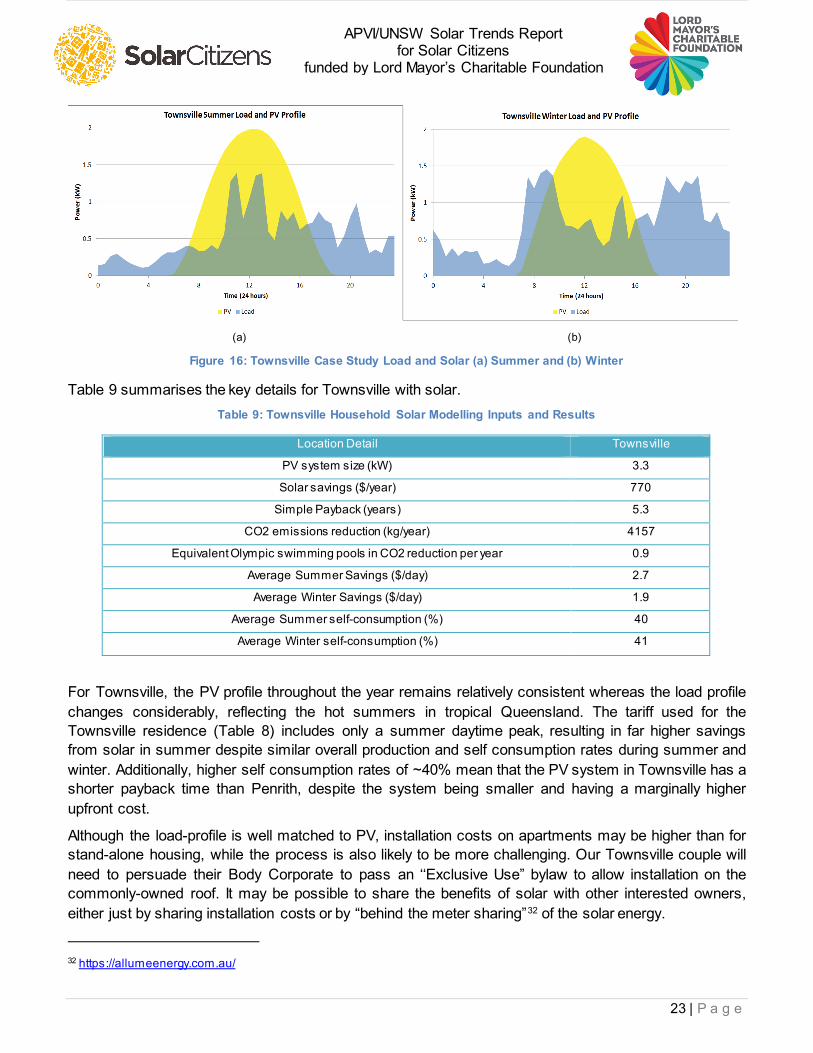
(a) (b)
Figure 16: Townsville Case Study Load and Solar (a) Summer and (b) Winter
Table 9 summarises the key details for Townsville with solar. Table 9: Townsville Household Solar Modelling Inputs and Results
Location Detail Townsville
PV system size (kW) 3.3
Solar savings ($/year) 770
Simple Payback (years) 5.3
CO2 emissions reduction (kg/year) 4157
Equivalent Olympic swimming pools in CO2 reduction per year 0.9
Average Summer Savings ($/day) 2.7
Average Winter Savings ($/day) 1.9
Average Summer self-consumption (%) 40
Average Winter self-consumption (%) 41
For Townsville, the PV profile throughout the year remains relatively consistent whereas the load profile changes considerably, reflecting the hot summers in tropical Queensland. The tariff used for the Townsville residence (Table 8) includes only a summer daytime peak, resulting in far higher savings from solar in summer despite similar overall production and self consumption rates during summer and winter. Additionally, higher self consumption rates of ~40% mean that the PV system in Townsville has a shorter payback time than Penrith, despite the system being smaller and having a marginally higher upfront cost.
Although the load-profile is well matched to PV, installation costs on apartments may be higher than for stand-alone housing, while the process is also likely to be more challenging. Our Townsville couple will need to persuade their Body Corporate to pass an ‘‘Exclusive Use” bylaw to allow installation on the commonly-owned roof. It may be possible to share the benefits of solar with other interested owners, either just by sharing installation costs or by “behind the meter sharing”32 of the solar energy.
32 https://allumeenergy.com.au/
24 | P a g e
APVI/UNSW Solar Trends Report for Solar Citizens
funded by Lord Mayor’s Charitable Foundation
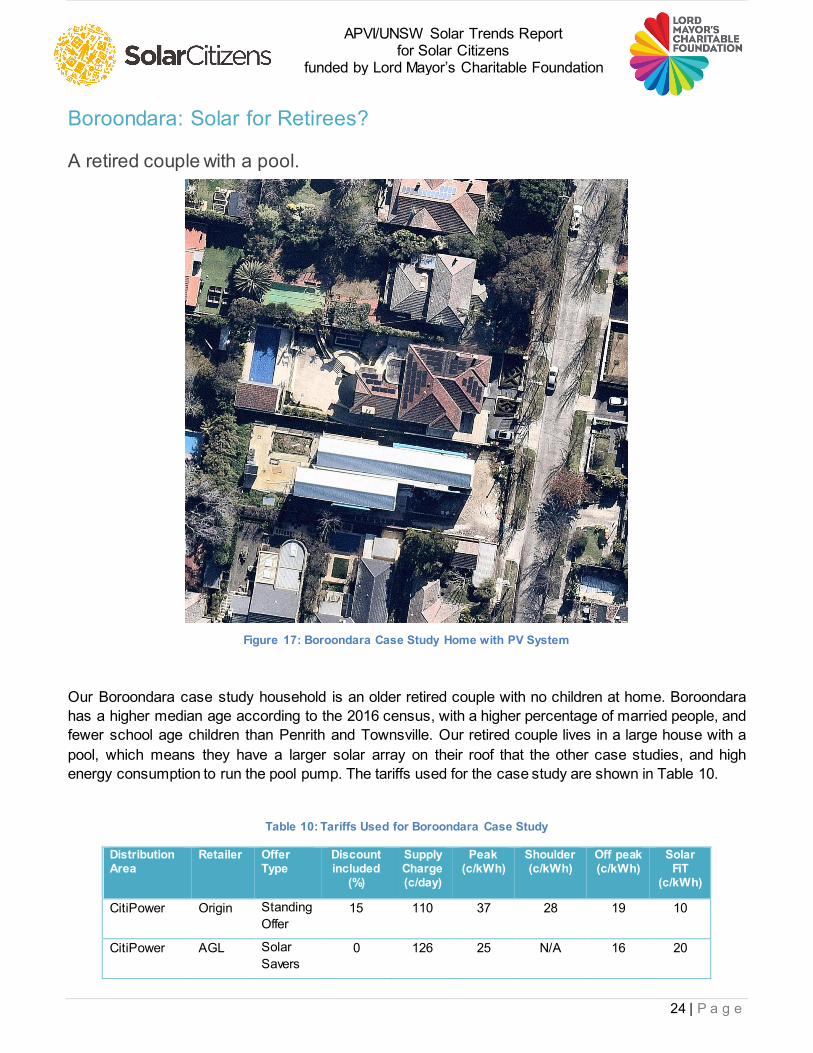
Boroondara: Solar for Retirees?
A retired couple with a pool.
Figure 17: Boroondara Case Study Home with PV System
Our Boroondara case study household is an older retired couple with no children at home. Boroondara has a higher median age according to the 2016 census, with a higher percentage of married people, and fewer school age children than Penrith and Townsville. Our retired couple lives in a large house with a pool, which means they have a larger solar array on their roof that the other case studies, and high energy consumption to run the pool pump. The tariffs used for the case study are shown in Table 10.
Table 10: Tariffs Used for Boroondara Case Study
Distribution Area
Retailer Offer Type
Discount included
(%)
Supply Charge (c/day)
Peak (c/kWh)
Shoulder (c/kWh)
Off peak (c/kWh)
Solar FiT
(c/kWh)
CitiPower Origin Standing Offer
15 110 37 28 19 10
CitiPower AGL Solar Savers
0 126 25 N/A 16 20

25 | P a g e
APVI/UNSW Solar Trends Report for Solar Citizens
funded by Lord Mayor’s Charitable Foundation
Table 11 summarises the key details for Boroondara with solar. Table 11: Boroondara Household Solar Modelling Inputs and Results
Location Detail Boroondara Boroondara (High FiT)
PV system size (kW) 11
Solar savings ($/year) 2187 2800
Simple Payback (years) 8.0 6.3
CO2 emissions reduction (kg/year) 11194
Equivalent Olympic swimming pools in CO2 reduction
per year
2.5
Average Summer Savings ($/day) 8.4 11.2
Average Winter Savings ($/day) 3.8 4.5
Average Summer self-consumption (%) 26
Average Winter self-consumption (%) 38
The solar and load profiles for Boroondara are shown in Figure 18.
(a) (b)
Figure 18: Boroondara Case Study Load and Solar (a) Summer and (b) Winter
As there are 3 different orientations of solar panels in this PV system, we assumed the Boroondara couple installs micro inverters, increasing system cost, but reducing the risk of losses due to mismatched solar. The southern latitude of Boroondara constitutes a large variation in average PV generation throughout the year, while the summer load for our retired couple is generally lower than the winter (heating driven) load, resulting in a large volume of exports in the summer and high consumption from the grid in winter. This home could benefit further from their PV installation by shifting winter heating loads earlier in the day and, ensuring that the building is well insulated, relying on the thermal mass and insulation of the building to keep the occupants warm overnight. Another potential option is the installation of battery storage to shift load peaks and maximise self-consumption of the PV. Being the largest PV system of our
26 | P a g e
APVI/UNSW Solar Trends Report for Solar Citizens
funded by Lord Mayor’s Charitable Foundation
case studies, it has by far the highest environmental benefit, avoiding CO2 emissions from grid electricity annually to fill 2.5 Olympic swimming pools.
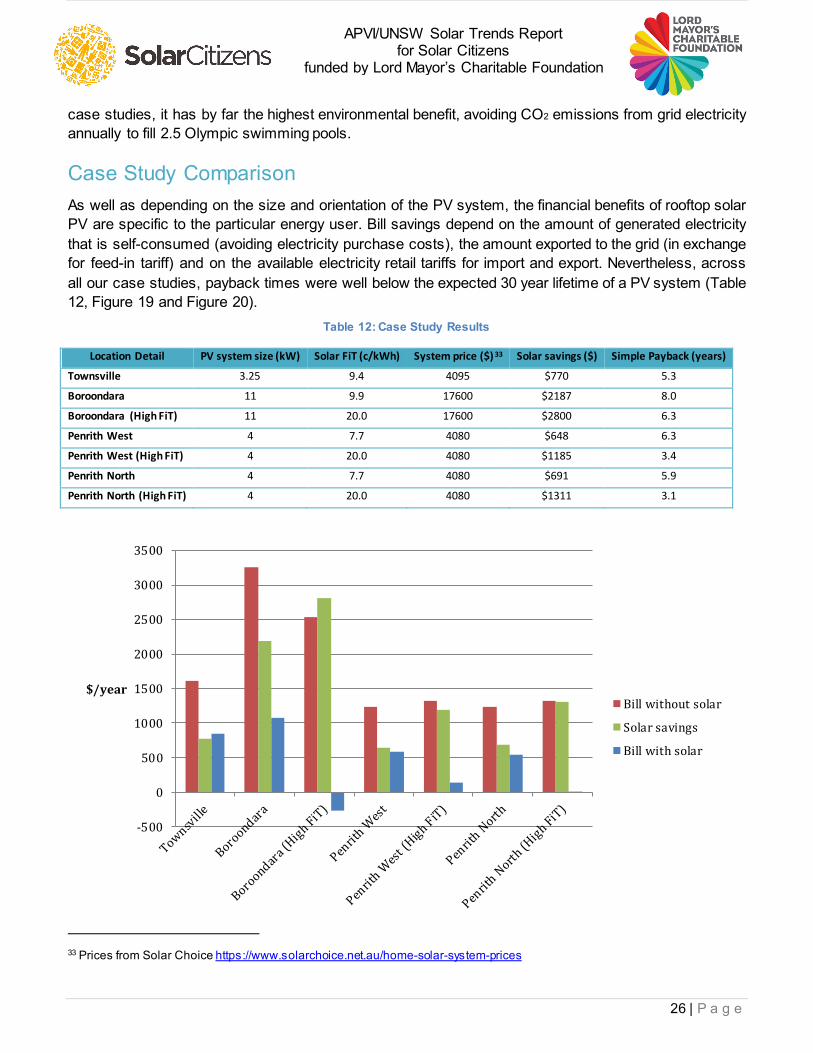
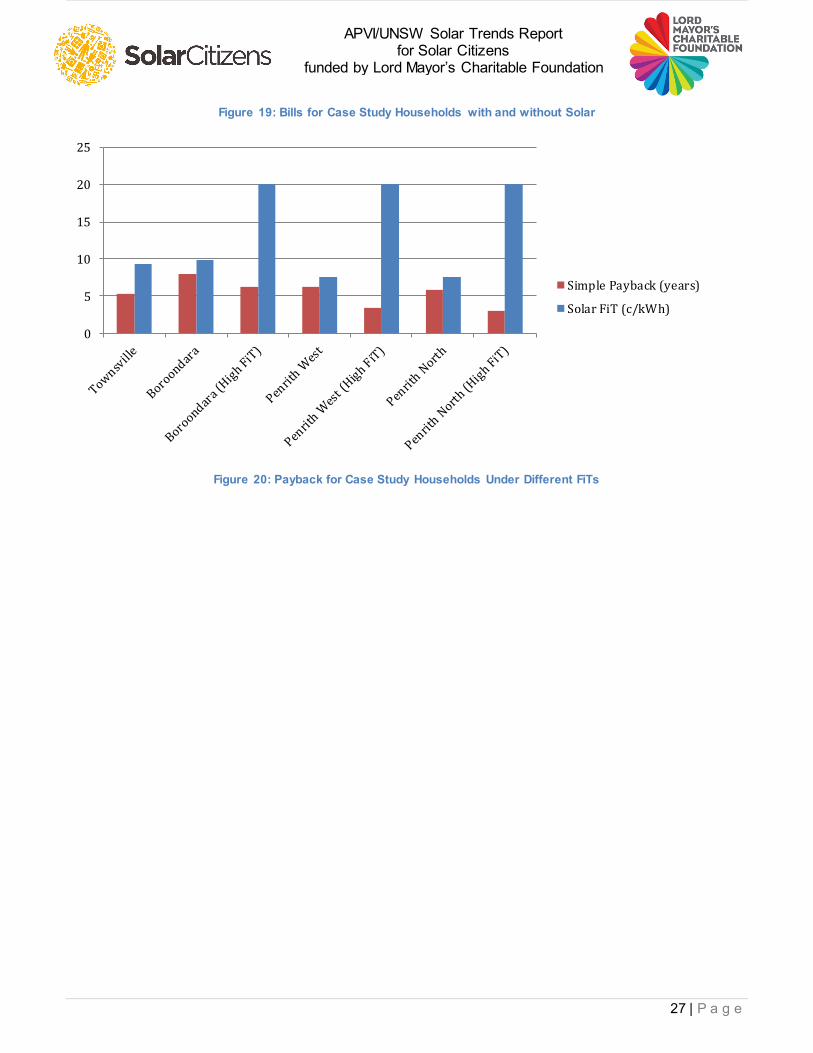
Case Study Comparison As well as depending on the size and orientation of the PV system, the financial benefits of rooftop solar PV are specific to the particular energy user. Bill savings depend on the amount of generated electricity that is self-consumed (avoiding electricity purchase costs), the amount exported to the grid (in exchange for feed-in tariff) and on the available electricity retail tariffs for import and export. Nevertheless, across all our case studies, payback times were well below the expected 30 year lifetime of a PV system (Table 12, Figure 19 and Figure 20).
Table 12: Case Study Results
Location Detail PV system size (kW) Solar FiT (c/kWh) System price ($) 33 Solar savings ($) Simple Payback (years)
Townsville 3.25 9.4 4095 $770 5.3
Boroondara 11 9.9 17600 $2187 8.0
Boroondara (High FiT) 11 20.0 17600 $2800 6.3
Penrith West 4 7.7 4080 $648 6.3
Penrith West (High FiT) 4 20.0 4080 $1185 3.4
Penrith North 4 7.7 4080 $691 5.9
Penrith North (High FiT) 4 20.0 4080 $1311 3.1
33 Prices from Solar Choice https://www.solarchoice.net.au/home-solar-system-prices
-500
0
500
1000
1500
2000
2500
3000
3500
$/yearBill without solar
Solar savings
Bill with solar
27 | P a g e
APVI/UNSW Solar Trends Report for Solar Citizens
funded by Lord Mayor’s Charitable Foundation
Figure 19: Bills for Case Study Households with and without Solar
Figure 20: Payback for Case Study Households Under Different FiTs
0
5
10
15
20
25
Simple Payback (years)
Solar FiT (c/kWh)

28 | P a g e
APVI/UNSW Solar Trends Report for Solar Citizens
funded by Lord Mayor’s Charitable Foundation
Methods Used in the Report Assessment of Residential PV Status
PV Capacity and Potential Existing PV capacity in each area was estimated using the Clean Energy Regulator’s database of PV systems registered under the Renewable Energy Target scheme (accessed via the APVI’s Solar Map), which is a near complete record of PV systems installed in Australia, the installed PV capacity was assessed.
Estimation of Dwelling growth The percentage of solar installation was adjusted to account for a growing population and the associated dwelling growth. From the 2011 and 2016 ABS census data a linear trend was created to project dwelling growth to the current date. For postcodes that span multiple LGAs, the change in the number of dwellings was adjusted by the percentage of that POA that falls into the LGA.
Assessment of Residential PV Potential
Figure 21: Method used for estimating the residential solar potential across Australia [from Roberts et al, 2018]
The method for estimation of residential rooftop PV potential across Australia uses an adaptation of the method developed for the APVI Solar Potential Tool, as described below and in [Roberts et al, 2018]. The method uses 3D building and vegetation models for the City of Melbourne to identify roof planes
29 | P a g e
APVI/UNSW Solar Trends Report for Solar Citizens
funded by Lord Mayor’s Charitable Foundation
suitable for PV installation. Details of this method can be found in [Copper and Bruce, 2014, 1 and 2]34 and Building data from City of Melbourne’s Census of Land and Environment (CLUE)35 was used to identify the predominant use of each building, the number of above-ground storeys and the number of residential dwellings. Using this information, the buildings were categorised by the ABS STRD dwelling structures. Combining these results gives the solar potential per dwelling for each residential building type, which are extrapolated nationally using dwelling numbers from the ABS 2016 census 36.
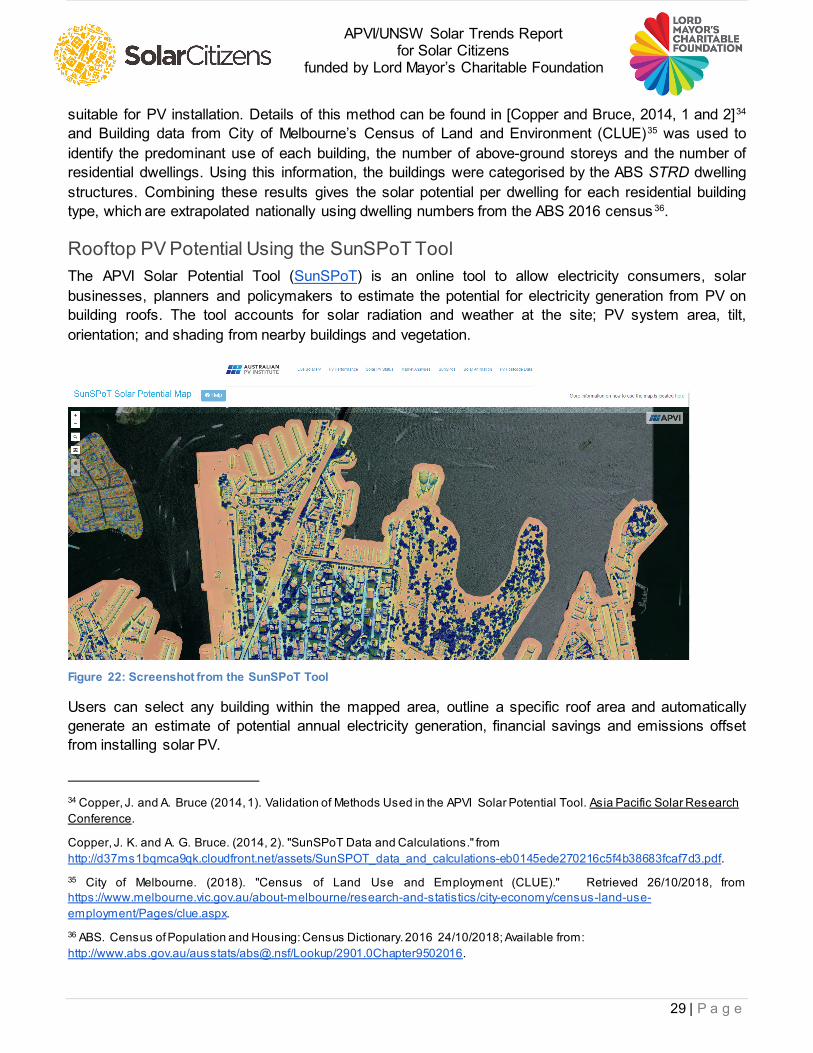
Rooftop PV Potential Using the SunSPoT Tool The APVI Solar Potential Tool (SunSPoT) is an online tool to allow electricity consumers, solar businesses, planners and policymakers to estimate the potential for electricity generation from PV on building roofs. The tool accounts for solar radiation and weather at the site; PV system area, tilt, orientation; and shading from nearby buildings and vegetation.
Figure 22: Screenshot from the SunSPoT Tool
Users can select any building within the mapped area, outline a specific roof area and automatically generate an estimate of potential annual electricity generation, financial savings and emissions offset from installing solar PV.
34 Copper, J. and A. Bruce (2014, 1). Validation of Methods Used in the APVI Solar Potential Tool. Asia Pacific Solar Research Conference.
Copper, J. K. and A. G. Bruce. (2014, 2). "SunSPoT Data and Calculations." from http://d37ms1bqmca9qk.cloudfront.net/assets/SunSPOT_data_and_calculations-eb0145ede270216c5f4b38683fcaf7d3.pdf. 35 City of Melbourne. (2018). "Census of Land Use and Employment (CLUE)." Retrieved 26/10/2018, from https://www.melbourne.vic.gov.au/about-melbourne/research-and-statistics/city-economy/census-land-use-employment/Pages/clue.aspx. 36 ABS. Census of Population and Housing: Census Dictionary. 2016 24/10/2018; Available from: http://www.abs.gov.au/ausstats/[email protected]/Lookup/2901.0Chapter9502016.

30 | P a g e
APVI/UNSW Solar Trends Report for Solar Citizens
funded by Lord Mayor’s Charitable Foundation
The data and methodology behind SunSPoT, as detailed in [Copper and Bruce, 2014], was used as the basis for the assessment of solar potential by residential dwelling type and for the case studies in this report.
The underlying dataset for the tool comprises 3D models of urban areas which combine digital surface models of buildings and vegetation. These models are analysed using ESRI’s ArcGIS tool to assess the tilt, orientation and annual solar insolation falling on each area of roof, based on Typical Meteorological Year (TMY) weather files. More details of this methodology can be found in the APVI’s Reports of Solar Potential for city centres across Australia37.
Case Study PV Modelling For the case studies, the process above was first used to identify developable roof planes receiving 80% of the annual insolation for an unshaded horizontal surface (3.99 kWh/m2 /day). The roof surfaces were then assessed visually using multiple viewpoint aerial imagery from Nearmap, to identify and exclude small obstructions and to lay out the modules. As the assessment was carried out remotely, there may be additional physical constraints on the available roof area as well as structural restrictions on the potential array size that have not been considered here. The power capacity of the array was calculated using a nominal output of 250W per module (equivalent to a DC size factor of 156.25 W/m2). The generation profile was calculated using NREL’s System Advisor Model (SAM)38, using SAM’s built-in TMY weather files and a derate factor of 0.77.
Solar Outcomes Analysis for Case Studies
Creating load profiles for case study locations In order to create load profiles for the case studies, load profile from a Newcastle household was used to model the case study dwelling of Boroondara, a Lake Macquarie load profile was used for the Penrith case study and a KuRingGai load profile was used for the Townsville case study.
The learning algorithm K-Nearest Neighbours (KNN) was used to transform data from the existing dwelling loads to the case study dwellings loads. In this scenario, KNN determines a relationship between the explanatory variables and the training set load data to predict new load data based on the associated explanatory variables. The explanatory variables used to predict half-hourly load data for the case study locations for the calendar year 2013 include:
● Day of the week ● Weekend/weekday ● Month ● Half-hour period of the day ● Dry bulb temperature (based on data from the nearest automatic weather station)
An example showing how the predicted load curves differ from the base profiles and the effect of temperature is illustrated in Figure 23-Figure 25 for Summer, Spring/Autumn and Winter. 37 e.g. Copper, J., M. Roberts and A. Bruce (2017). Spatial Analysis of Solar Potential in Melbourne, APVI. 38 NREL. (2010). "System Advisor Model (SAM)." Retrieved 18/10/2017, from https://sam.nrel.gov/.

31 | P a g e
APVI/UNSW Solar Trends Report for Solar Citizens
funded by Lord Mayor’s Charitable Foundation
Figure 23: Load Profile Generation for the Boroodara Case Study – Summer Average
Figure 24: Load Profile Generation for the Boroodara Case Study – Autumn and Spring Averages

32 | P a g e
APVI/UNSW Solar Trends Report for Solar Citizens
funded by Lord Mayor’s Charitable Foundation
Figure 25: Load Profile Generation for the Boroodara Case Study – Winter Average
The overall predicted load for Boroondara is higher than the load in Newcastle. This is largely influenced by the larger total range of temperatures experienced in Boroondara compared to Newcastle. On the average day in Summer, Boroondara experiences lower nighttime temperatures and higher daytime temperatures than Newcastle. The higher average daytime peak (likely caused by extreme weather events) results in greater use of air-conditioning in Boroondara and thus increases peak load. The cooler temperatures in Autumn/Spring and Winter in Boroondara compared to Newcastle likely increase the heating loads, with Winter causing a larger rise in Boroondara load than Newcastle load. The load before midday year-round for both profiles is relatively similar, as the home load for the base case was low before midday, likely because their is low occupancy with no heating and cooling being used, so this outcome was also transferred to the predicted profile.
Estimation of financial savings with solar For each case study location, the state-regulated standing tariff for the distribution area with a 15% total bill discount was applied (corresponding to a typical bill for a representative customer on a market offer39). For Townsville, however, no discount was applied as only regulated tariffs are available in the area. The retailers selected were the Retailers of Last Resort (ROLR) for each State. The feed-in-tariff (FiT) chosen was the midrange of the State’s recommended solar FiT for 2018-19. For Boroondara and Penrith, the AGL Solar Savers tariff was compared with standing tariff and 15% discount, to assess the effect of a higher FiT. All tariffs selected were Time of Use (TOU) tariffs, which better reflect the time value of solar. The selected tariffs are summarised in Table 13.
Table 13: 2018 Tariffs Used for the Solar Case Studies
Location Distribution Area
Retailer Offer Type
Discount included
(%)
Supply Charge (c/day)
Peak (c/kWh)
Shoulder (c/kWh)
Off peak (c/kWh)
Solar FiT
(c/kWh)
Townsville Ergon N/A Standing Offer
0 78 63 N/A 21 9
Boroondara CitiPower Origin Standing Offer
15 110 37 28 19 10
Boroondara CitiPower AGL Solar Savers
0 126 25 N/A 16 20
Penrith Endeavour Origin Standing Offer
15 93 38 31 17 8
Penrith Endeavour AGL Solar Savers
0 98 42 35 18 20
Synthetic load profiles for the case study locations were combined with solar profiles, modelled based on the tilt, orientation and location of the system (determined from the SunSPoT method), in order to determine the net load profile. Retail tariffs were applied to the net load profile and FiTs to the solar
39 AEMC (2016), 2016 residential Electricity Price Trends (Final Report)
33 | P a g e
APVI/UNSW Solar Trends Report for Solar Citizens
funded by Lord Mayor’s Charitable Foundation
exports. The difference in the bill was with compared to without solar is the calculated solar savings. In undertaking the calculations, the following assumptions were made:
● Despite Boroondara covering two distribution areas, the dwelling lies solely within the CitiPower area
● The AGL solar saver TOU tariff has the same prices as the AGL Essentials tariff within Endeavour’s network
● The cost of finance is zero ● There is no solar panel degradation, soiling or inverter replacements required over the time
period modelled