sold - next10.org · fifth cycle housing element updates must ... 9 in 2009, california had the ......
TRANSCRIPT
C U R R E N T S TAT E O F THE C A L I F O R N I A
H O U S I N G M A R K E T
A Comparative Analysis
SOLD

PRODUCED BY
Next 10
F. Noel Perry
Colleen Kredell
Marcia E. Perry
Stephanie Leonard
PREPARED BY
Beacon Economics
Adam Fowler
Hoyu Chong
DESIGN BY
José Fernandez
ONLINE AT
www.next10.org
A P R O J E C T O F
NEXT 10 is an independent nonpartisan organization that educates, engages and empowers Californians to improve the state’s future.
Next 10 is focused on innovation and the intersection be-
tween the economy, the environment, and quality of life
issues for all Californians. We provide critical data to help
inform the state’s efforts to grow the economy and reduce
greenhouse gas emissions. Next 10 was founded in 2003
by businessman and philanthropist F. Noel Perry.

O V E R V I E W
To say that California is
in a housing crisis is an
understatement. California’s
housing market continues
to suffer from a shortage of
supply and lingering effects
from the housing crash and
recession of the last decade.
The state ranks near the bottom in several metrics measuring its housing market: sup-ply of housing relative to population growth, housing affordability, existing single-family home prices, housing cost as percentage of household income for both owner-occupied and renter-occupied households, and over-crowdedness. Next 10 published a series of studies in 2016 analyzing trends related to California’s housing market, as well as trends in migration and employment by income. This study is an update to that series, analyz-ing the latest available data to determine how these trends may have shifted or im-proved in the last few years.
Findings from this brief include:
• Homeownership rates in California, which have histori-cally been low compared to other states, remained unchanged from 2015 to 2016. In 2016 (the latest year for which data are available), California ranked 49th in terms of homeownership — unchanged from 2014, with only 53.6% of homes owner-occupied.1
• For homeowners, housing costs relative to incomes dropped from 22.5% in 2014 to 21.9% in 2016. But California still has one of the highest ratios of hous-ing costs to income, ranking 49th in 2016, unchanged from 2014. Only New Jersey fared worse than Cali-fornia, with 22.8% of residents’ income going toward housing.
• Similarly, renters have also had a smaller proportion of their household incomes going toward housing costs, decreasing from 33.6% in 2014 to 32.8% in 2016. Compared with other states, however, California rent-ers also fared poorly, ranking 48th — unchanged from 2014.
• Housing remains overcrowded as the percentage of
1 Unless otherwise noted, statistics in this report are attributed to the U.S. Census Bureau.

N E X T 1 0 4
Current State of the Cal i fornia Housing Market: A Comparative Analysis
renter households with more than one person per bedroom2 grew from 13.2% in 2014 to 13.6% in 2016. Of all states, California had the highest percentage of overcrowded renter households.
• Home prices are higher than in all other states, particularly in major metropolitan ar-eas. Persistent low affordability has continued to drive many low- and middle-income households to other states.
• Housing remains in short supply, placing upward pressure on home prices and reduc-ing affordability. From 2007 to 2017, only 24.7 housing permits were filed for every 100 new residents in California — much lower than the U.S. average of 43.1 permits. Only Alaska had fewer housing permits filed (22.7) for every 100 new residents than California.
As illustrated in Figure A.1 in the appendix, most areas of California failed to meet the housing allocation goals set by the fourth cycle of the Regional Housing Needs Assessment (ca. 2007 to 2014; hereinafter “RHNA”) and look to also be failing to meet the goals set by the fifth cycle of RHNA, as well.3 In the years to come, the dearth of new homes could exac-erbate the problem, making housing even less affordable for many California residents.
The cost of development and stringent regulations have contributed to the relative lack of homebuilding in California.4 Tough environmental and zoning laws sometimes create obsta-cles for homebuilders that are seeking approval for development, especially in coastal cit-ies. Although these laws (such as the California Environmental Quality Act or CEQA) reflect good intentions and were enacted to preserve the state’s natural land, they are in need of comprehensive reevaluation and reform as they are often poorly implemented and subject to serious abuse. 5 6
This report provides further evidence that California needs more housing by juxtaposing the state’s performance with that of other states. These key trends explain the economic fundamentals of the housing market and why housing is becoming too expensive, laying the groundwork for the decisions and policy changes that need to be made to improve the lives of Golden State residents.
2 This report follows the definition of the California Department of Housing and Community Development on over-crowdedness: more than one person per room in a dwelling unit.
3 The Regional Housing Needs Assessment (RHNA) is mandated by State Housing Law as part of the periodic process of updating local housing elements of the General Plan. The RHNA quantifies the need for housing within each jurisdiction during specified planning periods. The most recently completed RHNA planning period was January 1, 2006 to June 30, 2014. The 5th cycle RHNA Allocation Plan, which covers the planning period from October 2013 to October 2021 was adopted by the Regional Council on October 4, 2012. Fifth cycle housing element updates must be adopted by October 15, 2013. From http://rtpscs.scag.ca.gov/Pages/Regional-Housing-Needs-Assessment.aspx
4 Gyourko, Saiz and Summers developed the Wharton Residential Land Use Regulation Index (WRLURI), which mea-sures local regulatory environments for housing markets. A discussion of the WRLURI is in the appendix.
5 Examples include the Sacramento Senior Homes in the City of Berkeley (2001), the East County Transitional Living Center in the City of El Cajon (2003), the Wagon Wheel Village in the City of Oxnard (2009) and the Park Merced Development Project in the City of San Francisco (2014).
6 Holland & Knight has conducted a comprehensive study of litigation abuse under CEQA. Hernandez, J.L., D. Fried-man and S. DeHerrera. In the Name of the Environment. Holland & Knight, Aug. 2015. <https://www.hklaw.com/publications/in-the-name-of-the-environment-litigation-abuse-under-ceqa-august-2015/>
N E X T 1 0 5
Current State of the Cal i fornia Housing Market: A Comparative Analysis
Costs and Housing Occupancy7
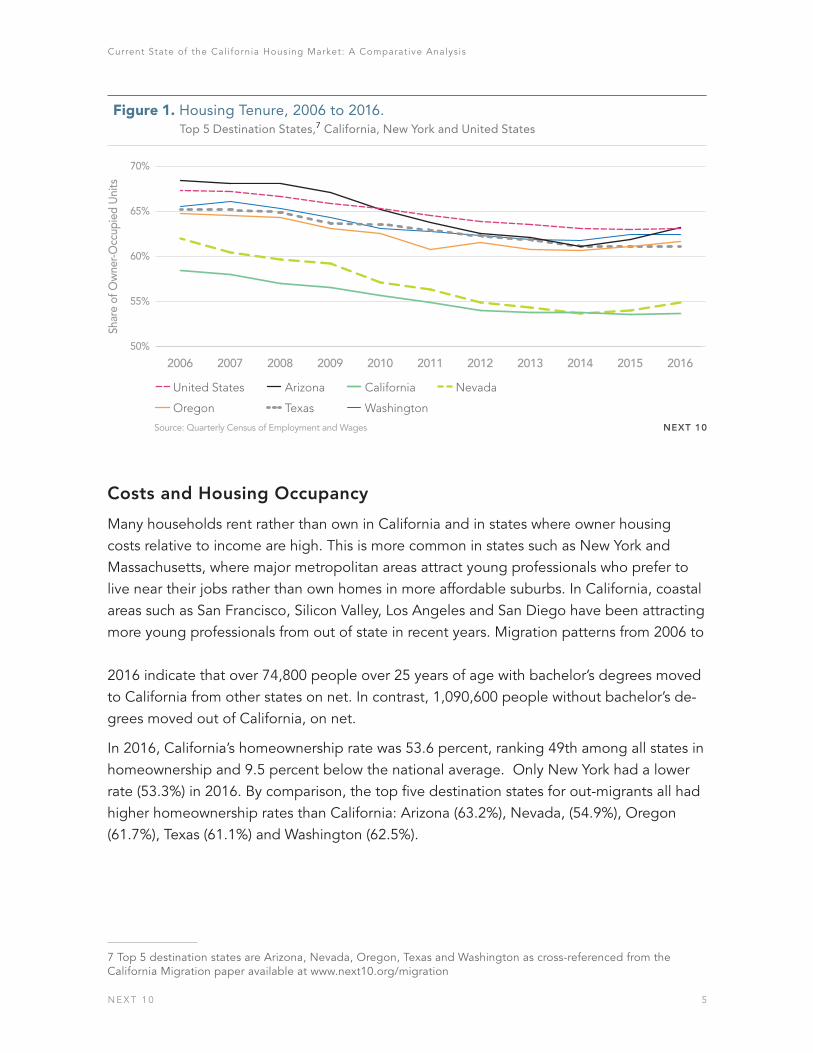
Many households rent rather than own in California and in states where owner housing costs relative to income are high. This is more common in states such as New York and Massachusetts, where major metropolitan areas attract young professionals who prefer to live near their jobs rather than own homes in more affordable suburbs. In California, coastal areas such as San Francisco, Silicon Valley, Los Angeles and San Diego have been attracting more young professionals from out of state in recent years. Migration patterns from 2006 to 2016 indicate that over 74,800 people over 25 years of age with bachelor’s degrees moved to California from other states on net. In contrast, 1,090,600 people without bachelor’s de-grees moved out of California, on net.
In 2016, California’s homeownership rate was 53.6 percent, ranking 49th among all states in homeownership and 9.5 percent below the national average. Only New York had a lower rate (53.3%) in 2016. By comparison, the top five destination states for out-migrants all had higher homeownership rates than California: Arizona (63.2%), Nevada, (54.9%), Oregon (61.7%), Texas (61.1%) and Washington (62.5%).
7 Top 5 destination states are Arizona, Nevada, Oregon, Texas and Washington as cross-referenced from the California Migration paper available at www.next10.org/migration
Figure 1. Housing Tenure, 2006 to 2016.Top 5 Destination States,7 California, New York and United States
Shar
e of
Ow
ner-O
ccup
ied
Uni
ts
50%
55%
60%
65%
70%
20162015201420132012201120102009200820072006
United States Arizona
Source: Quarterly Census of Employment and Wages
California Nevada
Oregon Texas Washington
NEXT 10

N E X T 1 0 6
Current State of the Cal i fornia Housing Market: A Comparative Analysis
Historically, Proposition 13, which limits property tax increases to no more than 2% per year as long as the property is not sold, has had a negative effect on the homeownership rate. It benefits properties that remain under the same ownership for longer periods of time, making it difficult for new homeowners to enter the market. Although California has one of the highest housing cost rates relative to income for all homeowners, this is not so for those without a mortgage. Indeed, one might attribute Proposition 13 and California’s low prop-erty tax rates as reasons home costs for homeowners without a mortgage are actually lower than the U.S. average, as illustrated in Table 2.
Since the mid-2000s, homeownership rates have been generally falling in the U.S. but have stabilized or even rebounded slightly since 2014.8 Of the top out-migration states, only Texas had a slight drop of 0.1 percent in homeownership from 2014 to 2016. But in Cali-fornia, not only is the homeownership rate low, it has not improved since 2014 despite a recovering economy. California residents suffered greatly during the housing crash, and the effects continue to linger.9 Subprime mortgages were very prevalent, especially in inland regions, which caused substantial numbers of foreclosures in these areas. A massive down-ward correction of home prices following the housing crash created bargain opportunities for investors, which were further fueled by the lack of competition from the many traditional buyers who had foreclosures on record.
More recently, however, California homes have had significant appreciation following the downward correction during and shortly after the Great Recession. Of the 179 metropolitan statistical areas (MSAs) tracked by the National Association of Realtors, six California MSAs ranked in the bottom 10 in terms of housing affordability, with San Francisco-Oakland-Hayward MSA, Anaheim-Santa Ana-Irvine MSA and San Jose-Sunnyvale-Santa Clara MSA ranking as the three least affordable metro areas based on the Housing Affordability Index.
8 Of the 50 states, 23 had a higher homeownership rate in 2016 than in 2014.9 In 2009, California had the fourth-highest foreclosure rate (4.75%), according to RealtyTrac’s “Year-End 2009 Fore-
closure Market Report.” The synopsis can be retrieved at https://nationalmortgageprofessional.com/news/19019/realtytrac-reports-foreclosure-filings-set-new-record-2009

N E X T 1 0 7
Current State of the Cal i fornia Housing Market: A Comparative Analysis
Housing costs in the Golden State remain elevated for both homeowners and renters compared with other states. In 2016, 38.6 percent of households in owner-occupied units were house-burdened (that is, with a housing expenditure including mortgage payment, property taxes, and maintenance equal to 30% or more of income), which actually represents a two-percentage-point improvement from 2014, when 40.6 percent were house-burdened. Nevertheless, Cali-fornia still has the highest percentage of house-burdened households among homeowners — more than 10 percentage points above the national average of 28.1 percent. Likewise, a lower percentage of renter households in California were rent-burdened in 2016 (52.6%) than in 2014 (56.8%), yet California again had the highest percentage of rent-burdened households in 2016.
Figure 2. Housing Affordability Index and Median Existing Single-Family ResidenceHome Price: Top 30 Largest Metropolitan Statistical Areas and Large California Metropolitan Statistical Areas (2016).
Med
ian
Exis
ting
SFR
Hom
e Pr
ice
(Tho
usan
ds o
f USD
)
20 40 60 80 100 120 140 160 180 2000
$200
$400
$600
$800
$1,000
$1,200
Non-CA MSAs CA MSAs
Source: National Association of Realtors NEXT 10

N E X T 1 0 8
Current State of the Cal i fornia Housing Market: A Comparative Analysis
Figure 3. Percent of Households that are Burdened by Tenure and by State, 2016.
Source: American Community Survey Public Use Microdata Samples; Tabulations by Beacon Economics
Percent House Burdened Percent Rent Burdened
0 10% 20% 30% 40% 50% 60%
North DakotaSouth Dakota
WyomingAlaska
MontanaArkansas
OklahomaWest Virginia
KentuckyMissouri
IowaKansas
NebraskaMississippi
IdahoWisconsin
New HampshireAlabama
OhioTennessee
IndianaNew Mexico
UtahNorth Carolina
MainePennsylvania
South CarolinaMinnesota
TexasArizona
WashingtonGeorgia
IllinoisDelaware
VirginiaRhode Island
MichiganMarylandVermont
MassachusettsNevada
LouisianaConnecticut
OregonNew Jersey
ColoradoNew York
HawaiiFlorida
California
NEXT 10
N E X T 1 0 9
Current State of the Cal i fornia Housing Market: A Comparative Analysis
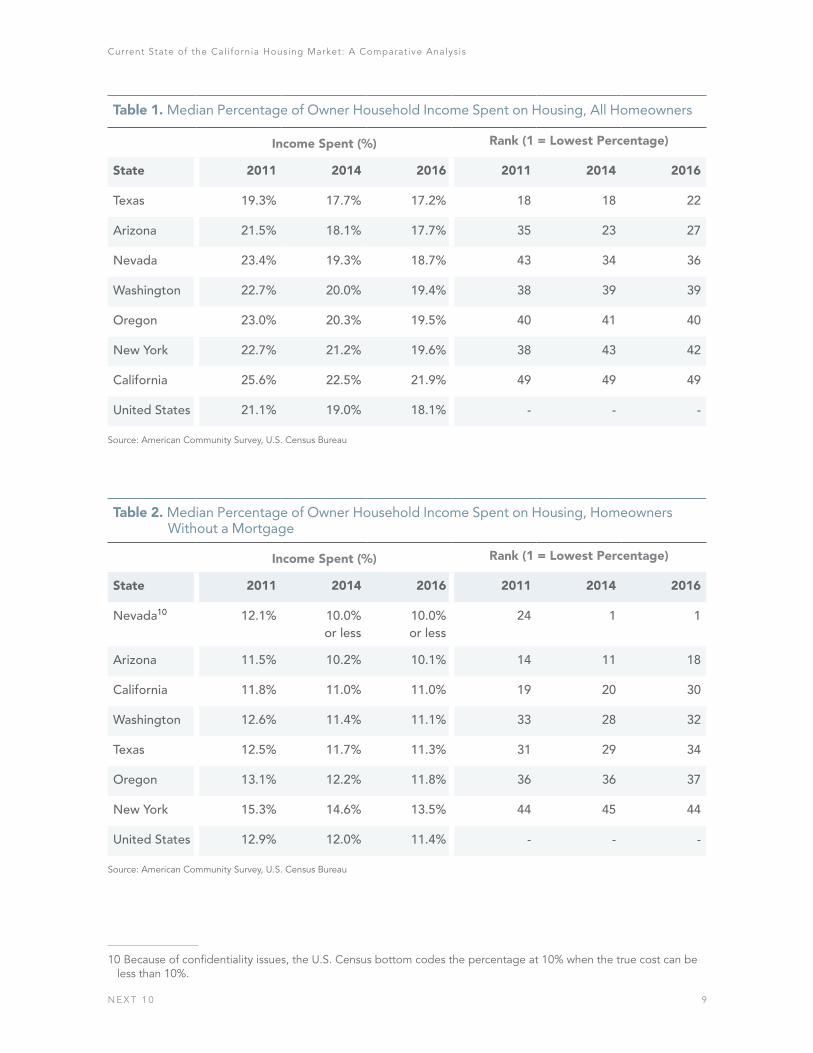
Table 1. Median Percentage of Owner Household Income Spent on Housing, All Homeowners
Income Spent (%) Rank (1 = Lowest Percentage)
State 2011 2014 2016 2011 2014 2016
Texas 19.3% 17.7% 17.2% 18 18 22
Arizona 21.5% 18.1% 17.7% 35 23 27
Nevada 23.4% 19.3% 18.7% 43 34 36
Washington 22.7% 20.0% 19.4% 38 39 39
Oregon 23.0% 20.3% 19.5% 40 41 40
New York 22.7% 21.2% 19.6% 38 43 42
California 25.6% 22.5% 21.9% 49 49 49
United States 21.1% 19.0% 18.1% - - -
Source: American Community Survey, U.S. Census Bureau
Table 2. Median Percentage of Owner Household Income Spent on Housing, Homeowners Without a Mortgage
Income Spent (%) Rank (1 = Lowest Percentage)
State 2011 2014 2016 2011 2014 2016
Nevada10 12.1% 10.0% or less
10.0% or less
24 1 1
Arizona 11.5% 10.2% 10.1% 14 11 18
California 11.8% 11.0% 11.0% 19 20 30
Washington 12.6% 11.4% 11.1% 33 28 32
Texas 12.5% 11.7% 11.3% 31 29 34
Oregon 13.1% 12.2% 11.8% 36 36 37
New York 15.3% 14.6% 13.5% 44 45 44
United States 12.9% 12.0% 11.4% - - -
Source: American Community Survey, U.S. Census Bureau10
10 Because of confidentiality issues, the U.S. Census bottom codes the percentage at 10% when the true cost can be less than 10%.

N E X T 1 0 10
Current State of the Cal i fornia Housing Market: A Comparative Analysis
Across the U.S., homeowners have been spending an increasingly smaller share of their household income on housing in recent years. But compared with the top out-migration states, New York and the U.S. average, California homeowners still spend a significantly higher portion of household income on housing (only New Jersey is worse). Furthermore, the gap between California and the U.S. widened from 2014 to 2016, with California homeowners spending 3.8 percent more income on housing than the U.S. average in 2016 instead of 3.5 percent more in 2014.
Looking at the subset of owner-occupied households without a mortgage, however, those California homeowners actually have a lower percentage of income spent on housing than the U.S. average. In 2016, California homeowners without a mortgage spent on average (median) 11.0 percent of their income on housing, lower than the U.S. median of 11.4 per-cent and that of all out-migration states except Nevada and Arizona.
It is not surprising that homeowners without a mortgage are better off than homeowners with a mortgage in California. Without a mortgage, the largest housing expenditures are maintenance and property taxes. Because of Proposition 13, California homeowners have a low property tax relative to their home values. Indeed, among the 50 states, New Jersey, Vermont, New Hampshire, Connecticut and Rhode Island had the highest housing costs among homeowners without a mortgage in 2016. Incidentally, these states have some of the highest property tax rates.11
Examining housing costs by income groups reveals that low-income groups are slightly more burdened in California than those in top out-migration destination states.12 For owner-occupied households, 82.8 percent with annual incomes less than $20,000 were burdened in California in 2016, or 3.1 percent higher than the next state, Washington (79.7%). As income levels rise, however, California homeowners are disproportionately burdened com-pared with these other states. For example, of owner-occupied households with incomes $35,000 to $50,000, 52.4 percent were burdened in California, which was 10 percent higher than the next most burdened state, Washington (42.3%). The gap between California and other states as well as the U.S. widens as income levels rise.
Comparing U.S. owner-occupied households whose income is less than $50,000, north-eastern states such as New Jersey, Connecticut, Massachusetts and Rhode Island — all of which have higher property tax rates than California — had higher shares of cost-burdened owner-occupied households than California. Incidentally, among owner-occupied house-holds where income is more than $75,000, Hawaii and California had the highest shares of burdened households, indicating that the high home prices play a greater role in housing burden for high-income groups, whereas property tax is a more important factor among lower-income groups.
11 Property tax rates are available at the Tax Foundation: https://taxfoundation.org/how-high-are-property-taxes-your-state/
12 This compares California with the top five states that Californians migrated to from 2006 to 2016.

N E X T 1 0 11
Current State of the Cal i fornia Housing Market: A Comparative Analysis
Figure 4. Percent of Owner-Occupied Households that are House Burdened by
Income Group, 2016.
Source: American Community Survey, U.S. Census Bureau
0
20%
40%
60%
80%
100%
$75,000+$50,000 to$75,000
$35,000 to$50,000
$20,000 to$35,000
$0 to $20,000
Arizona California Nevada Oregon Texas Washington
Renter households were similarly more likely to be burdened in California than other states for all income levels except for those that earn less than $20,000 in 2016. The spread be-tween California and the next most burdened state (Washington) where household income is $35,000 to $75,000 per year is more than 15 percentage points. Among California house-holds with incomes above $75,000, 11.8 percent were rent burdened, which was more than twice as much as Washington (5.5%).
In contrast with expenses for owner households, high rents (which may be the result of high home prices) rather than property taxes appear to have played a significant role in rent bur-den for renter households with income from $20,000 to $35,000: Hawaii and California took the top places.
NEXT 10

N E X T 1 0 12
Current State of the Cal i fornia Housing Market: A Comparative Analysis
Figure 5. Percent of Renter-Occupied Households that are House Burdened by
Income Group, 2016.
Table 3. California Housing Cost Burden Rank, by Tenure and Income Group (1 = Highest Percentage of Burdened Households), 2016
Housing Tenure$0 to $20000
$20,000 to $35,000
$35,000 to $50,000
$50,000 to $75,000
$75,000 or Above
Owner Occupied 9 8 3 2 2
… State with the Highest Per-centage of Burdened Owner-Occupied Households
New Jersey New Jersey New Jersey New Jersey Hawaii
Renter Occupied 2 2 2 2 2
… State with the Highest Per-centage of Burdened Owner-Occupied Households
Nevada Hawaii Hawaii Hawaii Hawaii
Source: American Community Survey, U.S. Census Bureau; Tabulations by Beacon Economics
Source: American Community Survey, U.S. Census Bureau
0
20%
40%
60%
80%
100%
$75,000+$50,000 to$75,000
$35,000 to$50,000
$20,000 to$35,000
$0 to $20,000
Arizona California Nevada Oregon Texas Washington
NEXT 10

N E X T 1 0 13
Current State of the Cal i fornia Housing Market: A Comparative Analysis
Table 3 summarizes California’s rank in terms of housing cost burden by tenure and income group.
The gaps in both the median rent and median single-family home prices between California and the U.S. have both widened since the publication of the previous version of this report. For rental rates, in 2016, the median gross rent in California was $1,375, or 40.2 percent above the national average. For home prices, in 2016, the median single-family home price in California was 113.3 percent higher than the national median.
The high costs of housing have contributed to two persistent trends among California households. First, household sizes, which were steeply declining before the recession, started to grow larger over the last five years as young adults lived with their parents for longer periods. This trend made national headlines during the recession because it affected every state. But the issue continues to affect California households even as the economy continues to improve, particularly in rental housing. In 2016, California had the highest share of rental units with more than one resident per room at 13.6 percent, which worsened from 2014 (13.2%), placing it dead last in the U.S.
Figure 6. Median Home Price, California vs. United States
0
$100,000
$200,000
$300,000
$400,000
$500,000
$600,000
2015201020052000199519901985198019751970
United States California
Source: CBRE
Prop 13Passes
1990 difference:$96,470
2006 difference:$334,530
2016 difference:$266,750
NEXT 10

N E X T 1 0 14
Current State of the Cal i fornia Housing Market: A Comparative Analysis
13
Table 4. Percentage of Overcrowded Homes13
Owner-Occupied Renter-Occupied
State 2011 2014 2016 2016 Rank
2011 2014 2016 2016 Rank
Washington 1.6% 1.7% 1.7% 39 5.2% 5.3% 6.0% 40
Oregon 1.4% 1.6% 1.8% 40 5.2% 5.9% 5.5% 37
Nevada 1.9% 2.2% 2.0% 43 7.8% 6.4% 6.6% 42
New York 1.9% 2.0% 2.1% 44 8.5% 8.5% 9.0% 48
Arizona 2.8% 2.4% 2.7% 45 8.2% 7.7% 7.9% 46
Texas 3.3% 3.2% 3.2% 47 7.7% 7.3% 7.9% 45
California 4.3% 3.9% 3.9% 48 13.2% 13.2% 13.6% 50
Source: American Community Survey, U.S. Census Bureau14
Table 5. Percentage of Severely Overcrowded Homes14
Owner-Occupied Renter-Occupied
State 2011 2014 2016 2016 Rank
2011 2014 2016 2016 Rank
Nevada 0.3% 0.4% 0.4% 39 1.9% 18.% 2.2% 39
Washington 0.2% 0.4% 0.4% 40 1.3% 1.4% 2.2% 40
Oregon 0.3% 0.3% 0.4% 41 4.2% 2.4% 2.3% 41
New York 0.5% 0.5% 0.6% 44 2.5% 2.1% 2.5% 44
Texas 0.8% 0.7% 0.7% 45 3.0% 2.2% 2.9% 45
Arizona 0.8% 0.7% 0.7% 46 1.0% 1.9% 3.1% 46
California 1.1% 0.9% 1.0% 48 3.6% 3.0% 4.4% 48
Source: American Community Survey, U.S. Census Bureau
13 The California Department of Housing and Community Development defines “overcrowded” as more than one occupant per room.
14 A household is “severely overcrowded” if the home averages more than 1.5 occupants per room.
N E X T 1 0 15
Current State of the Cal i fornia Housing Market: A Comparative Analysis
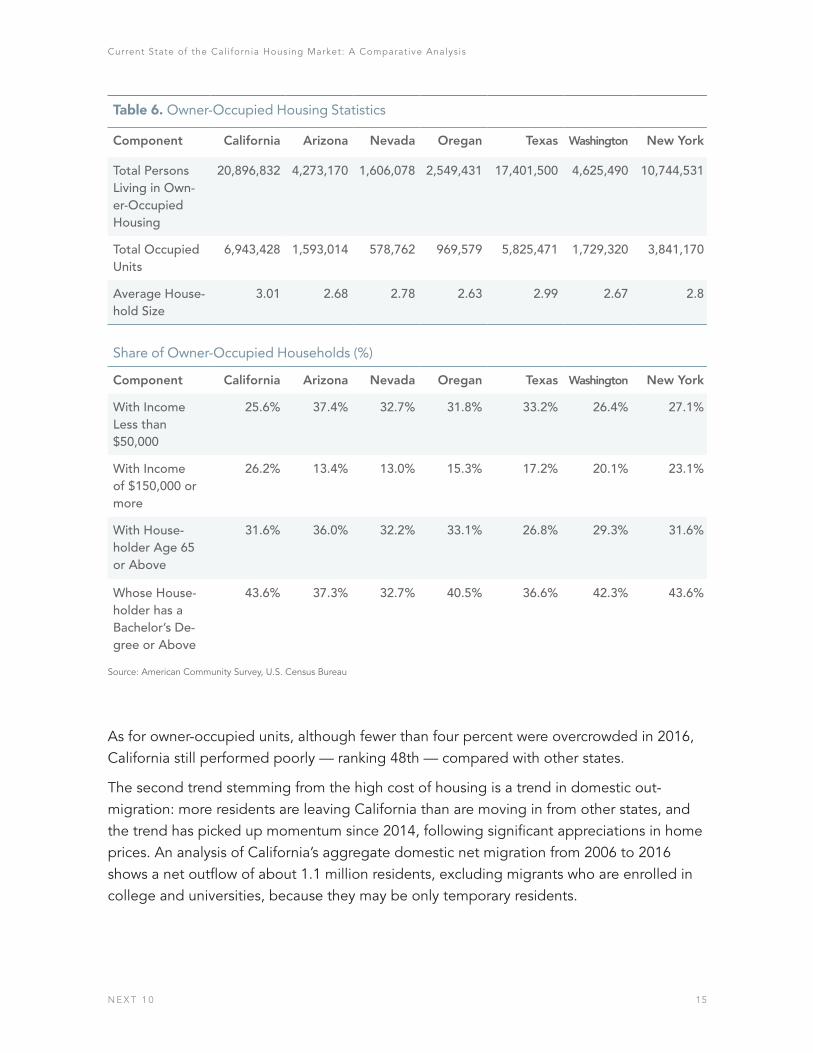
As for owner-occupied units, although fewer than four percent were overcrowded in 2016, California still performed poorly — ranking 48th — compared with other states.
The second trend stemming from the high cost of housing is a trend in domestic out-migration: more residents are leaving California than are moving in from other states, and the trend has picked up momentum since 2014, following significant appreciations in home prices. An analysis of California’s aggregate domestic net migration from 2006 to 2016 shows a net outflow of about 1.1 million residents, excluding migrants who are enrolled in college and universities, because they may be only temporary residents.
Table 6. Owner-Occupied Housing Statistics
Component California Arizona Nevada Oregan Texas Washington New York
Total Persons Living in Own-er-Occupied Housing
20,896,832 4,273,170 1,606,078 2,549,431 17,401,500 4,625,490 10,744,531
Total Occupied Units
6,943,428 1,593,014 578,762 969,579 5,825,471 1,729,320 3,841,170
Average House-hold Size
3.01 2.68 2.78 2.63 2.99 2.67 2.8
Share of Owner-Occupied Households (%)
Component California Arizona Nevada Oregan Texas Washington New York
With Income Less than $50,000
25.6% 37.4% 32.7% 31.8% 33.2% 26.4% 27.1%
With Income of $150,000 or more
26.2% 13.4% 13.0% 15.3% 17.2% 20.1% 23.1%
With House-holder Age 65 or Above
31.6% 36.0% 32.2% 33.1% 26.8% 29.3% 31.6%
Whose House-holder has a Bachelor’s De-gree or Above
43.6% 37.3% 32.7% 40.5% 36.6% 42.3% 43.6%
Source: American Community Survey, U.S. Census Bureau

N E X T 1 0 16
Current State of the Cal i fornia Housing Market: A Comparative Analysis
Consistent with previous findings, migration patterns confirm that low-income households are being driven out. On the other hand, California from 2006 to 2016 had a positive migra-tion of people with incomes from $50,000 to $99,999. Additionally, there was a net domes-tic migration of 6,400 people whose incomes were more than $150,000. For more migra-tion statistics, please refer to the California Migration paper.
Further declines in homeownership and home affordability could affect economic growth in California. Homeowners are more likely than renters to invest in their homes and com-munities, an important reason to encourage homeownership. Furthermore, households that spend high proportions of their incomes on housing spend less on goods and services, which means less tax revenue to reinvest back into the state. Finally, high housing costs may increase the likelihood that lower-income households will rely on some form of government assistance, which in turn puts fiscal pressure on state and local governments.
Housing Supply Constraints
The state’s housing supply has remained relatively stagnant since 2008, exacerbating afford-ability issues and driving increased out-migration and homelessness. Although housing permits have gradually increased since the Great Recession, the increase has been very slow. While 2017 was the best year in terms of permits issued since the Great Recession, the amount issued was roughly equivalent to 1997’s. Indeed, from 2008 to 2017, the average number of permits issued was a mere 73,000, or just barely over half of the 135,000 average from 1991 to 2007.
Figure 7. Annual Housing PermitsCalifornia, 1954 to 2017
Num
ber o
f Per
mits
Source: U.S. Census Bureau
Single-Family Multi-Family
0
$50,000
$100,000
$150,000
$200,000
$250,000
$300,000
$350,000
2014201020062002199819941990198619821978197419701966196219581954
1954-1979 Average: ~207,000 1980-1990 Avg:~203,000
2008-2017 Avg:~73,000
1991-2007 Avg: ~135,000
NEXT 10

N E X T 1 0 17
Current State of the Cal i fornia Housing Market: A Comparative Analysis
Figure 8. Permits per 100 New Residents, 2007 to 2017
Source: U.S. Census BureauNote: Michigan State was the only state where population was lower in 2017 than in 2007.
Single Family Multi-Family
-200 0 200 400 600 800 1000
MichiganAlaska
CaliforniaHawaiiFlorida
NevadaTexas
ColoradoMassachusetts
WashingtonOregon
MontanaOklahomaMaryland
UtahWyoming
VirginiaIdaho
GeorgiaArizona
MinnesotaSouth CarolinaNorth Carolina
New MexicoDelaware
TennesseeNebraska
North DakotaLouisianaKentucky
ConnecticutArkansas
IndianaKansas
New JerseyAlabama
IowaSouth Dakota
MissouriWisconsin
PennsylvaniaNew York
MississippiNew Hampshire
OhioMaine
Rhode IslandVermont
West VirginiaIllinois
Housing Permits per 100 New Residents, 2007 to 2017
NEXT 10
N E X T 1 0 18
Current State of the Cal i fornia Housing Market: A Comparative Analysis
The low number of permits puts California near the bottom on a per capita basis. From 2007 to 2017, only 24.7 new units were permitted for every 100 new residents, compared with 43.1 new units nationwide. Similar to previous findings, housing statewide has favored multifamily more than single-family structures, a trend that sets California apart from many other states. From 2007 to 2017, slightly over half (51.7%) of housing units permitted were for single-family homes, compared with 65.6% nationwide. Although the centers of the state’s largest cities are fairly built out and thus mainly receive permits for multiunit proper-ties, construction of single-family homes in suburban areas has failed to keep pace.
The deficient homebuilding in California is in part the result of a number of regulatory changes. Among these is CEQA, though which local governments require developments (residential and nonresidential) to report on potential environmental effects, which may lead to either limiting developments or stopping them altogether. CEQA in its current form is subject to serious abuse, particularly by NIMBY neighborhood groups. A recent study by Holland & Knight found that from 2010 to 2012, infill projects were the overwhelming tar-get of CEQA lawsuits. An updated study for the Southern California Association of Govern-ments region15 indicates that housing projects in infill locations and multifamily/attached housing projects were the targets of 98% and 71%, respectively, of the CEQA lawsuits from 2013 to 2015.16
The scarcity of developable land has also made coastal homebuilding difficult. The Legisla-tive Analyst’s Office reports that just under two-thirds of the area surrounding urban centers on California’s coast is undevelopable because of mountains, hills, ocean and other water.17 The 1976 California Coastal Act, which was enacted to protect and maintain the overall quality of the coastal environment, has played a role in limiting how much coastal land can be developed for housing.18
Local communities often employ land use authority to slow or stop housing projects. The resistance to new developments often stems from the desire to maintain home values or the conviction that the land should remain undeveloped for various reasons.
Another concern to developers, especially those that handle few properties, are the costs associated with tearing down buildings and addressing the environmental issues that may arise during redevelopment. California has some of the toughest zoning laws in the country, requiring developers to adhere to multiple state and local ordinances. The fees associated with development often are ultimately passed on to homebuyers. The fees include the building permit, utility connection, environmental impact assessment, and zoning and
15 The SCAG region comprises Imperial, Los Angeles, Orange, Riverside, San Bernardino and Ventura counties. Rep resenting over 18 million people, SCAG is the largest Metropolitan Planning Organization in the United States.
16 Hernandez, J.L., D. Friedman and S. DeHerrera. In the Name of the Environment (updated study). Holland & Knight, July 2016. Accessed at https://www.hklaw.com/files/Uploads/Documents/Alerts/Environment/InfillHous- ingCEQALawsuits.pdf
17 Mac Taylor, California’s High Housing Costs, Causes and Consequences. Legislative Analyst’s Office, March 2015, available at www.lao.ca.gov/reports/2015/finance/housing-costs/housing-costs.pdf.
18 See the 2003 State of California General Plan Guidelines, p. 174.

N E X T 1 0 19
Current State of the Cal i fornia Housing Market: A Comparative Analysis
Figure 9. California’s Housing Supply Gap2014 to 2025
0
0.5
1.0
1.5
2.0
2.5
3.0
3.5
4.0
202420222020201820162014
Source: McKinsey Global Institute Analysis;Tabulations by Beacon Economics
2.12.2
2.42.5
2.62.8
2.9Additional Demand
Current Housing Backlog
3.13.2
3.33.5
2.0
Hou
sing
Bac
klog
in C
alifo
rnia
(Mill
ions
of H
ousi
ng U
nits
)
subdivision fees. These items were dis-cussed at the House L.A. 2015 Summit hosted by the Building Industry Associa-tion’s Los Angeles and Ventura Chapter, which featured a number of local and na-tional developers along with local political representatives.19
Some developers assert that many local governments favor commercial projects over residential because they provide a larger financial upside. Cities and counties know that sales tax revenue collected by potential commercial and retail establish-ments far outweighs the property taxes homeowners would pay. Some local gov-ernments have also remained cautious toward homebuilding because the accom-panying population growth is sometimes costly, leading to an increased need for infrastructure development and policing.
Discussion of California’s Housing Shortage and RHNA 5th Cycle
The 2016 study by McKinsey Global Institute garnered much attention in stating that Cali-fornia needs to add 3.5 million housing units by 2025, which is a conservative estimate,20 to meet housing demand.21 According to the McKinsey report, California had a housing backlog of 2.0 million units in 2014. Figure 9 provides an illustration of California’s housing backlog from 2014 to 2025, assuming no additions of housing units and population projec-tions using Department of Finance estimates.
Using McKinsey’s conceptual methodology, Beacon Economics estimates that by 2017 the housing backlog had ballooned to 2.3 million. Note that this is slightly less than the 2.4 mil-lion illustrated in the McKinsey report, chiefly because of housing construction picking up
19 For more information, see www.bialav.org.20 The 3.5 million figure is considered conservative because the housing backlog is derived based on New Jersey and
New York’s ratio of housing units per capita, which itself is actually still lower than the that of the U.S. average. Using the ratio of housing units per capita of the U.S. average actually widens California’s housing backlog to 3.8 million by 2025.
21 Woetzel, J., Mischke, J., Peloquin, S. and Weisfield, D. (2016). “A Tool Kit to Close California’s Housing Gap: 3.5 Million Homes by 2025.” McKinsey Global Institute, McKinsey & Company. October 2016. Accessed February 2018. Available at: https://www.mckinsey.com/~/media/McKinsey/Global%20Themes/Urbanization/Closing%20Califor-nias%20housing%20gap/Closing-Californias-housing-gap-Full-report.ashx
NEXT 10

N E X T 1 0 20
Current State of the Cal i fornia Housing Market: A Comparative Analysis
moderately in 2017.22 At the present trajec-tory, California would have a housing back-log of 3.0 million by 2022 and 3.4 million by 2025. Since 2014, the change in total hous-ing stock stands at 225,500 units in 2017, or a net addition of 75,200 units per year.23 Assuming current pace and future pace of construction until 2025 remain the same, the gap to fill would be 2.6 million by 2022 and 2.8 million by 2025.24 The shortfalls are illustrated in Figure 10.
Exhibit 2 of the McKinsey study demon-strates that California has produced less housing per capita than other U.S. states: 80 percent less than New York, 29 percent less than Texas and eight percent less than Oregon from 2005 to 2014. Using McKin-sey’s methodology, Beacon
has updated the results (not adjusting for net migration) for 2011 to 2016 to illustrate just how much California has underbuilt relative to other states.
Compared with the 2005 to 2014 period in the McKinsey study, the gap between California and the comparison states widened during the 2011 to 2016 period for Texas, from 29 percent to 39 percent. Otherwise, the gaps ap-peared to have narrowed for Arizona (33% -> 4%), Nevada (44% -> -18%), Oregon (8% -> 6%) and Washington (26% -> 22%).
These results, however, do not account for population gains or losses due to migration. One of the major findings in the accompanying Net Migration paper is that at the state level, the high cost of living—especially the high cost of housing, which in part is due to the chronic housing shortage—is driving lower-income Californians away. This means if there were no migration among states, California’s housing shortage problem would be even worse. In other words, because cost of living and migration patterns are correlated to an extent,
22 California’s 2.3 million backlog is determined by summing up the housing backlog of all 58 counties. But not all counties have a backlog. Indeed, using the McKinsey method, 27 counties, mostly in rural areas, have no housing backlog. Excluding these counties (because it is not realistic to assume people from a county with a housing back log will move to one without a backlog) increases California’s backlog to 2.4 million.
23 This clearly falls short of the Legislative Analyst’s Office’s estimated shortage of 120,000 to 230,000 units per year.24 This differs from the McKinsey’s estimate of 2.5 million by 2025 because it estimates that the state would add 1.0
million units from 2014 to 2025. It is not clear whether the 1.0 million figure already accounts for housing removals such as demolitions. Whereas this report uses changes in housing units, which presumably accounts for demolition and other causes of housing losses.
Figure 10. Housing Backlog andHousing Supply GapAssuming Curent Pace of Construction
0
0.5
1.0
1.5
2.0
2.5
3.0
3.5
202520222017
Source: California Department of Finance;U.S. Census Bureau.Based on methodology developed byMcKinsey Global InstituteTabulations by Beacon Economics
Hou
sing
Bac
klog
and
Hou
sing
Sup
ply
Gap
ifA
ssum
ing
Cur
rent
Pac
e of
Con
stru
ctio
n(M
illio
ns o
f Hou
sing
Uni
ts)
2.3 2.3
2.6
3.02.8
3.4
Housing Supply Gap atCurrent Pace of Construction
Housing Backlog
NEXT 10
N E X T 1 0 21
Current State of the Cal i fornia Housing Market: A Comparative Analysis
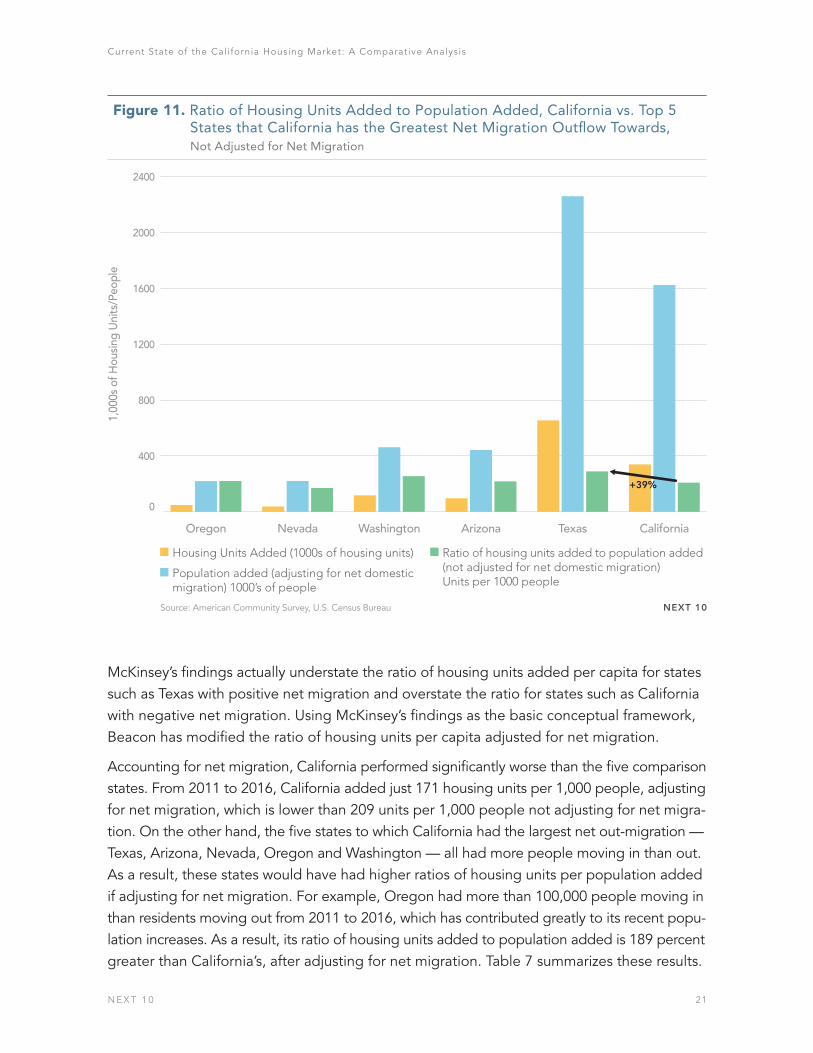
McKinsey’s findings actually understate the ratio of housing units added per capita for states such as Texas with positive net migration and overstate the ratio for states such as California with negative net migration. Using McKinsey’s findings as the basic conceptual framework, Beacon has modified the ratio of housing units per capita adjusted for net migration.
Accounting for net migration, California performed significantly worse than the five comparison states. From 2011 to 2016, California added just 171 housing units per 1,000 people, adjusting for net migration, which is lower than 209 units per 1,000 people not adjusting for net migra-tion. On the other hand, the five states to which California had the largest net out-migration — Texas, Arizona, Nevada, Oregon and Washington — all had more people moving in than out. As a result, these states would have had higher ratios of housing units per population added if adjusting for net migration. For example, Oregon had more than 100,000 people moving in than residents moving out from 2011 to 2016, which has contributed greatly to its recent popu-lation increases. As a result, its ratio of housing units added to population added is 189 percent greater than California’s, after adjusting for net migration. Table 7 summarizes these results.
Figure 11. Ratio of Housing Units Added to Population Added, California vs. Top 5 States that California has the Greatest Net Migration Outflow Towards,
Not Adjusted for Net Migration
Source: American Community Survey, U.S. Census Bureau
0
400
800
1200
1600
2000
2400
CaliforniaTexasArizonaWashingtonNevadaOregon
Housing Units Added (1000s of housing units) Ratio of housing units added to population added (not adjusted for net domestic migration)Units per 1000 people
Population added (adjusting for net domestic migration) 1000’s of people
1,00
0s o
f Hou
sing
Uni
ts/P
eopl
e
+39%
NEXT 10

N E X T 1 0 22
Current State of the Cal i fornia Housing Market: A Comparative Analysis
Note that the 3.5 million goal recommended in the McKinsey study is about triple the 1.16 million housing addition goals of the fifth RHNA Cycle (ca. 2014 to 2022).25 Even if the bar is lowered to meeting the housing allocations set by RHNA instead of the amount of housing unit additions recommended in this paper, many counties still fall short at the current pace of housing additions. Benchmarking against the 1.16 million RHNA goal, altogether just about 601,000 housing units would be added statewide, leaving 555,000 units, or about 48.0%, unfulfilled.26 At the county level, it is not surprising that most coun-ties that meet the overall RHNA goals (housing unit added by income levels distribution notwithstanding) tend to be rural and sparsely populated.
Of the counties with a council of government (COG), housing unit additions by income levels distribution notwithstanding, Imperial County would have the highest percentage of RHNA housing allocation unfulfilled (89%), followed by the counties of Merced (85%), Stanislaus (85%), Sutter (80%) and Kings (80%). Meanwhile, Mendocino, Orange, San Francisco, San Luis Obispo and Solano counties are the only ones with COGs that appear to be on track to fulfill-ing their RHNA goals. While there is not full transparency into whether or not housing need by each income level (i.e. Very Low Income, Low Income, Moderate Income, Above Moderate Income) is being met, it would appear that some counties have built more than the 5th cycle RHNA goal for the Above Moderate Income group but not enough for all other groups.
25 Not all councils of governments (COGs) run on the same cycle. For example, the largest COG by population, Southern California Association of Governments (SCAG), began its fifth cycle in 2014, whereas the Association of Bay Area Governments’ fifth cycle began in 2015. Furthermore, not all regions run on an eight-year cycle. For instance, many rural counties without a COG run on a five-year cycle. For ease of reporting, Beacon Economics has chosen to consolidate the fifth cycle period and define it as running roughly from 2014 to 2022, which is equivalent to SCAG’s cycle.
26 Note that the calculation differs from the SB 35 Statewide Determination Summary because SB 35 uses permitting activities as the basis of calculating housing needs fulfilled. This does not account for housing unit losses via demo- litions and other causes.
Table 7. Ratio of Housing Units to Population Added in Arizona, Nevada, Oregon, Texas, and Washington relative to California
State 2005 – 2014 (McKinsey Study)
2011 - 2016 2011 - 2016 (adjusting for net migration)
Oregon 8% 6% 189%
Nevada 44% -18% 161%
Washington 26% 22% 160%
Arizona 33% 4% 146%
Texas 29% 39% 119%
Source: McKinsey Global Institute; American Community Survey and American Community Survey Public Use Microdata Sample, U.S. Census Bureau

N E X T 1 0 23
Current State of the Cal i fornia Housing Market: A Comparative Analysis
As mentioned, not all counties have fallen behind in housing addition with respect to population addition. Using the McKinsey methodology, along with current pace of housing additions by county, Beacon has estimated the housing backlog at the county level by the end of the current (fifth) RHNA cycle.
At the current pace of construction, the unmet housing demand as percentage of total demand from 2017 to 2022 would worsen for all counties with a housing backlog in 2017 except for Orange County, which registers only a marginal improvement of 0.1 percent. Furthermore, Sonoma County, which has no housing backlog in 2017, would have an unmet housing demand as percentage of total demand of 2.5 percent by 2022 and 4.0 percent by 2025 – which could increase by up to another 2.5% when accounting for housing losses from the recent wildfires.27 The counties without unmet housing demand based on the
27 The additional 2.5% loss would assume all 5,000-5,500 homes destroyed would be removed from the housing stock, rather than some or all being rebuilt.
Figure 12. Ratio of Housing Units Added to Population Added, California vs. Top 5 States that California has the Greatest Net Migration Outflow Towards,
Adjusted for Net Migration
Source: American Community Survey, U.S. Census Bureau
0
400
800
1,200
1,600
2,000
2,400
CaliforniaTexasArizonaWashingtonNevadaOregon
Housing Units Added (1000s of housing units) Ratio of housing units added to population added (not adjusted for net domestic migration)Units per 1000 people
Population added (adjusting for net domestic migration) 1000’s of people
1,00
0s o
f Hou
sing
Uni
ts/P
eopl
e
171
495
+119%
NEXT 10
N E X T 1 0 24
Current State of the Cal i fornia Housing Market: A Comparative Analysis
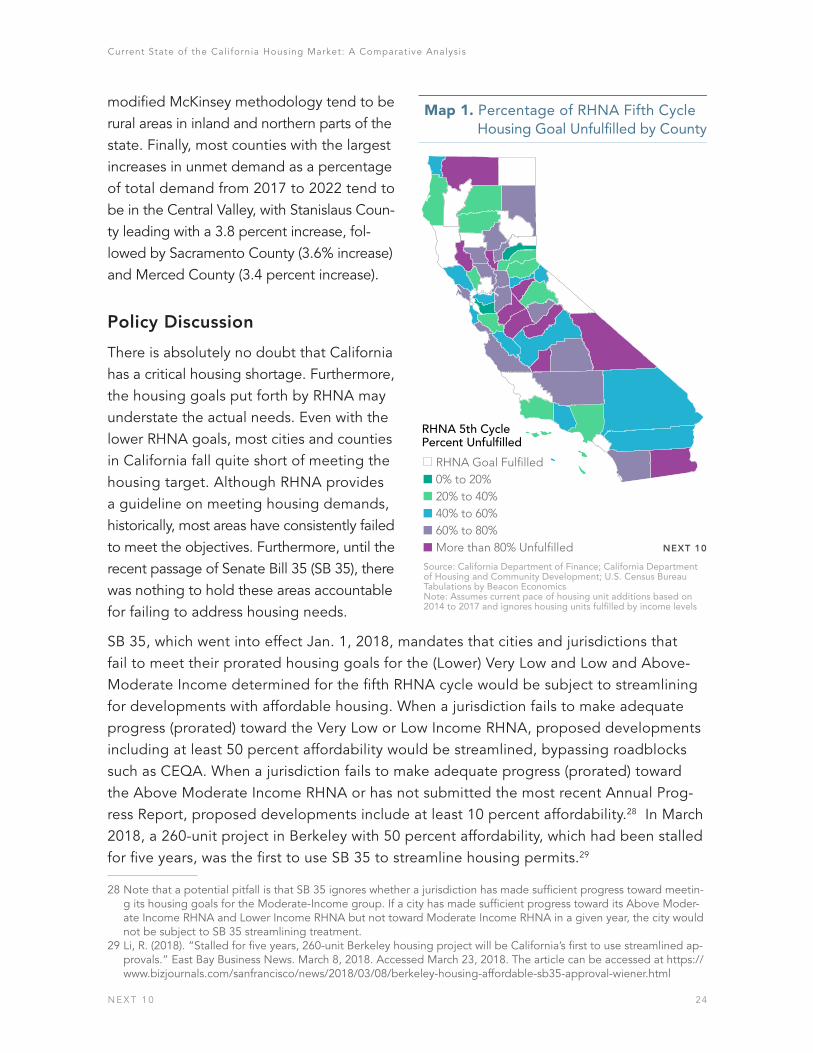
modified McKinsey methodology tend to be rural areas in inland and northern parts of the state. Finally, most counties with the largest increases in unmet demand as a percentage of total demand from 2017 to 2022 tend to be in the Central Valley, with Stanislaus Coun-ty leading with a 3.8 percent increase, fol-lowed by Sacramento County (3.6% increase) and Merced County (3.4 percent increase).
Policy Discussion
There is absolutely no doubt that California has a critical housing shortage. Furthermore, the housing goals put forth by RHNA may understate the actual needs. Even with the lower RHNA goals, most cities and counties in California fall quite short of meeting the housing target. Although RHNA provides a guideline on meeting housing demands, historically, most areas have consistently failed to meet the objectives. Furthermore, until the recent passage of Senate Bill 35 (SB 35), there was nothing to hold these areas accountable for failing to address housing needs.
SB 35, which went into effect Jan. 1, 2018, mandates that cities and jurisdictions that fail to meet their prorated housing goals for the (Lower) Very Low and Low and Above-Moderate Income determined for the fifth RHNA cycle would be subject to streamlining for developments with affordable housing. When a jurisdiction fails to make adequate progress (prorated) toward the Very Low or Low Income RHNA, proposed developments including at least 50 percent affordability would be streamlined, bypassing roadblocks such as CEQA. When a jurisdiction fails to make adequate progress (prorated) toward the Above Moderate Income RHNA or has not submitted the most recent Annual Prog-ress Report, proposed developments include at least 10 percent affordability.28 In March 2018, a 260-unit project in Berkeley with 50 percent affordability, which had been stalled for five years, was the first to use SB 35 to streamline housing permits.29
28 Note that a potential pitfall is that SB 35 ignores whether a jurisdiction has made sufficient progress toward meetin- g its housing goals for the Moderate-Income group. If a city has made sufficient progress toward its Above Moder- ate Income RHNA and Lower Income RHNA but not toward Moderate Income RHNA in a given year, the city would not be subject to SB 35 streamlining treatment.
29 Li, R. (2018). “Stalled for five years, 260-unit Berkeley housing project will be California’s first to use streamlined ap- provals.” East Bay Business News. March 8, 2018. Accessed March 23, 2018. The article can be accessed at https:// www.bizjournals.com/sanfrancisco/news/2018/03/08/berkeley-housing-affordable-sb35-approval-wiener.html
Map 1. Percentage of RHNA Fifth CycleHousing Goal Unfulfilled by County
RHNA 5th Cycle Percent Unfulfilled
RHNA Goal Fulfilled0% to 20%20% to 40%40% to 60%60% to 80%More than 80% Unfulfilled
Source: California Department of Finance; California Department of Housing and Community Development; U.S. Census BureauTabulations by Beacon EconomicsNote: Assumes current pace of housing unit additions based on 2014 to 2017 and ignores housing units fulfilled by income levels
NEXT 10

N E X T 1 0 25
Current State of the Cal i fornia Housing Market: A Comparative Analysis
SB 540 and AB 73 would also increase the supply of housing by allowing a streamlined review process. SB 540 facilitates areas within the city or county that are designated for expedited housing development while AB 73 allows completion of environmental and planning reviews within the Housing Sustainability Districts in advance. Both of these measure, however, merely allows cities and counties to take such actions. As it is evident that most jurisdictions continue to fail to meet their housing goals under RHNA, it is du-bious if these measures would be as effective as SB 35 in increasing housing supply.
Senate Bill 827 (SB 827), a much-discussed bill that was proposed and already defeated in the 2018 state legislature, would have provided a significant increase in housing. The bill was designed to prioritize transit-oriented development by upzoning within half a mile of a major transit stop or a quarter-mile of a stop on a high-quality transit,30 which would po-tentially bring other positive effects such as encouraging transit use over driving, thereby reducing greenhouse gas emissions. A letter signed by urban design professionals and
30 Current as of March 23, 2018.
Map 2. Housing Supply Gap (as Percentage of Housing Demand) by County,2017 (Current) vs. 2022 (End of 5th RHNA Cycle)
RHNA 5th Cycle Percent Unfulfilled
No Shortfall 0% - 4%4% to 8%8% to 12%12% to 16%16% to 20%20% to 24%More than 24%
RHNA Goal Fulfilled0% to 20%20% to 40%40% to 60%60% to 80%More than 80% Unfulfilled
Data Source: California Department of FInance; California Department of Housing and Community Development; U.S. Census BureauConceptual methodology developed by McKinsey Global Institute AnalysisAnalysis: Beacon Economics*The percentage of housing shortfall is computed by housing gap to fulfill assuming current pace of addition of new housing units over the demand of housing, which is based on population times the per capita housing rate as New York and New Jersey, as noted by McKinsey Global Institute NEXT 10

N E X T 1 0 26
Current State of the Cal i fornia Housing Market: A Comparative Analysis
others in academia31 who support SB 827 states that from 2009 to 2014, California added more households (544,000) than new housing units (467,000) and that the state ranks 49th of 50 in housing units per capita (which is also one of the findings of the McKinsey study). This means that from 2009 to 2014, California added 77,000 more households than hous-ing units. By 2016, the five-year difference worsened: from 2011 to 2016, California added 475,000 households but only 340,000 housing units — a difference of 135,000.32 Critics of SB 827 pushed for amendments to the bill that would protect residents from displacement, provide affordability constraints, and respect more local control. The League of California Cities – an association of California city officials with members in most of the state’s 482 cities – published a letter of opposition in late January33 and urged member cities to do the same. The League has voiced concerns over the bill undermining local controls and planning processes in addition to lacking proper protection for affordability. Their letter of opposition also suggested that the package of housing bills passed last year in California should be streamlined and improved upon, rather than adding another imperfect bill as law. While SB827 did not end up passing this legislative cycle, the state legislature continues to weigh policy options that could increase housing in transit-rich areas.
Apart from RHNA, local governments, rather than the state, are responsible for building housing. The analysis thus far has clearly shown that local governments have repeatedly failed to fulfill their responsibilities, resulting in a collective action problem in which local governments choose to protect their own interests (and the interests of certain parties such as NIMBYs) over ensuring adequate housing for all who need it in that area.
Conclusion
California’s current housing supply is not able to support its growing population. The low levels of construction will likely result in further increases in home prices, such that fewer and fewer California residents will be able to afford homes. It is true that home prices have increased throughout the country, but California remains the most expensive state for buying a home. Rental rates have also continued to climb, and residents who usually flock to the rental market to avoid unaffordable home prices find little relief. The state’s lower-income residents suffer the most; they are burdened with having to spend a higher proportion of their incomes on housing and are forced to cut back on other discretionary, but often necessary, purchases. But diminishing levels of affordability are also reducing the ability of middle-income residents to own a home, which is discouraging for residents of both low-income and middle-income categories. Indeed, the current state of housing has led many to leave California in the hope of finding more affordable living in other states.
31 The letter can be viewed at http://sd11.senate.ca.gov/sites/sd11.senate.ca.gov/files/urban_planning_professor_ support_for_sb_827.pdf
32 All figures in this paragraph are based on American Community Survey one-year estimates.33 The letter can be viewed at http://citizenmarin.org/wp-content/uploads/2018/01/League-of-California-Cities-Letter-
Opposing-SB827.pdf

N E X T 1 0 27
Current State of the Cal i fornia Housing Market: A Comparative Analysis
To alleviate the housing affordability crisis that plagues low- and middle-income house-holds, more housing construction needs to take place. Homebuilders should be encour-aged to build in California. One way is by streamlining the permitting process and finding a way to reduce concerns about environmental protection policies. The Legislative Analyst’s Office report discusses a few solutions, including encouraging more residential develop-ment along California coastal cities and, if possible, an increase in the residential density for such developments.34 New policies to provide such solutions are needed and are currently being weighed in the state legislature. Ensuring that such policies are designed responsi-bly in order to provide desperately needed housing stock while protecting the state’s most vulnerable residents will be key for successful implementation.
34 Mac Taylor, California’s High Housing Costs, Causes and Consequences. Legislative Analyst’s Office, March 2015, available at www.lao.ca.gov/reports/2015/finance/housing-costs/housing-costs.pdf.

N E X T 1 0 28
Current State of the Cal i fornia Housing Market: A Comparative Analysis
A P P E N D I X
The appendix seeks to relate the current housing crisis in California with existing land use regulation and the Regional Housing Needs Assessment, which is mandated by state hous-ing law as part of updating local housing elements of the General Plan.
Wharton Residential Land Use Regulation Index35
Mostly under local control, land use regulations in the U.S. are widespread and have a sig-nificant influence on housing supply. For example, land use regulation can affect the costs of housing through delay, design restriction and lawsuits that challenge development rights. The various barriers and hurdles to development have made the local regulatory environ-ment very complex. Nevertheless, although land use regulation varies considerably among cities in California, most tend to have more restrictive land use regulation compared with that in other states.
Table A.1. WRLURI36 Summary Statistics, California and Selected Major Metro Areas
Regions37 Mean Std. Dev. Min Max
United States 0 1 -2.2 4.8
California 0.6 0.7 -1.3 3.6
Ventura County, CA 1.2 1.2 -0.1 3.6
San Francisco-Oakland-Hayward, CA MSA 0.9 0.9 -1.3 2.3
Riverside-San Bernardino-Ontario, CA MSA 0.6 0.8 -1.0 2.0
Los Angeles-Long Beach Metropolitan Division, CA 0.5 0.7 -0.7 3.1
San Diego-Carlsbad-San Marcos, CA MSA 0.5 0.5 -0.3 1.6
Sacramento-Arden Arcade-Roseville, CA MSA 0.5 0.5 0.0 1.2
Orange County, CA 0.4 0.7 -0.7 1.6
36 Source: Gyourko, Saiz, and Summers; Tabulations by Beacon Economics37
35 Gyourko, J., Saiz, A. and Summers, A. A. (2008). “A New Measure of the Local Regulatory Environment for Housing Markets: The Wharton Residential Land Use Regulatory Index.”
36 The WRLURI is an aggregate measure comprising 11 sub-indices that summarize information on the various aspects of the regulatory environment. The sub-indices: 1. Local Political Pressure, 2. State Political Involvement Index, 3. State Court Involvement Index, 4. Local Zoning Approval Index, 5. Local Project Approval Index, 6. Local Assembly Index, 7. Density Restriction Index, 8. Open Space Index, 9. Exactions Index, 10. Supply Restrictions Index and 11. Approval Delay Index.
37 Unless otherwise noted, average here refers to the mean.

N E X T 1 0 29
Current State of the Cal i fornia Housing Market: A Comparative Analysis
The WRLURI is structured such that at the city level, the sample average38 (mean) land use regulation index is normalized at zero with a standard deviation of one. A city with a WRLURI above zero indicates that it is more restrictive than average. Among all cities in California, the average WRLURI is 0.6. This means at the aggregated state level, California tends to have a more stringent land use regulation than in the nation as a whole. Indeed, California ranks ninth. Northeastern and West Coast states tend to rank high in terms of having restric-tive land use regulation, whereas Southern and Midwestern states have more lax land use regulation. Also, compared with the top out-migration states, California has the second highest WRLURI index, after Wash-ington State.
Among the largest cities by population, California cities have considerably higher overall restrictive land use regulation.
Although restrictive residential land use does not necessarily contribute to a hous-ing shortage, it is no accident that Califor-nia has both above-average land use regu-lation while performing poorly in various housing metrics.
38 Unless otherwise noted, average here refers to the mean.
Table A.2. Average (Mean) WRLURI, California vs. Top Out-Migration States
State WRLURI Overall Rank
Washington 0.737 7
California 0.585 9
Arizona 0.581 10
Oregon 0.084 17
Nevada -0.458 31
Texas -0.459 32
Source: Gyourko, Saiz, and Summers; Tabulations by Beacon Economics
Table A.3. Average (Mean) WRLURI,Most Populous Cities in California and the U.S.
San Antonio, TX 2.354
Los Angeles, CA 2.103
Austin, TX 2.102
San Francisco, CA 1.948
San Diego, CA 1.583
Irvine, CA 1.562
Phoenix, AZ 1.252
Houston, TX 0.176
New York City, NY 0.026
Philadelphia, PA -0.027
Dallas, TX -0.111
Chicago, IL -1.175
Source: Gyourko, Saiz, and Summers; Tabulations by Beacon Economics

N E X T 1 0 30
Current State of the Cal i fornia Housing Market: A Comparative Analysis
Regional Housing Needs Assessment (RHNA)
Since 1969, California has required that all local governments (cities and counties) ad-equately plan to meet the housing needs of the community. To meet this require-ment, local governments adopt housing plans as part of their general plan, which is also required by the state. The California Department of Housing and Community Development determines the regional housing needs assessment, segmented by income levels, for each region’s planning body, the Council of Governments (COG), and each COG determines the regional housing needs based on its own demo-graphic data. Below is map of each Cali-fornia counties’ performance during the previous cycle.
If disregarding housing needs by income segment, only San Luis Obispo, Alpine and Plumas counties have permitted suffi-cient housing per the needs assessment.39 Of the 58 counties in California, only six have permitted at least 80% of the units mandated by RHNA, and 41 have permit-ted less than 50% of the goal.
39 This does not necessarily mean that both counties have permitted sufficient housing needs according to income levels. It is entirely possible for a region to have permitted more housing than needed for the above moderate-income group but under-permitted for the very-low and low-income groups. If this is the case, such region would be subject to the streamlining process mandated under SB 35.
Map A.1. Regional Housing NeedAssessment Fourth Cycle Results by CountyJanuary 2007 to June 2014.
Percent of RHNAAllocation Met
Source: California Department of Housing and Community Development
0% to 20%20% to 40%40% to 60%60% to 80%80% to 100%100% to 321%
Table A.4. Fourth RHNA Cycle Results by County
Percent of Goal Met
Number of Counties
100%+ 3
80% - 99.9% 3
50% - 79.9% 11
20% - 49.9% 30
Less than 20% 11
NEXT 10