solicitation of interest public information memorandum · disclaimer 1 this public information...
TRANSCRIPT

Solicitation of InterestPublic Information Memorandum
October, 22 2018
https://health.uconn.edu/about/path-forward

Disclaimer
1
This Public Information Memorandum (“PIM”) has been prepared on University of Connecticut Health Center (“UConn Health” or “UCH”), based on information from UCH and published sources, and is being furnished through Cain
Brothers, a division of KeyBanc Capital Markets (“Cain Brothers”), as UCH’s exclusive authorized representative, for informational purposes solely for use by qualified prospects in considering their interest in entering into a potential
partnership with UConn Health (a “Transaction”). The information contained herein is subject to change without notice. Neither UCH nor Cain Brothers assumes any responsibility to update any information contained in this PIM or to
inform the recipient of information which may affect this PIM. This PIM has been prepared to assist interested parties in making their own evaluation of UConn Health and does not purport to be all-inclusive or to contain all information
that a prospective partner may desire or that may be required in order to properly evaluate the business, prospects or value of UCH. In all cases, interested parties should conduct their own investigation and analysis of UCH and the data
set forth in this PIM. Industry data and statistics have been obtained or derived from UCH and published industry sources.
By accepting this PIM, the recipient will not reproduce this PIM in whole or in part.
Cain Brothers has not independently verified any of the information contained herein, and neither UCH, Cain Brothers nor any of their respective affiliates makes any representation or warranty (expressed or implied) as to the accuracy or
completeness of this PIM or any statements, estimates or projections contained herein. Such statements, estimates and projections reflect various assumptions made by UCH concerning anticipated results, which are subject to business,
economic and competitive uncertainties and contingencies, many of which are beyond the control of UCH and which may or may not prove to be correct. As a result, no representation or warranty is made as to the feasibility or attainability
of the projected financial information or the accuracy or completeness of the assumptions from which the projected financial information is derived. There can be no assurance that the projections will be realized. Additionally, certain
provisions of various agreements are summarized in this PIM, but interested parties should not assume that such summaries are complete. Such summaries are qualified in their entirety by reference to the complete text of such
agreements. This PIM speaks only as of the date hereof or as of the date indicated. This PIM does not constitute an offer or invitation for the sale or purchase of the securities, assets or business described herein. The only information that
will have any legal effect will be that specifically represented, warranted and contained in a definitive agreement relating to a Transaction and executed by UCH (or one or more affiliate(s)) and a purchaser, and UCH and Cain Brothers
disclaim liability for any loss or damage incurred as a result of any information contained in or omitted from this PIM.
UCH reserves the right to negotiate with one or more qualified prospects at any time and to enter into a definitive agreement relating to a Transaction without prior notice to the recipient or other prospective partners. Further, UCH
reserves the right, at any time, to terminate participation in the investigation and proposal process by any party and to modify any procedures without giving advance notice or providing any reason therefor. UCH also reserves the right
during the evaluation period to take any action, whether within or outside the ordinary course of business.
“Cain Brothers, a division of KeyBanc Capital Markets” is a trade name of Cain Brothers & Company, LLC Member FINRA/SIPC. Cain Brothers & Company, LLC is a wholly-owned subsidiary of KeyBanc Capital Markets Inc. Member
NYSE/FINRA/SIPC.
Cain Brothers & Company, LLC, KeyBanc Capital Markets Inc. and KeyBank National Association are separate but affiliated companies. Securities products and services are offered by Cain Brothers & Company, LLC, KeyBanc Capital
Markets Inc. and their respective licensed securities representatives. Banking products and services are offered by KeyBank National Association. Credit products are subject to credit approval.
Carsten BeithManaging Director
(312) 604-0500
Dave MorlockManaging Director
(312) 604-0575
David LevineVice President
(212) 981-6941
Ethan HallbergAssociate
(415) 962-2930
Drew McCormickAnalyst
(212) 981-6957
Cain Brothers, a division of KeyBanc Capital Markets

Table of Contents
2
Section I. Executive Summary
Section III. Overview of UConn Health
Section IV. Organization and Management
Section V. Market Overview
Section VI. Financial Overview
Appendix

Executive Summary

• History of high-quality research programs has enabled
UCH to recruit distinguished researchers in neuroscience,
molecular biology, molecular pharmacology, biochemistry,
cell physiology, toxicology, and endocrinology
• UCH’s Alcohol Research Center is one of only 27 such
federally supported centers in the nation; the Connecticut
Clinical Chemosensory Research Center is one of only
ten
• UConn Technology Incubation Program – 28,000 sq. ft.
state-of-the-art wet labs/office space for small start-ups
• Located in Farmington, UConn Health is Connecticut’s flagship public
academic health center, with an integrated 3-part mission focused
around Education, Research and Patient Care
• Includes UConn School of Medicine (“SOM”); UConn School of
Dental Medicine (“SODM”); the Graduate School; John Dempsey
Hospital (“JDH”); UConn Medical Group (“UMG”); UConn Dental
Clinics; Research Laboratories; and technology incubation facilities for
start-up companies
• Critical source of the State’s future health care professionals, with 37%
of medicine and 44% of dental graduates practicing in the State
• Essential provider of healthcare and dental services to underserved
populations
Organizational Overview
Overview of UConn Health
4
Overview
Education Research Patient Care
• Enrollment in Fall, 2018 was 408 in SOM, 189 in SODM,
and 324 in the Graduate School.
• Outstanding national board performance and residency
placement
• Residency/GME program boasts 781 residents (675 medical
and 106 dental) who train and provide patient care in local
hospitals and dozens of settings in more than 20
communities across the state
• JDH and UMG make up the combined entity
(referred herein as the “clinical enterprise”)
soliciting a potential partner through this
public-private partnership process
• Provides medical services at seventeen locations
throughout Connecticut
• Essential healthcare provider to CT’s underserved citizens
with ~23% Medicaid inpatient days
• All UConn Health clinical care venues serve as sites for
teaching and learning
Key Statistics
• $758M of total operating revenue in 2017, including $540M of net
patient revenue
• Operating budget of >$1B, including ~$235M in state appropriations
annually
• Employs nearly 5,000 full- and part-time individuals across the clinical,
research, and academic missions, with over 2,300 devoted to the
clinical enterprise
• 10,000 inpatient discharges, 1.1M outpatient encounters and over
35,000 ER visits
• $87M+ in federal and non-federal research grants and contracts in
2017

The three major, interdependent missions of UConn Health, combined with Bioscience Connecticut, contribute to excellence in patient care, teaching, research, technology transfer and commercialization
The UConn Health Ecosystem
5
About Bioscience Connecticut
• Bioscience Connecticut aims to strengthen Connecticut’s position as a
national and global center for bioscience innovation, to grow
enrollment in the medical and dental school and to improve access to
quality health care for Connecticut citizens while simultaneously
securing UConn Health’s future as a top tier academic medical center
• Championed by the Governor and approved by the General Assembly,
the Bioscience Connecticut initiative was enacted in 2011 through
Public Act 11‐75
• Bioscience Connecticut is composed of two major components:
> Infrastructure expansion and renovation – the buildings and facilities that
house doctors and scientists and education and training programs for
medical, dental and graduate students
> Programs to improve access to quality healthcare
• Notable infrastructure achievements include (among many others):
> Incubator Lab: Completed a new 28,000 net sq. ft. building to foster new
business start-ups in the technology and biomedical fields
> New Hospital Tower: Completed a new 169-bed, 384,000 sq. ft.
hospital tower housing the ED, surgery suite, MRI suite, renal dialysis,
among other key patient areas, clinical support and a patient education
space at JDH
> Outpatient Pavilion: Completed a new 306,880 sq. ft. ambulatory care
facility in Farmington, occupied by the Carole and Ray Neag
Comprehensive Cancer Center and other outpatient services
> Lab Renovations: Renovated 205,000 sq. ft. of research facilities
PATIENT
CARE
MEDICAL
AND DENTAL
SCHOOLS
RESEARCH
BIOSCIENCE
CONNECTICUT
ECONOMIC
GROWTH
QUALITY
HEALTHCARE
Revenue from patient
care comprises nearly
50% of operating budget
and helps finance
schools and subsidizes
salaries, tuition, and
operations
Academic influence
precipitates research
interest and thought
leadership necessary for
start-ups and viable
technology transfers
Research stimulates
innovations that attract
business ventures and
build industry, securing
grants and contracts
from outside the State
($100M annually)
Schools provide the
next generation of
premier doctors and
dentists, who
strengthen our
healthcare sector, tax
base and communities
Research enables
schools to stay
competitive and attract
the best faculty and
students
Innovation drives
commercialization and
business development,
as well as bioscience
knowledge and patents
that spur high-skills
research jobs

State appropriation cuts, UCH’s challenging clinical cost structure and the evolving healthcare landscape are driving UCH to find a sustainable, long-term solution via a partnership for the UCH clinical enterprise
Transaction Rationale
6
State Appropriation Cuts:
• Budget adjustments made in the 2018 Legislative Session cut UCH’s state appropriation by $15.4M, bringing the total reduction in FY18 and
FY19 to $32.2M compared to FY17 appropriations
• Today, state appropriations, which are used entirely to pay employee salaries and benefits, fund 22% of UConn Health’s $1+ billion budget –
this dollar amount covers approximately 33% of UCH employee salary and benefits
• Further strain will be put on the clinical enterprise to perform financially to fill in the gap left by budget cuts, although state support is likely
to continue in the near-term
1
Clinical Cost Structure:
• The State’s fringe benefit rates have risen dramatically over recent years, driven by the State’s obligation to service the unfunded pension
liability
• The fringe rate at JDH has risen to an average 71% in FY 2019, compared to an average of just under 30% for other hospitals in CT
• In addition, planned salary increases in FY 2020 and FY 2021, negotiated by SEBAC,(1) will increase salaries for the vast majority of UCH’s
employees, with limits on layoffs until 6/30/2021 for unionized employees hired before July 1, 2017
• There may be opportunities to negotiate changes to the overall collective bargaining agreement cost structure effective July 1, 2021
2
Hospital Consolidation in Connecticut:
• Consolidation among CT hospitals has created larger, integrated delivery systems in the State
• Competitors are expanding rapidly and beginning to create sizeable, limited networks in partnership with third-party payors
• Partnering with a larger system will allow UCH to benefit from economies of scale and more effectively compete in the evolving healthcare
ecosystem
• Partnering will also increase opportunities for UCH residents, fellows, students and researchers
3
____________________
Notes:
1. State Employee Bargaining Agent Coalition that includes Connecticut’s collective bargaining coalition of which there are 7 unions
covering employees at UConn Health

UConn Health Clinical Partnership Opportunity
• The only public academic medical center in Connecticut
• Provides high quality patient care to over one million patients annually, with the clinical
enterprise employing over 2,300
• Educates the next generation of Connecticut’s healthcare providers and is on the cutting
edge of healthcare research and innovation
• Tremendous support from the State through Bioscience Connecticut
• Recently completed a $200M+ Outpatient Pavilion and $300M+ inpatient University Tower
• The inpatient tower was funded through general obligation state bond funds (1)
• System-wide Epic implementation, which went live in April, 2018, was primarily financed
through state bonds
• Low average age of facilities means capex requirements are minimal over the next few years
• Numerous awards and recognitions, including the Joint Commission Gold Seal of Approval ®,
American Heart Association’s Gold Plus Achievement Awards, BlueCross BlueShield
Association Distinctions in Maternity Care and Spine Surgery and Joint Replacement, among
others
• UConn Health is also an American Association of Gynecologic Laparoscopists Center of
Excellence in Minimally Invasive Gynecology
Premier Public Academic
Medical Center in
Connecticut
Brand New, State-of-the-
Art Facilities
Clinical Quality and
Excellence
7
John Dempsey Hospital, combined with UMG, has accomplished a great deal, and has capacity for further clinical,
operational and financial growth
____________________
Notes:
1. The bonds were issued through the UConn 2000 Act and are represented as a liability on the University of Connecticut’s balance
sheet. The State appropriates monies to the University to offset this liability.

UConn Health Clinical Partnership Opportunity
• Evidenced by lower unemployment, higher median home prices and higher median household
income when compared to state and national averages
• The neighboring communities, from where a significant number of UCH’s patients originate,
have extremely strong per capita income
• Despite negative industry trends, clinical volumes at UCH are strong, with patient days at
John Dempsey Hospital seeing 10+% year-over-year growth from 2017 to 2018
> Patient days growth achieved through true operational improvements, without a corresponding
increase to average length of stay
• Clinical operating initiatives such as lowering length of stay and improving provider
productivity are underway to further improve utilization
• Financial performance has improved materially over the past year
• UCH is at the cutting edge of biomedical research and innovation and has ~$100 million in
extramural research support for the current year
• Patients have access to quality care and the latest clinical trials through Type II Centers in
cardiology, cancer care, musculoskeletal care, breast imaging and geriatrics, as well as other
programs
• Partnering will increase opportunities for UCH residents, fellows, students and researchers
Attractive Demographics
and Market Dynamics
Strong Operating Metrics
Research and Innovation
8

UConn Health’s reasons for exploring a public-private partnership for its clinical enterprise
Partnership Objectives
9
Provide scale and market positioning to enhance UConn Health’s patient volume, clinical performance, and
network expansion
Provide financial sustainability for UCH’s clinical enterprise
Expand and support research opportunities for UConn faculty, including fulfillment of the goals of
Bioscience Connecticut so that it can positively impact the lives of the citizens of Connecticut and the
world
Expand and support the educational mission for the residents, fellows, and students at the UConn School of
Medicine, School of Dental Medicine, and Graduate School, including preserving the integrity of the Schools’
academic affiliations

The University of Connecticut Board of Trustees has delegated to the UConn Health Board of Directors certain responsibility and authority
Organizational Structure
10
University
Board of Trustees
UConn Health
Board of Directors
University of Connecticut
University of Connecticut
Health Center
(UConn Health)
John Dempsey
Hospital
UConn Medical
Group
Central
Administration and
Finance
University of Connecticut Health
Center Finance Corporation
UCHCFC Circle
Road Corporation
UConn Health
Pharmacy Services
Inc.
School of MedicineSchool of Dental
Medicine
Educational Clinics
(includes University
Dentists)
Clinical enterprise
____________________
Notes: UMG providers are faculty members of The School of Medicine

$375 $395 $437
$102 $103 $110
$477 $499 $547
2016 2017 2018
JDH UMG
Clinical Enterprise Financial Summary
Salaries and Fringe Benefits
Payor Mix (2018)(3)
Revenue(1)
Total Capital Expenditures(2)
($ in millions)
$233 $258 $277
$136 $144 $139 $369
$402 $416
77% 80% 76%
56%
70% 74%
2016 2017 2018
UMG Salaries & Benefits JDH Salaries & Benefits
Salaries & Benefits as % of Revenue Fringe as % of Salaries
($ in millions)
$10
$296
$57 $27
86.3%
2095.4%
231.9% 103.4%
(5000.0%)
(4000.0%)
(3000.0%)
(2000.0%)
(1000.0%)
0.0%
1000.0%
2000.0%
2015 2016 2017 2018
Capital Expenditures Capex as % of Depreciation
($ in millions)
____________________
Notes:
1. Eliminating entries of ~$4M pre year are subtracted from UMG revenue
2. Includes Transfers from UConn Health for New Hospital Tower of $273.3M and $21.3M in 2016 and 2017, respectively.
3. Unaudited year-to-date April 2018
Commercial / HMO
31% Medicare28%
Medicaid23%Managed
Medicare
13%
Self-Pay / Other
5%
Gross Patient Revenue Net Patient Revenue
Commercial / HMO
43%
Medicare25%
Medicaid18%
Managed Medicare
10%
Self-Pay / Other
4%
11

Overview of UConn Health

Our Mission
13
UConn Health is dedicated to helping people achieve and
maintain healthy lives and restoring wellness/health to
maximum attainable levels.
In this quest, UConn Health will continuously enable students,
professionals and agencies to promote the health of
Connecticut’s citizens. UConn Health will consistently pursue
excellence and innovation in the education of health
professionals; the discovery, dissemination and utilization of
new knowledge; the provision of patient care; and the
promotion of wellness.
“
”

UConn Health has been on the cutting edge since its inception. Recent capital improvements have brought the campus even further into the 21st century
History
14
1881 – The University of
Connecticut is founded
2012 – UConn, in
partnership with the
State, launches Bioscience
Connecticut
2015 – UConn Health
opens its new state-of-
the-art Outpatient
Pavilion 2016 – UConn Health
completes the
construction of
University Tower
1961 – UConn Health
is established
1975 – John Dempsey
Hospital opened in
Farmington, CT
2014 – Jackson
Laboratory for Genomic
Medicine opens on
UConn Health’s campus

Overview of UConn Health Entities
15
Entity Description
UConn Health
An organizational unit of the University of Connecticut, UConn Health is a comprehensive state-owned academic medical center, which has the traditional
tripartite missions of education, patient care and research as well as community service and public health. Its main campus is located in a complex of buildings in
suburban Farmington, Connecticut. UConn Health was established in 1961 and is currently comprised of the School of Medicine, the School of Dental Medicine
and their associated Educational Clinics, the Graduate School, John Dempsey Hospital, University Medical Group, University of Connecticut Health Center
Finance Corporation, research laboratories, a health sciences/medical library and administrative and other support facilities. It operates more than 400 clinical
and educational programs throughout Connecticut and is a referral center for persons with certain illnesses requiring complex patient care.
John Dempsey Hospital
JDH has 234 licensed beds (193 staffed), and is located in Farmington, a suburb of Hartford. It serves as a primary teaching hospital for the Schools of Medicine
and Dental Medicine, and participates in the clinical education of students from other health profession education programs. JDH provides a full range of
services, including surgery, medicine, cardiac care, psychiatry, and obstetrics and gynecology. JDH is also the focus of specialized services, including programs for
the treatment of arthritis, lupus, alcoholism, cancer, hemophilia, high-risk pregnancies, dental diseases in the handicapped, and taste and smell deficiencies. JDH
also provides emergency dental care through an agreement with the Educational Clinics.
UConn Medical Group
The faculty practice of UConn Health, UMG is a key component of UConn Health's integrated health care delivery system. UMG operates as a separate,
identifiable entity of UCH. As one of the largest medical practices in Greater Hartford, UMG has an extensive array of ambulatory care clinics and over 420
providers offering over 50 specialty care services as well as primary care.
Finance Corporation
The University of Connecticut Health Center Finance Corporation (“Finance Corporation”) was established in 1987 pursuant to Public Act No. 87-458. The
purpose of the Finance Corporation is to provide greater flexibility for JDH, UMG, and other UCH entities and to promote the more efficient provision of
healthcare services. The Finance Corporation is empowered to purchase supplies and equipment, acquire facilities, approve write-offs of accounts receivable,
negotiate joint ventures and shared services and other agreements, and process malpractice claims on behalf of UConn Health, all for the clinical enterprise.
School of Medicine,
School of Dental
Medicine and the
Graduate School
The UConn School of Medicine (including, SOM and SODM and Graduate School) was established in 1961 on the then new 160-acre campus in Farmington. The
SOM and SODM offer four-year post-baccalaureate programs leading to the M.D. and D.M.D. degrees, respectively, as well as residency programs which
provide advanced training in preparation for licensure practice and certification within a field of specialization. The Graduate School offers Ph.D. and Master's
degree programs in nine biomedical sciences and in community health and dental sciences. SOM and SODM faculty are generally expected to develop an active
research program, both to advance knowledge within their field of expertise and to enhance the quality of patient care and education. Approximately $100
million was generated in FY 2017 by the research activities of the various faculties, which supplements appropriations from the State. Enrollment in Fall, 2018
was 408 in SOM, 189 in SODM, and 324 in the Graduate School.
These entities make up the clinical enterprise – UConn Health would consider a
partnership with one or both of the clinical entities

FY 2016A FY 2017A FY 2018A
Net Patient Care $351.9 $367.7 $398.7
Other Income 26.2 30.6 40.8
Total Revenue 378.1 398.3 439.6
Personnel Services 145.7 146.0 148.8
Fringe Benefits 87.2 112.0 128.3
Medical & Internal Contractual Support 45.9 47.7 51.1
Medical Supplies 35.6 39.0 43.5
Outside & Other Purchased Services 29.0 30.4 39.3
Other 67.2 78.9 93.5
Total Expenses 410.6 454.0 504.5
Operating Income (32.5) (55.8) (64.9)
Depreciation 8.9 18.8 20.1
Transfers from UConn 8.0 15.5 26.9
EBITDA ($15.6) ($21.5) ($17.9)
FY 2016A FY 2017A FY 2018A
Discharges 9,061 9,240 10,105
Adjusted Discharges 25,365 26,673 27,823
ALOS 4.1 4.2 4.1
Patient Days 37,357 38,339 42,303
Average Daily Census 102.1 105.0 115.9
Adj Patient Days 104,578 110,673 116,316
Total Surgical Cases 10,840 10,559 11,651
ER Visits 32,762 34,199 35,595
Deliveries 744 852 872
Overview of John Dempsey Hospital
16
• Flagship state-owned acute care teaching hospital in Connecticut, with 234
licensed beds and 193 staffed acute care beds
• Provides specialized and routine inpatient and outpatient services, including
comprehensive cardiovascular, cancer and musculoskeletal services, as well
as, high risk maternity and, through Connecticut Children’s Medical Center,
neonatal intensive care
• Home to the only Emergency Department in the Farmington Valley
• 169-bed, $318 million new patient tower opened in June, 2016
• Recent financial and operating performance characterized by steady revenue
growth and robust patient volumes
• Profitability has declined in recent years due to UConn Health’s
unsustainable all-in clinical cost structure
Overview Summary Income Statement (1)
Key Operating Statistics
____________________
Notes:
1. Unaudited pro forma financials
($ in millions)

FY 2016A FY 2017A FY 2018A
Net Patient Care $92.5 $93.2 $101.5
Other Income 10.4 10.8 9.4
Total Revenue 102.8 104.1 110.9
Personnel Services 91.6 90.7 90.0
Fringe Benefits 44.6 53.5 49.1
Medical & Internal Contractual Support 20.1 21.4 21.5
Medical Supplies 1.1 1.6 1.7
Outside & Other Purchased Services 8.1 7.8 10.5
Other 17.2 14.2 18.6
Total Expenses 182.6 189.3 191.5
Operating Income (79.8) (85.2) (80.6)
Depreciation 5.2 5.8 5.8
Transfers from UConn 54.2 53.0 63.0
EBITDA ($20.3) ($26.4) ($11.8)
Internal Medicine 27
Surgery 24
Dermatology 14
Hospitalist 11
Obstetrics 8
Radiology 7
Cardiology 7 Pathology 7
Orthopaedics 6 Neurology 6 General Medicine 5 Gastroenterology 5 Geriatrics 5 Psychiatry 4 Ophthalmology 4 Nephrology 4
Other 50
Other 90
UMG Physician Composition by Specialty
Overview of UConn Medical Group
17
Overview
• UMG is one of the region’s largest multi-specialty faculty clinical practices
• Clinical operations are modeled, in part, on private group practices and
include over 420 providers in a wide variety of specialties
> Includes 316 physicians and 107 advanced practice providers
• UMG’s operation is an essential element for the education and training of
medical students that enables the SOM to accomplish its mission
• Physicians act as both SOM faculty and clinical providers under UMG –
compensation split between the two entities based on time spent teaching
or treating patients, respectively
• The vast majority of UMG physicians are unionized under AAUP(1)
• While productivity and volumes continue to grow, there is opportunity to
better support the approximately 55% of physicians who are below their
wRVU targets(2). This speaks to the opportunity to improve access, enhance
clinical growth, make practices more efficient, and support operations
____________________
Notes:
1. American Association of University Professors
2. Based on the target benchmark developed by United HealthSystem Consortium (UHC). UMG physician productivity is adjusted for
effective clinical time spent by the physician
3. Unaudited pro forma financials
Summary Income Statement (3)
($ in millions)

Graduate Medical Education
18
Overview
• The Schools of Medicine and Dental Medicine sponsor 65 residency and fellowship programs,
supporting over 781 residents (675 medical and 106 dental) in graduate medical education at JDH
and other hospitals, all of which are part of the Capital Area Health Consortium
• UCH sponsors residency programs in the following categories:
> Anesthesiology
> Dental
> Dermatology
> Emergency Medicine
> Family Medicine
> Internal Medicine
> Neurology
> OB/GYN
• Residents provide patient care in more than 20 communities across the state, including: Hartford,
Bridgeport, New Britain, Middletown, East Hartford, Manchester, Waterbury, Norwich, New
Haven, Derby, Willimantic, Putnam, Torrington, Farmington, West Hartford, Meriden, Suffield,
Cheshire and Newington
• UConn’s SOM and SODM residency programs are critical to ensuring the future medical and
dental workforce in the State, contributing to the quality of health care provided by participating
hospitals, and bringing in additional Medicare reimbursement revenues to Connecticut
> Orthopaedic Surgery
> Otolaryngology
> Pediatrics
> Preliminary Medicine
> Primary Care Internal Medicine
> Psychiatry
> Radiology
> Surgery
Consortium Hospitals
Residents train and provide patient care in local hospitals and dozens of neighborhood settings in more than 20 communities across Connecticut
To fulfill the academic mission, UConn Health and the SOM must maintain adequate control
over the conduct of GME programs and medical school education programs and comply with
all LCME and ACGME accreditation standards

Overview of Jackson Laboratory for Genomic Medicine
19
Overview
• Located on UCH’s lower campus, the Jackson Laboratory for Genomic Medicine (“JAX”) collaborates with Connecticut’s leading medical institutions, including
UConn Health and the Yale University School of Medicine, to find new ways to predict, prevent, diagnose and treat diseases such as cancer, heart disease, infectious
diseases, Alzheimer’s and diabetes
> The Jackson Laboratory, is an independent, nonprofit research organization that expanded to Connecticut to translate its fundamental science to the clinic and further
their mission in the area
> In addition to the Farmington location, JAX has a mammalian genetics headquarters in Bar Harbor, Maine and a facility in Sacramento, CA
• Since its opening in 2014, JAX has worked with hospitals in Connecticut and beyond to find precise genomic solutions for disease and to empower the global
biomedical community to improve human health
• The 183,500 sq. ft. facility currently houses over 350 biomedical researchers, technicians and support staff in state-of-the-art computing facilities and laboratories

Areas of Clinical Excellence –Type II Centers
20
UCH is home to multiple Type II centers for excellence in clinical care and institutional research, including clinical centers for cardiology, cancer care, musculoskeletal care and imaging
The Pat and Jim Calhoun Cardiology Center Carole and Ray Neag Comprehensive Cancer Center
• Offers a complete range of services, from preventative cardiology to
sophisticated interventional and surgical procedures
> Also offers specialized services to manage high blood pressure, including
treatment-resistant hypertension, as well as complete care to diagnose and
treat heart failure, heart rhythm disorders and vascular disorders such as
peripheral arterial disease, abdominal aortic aneurisms and carotid disease
• Patients have access to the latest research and clinical trials; many of these
research projects build upon unique research strengths at UCH and areas of
excellence like the Center for Vascular Biology, which is focused solely on the
study of blood vessel function
• Received the AHA Mission: Lifeline STEMI Receiving Center Gold Performance
Achievement Award in 2014 and 2015
• Provides evaluation, individual counseling, rehabilitation and treatment by
physicians and nurses from multiple specialties for cancer patients
> Areas of expertise include medical oncology, radiotherapy, surgical
oncology and gynecologic oncology
• Accredited by the Commission on Cancer, a program of the American College
of Surgeons that recognizes cancer programs nationwide for excellence
> First won Commission on Cancer approval in 1977 and has maintained
that status in every subsequent review
• The Clinical and Translational Breast Program at the Carole and Ray Neag
Comprehensive Cancer Center is accredited by the National Accreditation
Program for Breast Centers (NAPBC)
Annual Encounters
53,361 53,852
57,020
50,000
51,000
52,000
53,000
54,000
55,000
56,000
57,000
58,000
59,000
2016 2017 2018
24,805 26,250
24,850
0
5,000
10,000
15,000
20,000
25,000
30,000
35,000
2016 2017 2018
Annual Encounters

UConn Musculoskeletal Institute The Beekley Imaging Center
Areas of Clinical Excellence –Type II Centers (cont’d)
21
UCH is home to multiple Type II centers for excellence in clinical care and institutional research, including clinical centers for cardiology, cancer care, musculoskeletal care and imaging
• The UConn Musculoskeletal Institute is the region’s premier choice for
complete care for a range of problems affecting bones, joints, muscles and
connective tissue
• Team includes nationally and internationally recognized experts in orthopaedic
surgery and sports medicine, comprehensive spine care, rheumatology, and
osteoporosis
• Combines patient care with education, including an orthopaedic residency
program and fellowship programs in endocrinology, family medicine, sports
medicine, hand surgery, orthopaedic sports medicine, pediatric orthopaedics
and rheumatology
• National and international scientists and clinicians pursue research in a variety of
areas including bone repair, osteoporosis, cartilage metabolism, soft tissue
repair, stem cell therapies, tissue engineering, etc.Center on Aging
• Offers the latest technologies in detecting
breast cancer, including leading-edge breast
imaging and digital mammography
• All-digital mammography and computer aided
detection system searches for patterns that
are typically recognized as indicators for
cancer
• First healthcare provider in the region to
provide 3D Mammography (Tomosynthesis)
• Team of board-certified geriatricians provide
comprehensive, individualized care for aging
adults
• Faculty conduct world-class research on
geriatric medicine, supported by a research
portfolio of more than $5M per scientist
• Geriatric Medicine Fellowship trains internal
medicine and family medicine graduates for
leadership careers in geriatric medicine
74,379 71,640 79,698
0
10,000
20,000
30,000
40,000
50,000
60,000
70,000
80,000
90,000
100 ,000
2016 2017 2018
Annual Encounters

UConn Health maintains a significant portfolio of clinical offerings
Overview of Services
22
Primary Care
• Aging & Geriatrics
• Family Medicine
• Internal Medicine
• Pediatrics
Behavioral Health
Cancer Care
• Bladder, Breast, Colon, Head and
Neck, Kidney, Lung, Ovarian,
Prostate, and Skin Cancer
Solutions
• Cancer Screening, Risk Assessment
• Hematology/Oncology
Diagnostic & Testing
• Bone Density
• Diagnostic Imaging/Radiology
• Laboratory and Blood Draw
• MRI
• Neuropsychology
Emergency Services
• Emergency Medical Services
• Poison Control
• Urgent Care
Specialty Care
• Audiology
• Cardiology
• Dental Care
• Dermatology/Dermatopathology
• Endocrinology
• Gastroenterology
• Infectious Disease
• Neonatal Intensive Care (1)
• Nephrology
• Neurology
• Osteoporosis & Metabolic Bone
Diseases
• Podiatry
• Pulmonary Medicine, Hypertension
• Rheumatology
• Urology
Physical Medicine
• Physical Therapy & Rehabilitation
• Speech/Language Pathology
• Nutritional Counseling
• Orthopedics & Sports Medicine
Surgical Care
• Cardiac Surgery
• Colorectal Surgery
• Cosmetic Plastic Surgery
• General Surgery
• Gynecologic Surgery
• Hand & Wrist
• Neurosurgery
• Orthopedic Surgery
• Ophthalmology
• Otolaryngology
• Hip & Knee Replacement Surgery
• Urological Surgery
• Vascular Surgery
Women’s Health
• Pregnancy & Birth
• Mammography
• Maternal Fetal Medicine
• OB/GYN
Other
• Clinical Research & Trials
• Ergonomics
• Child and Adolescent Behavior
Health
• Mental Health
• Psychiatric Services
• Sleep Disorders
____________________
Notes:
1. In partnership with Connecticut Children’s Medical Center, which holds the license for this service

Service Physicians % of Total
Internal Medicine 192 28.6%
Surgery (general) 95 14.1%
Diagnostic Imaging & Therapeutics 73 10.9%
Obstetrics & Gynecology 48 7.1%
Psychiatry 46 6.8%
Pediatrics 41 6.1%
Anesthesiology 36 5.4%
Orthopaedics 31 4.6%
Emergency Medicine 28 4.2%
Dental 34 5.1%
Dermatology 25 3.7%
Family Medicine 13 1.9%
Pathology 7 1.0%
Podiatry 3 0.4%
Total 672 100.0%
Board
Certified
91%
Not Board
Certified
9%
UConn Health’s medical staff numbers 672, including both employed providers and independent community medical staff
Physician Staff Overview
23
Medical Staff by SpecialtyPhysician Board Certification Status
N = 672
Average Age of Physicians:
49 Years Old

859 866 868 894
0
200
400
600
800
1000
FY16 FY17 FY18 FY19 YTD
Total Providers
UConn Health’s robust recruiting engine allows it to maintain its world-class faculty and physician base
Medical Staff Recruitment
24
• Between August, 2017 and August, 2018, UCH’s Clinical Council
approved 54 faculty requests. To date:
> 31 of these positions have been filled
> 4 are scheduled to be filled
> 19 remain open and are being recruited
Recent and Planned Hiring Integration Plan
Recruitment Overview
• UMG is co-led by an administrator and a physician, working
collaboratively with a Clinical Council to set recruitment priorities,
allocate resources and strengthen the practice
• UCH employs two provider relations professionals who focus on the
onboarding/ramp-up of all clinical providers, connecting specialists to
referral sources with a goal of reaching full productivity before budgeted
target
• Success in employee recruitment, both with clinical physicians and in the
basic sciences, has been strong and steady
> Basic sciences are the departments in the medical school where
PhD faculty conduct research
• UConn Health leverages its thriving and transformative research
enterprise to attract best-in-class talent
> Research capacity and productivity has grown due to recent
investments in existing and new facilities
Provider Growth

FY 2016A FY 2017A FY 2018A
Unique Visits - excl Anesthesia 659,656 656,848 667,009
Unique Anesthesia Visits 15,939 16,486 17,210
Total Invoices 821,641 819,422 592,784
Total Invoices per Unique Visits 1.2 1.2 0.9
Physician RVUs 1,031,645 1,054,534 1,084,289
Physician RVUs per Visit 1.6 1.6 1.6
FTEs - Support Staff 561 562 577
FTEs - Providers 189 192 185
Total FTEs 750 754 762
Gross Charge per Unique Visit $305.6 $308.3 $336.1
Gross Charge per RVU $195.4 $192.0 $206.8
Total Revenue per Unique Visit $154.8 $156.7 $166.2
Total Revenue per RVU $99.0 $97.6 $102.3
Expense per Unique Visit $251.9 $263.0 $252.9
Expense per RVU $161.1 $161.8 $157.5
FY 2016A FY 2017A FY 2018A
Discharges 9,061 9,240 10,105
Adjusted Discharges 25,365 26,673 27,823
Average Length of Stay 4.1 4.2 4.1
Admissions 9,068 9,245 10,082
Patient Days 37,357 38,339 42,303
Adjusted Patient Days 104,578 110,673 116,316
Average Daily Census 102.1 105.0 115.9
Total Surgical Cases 10,840 10,559 11,651
Adj. Occupied Bed 285.7 303.2 318.7
FTEs per Adj. Occupied Bed 4.65 4.56 5.39
Case Mix Index 1.52 1.53 1.54
Occupancy Rate 56.7% 58.4% 64.4%
ER Visits 32,762 34,199 35,595
OP Equivalents 16,304 17,433 17,680
Deliveries 744 852 872
Despite industry headwinds, volume and utilization is strong, with patient days at JDH growing over 10% between 2017 and 2018
Key Operating Statistics
25
UMG Utilization StatisticsJDH Utilization Statistics
____________________
Notes:
1. Increase in FTE per Adjusted Occupied Bed from FY17 to FY18 is mainly due to an increase in employees, offset by a decrease
in contractual employees
(1)

Footnote
Department FTE Count
NICU 93Emergency Room Unit 77UMG-Call Center 67Medicine 3 Unit 65Neag Cancer Center Unit 64UMG-Orthopaedics 63Surgery/Orthopaedics Unit 62Intermediate Unit 58Intensive Care Unit 55UMG-Univ Phy Patient Accts 52Dermatology Clinic 52Operating Room Unit 50Pharmacy 50OB/GYN 43Psychiatry 1 Unit 43Radiology 42Medical/Surgical/Oncology Unit 38Patient Services 38Health Information Management 37Core Lab 35Cardiology 32Phlebotomy-Lab Med 30Patient Access 26UMG-Administration 25UMG-Internal Medicine 24Anesthesiology Operating Statement 23UMG-IMA West Hartford 23Psychiatric Clinic 22UConn Health Surgery Center-OR 22UMG-Surgery - Ophthalmology 22UMG-General OB 22Other (134 Depts.) 992
Employee Overview
26
Division FTE Count
Hospital 1,568
SOM 976
UMG 779
Institutional Support 700
SODM 279
Total 4,302
UCH-Paid FTEs JDH and UMG FTEs by Department
____________________
Notes:
1. Licensed and operated by Connecticut Children’s
(1)

SEBAC 5-Year Wage Package
Year Dates Wage Increase
FY 17 7/1/16 - 6/30/17 Hard 0% Freeze
FY 18 7/1/17 - 6/30/18 Hard 0% Freeze
FY 19 7/1/18 - 6/30/19Hard 0% Freeze + $2,000 lump-sum payment, or
top step lump sum plus $1,000 if greater
FY 20 7/1/19 - 6/30/20 3.5% GWI increase plus step increment
FY 21 7/1/20 - 6/30/21 3.5% GWI increase plus step increment
Union employees are governed by many provisions of the 2017 SEBAC agreement negotiated with the State
Summary of Unions
27
Bargaining Unit Full Name FTE Count Head Count
1199 - Para-Professional Health Care (NP-6) New England Healthcare Employees Union District 1199 265 292
A&R - Administrative and Residual (P-5) Administrative & Residual Employees Union 10 10
AAUP - Faculty American Association of University Professors 547 590
AFSCME - Administrative Clerical (NP-3) American Federation of State, County and Municipal Employees 246 266
CEUI - Maintenance & Service (NP-2) Connecticut Employees Union Independent 195 209
CPFU - Protective Services (NP-5) Protective Services Employee Coalition 2 2
UHP - University Health Professionals University Health Professionals 2,533 2,708
Total Represented 3,797 4,077
Not Represented 554 801
Total Employees 4,352 4,878
% Represented 87.3% 83.6%
Summary of UConn Health Union Employees
Summary of Key SEBAC and Other Collective Bargaining Terms
• On July 31, 2017, the CT General Assembly approved the SEBAC Agreement, which includes 7
UCH bargaining units representing ~4,000 public services employees at UConn Health
• Under the SEBAC Agreement, the parties agreed to certain structural pension plan changes for
employees hired after July 1, 2017 and made certain modifications to existing health and pension
plans to increase contributions for current employees. The SEBAC Agreement, together with the
individually negotiated union agreements, also provides certain protections from lay-off (and in the
case of faculty, non-renewal) for employees hired prior to July 1, 2017. For faculty, the protections
extend through June 30, 2020; for other employees, the protections extend through June 30, 2021.
• The Agreement also provides for certain across-the-board wage provisions and changes in terms
and conditions of employment sought by management, to be negotiated with each of the unions.
The negotiated wage increases are outlined in the table to the right

New Enterprise-wide EMR System
28
UCH recently installed an enterprise-wide Epic EMR product, which went live on April 28, 2018
• UCH’s new integrated electronic health record system launched in April, 2018, making patient records easily accessible to all members of the care team and
to the patient
• UCH’s EMR System represents a technological, clinical, and operational transformation aimed at enhancing the patient experience. At its heart is an EHR
platform powered by Epic that facilitates collaboration, knowledge-driven care coordination, and continuous improvement
Overview of UConn Health’s EMR
Providers Patients Non-Clinical Advantages
• Seamless flow of information following the
patient throughout their encounter not only
with UConn Health, but also with other health
care systems through Epic’s interoperable Care
Everywhere tool
• All members of the care team, including
referring physicians, have simultaneous access
to up-to-date patient information
• Patients get more efficient care and can
access their test results and other health
information at any time
• A secure online portal enables patients to
message their care team, request
prescription refills, and manage appointments
• Positions JDH to be Meaningful Use Stage 3
compliant
• Creates additional opportunities to improve
clinical business office functions and other
potential operational processes, including:
> Revenue cycle management
> Training internal IT/EMR staff
> Healthcare reform and regulatory
compliance (MU, ICD-10, MACRA, PQRS,
etc.)

Aerial View
Campus Map
29
Map Legend
Academic Building…………………………………………………………………………………………………………AB
Academic Entrance…………………………………………………………………………………………………………AE
Academic Research Building…………………………………………………………………………………………………………AR
Administrative Services Building…………………………………………………………………………………………………………AS
Creative Child Center…………………………………………………………………………………………………………CC
Center for Comparative Medicine…………………………………………………………………………………………………………CM
Emergency Department…………………………………………………………………………………………………………ED
195 Farmington Avenue…………………………………………………………………………………………………………FA
Fire Department…………………………………………………………………………………………………………FD
Garage 1…………………………………………………………………………………………………………G1
Garage 2…………………………………………………………………………………………………………G2
Garage 3…………………………………………………………………………………………………………G3
UConn John Dempsey Hosptial…………………………………………………………………………………………………………H
Jackson Laboratory for Genomic Medicine…………………………………………………………………………………………………………JL
Laboratory…………………………………………………………………………………………………………L
Main Building…………………………………………………………………………………………………………MB
Medical Examiner…………………………………………………………………………………………………………ME
Musculoskeletal Institute…………………………………………………………………………………………………………MI
Outpatient Pavilion…………………………………………………………………………………………………………OP
Warehouse …………………………………………………………………………………………………………W
Campus Map

Description Gross SF Interior SF Net SF Education Research Patient Care & Admin Inst. Support Primary Usage
Administration Instructional Wet Lab Office Outpatient Inpatient
MAIN BUILDING 1,760,258 1,548,599 938,066 22,694 57,839 117,600 91,210 212,805 240,704 113,736 Multiple
MUSCULOSKELETAL INSTITUTE 103,396 94,816 76,970 0 0 10,289 8,859 56,413 0 1,409 Clinic
OUTPATIENT PAVILION 318,759 286,607 204,828 0 0 0 0 201,521 0 0 Clinic
UNIVERSITY TOWER 410,438 350,827 225,065 0 0 0 0 44,782 137,956 14,264 Hospital
CLINIC 344,847 310,439 191,646 240 15,843 5,962 25,922 89,148 24,210 6,534 Clinic
CONNECTICUT TOWER 190,621 166,832 120,764 0 0 0 1,845 30,692 60,022 278 Hospital
CANZONETTI 95,999 86,364 64,222 0 0 0 0 48,184 9,433 6,605 Hospital
Farmington
Overview of Clinical Facilities
30
Main Building
• The Main Building on the UCH Upper Campus includes the Connecticut Tower and several other areas for patient care, research and Medical and Dental School education functions
• JDH operations in the Main Building and Connecticut Tower include the Pat and Jim Calhoun Cardiology Center with three Cath/EP lab rooms, the Procedure Center for GI/Endo procedures, blood draw services, the clinical pharmacy and clinical lab, OB/GYN/labor and delivery, inpatient psychiatry, neurophysiology, radiology, nuclear medicine, pulmonary, nephrology, and various administrative office functions
• The NICU is located in the Main Building, but is leased and managed by Connecticut Children’s Medical Center (not licensed under JDH)
Musculoskeletal Institute
• The MSI, built in 2005, houses 100,000 sq. ft. of clinical and research activity focused on musculoskeletal health
• JDH functions include a 6-room outpatient surgery center as well as clinical practices for orthopaedics and sports medicine, rheumatology, osteoporosis, and comprehensive spine center.
• Rehab and imaging services are also provided at this location
Described on following slides
Musculoskeletal
Institute
Main Building
____________________
Notes:
1. Academic offices located in UCH are part of the School of Medicine
(1)

Outpatient Pavilion
31
• Opened in 2015, the Outpatient Pavilion is an approximately 320,000 sq. ft. state-of-the-art multispecialty outpatient clinical building on UCH’s Lower Campus and includes a 1,400 space parking garage
• The 8-story building is home to the majority of UMG’s physician practices and JDH outpatient services
• The building also includes patient-centered services such as a café, a commercial pharmacy and an optical shop
• Construction of the Outpatient Pavilion was funded by a $203M mortgage with TIAA-CREF, which is held by Circle Road Corporation (a subsidiary of the Finance Corporation)
> Circle Road Corporation holds a direct financing lease with UCH for the Outpatient Pavilion and associated equipment
> Mortgage payments are funded by lease payments to the Finance Corporation, which in turn makes the scheduled mortgage payments
> Outstanding balance on the mortgage is $188.2M as of June 30, 2018
• Departments include: Internal Medicine, Neurology, Occupational Medicine, Ophthalmology, Orthodontics, Physical Therapy, Plastic Surgery, Radiation Oncology, including TomoTherapy, Rheumatology, Urology, Vascular Surgery, Blood Drawing Stations, Carole and Ray Neag Comprehensive Cancer Center, Comprehensive Spine Center and Neurosurgery, Diagnostic Imaging, Ear, Nose and Throat, (Otolaryngology), Endocrinology, Gastroenterology, General Medicine, General Surgery, Women’s Center, Center for Healthy Aging (Geriatrics), and Infectious Diseases
Overview
Overview of Clinical Facilities (cont’d)

32
University Tower
Overview
• UCH completed the construction of the University Tower in 2016 – the
new hospital building is an addition to the existing Upper Campus Main
Building
> Replaced outdated space and expanded JDH services
> Includes 169 single inpatient bed room, a 42-bay Emergency
Department, surgery suite with 11 OR rooms and 1 hybrid OR
room, an MRI suite, renal dialysis, respiratory therapy, inpatient
rehabilitation, a clinical support floor and other support services
> Also includes two 400-car parking garages
• The $318 million new patient tower was funded from State general
obligation bonds
> Single patient rooms are designed to reduce stress, improve patient
safety, maintain confidentiality, minimize hospital-acquired infections,
enhance privacy and speed recovery
> Decentralized nursing stations enable nurses to remain in close
proximity to their patients
• Convenience and Access
> Farmington Valley’s only full-service 24/7 ED is all-new and has more
than doubled the capacity of the former ED
• Technology-enabled
> Voalte Platform for communications, Black Diamond Video
integration information delivery system in the OR, robotic surgery,
“TUG” robotic pharmacy delivery units, Epic EMR
Overview of Clinical Facilities (cont’d)

Accolades / Awards
33
Select Awards Year Description
ACTION Registry Gold Performance
Award2017
• For delivering the highest quality of cardiovascular care (as determined by the
ACTION Registry)
BlueCross BlueShield Association's Blue
Distinction Center in:
• Maternity Care
• Spine Surgery and Joint Replacement
Maternity
2017
Spine Surgery
2009
• For demonstrating expertise and a commitment to quality care for vaginal and
cesarean section deliveries, and for better overall patient satisfaction and a
lower percentage of early elective deliveries
• For expertise in safe, efficient, and cost-effective delivery of quality care for
knee and hip replacement and spine surgery
American Heart Association’s Gold Plus
Achievement Award, Elite Honor Roll
Stroke Award
2015• For treating patients with 85% or higher compliance to core standard levels of
care for two consecutive years.
American Heart Association’s Heart
Failure Gold Plus Quality Achievement
Award
2017• Recognizes the hospital’s commitment to ensuring heart failure patients receive
the most appropriate treatment to speed recovery and reduce readmissions
Mission: Lifeline® Gold Receiving Quality
Achievement Award2017
• Awarded for implementing specific quality improvement measures for the
treatment of patients who suffer severe heart attacks
• JDH is the only hospital in the State to win Mission: Lifeline Gold in heart
attack care for three consecutive years
AAGL Center of Excellence in Minimally
Invasive Gynecology2017
• Recognizes hospitals and surgeons around the world providing exceptional
minimally invasive gynecologic surgical care and dedicated to continuously
improving healthcare quality and patient safety
Commission on Cancer Accreditation 2017
• Recognizes cancer programs nationwide for excellence
• First won Commission on Cancer approval in 1977 and has maintained that
status in every subsequent review
National Accreditation Program for
Breast Centers (NAPBC)2017
• Awarded to organizations dedicated to the improvement of the quality of care
and monitoring of outcomes
The Joint Commission on Accreditation
of Health Care Organizations2017
• For demonstrating compliance with The Joint Commission’s national standards
for health care quality and safety in hospitals

Organization and Management

UConn Health has an experienced and dedicated senior management team
Organizational Chart
35
Andrew Agwunobi
UConn Health CEO &
Executive VP of Health Affairs
Jeff
Blumenthal
Chief Counsel
Susan Herbst
UConn President
Anne
Horbatuck
VP UMG
Administration
D. Stanley
Chief Medical
Information
Officer
Cindy
Molin
VP Patient
Experience
Vacant
CEO of UMG
Denis
Lafreniere
UMG Medical
Director
Bruce
Metz
Chief
Information
Officer
Jeff
Geoghegan
Chief Financial
Officer
Deb
Abromaitis
Compliance Officer
Chris Hyers
Director Business
Development &
Decision Support,
Chief
Communications
Officer
Carolle
Andrews
Chief Administrative
Officer / VP Human
Resources
JDH Administration:
• Andrew Agwunobi, JDH CEO
• Richard Simon, Chief of Medical Staff
• Ann Marie Capo, CNO & VP, Quality & Patient Care Service
• Scott Allen, Medical Director, Clinical Effectiveness & Patient Safety
Andrea
KeiltyDirector of
Government
Relations,
Health Affairs

Executive
Board of Directors
36
Kenneth Alleyne, M.D.
Orthopedic Surgeon, Healthcare Entrepreneur
A graduate of Williams College, Dr. Alleyne carried out his orthopedic residency at Howard University Hospital
and a fellowship in knee and shoulder surgery and sports medicine at Yale University. He is the managing partner
of Harthaven Capital Partners, a health care consultancy and investment firm based in Connecticut and New York,
and a founder of NextLevel Health Partners, a Medicaid and Medicare managed care company
Francis X. Archambault Jr, Ph.D.
Professor Emeritus at UConn, Board of Trustees
Mr. Archambault was an assistant professor at Boston University and later a social scientist at Abt Associates, Inc.
in Cambridge, Massachusetts before joining the UConn faculty in 1978. He has conducted research, evaluations
and policy analyses for a variety of governmental agencies and private organizations at the national, state, and local
levels
Richard M. Barry
Deputy Chief Risk Officer at Keybank
Richard is the deputy chief risk officer for KeyBank, and is also responsible for the credit risk, market risk, and
risk information and reporting functions of the company. Rich joined Keybank through the acquisition of First
Niagara Financial Group, where he was the chief risk officer. He was responsible for enterprise risk management,
operations, corporate compliance and regulatory risk, credit risk, consumer collections, market risk, fraud risk,
and operational risk
Andy F. Bessette
Executive Vice President, Chief Administrative Officer of The
Travelers Companies, Inc.
Andy Bessette is an executive vice president and the chief administrative officer of the Travelers Companies, Inc.
He has responsibility for corporate real estate, administrative service, community affairs, aviation, internal
investigations, event management, business continuity, and sports sponsorships. Bessette has been with Travelers
Companies, Inc. for 29 years and has held a variety of management positions
UConn Health Board of Directors: The University of Connecticut Board of Trustees governs both the University and UCH; however, UCH also has as a Board
of Directors to which the Board of Trustees has delegated certain responsibility and authority. Subject to duties reserved to the Board of Trustees, the UCH Board
of Directors is authorized to establish rules and general policies for the governance of UCH and its academic programs. The Board of Directors manages and directs
the expenditures of UCH. The Board of Directors is required by law to review and approve UCH budget requests and propose facility, planning and capital
expenditure budget priorities. The Board of Directors consists of up to 18 members, nine of which are appointed by a nominating committee of the Board of
Directors, three members appointed by the Chairperson of the Board of Trustees, three members appointed by the Governor and three voting ex-officio members
(the State’s Office of Policy and Management, the President of the University and the Commissioner of Public Health (or their designees)).
Experience

Board of Directors
37
Richard T. Carbray Jr.
Owner of Apex Pharmacy, Home Care and Nutritional
Center
Richard Carbray is co-owner of Apex Pharmacy and Home Care Center. Prior to this, he served as an adjunct
lecturer for pharmacy practice at the UConn School of Pharmacy and as legislative chairman of Connecticut
Pharmacists Association. Mr. Carbray graduated cum laude from the UConn School of Pharmacy.
Cheryl A. Chase, Vice Chair
Executive Vice President, Principal and General Counsel
Chase Enterprises
Cheryl Chase present affiliations include a trustee of the University of Connecticut Law School Foundation, a
member of the Connecticut Science Center, a trustee of the Wadsworth Atheneum Museum of Art, and a past
director of numerous public and private institutions. A graduate of Tufts University, she received her J.D. from
the University of Connecticut School of Law.
Sanford Cloud Jr., Chair
Chairman and Chief Executive Officer of Cloud Company,
LLC
Sandy Cloud is Chairman and CEO of The Cloud Company, LLC, a real estate development and investment firm.
Mr. Cloud is a lawyer and former two-term Connecticut State Senator and was the primary sponsor of legislation
creating the State Department of Housing. He currently serves on the boards of Eversource Energy, Ironwood
Mezzanine Fund FP, Thomas J. Dodd Research Center, The Connecticut Health Foundation, and The Greater
Hartford Metro-Alliance.
Anne Foley
Senior Policy Advisor to the Secretary of Connecticut’s Office
of Policy and Management (OPM)
Anne Foley is a thirty-year employee at OPM, and she has significant experience as a state government policy-
maker. Her previous positions with OPM included Undersecretary of Planning, Legislative Program Manager, and
Planning Specialist. Anne was an adjunct lecturer at the University of Connecticut School of Social Work from
1992 to 2016. Anne is a graduate of Providence College, earned a Master of Social Work from the University of
Connecticut, and earned a Master of Arts in Social Policy from Brandeis University.
John F. Droney, J.D.
Partner, Hinckley Allen Snyder, LLP
John Droney has served as a special state’s attorney for the judicial districts of Hartford and Waterbury, and is a
recipient of the UConn School of Law Distinguished Alumni Award. He has lectured at UConn and Quinnipiac
Law Schools, and was a founding principal of the Farmington law firm Levy & Droney. He received his J.D. with
honors from the UConn School of Law.
Joel Freedman
Independent Public Policy Consultant
Joel Freedman has been in the insurance and financial services industry for 40 years. He retired from The Hartford
Financial Services Corporation in 2008, after a 25-year tenure spent primarily as the director of Government and
Regulatory Affairs.
Executive Experience

Board of Directors
38
Susan Herbst, Ph.D.
President, UConn
Prior to her appointment to the presidency, Susan Herbst served as executive vice chancellor and chief academic
officer at the University System of Georgia, where she led 15 university presidents and oversaw the academic
missions for all 35 public universities in Georgia.
Timothy A. Holt
Independent Business Consultant
Timothy Holt previously served as the senior vice president and chief investment officer for Aetna, Inc., where he
held many positions throughout his career. He also retired as a director of Virtus Investment Partners and MGIC
Investment Corporation.
Dr. Raul Pino
Commissioner, Connecticut Department of Public Health
Dr. Raul Pino has served as the commissioner of the Connecticut Department of Public Health since he was
appointed in December of 2015. Prior to this, he worked for the city of Hartford as director of the city’s
Department of Health and Human Services where he managed the budget, oversaw labor relations and code
enforcement. He is a member of the American Public Health Association, and National Hispanic Science Network
on Drug Abuse
Dr. Wayne Rawlins, M.D., M.B.A
Vice President and Senior Medical Director Healthcare
Services, ConnectiCare, Inc.
Before his position at ConnectiCare, Dr. Wayne Rawlins spent time as the national medical director for racial and
ethnic equality initiatives at Aetna. He joined Aetna in 1997, and held a variety of leadership positions. Prior to
Aetna, he was a physician manager with the Northeast Permanent Medical Group for 13 years. He received his
medical degree form the UConn School of Medicine and completed his chief residency at the University of
Rochester in New York
Teresa M. Ressel
Private Company Management
Teresa Ressel served as the chief operating officer of UBS Securities and UBS Americas from 2004 until 2012.
Prior to UBS, she was confirmed by the U.S. Senate as assistant secretary for management and chief financial
officer of the Department of Treasury. She also spent time at Kaiser Permanente leading regulatory compliance,
change management, and financial matters related to corporate governance.
Kathleen D. Woods
Chairperson, Farmington Woods Golf Club
Kathleen Woods is a former vice president at various Bank of America institutions focusing primarily on
corporate trust and investment activities in the municipal, health care, higher education, and housing area in New
England. She has extensive experience in the administration of trustee services in connection with debt financings.
She has been a member of the Government Finance Officers Association, the Connecticut Women’s Council, and
the board of the Downtown Hartford YMCA
Executive Experience

UConn Health Leadership Team
39
Andrew Agwunobi, M.D., M.B.A.
UConn Health Chief Executive Officer, Executive
Vice President for Health Affairs
Prior to joining UConn Health, Andrew Agwunobi served as managing director and a co-leader of Berkley
Research Group’s Health System performance improvement consulting practice. He has also served as the
CEO of Providence Healthcare, of Grady Health System, and of Tenet South Fulton Hospital in East Point,
GA. He currently serves on the board of Dignity Health in California
Carolle Andrews
Chief Administrative Officer & VP, Human
Resources
Carolle serves as the Chief Administrative Officer at UConn Health for the past decade. In this position, she
has directed the administrative services that support the entire institution, including, Information Technology,
Human Resources, Facilities Management, Student Services, Campus Planning and Construction, Parking &
Transportation as well as Police and Fire Services. She was the executive responsible for the $800 million
capital improvement construction project Bioscience Connecticut. Mrs. Andrews has more than 25 years of
experience working in the insurance industry, with extensive operations, project management and regulatory
legal experience. She graduated from UConn Law in 1996
Jeffrey M. Blumenthal
Chief Counsel
Jeff leads UConn Health’s legal team within UConn’s Office of General Counsel, representing and advising
UConn Health on the many legal matters related to its clinical, academic and research missions. Previously,
Jeff represented UConn Health first as Assistant Attorney General and then as Senior Health Attorney. His
career includes serving as a transactional attorney at Debevoise & Plimpton; Vice President for government
affairs for a real estate development firm; and for many years as a lawyer, policy advisor and claims executive
in the insurance industry. He graduated from UVA Law in 1985
Jeffrey P. Geoghegan
Chief Financial Officer
Jeffrey manages all financial transactions for the School of Medicine, School of Dental Medicine, UMG and
John Dempsey Hospital. He also supervises the financial services departments, consisting of Accounting,
Budget, Procurement, Clinical Reimbursement, Patient Financial Service, Research and more. He previously
spent time at PricewaterhouseCoopers as a Senior Accountant, and was previously a board member of
CTHFMA
Chris Hyers
Chief Communications Officer
Prior to joining UConn Health in 2015, Chris oversaw Field Marketing & Communications for Mercy Health
based in Cincinnati, Ohio. In his healthcare career he has worked in academic, faith-based and investor
owned systems across the country. He is a fellow of the American College of Health Care Executives and
holds several academic appointments teaching health marketing and communications
Executive Experience

UConn Health Leadership Team (cont’d)
40
Andrea Keilty
Director, Governmental Relations
Andrea has served as UConn Health’s primary contact with state elected and appointed officials since 2015.
She has nearly 20 years of experience in Connecticut state government providing legal and policy advice and
support to agency leaders. Prior to joining UConn, Andrea worked as head counsel at the Department of
Administrative Services, and previously at the law firm of Wiggin & Dana
Bruce T. Liang, M.D., FACC
Dean, School of Medicine
Dr. Liang received his M.D. from Harvard Medical School in 1982, and completed his residency in internal
medicine at the UPenn University Hospital from 1982 to 1985, and his cardiology fellowship at Brigham and
Women’s Hospital/Harvard Medical School. He specializes in cardiovascular diseases, ischemic heart disease,
arrhythmias, peripheral arterial disease, and preventative cardiology. Dr. Liang is a fellow of the American
College of Cardiology and the American Heart Association to name a few
Sharon M. Gordon, D.D.S., M.P.H.,
Ph.D.
Dean, School of Dental Medicine
Dr. Gordon received her doctoral degree in dental surgery from the University of Texas Health Science
Center Dental School at San Antonio, and a Master of Public Health in epidemiology and a Ph.D. in clinical
investigation at Johns Hopkins University. She has spent time at the NIH, the University of Maryland, and
most recently at East Carolina University’s School of Dental Medicine in Greenville, North Carolina
Bruce Metz
Chief Information Officer
Bruce Metz has served as chief information officer for a number of leading organizations including Lahey
Health, Thomas Jefferson University and Jefferson University Physicians.. He also ran his own healthcare IT
consulting practice, Bruce Metz & Associates, LLC. Mr. Metz has a B.S. in Industrial and Management
Engineering from Columbia University, a M.A. in Organizational Development from New York University,
and a Ph.D. in Applied Psychology from New York University
Executive Experience

Market Overview

UCH maintains care sites across its primary service area
Geographic Footprint
42
• UCH serves patients from 73 different zip codes
within Connecticut
> Hartford County is UCH’s primary service area
(PSA)
• Total population for Hartford County reached 895,388
in 2017 (1)
• UCH provides medical services at 17 sites of care
across the service area
• On the main campus, in addition to JDH, UCH
provides specialized care in its Outpatient Pavilion,
Musculoskeletal Institute and Surgery Center, and
Procedures Center
> UCH also operates 3 distinct off-campus locations
in Farmington, as well as 3 locations in Storrs, CT
Legend
Community Locations (10 Sites of Care)
JDH / Farmington (7 Sites of Care)
Storrs (3 Sites of Care)
Canton (2 Sites of Care)
East Hartford
West Hartford
Southington
Simsbury
Avon
____________________
Notes:
1. U.S. Census Bureau
Overview UCH Sites of Care

UCH benefits from positive demographics in Hartford County
Demographic Snapshot
43
Overview of Local Area(1) Hartford County Population
Educational Attainment
0-4
5.4%
5-14
12.3%
15-24
13.2% 25-44
25.3%
45-64
28.2%
65+
15.6%
Hartford County Age Distribution
857,183
894,014
925,492
820 ,000
840 ,000
860 ,000
880 ,000
900 ,000
920 ,000
940 ,000
2000 2010 2020
2016-2020 CAGR: 0.8%
Unemployment Rate: 3.6%
(State: 5.1%)
Median Housing Price:
$341,000
(State: $269,300)
Median HH Income
(’12-’16): $103,880
(State: $71,755)
Hartford County State of CT
0-4
5.3%
5-14
12.2%
15-24
13.8% 25-44
24.5%
45-64
28.8%
65+
15.5% High School
Graduate
33%
Associates
Degree
10%
Bachelors or
Higher
57%
High School
Graduate
38%
Associates
Degree
10%
Bachelors or
Higher
52%
Hartford County State of CT
Town of Avon Median HH
Income: $124,608
____________________
Notes: CT Data Collaborative
1. Local area includes average metrics across the towns of Avon, Farmington, and West Hartford

UCH patients are predominately from West Hartford, Hartford, and Farmington, CT
Patient Origin
44
JDH Patient Origin
Farmington
14.0%
West Hartford
9.3%
New Britain
7.1%
Hartford
7.1%
Bristol
5.4%Avon
5.0%
Other Towns
52.1%
Outpatient
West Hartford
8.9%
Farmington
8.2%
Hartford
7.8%
New Britain
6.2%Bristol
5.2%Avon
3.5%
Other Towns
60.3%
Inpatient
50,000+
20,001 - 50,000
0 - 20,000
Inpatient and Outpatient Cases by County
Fairfield
Hartford
Litchfield
Middlesex
New Haven
Tolland
Windham
New
London
West Hartford
Hartford
New Britain
Bristol
Avon
John Dempsey Hospital (Farmington)
Patient Origin(1) Cases(2) %
Primary Service Area 221,179 51.0%
Secondary Service Area 119,205 27.5%
Other CT 93,274 21.5%
Total 433,658 100%
____________________
1. Primary Service Area (“PSA”) is defined as Avon, Bloomfield, Burlington, Canton, East Hartford, Granby, Hartford, Farmington, New
Britain, Newington, Simsbury, West Hartford.
Secondary Service Area (“SSA’) defined as Barkhamsted, Berlin, Bristol, Cromwell, East Granby, East Windsor, Glastonbury, Hartland,
Harwinton, Litchfield, Manchester, New Hartford, Plainville, Plymouth, Rocky Hill, South Windsor, Southington, Torrington, Vernon,
Wethersfield, Winchester, Windsor
2. Inpatient and outpatient

Primary Service Area
45
1
2
3
1
2
4
1
UConn Health
UConn John Dempsey Hospital
Hartford Healthcare
Hartford Hospital
Institute of Living
The Hospital of Central Connecticut – New
Britain General Campus
The Hospital of Central Connecticut –
Bradley Memorial Campus
Trinity Health
Mount Sinai Rehabilitation Hospital
Saint Francis Hospital and Medical Center
Bristol Hospital
Bristol Hospital
1
2
1
2
3
4
1

46
Market Share
Inpatient Discharges Market Share by PSA
Inpatient Discharges Market Share by PSA + SSA
JDH has market share of 11% in its primary service area (“PSA”) (1) and 8% in its secondary service area (“SSA”) (2) with tremendous opportunity to improve market share with the right partner
____________________
Notes:
1. Defined as Avon, Bloomfield, Burlington, Canton, East Hartford, Granby, Hartford, Farmington, New Britain, Newington, Simsbury, West
Hartford
2. Defined as Barkhamsted, Berlin, Bristol, Cromwell, East Granby, East Windsor, Glastonbury, Hartland, Harwinton, Litchfield, Manchester,
New Hartford, Plainville, Plymouth, Rocky Hill, South Windsor, Southington, Torrington, Vernon, Wethersfield, Winchester, Windsor
Numbers may not add to 100% due to rounding
10%
36%
29%
16%
1%
8% 11%
36%
30%
15%
1%
8% 11%
36%
30%
14%
1%
8% 11%
36%
30%
13%
1%
9%
0%
5%
10%
15%
20%
25%
30%
35%
40%
JDH Hartford Hospital St Francis Hospital Hospital of Central
Connecticut
Bristol Hospital Other
2014 2015 2016 2017
7%
29%
22%
14%
6%
21%
8%
30%
23%
13%
6%
21%
8%
30%
23%
12%
6%
21%
8%
30%
24%
11%
6%
21%
0%
5%
10%
15%
20%
25%
30%
35%
JDH Hartford Hospital St Francis Hospital Hospital of Central
Connecticut
Bristol Hospital Other
2014 2015 2016 2017
Other
Other

Financial Overview

($ in millions) 2016 Audited 2017 Audited 2018 Unaudited
Operating revenues:Student tuition and fees (net of scholarship allowances) $15.7 $17.5 $18.6Patient services 532.9 539.8 582.9Federal grants and contracts 59.5 58.1 50.7Nonfederal grants and contracts 27.1 29.0 29.3Contract grants and contracts 108.0 114.3 125.0
Total operating revenues 743.3 758.7 806.6
Operating expenses:Instructions 168.3 169.1 176.6Research 58.2 59.4 55.0Patient services 648.1 713.3 756.8Academic support 18.1 19.2 18.9Institutional support 98.0 82.2 100.7Operations and maintenance of plant 21.4 37.3 28.7Depreciation and amortization 41.5 52.0 52.6Student aid 0.1 0.2 0.3
Total operating expenses 1,053.6 1,132.8 1,189.6Operating loss (310.3) (374.1) (383.0)
Nonoperating revenues (expenses):State appropriations 289.3 278.2 275.2Gifts 6.9 4.1 5.7Investment income (net of investment expenses) 0.1 0.1 0.7Interest on capital asset - related debt (10.5) (10.2) (9.9)
Net nonoperating revenues 285.8 272.2 271.6Loss before other charges in net position (24.5) (101.9) (111.4)
Other changes in net position:Capital appropriations 175.0 43.5 88.8Loss on disposal (0.7) (1.0) (3.1)
Net other changes in net position 174.3 42.5 85.7Increase (decrease) in net position 149.8 (59.4) (25.7)
Net position-beginning of year 36.0 185.8 126.3Cumulative effect of implementing GASB 68 and 71 - - (1,099.2)
Net position - Beginning of year, as adjusted 36.0 185.8 (972.9)Net position - End of year $185.8 $126.3 ($998.6)
Income Statement
UConn Health Financial Statements
48
____________________
Notes: UCH includes clinical, academic and research activities

Pro Forma
2016
Pro Forma
2017
Pro Forma
2018
Revenues:
Net Patient Care $444.4 $461.0 $500.2
Other Income 32.7 37.6 46.5
Total Revenues 477.1 498.5 546.8
Expenses:
Personnel Services 237.3 236.7 238.8
Fringe Benefits 131.8 165.5 177.4
Medical Contractual Support 6.6 7.0 7.4
Internal Contractual Support - Overhead 18.9 21.8 23.8
Internal Contractual Support - Rent 14.3 14.1 14.1
Internal Contractual Support - Intern and Residents 22.3 22.4 23.6
Allocation of Inst. Support - Other 20.0 7.9 16.0
Medical/Dental House Staff 3.0 3.3 2.6
Outside Agency Per Diems 1.6 3.3 4.2
Drugs 29.8 36.3 39.8
Medical Supplies 36.7 40.6 45.2
Utilities 2.5 3.6 3.5
Outside & Other Purchased Services 37.1 38.2 49.8
Insurance 3.7 3.7 4.1
Repairs & Maintenance 6.6 7.9 9.1
Other Expenses 3.1 2.5 7.0
Depreciation 14.1 24.6 25.8
Total Expenses 589.3 639.5 692.2
Operating Income (Loss) (112.3) (141.0) (145.5)
Nonoperating Revenues (Expenses)
Gift Income 0.6 0.7 -
Interest Expense - (0.0) (0.0)
Loss on disposals (0.4) (0.2) (2.8)
Net Nonoperating Revenues 0.2 0.4 (2.8)
(Loss) Income before Transfers (112.0) (140.6) (148.3)
Transfer from UConn Health for new Hospital Tower 273.3 21.3 9.8
Transfers (to)from UConn Health - Unrestricted 31.4 34.0 40.0
Transfers from UConn Health - In Kind Fringe 30.9 34.5 49.9
Increase in Net Position $223.5 ($50.8) ($48.6)
Income Statement
Pro Forma Financial Statements – Clinical Enterprise (1)
49
($ in millions)
(8)
(9)
____________________
Notes: Personnel Services and Fringe Benefits include allocation of institutional support
See “Financial Statement Adjustments” pages for numbered adjustment explanation
Refer to appendix A for detailed explanation of pro forma financial presentation
(1) The clinical enterprise includes John Dempsey Hospital and the UConn Medical Group
(2)

Pro Forma
2016
Pro Forma
2017
Pro Forma
2018
Revenues:
Net Patient Care $351.9 $367.7 $398.7
Other Income 26.2 30.6 40.8
Total Revenues 378.1 398.3 439.6
Expenses:
Personnel Services 145.7 146.0 148.8
Fringe Benefits 87.2 112.0 128.3
Medical Contractual Support 0.2 0.2 0.3
Internal Contractual Support - Overhead 15.8 18.3 20.4
Internal Contractual Support - Rent 7.6 6.8 6.7
Internal Contractual Support - Intern and Residents 22.3 22.4 23.6
Allocation of Inst. Support - Other 14.1 5.7 11.5
Medical/Dental House Staff 3.0 3.3 2.6
Outside Agency Per Diems 1.3 3.0 3.7
Drugs 26.0 32.2 34.9
Medical Supplies 35.6 39.0 43.5
Utilities 2.3 3.4 3.2
Outside & Other Purchased Services 29.0 30.4 39.3
Insurance 3.4 3.4 3.7
Repairs & Maintenance 5.7 7.1 8.2
Other Expenses 2.4 2.0 5.5
Depreciation 8.9 18.8 20.1
Total Expenses 410.6 454.0 504.5
Operating Income (Loss) (32.5) (55.8) (64.9)
Nonoperating Revenues (Expenses)
Gift Income 0.6 0.7 -
Interest Expense - (0.0) (0.0)
Loss on disposals (0.4) (0.1) (0.4)
Net Nonoperating Revenues 0.2 0.5 (0.5)
(Loss) Income before Transfers (32.3) (55.3) (65.4)
Transfer from UConn Health for new Hospital Tower 273.3 21.3 9.8
Transfers (to)from UConn Health - Unrestricted (0.9) 2.8 1.4
Transfers from UConn Health - In Kind Fringe 8.9 12.6 25.5
Increase in Net Position $249.0 ($18.5) ($28.7)
Income Statement
Pro Forma Financial Statements – John Dempsey Hospital
50
(8)
($ in millions)
(9)
____________________
Notes: Personnel Services and Fringe Benefits include internal contractual support and allocation of institutional support
See “Financial Statement Adjustments” pages for numbered adjustment explanation
Refer to appendix A for detailed explanation of pro forma financial presentation
(2)

Pro Forma
2016
Pro Forma
2017
Pro Forma
2018
Revenues:
Net Patient Care $92.5 $93.2 $101.5
Other Income 10.4 10.8 9.4
Total Revenues 102.8 104.1 110.9
Expenses:
Personnel Services 91.6 90.7 90.0
Fringe Benefits 44.6 53.5 49.1
Medical Contractual Support 6.5 6.8 7.1
Internal Contractual Support - Overhead 6.9 7.3 7.0
Internal Contractual Support - Rent 6.7 7.3 7.4
Allocation of Inst. Support - Other 5.9 2.2 4.4
Outside Agency Per Diems 0.3 0.3 0.5
Drugs 3.7 4.1 4.9
Medical Supplies 1.1 1.6 1.7
Utilities 0.2 0.2 0.2
Outside & Other Purchased Services 8.1 7.8 10.5
Insurance 0.3 0.3 0.5
Repairs & Maintenance 0.8 0.7 0.9
Other Expenses 0.6 0.5 1.5
Depreciation 5.2 5.8 5.8
Total Expenses 182.6 189.3 191.5
Operating Income (Loss) (79.8) (85.2) (80.6)
Nonoperating Revenues (Expenses)
Gift Income 0.0 - -
Interest Expense - - -
Loss on disposals (0.0) (0.1) (2.4)
Net Nonoperating Revenues 0.0 (0.1) (2.4)
(Loss) Income before Transfers (79.7) (85.3) (82.9)
Transfer from UConn Health for new Hospital Tower - - -
Transfers from UConn Health - Unrestricted 32.3 31.2 38.6
Transfers from UConn Health - In Kind Fringe 22.0 21.8 24.4
Increase in Net Position ($25.5) ($32.3) ($20.0)
Income Statement
51
($ in millions)
(8)
(9)
Pro Forma Financial Statements – UConn Medical Group
____________________
Notes: Personnel Services and Fringe Benefits include allocation of institutional support
See “Financial Statement Adjustments” pages for numbered adjustment explanation
Refer to appendix A for detailed explanation of pro forma financial presentation

2019 Budget
UCH JDH UMG
Revenues:Tuition & Fees $25.5 $0.0 $0.0Research Grants and Contracts 80.2 - -Auxiliary Enterprises 18.7 3.4 -Interns and Residents 69.0 0.7 -Net Patient Care 538.3 426.6 101.5 Gift & Endowment Income 5.4 0.9 -Other Income 47.9 39.6 16.5
Total Revenue 785.1 471.1 118.0
Expenses:Salary Expense 412.5 139.2 92.4 Fringe Benefits 247.9 97.6 48.9 Internal Contractual Support - 51.7 14.0 Medical/Dental House Staff 55.8 3.4 -Medical Contractual Support 16.8 0.2 6.8 Temporary/Per Diem Staff 1.7 1.3 0.4 Utilities 13.1 3.3 0.2 Outside & Other Purchased Services 96.2 37.9 10.0 Insurance 3.6 2.5 0.2 Repair and Maintenance 15.1 7.8 1.1 Drugs 42.2 38.0 4.1 Medical Supplies 56.4 44.6 1.7 Other Expenses 30.7 2.0 0.5 Debt Service 9.6 0.0 -Depreciation 34.5 7.9 4.2
Total Expenses 1,036.0 437.5 184.5 Excess/(Deficiency) of Revenues over Expenses (250.9) 33.7 (66.5)
State Appropriation-Block Grant 119.0 - -State Supported Fringe Benefits 115.5 - -GF Appropriation Rescission - - -Workers Compensation Net of Appropriation (1.8) - -Transfer to State of CT - - -
Excess/(Deficiency) ($18.2) $33.7 ($66.5)
Total State Support 232.7 - -Percent of Total Revenues 22.9% - -
Income Statement
UCH, JDH, and UMG FY 2019 Proposed Operating Budget
52
($ in millions)

UCH has undertaken extensive financial improvement projects (“FIP”), and has targeted creating an additional $22.3M of savings in FY 2019
Cost Savings and Strategic Growth Initiatives
53
Financial Improvement Projects: FY 14 – FY 17 Financial Improvement Projects: FY 18 – FY 19
• Clinical Initiatives: Decrease Length of Stay in OB, cancer, 30 day readmissions, C-
sections, partial hospitalization; increase provider productivity, use of scribes,
onboarding/ interview savings, coding and revenue enhancements
• Revenue Initiatives: Coding & documentation optimization, collection process
improvements, managed care contract and revenue recovery efforts and revisions to
point of collection policy
• Workforce Initiatives: Workforce tracker implemented to review all clinical
positions and nursing staff grids using volume to approve positions
• Non-Labor: Extensive contract improvements yielding savings on medical devices,
pharmaceuticals, lab supplies, surgery, radiology
• Workers’ Compensation: Program improvements; Incident Review
• Strategic Growth Initiatives: Increase clinical volume through strategic faculty-
clinician hiring; identify new patient revenue streams; other new revenue generating
initiatives
Financial Improvement Project Total Savings
FIP FY 14 – 16 $13.7M
FIP FY 17 $11.1M
Total $24.8M
Financial Improvement Project Total Savings
FIP FY 18 $12.3M
FIP FY 19 - expected $22.3M
Total $34.6M
• Clinical Initiatives: Contract pharmacy revenue, provider productivity, contracts
review, Scribe implementation
• Workforce Initiatives: Restricted hiring to only vital positions
• Non-Labor: Extensive contract improvements yielding savings on medical devices,
pharmaceuticals, lab supplies, Surgery, Radiology
• Workers’ Compensation: Incident Review
• Strategic Growth Initiatives: Increase clinical volume through strategic faculty-
clinician hiring; identify new patient revenue streams; other new revenue generating
initiatives

($18.4)
($40.5)
-
($9.9)
($8.8)
($14.0)
($7.8)
$14.7
$3.7 $0.4
$3.5
$18.2
FY 18B Run Rate Salary Fringe Benefits EPIC Initial FY19B Clinical - JDH Clinical - UMG Non-Labor Other
Reduced
Operating CapitalSpend Final FY19B
FIP will be a key driver in materially improving FY19 financial performance to limit the impact of increased costs associated with salaries, fringe benefits and Epic
Financial Improvement Project (FY19)
54
FIP FY19 Key Initiatives Target Savings
Clinical Operational Initiatives – JDH $14.7M
Clinical Operational Initiatives – UMG $3.7M
Non-Labor $0.4M
Other Initiatives $3.5M
Total $22.3M
Budget Impact
FY19B Drivers
$0.0

$145 $145 $136 $118 $119
$83 $91 $88 $107 $116
$227 $236 $224 $226 $235
2015A 2016A 2017A 2018A 2019B
Block Grant State-Supported Fringe Benefits
UCH receives state appropriations, but budget cuts have caused a decrease in state support in FY18 and FY19
State Appropriations
55
• State appropriation dollars fund ~22% of
UCH’s $1+ billion budget
• These funds are used entirely to pay employee
salaries and benefits (equates to ~33% of UCH
employee salary and benefits)
> State reimburses UCH for fringe benefit
costs incurred to those employees whose
salaries are paid for using state
appropriation dollars
> All other employee compensation and
UCH expenses are paid using clinical
revenues, external grant funds and other
revenues
• Budget adjustments made in the 2018
Legislative Session cut UCH’s state
appropriation by an additional $15.4M,
bringing the total reduction in FY18 and FY19
to $32.2M as compared to FY17
($ in millions)
Historical and Budget State Appropriations

Recent increases in fringe benefit rates due to State’s obligation to service unfunded pension liabilities
Rising Fringe Benefit Costs
56
29.5% 30.1% 31.1% 30.6% 28.8% 28.8% 28.1% 28.7% 29.3% 29.9%
44.3% 44.1% 43.4%46.1%
53.3% 54.5%57.4% 58.9%
63.4%
71.1%
2010 2011 2012 2013 2014 2015 2016 2017 2018 2019
CHA Rate JDH Rate
JDH Fringe Rate vs Average Connecticut Hospital Fringe Rate (1)
The State’s fringe benefit rates
have risen dramatically over
recent years (driven by the State’s
obligation to service the unfunded
pension liability), while rates at
other CT hospitals have remained
relatively stable
Fringe Benefit Costs Compared with Other CT Hospitals
$13.1 $13.3 $13.1 $17.1
$25.6 $27.6 $24.3
$35.4
$46.4
$57.5
2010 2011 2012 2013 2014 2015 2016 2017 2018 2019
Fringe Benefit Differential vs Other CT Hospitals
____________________
Notes:
(1) Per Connecticut Hospital Association (“CHA”)

Trended Payor Mix at John Dempsey Hospital
57
32.0% 30.5%
22.9%
9.3%
5.3%
31.4%29.7%
23.1%
10.3%
5.5%
30.5%27.8%
23.1%
13.2%
5.4%
Commercial/HMO Medicare Medicaid Managed Medicare Self-Pay / Other
FY 2016 FY 2017 YTD Apr-18
40.9%
26.9%
19.6%
7.5%5.1%
43.1%
26.2%
17.2%
8.2%5.3%
43.3%
25.0%
17.6%
10.5%
3.7%
Commercial/HMO Medicare Medicaid Managed Medicare Self-Pay / Other
FY 2016 FY 2017 YTD Apr-18
Payor Mix - Gross Patient Revenue
Payor Mix - Net Patient Revenue

Major capital projects such as the new patient tower, Outpatient Pavilion and Epic implementation, have recently been completed with no major capex needs in the near term
UCH Historical and Projected Capital Expenditures
58
($ in millions)
$171 $154 $116
$93
$97
$42
$22
$268
$197
$138
$93
$7
2015A 2016A 2017A 2018A 2019B
Capital Appropriations Other
Historical and Projected Capital Expenditures• Given UCH’s recent completion of a number of major capital
projects and a low average age of plant, go-forward capital
needs in the near term are limited
> Projected capital expenditures are limited mainly to routine
maintenance of existing facilities
• The $318 million new patient tower was funded completely by
state bonds
• Epic implementation was funded by UCH operating funds and
state bonds
• Construction of the Outpatient Pavilion was funded by a
mortgage with TIAA-CREF, which is held by the Circle Road
Corporation (a subsidiary of the Finance Corporation)
> TIAA-CREF mortgage is supported by a 25-year fixed term
lease between UCH and the Finance Corporation which
ends March, 2040

Appendix A: Consolidated Financial Statements

• Presented herein are audited and pro forma income statements for JDH and UMG
• The pro forma financial statements for JDH and UMG reflect (1) adjustments made to get from UConn Health’s internal
accounting systems to the audited financial statements and (2) to include a full allocation of home office support provided
to JDH and UMG (“Institutional Support”)
• (1) Adjustments to reach the audited financial figures mainly pertain to an increase in fringe benefit costs due to the
adoption of GASB 68, GASB 75 and additional depreciation associated with Bond Funding
> The GASB 68 adjustment is a result of accounting and financial reporting requirements for governmental employers that provide their
employees with pension benefits administered through a qualified trust. GASB 68 establishes standards to measure and recognize pension
liabilities, deferred outflows of resources, deferred inflows of resources and expenses
> The GASB 75 adjustment is similar to GASB 68 except it is for postemployment benefits other than pensions
> The depreciation associated with Bond Funding is a result of purchases with State of CT general obligation bonds. UConn Health recorded
the bonds as State of CT Capital Appropriations (revenue) in the audit in the years sold. The corresponding depreciation expense is
recorded over the useful life (expense) in the audited statements. The revenue and expense were not part of JDH or UMG pro forma
financial statements
• (2) Adjustments are made to reflect the fact that JDH and UMG do not include a full allocation of Institutional Support,
which includes functions such as Human Resources, IT services and Facility Costs. The final pro forma Financial Statements
represent the audited financials plus the full allocation of Institutional Support
• Please refer to the Notes to Financial Statements later in this section for detailed descriptions of each adjustment
• All balance sheets presented in Appendix B are unadjusted and audited for 2016 and 2017 and unaudited for 2018
Financial Statement Presentation
60

Pro Forma
2016
Pro Forma
2017
Pro Forma
2018
Revenues:
Net Patient Care $444.4 $461.0 $500.2
Other Income 32.7 37.6 46.5
Total Revenues 477.1 498.5 546.8
Expenses:
Personnel Services 237.3 236.7 238.8
Fringe Benefits 131.8 165.5 177.4
Medical Contractual Support 6.6 7.0 7.4
Internal Contractual Support - Overhead 18.9 21.8 23.8
Internal Contractual Support - Rent 14.3 14.1 14.1
Internal Contractual Support - Intern and Residents 22.3 22.4 23.6
Allocation of Inst. Support - Other 20.0 7.9 16.0
Medical/Dental House Staff 3.0 3.3 2.6
Outside Agency Per Diems 1.6 3.3 4.2
Drugs 29.8 36.3 39.8
Medical Supplies 36.7 40.6 45.2
Utilities 2.5 3.6 3.5
Outside & Other Purchased Services 37.1 38.2 49.8
Insurance 3.7 3.7 4.1
Repairs & Maintenance 6.6 7.9 9.1
Other Expenses 3.1 2.5 7.0
Depreciation 14.1 24.6 25.8
Total Expenses 589.3 639.5 692.2
Operating Income (Loss) (112.3) (141.0) (145.5)
Nonoperating Revenues (Expenses)
Gift Income 0.6 0.7 -
Interest Expense - (0.0) (0.0)
Loss on disposals (0.4) (0.2) (2.8)
Net Nonoperating Revenues 0.2 0.4 (2.8)
(Loss) Income before Transfers (112.0) (140.6) (148.3)
Transfer from UConn Health for new Hospital Tower 273.3 21.3 9.8
Transfers (to)from UConn Health - Unrestricted 31.4 34.0 40.0
Transfers from UConn Health - In Kind Fringe 30.9 34.5 49.9
Increase in Net Position $223.5 ($50.8) ($48.6)
Income Statement
Pro Forma Financial Statements – Clinical Enterprise (1)
61
($ in millions)
(8)
(9)
____________________
Notes: Personnel Services and Fringe Benefits include allocation of institutional support
See “Financial Statement Adjustments” pages for numbered adjustment explanation
Refer to appendix A for detailed explanation of pro forma financial presentation
(1) The clinical enterprise includes John Dempsey Hospital and the UConn Medical Group
(2)

Actual Common Size (%)
2016 Audited 2017 Audited 2018 Prelim. Audited
Operating revenues:
Net patient service revenues $351.9 $367.7 $398.7
Contract and other revenues 26.2 30.6 40.8
Total operating revenues 378.1 398.3 439.6
Operating expenses:
Salaries and wages 117.0 117.4 138.4
Fringe benefits 67.2 89.5 120.4
Medical/dental house staff 3.0 3.3 2.6
Medical contractual support 0.2 0.2 0.3
Internal contractual support 71.9 76.1 50.8
Outside agency per diems 1.3 3.0 3.7
Depreciation and amortization 8.9 18.8 20.1
Pharmaceutical/medical supplies 61.6 71.2 78.4
Utilities 2.3 3.4 3.2
Outside and other purchased services 29.0 30.4 39.3
Insurance 3.4 3.4 3.7
Repairs and maintenance 5.7 7.1 8.2
Other expenses 2.4 2.0 5.5
Total operating expenses 373.8 425.8 474.7
Operating income (loss) 4.2 (27.6) (35.1)
Nonoperating revenues (expenses):
Gift income 0.6 0.7 0.0
Interest expense - (0.0) (0.0)
Loss on disposals (0.4) (0.1) (0.4)
Net nonoperating revenues (expenses) 0.2 0.5 (0.5)
Income (loss) before transfers 4.4 (27.1) (35.6)
Transfers from UConn Health - Unrestricted 8.0 15.5 26.9
Transfers from UConn Health for New Hospital Tower 273.3 21.3 9.8
Increase (decrease) in net position 285.8 9.7 1.1
Net Position - Beginning of year (39.6) 246.2 255.8
Cumulative Effect of Implementing GASB 68 and 71 - - -
Net position - Beginning of year (39.6) 246.2 255.8
Net position - End of year $246.2 $255.8 $256.9
Income Statement
Financial Statements – John Dempsey Hospital
62
($ in millions)

Pro Forma
2016
Pro Forma
2017
Pro Forma
2018
Revenues:
Net Patient Care $351.9 $367.7 $398.7
Other Income 26.2 30.6 40.8
Total Revenues 378.1 398.3 439.6
Expenses:
Personnel Services 145.7 146.0 148.8
Fringe Benefits 87.2 112.0 128.3
Medical Contractual Support 0.2 0.2 0.3
Internal Contractual Support - Overhead 15.8 18.3 20.4
Internal Contractual Support - Rent 7.6 6.8 6.7
Internal Contractual Support - Intern and Residents 22.3 22.4 23.6
Allocation of Inst. Support - Other 14.1 5.7 11.5
Medical/Dental House Staff 3.0 3.3 2.6
Outside Agency Per Diems 1.3 3.0 3.7
Drugs 26.0 32.2 34.9
Medical Supplies 35.6 39.0 43.5
Utilities 2.3 3.4 3.2
Outside & Other Purchased Services 29.0 30.4 39.3
Insurance 3.4 3.4 3.7
Repairs & Maintenance 5.7 7.1 8.2
Other Expenses 2.4 2.0 5.5
Depreciation 8.9 18.8 20.1
Total Expenses 410.6 454.0 504.5
Operating Income (Loss) (32.5) (55.8) (64.9)
Nonoperating Revenues (Expenses)
Gift Income 0.6 0.7 -
Interest Expense - (0.0) (0.0)
Loss on disposals (0.4) (0.1) (0.4)
Net Nonoperating Revenues 0.2 0.5 (0.5)
(Loss) Income before Transfers (32.3) (55.3) (65.4)
Transfer from UConn Health for new Hospital Tower 273.3 21.3 9.8
Transfers (to)from UConn Health - Unrestricted (0.9) 2.8 1.4
Transfers from UConn Health - In Kind Fringe 8.9 12.6 25.5
Increase in Net Position $249.0 ($18.5) ($28.7)
Income Statement
Pro Forma Financial Statements – John Dempsey Hospital
63
(8)
($ in millions)
(9)
(4)
(5)
(1)
(2)
(7)
(3)
____________________
Notes: Personnel Services and Fringe Benefits include internal contractual support and allocation of institutional support
See “Financial Statement Adjustments” pages for numbered adjustment explanation

Actual Common Size (%)
2016 Audited 2017 Audited 2018 Prelim. Audited
Operating revenues:
Net patient service revenues $92.5 $93.2 $101.5
Contract and other revenues 10.4 10.8 9.4
Total operating revenues 102.8 104.1 110.9
Operating expenses:
Salaries and wages 85.6 85.4 86.0
Fringe benefits 40.8 49.5 46.0
Medical contractual support 6.5 6.8 7.1
Internal contractual support 13.6 14.7 14.4
Outside agency per diems 0.3 0.3 0.5
Depreciation and amortization 5.2 5.8 5.8
Pharmaceutical/medical supplies 4.8 5.7 6.6
Utilities 0.2 0.2 0.2
Outside and other purchased services 8.1 7.8 10.5
Insurance 0.3 0.3 0.5
Repairs and maintenance 0.8 0.7 0.9
Other expenses 0.6 0.5 1.5
Total operating expenses 166.9 177.8 180.0
Operating loss (64.1) (73.8) (69.1)
Nonoperating revenues (expenses):
Gift income 0.0 - -
Loss on disposals (0.0) (0.1) (2.4)
Net nonoperating revenues (expenses) 0.0 (0.1) (2.4)
Loss before transfers (64.0) (73.9) (71.5)
Net Transfers from UConn Health - Unrestricted 54.2 53.0 63.0
Decrease in Net Position (9.8) (20.9) (8.5)
Net Position - Beginning of year (48.1) (57.9) (78.8)
Cumulative Effect of Implementing GASB 68 and 71 - - -
Net position - Beginning of year (48.1) (57.9) (78.8)
Net position - End of year ($57.9) ($78.8) ($87.3)
Income Statement
Financial Statements – UConn Medical Group
64
($ in millions)

Pro Forma
2016
Pro Forma
2017
Pro Forma
2018
Revenues:
Net Patient Care $92.5 $93.2 $101.5
Other Income 10.4 10.8 9.4
Total Revenues 102.8 104.1 110.9
Expenses:
Personnel Services 91.6 90.7 90.0
Fringe Benefits 44.6 53.5 49.1
Medical Contractual Support 6.5 6.8 7.1
Internal Contractual Support - Overhead 6.9 7.3 7.0
Internal Contractual Support - Rent 6.7 7.3 7.4
Allocation of Inst. Support - Other 5.9 2.2 4.4
Outside Agency Per Diems 0.3 0.3 0.5
Drugs 3.7 4.1 4.9
Medical Supplies 1.1 1.6 1.7
Utilities 0.2 0.2 0.2
Outside & Other Purchased Services 8.1 7.8 10.5
Insurance 0.3 0.3 0.5
Repairs & Maintenance 0.8 0.7 0.9
Other Expenses 0.6 0.5 1.5
Depreciation 5.2 5.8 5.8
Total Expenses 182.6 189.3 191.5
Operating Income (Loss) (79.8) (85.2) (80.6)
Nonoperating Revenues (Expenses)
Gift Income 0.0 - -
Interest Expense - - -
Loss on disposals (0.0) (0.1) (2.4)
Net Nonoperating Revenues 0.0 (0.1) (2.4)
(Loss) Income before Transfers (79.7) (85.3) (82.9)
Transfer from UConn Health for new Hospital Tower - - -
Transfers from UConn Health - Unrestricted 32.3 31.2 38.6
Transfers from UConn Health - In Kind Fringe 22.0 21.8 24.4
Increase in Net Position ($25.5) ($32.3) ($20.0)
Income Statement
65
($ in millions)
(8)
Pro Forma Financial Statements – UConn Medical Group
(6)
(4)
(5)
(1)
(7)
(3)
____________________
Notes: Personnel Services and Fringe Benefits include internal contractual support and allocation of institutional support
See “Financial Statement Adjustments” pages for numbered adjustment explanation

• (1) – Includes depreciation associated with Bond Funded Assets
• (2) – Fair value transfer to JDH for cost UConn Health incurred to build new Hospital Tower
• (3) – In kind fringe associated with Internal charges for Salary and Fringe
• (4) – Includes worker comp paid to Third Party for Claims in Excess of Appropriation
• (5) – Includes expense EPIC project costs that were deemed not capital
• (6) – SOM funding for Faculty Support
• (7) – FY 2018 Net transfer between JDH and UConn Health and UMG (see detail below). A - EPIC Bond Funds from State of CT was recognized as
income by UConn Health in issuance year. JDH and UMG reported as transfers in years spent.
List of Adjustments - Legend
Notes to Financial Statements
66
Breakdown of unrestricted transfer
FY2018 JDH UMG Total
JDH portion of Appropriation 25,514,324 30,487,282 56,001,606
EPIC Funds received from State Bond Funds 16,311,494 A 4,083,304 20,394,798
Storrs EPIC Reimbursement 16,014,893 4,003,723 20,018,616
Return to UConn Health prior year funding of losses (4,049,405) (4,049,405)
Clinical Fund Transfer to UConn Health (52,455,634) (52,455,634)
Total Transfers to UConn Health - Unrestricted 1,335,672 38,574,309 39,909,981
• (8) – Prior to GASB 68 and 75 adjustment for FY18. This will be first year for GASB 75. In prior year GASB 68 had the following impact
• (9) 19 – Includes EPIC at the elbow cost of the following:
JDH $7,135,224
UMG 1,983,806
Total at the elbow cost $9,119,030
JDH UMG Total
FY18 33,073,276 4,212,692 37,285,968
FY17 20,371,914 10,603,144 30,975,058
FY16 338,440 1,655,382 1,993,822

Appendix B: Balance Sheets
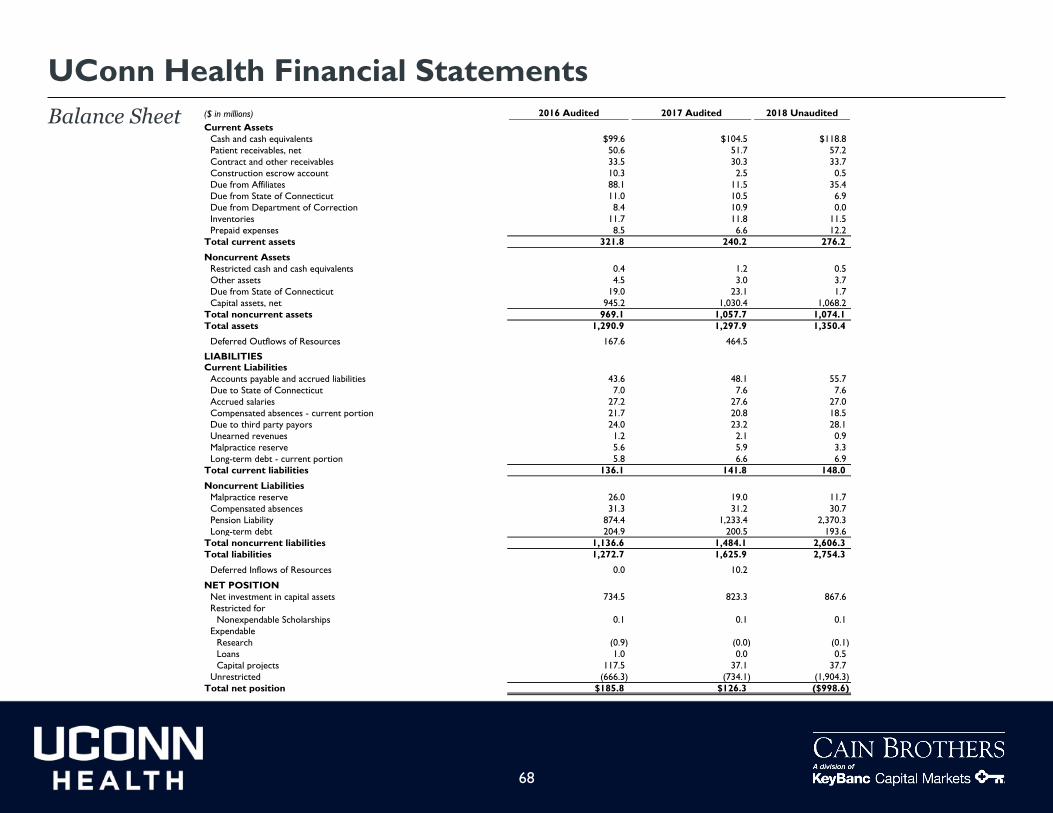
($ in millions) 2016 Audited 2017 Audited 2018 Unaudited
Current Assets
Cash and cash equivalents $99.6 $104.5 $118.8
Patient receivables, net 50.6 51.7 57.2
Contract and other receivables 33.5 30.3 33.7
Construction escrow account 10.3 2.5 0.5
Due from Affiliates 88.1 11.5 35.4
Due from State of Connecticut 11.0 10.5 6.9
Due from Department of Correction 8.4 10.9 0.0
Inventories 11.7 11.8 11.5
Prepaid expenses 8.5 6.6 12.2
Total current assets 321.8 240.2 276.2
Noncurrent Assets
Restricted cash and cash equivalents 0.4 1.2 0.5
Other assets 4.5 3.0 3.7
Due from State of Connecticut 19.0 23.1 1.7
Capital assets, net 945.2 1,030.4 1,068.2
Total noncurrent assets 969.1 1,057.7 1,074.1
Total assets 1,290.9 1,297.9 1,350.4
Deferred Outflows of Resources 167.6 464.5
LIABILITIESCurrent Liabilities
Accounts payable and accrued liabilities 43.6 48.1 55.7
Due to State of Connecticut 7.0 7.6 7.6
Accrued salaries 27.2 27.6 27.0
Compensated absences - current portion 21.7 20.8 18.5
Due to third party payors 24.0 23.2 28.1
Unearned revenues 1.2 2.1 0.9
Malpractice reserve 5.6 5.9 3.3
Long-term debt - current portion 5.8 6.6 6.9
Total current liabilities 136.1 141.8 148.0
Noncurrent Liabilities
Malpractice reserve 26.0 19.0 11.7
Compensated absences 31.3 31.2 30.7
Pension Liability 874.4 1,233.4 2,370.3
Long-term debt 204.9 200.5 193.6
Total noncurrent liabilities 1,136.6 1,484.1 2,606.3
Total liabilities 1,272.7 1,625.9 2,754.3
Deferred Inflows of Resources 0.0 10.2
NET POSITION
Net investment in capital assets 734.5 823.3 867.6
Restricted for
Nonexpendable Scholarships 0.1 0.1 0.1
Expendable
Research (0.9) (0.0) (0.1)
Loans 1.0 0.0 0.5
Capital projects 117.5 37.1 37.7
Unrestricted (666.3) (734.1) (1,904.3)
Total net position $185.8 $126.3 ($998.6)
Balance Sheet
UConn Health Financial Statements
68

($ in millions) 2016 Audited 2017 Audited 2018 Unaudited
Current AssetsCash $35.9 $36.9 $57.0Patient accounts receivable 40.0 40.9 47.9 Inventory 9.0 9.0 9.2 Contract and other receivables 8.8 10.9 11.6 Due from UMG - 9.6 5.6 Due from Finance Corporation, current portion 5.7 2.0 2.0 Prepaid expenses 5.9 5.8 7.2
Total Current Assets 105.4 115.2 140.5
Noncurrent AssetsOther assets 0.8 0.8 0.8 Due from Finance Corporation, noncurrent portion 9.0 2.7 2.7 Capital assets, net 331.9 366.5 386.1
Total Noncurrent Assets 341.7 370.0 389.7 Total Assets 447.1 485.2 530.2
Deferred Outflows of ResourcesDeferred amount for pensions 50.4 129.8 145.1
Current LiabilitiesAccounts payable and accrued expenses 12.4 18.4 27.1 Accrued payroll 6.7 6.8 8.3 Due to UConn Health Malpractice Fund 0.3 0.3 0.2 Due to State of Connecticut 4.0 4.2 5.2 Due to third-party payors 24.0 23.2 19.8 Deferred revenues 0.0 0.2 0.0 Capital leases, current portion - 0.5 0.5 Accrued compensated absences, current portion 6.4 6.3 7.3
Total Current Liabilities 53.7 59.9 68.5
Noncurrent LiabilitiesPension liabilities 188.4 288.1 653.9 Capital leases, net of current portion - 1.7 1.2 Accrued compensated absences, net of current portion 9.2 9.4 12.1
Total Noncurrent Liabilities 197.6 299.3 667.3 Total Liabilities 251.3 359.2 735.8
Deferred Inflows of ResourcesDeferred amount for pensions 0.0 0.0 9.2
Net PositionNet investment in capital assets 331.9 364.3 384.4 Unrestricted (85.7) (108.4) (454.2)
Total Net Position $246.2 $255.8 ($69.7)
Balance Sheet
Financial Statements – John Dempsey Hospital
69

($ in millions) 2016 Audited 2017 Audited 2018 Unaudited
Current AssetsCash $0.0 $0.0 $0.0Patient accounts receivable 10.4 10.6 9.1Inventory 0.6 0.6 0.3Contract and other receivables 0.1 0.4 0.1Prepaid expenses 0.1 0.1 0.1
Total Current Assets 11.2 11.7 9.6
Noncurrent AssetsDue from Finance Corporation - - -Capital assets, net 21.8 21.9 21.1
Total Noncurrent Assets 21.8 21.9 21.1Total Assets 32.9 33.6 30.7
Deferred Outflows of ResourcesDeferred amount of pensions 24.4 60.2 50.9
Current LiabilitiesCash overdraft 2.9 3.6 5.6Accounts payable and accrued expenses 2.0 2.1 4.3Accrued payroll 7.1 7.4 7.9Due to UConn Health Malpractice Fund 0.0 0.0 0.0Due to JDH - 9.6 5.6Accrued compensated absences, current portion 2.9 3.0 3.0
Total Current Liabilities 15.0 25.7 26.4
Noncurrent LiabilitiesPension liabilities 96.1 142.5 320.2Accrued compensated absences, noncurrent portion 4.2 4.4 5.0
Total Noncurrent Liabilities 100.3 146.9 325.2Total Liabilities 115.3 172.6 351.6
Net PositionNet investment in capital assets 21.8 21.9 21.1Unrestricted (79.7) (100.7) (295.9)
Total Net Position ($57.9) ($78.8) ($274.8)
Balance Sheet
Financial Statements – UConn Medical Group
70