solid phase extraction (spe) and quantification of ... phase... · solid phase extraction (spe) and...
TRANSCRIPT

Solid Phase Extraction (SPE) and Quantification of Naphthenic Acid in Milli-Q,
Simulated Groundwater and River Waters
John Headley, Jing-Long Du, Kerry Peru, Arash Janfada
Aquatic Ecosystem Protection Research Division Water Science and Technology Directorate
Environment Canada

Outline of the Presentation
What are Naphthenic Acids?
Quantification of Naphthenic acids
Merits of Solid Phase Extraction
Analysis by –ve ESI/MS
Results and Discussion
Conclusions


Oil sand
Oil Sand Extraction Process
Crude Oil
Extraction Tailings
Bitumen


Tailing Pond
Processing Unit

Naphthenic acids are carboxylic acidswhich include linear and/or saturated ring
structures.
What are Naphthenic Acids?
CnH2n+ZO2N --- the carbon number
Z --- number of hydrogen atoms that are lost as the structure becomes more compact

General Structure of Naphthenic Acids


Naphthenic acid characteristics
• Naphthenic acids are the main organic toxic constituents of Oil Sands process-water
• Corrosive
Negative
Positive
• Wood preservative• Detergent

Corrosion
Refinery units Pipelines
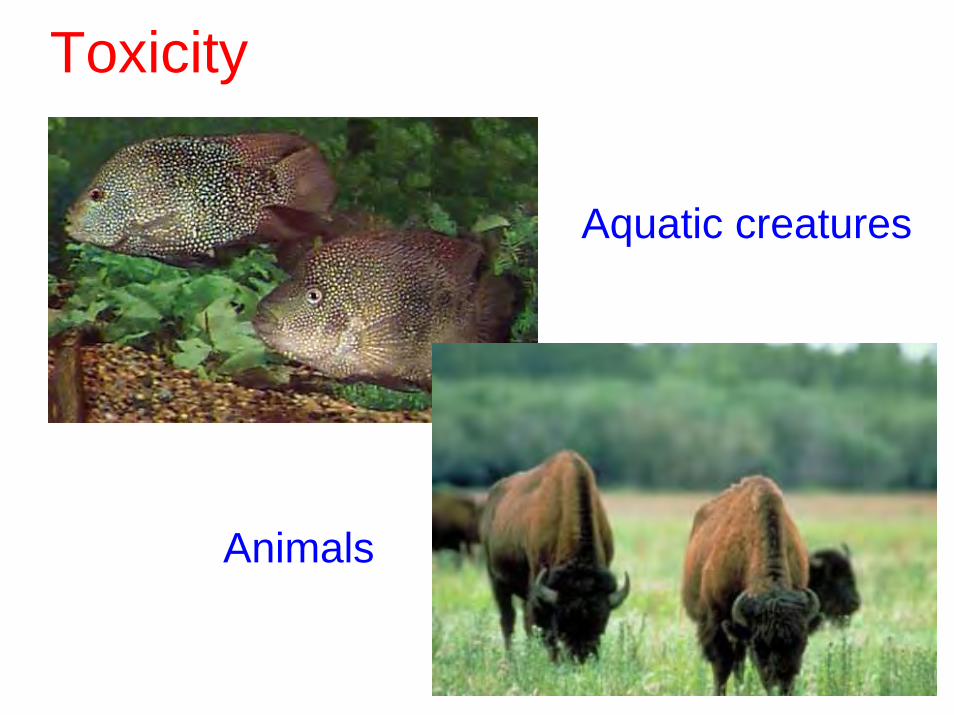
Toxicity
Aquatic creatures
Animals

Quantification of Naphthenic Acids
Infrared Spectroscopy (IR)Fan, T.P., Energy & Fuel, 5, 371, 1991.
Fast Atom Bombardment/Mass Spectrometry (FAB/MS)CEATAG, Naphthenic Acids Background Information Discussion Report, 1998.
Gas Chromatography/Mass Spectrometry (GC/MS) Seifert, W.K., et. al. Anal. Chem. 41, 1638, 1969
Negative-Ion Electrospray Mass SpectrometryJohn V. Headley, Kerry M. Peru, Dena W. McMartin and Marcus Winkler, AOAC, 85, 1, 2002.


Water sample description
Milli-Q
Composition Composition (mg/L)
CaSO4 (DBH, DBH Chemicals, Poole, UK) 1013MgSO4 (DBH, DBH Chemicals, Toronto, Ont.) 938NaN3(DBH, DBH Chemicals, Toronto, Ont.) 525
Simulated Ground Water
South Saskatchewan River water

Experimental
Stock NA: Obtained from Athabasca Oilsandstailing pond water (pKa: 5 -6 )
Cartridges: ENV+ (crosslinked polystyrene-based polymer)(Biotage); C18 and Oasis.
Elution: Methanol
Mass Spectrometry: Electrospray
(negative-ion
mode)

Pre-wash with 10 ml of methanol & 10 ml of Milli-Q water
Load pH 3 water sample (4 to 200 ml)
Wash with 10 ml Milli-Q water. Dry for 10 min.
Elute with 4 ml of methanol
Bring the solution to dryness by blowing with N2
Re-dissolve in acetonitrile-water (50/50) plus 0.1% ammonium
hydroxide (2 to 4 ml)1 ml was taken for ESI-MS
analysis

Henderson-Hasselbalch Equation
= 100
A−
HApH = pKa + log
pKa = pH + log HAA−
Or
At pH = 3 and pKa = 5
HAA−

NA (Syncude standard) mass spectrum
100 120 140 160 180 200 220 240 260 280 300 320 340 360 380 400 420 440 460 480 500 520 540m/z0
100
%
Mar_19_07_Sarah5 42 (0.605) Sm (SG, 1x1.00); Cm (31:60-108:158) Scan ES- 3.11e6222.9
220.8208.8
206.9
194.9
192.8
118.6180.8
136.6178.7
234.9
236.9
249.0
251.0
257.0 271.0
281.0
283.0
297.0
299.0
309.0
313.0323.0

0.0
0.5
1.0
1.5
2.0
2.5
3.0
510
1520
2530
3540 0
24
68
1012
14
% A
bund
ance
Carbon No. (n)- Z family
Working Sol'n Oct 27/2005Athabasca Oilsands Naphthenic Acids

1 0 0 1 2 0 1 4 0 1 6 0 1 8 0 2 0 0 2 2 0 2 4 0 2 6 0 2 8 0 3 0 0 3 2 0 3 4 0 3 6 0 3 8 0 4 0 0 4 2 0 4 4 0 4 6 0 4 8 0 5 0 0 5 2 0 5 4 0m / z0
1 0 0
%
F e b _ 2 6 _ 0 7 _ D U 1 7 3 8 ( 0 . 5 4 8 ) S m ( S G , 1 x 1 . 0 0 ) ; C m ( 2 7 : 6 6 ) S c a n E S - 3 . 8 0 e 51 5 2 . 7
1 4 6 . 5
1 1 8 . 7
1 1 1 . 71 3 6 . 6
3 3 0 . 8
2 5 0 . 8
1 8 0 . 6
1 7 0 . 7
2 3 2 . 7
2 2 2 . 92 1 1 . 7
1 9 4 . 8
2 3 4 . 8
2 3 6 . 9
2 8 8 . 8
2 5 4 . 8
2 8 2 . 9
2 7 0 . 8
3 1 6 . 73 1 0 . 7
2 9 4 . 9
3 6 8 . 8
3 5 2 . 93 3 2 . 8
3 3 4 . 9
5 0 4 . 7
4 5 2 . 7
4 2 4 . 84 0 9 . 83 8 4 . 8
3 9 0 . 9
4 0 0 . 94 1 0 . 9
4 3 6 . 9
4 6 6 . 7 4 8 8 . 7
4 6 8 . 94 9 6 . 8
5 4 4 . 65 2 6 . 75 0 6 . 8
5 3 4 . 6
5 4 6 . 4
5 4 9 . 0
1 0 0 1 2 0 1 4 0 1 6 0 1 8 0 2 0 0 2 2 0 2 4 0 2 6 0 2 8 0 3 0 0 3 2 0 3 4 0 3 6 0 3 8 0 4 0 0 4 2 0 4 4 0 4 6 0 4 8 0 5 0 0 5 2 0 5 4 0m / z0
1 0 0
%
F e b _ 2 8 _ 0 7 _ D U 5 1 4 1 ( 0 . 5 9 0 ) S m ( S G , 1 x 1 . 0 0 ) ; C m ( 2 7 : 6 4 - 7 2 : 1 3 4 ) S c a n E S - 5 . 5 4 e 52 2 2 . 9
2 0 8 . 9
2 0 6 . 9
1 9 4 . 8
1 9 2 . 9
1 8 0 . 9
1 1 8 . 7 1 3 6 . 8 1 7 8 . 8
1 6 4 . 91 5 2 . 8
2 3 4 . 92 3 6 . 9
2 5 3 . 0
2 5 1 . 0 2 6 7 . 0
2 8 0 . 9
2 8 3 . 1
2 9 5 . 02 9 7 . 1
2 9 9 . 1
3 1 0 . 9
3 1 3 . 03 2 5 . 0
3 3 6 . 93 3 8 . 9
3 4 1 . 23 5 3 . 0
Simulated groundwater, 69 mg/L
Before extraction
After extraction

1 0 0 1 2 0 1 4 0 1 6 0 1 8 0 2 0 0 2 2 0 2 4 0 2 6 0 2 8 0 3 0 0 3 2 0 3 4 0 3 6 0 3 8 0 4 0 0 4 2 0 4 4 0 4 6 0 4 8 0 5 0 0 5 2 0 5 4 0m / z0
1 0 0
%
F e b _ 2 6 _ 0 7 _ D U 1 5 4 0 ( 0 . 5 7 6 ) C m ( 2 6 : 5 7 ) S c a n E S - 5 . 3 4 e 53 3 0 . 6
1 5 2 . 7
1 5 2 . 3
1 3 6 . 61 1 1 . 6 1 1 8 . 3
2 5 0 . 82 3 2 . 6
1 8 0 . 6
1 7 0 . 6
1 8 0 . 8
2 1 1 . 8
1 9 4 . 7
2 1 6 . 6
2 1 8 . 7
2 5 0 . 7
2 3 4 . 6
2 4 4 . 0
2 8 8 . 6
2 5 1 . 5
2 5 4 . 9
2 8 2 . 8
2 7 2 . 6
3 1 6 . 6
3 1 1 . 1
3 0 0 . 9
3 6 8 . 7
3 5 2 . 73 3 2 . 7
3 3 3 . 0
3 3 4 . 6
4 8 8 . 6
4 6 6 . 7
4 3 6 . 74 0 9 . 7
3 8 4 . 63 7 0 . 6 3 9 0 . 7
3 9 6 . 8
4 2 8 . 8
4 2 4 . 8
4 1 0 . 6
4 5 3 . 04 5 0 . 5
4 7 2 . 8
4 8 5 . 9
5 0 4 . 7
4 9 0 . 7 5 4 6 . 25 2 6 . 8
5 2 2 . 75 1 6 . 3 5 3 8 . 2
1 0 0 1 2 0 1 4 0 1 6 0 1 8 0 2 0 0 2 2 0 2 4 0 2 6 0 2 8 0 3 0 0 3 2 0 3 4 0 3 6 0 3 8 0 4 0 0 4 2 0 4 4 0 4 6 0 4 8 0 5 0 0 5 2 0 5 4 0m / z0
1 0 0
%
F e b _ 2 8 _ 0 7 _ D U 4 4 4 2 ( 0 . 6 0 5 ) S m ( S G , 1 x 1 . 0 0 ) ; C m ( 3 4 : 4 8 - 5 3 : 9 9 ) S c a n E S - 3 . 8 5 e 52 1 6 . 6
1 9 4 . 8
1 1 8 . 7
1 1 1 . 7
1 3 6 . 8
1 2 0 . 8
1 9 2 . 8
1 5 6 . 9
1 4 2 . 91 7 0 . 8
2 0 8 . 9
2 2 2 . 9
2 8 3 . 12 5 5 . 0
2 3 4 . 8
2 3 6 . 9
2 6 7 . 02 8 1 . 1
2 9 7 . 1
3 1 1 . 1
3 2 5 . 0
3 3 6 . 84 5 6 . 7
3 3 8 . 83 5 9 . 0
3 5 3 . 13 6 1 . 0
4 1 2 . 93 8 0 . 8 3 9 3 . 1 4 3 5 . 0
4 7 8 . 9
4 5 8 . 9 4 8 0 . 85 3 2 . 95 0 0 . 8
After extraction
Before extraction
Simulated groundwater, 0.069 mg/L
100 120 140 160 180 200 220 240 260 280 300 320 340 360 380 400 420 440 460 480 500 520 540m/z0
100
%
0
100
%
Feb_28_07_DU35 40 (0.576) Sm (SG, 1x1.00); Cm (27:58-77:124) Scan ES- 1.58e5146.7
118.8
102.8
104.8
136.7
174.8
152.6
158.7
180.8304.8294.8
288.7
254.6238.8232.8
216.6198.8
182.8208.6
266.9282.8
310.7
368.9352.7322.8
336.8384.9 434.9424.8396.8 440.8 498.7458.9 475.1 508.8
533.1 540.9
Feb_28_07_DU30 41 (0.591) Sm (SG, 1x1.00); Cm (27:59-78:132) Scan ES- 1.75e5222.8
220.9209.0
206.8
194.9
188.7
180.9148.9136.6118.7
164.6
237.0
265.1252.9 282.9267.0
281.0
293.0310.9
313.0
335.1 339.0 353.2367.0 381.1 395.3
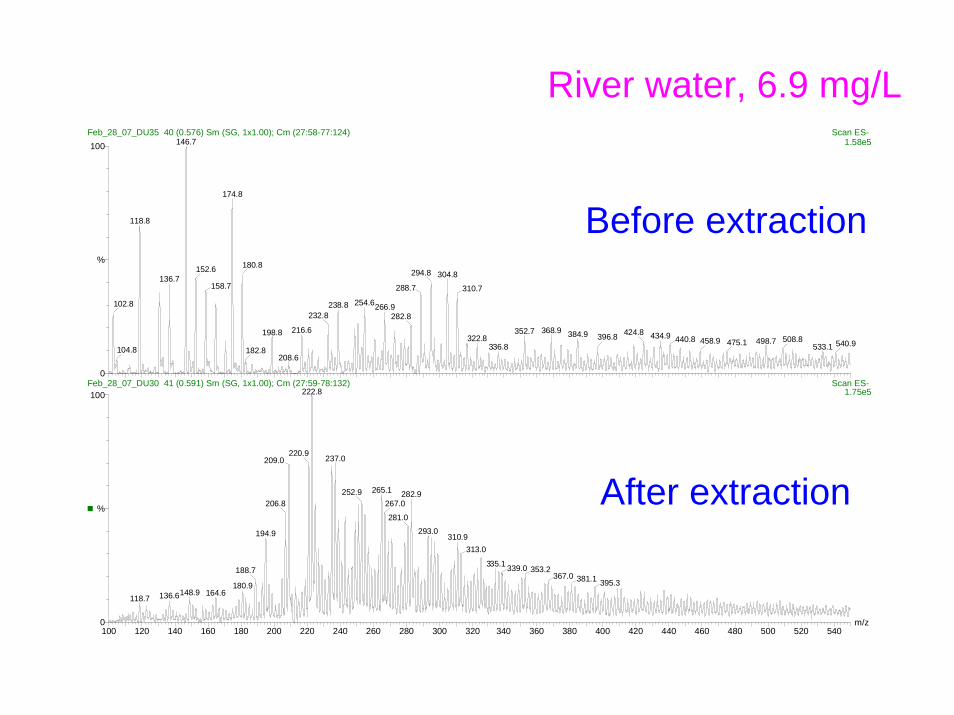
Before extraction
After extraction
River water, 6.9 mg/L

100 120 140 160 180 200 220 240 260 280 300 320 340 360 380 400 420 440 460 480 500 520 540m/z0
100
%
Feb_28_07_DU23 41 (0.590) Sm (SG, 1x1.00); Cm (24:71-90:137) Scan ES- 2.29e5297.0
283.1
281.0
265.0
254.9
242.9238.8
222.7220.8
219.0
204.8
192.8191.0
176.7
136.9
124.8
164.9150.9
267.0
311.0 325.0338.9
353.0
367.1369.1
381.1
395.1397.0
411.1
423.0425.1
437.2453.1
465.0467.1
River water, 0.069 mg/L
After extraction
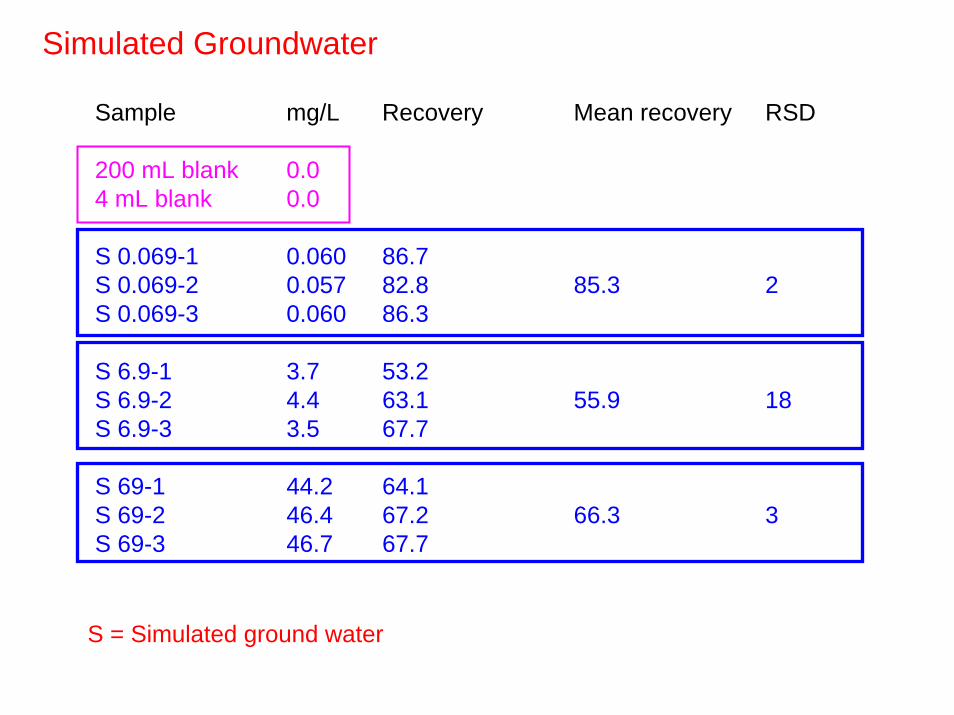
Sample mg/L Recovery Mean recovery RSD
200 mL blank 0.04 mL blank 0.0
S 0.069-1 0.060 86.7S 0.069-2 0.057 82.8 85.3 2S 0.069-3 0.060 86.3
S 6.9-1 3.7 53.2S 6.9-2 4.4 63.1 55.9 18S 6.9-3 3.5 67.7
S 69-1 44.2 64.1S 69-2 46.4 67.2 66.3 3S 69-3 46.7 67.7
S = Simulated ground water
Simulated Groundwater

Sample mg/L Corr. Conc. Recovery Mean recovery RSD
200 mL blank 69.34 mL blank 2.0
R 0.069-1 69.8 0.005 7.6R 0.069-2 71.4 0.021 30.4 30.5 75R 0.069-3 73.0 0.037 53.6
R 6.9-1 7.6 5.6 81.2R 6.9-2 7.3 5.3 76.8 83.1 9R 6.9-3 8.3 6.3 91.3
R 69-1 46.8 44.8 64.9R 69-2 46.4 44.4 64.3 61.2 10R 69-3 39.6 37.6 54.4
R = South Saskatchewan River water
River Water

Sample mg/L Recovery Mean recovery RSD
M 0.069-1 0.050 72.2M 0.069-2 0.041 60.0 65.5 5M 0.069-3 0.045 64.9
M 6.9-1 4.2 60.9M 6.9-2 4.0 57.4 61.4 7M 6.9-3 4.6 66.0
M 69-1 43.8 63.5M 69-2 46.1 66.8 63.5 5M 69-3 41.6 60.3
M =Milli-Q water
Milli-Q Water
200 mL blank 0.04 mL blank 0.0

Conclusions:
ENV+ cartridge efficiently extracts the non-dissociated naphthenic acid and desalts the final extract.
There is a significant matrix effect in the river water samples due to natural carboxylic acids (humic, fulvicetc.) in the natural river water systems.
The described SPE procedure significantly reduced the ion suppression during ESI caused by matrix interference.
ENV+ is more efficient than Oasis and C18 cartridges in extraction of NAs.

Thank you!