solid state degradation mechanisms: impact on - mbsw online
TRANSCRIPT
Solid State Degradation Mechanisms: Impact on Drug Product Design and Stability Test Design
William R. Porter33rd ANNUAL MIDWEST BIOPHARMACEUTICAL STATISTICS WORKSHOPMuncie, IN, May 25, 2010

Solid State Degradation MechanismsMay 25, 2010
2© 2010 Abbott
Stability by Design (SbD):
Instability Assessment— A Tool for Product Development
…in order to design stable products, you must first understand how your product degrades!
Solid State Degradation MechanismsMay 25, 2010
3© 2010 Abbott
Why “instability”
assessment?
“Good”
bulk storage conditions, formulations and packaging are really those that are “least bad.”
In order to develop “good”
processes and procedures, you must first...
Solid State Degradation MechanismsMay 25, 2010
4© 2010 Abbott
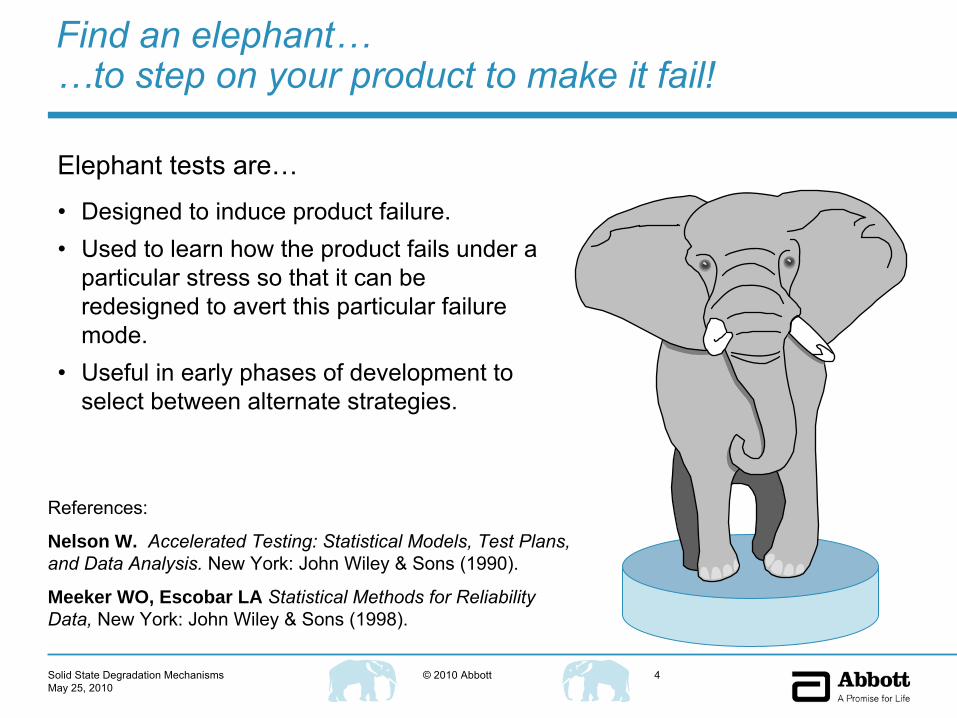
Find an elephant… …to step on your product to make it fail!
Elephant tests are…
•
Designed to induce product failure.•
Used to learn how the product fails under a particular stress so that it can be redesigned to avert this particular failure mode.
•
Useful in early phases of development to select between alternate strategies.
References:
Nelson W. Accelerated Testing: Statistical Models, Test Plans, and Data Analysis. New York: John Wiley & Sons (1990).
Meeker WO, Escobar LA Statistical Methods for Reliability Data,
New York: John Wiley & Sons (1998).
Solid State Degradation MechanismsMay 25, 2010
5© 2010 Abbott
What is a good elephant test?
One that produces the same
failures
and in the same proportions
that will occur in actual use, but in shorter time.
Elephant tests use stress conditions that exceed normal environmental conditions to degrade product performance.
Solid State Degradation MechanismsMay 25, 2010
6© 2010 Abbott
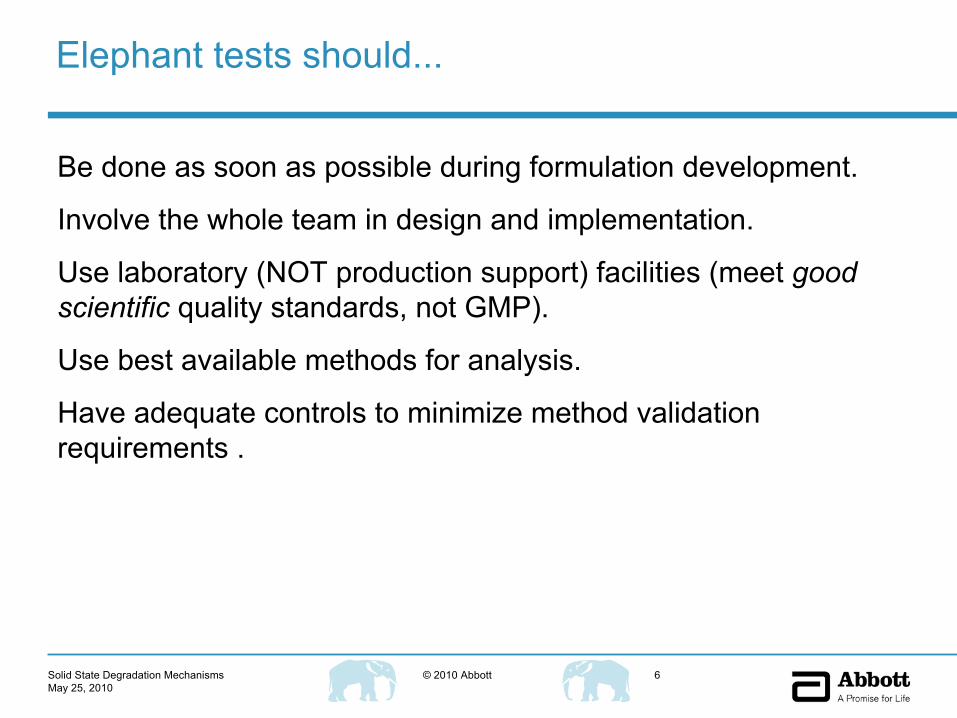
Elephant tests should...
Be done as soon as possible during formulation development.
Involve the whole team in design and implementation.
Use laboratory (NOT production support) facilities (meet good scientific quality standards, not GMP).
Use best available methods for analysis.
Have adequate controls to minimize method validation requirements .

Solid State Degradation MechanismsMay 25, 2010
7© 2010 Abbott
Prerequisites for instability assessment
“Stability-indicating”
assay…
•
“chicken & egg problem”
—Need to understand how material degrades to validate assay, need assay to understand how material degrades.
Controlled environment storage facilities…
•
Need controlled temperature, controlled humidity, controlled light stress.–
Control does NOT mean constant, but nonisofactorial
conditions complicate data analysis
Bulk material typical of future production lots…
•
Atypical bulk material may have atypical failure modes.
Planning is the most crucial element of a successful program…
…Timing isn’t everything; it’s the only thing!
Solid State Degradation MechanismsMay 25, 2010
8© 2010 Abbott
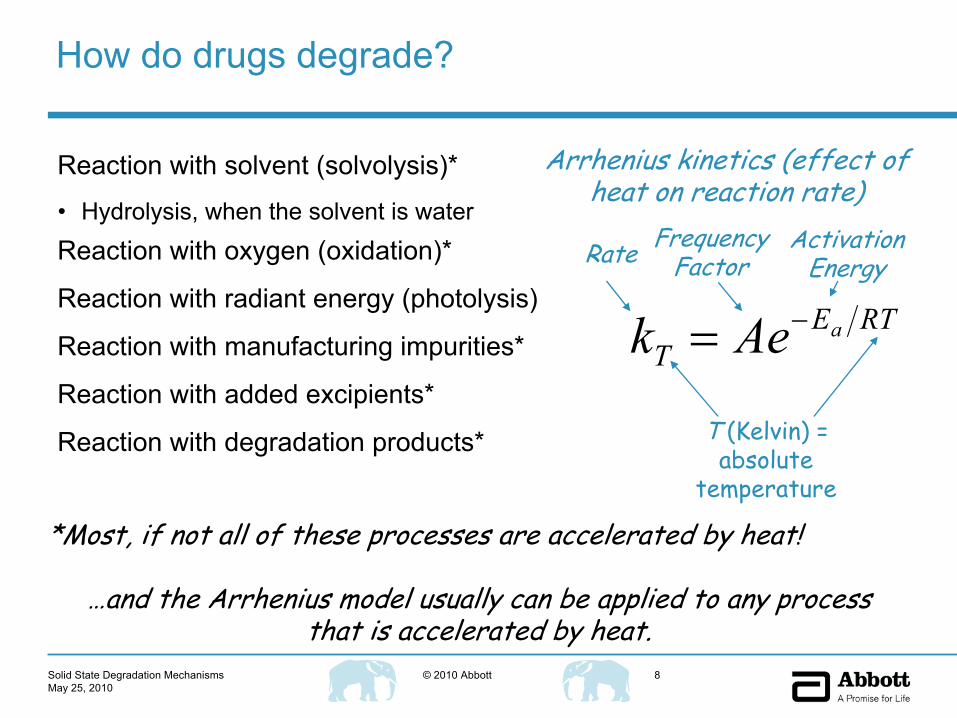
How do drugs degrade?
Reaction with solvent (solvolysis)*
•
Hydrolysis, when the solvent is water
Reaction with oxygen (oxidation)*
Reaction with radiant energy (photolysis)
Reaction with manufacturing impurities*
Reaction with added excipients*
Reaction with degradation products*
*Most, if not all of these processes are accelerated by heat!
…and the Arrhenius model usually can be applied to any process that is accelerated by heat.
Arrhenius kinetics (effect of heat on reaction rate)
RTET
aAek −=
T (Kelvin) = absolute
temperature
Rate Frequency Factor
Activation Energy

Solid State Degradation MechanismsMay 25, 2010
9© 2010 Abbott
Thermal stress tests for solids
Arrhenius assumption often invalid, because…
•
Phase changes, adsorbed moisture invalidate assumptions
Use lowest
temperature that produces measurable failure within allocated
time to avoid these complications.
•
Using higher temperatures to save time can lead to changes in failure mechanism, so always have a Plan B (additional samples stored at
a lower temperature for a longer time; assay these if higher temperature samples show excessive degradation).
True, but “reasonable” stress still practical… That depends…
Good news is good news; bad news is no news.*
*You need to execute Plan B…and that takes extra time and money!
Solid State Degradation MechanismsMay 25, 2010
10© 2010 Abbott
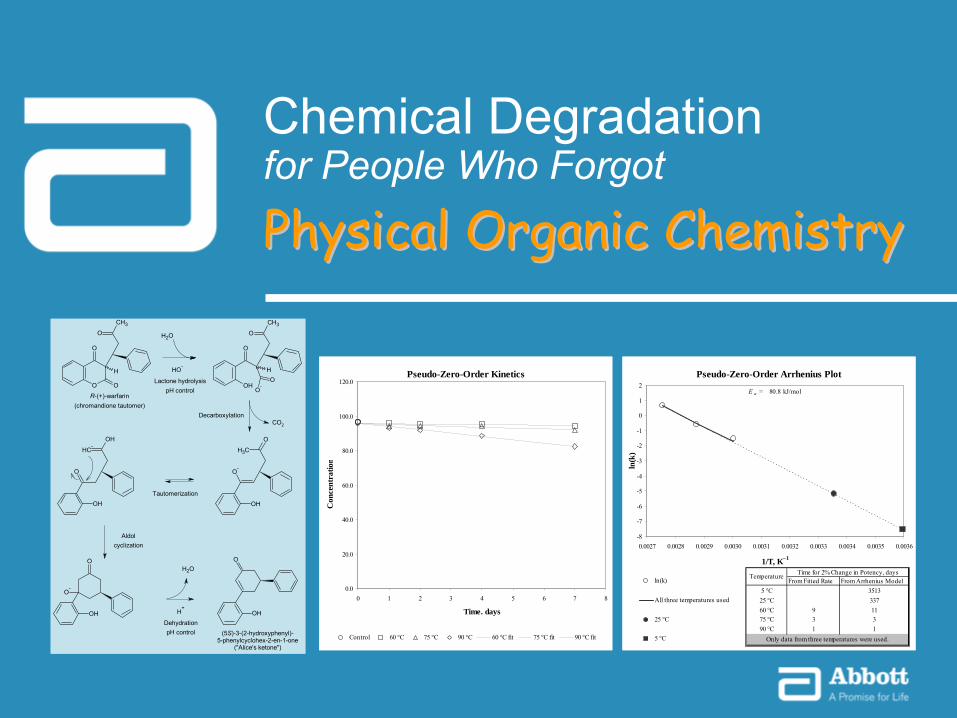
Chemical Degradation for People Who Forgot
O O
O
CH3
O
H
OHO
O
CH3
O
O-
H
OH
O-
CH3
O
Lactone hydrolysispH control
CO2
OH
O-
O
OH
OOH2
Decarboxylation
Tautomerization
Aldolcyclization
OH
O
CH-
OH
H+
DehydrationpH control
R-(+)-warfarin(chromandione tautomer)
(5S)-3-(2-hydroxyphenyl)-5-phenylcyclohex-2-en-1-one
("Alice's ketone")
OH2
OH-
Pseudo-Zero-Order Kinetics
0.0
20.0
40.0
60.0
80.0
100.0
120.0
0 1 2 3 4 5 6 7 8
Time. days
Con
cent
ratio
n
Control 60 °C 75 °C 90 °C 60 °C fit 75 °C fit 90 °C fit
Pseudo-Zero-Order Arrhenius Plot
-8
-7
-6
-5
-4
-3
-2
-1
0
1
2
0.0027 0.0028 0.0029 0.0030 0.0031 0.0032 0.0033 0.0034 0.0035 0.0036
1/T, K–1
ln(k
)
ln(k)
All three temperatures used
25 °C
5 °C
E a = 80.8 kJ/mol
From Fitted Rate From Arrhenius Model5 °C 351325 °C 33760 °C 9 1175 °C 3 390 °C 1 1
Only data from three temperatures were used.
Temperature Time for 2% Change in Potency, days
Physical Organic ChemistryPhysical Organic Chemistry
Solid State Degradation MechanismsMay 25, 2010
11© 2010 Abbott
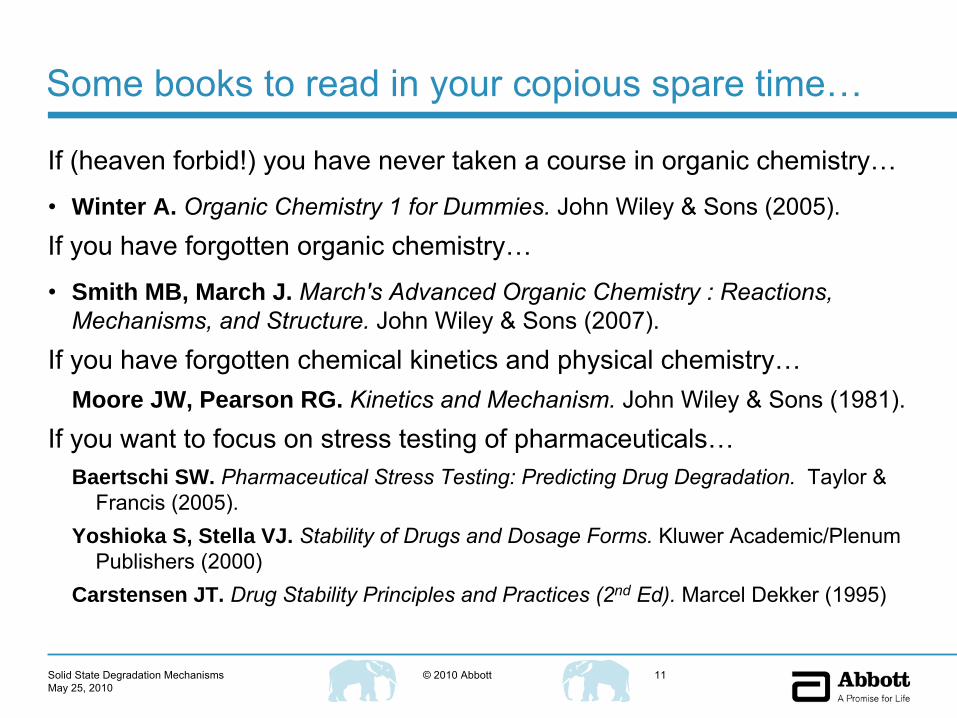
Some books to read in your copious spare time…
If (heaven forbid!) you have never taken a course in organic chemistry…
•
Winter A. Organic Chemistry 1 for Dummies.
John Wiley & Sons (2005).
If you have forgotten organic chemistry…
•
Smith MB, March J. March's Advanced Organic Chemistry : Reactions, Mechanisms, and Structure.
John Wiley & Sons (2007).
If you have forgotten chemical kinetics and physical chemistry…Moore JW, Pearson RG. Kinetics and Mechanism. John Wiley & Sons (1981).
If you want to focus on stress testing of pharmaceuticals…Baertschi SW. Pharmaceutical Stress Testing: Predicting Drug Degradation. Taylor &
Francis (2005).Yoshioka S, Stella VJ. Stability of Drugs and Dosage Forms.
Kluwer
Academic/Plenum Publishers (2000)
Carstensen JT. Drug Stability Principles and Practices (2nd
Ed).
Marcel Dekker (1995)

Solid State Degradation MechanismsMay 25, 2010
12© 2010 Abbott
…not to mention self-promotion…
Book chapters I’ve written on the subject:
•
Zhou D, Porter WR, Zhang GZZ. “Drug Stability and Degradation Studies.”
Chapter 5 in: Qiu Y, Chen Y, Zhang GGZ, Liu L, Porter WR. Developing Solid Oral Dosage Forms: Pharmaceutical Theory and Practice.
Elsevier/Academic Press (2009).•
Porter WR. “Residues and Cleaning Chemistry,”
Chapter 9 in Pluta P. Cleaning and Cleaning Validation, Vol
1. PDA/Davis Healthcare International Publishing LLC (2009).
Solid State Degradation MechanismsMay 25, 2010
13© 2010 Abbott
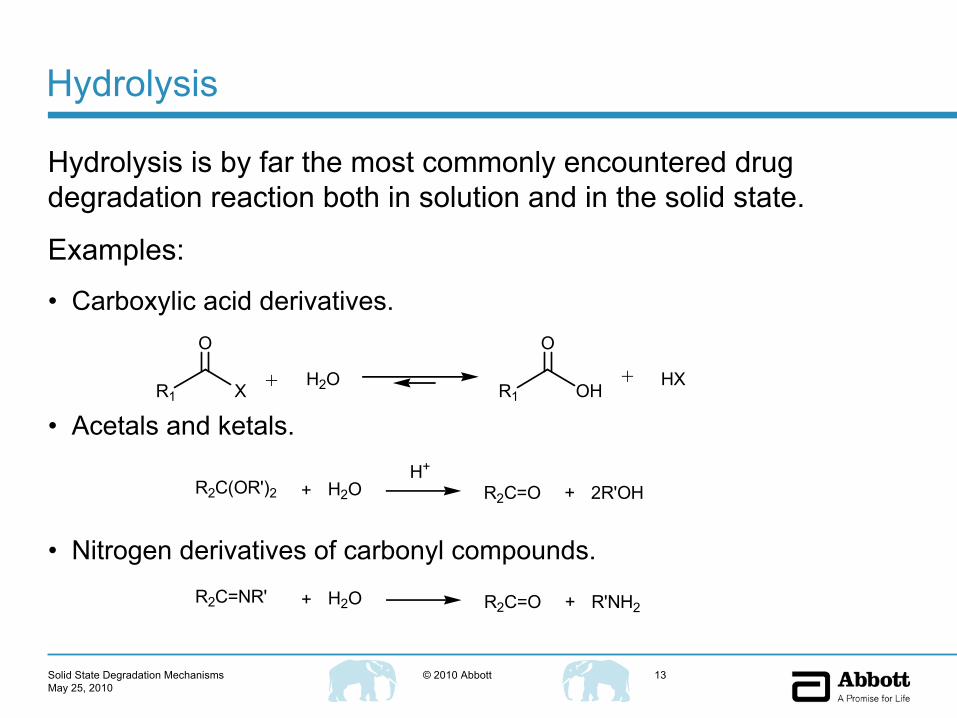
Hydrolysis
Hydrolysis is by far the most commonly encountered drug degradation reaction both in solution and in the solid state.
Examples:
•
Carboxylic acid derivatives.
•
Acetals
and ketals.
•
Nitrogen derivatives of carbonyl compounds.
R1
O
X + H2OR1
O
OH+ HX
R2C(OR')2 H2O R2C=O 2R'OH++H+
R2C=NR' H2O R2C=O R'NH2++
Solid State Degradation MechanismsMay 25, 2010
14© 2010 Abbott
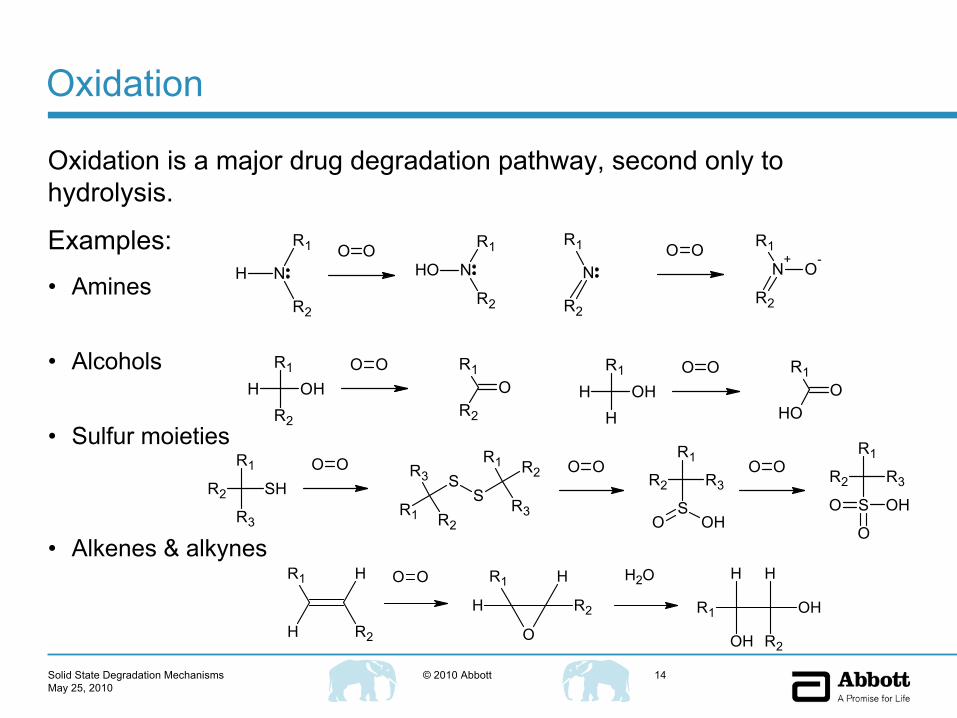
Oxidation
Oxidation is a major drug degradation pathway, second only to hydrolysis.
Examples:
•
Amines
•
Alcohols
•
Sulfur moieties
•
Alkenes & alkynes
SH
R1
R3
R2
O OS
R1
R3
R2
S
R1
R3
R2 O O
S
R1
R3R2
OHO
O O
S
R1
R3R2
OHO
O
OHR1
R2
HO O
OR1
R2
OHR1
HH
O OO
R1
OH
R1
H
H
R2
O O R1
H
H
R2
O
OH2
R1
H H
R2
OH
OH
N
R2
H
R1
NOH
R2
R1O ON
R2
R1
N+
O-
R2
R1O O

Solid State Degradation MechanismsMay 25, 2010
15© 2010 Abbott
Photolysis
To undergo photodegradation, compound must absorb light in the same spectral region as the radiant energy to which it is exposed.
•
No absoption no reaction
Examples
•
Radical induced oxidation
•
Radical formation and polymerization
R2
R3
R1
Hhν
CR2
R3
R1O O
CR2
R3
R1
R2
R3
R1
R2
R3
R1
R2
R3
R1
O
OH

Solid State Degradation MechanismsMay 25, 2010
16© 2010 Abbott
Solid State Chemical Kinetics
Based on: Vyazovkin A & Wight CA. Kinetics in Solids
Annu
Rev Phys Chem. 48:125-149 (1977)
Look at the date!
One score and thirteen years ago, physical chemists brought forth upon this planet a new paradigm, conceived in simplicity, and dedicated to the principle that all solid state kinetics problems can be solved by replacing kinetic models and rates with time-to-failure.
Solid State Degradation MechanismsMay 25, 2010
17© 2010 Abbott
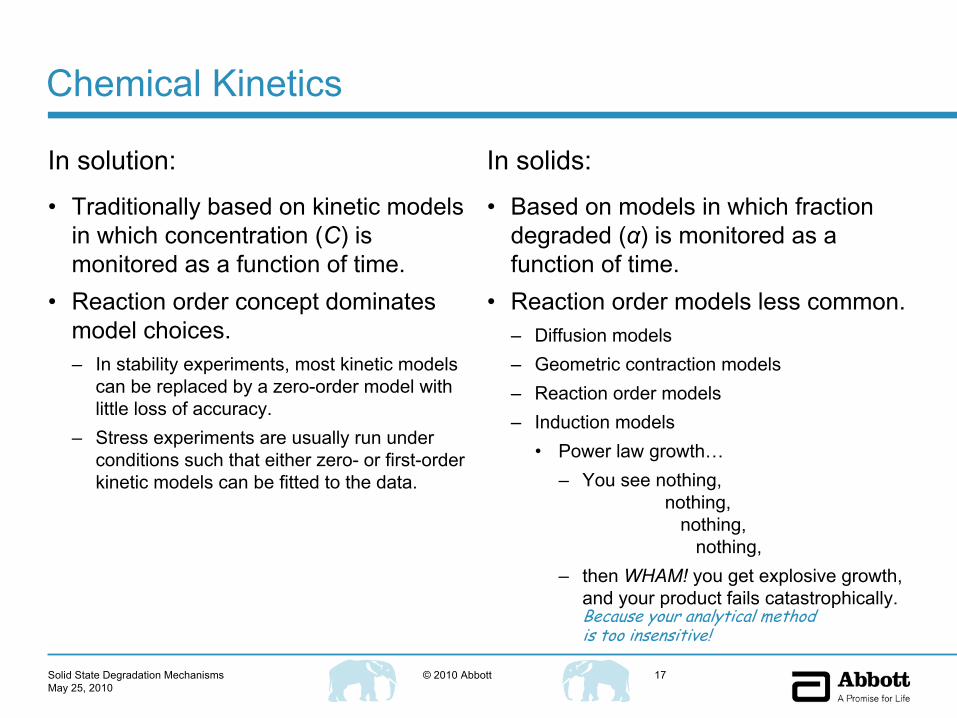
Chemical Kinetics
In solution:
•
Traditionally based on kinetic models in which concentration (C) is monitored as a function of time.
•
Reaction order concept dominates model choices.–
In stability experiments, most kinetic models can be replaced by a zero-order model with little loss of accuracy.
–
Stress experiments are usually run under conditions such that either zero-
or first-order kinetic models can be fitted to the data.
In solids:
•
Based on models in which fraction degraded (α) is monitored as a function of time.
•
Reaction order models less common.–
Diffusion models–
Geometric contraction models–
Reaction order models–
Induction models•
Power law growth…–
You see nothing,
nothing,
nothing,
nothing,
–
then WHAM!
you get explosive growth,
and your product fails catastrophically.Because your analytical method is too insensitive!

Solid State Degradation MechanismsMay 25, 2010
18© 2010 Abbott
The traditional unreadable slide…
From: Vyazovkin A & Wight CA. Kinetics in Solids Annu Rev Phys Chem. 48:127-1128 (1977)
Derivative form Integral form
Solid State Degradation MechanismsMay 25, 2010
19© 2010 Abbott
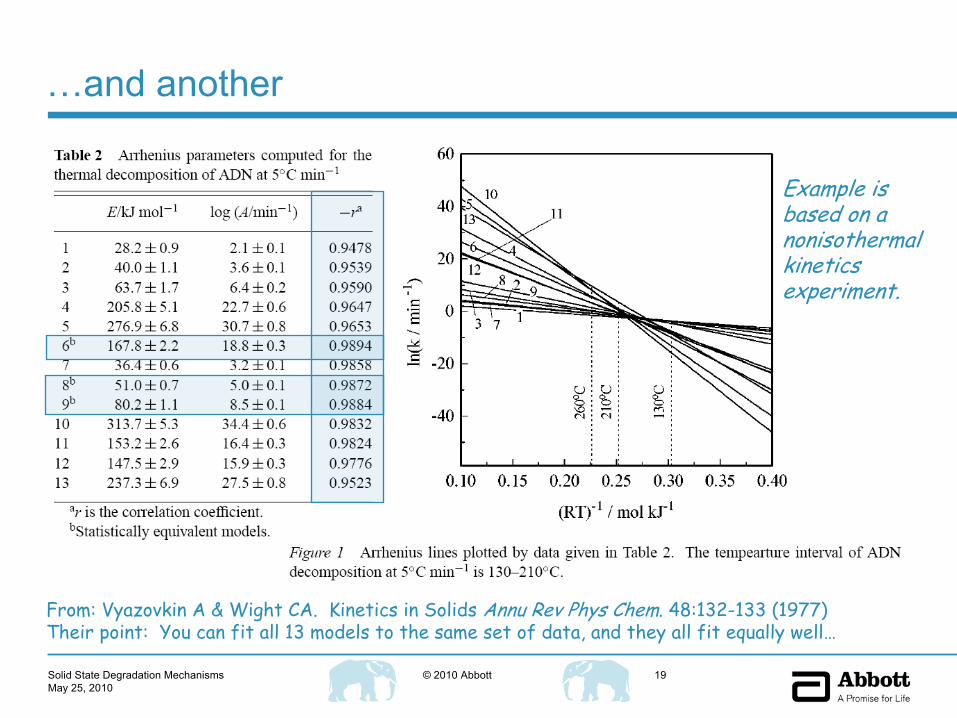
…and another
From: Vyazovkin A & Wight CA. Kinetics in Solids Annu Rev Phys Chem. 48:132-133 (1977)
Their point: You can fit all 13 models to the same set of data,
and they all fit equally well…
Example is based on a nonisothermal kinetics experiment.
Solid State Degradation MechanismsMay 25, 2010
20© 2010 Abbott
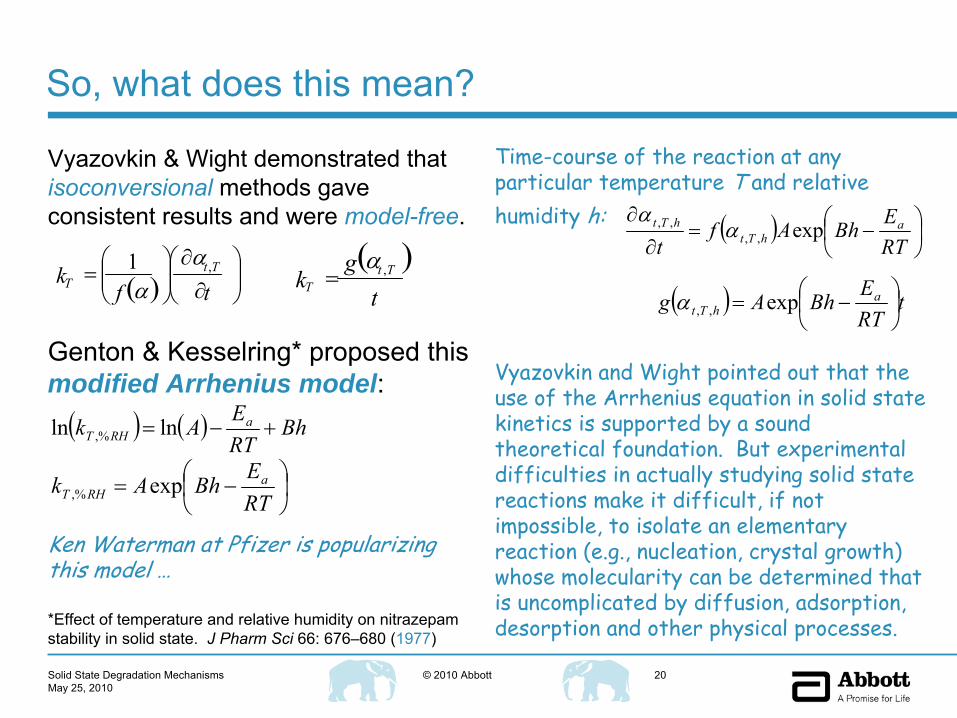
Vyazovkin & Wight demonstrated that isoconversional
methods gave consistent results and were model-free.
So, what does this mean?
( ) ( ) BhRTEAk a
RHT +−= lnln ,%
⎟⎠⎞
⎜⎝⎛ −=
RTEBhAk a
RHT exp,%
Time-course of the reaction at any particular temperature T and relative humidity h: ( ) ⎟
⎠⎞
⎜⎝⎛ −=
∂∂
RTEBhAf
ta
hTthTt exp,,
,, αα
( ) tRTEBhAg a
hTt ⎟⎠⎞
⎜⎝⎛ −= exp,,α
Vyazovkin and Wight pointed out that the use of the Arrhenius equation in solid state kinetics is supported by a sound theoretical foundation. But experimental difficulties in actually studying solid state reactions make it difficult, if not impossible, to isolate an elementary reaction (e.g., nucleation, crystal growth) whose molecularity can be determined that is uncomplicated by diffusion, adsorption, desorption and other physical processes.
Ken Waterman at Pfizer is popularizing
this model …
*Effect of temperature and relative humidity on nitrazepam
stability in solid state. J Pharm
Sci
66: 676–680 (1977)
Genton
& Kesselring* proposed this modified Arrhenius model:
( )t
gk TtT
,α=( ) ⎟⎟
⎠
⎞⎜⎜⎝
⎛∂
∂⎟⎟⎠
⎞⎜⎜⎝
⎛=
tfk TtT
,1 αα

Solid State Degradation MechanismsMay 25, 2010
21© 2010 Abbott
All things cometh to they who waiteth…
…but isn’t 33 years of waiting a little bit too long?
Everything we needed to know to design thermal stress degradation experiments for solids was known in 1977.
The key, as pointed out by Vyazovkin & Wight, was to use “model-free”
methods. All you need to do is replace rates (which depend on kinetic models) with time-to-failure:
( )
⎟⎠⎞
⎜⎝⎛ −
===
RTEBhA
gta
g
T
exp
005.0,005.0
αα
The Arrhenius frequency factor A is a function of g, but g itself is independent of the temperature T.
Solid State Degradation MechanismsMay 25, 2010
22© 2010 Abbott
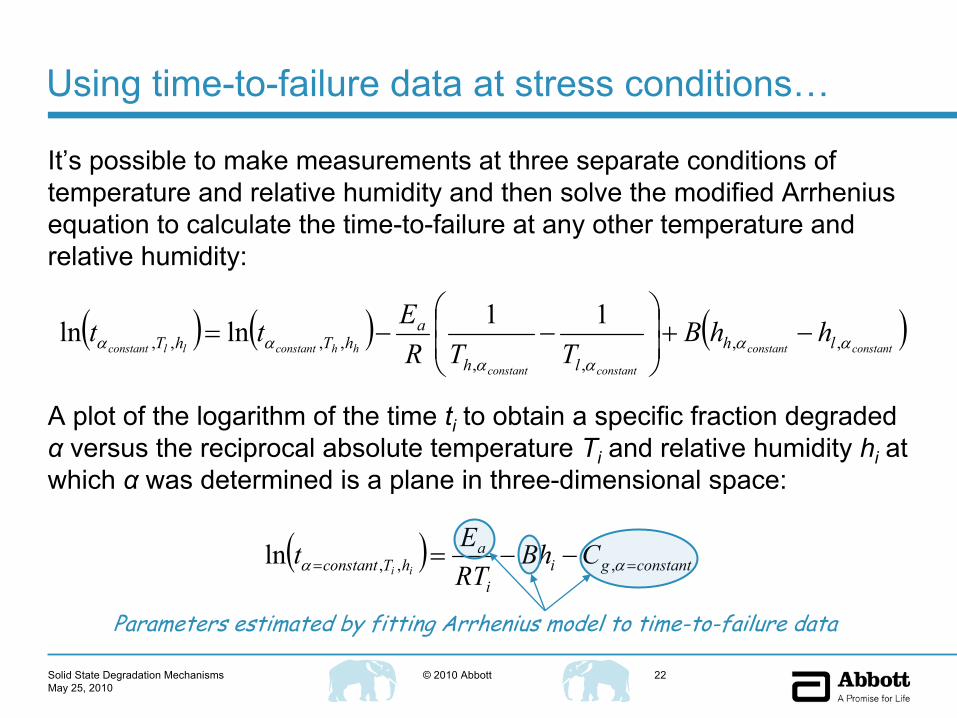
Using time-to-failure data at stress conditions…
It’s possible to make measurements at three separate conditions of temperature and relative humidity and then solve the modified Arrhenius equation to calculate the time-to-failure at any other temperature and relative humidity:
( ) ( ) ( )constantconstant
constantconstant
hhconstantllconstant lhlh
ahThT hhB
TTREtt αα
αααα ,,
,,,,,,
11lnln −+⎟⎟⎠
⎞⎜⎜⎝
⎛−−=
A plot of the logarithm of the time ti
to obtain a specific fraction degraded α
versus the reciprocal absolute temperature Ti
and relative humidity hi
at which α
was determined is a plane in three-dimensional space:
( ) constantgii
ahTconstant CBh
RTEt
ii == −−= αα ,,,ln
Parameters estimated by fitting Arrhenius model to time-to-failure data
Solid State Degradation MechanismsMay 25, 2010
23© 2010 Abbott
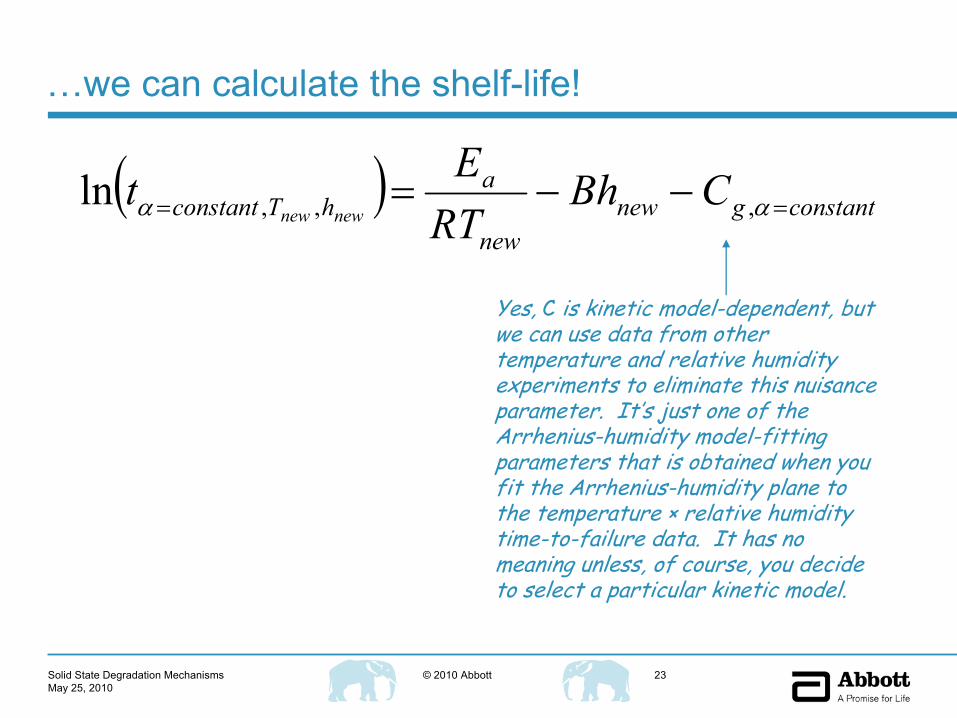
…we can calculate the shelf-life!
( ) constantgnewnew
ahTconstant CBh
RTEt
newnew == −−= αα ,,,ln
Yes, C is kinetic model-dependent, but we can use data from other temperature and relative humidity experiments to eliminate this nuisance parameter. It’s just one of the Arrhenius-humidity model-fitting parameters that is obtained when you fit the Arrhenius-humidity plane to the temperature × relative humidity time-to-failure data. It has no meaning unless, of course, you decide to select a particular kinetic model.

Solid State Degradation MechanismsMay 25, 2010
24© 2010 Abbott
…or, we can calculate how long to expose samples to thermal stress to support a desired shelf-life
Time Required to Achieve Constant Fractional Degradation as a Function of Temperature at B×h = 0 for tlow = 2 Years at 25 °C
a. “Rule of thumb”
assumed value for ICH accelerated stability extrapolation.
b. Note that 50 kJ/mol ≈
12 kcal/mol, 67 kJ/mol ≈
16 kcal/mol, 84 kJ/mol ≈
20 kcal/mol, 100 kJ/mol ≈
24 kcal/mol, and 117 kJ/mol ≈
28 kcal/mol.
Temperature t(1 –
α)
(days) for Ea
, kJoules/mole
°C K 50b 67b 71.74a,b 84b 100b 117b
25 298.15 730.50 days
32 305.15 459.91 392.96 376.10 335.76 289.55 247.40
40 313.15 277.99 200.15 182.63 144.11 105.79 76.17
48 321.15 172.29 105.43 91.93 64.52 40.64 24.87
56 329.15 190.30 57.29 47.85 30.03 16.35 8.57
65 338.15 67.21 29.86 23.82 13.27 6.18 2.75
75 348.15 40.32 15.06 11.44 5.62 2.23 0.83
85 358.15 24.90 7.89 5.73 2.50 0.85 0.27
T
to cut t
in half @ E
a
= 71.74 kJmol –1

Solid State Degradation MechanismsMay 25, 2010
25© 2010 Abbott
What temperature and humidity conditions must our products survive?
ICH Guideline Q1A(R2) recommends storage conditions of 25 °C at 60% RH and 40 °C at 75% RH as a general case for use in “long term”
and “accelerated”
stability trials. An “intermediate”
storage condition of 30 °C at 65% RH is used to provide backup data in the event that product failure is detected under “accelerated”
stress conditions.
Can we predict whether or not a drug substance or drug product is likely to meet specifications as recommended in ICH Guidelines Q3A(R2) and Q3B(R2) using the Genton
and Kesselring
expanded Arrhenius model and data obtained under higher temperature and higher humidity?
Solid State Degradation MechanismsMay 25, 2010
26© 2010 Abbott
The Waterman plan…
Ken Waterman and colleagues at Pfizer recently proposed time- to-failure stress degradation studies using a range of accelerated
temperature and a range of relative humidity storage conditions to be used routinely for preformulation and early formulation development studies.
•
Waterman KC, Carella AJ, Gumkowski MJ, Lukulay P, MacDonald BC, Roy MC, Shamblin SL. Improved protocol and data analysis for accelerated shelf-life estimation. Pharm
Res 24(4):780–790 (2007).•
Waterman K. “Accelerated Stability Assessment Program (ASAP): Using Science to Set Shelf Life,”
presented at 5th Annual Forced Degradation Strategies for Small Molecules, Baltimore, MD, February 26, 2008.
Solid State Degradation MechanismsMay 25, 2010
27© 2010 Abbott
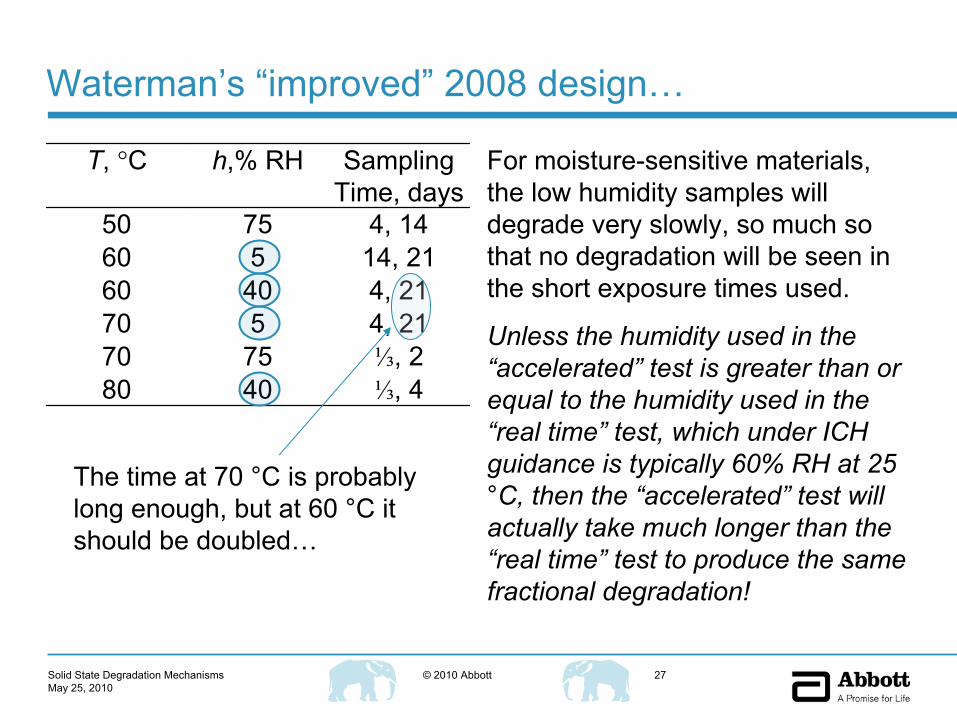
Waterman’s “improved”
2008 design…
For moisture-sensitive materials, the low humidity samples will degrade very slowly, so much so that no degradation will be seen in the short exposure times used.
Unless the humidity used in the “accelerated”
test is greater than or equal to the humidity used in the “real time”
test, which under ICH guidance is typically 60% RH at 25 °C, then the “accelerated”
test will actually take much longer than the “real time”
test to produce the same fractional degradation!
T, °C h,% RH Sampling Time, days
50 75 4, 1460 5 14, 2160 40 4, 2170 5 4, 2170 75 ⅓, 280 40 ⅓, 4
The time at 70 °C is probably long enough, but at 60 °C it should be doubled…

Solid State Degradation MechanismsMay 25, 2010
28© 2010 Abbott
How does B
(sensitivity to humidity) affect time-to failure at different temperatures for different Ea
? Time Required to Achieve Constant Fractional Degradation as a Function of Temperature at 75% Relative Humidity
B = Temperature Ea
, kJ/mole h =T, °C T, K 50 67 84 100 117 %RH
25 298.15 730.50 days 600.01 40 313.15 239.26 172.27 124.04 91.05 65.56 750.01 50 323.15 132.07 77.69 45.70 27.74 16.32 750.01 60 333.15 75.54 36.75 17.88 9.08 4.42 750.01 75 348.15 34.71 12.96 4.84 1.92 0.72 750.03 40 313.15 177.25 127.62 91.89 67.45 48.57 750.03 50 323.15 97.84 57.56 33.86 20.55 12.09 750.03 60 333.15 55.96 27.23 13.25 6.72 3.27 750.03 75 348.15 25.71 9.60 3.59 1.42 0.53 750.05 40 313.15 131.31 94.55 68.07 49.97 35.98 750.05 50 323.15 72.48 42.64 25.08 15.22 8.96 750.05 60 333.15 41.46 20.17 9.81 4.98 2.42 750.05 75 348.15 19.05 7.11 2.66 1.05 0.39 750.07 40 313.15 97.28 70.04 50.43 37.02 26.65 750.07 50 323.15 53.69 31.59 18.58 11.28 6.63 750.07 60 333.15 30.71 14.94 7.27 3.69 1.80 750.07 75 348.15 14.11 5.27 1.97 0.78 0.29 750.09 40 313.15 72.07 51.89 37.36 27.42 19.75 750.09 50 323.15 39.78 23.40 13.77 8.36 4.92 750.09 60 333.15 22.75 11.07 5.39 2.73 1.33 750.09 75 348.15 10.45 3.90 1.46 0.58 0.22 75

Solid State Degradation MechanismsMay 25, 2010
29© 2010 Abbott
What is the effect of humidity h… …for different moisture sensitivities (B)?
Storage Time in Days Required to Achieve Degradation Equivalent to Storage for 2 Years at 25 °C, 60% RH
B Ea
kJ/moleT
°C
T
K h
= 5% RH h
= 10% RH
h
= 30% RH
h
= 50% RH
h
= 75% RH
h
= 80% RH
0.09 50 50 323.15 21661.58 13812.03 2283.11 377.40 39.78 25.360.09 50 60 333.15 12390.63 7900.62 1305.96 215.87 22.75 14.51
0.09 50 65 338.15 9488.03 6049.83 1000.03 165.30 17.42 11.11
0.09 50 75 348.15 5692.84 3629.92 600.02 99.18 10.45 6.67
0.05 84 50 323.15 830.64 646.91 237.98 87.55 25.08 19.53
0.05 84 60 333.15 324.98 253.09 93.11 34.25 9.81 7.64
0.05 84 65 338.15 207.54 161.64 59.46 21.88 6.27 4.88
0.05 84 75 348.15 87.98 68.52 25.21 9.27 2.66 2.07
0.01 117 50 323.15 32.86 31.26 25.59 20.95 16.32 15.52
0.01 117 60 333.15 8.89 8.46 6.93 5.67 4.42 4.20
0.01 117 65 338.15 4.76 4.53 3.71 3.04 2.36 2.25
0.01 117 75 348.15 1.44 1.37 1.12 0.92 0.72 0.68

Solid State Degradation MechanismsMay 25, 2010
30© 2010 Abbott
So, what does this mean?
When substances sensitive to moisture (large B) are subjected to thermal stress under conditions of low humidity (small h), it can take a very long time for substances having a low Arrhenius activation energy (small Ea
) to degrade, even at elevated temperatures (high T) to the same extent that would be observed in a real time stability trial conducted in accordance with ICH Guidelines.
•
For example, in the case where B
= 0.09, h
= 5% RH, Ea
= 50 kJ/mole and T
= 75 °C, it would take 5693 days exposure to achieve the same amount of degradation seen in 730 days at 25 °C and 60% RH
Conclusion: Experiments at low humidity are useless for moisture sensitive compounds.

Solid State Degradation MechanismsMay 25, 2010
31© 2010 Abbott
A better design…
Skip the low humidity test conditions
•
You really need to do initial experiments at only one humidity—the highest the product must ever face.
•
Per ICH guidelines, this is 75% RH for all
climate zones.
Use the highest thermal stress that does not result in a change of physical form.
•
Desolvation/dehydration•
Polymorph conversion
If you have time, use two or more temperatures to estimate Ea
.
Solid State Degradation MechanismsMay 25, 2010
32© 2010 Abbott
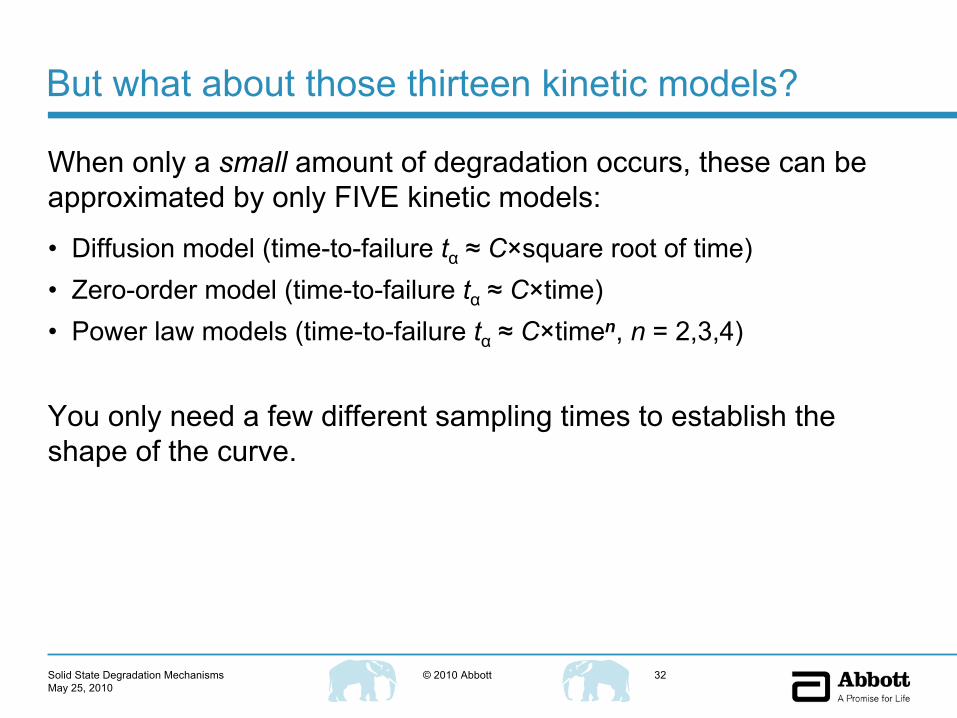
But what about those thirteen kinetic models?
When only a small
amount of degradation occurs, these can be approximated by only FIVE kinetic models:
•
Diffusion model (time-to-failure tα
≈
C×square
root of time)•
Zero-order model (time-to-failure tα
≈
C×time)•
Power law models (time-to-failure tα
≈
C×timen, n = 2,3,4)
You only need a few different sampling times to establish the shape of the curve.

Solid State Degradation MechanismsMay 25, 2010
33© 2010 Abbott
Stability Trial Assay Results
0.00%
0.05%
0.10%
0.15%
0.20%
0.25%
0.30%
0.35%
0.40%
0.45%
0.50%
0.55%
0 0.5 1 1.5 2
Time, Years
Cri
tical
Deg
rada
nt, %
Diffusion Zero Order Quadratic Cubic Quartic
Not Detected
Detected, Not Quantified
Hypothetical Stability Trial Results
Need to know shape of plot in advance!•
Use data from high temperature and high humidity degradation experiment.
•
Note that for power law (induction) kinetics, early degradation is either:–
not detected…–
or not quantifiable,…so you need to modify the stability sampling plan.
Threshold for toxicological qualification
