solid waste comprehensive plan - king county, washington · metal 2.7% 4.7% plastic 12.2% paper...
TRANSCRIPT

11/13/2017
Solid Waste Comprehensive PlanJanuary 13, 2017

21/13/2017
Planning Chapter Overview
• MSWMAC survey showed strong support for existing policies
• Most planning policies required by state law or by agreements with cities
• Content provides context for all other chapters and policies
31/13/2017
Purpose of the Planning Chapter
• Inventories existing capacity at solid waste
operations and facilities
• Forecasts solid waste disposal and tonnage
through 2040
• Identifies major regional and industry trends

41/13/2017
Policies Are Labeled by Chapter and Number
• Labeling consistent with
committee survey
results included in
November 2016
meeting
WPR - 4
Chapter
Policy
Number

51/13/2017
Policy Legend
WPR TWaste Prevention
& Recycling
P Planning
CP Collection &
ProcessingF
D Disposal
Transfer
Finance

61/13/2017
The Regional Solid Waste System by
the Numbers in 2016576,800 Households (2016)
757,700 Covered Employment (2015)
2,050,000 Generated tons* (2016 estimate)
920,000 Disposed tons (2016 estimate)
54% Recycling rate (2013)
8 Transfer stations
*Note: Includes disposed, recycled, and composted tons
71/13/2017
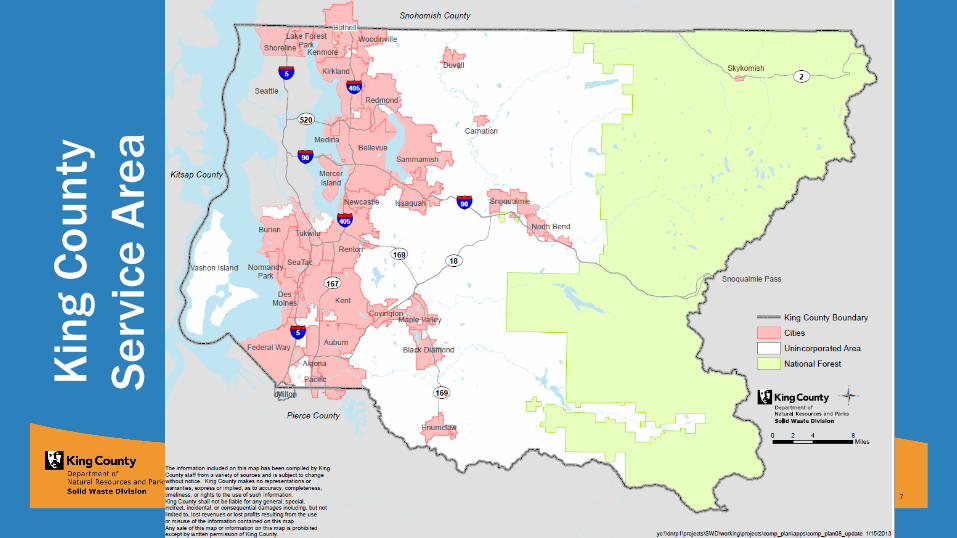
Kin
g C
ou
nty
Se
rvic
e A
rea
81/13/2017

91/13/2017
Some Planning Policies are Required
by State Law
Monitor and report the amount of, composition, and source of solid waste entering the transfer and disposal system
Notes: See Revised Code of Washington 70.95.080 and 70.95.090
P 1

101/13/2017
Waste audits at transfer stations are
completed every three years
Wood, Yard
16.8%
Food
20.6%
Glass
2.7%Metal
4.7%
Plastic
12.2%
Paper
16.8%
HHW,
Special
0.7%
Other
Wastes
9.9%
Electronics
0.5% Other
Organics
15.3%
Results from 2015
Waste Characterization
Study
Source: Final 2015 Waste Characterization and Customer Survey Report

111/13/2017
70% of Waste Disposed has Potential
to be Recycled
Not Recyclable
30.2%
Limited
Recyclability
8.0%
Readily
Recyclable
61.8%
Final 2015 Waste Characterization and Customer Survey Report
Vegetative food 13%
Non-vegetative food 8%
Dimensional lumber 6%
Yard waste 4%
Cardboard 3%
Disposable Diapers 6%
Treated Wood 2%
Gypsum Wallboard 2%
Furniture 2%

121/13/2017
Transfer Stations Receive Solid Waste from
Residential and Non-Residential Sources
39%
25%35%
2%
Commercial Collection
Self-Haul
Self-Haul
Commercial Collection
Final 2015 Waste Characterization and Customer Survey Report
Percent
of
Disposed
Tons

131/13/2017
Annual Tons Disposed
at Transfer Stations, 2016*
272
155 154 131
72 68 21 7 4 1
-
50
100
150
200
250
300
Bow Lake NE Area
(Houghton)
Algona Factoria Shoreline Renton Enumclaw Vashon Cedar Falls
Drop Box
Skykomish*
Ton
s (
in t
ho
usa
nd
s)
* Note: Data reflect transfer station tons only – they do not include disposed tons from regional direct, special, and other waste sent to Cedar Hills Landfill
141/13/2017
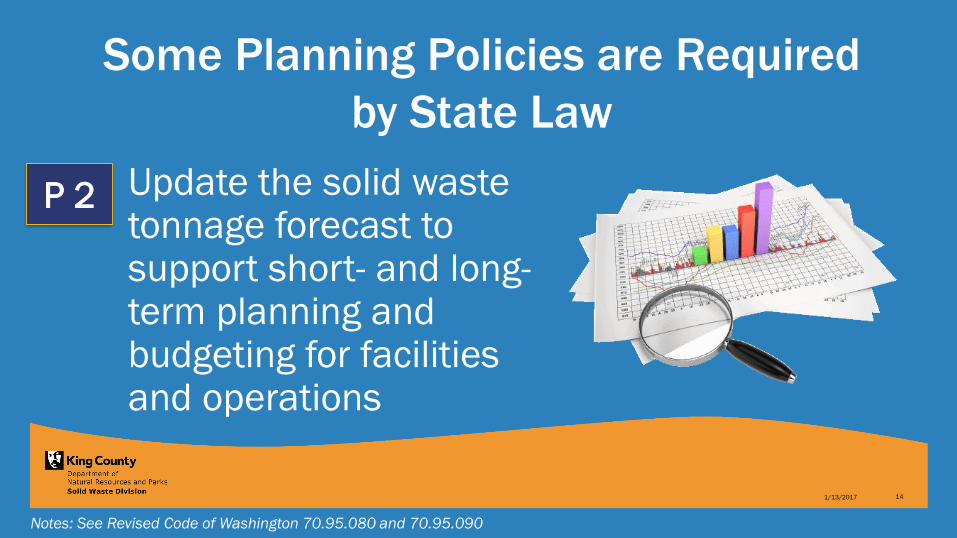
Some Planning Policies are Required
by State Law
Update the solid waste tonnage forecast to support short- and long-term planning and budgeting for facilities and operations
Notes: See Revised Code of Washington 70.95.080 and 70.95.090
P 2
151/13/2017
Forecasting Solid Waste in King County
• Identify short-term (high confidence) changes
to generated and disposed tons
• Estimate effect of long-term effects (lower
confidence) to solid waste
• Tonnage forecast is updated annually to
adjust to changing conditions

161/13/2017
Factors Driving Tonnage Disposal
• Short-term Outlook:
– Re-opening of Seattle
North transfer station
– Effects of short-term
business cycle (Booms
and Busts): Great
Recession, Amazon-
boom
• Long-term Outlook
– Income Development
– Growth in Local
Economy
– Innovations
– Productivity

171/13/2017
Projected Change in Population, SWD Service Area
2016-2040
1,444,000
1,549,0001,589,000
1,627,0001,673,000
1,000,000
1,250,000
1,500,000
1,750,000
2016 2025 2030 2035 2040
Po
pu
lati
on
Source: PSRC, Land Use Vision1 Model (2015)

181/13/2017
-
500,000
1,000,000
1,500,000
2,000,000
2,500,000
3,000,000
Ton
s G
en
era
ted
Tons Disposed MSW Recycling
MSW Tons Disposed and Recycled,
2015-2040
Sources: SWD, Ecology WA (2013); assumes a 57% recycling rate in 2018 and beyond
191/13/2017
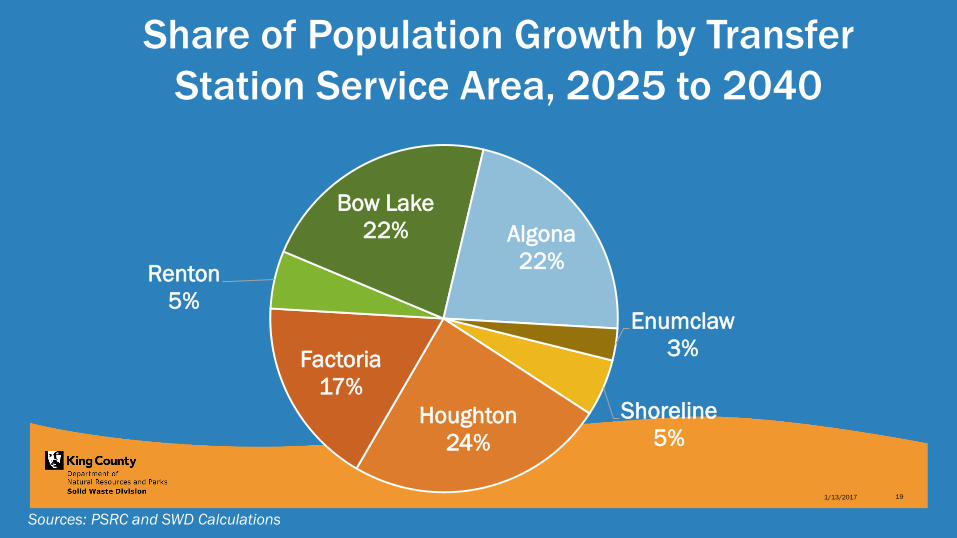
Share of Population Growth by Transfer
Station Service Area, 2025 to 2040
Shoreline
5%Houghton
24%
Factoria
17%
Renton
5%
Bow Lake
22% Algona
22%
Enumclaw
3%
Sources: PSRC and SWD Calculations
201/13/2017
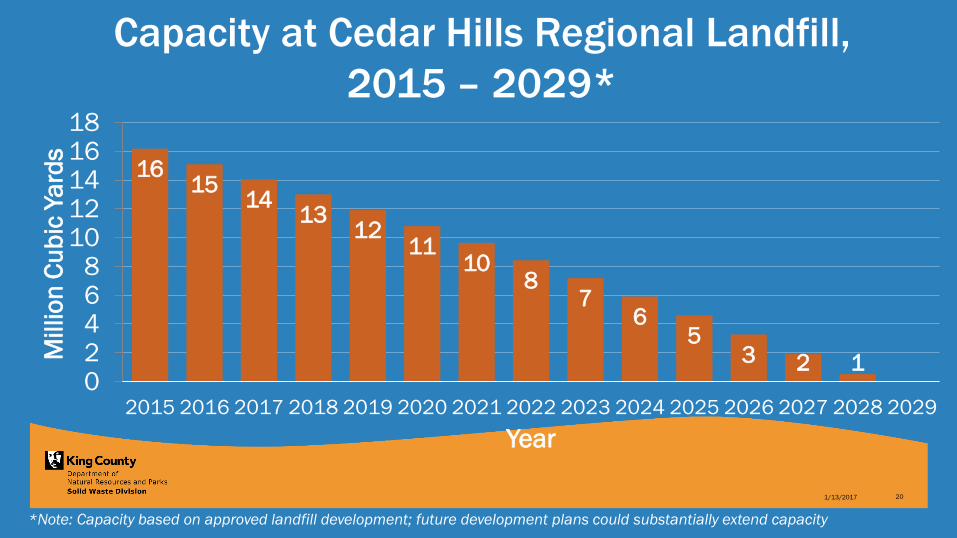
Capacity at Cedar Hills Regional Landfill,
2015 – 2029*
1615
1413
1211
108
76
53 2 1
02468
1012141618
2015 2016 2017 2018 2019 2020 2021 2022 2023 2024 2025 2026 2027 2028 2029
Millio
n C
ub
ic Y
ard
s
Year
*Note: Capacity based on approved landfill development; future development plans could substantially extend capacity

211/13/2017
Some Planning Policies are Required
by State Law
Monitor and report waste prevention and recycling activity, including the amounts of materials recycled, programmatic achievements, and the strength of commodity markets
Notes: See Revised Code of Washington 70.95.080 and 70.95.090
P 3
221/13/2017
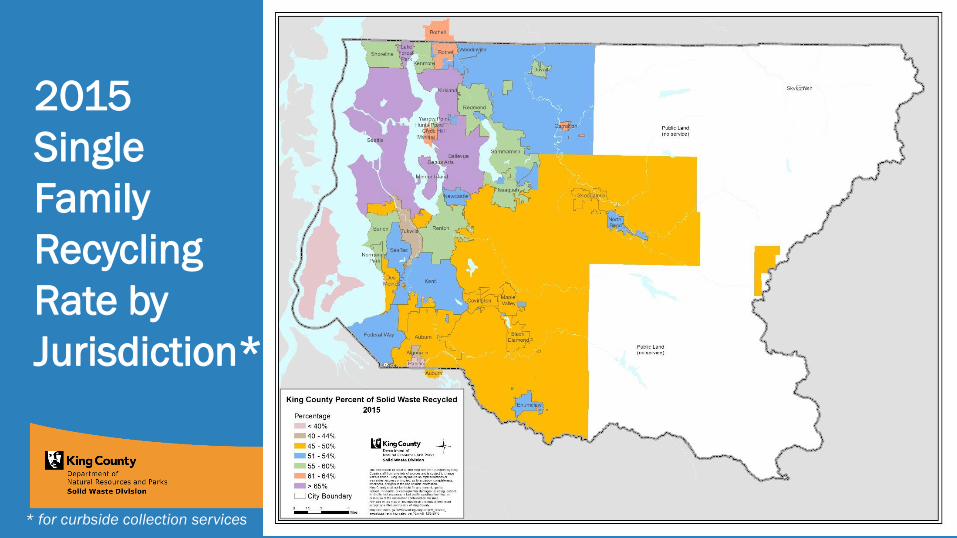
2015
Single
Family
Recycling
Rate by
Jurisdiction*
* for curbside collection services
231/13/2017
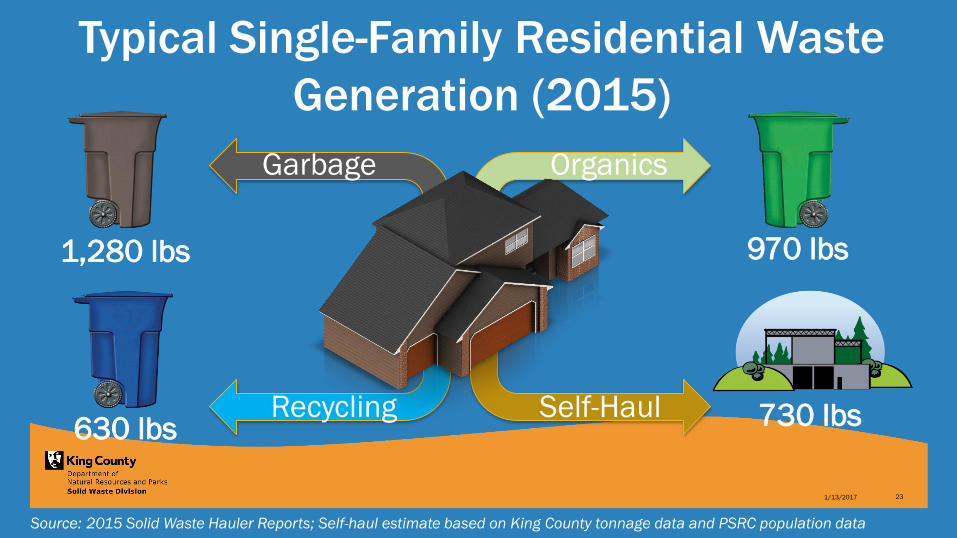
Typical Single-Family Residential Waste
Generation (2015)
1,280 lbs
630 lbs
970 lbs
Garbage Organics
Recycling Self-Haul
Source: 2015 Solid Waste Hauler Reports; Self-haul estimate based on King County tonnage data and PSRC population data
730 lbs

241/13/2017
Interlocal Agreements with Cities and State
Law Require Advisory Group Feedback
Work with the division’s advisory committees, the cities, and the Solid Waste Interlocal Forum on solid waste management planning and decisions
Notes: See Revised Code of Washington 70.95.165, ILA 9.2.c, and ILA 11.6.b
P 4

251/13/2017
County Goals Influence Planning
Policies
• Incorporate principles of equity and social
justice into solid waste system planning
• Consider climate change impacts and
sustainability when planning for facilities,
operations, and programs
P 5
P 6
261/13/2017
Equity and Social Justice
• King County released Equity and
Social Justice Strategic Plan for
2016-2022
• Agencies evaluate equity impacts
on communities of color, low-
income populations, and limited
English-speaking residents

271/13/2017
The Strategic Climate Action Plan Commits the
County to Ambitious Actions & Targets
• Achieve carbon neutral operations by
2025 for solid waste division
• Achieve a 70 percent recycling rate in
the King County solid waste service
area by 2020

281/13/2017
Next Month
• Combined meeting scheduled proposed to be
February 17, from 11:00a to 1:30p
• Visioning Exercise: King County 2040
• Discuss recycling chapter and policies

291/13/2017
Proposed Discussion Schedule
Meeting Chapter(s) to Present Chapter(s) to Review
January 2017 Planning
February 2017 Recycling Planning
March 2017 Collection Recycling
April 2017 Disposal Collection
May 2017 Transfer Disposal
June 2017 Transfer Transfer
July 2017 Transfer/Finance Transfer
August 2017 Transfer/Finance Transfer/Finance
September 2017 Review of Draft Plan

301/13/2017
QUESTIONS?