solid waste element - broward county, florida waste element broward county page 6-2 comprehensive...
TRANSCRIPT

SOLID WASTE ELEMENT
Broward County Page 6-i Comprehensive Plan
Volume 4, Support Document Solid Waste Element
TABLE OF CONTENTS
PAGE I. INTRODUCTION ...............................................................................................6-1 A.Purpose and Scope. ......................................................................................6-1
B.Service Area. .................................................................................................6-1 C.Planning Horizon. ..........................................................................................6-1 D.Jurisdiction Arrangements. ............................................................................6-1 E.Key Programs. ...............................................................................................6-2 F.Definitions. .....................................................................................................6-3
II. DATA AND BACKGROUND INFORMATION ...................................................6-9 A.Municipal solid waste collection and management. .......................................6-9
B.Special waste management. ........................................................................ 6-11 C.Pollution Prevention .................................................................................... 6-12 D.Recycling and Source Reduction Programs in Broward County. ................. 6-13 E. Remadiation Programs in Broward County. ................................................ 6-17 F. Recycling Data. ........................................................................................... 6-19 G.Transfer and Disposal Facilities. ................................................................. 6-21 H. Regulatory framework for solid waste ......................................................... 6-33
III. ANALYSIS REQUIREMENTS .......................................................................... 6-37 A.Methodology and Assumptions. .................................................................. 6-37
B.Analysis of Municipal Solid Waste Scenarios . ............................................. 6-39 C.Resulting impact on capacity of Waste to Energy Plants. ............................ 6-40 D.Resulting impact on capacity of Landfill facilities. ........................................ 6-41 E. Process and time needed to expand existing facilities or construct new facilities. .......................................................................................................... 6-41 F. Impact of facilities on natural resources. ..................................................... 6-41
IV. PROBLEMS AND OPPORTUNITIES FOR SOLID WASTE
FACILITIES REPLACEMENT, EXPANSION, AND NEW SITING. ................. 6-43 A. Expiration of key documents for Broward Solid Waste Disposal District. ............................................................................................ 6-43 B.Expansion or replacement of existing facilities. ........................................... 6-44 C. Potential programs to reduce solid waste generation, and to increase recycling ...................................................................................... 6-46
V. IMPLEMENTATION ........................................................................................ 6-57

SOLID WASTE ELEMENT
Broward County Page 6-ii Comprehensive Plan
Volume 4, Support Document Solid Waste Element
APPENDIX A Analysis of Scenarios for Municipal Solid Waste Projections ......................... 6-61 APPENDIX B Analysis of Scenarios for Remaining Waste-to-Energy Capacity ................... 6-73 APPENDIX C Analysis of Scenarios for Remaining Landfill Capacity ................................... 6-74 APPENDIX D Proposed Memorandum of Understanding .................................................... 6-80 APPENDIX E Recommendations from ―75% Recycling Goal Report to the Legislature‖ .................................................................................................... 6-84 APPENDIX F Example of Potential Recycling Changes to Achieve Targets ........................ 6-86

SOLID WASTE ELEMENT
Broward County Page 6-1 Comprehensive Plan
Volume 4, Support Document Solid Waste Element
I. INTRODUCTION
A. Purpose and Scope. The purpose of the Solid Waste Element is to provide for the necessary public solid waste facilities and services correlated to future land use projections. The scope of the facilities and services covered under this Element is derived from the definition of solid waste facilities at 9J-5.003(120) of the Florida Administrative Code: ―structures or systems designed for the collection, processing or disposal of solid wastes, including hazardous wastes, and includes transfer stations, processing plants, recycling plants, and disposal systems.‖ The Element will also address processes and activities which influence the use of these facilities, or result from the use of these facilities, including: waste prevention, source reduction, reuse, recycling, recovery, natural resource protection, public education, and debris from natural disasters. B. Service Area. The planning service area for the Solid Waste Element is all of Broward County, including 31 municipalities and the unincorporated area.
C. Planning Horizon. The short-term planning horizon is 2015, while the long-term planning horizon is 2030.
D. Jurisdictional Arrangements. In 1986 an Interlocal Agreement (ILA) was executed between Broward County and a number of municipalities (currently 26 out of 31), to establish the Broward Solid Waste Disposal District. The District, headed by the Resource Recovery Board (RRB), provides for disposal of all solid waste delivered by haulers from the participating municipalities and the unincorporated area of the county. The facilities and services managed by the RRB make up the Resource Recovery System (RRS). The purpose of the Interlocal Agreement (ILA) between Broward County and the contract communities of the Broward Solid Waste Disposal District is to develop a comprehensive solid waste disposal and resource recovery program. Under the ILA, each contract community agrees to enact flow control ordinances, directing that all solid waste generated within its boundaries be delivered to the resource recovery system transfer or disposal facility or facilities designated in the plan of operations. Each contract community also agrees that all agreements with a hauler must include a provision that all solid waste shall be delivered to these designated facilities, and agrees to enforce such provisions. In addition, the ILA governs the calculation of tipping fees and service charges at the resource recovery system facilities. The ILA expires on July 2, 2013. The status of development of a new ILA is discussed in Section IV of this report. Currently, the services provided by the District include: 1. Solid Waste Reduction and Disposal

SOLID WASTE ELEMENT
Broward County Page 6-2 Comprehensive Plan
Volume 4, Support Document Solid Waste Element
2. Recovered Material Processing (MRF) 3. Public Education and Information 4. Electronic Waste Recycling Program 5. Household Hazardous Waste Processing 6. Research and Development 7. Emergency Debris Storage and Disposal The remaining communities, which are referred to as non-ILA cities, include Dania Beach, Hallandale Beach, Parkland, Pembroke Pines, and Pompano Beach. They each make their own arrangements for collection, disposal, and administration of solid waste.
E. Key Programs. The following is a brief summary of some key programs of the Resource Recovery System (excerpted from the Broward County FY2010 Adopted Operating Budget):
1. Resource Recovery System Operations. This program implements long-term waste disposal service agreements with full service contractors who designed, constructed, own, operate and maintain two 2,250 ton per day, 67 megawatt waste-to-energy facilities in northern and southern Broward County, in order to conserve landfill space by waste volume reduction and reduce the need for fossil fuels to generate electricity.
2. Materials Recovery Facility. The Materials Recovery Facility (MRF) receives sorts and processes source-separated recyclables from the County and RRS Partner Cities. Program Recyclables include newspaper, mixed paper and cardboard, as well as metal, plastic, glass and aseptic (milk, juice cartons and juice boxes) food and beverage containers. The Program Recyclables are collected from RRS city residential curbside and multi-family recycling programs. Processed and sorted recyclables are marketed and sold to recovered materials end-markets, and the revenues generated are distributed back to the County and RRS Partner Cities.
3. Ash Monofill. Ash generated by Wheelabrator South Broward, Inc. (WSB) is disposed of in a 33-acre landfill (Ash Monofill) located in the immediate vicinity of WSB.
4. BIC Landfill. The Southwest Regional (Broward Interim Contingency or BIC) Landfill is part of the Resource Recovery System. It accepts unprocessable materials from Resource Recovery System Partner Cities and is a backup facility for municipal solid waste in the event the south waste-to-energy plant is unable to accept this material in an emergency situation. The landfill property is 588 acres in size, including 223 acres of wetlands maintained by the County, an area designated for a future neighborhood park, and acreage designated for a temporary debris management site. In previous hurricane seasons, the site was used for disaster debris management.

SOLID WASTE ELEMENT
Broward County Page 6-3 Comprehensive Plan
Volume 4, Support Document Solid Waste Element
5. Household Hazardous Waste Program. Residents bring designated household hazardous waste (HHW) items to drop-off locations where they are received, processed and either recycled or shipped for disposal. The HHW Program includes weekly and periodic drop-off collections at various municipal locations, monthly drop-off events for small businesses and scheduled pick-up services at governmental agencies. All municipalities participate in this program through a series of interlocal agreements. As a result, residents from non-RRS cities can participate and their proportionate shares of the program costs are billed back to their cities quarterly.
6. Electronics Recycling Program. The Electronics Recycling Program provides for permanent drop-off locations at the County’s three residential Trash Transfer Stations, and numerous remote collection events throughout the year. The program also provides for scheduled pick-up at County and Resource Recovery System (RRS) Partner City governmental agencies and eligible small businesses within RRS cities. All municipalities participate in this program through a series of interlocal agreements. As a result, residents from non-RRS cities can participate and their proportionate shares of the program costs are billed back to their cities quarterly. The Electronics Recycling Program allows for safe recycling and disposal of End-of-Life (EOL) electronic devices such as computers, computer monitors, televisions, printers, fax machines and copiers. Most of these materials have hazardous components within them, including mercury, cadmium and lead. They also contain precious metals including gold, silver and palladium. Virtually all components of EOL electronic devices can be recycled.
7. Resource Recovery System Public Education. The Public Education Program is an extensive outreach and education program for all aspects of the Resource Recovery System (RRS). The program functions through the RRS Interlocal Agreement with partner cities and serves to increase the awareness of and maximize the participation in RRS programs and services.
The Public Education Section uses a multipronged approach to educate residents of all ages about the RRS and its positive environmental benefits through high-visibility, year-round efforts that include print awareness campaigns, website (in-house and external), television/radio promotions and community outreach including presentations and participation in community events.
F. Definitions. The following definitions are provided for use in understanding solid waste management terms. The source of the definition is cited in parenthesis and that source is generally either the Florida Statutes (F.S.) or the Florida Administrative Code (F.A.C.). Ash residue - all the solid residue and any entrained liquids resulting from the combustion of solid waste in a solid waste combustor, including bottom ash, fly ash and combined bottom and fly ash, but excluding recovered metals, glass, and other recovered materials separated from the ash residue.

SOLID WASTE ELEMENT
Broward County Page 6-4 Comprehensive Plan
Volume 4, Support Document Solid Waste Element
(a) ―Bottom ash‖ means the solid material remaining after combustion of solid waste,
which is discharged from the grates or stoker of a solid waste combustor.
(b) ―Fly ash‖ means the residue from the combustion of solid waste, which is entrained in
the gas stream of a solid waste combustor. Fly ash includes particulates, cinders, soot,
and solid waste from air pollution control equipment (Chapter 62-701.200(6), F.A.C.). Bulky wastes - items whose large size or weight precludes or complicates their handling by normal collection, processing, or disposal methods (Chapter 62-701.200(11), F.A.C.). Class I waste - solid waste which is not hazardous waste, and which is not prohibited from disposal in a lined landfill under Rule 62-701.300, F.A.C. (62-701.200(13), F.A.C.). Class III waste – yard trash, construction and demolition debris, processed tires, asbestos, carpet, cardboard, paper, glass, plastic, furniture other than appliances, or other materials approved by the Department that are not expected to produce leachate which poses a threat to public health or the environment (62-701.200(14), F.A.C.). Closure - the cessation of operation of a solid waste management facility and the act of securing such a facility so that it will pose no significant threat to human health or the environment, including long-term monitoring and maintenance of a facility if required by department rule (Subsection 403.703(5), F.S.). Compost - solid waste which has undergone biological decomposition of organic matter, has been disinfected using composting or similar technologies, and has been stabilized to a degree which is potentially beneficial to plant growth and which is used or sold for use as a soil amendment, artificial top soil, growing medium amendment or other similar uses (62-709.200(23), FAC). Combustion – the treatment of solid waste in a device that uses heat as the primary means to change the chemical, physical, or biological character or composition of the waste. Combustion processes include incineration and pyrolysis (62-701.200(21), F.A.C).
Construction and demolition debris - discarded materials generally considered to be not water-soluble and nonhazardous in nature, including, but not limited to, steel, glass, brick, concrete, asphalt roofing material, pipe, gypsum wallboard, and lumber, from the construction or destruction of a structure as part of a construction or demolition project or from the renovation of a structure, and includes rocks, soils, tree remains, trees, and other vegetative matter that normally results from land clearing or land development operations for a construction project, including such debris from construction of structures at a site remote from the construction or demolition project site. Mixing of construction and demolition debris with other types of solid waste will cause the resulting mixture to be classified as other than construction and demolition debris. The term also includes:
(a) Clean cardboard, paper, plastic, wood, and metal scraps from a construction project;

SOLID WASTE ELEMENT
Broward County Page 6-5 Comprehensive Plan
Volume 4, Support Document Solid Waste Element
(b) Except as provided in s. 403.707(9)(j), yard trash and unpainted, nontreated wood scraps and wood pallets from sources other than construction or demolition projects;
(c) Scrap from manufacturing facilities which is the type of material generally used in construction projects and which would meet the definition of construction and demolition debris if it were generated as part of a construction or demolition project. This includes debris from the construction of manufactured homes and scrap shingles, wallboard, siding concrete, and similar materials from industrial or commercial facilities; and
(d) De minimis amounts of other nonhazardous wastes that are generated at construction or destruction projects, provided such amounts are consistent with best management practices of the industry (Subsection 403.703(6), F.S.).
Disposal - the discharge, deposit, injection, dumping, spilling, leaking, or placing of any solid waste into or upon land or water so that such solid waste or any constituent thereof may enter other lands or be emitted into the air or discharged into any waters, including ground waters, or otherwise enter the environment (Subsection 403.703(9), F.S.). Facility - all contiguous land and structures and other appurtenances, and improvements on the
land used for solid waste management (Chapter 62-701.200(37), F.A.C.). Fill - man-made deposits of earth or waste materials used to fill excavations, to increase the vertical or horizontal extent of land or solid waste disposal units, or to build embankments (Chapter 62-701.200(38), F.A.C.). Garbage - all kitchen and table food waste, and animal or vegetative waste that is attendant with or results from the storage, preparation, cooking, or handling of food materials (Section 27-214, Broward County Code of Ordinances). Generation - the act or process of producing solid or hazardous waste (Subsection 403.703(10) F.S.). Ground water - water beneath the surface of the ground within a zone of saturation, whether or
not it is flowing through known and definite channels (Chapter 62-701. 200(53), F.A.C.).
Hazardous Wastes - solid waste, or a combination of solid wastes, which, because of its quantity, concentration, or physical, chemical, or infectious characteristics, may cause, or significantly contribute to, an increase in mortality or an increase in serious irreversible or incapacitating reversible illness or may pose a substantial present or potential hazard to human health or the environment when improperly transported, disposed of, stored, treated, or otherwise managed. The term does not include human remains that are disposed of by persons licensed under chapter 497 (Subsection 403.703(13) F.S.). Household waste - any solid waste, including garbage, trash, and sanitary waste in septic tanks, derived from households, including single and multiple residences, hotels and motels, bunkhouses, ranger stations, crew quarters, campgrounds, picnic grounds, and day-use

SOLID WASTE ELEMENT
Broward County Page 6-6 Comprehensive Plan
Volume 4, Support Document Solid Waste Element
recreation areas (Chapter 62-701.200(55), F.A.C.).
Incineration - see Combustion. Landfill - any solid waste land disposal area for which a permit, other than a general permit, is required by Section 403.707 and which receives solid waste for disposal in or upon land. The term does not include a land-spreading site, an injection well, a surface impoundment, or a facility for the disposal of construction and demolition debris (Subsection 403.703(17), F.A.C.). Leachate - liquid that has passed through or emerged from solid waste and may contain soluble, suspended, or miscible materials (Chapter 62-701.200(66), F.A.C.). Materials recovery - any process by which one or more of the various components in solid waste is separated and concentrated for reuse (Chapter 62-701.200(76), F.A.C.). Materials recovery facility - a solid waste management facility that provides for the extraction from solid waste of recyclable materials, materials suitable for use as a fuel or soil amendment, or any combination of such materials (Subsection 403.703(19), F.S.). Municipal solid waste (MSW) - includes any solid waste, except for sludge, resulting from the operation of residential, commercial, governmental or institutional establishments that would normally be collected, processed, and disposed of through a public or private solid waste management service. The term includes yard trash, but does not include solid waste from industrial, mining, or agricultural operations (403.706(5), F.S.). Pollution prevention - the act of using materials, processes, or practices that:
a. Reduce or eliminate the creation of pollution or wastes at the source; and
b. Protect the environment and reduce the hazards to public health associated with the discharge of pollutants or wastes. This includes equipment or technology modifications, process or procedure modifications, reformulation or redesign of products, material substitution, on-site recycling/reuse, conservation of energy, water, and other natural resources, and improvements in housekeeping, maintenance, training, or inventory control. This does not include off-site recycling, waste treatment, concentrating hazardous or toxic constituents to reduce volume, diluting constituents to reduce hazard or toxicity, or transferring hazardous or toxic constituents from one environmental medium to another (Chapter 27-4(31), Broward County Code of Ordinances).
Processable waste - that portion of the solid waste stream which is capable of being processed in a mass burn resource recovery facility, including, but not limited to, all forms of household and other garbage, trash, rubbish, refuse, combustible agricultural, commercial and light industrial waste, commercial waste, leaves and brush, paper and cardboard, plastics, wood and lumber, rags, carpeting, occasional tires, wood furniture, mattresses, stumps, wood pallets, timber, tree limbs, ties, and logs not separated at the source of generation or after collection and held for purposes of recycling, but excluding Unacceptable Waste and Unprocessable Waste,

SOLID WASTE ELEMENT
Broward County Page 6-7 Comprehensive Plan
Volume 4, Support Document Solid Waste Element
except, to the extent consistent with the regulatory and permit requirements applicable to the processing of waste by a mass burn resource recovery facility, such minor amounts of such Unacceptable Waste and Unprocessable Waste (other than hazardous waste) as may be contained in the normal Processable Waste stream (Broward Solid Waste Disposal District Plan of Operations). Recovered materials - metal, paper, glass, plastic, textile, or rubber materials that have known recycling potential, can be feasibly recycled, and have been diverted and source separated or have been removed from the solid waste stream for sale, use or reuse as raw materials, whether or not the materials require subsequent processing or separation from each other, but does not include materials destined for any use that constitutes disposal. Recovered materials are not solid waste (Subsection 403.703(24), F.S.). . Recycling - any process by which solid waste, or materials which would otherwise become solid waste, are collected, separated, or processed and reused or returned to use in the form of raw materials or products (Subsection 403.703(27) F.S.). Resource recovery - the process by which materials, excluding those under the Atomic Energy Commission, which still have useful physical or chemical properties after serving a specific purpose are reused or recycled for the same or other purposes, including use as an energy source (Chapter 403.703(28) F.S.). Sludge – the accumulated solids, residues, and precipitates generated as a result of waste treatment or processing, including wastewater treatment, water supply treatment, or operation of an air pollution control facility, and mixed liquids and solids pumped from septic tanks, grease traps, privies, or similar waste disposal appurtenances (Chapter 403.703(30), F.S.). Solid waste - sludge unregulated under the federal Clean Water Act or Clean Air Act; sludge from a waste treatment works, water supply treatment plant, or air pollution control facility; or garbage, rubbish, refuse, special waste or other discarded material, including solid, liquid, semi-solid, or gaseous material resulting from domestic, commercial, industrial, mining, agricultural or governmental operations. Recovered materials as defined in subsection (24) are not solid waste (Subsection 403.703(32) F.S.). Solid waste disposal facility - any solid waste management facility which is the final resting place for solid waste, including landfills and incineration facilities that produce ash from the process of incinerating municipal solid waste (Subsection 403.703(33) F.S.). Solid waste management - the process by which solid waste is collected, transported, stored, processed or disposed of in any other way, according to an orderly, purposeful, and planned program which includes closure (Chapter 62-701, F.A.C.). Solid waste management facility - any solid waste disposal area, volume reduction plant, transfer station, materials recovery facility, or other facility, the purpose of which is resource recovery or disposal, recycling, processing, or storage of solid waste. The term does not includes recovered materials processing facilities meet the requirements of s. 403.7046, except the portion of such facilities, if any, which is used for the management of solid waste (Subsection 403.703(35)F.S.).

SOLID WASTE ELEMENT
Broward County Page 6-8 Comprehensive Plan
Volume 4, Support Document Solid Waste Element
Special wastes - solid waste that can require special handling and management, including but not limited to, white goods, waste tires, used oil, lead-acid batteries, construction and demolition debris, ash residue, yard trash, and biological wastes (Subsection 403.703(31) F.S.). Stabilized - that biological and chemical decomposition of the waste has ceased or diminished to a level so that such decomposition no longer poses a pollution, health or safety hazard (Chapter 62-701.200(120), F.A.C.). Transfer station - a site where the primary purpose is to store or hold solid waste for transport to a processing or disposal facility (Subsection 403.703(38) F.S.). Unacceptable waste - motor vehicles, trailers, comparable bulky items of machinery or equipment, highly inflammable substances, hazardous waste, sludge, pathological and biological wastes, liquid wastes, sewage manure, explosives and ordinance materials, and radioactive materials. Unacceptable Waste shall also include any other material not permitted by law or regulation to be disposed of at a landfill unless such landfill is specifically designed, constructed and licensed or permitted to receive such material. None of such material shall constitute either Processable Waste or Unprocessable Waste (Broward Solid Waste Disposal District Plan of Operations). Unprocessable wastes - that portion of the solid waste stream that is predominantly noncombustible and therefore, should not be processed in a mass burn resource recovery system. Unprocessable Waste shall include, but not be limited to metal furniture and appliances, concrete rubble, mixed roofing materials, noncombustible building debris, rock, gravel and other earthen materials, equipment, wire and cable, and any item of solid waste exceeding six feet in any one of its dimensions or being in whole or in part of a solid mass, the solid mass portion of which has dimensions such that a sphere with a diameter of eight inches could be contained within such solid mass operation, and Processable Waste to the extent that it is contained in the normal Unprocessable Waste stream. This term excludes Unacceptable Waste (Broward Solid Waste Disposal District Plan of Operations).
Volume reduction plant - an incinerator, pulverizer, compactor, shredding and baling plant, composting plant, or other plant which accepts and processes solid waste for recycling or disposal (Subsection 403.703(41) F.S.). White goods - includes inoperative and discarded refrigerators, ranges, water heaters, freezers, and other similar domestic and commercial large appliances (403.703(42), FS). Yard trash - vegetative matter resulting from landscaping maintenance and land clearing operations, including associated rocks and soils (403.703(43), F.S.).
SOLID WASTE ELEMENT
Broward County Page 6-9 Comprehensive Plan
Volume 4, Support Document Solid Waste Element
II. DATA AND BACKGROUND INFORMATION
A. Municipal solid waste collection and management. Collection of municipal solid waste is handled individually by each municipal government within Broward County. This creates a wide degree of variation between the levels of service provided in each community. However, it also enables each municipality to bid out their collection services and tailor them to community needs and preferences. For the majority of municipalities, which are members of the Broward Solid Waste Disposal District, the tipping fees for collected municipal solid waste are higher than the market rate because they include additional regional services that are covered by the fees (e.g., recycling programs). Currently, the municipalities participating in the District constitute approximately 80% of Broward’s population.
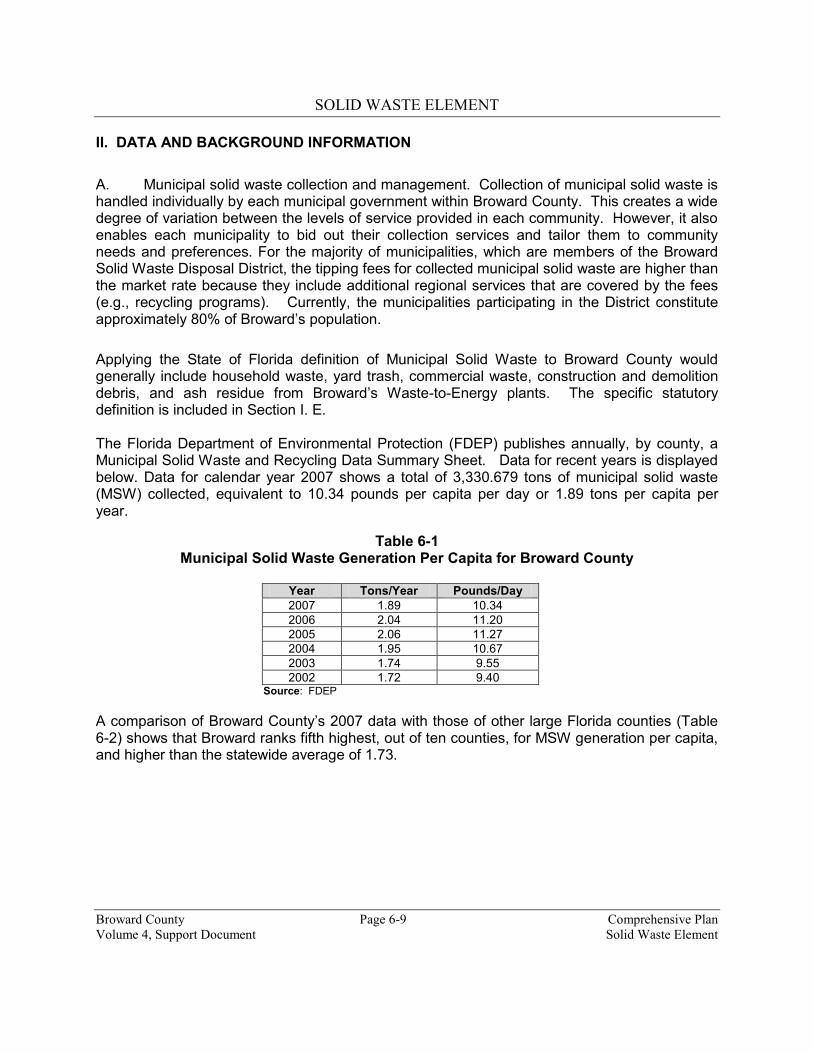
Applying the State of Florida definition of Municipal Solid Waste to Broward County would generally include household waste, yard trash, commercial waste, construction and demolition debris, and ash residue from Broward’s Waste-to-Energy plants. The specific statutory definition is included in Section I. E. The Florida Department of Environmental Protection (FDEP) publishes annually, by county, a Municipal Solid Waste and Recycling Data Summary Sheet. Data for recent years is displayed below. Data for calendar year 2007 shows a total of 3,330.679 tons of municipal solid waste (MSW) collected, equivalent to 10.34 pounds per capita per day or 1.89 tons per capita per year.
Table 6-1 Municipal Solid Waste Generation Per Capita for Broward County
Year Tons/Year Pounds/Day
2007 1.89 10.34
2006 2.04 11.20
2005 2.06 11.27
2004 1.95 10.67
2003 1.74 9.55
2002 1.72 9.40 Source: FDEP
A comparison of Broward County’s 2007 data with those of other large Florida counties (Table 6-2) shows that Broward ranks fifth highest, out of ten counties, for MSW generation per capita, and higher than the statewide average of 1.73.

SOLID WASTE ELEMENT
Broward County Page 6-10 Comprehensive Plan
Volume 4, Support Document Solid Waste Element
Table 6-2
2007 Municipal Solid Waste Management Generation Per Capita for Ten Florida Counties with Largest Population, and for State of Florida
Source: FDEP
The MSW total includes materials landfilled, combusted, and recycled. For 2007, the percentages for each of these categories (in Broward) were reported by FDEP as follows: Landfilled 51% Combusted 24% Recycled 25% The State’s methodology for the above percentage combusted accounts for the ―net‖ material combusted from Broward’s two Waste-to-Energy facilities, subtracting out the combustor ash and recovered metals. A historical view of MSW management in Broward County, taken from FDEP reports, is displayed below. Note that debris from Hurricane Wilma, at the end of 2005, impacted the figures for 2006.
Table 6-3 Municipal Solid Waste Management
Percentages for Broward County
Year Landfilled1 Combusted
2 Recycled
2007 51% 24% 25%
2006 56% 24% 20%
2005 51% 25% 24%
2004 53% 25% 22%
2003 51% 27% 22%
2002 50% 27% 23%
2001 46% 29% 25%
2000 40% 30% 26%
County Tons/Year Pounds/Day
Miami-Dade 1.78 9.77
Broward 1.89 10.34
Palm Beach 1.59 8.70
Hillsborough 1.70 9.34
Orange 2.24 12.25
Pinellas 1.64 8.98
Duval 2.02 11.05
Lee 2.00 10.94
Polk 1.68 9.18
Brevard 2.28 12.52
Florida 1.73 9.49

SOLID WASTE ELEMENT
Broward County Page 6-11 Comprehensive Plan
Volume 4, Support Document Solid Waste Element
1999 40% 35% 25% Source: FDEP (1999-2007). 1Percentage landfilled includes ash residue from waste-to-energy facilities.
2Percentage combusted excludes ash residue from waste-to-energy plants.
B. Special waste management. Certain portions of the waste stream require special treatment. These ―special wastes‖ are discussed below.
1. Used oil. Used oil is collected at Broward County’s three transfer stations and at periodic household hazardous waste collection ―remote‖ events. The used oil is collected by a licensed contractor and marketed for recycling. Used oil is also collected at numerous private sector sites, including auto oil change and auto repair facilities.
2. Construction and demolition (C&D) debris. Residential and commercial C&D debris is collected by contracted haulers, roofing companies, and other contractors, and delivered to landfills or C&D debris processing sites. Significant quantities of wood, ferrous metal and rock/concrete are recovered and marketed for recycling at some processing sites. Asphalt pavement is recycled at some job sites by local asphalt paving contractors.
3. White goods. White goods are collected as bulky waste in most residential solid waste agreements. They are separated at landfills or processing facilities, and then marketed for recycling through a scrap metal dealer.
4. Waste tires. Illegally disposed and residential waste tires are collected through county, municipal, and private cooperative programs including residential drop-offs and Broward Sheriff’s Office prison inmate work crew removal programs. Dedicated code enforcement, neighborhood improvement, and community service aide program officers find illegally dumped tires, facilitate removal, and educate tire generators on disposal responsibilities. [See a description of the Reef Tire Removal Project in Section II. F., Remediation Programs in Broward County]
5. Biomedical wastes. Biomedical waste haulers are regulated by the Broward County Pollution Prevention Remediation and Air Quality Division. PPRAQD issues permits to biomedical waste haulers to transport wastes for weights generated in excess of 25 pounds that are then transported to disposal facilities outside the County or to either of the two permitted Medical Waste Transfer Facilities within the County. PPRAQD monitors the monthly reports and the records of both permitted transfer facilities and permitted haulers.
The Florida Department of Health manages all biomedical waste generators and transporters of less than 25 pounds. These wastes can be transported to a permitted Medical Waste Treatment Facility in Broward County. Doctors and hospitals contract with the approved haulers to dispose of their biomedical waste. At least 45 percent of county generated biomedical wastes are transported out of the county for incineration, while the balance of county generated biomedical waste is treated in Broward County.
SOLID WASTE ELEMENT
Broward County Page 6-12 Comprehensive Plan
Volume 4, Support Document Solid Waste Element
6. Latex paint. Latex paint is collected at all three county trash transfer stations, and at remote household hazardous waste collection events. Paint is blended and processed into 5 gallon pails of latex paint in a variety of colors by a contracted paint supplier and is distributed at no charge to county residents and organizations for reuse. 7. Batteries. The following battery types require special processing: lead acid batteries, and Ni-cad batteries.
a. Lead acid batteries. Broward County’s three trash transfer stations collect lead acid batteries. The batteries are removed by a non-ferrous scrap dealer who recycles the lead, plastic, and acid with management by contracted services. Most retail outlets will accept batteries as new batteries are sold.
b. Ni-Cad batteries. Ni-cad batteries are being collected at more than 40 private businesses and weekly hazardous waste collections. The collected batteries are then shipped to a licensed contractor and recycled.
C. Pollution Prevention. Pollution prevention is simple in concept: the best way to manage pollution is to utilize raw materials, manufacturing technologies, and operational practices which minimize emissions, discharges and wastes. It means curtailing pollution before it happens. Broward County believes that this philosophy is the key element for successful implementation of any environmental waste management program.
Pollution prevention through waste minimization is the preferred approach because it can reduce the expense of waste management, minimizes potential future liabilities and provides greater protection of public health and the environment.
Waste minimization can be defined as a combination of source reduction and recycling. Source reduction is the preferred option and is defined as any activity that prevents or reduces the generation of waste. It does not mean reducing the volume or toxicity of an already generated waste. Source reduction employs methods that eliminate or minimize the amount of waste generated either through manufacturing and process modifications or raw material substitutions.
The use (directly use waste in a different process), reuse (directly reuse waste in the same process), or reclamation (recover or regenerate a component for reuse) of waste materials constitutes recycling. It is the secondary option in the management hierarchy because the wastes have already been generated, thus representing some hazard to the environment if mismanaged
Once all source reduction and recycling options have been exhausted, various treatment processes and technologies may be employed to reduce or remove levels of pollutants/waste to acceptable levels prior to disposal and/or discharge to environment.
A successful waste minimization program should consider the following components: management initiatives; improved operating practices; waste assessment (a.k.a. waste audit); materials substitution; product substitution; and technology and process modification.

SOLID WASTE ELEMENT
Broward County Page 6-13 Comprehensive Plan
Volume 4, Support Document Solid Waste Element
D. Recycling and Source Reduction Programs in Broward County.
1. Waste Prevention Program. The Waste Prevention Program is designed to promote waste prevention as the most responsible, environmentally sound and cost–effective means to reduce waste. The means for preventing waste include reduction at the source through improved product and packaging design, consumer education, product reuse, repair and remanufacturing, financial incentives and legislation. The Waste Management Section of the Pollution Prevention, Remediation and Air Quality Division promotes waste prevention by:
Raising public awareness through outreach & education
Conducting research and analysis of solid waste problems and waste prevention solutions
Providing technical assistance to help businesses identify waste prevention opportunities
Advocating public policy to advance waste prevention 2. Residential Recycling. Most single family homes in Broward County have curbside recycling service that includes various paper materials (newspaper, magazines, catalogs, office paper, and junk mail), plastic and glass bottles, and metal cans. Many communities have multifamily programs in which recycling carts are located adjoining the solid waste enclosure, or an on-site drop-off area is established. Most municipalities direct their recycling materials to the Waste Management – Recycle America Recovered Materials Processing Facility (MRF), located in southwestern Pembroke Pines, and operated under a contract with the Resource Recovery System. The MRF’s operational costs are covered through a surcharge on the disposal fee at the county's Waste-to-Energy plants, state grants, and other funds. This cooperative agreement gives Broward residents a great opportunity to recycle in a cost-effective way.
Further information about the MRF is contained in Section II.G.3., entitled ―Recycling Facilities‖.
In some communities, the jurisdiction arranges for the collection of yard waste as a component of their municipal services. The collected material may be used for municipal purposes or directed to commercial recycling firms or otherwise beneficially used.
3. Governmental Recycling. All major County facilities participate in an office paper recycling program in which all grades and types of paper are recycled. Plastic, aluminum beverage cans, and steel food and beverage containers are also accepted. A majority of municipal facilities have instituted office paper recycling programs in association with their franchise recycling contractor or another recycling company.
Recycling is provided throughout the County’s regional park system, and at many municipal parks.

SOLID WASTE ELEMENT
Broward County Page 6-14 Comprehensive Plan
Volume 4, Support Document Solid Waste Element
All Broward County public schools and School Board administrative offices recycle paper and various plastic and metal containers through a partnership between Broward County and the School Board.
4. Commercial Recycling. Commercial recycling includes general business recycling and construction and demolition (C&D) recycling, which combined constitute the majority of recycling. Significant quantities are recovered at office buildings, retail outlets, and other commercial enterprises. Various collection and processing companies are involved through numerous contracts. In many cases, large retail chains will back-haul their old cardboard or other material to regional facilities located outside the County. C&D materials comprise the largest component of the waste stream, and several private ventures accept and recycle the metal, concrete, wood, and other materials.
5. Electronics Recycling. Growing at three times the rate of other wastes, electronics is the newest challenge in environmentally responsible waste disposal. If not properly disposed of, electronics can release hazardous materials into our environment.
To help alleviate this problem, Broward County’s Waste and Recycling Services has provided Broward County residents with a program to dispose of electronics. Since 2001, more than 5 million pounds of used electronics have been recycled in Broward County. From 2007 to 2009, there was an 81.9 percent increase in residential participation in the recycling program and a 110 percent increase in the number of televisions collected. Staff attributes the growth to heightened environmental concern, increased awareness of the County program, high interest in new technology, and the mandatory analog-to-digital television conversion which occurred on June 12, 2009. Electronics recycling drop-off locations are in Pompano Beach, West Park and Sunrise, with limited items accepted in Davie. Residents can bring computers, monitors, keyboards, mice, terminals, printers, modems, cell phones, rechargeable batteries, televisions, and copiers.
Waste and Recycling Services partners with a non-profit organization serving people with disabilities. The organization provides services to collect and refurbish or de-manufacture end-of-life electronics. Participants learn new skills and receive valuable work training in the disassembly of computers. The recovered materials are then shipped out for recycling or environmentally safe disposal.
6. Household Hazardous Waste. A free disposal program for household hazardous waste is operated by Waste and Recycling Services at three permanent locations, in Pompano Beach and West Park (Fridays and Saturdays) and Davie (Saturdays only). In addition, one day ―remote‖ collection events are held throughout Broward County. The following items are accepted, and are either recycled or disposed of in an eco-friendly manner:

SOLID WASTE ELEMENT
Broward County Page 6-15 Comprehensive Plan
Volume 4, Support Document Solid Waste Element
The same three trash transfer stations used for collection of Household Hazardous Waste are also sites on Saturdays for the free disposal by residents of bulky wastes. The stations accept bulky waste including furniture, appliances, and yard waste
7. Paint Recycling Program. Free exterior latex paint is available to Broward County residents and non-profit organizations. All of the latex paint collected through the Household Hazardous Waste (HHW) Program is re-blended into four exterior paint colors: beige, grey, turquoise and terra cotta. The paint is not available for commercial businesses or re-sale. Up to 20 gallons is available per household. The paint is distributed through participating municipalities. 8. Recycled Glass Beach Renourishment Project. Broward County has been spearheading an innovative project to determine the feasibility of using pulverized glass from recycling programs blended with natural beach sand to help address erosion "hotspots" on local beaches. The project is a cooperative effort among the City of Hollywood and other partner cities from the County’s Resource Recovery System, the County’s Environmental Protection and Growth Management Department and Public Works Department, and the State of Florida, primarily through the Florida Department of Environmental Protection. Results from the project’s study areas have been positive to date, and Broward County is hopeful that the process of recycling glass back into its original state will yield a synergistic solution to combating beach erosion and addressing poor markets for the county’s recovered glass.
If the project is successful, Broward County will be the first U.S. community to utilize finely crushed glass blended with natural beach sand for erosion control.
9 Mulching and Composting (part of NatureScape Broward). NatureScape Broward is about creating Florida-friendly landscapes that conserve water, protect water quality, and create wildlife habitat. NatureScape provides simple, common sense techniques to conserve water and protect our water supply through our daily activities. More information about NatureScape Broward is available at http://www.broward.org/naturescape/welcome.htm
Aerosol products Ammonia Ammunition Antifreeze Auto fluids Auto batteries Boat batteries Boat fluids Charcoal starter Compact Fluorescent Bulbs (CFLs) Drain cleaners Fertilizers Fire extinguishers
Fireworks Flares Fluorescent tubes Gasoline Herbicides Household cleaners Insect killer Kerosene Lawn chemicals Lighter fluid Mercury thermometers Motor oil Nail polish remover Paint
Pesticides Photo chemicals Pool chemicals Propane tanks Rechargeable batteries Rust remover Solvents Spot remover Tires (limit 4) Turpentine Weed killer Wood stains Wood stripper

SOLID WASTE ELEMENT
Broward County Page 6-16 Comprehensive Plan
Volume 4, Support Document Solid Waste Element
Recycling reduces the amount of yard waste being taken to landfills, and turns the waste into material to help your NatureScape yard. Leaving trimmings on the lawn after mowing is a simple way to return nutrients to the soil. You can make your own organic mulches from bark, straw, leaves, grass clippings and twigs. These mulches improve the soil by adding nutrients as they decompose, encouraging earthworm activity.
Mulch should be spread around trees, shrubs, and planted beds as ground covering. Mulch can provide many benefits for your yard:
Improved soil fertility.
Reduced landscape maintenance.
Reduced evaporation and increased conservation of soil moisture.
Improved aeration by reducing soil compaction.
Reduced water runoff and soil erosion.
Improved drainage and soil structure over time.
Backyard composting is a relatively simple way to improve your garden and save valuable resources. As with any other type of recycling program, composting is a way to reuse material.
Composting reuses the things you already have around the house to improve soil fertility. Turning yard waste such as plant trimmings and leaves, and select kitchen scraps into compost can give your plants what they need.
Composting can:
Improve soil structure, texture and aeration.
Increase the water holding capacity of soil.
Help loosen compacted soil.
Create a favorable environment for microorganisms, earthworms and insects that are nature's "soil builders"
10. Outreach Programs. Among the outreach programs offered by Broward County, to encourage recycling are:
The Emerald Award Program, which is designed to recognize businesses, government, individuals, or organizations in Broward County demonstrating a commitment to protecting and preserving our environment.
WasteWise, a free, voluntary EPA partnership program, which provides guidance and recognition to participating organizations that are working to find practical methods to reduce solid waste and improve financial performance. See http://www.epa.gov/epawaste/partnerships/wastewise/about.htm for more information.

SOLID WASTE ELEMENT
Broward County Page 6-17 Comprehensive Plan
Volume 4, Support Document Solid Waste Element
Cooperative programs for children, between Broward County Waste and Recycling Services and local institutions such as the Museum of Discovery and Science, and the Young at Art Children's Museum.
E. Remediation Programs in Broward County. Remediation programs are designed to correct environmental problems which occur despite the best efforts of the preventative programs.
1. Environmental Assessment and Remediation (EAR) Program. Broward County’s EAR program is responsible for ensuring that contaminated sites in Broward County are cleaned up in accordance with State and local cleanup regulations. EAR’s responsibilities include identifying and tracking contaminated sites; determining responsible parties; and managing the cleanup process through assessment, remediation, and finally closure of the contaminated site.
2. Brownfield Site Rehabilitation. Brownfield sites are abandoned or underutilized industrial or commercial properties where expansion or redevelopment is complicated by actual or perceived environmental contamination. Via development of a Brownfield Site Rehabilitation Agreement and in coordination with its cleanup program, Broward County assists interested parties in the rehabilitation of Brownfield Sites which are in designated Brownfield areas.
3. Environmental Response. The Environmental Response program is Broward County’s 24/7 environmental complaint response program. Any citizen can report any environmental complaint by calling 954-519-1499 or emailing [email protected]. Broward County staff will triage the complaint, respond accordingly, and debrief the complainant on the County’s response.
4. Adopt-A-Street. Broward County's Adopt-A-Street Program empowers volunteer groups to keep their neighborhoods litter-free one street at a time. Groups agree to adopt half a mile or more of a street in Broward County and remove the litter four times per year for two years. The County provides organizational help, cleanup supplies, free disposal and Adopt-A-Street signs with the group's name displayed. More than 12,000 volunteers, from 16 cities have removed 152,263 pounds of litter from their adopted streets.
5. Waterway and coastal cleanups. Broward County helps organize the Broward County Coastal Cleanup, held each September, and currently involving twelve locations throughout Broward County. The Cleanup is part of the International Coastal Cleanup, sponsored annually by the Ocean Conservancy. In 2007, nearly 400,000 volunteers worldwide collected more than 6.8 million pounds of trash in 100 countries and 42 U.S. states. In Broward County, 1,400 volunteers collected more than 4,500 pounds of garbage that same year.
Broward County is also a sponsor of the annual Waterway Cleanup, led by the Marine Industries Association of South Florida. The March, 2009 event involved an estimated

SOLID WASTE ELEMENT
Broward County Page 6-18 Comprehensive Plan
Volume 4, Support Document Solid Waste Element
2,800 volunteers, successfully removing 41 tons of trash from Broward’s waterways, rivers, and canals.
6. Reef Tire Removal Project. During the 1970s, between one and two million tires were put in the ocean off Broward County in an effort to create an artificial fish habitat. Over the years, many of the tires were mobilized by tropical storms and hurricanes, the movement of which caused damage to existing nearby coral reefs. The threat is serious, but the complexity and magnitude of the challenge of removing these tires has prevented any individual government agency from doing so. The NOAA Marine Debris Program funded a reconnaissance project that was conducted in August 2006. The scope of work required the development of a strategy to remove and dispose of these tires. In 2007, a group of federal, state and county government agencies worked jointly to complete the pilot study with the objective of defining the technical and economic feasibility of coordinating agency capabilities to accomplish a variety of objectives. This joint-effort program involved Coastal America, U.S. Navy, Army, Coast Guard, Florida Department of Environmental Protection, Broward County Environmental Protection and Growth Management Department, Port Everglades Department and Parks and Recreation. The tire removal project is currently continuing off the Fort Lauderdale shoreline. Once again U.S. Navy and Army divers are recovering the tires which are then buoyed to the surface. While the divers work to clean up the environment, the tire retrieval project also serves as military training exercise. The Army is also providing a 175-foot landing craft utility (LCU) craft which accommodates a crane used to transfer the tire bundles from the water's surface to on-board tractor-trailer units. Full trailers are regularly off-loaded at Port Everglades and the Florida Department of Environmental Protection manages the recycling of the waste tires. The Broward County Natural Resources Planning and Management Division is the local partner providing project coordination and oversight.
F. Recycling Data. Section 403.7032, F.S., entitled Recycling, was amended by the Florida Legislature in 2008. Paragraph (2) reads as follows: ...
(2) By the year 2020, the long-term goal for the recycling efforts of state and local governmental entities, private companies and organizations, and the general public is to reduce the amount of recyclable solid waste disposed of in waste management facilities, landfills, or incineration facilities by a statewide average of at least 75 percent. However, any solid waste used for the production of renewable energy shall count toward the long-term recycling goal as set forth in this section.

SOLID WASTE ELEMENT
Broward County Page 6-19 Comprehensive Plan
Volume 4, Support Document Solid Waste Element
FDEP is further directed by the Statute to develop a comprehensive recycling program that is designed to achieve the above goal, and to submit it to the Legislature by January 1, 2010. The recommendations from this FDEP report are included as Exhibit E. Municipal solid waste combusted through waste-to-energy facilities is recognized as a renewable energy source by Florida Statute and may be eligible for credit towards the 75% goal. The Legislature also addressed county organics recycling plans and programs, by amending Section 403.706, Subsection (2) F.S., paragraphs (d) and (e) to read: ...
(d) By July 1, 2010, each county shall develop and implement a plan to achieve a goal to compost organic materials that would otherwise be disposed of in a landfill. The goal shall provide that up to 10 percent and no less than 5 percent of organic material would be composted within the county and the municipalities within its boundaries. The department may reduce or modify the compost goal if the county demonstrates to the department that achievement of the goal would be impractical given the county's unique demographic, urban density, or inability to separate normally compostable material from the solid waste stream. The composting plan is encouraged to address partnership with the private sector. (e) Each county is encouraged to consider plans for mulching organic materials that would otherwise be disposed of in a landfill. The mulching plans are encouraged to address partnership with the private sector.
For the short-term, Section 403.706(4)(a)., F.S. states: ...
(4)(a) A county's solid waste management and recycling programs shall be designed to provide for sufficient reduction of the amount of solid waste generated within the county and the municipalities within its boundaries in order to meet goals for the reduction of municipal solid waste prior to the final disposal or the incineration of such waste at a solid waste disposal facility. The goals shall provide, at a minimum, that the amount of municipal solid waste that would be disposed of within the county and the municipalities within its boundaries is reduced by at least 30 percent.
Also, as referenced above, counties must now develop and implement programs, by July 1, 2010,. to compost up to 10 percent and no less than 5 percent of its organics within the county. The recycling percentages of particular categories of municipal solid waste, for Broward County in 2007, are as follows:

SOLID WASTE ELEMENT
Broward County Page 6-20 Comprehensive Plan
Volume 4, Support Document Solid Waste Element
Table 6-4
Municipal Solid Waste Collected and Recycled in Broward County, 2007
Source: FDEP, WRS
G. Transfer and Disposal Facilities.
1. Landfill Facilities. Landfills are classified according to the amount and types of waste received. Class I and Class II landfills receive non-hazardous solid waste from household, commercial, industrial and agricultural sources, subject to restrictions in the Florida Administrative Code. Class I landfills receive an average of 20 tons or more of solid waste per day, while Class II landfills receive an average of less than 20 tons per day. Class III landfills are more restricted in the types of waste they can receive; see the definitions of Class I Waste and Class III Waste in Section I.E.
In addition to Class I, II and III landfills, FDEP authorizes the use of Construction and Demolition (C&D) landfills; however, there are no such landfills currently authorized in Broward County.
There are three Class I landfills currently operating in Broward County (see Table 6-7). The Central Disposal Sanitary Landfill (CDSL) is located at 2700 N.W. 48th Street in unincorporated Broward County. The CDSL is owned and operated by a subsidiary of Waste Management, Inc. This facility handles municipal solid waste (including construction and demolition debris), special waste, and ash residue from the adjacent North Broward County Resource Recovery Facility. The predominant land uses served by the CDSL are residential and commercial. The Plan of Operations for the Broward Solid Waste Disposal District sets the CDSL as the primary disposal site for unprocessable waste for areas north of Oakland Park Boulevard, including Coconut Creek, Coral Springs, Deerfield Beach, part of Fort Lauderdale, Hillsboro Beach,
Type of Municipal Solid Waste Collected (tons) Percentage Recycled
Newspaper 147,329 41%
Glass 83,627 19%
Aluminum Cans 10,461 23%
Plastic Bottles 55,178 9%
Steel Cans 12,293 29%
Cardboard 318,009 38%
Office Paper 48,619 42%
Yard Trash 438,962 10%
C&D Debris 1,039,200 25%
Other Paper 286,394 12%
White Goods 45,135 83%
Food Waste 109,384 0%
Tires 5,966 0%
Other Wastes 730,122 32%
Total Recycling Rate 25%

SOLID WASTE ELEMENT
Broward County Page 6-21 Comprehensive Plan
Volume 4, Support Document Solid Waste Element
Lauderdale by the Sea, Lauderdale Lakes, Lauderhill, Lazy Lake, Lighthouse Point, Margate, North Lauderdale, Oakland Park, Sea Ranch Lakes, part of Sunrise, Tamarac, Wilton Manors, and certain unincorporated areas. CDSL also receives general solid waste from Dania Beach, Hallandale Beach, Parkland, Pembroke Pines, and Pompano Beach, as well as other counties and cities.
Another Class I landfill is the Broward Interim/Contingency Sanitary Landfill (BIC) which began operation in 1988. It is located east of U.S. 27 and north of Sheridan Street, in unincorporated Broward County. The entire parcel of land is 588 acres. The active Landfill area is approximately 263 acres. Landfilling began in the northeast area and is progressing westward. BIC is owned and operated by the County. The Plan of Operations for the Broward Solid Waste Disposal District sets the BIC as the primary disposal site for unprocessable waste for areas south of Oakland Park Boulevard, including Davie, Cooper City, part of Fort Lauderdale, Hollywood, Miramar, Pembroke Park, Plantation, Southwest Ranches, part of Sunrise, West Park, Weston, and certain unincorporated areas. BIC also serves as a contingency facility for the Resource Recovery System in case of natural disaster, or Waste-to-Energy plant closings. This site also serves as a collection center for used white goods (appliances such as stoves, refrigerators, heaters). The scrap metal recovered from these white goods is sold to recyclers.
A third Class I landfill is the Ash Monofill. This facility receives ash residue from the adjacent South Broward County Resource Recovery Facility.
2. Incineration Facilities. Table 6-8 displays information about the two incineration facilities currently operating within Broward County, including their status, design capacity, current demand, and available capacity. It is important to note that the capacity of these facilities is currently not fully utilized by the waste stream from the Resource Recovery System Partner Cities; the excess capacity is made available for short-term commitments on the ―spot market‖.
The North Broward County Resource Recovery Facility was opened in 1991, and is adjacent to the Central Disposal Sanitary Landfill. This facility primarily serves the area of Broward County north of Oakland Park Boulevard, excluding the municipalities of Pompano Beach and Parkland. The predominant land uses served by the facility are residential. The facility has a gross electrical generating capacity of approximately 68.5 megawatts.
The South Broward County Resource Recovery Facility was opened in 1991, and is located east of State Road 7 and south of I-595. This facility primarily serves the area of Broward County south of Oakland Park Boulevard, excluding the municipalities of Dania Beach, Hallandale Beach, and Pembroke Pines. The predominant land uses served by the facility are residential. The facility has a gross electrical generating capacity of approximately 66 megawatts.
Facilities which generate more than fifty megawatts of electricity are certified under a consolidated permitting process specified in the Florida Electrical Power Siting Act. In

SOLID WASTE ELEMENT
Broward County Page 6-22 Comprehensive Plan
Volume 4, Support Document Solid Waste Element
anticipation of future disposal needs, Broward County received certification for ultimate generating capacities of 83.5 megawatts and 96.1 megawatts for the north and south Resource Recovery Facilities, respectively.
For a description of the processes used inside Broward County's two waste-to-energy plants, see Section III.F., entitled ―Impact of facilities on natural resources‖.
3. Recycling facilities. The Recovery Materials Processing Facility (typically called the MRF), is owned and operated by Waste Management, Inc. – Recycle America Alliance (WM-RA). The MRF accepts for processing and marketing newspapers, mixed paper (magazines, catalogs, and junk mail), aluminum and steel cans, glass bottles and jars (clear, green and brown), plastic bottles, and aseptic beverage boxes (i.e., milk cartons, juice boxes) from most Broward County cities, as well as other counties and their cities. Corrugated cardboard from some municipal programs has also been accepted at the MRF.
The annual tonnage throughput at the WM-RA MRF has increased during the past few years. Annual throughput has risen to more than 140,000 tons per year. WM-RA retrofitted the facility in southwestern Pembroke Pines to allow it to accept ―single-stream‖ recyclables, whereby paper products as well as commingled food and beverage containers are collected together in the same containers, and sorted at the MRF. The MRF also handles material collected using a dual stream method, which means collecting paper and commingled food and beverage containers from separate recycling bins and placing the respective materials into two separate compartments on the collection vehicle. Broward County communities are currently migrating to single stream programs.
Table 6-9 catalogs 14 additional active Material Recovery Facilities within Broward County, plus one inactive site, and one facility under construction. These handle some combination of the following waste types: construction and demolition debris (C&D); vegetative debris; residential bulk waste; and commercial waste. The Table reveals substantial available capacity for this type of activity.
4. Transfer Stations. A transfer station is a facility for the temporary collection of solid waste prior to transport to a processing plant or to final disposal. Table 6-9 includes information on 13 active transfer stations, as well as 2 which are permitted but inactive. Of the 13 active stations, 3 are county facilities, and 10 are municipal facilities. They accept various combinations of the following waste types: residential bulk waste; vegetative debris; bulky waste; C&D; and, catch basin debris. The overall status of these is as follows:

SOLID WASTE ELEMENT
Broward County Page 6-23 Comprehensive Plan
Volume 4, Support Document Solid Waste Element
Table 6-5
Available Capacity of Transfer Stations in Broward County
5. Hazardous Material Transfer Facilities. Table 6-10 displays data on active and licensed hazardous material transfer stations in Broward County. Nine of these handle discarded hazardous materials and/or hazardous waste, two handle biomedical waste, one handles sludge, and one is a grease trap. The summary information for these facilities, by type, is as follows:
Table 6-6
Available Capacity of Hazardous Materials Transfer Facilities in Broward County
6. Debris Staging Areas. The local governments, regional agencies, and special districts within Broward County have developed a Countywide Disaster Debris Management Plan, for management of disaster-generated debris. The countywide plan defines both the actions to be taken during times of normalcy, as well as the responsibility for those actions, necessary to maintain readiness to implement and coordinate actions for collection, transport, temporary handling and permanent disposal of disaster-generated debris. The plan also defines the actions by and responsibilities of all involved jurisdictions, agencies, and organizations during actual post-disaster debris management operations, from initiation of these operations through completion and termination of the debris management process.
Facility Type
Design
Capacity
Current Demand
Available Capacity
Percent Capacity Available
Discarded Hazardous Materials and/or Hazardous Waste
1,378,520 gallons
42,062 gallons
1,336,458 gallons
97%
Biomedical Waste 27 tons 17.8 tons 9.2 tons 34%
Sludge 4 cy 1 cy 3 cy 75%
Grease Trap 5,000 gallons 1,000 gallons 4,000 gallons 80%
Design Capacity
(cy/month)
Current Demand
(cy/month)
Available Capacity
(cy/month)
County facilities 13,500 4,600 8,900
Municipal facilities 3,885 1,599 2,286
Total facilities 17,385 6,199 11,186

SOLID WASTE ELEMENT
Broward County Page 6-24 Comprehensive Plan
Volume 4, Support Document Solid Waste Element
Part of this Plan involves the potential use of Debris Staging Areas, which are located in various areas around the county. Table 6-11 displays the 50 currently designated locations.
Table 6-7 Existing Landfill Facilities
Facility Facility Status
Design Capacity
(tons)
Current Demand
(tons/year)
Available Capacity
(tons)
Central Disposal Sanitary Landfill Active 75,000,000 1,500,000 25,265,000
Broward Interim/ Contingency Landfill (BIC)
Cells1,2 & 3 (52 acres)
Active 4,800,000 80,000 2,200,000
Future Cells Not developed 23,000,000 0 23,000,000
BIC Total 27,800,000 80,000 25,200,000 Source: Broward County Waste and Recycling Services, July 2009 Note: BIC facility is available only to RRS/ILA Contract Communities.
Table 6-8 Existing Incineration Facilities
Facility
Facility Status
Design
Capacity*
Current RRS
Demand
Available RRS
Capacity**
North Broward County Resource Recovery Facility
Active 2,250 tons/day
1,500 tons/day
750 tons/day
South Broward County Resource Recovery Facility
Active 2,250 tons/day
1,500 tons/day
750 tons/day
Total 4,500 tons/day
3,000 tons/day
1,500 tons/day
Source: Broward County Waste and Recycling Services, July, 2009 *A ―processing capacity‖ can be estimated as approximately 15% higher than design capacity. ** Approximately 3,000 tons/day is presently being processed for RRS/ILA Contract Communities. Wheelabrator has an allowance to contract for additional waste up to the remaining processing capacity, but must process all RRS waste first.

SOLID WASTE ELEMENT
Broward County Page 6-25 Comprehensive Plan
Volume 4, Support Documents Solid Waste Element
Table 6-9 Existing Solid Waste Management Facilities
(Residential Bulk Waste Facilities, Transfer Stations, Material Recovery Facilities, Composing and Mulching Facilities) (Broward County 2009)
Facility Facility
Status Facility Type
Waste Type Design Capacity
Current Demand Current Demand
Broward County Trans. Sta. North 2780 N. Powerline Road Pompano Beach, FL 33069
Active
TS
Residential bulk waste Vegetative debris
Bulky waste
4,500cy/month
1,600cy/month
2,900cy/month
Broward County Trans. Sta. Central 5490 Reese Road Davie, FL 33314
Active
TS
Residential bulk waste
Vegetative debris
4,500cy/month
1,500cy/month
3,000cy/month
Broward County Trans. Sta. South 5601 West Hallandale Beach Blvd Hollywood, FL 33023
Active TS Residential bulk waste
Vegetative debris
4,500cy/month
1,500cy/month
3,000cy/month
City of Coral Springs Trans. Sta. Wiles Road and NW 121 Avenue Coral Springs, FL
Active TS Residential bulk waste
Vegetative debris
590cy/month
425cy/month
165cy/month
City of Coral Springs- Public Works TS 4181 NW 121 Avenue Coral Springs, FL 33065
Active TS Residential bulk waste C&D
Vegetative debris
150cy/day
45cy/day
105cy/day
City of Fort Lauderdale Trans. Sta. 2101 NW 6
th Street
Fort Lauderdale, FL 33311
Active TS Residential bulk waste Vegetative debris
Catch basin debris
355cy/day
30cy/day
325cy/month
Snyder Park Transfer Station 3299 SW 4
th Avenue
Fort Lauderdale, FL 33315
Active
TS
Residential bulk waste
Vegetative debris
90 cy/day
45 cy/day
45 cy/day
City of Hollywood Trash Trans. Sta. 1600 South Park Road Hollywood, FL 33021
Active
TS
Residential bulk waste
Vegetative debris
500 cy/day
575 cy/day
75 cy/day
City of Deerfield Beach Trans. Sta. 360 SW 4
th Street
Deerfield Beach, Fl 33441
Permitted Inactive
TS
Residential bulk waste
400cy/month
0
400cy/month

SOLID WASTE ELEMENT
Broward County Page 6-26 Comprehensive Plan
Volume 4, Support Documents Solid Waste Element
Table 6-9 Existing Solid Waste Management Facilities
(Residential Bulk Waste Facilities, Transfer Stations, Material Recovery Facilities, Composing and Mulching Facilities) (Broward County 2009)
Facility Facility
Status Facility
Type Waste Type Design
Capacity Current Demand Current
Demand
Central Sanitary Landfill 2700 NW 48
th Street
Pompano Beach, FL 33073
Permitted Inactive
TS
MSW Residential bulk waste
4,000tons/month
0
4,000tons/month
City of Hallandale Residential Trans. Sta. 609 NW 8
th Avenue
Hallandale Beach, FL 33009
Active
TS
Residential bulk waste
Vegetative debris
700 cy/day
240 cy/day
460 cy/day
City of Plantation Horticultural Trans. Sta 750 NW 91th Avenue Plantation, FL 33324
Active TS Vegetative debris
10 cy/day
7.5 cy/day
2.5 cy/day
City of Sunrise Trash Transfer Station 5400 Block of NW 108 Avenue Sunrise, FL 33351
Active TS Residential bulk waste
60 cy/day
4 cy/day
56 cy/day
City of Margate, Public Works Trans. Sta. 102 Rock Island Road Margate, FL 33063
Active TS Residential bulk waste
1,020 cy/day
20cy/day
1,000 cy/day
Pompano Beach Trans. Sta. 1201 NE 3
rd Avenue
Pompano Beach, FL 33060
Active TS Residential bulk waste Vegetative debris
400 cy/day
200 cy/day
200 cy/day
Airport Recycling Specialists, Inc. 3551 SW 2
nd Avenue
Fort Lauderdale, FL 33315
Active
MRF
Garbage from Airport Recovered materials
9 ton/day
9 ton/day
0
Central Sanitary Landfill 2700 NW 48
th Street
Pompano Beach, FL 33073
Permitted Inactive
MRF
C&D Vegetative debris
750 ton/day
0
750 ton/day
Central Sanitary Landfill 2700 NW 48
th Street
Pompano Beach, FL 33073
Active
Compost Mulching
Vegetative debris
Wood
125 ton/day
175 ton/day
(50 ton/day)

SOLID WASTE ELEMENT
Broward County Page 6-27 Comprehensive Plan
Volume 4, Support Documents Solid Waste Element
Table 6-9 Existing Solid Waste Management Facilities
(Residential Bulk Waste Facilities, Transfer Stations, Material Recovery Facilities, Composing and Mulching Facilities) (Broward County 2009)
Facility Facility
Status Facility
Type Waste Type Design
Capacity Current Demand Current
Demand
Envirocycle, Inc 849 SW 21
st Terrace
Fort Lauderdale, FL 33312
Active
MRF
Residential bulk waste Commercial waste
C&D
1,200ton/day
71 ton/day
1,129 ton/day
Sun Recycling, LLC I 2241 NW 15 Court Pompano Beach, FL 33069
Active
MRF
C&D Vegetative debris
2,000 ton/day
0
2,000 ton/day
Delta Recycling Pompano 1951 N. Powerline Road Pompano Beach, FL 33069
Active MRF Residential bulk waste Commercial waste
C&D
3,000 ton/day
430 ton/day
2,570 ton/day
Transfer/Recycling Services Division 7061 SW 22 Court Davie, FL 33317
Active MRF Residential bulk waste Commercial waste
C&D
500 cy/day
235 cy/day
265 cy/day
Delta Recycling Pompano South 2900 NW 33
rd Street
Pompano Beach, FL 33069
Active MRF Residential bulk waste Commercial waste
C&D
2,000 cy/day
1,500 cy/day
(500 cy/day)
Delta Recycling Davie 3250 SW 50
th Avenue
Davie, FL 33314
Active MRF Residential bulk waste Commercial waste
C&D
5,000 cy/day
1,980 cy/day
3,020 cy/day
Choice Recycling Services
1899 SW 31 Avenue Pembroke Park, FL 33009
Active
MRF Commercial waste C&D
600 ton/day
265 ton/day
335 ton/day
Sun Recycling, LLC #8 1410 S. Powerline Road Deerfield Beach, FL 33442
Active
MRF
C&D Vegetative debris
600 cy/day
0
600 cy/day
Sun Recycling, LLC #3 3251 SW 26 Terrace Dania Beach, FL 33312
Active
MRF
C&D Vegetative debris
5,000 cy/day
3,650 cy/day
1,350 cy/day

SOLID WASTE ELEMENT
Broward County Page 6-28 Comprehensive Plan
Volume 4, Support Documents Solid Waste Element
Table 6-9
Existing Solid Waste Management Facilities (Residential Bulk Waste Facilities, Transfer Stations, Material Recovery Facilities, Composing and Mulching Facilities)
(Broward County 2009)
Facility
Facility Status
Facility Type
Waste Type Design Capacity
Current Demand Current Demand
Reuter Recycling of Florida, Inc. 20701 Pembroke Road Pembroke Pine, FL 33029
Active
MRF
MSW Commercial waste
C&D
5,600 cy/day
1,235 ton/day
4,425 ton/day
Sun Recycling, LLC #7 1815 S. Powerline Road Deerfield Beach, FL 33442
Active
MRF
C&D Vegetative debris
1,000 cy/day
1,035 cy/day
(35 cy/day)
Sun Recycling, LLC #2 2281 NW 16 Street Pompano Beach, FL 33069
Active
MRF
Residential bulk waste C&D
5,000 cy/day
2,535 cy/day
2,465 cy/day
All County Waste Recycling 1810 SW 42 Court Deerfield Beach, FL 33442
Active
MRF
Residential bulk waste Commercial waste
C&D
1,500 cy/day
460 cy/day
1,040 cy/day
Atlantic Coast Environmental 1751 SW 43
rd Terrace
Deerfield Beach, FL 33442
Active
MRF
Residential bulk waste Commercial waste
C&D
6,000 cy/day
970 cy/day
5,030 cy/day
Organic Recovery 1300 SW 2
nd Street
Pompano Beach, FL 33069
Inactive
MSW MRF
Food waste
60 ton/day
0
60 ton/day
FSR Hauling 1611 SW 3
rd Street
Pompano Beach, FL 33069
Permitted under const.
MRF C&D Vegetative debris
800 cy/day
0
800 cy/day
Notes: MSW = Municipal Solid Waste TS = Transfer Station
MRF = Material Recovery Facility Note: City of Plantation facility figures converted based on 200 lbs/cy for uncompacted vegetative debris.
C&D= Construction and Demolition Debris
Source: Broward County Pollution Prevention, Remediation and Air Quality Division (May 2009)

SOLID WASTE ELEMENT
Broward County Page 6-29 Comprehensive Plan
Volume 4, Support Documents Solid Waste Element
Table 6-10 Existing Hazardous Material Transfer Facilities
(Broward County 2009)
Facility
Facility Status
Facility Type
Design Capacity
Current Demand
Current Demand
Hydrocarbon Recovery Services, Inc. 1280 NE 48th Street Pompano Beach, FL 33064
Active
Discarded Hazardous Materials &
Hazardous Waste
300 gallons/day
46 gallons/day
254 gallons/day
Perma-Fix of Fort Lauderdale, Inc. 3670 SW 47th Avenue Davie, FL 33314
Active
Discarded Hazardous Materials &
Hazardous Waste
16,500 gallons/day
440 gallons/day
16,050 gallons/day
Clean Harbors Environmental Services 11221 Interchange Cir S Miramar, FL 33025
Active
Discarded Hazardous Materials &
Hazardous Waste
4,125 gallons/day
203 gallons/day
3,922 gallons/day
Heritage-Crystal Clean, LLC. 950 Eller Drive Dania Beach, FL 33316
Active
Discarded Hazardous Materials &
Hazardous Waste
4,125 gallons/day
40 gallons/day
4,085 gallons/day
Chemical Pollution Control of FL, LLC. 1280 NE 48th Street Pompano Beach, FL 33442
Active
Discarded
Hazardous Materials
700 gallons/day
410 gallons/day
290 gallons/day
Safety-Kleen Systems, Inc. 1400 NW 13th Avenue Pompano Beach, FL 33069
Active
Discarded
Hazardous Materials
57,500gallons/day
8,650gallons/day
48,350gallons/day
Bulk Intermodal Distribution Services, Inc. 890 SW 21st Street Fort Lauderdale, FL 33312
Active
Discarded
Hazardous Materials
140,000gallons/day
18,000gallons/day
122,000gallons/day
World Petroleum 3650 SW 47th Avenue Davie, FL 33314
Active
Discarded
Hazardous Materials
300,000 gallons/day
11,000 gallons/day
289,000 gallons/day
Cliff Berry Inc. (Port Everglades) 3400 SE 9th Avenue Dania Beach, FL 33316
Active
Discarded
Hazardous Materials
855,770 gallons/day
3,273 gallons/day
852,497 gallons/day
Healthcare Waste Solutions (Steritronix, Inc.) 3573 NW 19th Street Lauderhill, FL 33311
Active
Biomedical
19 tons/day
12.5 tons/day
6.5 tons/day
Bio-Tech Medical Waste Transporters 2560 N. Powerline Road, #203 Pompano Beach, FL 33311
Active
Biomedical
19 tons/day
12.5 tons/day
6.5 tons/day
City of Fort Lauderdale, Solids Receiving Sta 4030 S. State Road 7 Fort Lauderdale, FL 33314
Active
Sludge
4 cy/day
1 cy/day
3 cy/day
Darling International, Inc. 700 NW 57
th Street
Fort Lauderdale, FL 33309
Active
Grease Trap
5,000 gallons/day
1,000 gallons/day
4,000 gallons/day
Source: Broward County Pollution Prevention, Remediation and Air Quality Division (May 2009)

SOLID WASTE ELEMENT
Broward County Page 6-30 Comprehensive Plan
Volume 4, Support Documents Solid Waste Element
Table 6-11 Debris Staging Areas
General Location
City Name Location
SW PEMBROKE PINES BIC Landfill US 27 and Sheridan Street
NE Pompano Beach Sun Recycling 1 2241 NW 15TH CT, Pompano Beach
NE Pompano Beach Broward County North Residential Transfer Station
2780 N Powerline Road Pompano Beach
SE Davie Delta Recycling Davie ( Waste Management Inc)
3250 SW. 50 Avenue, Davie
NE Pompano Beach Delta Recycling Pompano (Waste Management Inc)
1951 N. Powerline Pompano Beach
SW Plantation City of Plantation Horticultural Recycling Center
750 NW91ST Ave, Plantation
NW Coral Springs City of Coral Springs Residential Transfer Station
Wiles Road & NW 121 AVE
SE Hallandale Beach City of Hallandale Beach Trash Transfer Station
609 NW 8TH AVE, Halladale Beach
SE Hollywood City of Hollywood Residential Transfer Station
1600 S Park Rd, Hollywood
NE Pompano Beach Sun Recycling 2 2281 NW 16thStreet, Pompano Beach
SE Deerfield Beach Sun Recycling 8 1410 S Powerline Road Pompano Beach
SE Dania Beach Sun recycling 3 3251 SW 26th Terrace, Dania Beach
NE Pompano Beach Sun Recycling 7
1815 S. Powerline Rd, Deerfield Beach, Fl 33442
NE Pompano Beach
City of Pompano Transfer Station
1201 NE 3RD AVE
NW Coral Springs City of Coral Springs Public Works Transfer Station
4181 NW 121ST AVE
SW Sunrise City of Sunrise Transfer Station 5400 Block of NW 108 Ave
NW Margate City of Margate Public Works Department
102 Rock Island Rd
SE Broward County South Broward Resource Recovery Monofill I-595 and 441
NW Coral Springs City of Coral Springs - Cleveland Clinic
University Dr., South of Sawgrass, north of 56th Drive and North of West View
NW Coral Springs City of Coral Springs – Sport Complex
13000 Royal Palm Blvd.
NE Pompano Beach Little B Inc. 2700 NW 33rd Street, Pompano Beach, FL

SOLID WASTE ELEMENT
Broward County Page 6-31 Comprehensive Plan
Volume 4, Support Documents Solid Waste Element
NE Deerfield Beach Deerfield Beach Recycle Site 43rd Terrace, Deerfield Beach FL
SW Pembroke Pines
Bergeron Site 1 West of SW 196 & SW 62 Avenue, Pembroke Pines
SW Pembroke Pines
Bergeron Site 2
NE Corner/Inters Stirling Rd & SW 202 Ave, Pembroke Pines
SW Pembroke Pines
Bergeron Site 3 NE Corner/Inters US 27 & Stirling Rd, Pembroke Pines
SW Weston Bergeron Site 4 SW Corner/Intersection
SW Weston Bergeron Site 5 NE Corner/Inters. US 27 & SW 16th Street
NW Coconut Creek City of Coconut Creek Site 1 5250 NW 40 Street, Coconut Creek
NW Coconut Creek Coconut Creek Site 2-next to Monarch High School
4400 Banks Road, Coconut Creek
SW Sunrise City of Sunrise NW Corner of Oakland Blvd and Flamingo Rd.
SW Plantation School Board-Plantation 11150 West Broward
SW Weston Weston Regional Park 20200 Saddle Club Rd
NE Fort Lauderdale City of Fort Lauderdale- Mills Pond Park 2201 NW 9th Avenue
NE
Fort Lauderdale
City of Fort Lauderdale - Compost Plant 4030 South State Road 7
NE
Fort Lauderdale
City of Fort Lauderdale- Lockhart Stadium 5301 NW 12th Avenue
NE
Fort Lauderdale
City of Fort Lauderdale-Holiday Park 800 East Sunrise Boulevard
SE Fort Lauderdale
City of Fort Lauderdale Snyder Park
3299 SW 4th Avenue, Fort Lauderdale
SW Southwest Ranches South Broward Drainage District 6591 SW 160 Avenue
SE West Park City of West Park Southeast corner of Pembroke Rd and S 57th Ave
NE Deerfield Beach Ric-Man Const., Inc. 1901 SW 45th Way
NW Margate City of Margate - Southeast Park 655 SW 50th Avenue
NW Margate City of Margate - Old Swap Shop 1000 N. SR7 (441)
NW Coconut Creek Tradewinds Park 3600 W. Sample Road
SW Sunrise Markham Park 16001 W. State Rd 84
SW Plantation Plantation Heritage Park 1100 S. Fig Tree Ln
SW Cooper City Brian Piccolo Park 9501 Sheridan St
SW Pembroke Pines C.B. Smith Park 900 N. Flamingo Rd
NE Pompano Beach Alpha 250 Site Blount Rd and Copans Rd Source: Broward County Pollution Prevention, Remediation and Air Quality Division (June 2009)

SOLID WASTE ELEMENT
Broward County Page 6-32 Comprehensive Plan
Volume 4, Support Documents Solid Waste Element
H. Regulatory framework for solid waste.
1. Level of service standards for solid waste generation. Solid Waste Generation Rates are contained in the Broward County Land Development Code, for the purpose of determining whether a proposed development satisfies Section 5-182(h): ―Adequacy of Solid Waste Disposal Sites or Facilities‖. This Section reads as follows:
(1) Solid waste disposal sites or facilities shall be available prior to occupancy to provide for the needs of the proposed development at the level of service in the Table V below.
(2) A finding that solid waste disposal sites or facilities are available must be based upon a demonstration that existing solid waste disposal sites or facilities have sufficient capacity to provide for the solid waste disposal needs of the development proposed by the application and for other developments in the service area which are occupied, available for occupancy, for which building permits are in effect or for which solid waste disposal capacity has been reserved. If existing capacity is unavailable, conditional approval may be granted if it is shown that there is an economically and fiscally feasible plan to expand solid waste disposal sites so that sufficient capacity will be available for the solid waste disposal of the development proposed by the application and for other developments in the service area which are occupied, available for occupancy, for which building permits are in effect or for which solid waste disposal capacity has been reserved.
Following this text is a table which contains solid waste generation rates:
Table 6-12 Current Solid Waste Generation Rates
Facility Type Generation Per Day
Residential 8.9 lbs. per unit
Factory/Warehouse 2 lbs. per 100 square feet
Office buildings 1 lb. per 100 square feet
Department store 4 lbs. per 100 square feet
Supermarket 9 lbs. per 100 square feet
Restaurant 2 lbs. per 100 square feet
Drug Store 5 lbs. per 100 square feet
Grade School 10 lbs per room & ¼ lb. per pupil
High School 8 lbs. per room and ¼ lb. per pupil
Hospital 8 lbs. per bed
Nurse or Intern Home 3 lbs. per person
Home for Aged 3 lbs. per person
Rest Home 3 lbs. per person Source: Broward County Land Development Code

SOLID WASTE ELEMENT
Broward County Page 6-33 Comprehensive Plan
Volume 4, Support Documents Solid Waste Element
Some of the categories in this table are outdated, and need revision. In addition, a rate is needed for hotel/motel, a fairly common land use type in development applications.1 Broward County is proposing to update this table to the following:
Table 6-13
Proposed Solid Waste Generation Rates
Facility Type Generation Per Day
Residential 8.9 lbs. per unit
Factory/Warehouse 2 lbs. per 100 square feet
Office buildings 1 lb. per 100 square feet
Retail/service 4 lbs. per 100 square feet
Supermarket 9 lbs. per 100 square feet
Grade School 10 lbs per room & ¼ lb. per pupil
High School 8 lbs. per room and ¼ lb. per pupil
Hospital 8 lbs. per bed
Nursing Home 3 lbs. per person
Hotel/motel 3 lbs. per room
2. County Environmental Review Approval – Development & Environmental Regulation Division. Environmental Review Approval is an important step in the process of obtaining a building or construction permit in Broward County. Review and approval at the Development & Environmental Regulation Division’s Environmental Review Desk is verification that all required environmental licenses and pending environmental enforcement issues related to the Broward County Natural Resource Protection Code (the Code) have been resolved. Environmental operation licenses which will be required at the completion of the project are also identified.
Applicants will be required to complete online application forms to receive Environmental Review Approval. Upon confirmation of compliance, Development & Environmental Regulation Division’s Environmental Review Approval stamps will be placed on plans or applications. Most evaluations require payment of an approval review fee. Approved plans become invalid if not submitted to the relevant municipal or county building department within thirty days.
In general, projects requiring a specific environmental license for construction of a new project or modifications to an existing facility must first obtain that license before Environmental Review Approval is granted. Completion of an industrial review form is required for submittal of nonresidential projects. This form helps staff to determine any need for additional environmental approvals and to identify future approval or license requirements which may be necessary after the project becomes operational.
Among the environmental evaluations made during the Approval process are:
a. Wellfield Protection. For new construction and all industrial and commercial projects, a determination is made regarding location with respect to drinking water
1 Hotel/motel rate from Table 4.3, Osceola County Solid Waste Element.

SOLID WASTE ELEMENT
Broward County Page 6-34 Comprehensive Plan
Volume 4, Support Documents Solid Waste Element
supply wells. If staff determines that the project is in a protected wellfield zone, the project is referred to the Pollution Prevention, Remediation & Air Quality Division (PPRAQD) for possible licensing. If such a license requirement is confirmed, Environmental Review Approval will not be granted until a complete application for a wellfield protection license has been received by the PPRAQD’s Hazardous Materials Licensing Section.
b. Storage Tank Licensing. All projects are reviewed to determine the presence of regulated storage tanks. A regulated storage tank is any above or below ground tank used to store hazardous materials with a volume greater than the threshold volume as defined in the Code. If such a tank is present, a valid storage tank license is required in order to obtain Environmental Review Approval. A license is also required before plans to construct or modify a tank can be approved.
c. Surface Water Management Licensing. All jurisdictional projects are reviewed to determine whether a surface water management license and/or state-delegated Environmental Resource Permit are required. If staff determines that the jurisdictional project involves alterations to the landscape above certain thresholds (including tidal and fresh surface waters and uplands), then a license and/or permit will be required and Environmental Review Approval will not be granted until the appropriate license/permit is issued. The license/permit required under this section includes additional criteria for Class I, II and III landfills.
d. Contaminated Sites. Every application for new construction is reviewed to determine if the site overlies or is adjacent to a site for which there is evidence that some prior release or discharge of pollutants has required assessment or possible remediation. In such a case, the project is referred to PPRAQD for evaluation. If this evaluation determines that the proposed project will not adversely affect cleanup of the site in accordance with Section 27-66(f) of the Code, notification is made to the Environmental Review staff so that the Environmental Review Approval process may continue.
e. Hazardous Material License. All nonresidential projects are reviewed to determine if a Hazardous Material license will be required after the project has been completed. If a determination is made that such a license may be required, the applicant is notified of their responsibility to obtain this license in accordance with the requirements in Section 27-356 of the Code. Projects for existing facilities that appear to need a Hazardous Material license may be referred to an Environmental Protection License Coordinator to determine if either a valid license exists or a license application is on file with PPRAQD’s Hazardous Materials Licensing Section. The project may not receive Environmental Review Approval until an appropriate application is received by the Hazardous Materials Licensing Section.
f. Enforcement Activities. Every project is reviewed for current or outstanding enforcement actions. If the project is found to have an outstanding enforcement issue, the project is referred to PPRAQD’s Enforcement Section for evaluation in accordance with Sections 27-66 (k) & 27-55(d) (1) & (6) of the Code. Upon resolution of enforcement matters, the Enforcement Section will notify the Environmental Review staff in writing to allow the project to continue through the approval process.

SOLID WASTE ELEMENT
Broward County Page 6-35 Comprehensive Plan
Volume 4, Support Documents Solid Waste Element
g. Other License Review Checks. In addition, all projects are assessed to determine the need for other licenses including solid waste and hazardous material transfer facility licenses. If a license is required for construction of a facility in any of these categories, the applicant will be referred to the appropriate Pollution Prevention, Remediation & Air Quality Division Section for further evaluation. Environmental Review Approval will not be granted until all appropriate licenses are issued.
3. County regulation of solid waste facilities and transporters – Pollution Prevention, Remediation and Air Quality Division. Improper disposal and management of solid waste and the unauthorized presence of hazardous materials results in or contributes to air and water pollution, land blight, and nuisance conditions. Therefore, the Broward County Environmental Protection and Growth Management Department requires that certain solid waste activities and facilities, transfer stations, and waste transporters be managed to eliminate deleterious effects upon the quality of air, water, soil, animal, environmental and human health. The Waste Management Section of the Pollution Prevention, Remediation and Air Quality Division is responsible for:
Administering the licensing and compliance for all solid waste management facilities, waste transporters, borrow pit reclamation areas, and hazardous material transfer stations within Broward County as required under county and state regulations, specifically Broward County Code of Ordinances, Chapter 27, Article VI, Solid Waste; Article XII, Hazardous Materials; Article XVII, Waste Transporters; and State Solid Waste Rule, Chapter 62-701 of Florida Administrative Code;
Conducting inspections at all licensed facilities to ensure compliance with environmental regulations; and,
Administering the state delegated solid waste licensing and compliance program. The following facilities require a license/permit from the Waste Management Section:
Solid Waste Facilities: Borrow Pit Reclamation Projects; Landfills; Material Recovery Facilities or Transfer Stations; Compost Facilities; Waste Tire Processing or Collection Facilities; and Construction and Demolition Debris Recycling Facilities
Hazardous Materials Transfer Facilities: Discarded Hazardous Materials; Sludge; Biomedical Waste
Waste Transporters: Waste Transporters; Discarded Hazardous Material Hauling; Sludge Hauling; Biomedical Waste Hauling

SOLID WASTE ELEMENT
Broward County Page 6-36 Comprehensive Plan
Volume 4, Support Documents Solid Waste Element
III. ANALYSIS REQUIREMENTS A. Methodology and Assumptions. The methodology for determining the future need and adequacy of solid waste facilities involves: projecting the amount of the solid waste stream; apportioning the projected waste stream to the types of facilities; and comparing the apportioned projection to the capacity available for each type of facility. By varying the assumptions, several scenarios are produced and analyzed, leading to a range of projections. This analysis needs to be performed for the short-term planning horizon (2015) and for the long-term planning horizon (2030). In the case of Municipal Solid Waste (MSW), the assumptions used in this analysis are critical to the outcome. The key assumptions are as follows:
1. Population. The current and forecasted population figures are from the 2009 Broward County Population Forecast Model, developed by the Broward County Planning and Redevelopment Division. This model estimates a countywide population of 1,772,060 for 2010; a population of 1,876,261 for 2015; and a population of 2,214,420 for 2030. This is the same source used for other elements of the Broward County Comprehensive Plan, to ensure consistency among these elements. A key factor in the analysis is that approximately 80% of the population is within municipalities which are members of in the Broward Solid Waste Disposal District. 2. Total waste generated per capita. According to Broward County Waste and Recycling Services, total municipal solid waste generated in Broward County in 2007 was 3,330,679 tons. Using the countywide population estimate for 2007 of 1,765,707 (from the source cited above) yields a figure for 1.89 tons of MSW per capita per year. 2007 was selected as a benchmark for this analysis because later years reflect too much of the economic recession in Broward County, while earlier years reflect an unsustainable ―boom‖ period, as well as a large influence from Hurricane Wilma, which occurred in October of 2005.
The methodology for this analysis examines three differing assumptions regarding the total waste generated per capita in Broward County: o Scenarios A and C assume that the generation rate will decrease by 5% by 2030; o Scenarios B and D assume that the generation rate will decrease by 10% by
2030; o Scenarios E and F assume that the generation rate will remain constant through
2030.
Data for Broward County published by the Florida Department of Environmental Protection shows that MSW disposed per capita has been increasing steadily, with a 34% overall increase from 1997-2007 (this does not include an even higher increase during the ―boom‖ years of 2004-2006). Based on this trend, even a modest waste reduction target is likely to require a substantial effort to achieve.
3. Allocation of waste stream. The Florida Department of Environmental Protection reports that, in 2007, the allocation of municipal solid waste from Broward County was: 24% combusted; 51% landfilled; and 25% recycled. These figures account

SOLID WASTE ELEMENT
Broward County Page 6-37 Comprehensive Plan
Volume 4, Support Documents Solid Waste Element
for the ―net‖ processed through the waste-to-energy plants, subtracting out the ash residue and recovered metals.
The methodology for this analysis examines two factors that would cause this allocation to change:
Currently, 80% of the County’s population is in municipalities that are members of the Broward Solid Waste Disposal District, and therefore use the Waste-to-Energy plants. o Scenarios 1 assume that an additional 10% will participate, but after 2015 o Scenarios 2 assume that an additional 10% will participate, but before 2015. Of the 20% population not currently members of the Broward Solid Waste Disposal District, Pembroke Pines accounts for more than 8%; Pompano Beach accounts for approximately 6%; while Dania Beach, Parkland, and Hallandale Beach account for 1% - 2% each. Therefore, the additional 10% participation in this assumption would imply that Pembroke Pines or Pompano Beach, plus one or more of the smaller municipalities, would join the District.
All scenarios assume that Broward County attains the State recycling goal of 75% by the year 2030. o Scenarios A, B, and F assume that this is comprised of 31% combusted and 44%
recycled o Scenarios C, D, and E assume that this is comprised of 25% combusted and
50% recycled.
All of the scenarios contain an assumption of 31% recycling in 2015. The initial scenarios (A,B, and later F) all assume that the balance of the shift, from 2015 to 2030, to get to the State target of 75% combustion + recycling, all comes from material that would otherwise have been landfilled. This recognizes the high unrealized potential for recycling Construction & Demolition Debris.
A more balanced assumption was subsequently used for Scenarios C, D, and E. It diverts roughly two-thirds of the 2015-2030 increase from the landfill, and one-third from the Waste-to-Energy plants. This recognizes that yard waste also has high potential to contribute to recycling.
Appendix F displays an example of potential recycling changes to achieve the targets envisioned in the scenarios.
4. Waste from outside Broward County. For the two Waste-to-Energy plants, waste from within the Broward Resource Recovery System is required to receive preference over other waste. Although these contracts expire in 2011 (south) and 2012 (north), the analysis assumes that this condition will continue within future contracts, so that waste from outside the County will only be allowed at these plants to take advantage of excess capacity not used by waste from within the County.
However, the private Central Sanitary Disposal Landfill (CDSL) does not have a similar constraint. No limit currently exists as to how much outside waste is accepted at CDSL. During 2008, the operator of this facility submitted to the County data indicating that, for

SOLID WASTE ELEMENT
Broward County Page 6-38 Comprehensive Plan
Volume 4, Support Documents Solid Waste Element
the calendar year 2007, 313,000 tons of waste, from outside Broward County, was received at CDSL. This comprised 14% of total waste received at CDSL for the year. The analysis of scenarios for the Solid Waste Element assumes that the operator will continue to send the same quantity (313,000 tons) from outside sources to CDSL, increasing by 1% each year. 5. Natural Disasters. As noted previously, the aftermath of Hurricane Wilma, which struck Broward County in November, 2005, had a major impact on solid waste facilities within Broward County. The Countywide Disaster Debris Management Plan (2007) includes Hurricane Debris Estimates, based on a model used by the U.S. Army Corps of Engineers. For a Category 3 storm hitting Broward County, the estimate is 15.048 million cubic yards of debris for a dry storm, and 19.562 million cubic yards of debris for a wet storm. Using a conversion factor of 300 lbs. per cubic yard2, this would translate to 2.257 million tons of debris for a dry storm, and 2.934 million tons of debris for a wet storm.
6. Other Factors Considered. The following factors, which could impact the future need and adequacy of solid waste facilities in Broward County, were considered for inclusion. However, they were not used in the scenario analysis, because they were deemed too insignificant and/or too unpredictable:
Factor Examples Future legislation Retail plastic bags bans or fees; Beverage container deposits Technological changes New products made from recycled materials Cultural changes Diminished lifespan of consumer electronics Change in composition of waste stream at a facility Proportion C&D debris vs. household waste at landfill
B. Analysis of Municipal Solid Waste Scenarios. Using the varying assumptions described above (waste generation rate, participation in the Resource Recovery System, and portion of Waste-to-Energy used to reach the 75% recycling goal), twelve scenarios were analyzed for the years 2015 and 2030. The detailed analysis for each is contained in Appendix A. Table 6.14 below displays the assumptions for each scenario, and the resulting estimates of two critical facility issues: 1. When will the two existing Waste-to-Energy plants reach capacity? 2. When will the Central Disposal Sanitary Landfill reach capacity?
2 This represents a mixture of uncompacted vegetative debris (200 lbs. per c.y.); residential bulk waste (250 lbs per
c.y.); and C&D debris (500 lbs. per c.y.).

SOLID WASTE ELEMENT
Broward County Page 6-39 Comprehensive Plan
Volume 4, Support Documents Solid Waste Element
Table 6.14
Analysis of Scenarios for Municipal Solid Waste Management in Broward County
Assumptions Results
Increase W-T-E participation by 10% how soon?
Reduce MSW generation rate by 2030 by how much?
Achieve 75% recycling goal by 2030, with what share to W-T-E?
W-T-E at capacity by 2015?
W-T-E at capacity by 2030?
Year CDSL reaches capacity?
Scenario
A1 After 2015 5% 31% No Yes* 2021
A2 Before 2015 5% 31% Yes Yes* 2022
B1 After 2015 10% 31% No Yes 2021
B2 Before 2015 10% 31% Yes Yes 2023
C1 After 2015 5% 25% No No 2021
C2 Before 2015 5% 25% Yes No 2022
D1 After 2015 10% 25% No No 2021
D2 Before 2015 10% 25% Yes No 2023
E1 After 2015 0% 25% No No 2021
E2 Before 2015 0% 25% Yes No 2022
F1 After 2015 0% 31% No Yes* 2021
F2 Before 2015 0% 31% Yes Yes* 2022 See calculations in Appendix A, B and C * Gross WTE tonnage in these scenarios is greater than 1.8 million, and would require expansion of both plants, or equivalent capacity elsewhere.
C. Resulting impact on capacity of Waste-to Energy Plants. The current design capacity of the two waste-to-energy plants is 1.6 million tons annually.3 Approximately 1.2 million tons/year are presently being processed for RRS/ILA Contract Communities. Wheelabrator, owner and operator of the plants, has an allowance to contract for additional waste up to the remaining processing capacity, but must process all RRS waste first. Based on the scenario analysis in Table 6.14, and the calculations shown in Appendix B, the current design capacity would be reached by 2015, for those scenarios (A2, B2, C2, D2, E2, and F2) in which the plants are being used by municipalities representing 10% (or more) additional population, compared to current usage. In addition, for scenarios A1, B1, and F1, in which the 75% recycling goal is achieved by 2030, partly by using combustion for 31% of municipal solid waste, the current design capacity of the Waste-to-Energy plants is reached by 2030. At the time when capacity is reached, at least one expansion (or an alternative facility) would need to be available. Each of the two plants is expandable by 33%. Expanding one existing
3 The ―processing capacity‖ for these facilities is approximately 15% higher than design capacity (roughly
1.84 million tons for both). However, the County believes that the Design Capacity should be used as the benchmark of when expanded or new facilities are needed.

SOLID WASTE ELEMENT
Broward County Page 6-40 Comprehensive Plan
Volume 4, Support Documents Solid Waste Element
plant would increase total design capacity to 1.8 million tons annually, which would last beyond the 2030 time frame for scenarios B1 and B2, due to the 10% reduction in the generation rate. However, for scenarios A1, A2, F1, and F2, which assume a 5% reduction or no reduction in the generation rate, the capacity of both plants is exceeded by 2030. For the remaining scenarios (C1, D1, and E1), the current design capacity of these two plants is not reached, even by 2030. D. Resulting impact on capacity of Landfill facilities. The March, 2009 Annual Life Report from Waste Management, the operator of the CDSL, estimates that the remaining capacity there is 23.6 million tons of waste. Beginning with this capacity in 2008, the tables in Appendix C estimate the number of years this capacity will last under the specified scenarios. They assume the Landfill demands forecast in Appendix A, while also assuming that: (a) approximately 100,000 tons/year goes to the Interim Contingency Landfill; and (b) approximately 200,000 tons/year goes to the ash monofill at the South WTE Plant, leaving a net current demand from Broward sources on the CDSL of 1.4 million tons/year. In addition, data submitted on behalf of WMI, for the year 2007, showed that 313,000 tons of waste, from outside of Broward County, was received at CDSL that year. An increase of 1% each year in this amount is assumed for the purposes of this forecast. Finally, the same data for 2007 shows that non-MSW wastes from within Broward (including industrial waste, agricultural waste, industrial sludge, waste/air treatment sludge, and treated bio-hazard waste) totaled approximately 250,000 tons at CDSL. An increase of 1% each year is also assumed for this portion of the waste stream. Table 6.14 shows the results of the calculations from Appendix C. Under all scenarios, the currently licensed capacity of CDSL is reached during the period from 2021 to 2023. E. Process and time needed to expand existing facilities or construct new facilities. Each of the waste-to-energy plants has designated space for a fourth boiler, which would increase the design capacity by 750 tons per day at each plant. This would increase the total design capacity from 2,250 to 3,000 tons per day at each of the plants. The lead time for adding a fourth boiler, including design, permitting and construction, would be approximately 5 years. Alternatively, design, permitting, and construction of a new facility would take at least 5 years. The BIC Landfill has space that is conceptually permitted by FDEP for future landfill expansion. The design, permitting and construction of new cells would take approximately 3-5 years. The currently adopted Broward County Capital Program includes funding for a BIC cell expansion, beginning in FY 2013. The previous analysis indicates that the CDSL would likely run out of its currently licensed capacity between 2021 and 2023. The same 5 year period for the design, permitting, and construction of an expansion would apply to this facility, if approved. F. Impact of facilities on natural resources. Disposal facilities can impact adjacent natural resources (such as wetlands, ground water, and surface water) through new facility construction or expansion, or through the operation of existing facilities. However, adequate regulation and monitoring can minimize the opportunities for negative environmental impacts.

SOLID WASTE ELEMENT
Broward County Page 6-41 Comprehensive Plan
Volume 4, Support Documents Solid Waste Element
1. Landfills. To protect adjacent natural resources from the impacts associated with the operation of landfills, in 1985 Florida began requiring landfills to have liners. The original requirements were for either a single clay liner or a single geomembrane liner. Today the requirements are for either a composite liner or a double liner for Class I or II MSW landfill cells. The active portions of CDSL, the BIC, and the Ash Monofill are all double-lined landfills. The CDSL and the BIC have separate monitoring of the leachate flow rates for both the Leachate Collection System (LCS) from the primary liner and the Leachate Detection System (LDS) from the secondary liner. The LDS is not monitored separately from the LCS for the Ash Monofill. Based upon this data, no adverse impacts to the adjacent areas are occurring.
2. Resource Recovery Facilities. The following is a description of the operational procedures in place at the two Waste-to-Energy facilities, to minimize negative environmental impacts: First, the trucks delivering waste are weighed; then they enter an enclosed tipping area where they unload waste into a concrete storage pit. Cranes move and mix the delivered waste, and bulky unprocessable objects are removed and landfilled. The cranes feed the furnace hoppers located above the back wall of the pit. Air from the pit and tipping area is used for burning the waste (this prevents the escape of dust and odor from the building.) Once in the furnace, the waste travels on moving metal grates. A minimum temperature of 1800° F is used, assuring complete combustion and leaving little chance of releasing unburned pollutants.
Hot gases are carried up from the grate area through several boiler tube sections where heat is absorbed to produce steam. The gases pass from the boiler through a scrubber, where a water mist containing lime is mixed with the gases. The gases are cooled and a chemical reaction of the lime with the gases neutralizes any acids and produces particles that can be collected. Next in the process line is a baghouse that works like a large vacuum cleaner, collecting particles produced in the boiler and scrubber. The cooled and cleaned gases are vented through a stack flue topping out at 200 feet above the ground.
The entire process is guided and monitored by operators from a central control room. All processing activities take place indoors to control dust odors, and to prevent rain water from coming in contact with either waste or ash. Metals in the ash are removed and recycled while the remaining ash is landfilled in areas adjacent to the plants called monofills. These monofills have been constructed with multiple liners to prevent groundwater contamination. The water retained by the monofill liner system is used in the plants or sent to a sewage treatment plant for disposal. Wastes which cannot be recycled or processed at the plants are landfilled.
Steam from the boilers power a turbine generator, producing electricity to run plant equipment. The remaining electricity, about 95% of the total, is sold for use in local homes and businesses.
3. Monitoring. Landfills and WTE plants are monitored to ensure compliance with environmental regulations through routine on-site inspections. Additionally, environmental monitoring systems are used at both types of facilities. Landfills are monitored via a well system for any signs of groundwater contamination and for landfill

SOLID WASTE ELEMENT
Broward County Page 6-42 Comprehensive Plan
Volume 4, Support Documents Solid Waste Element
gases (for example, methane). WTE plants are tested routinely for air emissions to ensure compliance with air quality requirements. Based on Chapter 403, Part II, Florida Statutes, environmental monitoring for these WTE plants is under the jurisdiction of the Florida Department of Environmental Protection.
IV. PROBLEMS AND OPPORTUNITIES FOR SOLID WASTE FACILITIES REPLACEMENT, EXPANSION, AND NEW SITING. A. Expiration of key documents for Broward Solid Waste Disposal District. Wheelabrator South contract August 14, 2011 Wheelabrator North contract March 22, 2012 ILA Contract July 2, 2013 At its meeting of June 30, 2009, the Resource Recovery Board unanimously approved a Memorandum of Understanding (MOU) regarding the terms of a new Service Agreement with Wheelabrator for the north and south waste-to-energy facilities. This MOU is displayed in Appendix C. The Board also reviewed with its Technical Advisory Committee the framework of a new Interlocal Agreement (ILA), and directed that both documents be prepared for municipal review in the fall. On September 1, 2009, the Broward County Commission also approved the MOU. As of January 1, 2010, the following municipalities had approved the terms of the MOU: Coconut Creek Cooper City Coral Springs Davie Deerfield Beach Fort Lauderdale Hillsboro Beach Hollywood Lauderdale-by-the-Sea Lauderdale Lakes Lauderhill Lighthouse Point Margate Miramar North Lauderdale Oakland Park Pembroke Park Plantation Sea Ranch Lakes Southwest Ranches Sunrise Tamarac West Park Weston Wilton Manors Unincorporated Broward County

SOLID WASTE ELEMENT
Broward County Page 6-43 Comprehensive Plan
Volume 4, Support Documents Solid Waste Element
Appendix D contains the MOU, dated November 2, 2009, which was executed by Wheelabrator, the District, and the County. B. Expansion or replacement of existing facilities.
1. Waste-to-Energy Plants. Based on the calculations in Section III.C., the current design capacity of the two existing waste-to-energy plants would be reached by 2015 for six of the twelve scenarios examined. For three additional scenarios, the current capacity of the two plants would be reached by the year 2030.
Of the nine scenarios cited above, only in four does the 2030 demand for waste-to-energy exceed the combined capacity of both of the existing plants. In these four cases, the expansions for which these existing plants were designed would be insufficient and additional sites and/or different technology would be required.
In 2007, the Broward Solid Waste District issued a Request for Expressions of Interest (RFEI). The objectives were: 1. To inform interested parties of the District’s solid waste management needs and
to engage qualified firms in preliminary discussions regarding possible approaches to addressing those needs.
2. To determine the viability of emerging solid waste management options and
technologies, in addition to established technical approaches. Viable options were defined as those solid waste processing and disposal options that would:
Provide the District with long-term waste disposal capacity;
Be cost effective for the District;
Provide high levels of service to the community;
Increase recycling levels to meet or exceed State of Florida goals; and
Provide flexibility to adapt to future changes. 3. To identify relevant procurement, technical, business and management issues.
4. To identify parties with the experience, financial capability and proven technology
to effectively manage the District’s solid waste.
25 Expressions of Interest were received by the District, but no further action was taken at that time, regarding a change in technology for solid waste processing and disposal. As the expiration of the two Wheelabrator contracts approached, the District elected to begin discussions on new contracts with Wheelabrator for the continued use of the existing plants. The result was the Memorandum of Understanding cited above, which foresees a 10-year contract, with two renewal options for 10 years each. The MOU does not contemplate an expansion of either facility due to increased demand during this period.
2. Landfill facilities. Based on the calculations in Section III.D., the Central Disposal Sanitary Landfill (CDSL), as currently licensed and zoned, will reach capacity between 2021 and 2023. Among the actions which could mitigate that situation are the following:

SOLID WASTE ELEMENT
Broward County Page 6-44 Comprehensive Plan
Volume 4, Support Documents Solid Waste Element
a. Expansion of CDSL. In 2008, Waste Management Inc. of Florida (WMIF) provided to County staff a topographic map illustrating potential alternatives to increase the landfill footprint and airspace by means of possible lateral and vertical expansions. This map was intended for informational purposes only and did not represent an official application submittal. This was an exercise to estimate the maximum engineering capacity of the landfill without taking into account zoning and permitting constraints and based on the potential footprint and minimum slope requirements.
WMIF identified hypothetical scenarios for future lateral expansions that could potentially increase the landfill footprint by 247 acres and increase the landfill life span by 29.9 years, assuming an average annual incoming waste rate of 2,300,000 tons. Based on that scenario, the landfill life span could potentially increase to year 2052.
Additionally, WMIF has identified the hypothetical scenario for a vertical expansion to a top elevation of 290 ft NGVD. This scenario could potentially increase the landfill operating life span by an additional 8.3 years, assuming an average annual incoming waste at the rate of 2,300,000 tons/year and this would mean that the landfill life could extend to year 2060.
b. Increased use of BIC. The potential use of BIC as a permanent landfill site is contrary to the current policy of the County Commission and the Resource Recovery Board. As its name implies, this facility is reserved for interim and contingency use. It was planned as the last Class I landfill site in Broward County. As such, it was designed to last as long as possible by only accepting waste that cannot be processed at waste-to-energy plants, and to act as a backup facility for municipal solid waste in the event that the waste-to-energy plants are unable to accept this material in an emergency situation, or if disposal is required while additional capacity is being developed. c. Use of other disposal sites. Landfill sites exist in Central Florida, and beyond, with ample capacity to handle the excess forecasted demand from Broward County during the planning period. However, the transport of solid waste over long distances carries a direct cost (in proportion to the price of fuel), and an indirect cost (in terms of environmental impacts), which may make this option undesirable.
Regarding a new landfill site within Broward County, it is difficult to imagine a location that would be socially and environmentally acceptable. Since the completion of the 2000 Land Preservation and Safe Parks County Bond Program, finding a vacant suitable site of sufficient size for this purpose would be very difficult.
d. Reduction of use of landfill. Aside from the goal in Florida Statute to achieve 75% recycling, there are many other efforts underway by local and state governments to reduce waste, particularly waste going to landfills. For example, see http://www.zerowaste.org/ for information on the ―zero waste‖ movement. Programs within Broward County to reduce, reuse, and recycle solid waste, as in Section II.D (existing programs) and Section IV.C (potential programs), will use up the available landfill capacity more slowly. Additionally, policies which prohibit and/or discourage (1) the use of landfill capacity for processable solid waste (which can be combusted) or (2) waste from outside Broward County, will significantly extend the useful life of the landfill facility.
SOLID WASTE ELEMENT
Broward County Page 6-45 Comprehensive Plan
Volume 4, Support Documents Solid Waste Element
3. Other facilities. The discussions and tables in Section II.G demonstrate that there will be ample capacity available at recycling facilities, transfer stations, and hazardous waste facilities, for the short-term and long-term planning horizons.
C. Potential programs to reduce solid waste generation, and to increase recycling. [Also see FDEP recycling recommendations in Appendix E, and an example of potential recycling changes to achieve the targets in Appendix F].
1. Product Stewardship. According to the U.S. Environmental Protection Agency, Product Stewardship is ―a product-centered approach to environmental protection‖ which ― calls on those in the product life cycle – manufacturers, retailers, users, and disposers – to share responsibility for reducing the environmental impacts of products.‖ Also known as Extended Product Responsibility (EPR), this approach ―recognizes that product manufacturers must take on new responsibilities to reduce the environmental footprint of their products. However, real change cannot always be achieved by producers acting alone: retailers, consumers, and the existing waste management infrastructure need to help to provide the most workable and cost-effective solutions.‖ See http://www.epa.gov/epawaste/partnerships/stewardship/basic.htm for more information.
2. Reuse Network. The U.S. Environmental Protection Agency discusses the concept of reuse networks under the heading ―Materials and Waste Exchanges‖:
―Materials and waste exchanges are markets for buying and selling reusable and recyclable commodities. Some are physical warehouses that advertise available commodities through printed catalogs, while others are simply Web sites that connect buyers and sellers. Some are coordinated by state and local governments. Others are wholly private, for-profit businesses. The exchanges also vary in terms of area of service and the types of commodities exchanged. In general, waste exchanges tend to handle hazardous materials and industrial process waste while materials exchanges handle nonhazardous items. Typically, the exchanges allow subscribers to post materials available or wanted on a Web page listing. Organizations interested in trading posted commodities then contact each other directly. As more and more individuals recognize the power of this unique tool, the number of Internet-accessible materials exchanges continues to grow, particularly in the area of national commodity-specific exchanges. Wherever possible, the materials exchange programs presented contain a brief description of the services offered, including the materials available for exchange, how to contact the exchange, and other pertinent information. Significant effort has been made to provide a comprehensive and accurate list of materials exchanges; however, this Web site may not currently represent a complete listing of national, regional, and local exchanges‖.
See http://www.epa.gov/osw/conserve/tools/exchange.htm for more information. This site lists nine Exchanges in Florida, including three based in Broward County.

SOLID WASTE ELEMENT
Broward County Page 6-46 Comprehensive Plan
Volume 4, Support Documents Solid Waste Element
The Town of Nantucket, Massachusetts has a specific facility to encourage reuse, described as follows:
―The Take It or Leave It (TILI) building is a drop-exchange location for anyone who wishes to use it. It is monitored closely to avoid improper disposal of wastes; however, many quality items are saved from the landfill. If an item does not get picked up, it is sent to its proper venue for disposal and/or recycling. All textiles (shoes, belts, hats, clothes, coats) are removed from the TILI at the end of each day and recycled
through a charitable organization‖.
3. Construction and design techniques to minimize disposal. The U.S. Environmental Protection Agency publication ―Reducing the Scrap‖ includes the following:
By minimizing construction inputs, buying recycled products, and using salvaged building materials, building projects can achieve substantial cost savings. Eliminating waste at the source, known as source reduction, saves money and valuable landfill space. There are many opportunities to implement source reduction strategies on construction sites. The total waste generated by a project can be greatly reduced by considering waste generation during the design phase, employing conservative purchasing practices, and by reusing excess materials at the jobsite. . . . Materials can be reduced during the design phase by planning for efficient framing techniques, use of standardized lumber sizes, and incorporation of prefabricated or modular materials. Value engineering focuses on maximizing resources while maintaining construction value. This results in a finished project that performs the required functions while utilizing the least amount of resources. . . . Reuse can range from saving an entire structure, to readapting select assemblies and systems, to the selection of specific materials or items. Conduct an inventory of materials that can be reused and allow time to salvage as much as possible. If there are many valuable materials or items in the structure, this will be well worth the effort. The extra time invested can result in the salvage of old growth lumber, valuable appliances, light fixtures, hardware, architectural millwork and other custom accessories.
See http://www.epa.gov/region09/waste/solid/pdf/cd2.pdf for more information. 4. Reduction in the quantity of hazardous material produced, and reduction in the toxicity of hazardous material. The Broward County Pollution Prevention Remediation and Air Quality Division, on its website at http://www.broward.org/pprd/hm_best.htm, have links to publications on best management practices for hazardous materials, mostly by specific industry, as follows:

SOLID WASTE ELEMENT
Broward County Page 6-47 Comprehensive Plan
Volume 4, Support Documents Solid Waste Element
Florida 's Automotive Recyclers Handbook
Guidance for the Management and Disposal of CCA-Treated Wood
A Guide on Hazardous Waste Management for Florida 's Auto Repair Shops
A Guide on Hazardous Waste Management for Florida 's Dry Cleaners
A Guide on Hazardous Waste Management for Florida 's Furniture Refinishers and Manufacturers
BMP for Managing Mercury in Medical Facilities
BMP for Scrap Dental Amalgam
A Guide on Hazardous Waste Management for Florida 's Photo Shops
A Guide on Hazardous Waste Management for Florida 's Printers
A Guide on Hazardous Waste Management for Florida 's Circuit Board Manufacturer's
Florida's Handbook for Small Quantity Generators of Hazardous Waste
A Guide on Hazardous Waste Management for Florida 's Labs
US EPA Pollution Prevention website
Title III, Consolidated List of Chemicals: List of Lists, EPECRA 302/312, CERCLA & CAA 112(r)
100% Closed-loop Recycle Systems at Vehicle and Other Equipment Wash Facilities
o Checklist Guide
o BMP
Drycleaner Presentation February, 2007 (225 page pdf document)
Broward County Best Management Practices for Marinas (August 1, 1999, 23 pages, .pdf)
5. Environmentally Preferable Purchasing (EPP). The U.S. Environmental Protection Agency has a website on the Federal Environmentally Preferable Purchasing Program. In part, it states:
―The primary purpose of the Environmentally Preferable Purchasing Program is to help Executive agencies prevent waste and pollution by considering environmental impacts along with price and performance and other traditional factors when deciding what products and services to buy.

SOLID WASTE ELEMENT
Broward County Page 6-48 Comprehensive Plan
Volume 4, Support Documents Solid Waste Element
The Federal government is the single largest consumer in the U.S., spending over $350 billion each year on a wide variety of products and services. The government's purchase and use of products and services leave a large environmental footprint. Through its purchasing decisions, the Federal government can minimize environmental impacts while supporting manufacturers that produce environmentally preferable products and services. The Environmentally Preferable Purchasing Program serves as a clearinghouse of information and tools to facilitate the efforts of Executive agencies to purchase environmentally preferable products and services. The Environmentally Preferable Purchasing Program's audience is not limited to the Federal government, however. Businesses, non-profit organizations, and state and local government agencies have also found the program to be of interest and value‖.
The website also states:
As defined in the instructions for implementing Executive Order 13423, environmentally preferable means "products or services that have a lesser or reduced effect on human health and the environment when compared with competing products or services that serve the same purpose. This comparison may consider raw materials acquisition, product, manufacturing, packaging, distribution, reuse, operation, maintenance, or disposal of the product or service."
For further information, see http://www.epa.gov/opptintr/epp/index.htm .
[Also see the example below from the Commonwealth of Massachusetts.]
6. Waste reduction programs at public agencies. The organization INFORM, as part of its Community Waste Prevention Toolkit (at http://www.informinc.org/cwp_06.php), describes two waste prevention programs at government agencies:
Environmental Management Program Seattle, Washington As owner and operator of over 350 separate facilities, the City of Seattle is one of the largest employers in its jurisdiction. To ensure that the city itself sets an example in waste prevention, the Environmental Management Program establishes goals and procedures for all city departments to reduce solid waste and increase recycling consistent with Seattle's waste management plan. In fiscal year 2000, with a budget of $572,000, the program provided city employees with technical assistance and training in waste reduction conducted by Seattle Public Utilities, the department responsible for the city's sanitation services. Under the program, each city department must designate a coordinator to promote waste reduction and recycling, and all city buildings must establish recycling collection services. Data on waste generation, reduction, and recycling rates are collected to measure the program's success. For more information, go to http://www.cityofseattle.net/environment/default.htm

SOLID WASTE ELEMENT
Broward County Page 6-49 Comprehensive Plan
Volume 4, Support Documents Solid Waste Element
Environmentally Preferable Products Procurement Program Commonwealth of Massachusetts Established in 1988, Massachusetts' Environmentally Preferable Products Procurement Program is one of the most successful such programs in the country. In 2000, the commonwealth and local entities purchased over $65 million worth of recycled products and millions more of products that minimize waste, conserve energy and water, and contain fewer toxic materials. The program targets products of all types purchased under state contracts for state agencies, including reusable shipping crates, rechargeable batteries, retread tires, recycled antifreeze, solar landscape lights, compost bins, and remanufactured furniture and medical equipment. Under the $150,000/year program, vendors are required to certify the environmentally preferable attributes of their products
and the state holds the right to cancel the contract if this information is found to be incorrect. Preference is given to vendors able to prove that their products are manufactured without toxic substances. In addition to encouraging responsible purchasing, program staff holds one vendor conference and numerous workshops for public purchasers each year. They also provide extensive outreach materials, including the Recycled and Environmentally Preferable Products Guide for State Contracts, which provides up-to-date details on existing state contracts for environmentally preferable products. For more information (including the products guide), go to http://www.magnet.state.ma.us/osd/enviro.
7. Use of roll-out carts to enhance single-stream recycling, and facilitate incentive programs such as RecycleBank;
According to their website, RecycleBank partners with cities and haulers to reward households for recycling. Households earn RecycleBank Points that can be used to shop at over 1,500 local and national businesses. Members of the RecycleBank program can earn Points by curbside recycling and recycling e-waste. In the curbside program, your RecycleBank cart will be weighed each week upon pick-up. The weight will then be translated to RecycleBank Points. The more you recycle, the more your household can earn. In a few select communities, households earn rewards based on their equal share of the total amount that their entire community recycles. Online rewards will be made available either instantaneously, via the website, or will be sent via e-mail for your immediate use. Many reward partners require that their rewards be sent to you through the mail. It takes approximately 5-7 business days to receive your rewards after you have placed your order. For more information, see https://www.recyclebank.com/ . 8. A “Pay As You Throw” fee system for waste collection. The U.S. Environmental Protection Agency describes Pay-as-you-Throw by the following: In communities with pay-as-you-throw programs (also known as unit pricing or variable-rate pricing), residents are charged for the collection of municipal solid waste—ordinary household trash—based on the amount they throw away. This creates a direct economic incentive to recycle more and to generate less waste.
SOLID WASTE ELEMENT
Broward County Page 6-50 Comprehensive Plan
Volume 4, Support Documents Solid Waste Element
Traditionally, residents pay for waste collection through property taxes or a fixed fee, regardless of how much—or how little—trash they generate. Pay-As-You-throw (PAYT) breaks with tradition by treating trash services just like electricity, gas, and other utilities. Households pay a variable rate depending on the amount of service they use. Most communities with PAYT charge residents a fee for each bag or can of waste they generate. In a small number of communities, residents are billed based on the weight of their trash. Either way, these programs are simple and fair. The less individuals throw away, the less they pay.
EPA supports this new approach to solid waste management because it encompasses three interrelated components that are key to successful community programs: a. Environmental Sustainability - Communities with programs in place have reported significant increases in recycling and reductions in waste, due primarily to the waste reduction incentive created by PAYT. Less waste and more recycling mean that fewer natural resources need to be extracted. In addition, greenhouse gas emissions associated with the manufacture, distribution, use, and subsequent disposal of products are reduced as a result of the increased recycling and waste reduction PAYT encourages. In this way, PAYT helps slow the buildup of greenhouse gases in the Earth's atmosphere which leads to global climate change. For more information on the link between solid waste and global climate change, go to EPA's Climate Change Web site.
b. Economic Sustainability - PAYT is an effective tool for communities struggling to cope with soaring municipal solid waste management expenses. Well-designed programs generate the revenues communities need to cover their solid waste costs, including the costs of such complementary programs as recycling and composting. Residents benefit, too, because they have the opportunity to take control of their trash bills.
c. Equity - One of the most important advantages of a variable-rate program may be its inherent fairness. When the cost of managing trash is hidden in taxes or charged at a flat rate, residents who recycle and prevent waste subsidize their neighbors' wastefulness. Under PAYT, residents pay only for what they throw away.
See http://www.epa.gov/osw/conserve/tools/payt/index.htm for further information. The City of Plantation utilizes this type of system. It is described on the City’s website as follows:
Sometime ago, the City Council and Mayor looked into ways to better serve the waste collection needs and requirements of our community. With that in mind, a ―pay as you throw‖ or blue bag system for refuse collection was established. This system offers residents a true ―user-fee‖ based collection program and, at the same time, enhances the esthetics of the neighborhoods by doing away with unsightly garbage pails with various and sundry refuse containers being left at the curb before and after garbage collection.

SOLID WASTE ELEMENT
Broward County Page 6-51 Comprehensive Plan
Volume 4, Support Documents Solid Waste Element
9. Green waste/yard waste programs. The U.S. Environmental Protection Agency has a website on yard trimmings, which includes the following:
In large part, disposal of yard trimmings—such as grass clippings and trimmings from bushes, trees, and other yard vegetation—in landfills is generally not necessary, since backyard composting and yard trimmings collection and recovery programs have become quite popular. Composting yard trimmings saves landfill space and reduces methane production in landfills. Methane gas can contribute to global climate change. Many local governments offer drop-off and/or curbside collection of yard trimmings not composted by homeowners. Drop-off sites work best with residents accustomed to delivering their household discards to landfills or transfer stations to avoid the costs of a curbside collection program. Curbside collection is more expensive than drop-off but typically garners higher participation and diversion rates. The higher operational costs of curbside collection programs can be offset by:
Decreased disposal costs (tipping fees);
Increased landfill life; and
Potential revenue from compost and/or mulch sales.
Yard trimmings collection programs might occur seasonally or by request depending on where you live.
EPA's GreenScapes program provides cost-efficient and environmentally friendly solutions for managing yard trimmings from large-scale landscaping operations (e.g., golf courses, parks, roadsides). See http://www.epa.gov/epawaste/conserve/materials/organics/yrdwste.htm for additional information. In San Francisco, the residential recycling program includes a ―green‖ compost cart that includes food scraps and soiled paper, as well as yard trimmings. For more information, see http://www.sfrecycling.com/residential/composting.php?t=r . 10. Recycling for all multifamily and commercial properties. An article entitled ―Multifamily Recycling: A Golden Opportunity for Solid Waste Reduction‖ (EPA, 1999) discusses a study of 40 communities with multifamily recycling programs. The article explores ways to measure the success of a program, including diversion percentages and costs. It also outlines the common design features of successful programs, including size and number of containers; collection fees; materials collected; program enforcement; contract provisions; preventing contamination; public education; and detailed recordkeeping. For additional information, see http://www.epa.gov/waste/conserve/rrr/pubs/multi.pdf.
In 2009, the Green Foodservice Alliance established four Zero Waste Zones (ZWZ) in the Atlanta metro area. Each ZWZ involves food service establishments pledging to participate as follows:
Spent grease must be collected for the local production of biofuel.

SOLID WASTE ELEMENT
Broward County Page 6-52 Comprehensive Plan
Volume 4, Support Documents Solid Waste Element
Common recyclables (cardboard, paper, glass, plastic and metals) must be collected for recycling.
Excess food in compliance with federal, state and/or local Good Samaritan Food Donation legislation must be donated to feed the hungry.
Food residuals, from preparation and service, and excess food not compliant with the Good Samaritan Food Donation legislation must be collected for composting. This provision only applies where there is a composting option available in compliance with state regulations.
Participation in the EPA WasteWise Program
Membership in the Green Foodservice Alliance via Georgia Restaurant Association membership.
A future phase of the program would expand the zones to include for general business, retail, and mixed-use residential and common public areas. For more information, see http://www.greenfoodservicealliance.org/about-gfa . The City of Seattle has a web page for commercial recycling, at http://www.seattle.gov/util/Services/Recycling/CommercialRecycling/index.asp . It includes a free resource for recycling assistance, information on free limited-service cart recycling, referrals to private recycling services, instructions for self-haul recycling, and resources for reuse opportunities, including commercial compost collection. The San Francisco Board of Supervisors has mandated a goal of 75% waste diversion for all of San Francisco by the year 2010. Its recycling website, at http://www.sfrecycling.com/residential/index.php?t=r, includes a 20-page list of San Francisco businesses already meeting that goal by diverting 75% or more of their garbage to recycling.
11. Recycling of food and beverage containers at food service facilities, including institutions. The following information is excerpted from ―Decision Maker’s Guide to Solid Waste Management, Volume II‖ (EPA 530-R-95-023), 1995. It is found online at: http://www.epa.gov/osw/nonhaz/municipal/dmg2/chapter5.pdf .
Different types of businesses can use source reduction strategies that are appropriate for their specific materials use and waste streams. For example, restaurant managers can include the following strategies:
Use reusable utensils, dinnerware, napkins and place mats in restaurants for in-store serving.
Sell beverages on tap, in bulk dispensers and in returnable bottles.
Buy in bulk.
Reduce single-serving packages for condiments by providing dispensers.
Ask diners if they want a glass of water, condiments, straw and napkins.
Evaluate shipping packaging to identify items that could be eliminated or reduced.
One restaurant that benefited from such measures is the Brick Alley Pub and Restaurant in Newport, Rhode Island, which formerly served beer in nonreturnable bottles. Their source reduction program consisted of installing a tap as well as purchasing beer only in returnable bottles. These measures resulted in cost savings of $2,900 and disposal reduction of 700 cubic yards annually.

SOLID WASTE ELEMENT
Broward County Page 6-53 Comprehensive Plan
Volume 4, Support Documents Solid Waste Element
Packaging should protect products from chemical and physical damage. Once this goal is achieved, source reduction decision-making guidelines for packaging professionals should be followed to evaluate each type of package design. Source reduction considerations should be incorporated into all packaging design. To assess packaging, the following should be considered. • Evaluate the need for any package at all. • Decide if any of the package components can be eliminated. • Assess the use of toxic chemicals and replace them with less harmful
chemicals using the smallest amount possible. • Design a package that is reusable. • Find ways to reduce the package size. For example, by using the same
type of packaging material, but in smaller amounts (by weight); by reducing the size or volume of the package relative to the product it contains; or by substituting a different, recyclable material that weighs less.
12. Recycling programs for public places. Recycle on the Go is an EPA initiative to encourage recycling in public places such as parks, stadiums, convention centers, airports and other transportation hubs, shopping centers, and at special events. The program is intended to promote recycling by:
Encouraging development of a recycling infrastructure for away-from-home
collection
Increasing the amount of waste collected for recycling
Promoting a culture of recycling by making it convenient, available, and cost effective
The website, at http://www.epa.gov/epawaste/conserve/rrr/rogo/index.htm, includes
information on how to set up a program, success stories, and a resource center.
13. Public facility recycling collection programs. The ―Broward County Government Operations Climate Change Report‖ (2008), at http://www.broward.org/climatechange/broward_county_climate_change_report.htm, contains the following description of recycling activities under ―Current Greenhouse Gas Emission Reduction Actions‖:
a. Provide recycling services at Broward County offices, facilities, and parks. The governmental recycling program began in 1992 and it includes the majority of county office buildings, libraries and other facilities. Old cardboard and office paper comprise the majority of materials. Some sites have established bottle and can recovery systems and more recently a program was re-instituted to collect bottles and cans at county regional park sites – picnic areas, campgrounds, etc. Collection and processing costs ($250/ton) have increased significantly due to fuel costs and other factors. b. Provide recycling services at Broward County schools, offices, facilities, and community colleges. The recycling program was extended to all public schools and community colleges through the State Recycling Grants or more recently through interlocal agreements with the Broward County School Board and the Community

SOLID WASTE ELEMENT
Broward County Page 6-54 Comprehensive Plan
Volume 4, Support Documents Solid Waste Element
College Administration. Old cardboard and office paper comprise the majority of materials. Some sites have established bottle and can recovery systems. Collection and processing costs ($250/ton) have increased significantly due to fuel costs and other factors. c. Example of the Broward County Waste Reduction Program (paper reduction): Broward Metropolitan Planning Organization. Agenda packages for the Broward Metropolitan Planning Organization (MPO) were reduced from 120 to 85 in 2004 and from 85 to 55 more recently. The Broward MPO is a decision-making board of local elected officials, including some of the Broward County Board of County Commissioners, that meet approximately ten times per year. The average number of sheets of paper in an agenda package was estimated to be 95. Agenda packages for the Community Involvement Roundtable (CIR) were reduced from 55 to 35. The CIR is an advisory committee to the Broward MPO. The CIR meets approximately ten times per year. The average number of sheets of paper in an agenda package was estimated to be 95. Agenda packages for the Broward MPO Technical Coordinating Committee (TCC) were reduced from 95 to 80. The TCC is an advisory committee to the Broward MPO. The TCC meets approximately ten times per year. The average number of sheets of paper in an agenda package was estimated to be 95. d. Recycling at the Fort Lauderdale-Hollywood International Airport. The airport recycling program began in 1989, wherein an onsite facility, Airport Recycling Specialists (ARS), separates out the recyclables from the waste hauled from the terminal areas and airlines, as well as various on-site offices. Cardboard, plastic bottles and aluminum cans are separated, baled and marketed. Pallets and scrap metal are recycled when feasible. ARS recycles over 1,000 tons per year, which equates to over 30% recycling rate.
14. Affirmative procurement policies that stimulate recycling markets. The EPA WasteWise Program includes a Fact Sheet which provides answers to questions commonly asked on the WasteWise Helpline about buying recycled-content products. Entitled ―Buy –Recycled Questions and Answers‖, the fact sheet covers the following areas:
Why buy recycled products?
How do I start a buy-recycled program?
What resources are available to help develop a corporate policy statement to promote the purchase of recycled-content products?
How can I work with vendors to increase awareness of buy-recycled purchasing?
How can I educate my employees to increase awareness of buy-recycled purchasing?
How do recycled-content products perform?
Do recycled products cost more?
How can I find out about federal government recycled product procurement guidelines?
Can you provide a definition of post-consumer and recovered materials? See http://www.epa.gov/osw/partnerships/wastewise/wrr/buyq&a.htm for further information.

SOLID WASTE ELEMENT
Broward County Page 6-55 Comprehensive Plan
Volume 4, Support Documents Solid Waste Element
15. Reuse and pre-processing of Construction and Demolition material. According to the U.S. Environmental Protection Agency, throughout North America, hundreds of used building material stores sell materials for construction and renovation projects. Materials (such as used lumber and bricks) and other items (such as doors and windows) are salvaged mostly from remodeling projects, pre-demolition salvage, and the growing practice of deconstruction—the selective disassembly of buildings to reuse and recycle parts.
See http://www.epa.gov/osw/conserve/rrr/imr/cdm/reuse.htm for more information.
Under the City and County of San Francisco's Construction and Demolition (C&D) Ordinance, effective July 1, 2006, construction and demolition debris (such as wood, metal, concrete, asphalt, and sheetrock) taken off a site must go to a registered construction recycling facility and cannot go in a landfill. This mandatory ordinance maximizes the recycling of mixed construction and demolition debris and applies to all commercial and residential indoor and outdoor construction projects including repairs, improvements, additions, remodeling, and demolitions. The Ordinance requires that all mixed C&D debris, transported off site, must be hauled by a registered transporter. The Ordinance also requires that C&D debris be taken to a registered facility that can process mixed C&D debris and divert a minimum of 65 percent of the material from landfill.
16. Building Code requirements that facilitate recycling. The publication ―Building Savings: Strategies for Waste Reduction of Construction and Demolition Debris from Buildings‖ (EPA, 2000) documents seven exceptional examples of C&D waste reduction from construction, renovation, deconstruction, and demolition projects. Under a page entitled ―Some Questions and Answers‖ is the following:
Q: How can communities prevent buildings from being demolished without materials recovery? A: Some localities have incorporated materials recovery requirements as part of the permit process. Another option is to pass a local ordinance requiring recovery of C&D materials. For example, Portland, Oregon, passed an ordinance, effective January 1, 1996, requiring job-site recycling on all construction projects with a value exceeding $25,000. Localities could pass similar ordinances requiring recovery of demolition materials.
See http://www.epa.gov/osw/nonhaz/municipal/pubs/combined.pdf for further information.
17. Container deposit programs. The website www.bottlebill.org contains the
following definition:
The term ―bottle bill‖ is actually another way of saying ―container deposit law.‖ A container deposit law requires a minimum refundable deposit on beer, soft drink and other beverage containers in order to ensure a high rate of recycling or reuse.
SOLID WASTE ELEMENT
Broward County Page 6-56 Comprehensive Plan
Volume 4, Support Documents Solid Waste Element
The same website explains the process as follows:
When a retailer buys beverages from a distributor, a deposit is paid to the distributor for each can or bottle purchased. The consumer pays the deposit to the retailer when buying the beverage. When the consumer returns the empty beverage container to the retail store, to a redemption center, or to a reverse vending machine, the deposit is refunded. The retailer recoups the deposit from the distributor, plus an additional handling fee in most U.S. states. The handling fee, which generally ranges from 1-3 cents, helps cover the cost of handling the containers.
The costs to distributors and bottlers can be offset by the sale of scrap cans and bottles and by short-term investments made on the deposits that are collected from retailers. In addition to this income, distributors and bottlers realize windfall profits on beverage containers that consumers fail to return for the refund.
These "unclaimed" or "unredeemed" deposits remain the property of the distributors and bottlers in most states, and amount to millions of dollars a year. In Michigan and Massachusetts, the courts have ruled that because these unclaimed deposits are "abandoned" by the public, they rightfully belong to the state, and they are now used to fund environmental programs in those states. In Hawaii and California as well, the state collects all of the unredeemed deposits, which are then used to administer the deposit system. Bottlebill.org states that 11 states and 8 Canadian provinces currently have a deposit law requiring refundable deposits on certain beverage containers.
18. Monitoring of research regarding reuse of ash. The EPA web page on combustion of municipal solid waste, states the following: (see http://www.epa.gov/epawaste/nonhaz/municipal/combustion.htm)
Burning waste at extremely high temperatures also destroys chemical compounds and disease-causing bacteria. Regular testing ensures that residual ash is non-hazardous before being landfilled. About ten percent of the total ash formed in the combustion process is used for beneficial use such as daily cover in landfills and road construction.
V. IMPLEMENTATION. Because the underlying arrangement for the Broward Solid Waste Disposal District (the Interlocal Agreement, or ILA) is in the process of being rewritten, precise assignment of responsibility for all of the policies in this Element is difficult to forecast at this time. Even after a new ILA is executed, the Plan of Operations adopted by the District, and the annual programs and budgets adopted by the participating entities will have a significant impact on the type and degree of implementation of solid waste programs within Broward County. The table below indicates, for each policy or subpolicy in the element, which participant(s) are currently performing implementation, or which participant would have high potential to perform future implementation. This table in no sense commits Broward County, the municipalities, or the Solid Waste Disposal District to continue an existing program, or to initiate a new program. It is only intended as a guide for potential implementation strategies.

SOLID WASTE ELEMENT
Broward County Page 6-57 Comprehensive Plan
Volume 4, Support Documents Solid Waste Element
Table 6.15 Potential Implementation Responsibilities for Solid Waste Element Policies
Policy Number
Policy Subject
Current District function
Current County function
Current municipal function
Potential District function
Potential County function
Potential municipal function
Other
6.1.1(a) Mulching/composting X X
6.1.1(b) Product Stewardship X X 2
6.1.1(c) Reuse Network X X 2
6.1.1(d) Building design/demolition
X 1,4
6.1.1(e) HazMat reduction X
6.1.1(f) Environ. Preferable Purchasing
X X
6.1.1(g) Waste reduction at public agencies
X X
6.1.1(h) Waste reduction education
X
6.1.2(a) Residential recycling X X
6.1.2(b) Single stream recycling
X X
6.1.2(c) Roll-out carts/ incentives
X X
6.1.2(d) Pay As You Throw X X
6.1.2(e) Green waste/yard waste
X X
6.1.2(f) MF & commercial recycling
X X
6.1.2(g) Food and beverage container recycling
X X 2
6.1.2(h) Public place recycling
X X X 2
6.1.2(i) Public facility recycling programs
X X
6.1.2(j) Affirmative procurement policies
X X
6.1.2(k) Electronics recycling X
6.1.2(l) HHW recycling X
6.1.2(m) Recycled glass beach renourishment
X X
6.1.2(n) C&D reuse and pre-preprocessing
X X X 2
6.1.2(o) Building Code requirements
X 1
6.1.2(p) Container deposit programs
X X 4
6.1.2(q) Monitoring research on reuse of ash
X 2
6.1.2(r) Outreach programs X X X
6.1.2(s) Recycling education X X
6.1.2(t) Encourage reclamation industries in county
X X 3
6.1.3(a) All processable waste to W-T-E plant
X X
6.1.3(b) Processable waste not at landfills
X

SOLID WASTE ELEMENT
Broward County Page 6-58 Comprehensive Plan
Volume 4, Support Documents Solid Waste Element
Policy Number
Policy Subject
Current District function
Current County function
Current municipal function
Potential District function
Potential County function
Potential municipal function
Other
6.1.3(c) Encourage State and Federal legislation
X X
6.2.1 License and regulate to protect from contamination
X 4
6.2.2 Siting new facilities and expansions
X X 4
6.2.3 Monitor landfills X 4
6.2.4 Monitor W-T-E plants
X 4
6.2.5 HHW collection program
X
6.2.6 Storage Tanks X
6.2.7 Wellfield Protection X
6.2.8 Trash transfer stations
X X X
6.2.9 Littering & dumping X X
6.2.10 Envir. evaluation at plan review
X
6.2.11 Long-haul transport impact on climate change
X X
6.2.12 Remediation programs
X
6.3.1 Waste generation rates
X
6.3.2 Adequacy finding in development review process
X
6.3.3 Design and permitting of additional WTE capacity
X 4
6.3.4 Design and permitting of additional landfill capacity
X X
6.3.5 Annual review of demand and capacity for disposal facilities
X X
6.3.6 Monitor adequacy of other facilities
X X
6.3.7(a) Prohibit outside use of County-owned landfills
X
6.3.7(b) District gets capacity priority at W-T-E plants
X
6.3.7(c) Discourage outside waste at private landfills
X
6.3.7(d) Monitor landfill reduction technology
X

SOLID WASTE ELEMENT
Broward County Page 6-59 Comprehensive Plan
Volume 4, Support Documents Solid Waste Element
Policy Number
Policy Subject
Current District function
Current County function
Current municipal function
Potential District function
Potential County function
Potential municipal function
Other
6.4.1 Support participation in District
X X
6.4.2 Debris Management Plan
X X X
6.4.3 Minimize impacts on adjacent land uses
X X
6.4.4 Enforcement for flow control
X X X
6.4.5 Long Term Facilities Plan
X
6.4.6 Monitor alternative technologies
X
6.4.7 Post closure landfill planning
X X 2
Key to ―Other‖: 1 – Board of Rules and Appeals. 2 – Private sector organization. 3 – Broward Alliance. 4- State agency Note: Functions marked as ―Current‖ are presumed to continue, unless otherwise indicated.

SOLID WASTE ELEMENT
Broward County Page 6-60 Comprehensive Plan
Volume 4, Support Documents Solid Waste Element
APPENDIX A - Analysis of Scenarios for Municipal Solid Waste Projections
SCENARIO A1 ASSUMPTIONS: 1. Generation rate reduced from 1.89 (2010) to 1.87 (2015) to 1.80 (2030) [5% reduction]
2. Maintain current participation rate for W-T-E to 2015, add 10% by 2030. 3.. Achieve State recycling goal of 75% (including 31% net W-T-E) by 2030. Projections of Municipal Solid Waste Generated in Broward County (waste amounts are tons/year)
Population Gen. Rate
Total Annual MSW
[Net] Waste-to- Energy
%
Landfill
%
Recycling
%
Comments
2010 1,772,060 1.89 3,349,193 803,807 24% 1,708,088 51% 837,298 25% Current distribution
Adjust for increased recycling to 31%
3,349,193 703,331 21% 1,607,612 48% 1,038,250 31% Shift split evenly between landfill and waste-to-energy
2015 1,876,261 1.87 3,508,608 736,808 21% 1,684,132 48% 1,087,668 31% MSW increase of 4.8% over 2010
Adjust for more cities using W-T-E
3,508,608 1,087,668 31% 1,333,272 38% 1,087,668 31% Shift of 10% of total MSW from landfill to WTE
Adjust for increased recycling to 44%
3,508,608 1,087,668 31% 877,153 25% 1,543,787 44% Shift of 13% of total MSW from landfill to recycling
2030 2,214,420 1.80 3,985,956 1,235,646 31% 996,489 25% 1,753,821 44% MSW Increase of 13.6% over 2015.

SOLID WASTE ELEMENT
Broward County Page 6-61 Comprehensive Plan
Volume 4, Support Documents Solid Waste Element
SCENARIO A2 ASSUMPTIONS: 1. Generation rate reduced from 1.89 (2010) to 1.87 (2015) to 1.80 (2030) [5% reduction]
2. Add 10% to W-T-E participation rate by 2015. 3. Achieve State recycling goal of 75% (including 31% net W-T-E) by 2030. Projections of Municipal Solid Waste Generated in Broward County (waste amounts are tons/year)
Population Gen. Rate
Total Annual MSW
[Net] Waste-to- Energy
%
Landfill
%
Recycling
%
Comments
2010 1,772,060 1.89 3,349,193 803,807 24% 1,708,088 51% 837,298 25% Current distribution
Adjust for more cities using W-T-E
3,349,193 1,138,726 34% 1,373,169 41% 837,298 25% Shift of 10% of total MSW from landfill to WTE
Adjust for increased recycling to 31%
3,349,193 1,038,250 31% 1,272,693 38% 1,038,250 31% Shift split evenly between landfill and waste-to-energy
2015 1,876,261 1.87 3,508,608 1,087,668 31% 1,333,272 38% 1,087,668 31% MSW increase of 4.8% over 2010
Adjust for increased recycling to 44%
3,508,608 1,087,668 31% 877,153 25% 1,543,787 44% Shift of 13% of total MSW from landfill to recycling
2030 2,214,420 1.80 3,985,956 1,235,646 31% 996,489 25% 1,753,821 44% MSW Increase of 13.6% over 2015.

SOLID WASTE ELEMENT
Broward County Page 6-62 Comprehensive Plan
Volume 4, Support Documents Solid Waste Element
Scenario B-1 ASSUMPTIONS: 1. Generation rate reduced from 1.89 (2010) to 1.84 (2015) to 1.70 (2030) [10% reduction]
2. Maintain current participation rate for W-T-E to 2015, add 10% by 2030. 3. Achieve State recycling goal of 75% (including 31% net W-T-E) by 2030. Projections of Municipal Solid Waste Generated in Broward County (waste amounts are tons/year)
Population
Gen. Rate
Total Annual MSW
[Net] Waste-to- Energy
%
Landfill
%
Recycling
%
Comments
2010 1,772,060 1.89 3,349,193 803,807 24% 1,708,088 51% 837,298 25% Current distribution
Adjust for increased recycling to 31%
3,349,193 703,331 21% 1,607,612 48% 1,038,250 31% Shift split evenly between landfill and waste-to-energy
2015 1,876,261 1.84 3,452,320 724,987 21% 1,657,114 48% 1,070,219 31% MSW increase of 3.1% over 2010
Adjust for more cities using W-T-E
3,452,320 1,070,219 31% 1,311,882 38% 1,070,219 31% Shift of 10% of total MSW from landfill to WTE
Adjust for increased recycling to 44%
3,452,320 1,070,219 31% 863,080 25% 1,519,021 44% Shift of 13% of total MSW from landfill to recycling
2030 2,214,420 1.70 3,764,514 1,167,000 31% 941,128 25% 1,656,386 44% MSW Increase of 9.0% over 2015.

SOLID WASTE ELEMENT
Broward County Page 6-63 Comprehensive Plan
Volume 4, Support Documents Solid Waste Element
Scenario B-2 ASSUMPTIONS: 1. Generation rate reduced from 1.89 (2010) to 1.84 (2015) to 1.70 (2030) [10% reduction]
2. Add 10% to W-T-E participation rate by 2015. 3. Achieve State recycling goal of 75% (including 31% net W-T-E) by 2030. Projections of Municipal Solid Waste Generated in Broward County (waste amounts are tons/year)
Population
Gen. Rate
Total Annual MSW
[Net] Waste-to- Energy
%
Landfill
%
Recycling
%
Comments
2010 1,772,060 1.89 3,349,193 803,807 24% 1,708,088 51% 837,298 25% Current distribution
Adjust for more cities using W-T-E
3,349,193 1,138,726 34% 1,373,169 41% 837,298 25% Shift of 10% of total MSW from landfill to WTE
Adjust for increased recycling to 31%
3,349,193 1,038,250 31% 1,272,693 38% 1,038,250 31% Shift split evenly between landfill and waste-to-energy
2015 1,876,261 1.84 3,452,320 1,070,219 31% 1,311,882 38% 1,070,219 31% MSW increase of 3.1% over 2010
Adjust for increased recycling to 44%
3,452,320 1,070,219 31% 863,080 25% 1,519,021 44% Shift of 13% of total MSW from landfill to recycling
2030 2,214,420 1.70 3,764,514 1,167,000 31% 941,128 25% 1,656,386 44% MSW Increase of 9.0% over 2015.

SOLID WASTE ELEMENT
Broward County Page 6-64 Comprehensive Plan
Volume 4, Support Documents Solid Waste Element
Scenario C1 ASSUMPTIONS: 1. Generation rate reduced from 1.89 (2010) to 1.87 (2015) to 1.80 (2030) [5% reduction]
2. Maintain current participation rate for W-T-E to 2015, add 10% by 2030. 3. Achieve State recycling goal of 75% (including 25% net W-T-E) by 2030. Projections of Municipal Solid Waste Generated in Broward County (waste amounts are tons/year)
Population
Gen. Rate
Total Annual
MSW
[Net] Waste-to- Energy
%
Landfill
%
Recycling
%
Comments
2010 1,772,060 1.89 3,349,193 803,807 24% 1,708,088 51% 837,298 25% Current distribution
Adjust for increased recycling to 31%
3,349,193 703,331 21% 1,607,612 48% 1,038,250 31% Shift split evenly between landfill and waste-to-energy
2015 1,876,261 1.87 3,508,608 736,808 21% 1,684,132 48% 1,087,668 31% MSW increase of 4.8% over 2010
Adjust for more cities using W-T-E
3,508,608 1,087,668 31% 1,333,272 38% 1,087,668 31% Shift of 10% of total MSW from landfill to WTE
Adjust for increased recycling to 50%
3,508,608 877,152 25% 877,152 25% 1,754,304 50% Shift of 19% of from landfill and 6% from W-T-E.
2030 2,214,420 1.80 3,985,956 996,489 25% 996,489 25% 1,992,978 50% MSW Increase of 13.6% over 2015.

SOLID WASTE ELEMENT
Broward County Page 6-65 Comprehensive Plan
Volume 4, Support Documents Solid Waste Element
Scenario C2 ASSUMPTIONS: 1. Generation rate reduced from 1.89 (2010) to 1.87 (2015) to 1.80 (2030) [5% reduction]
2. Add 10% to W-T-E participation rate by 2015. 3. Achieve State recycling goal of 75% (including 25% net W-T-E) by 2030. Projections of Municipal Solid Waste Generated in Broward County (waste amounts are tons/year)
Population
Gen. Rate
Total Annual
MSW
[Net] Waste-to- Energy
%
Landfill
%
Recycling
%
Comments
2010 1,772,060 1.89 3,349,193 803,807 24% 1,708,088 51% 837,298 25% Current distribution
Adjust for more cities using W-T-E
3,349,193 1,138,726 34% 1,373,169 41% 837,298 25% Shift of 10% of total MSW from landfill to WTE
Adjust for increased recycling to 31%
3,349,193 1,038,250 31% 1,272,693 38% 1,038,250 31% Shift split evenly between landfill and waste-to-energy
2015 1,876,261 1.87 3,508,608 1,087,668 31% 1,333,271 38% 1,087,668 31% MSW increase of 4.8% over 2010
Adjust for increased recycling to 50%
3,508,608 877,152 25% 877,152 25% 1,754,304 50% Shift of 13% from landfill and 6% from W-T-E.
2030 2,214,420 1.80 3,985,956 996,489 25% 996,489 25% 1,992,978 50% MSW Increase of 13.6% over 2015.

SOLID WASTE ELEMENT
Broward County Page 6-66 Comprehensive Plan
Volume 4, Support Documents Solid Waste Element
Scenario D1 ASSUMPTIONS: 1. Generation rate reduced from 1.89 (2010) to 1.84 (2015) to 1.70 (2030) [10% reduction]
2. Maintain current participation rate for W-T-E to 2015, add 10% by 2030. 3. Achieve State recycling goal of 75% (including 25 % net W-T-E) by 2030. Projections of Municipal Solid Waste Generated in Broward County (waste amounts are tons/year)
Population Gen. Rate
Total Annual MSW
[Net] Waste-to- Energy
%
Landfill
%
Recycling
%
Comments
2010 1,772,060 1.89 3,349,193 803,807 24% 1,708,088 51% 837,298 25% Current distribution
Adjust for increased recycling to 31%
3,349,193 703,331 21% 1,607,612 48% 1,038,250 31% Shift split evenly between landfill and waste-to-energy
2015 1,876,261 1.84 3,452,320 724,987 21% 1,657,114 48% 1,070,219 31% MSW increase of 3.1% over 2010
Adjust for more cities using W-T-E
3,452,320 1,070,219 31% 1,311,882 38% 1,070,219 31% Shift of 10% of total MSW from landfill to WTE
Adjust for increased recycling to 50%
3,452,320 863,080 25% 863,080 25% 1,726,160 50% Shift of 19% of from landfill and 6% from W-T-E.
2030 2,214,420 1.70 3,764,514 941,129 25% 941,128 25% 1,882,257 50% MSW Increase of 9.0% over 2015.

SOLID WASTE ELEMENT
Broward County Page 6-67 Comprehensive Plan
Volume 4, Support Documents Solid Waste Element
Scenario D2 ASSUMPTIONS: 1. Generation rate reduced from 1.89 (2010) to 1.84 (2015) to 1.70 (2030) [10% reduction]
2. Add 10% to W-T-E participation rate by 2015. 3. Achieve State recycling goal of 75% (including 25 % net W-T-E) by 2030.
Projections of Municipal Solid Waste Generated in Broward County (waste amounts are tons/year)
Population
Gen. Rate
Total Annual
MSW
[Net] Waste-to- Energy
%
Landfill
%
Recycling
%
Comments
2010 1,772,060 1.89 3,349,193 803,807 24% 1,708,088 51% 837,298 25% Current distribution
Adjust for more cities using W-T-E
3,349,193 1,138,726 34% 1,373,169 41% 837,298 25% Shift of 10% of total MSW from landfill to WTE
Adjust for increased recycling to 31%
3,349,193 1,038,250 31% 1,272,693 38% 1,038,250 31% Shift split evenly between landfill and waste-to-energy
2015 1,876,261 1.84 3,452,320 1,070,219 31% 1,311,882 38% 1,070,219 31% MSW increase of 3.1% over 2010
Adjust for increased recycling to 50%
3,452,320 863,080 25% 863,080 25% 1,726,160 50% Shift of 13% from landfill and 6% from W-T-E.
2030 2,214,420 1.70 3,764,514 941,129 25% 941,128 25% 1,882,257 50% MSW Increase of 9.0% over 2015.

SOLID WASTE ELEMENT
Broward County Page 6-68 Comprehensive Plan
Volume 4, Support Documents Solid Waste Element
Scenario E1 ASSUMPTIONS: 1. No reduction in generation rate. 2. Add 10% to W-T-E participation rate by 2030. 3. Achieve State recycling goal of 75% (including 25% net W-T-E) by 2030.
Projections of Municipal Solid Waste Generated in Broward County (waste amounts are tons/year)
Population
Gen. Rate
Total Annual MSW
[Net] Waste-to-Energy
%
Landfill
%
Recycling
%
Comments
2010 1,772,060 1.89 3,349,193 803,807 24% 1,708,088 51% 837,298 25% Current distribution
Adjust for increased recycling to 31%
3,349,193 703,331 21% 1,607,612 48% 1,038,250 31% Shift split evenly between landfill and waste-to-energy
2015 1,876,261 1.89 3,546,133 744,688 21% 1,702,144 48% 1,099,301 31% MSW increase of 5.9% over 2010
Adjust for more cities using W-T-E
3,546,133 1,099,301 31% 1,347,531 38% 1,099,301 31% Shift of 10% of total MSW from landfill to WTE
Adjust for increased recycling to 50%
3,546,133 886,533 25% 886,533 25% 1,773,066 50% Shift of 13% from landfill and 6% from W-T-E
2030 2,214,420 1.89 4,185,254 1,046,314 25% 1,046,313 25% 2,092,627 50% MSW increase of 18.0% over 2015

SOLID WASTE ELEMENT
Broward County Page 6-69 Comprehensive Plan
Volume 4, Support Documents Solid Waste Element
Scenario E2 ASSUMPTIONS: 1. No reduction in generation rate. 2. Add 10% to W-T-E participation rate by 2015. 3. Achieve State recycling goal of 75% (including 25% net W-T-E) by 2030. Projections of Municipal Solid Waste Generated in Broward County (waste amounts are tons/year)
Population
Gen. Rate
Total Annual MSW
[Net] Waste-to-
Energy
%
Landfill
%
Recycling
%
Comments
2010 1,772,060 1.89 3,349,193 803,807 24% 1,708,088 51% 837,298 25% Current distribution
Adjust for more cities using W-T-E
3,349,193 1,138,726 34% 1,373,169 41% 837,298 25% Shift of 10% of total; MSW from landfill to WTE
Adjust for increased recycling to 31%
3,349,193 1,038,250 31% 1,272,693 38% 1,038,250 31% Shift split evenly between landfill and W-T-E
2015 1,876,261 1.89 3,546,133 1,099,301 31% 1,347,531 38% 1.099.301 31% MSW increase of 5.9% over 2010
Adjust for increased recycling to 50%
3,546,133 886,533 25% 886,533 25% 1,773,066 50% Shift of 13% from landfill and 6% from W-T-E
2030 2,214,420 1.89 4,185,254 1,046,314 25% 1,046,313 25% 2,092,627 50% MSW increase of 18.0% over 2015

SOLID WASTE ELEMENT
Broward County Page 6-70 Comprehensive Plan
Volume 4, Support Documents Solid Waste Element
Scenario F1 ASSUMPTIONS: 1. No reduction in generation rate. 2. Add 10% to W-T-E participation rate after 2015. 3. Achieve State recycling goal of 75% (including 31% net W-T-E) by 2030. Projections of Municipal Solid Waste Generated in Broward County (waste amounts are tons/year)
Population
Gen. Rate
Total Annual MSW
[Net] Waste-to-
Energy
%
Landfill
%
Recycling
%
Comments
2010 1,772,060 1.89 3,349,193 803,807 24% 1,708,088 51% 837,298 25% Current distribution
Adjust for increased recycling to 31%
3,349,193 703,331 21% 1,607,612 48% 1,038,250 31% Shift split evenly between landfill and W-T-E
2015 1,876,261 1.89 3,546,133 744,688 21% 1,702,144 48% 1.099.301 31% MSW increase of 5.9% over 2010
Adjust for more cities using WTE
3,546,133 1,099,301 31% 1,347,531 38% 1,099,301 31% Shift of 10% of total MSW from landfill to WTE
Adjust for increased recycling to 50%
3,546,133 1,099,301 31% 886,533 25% 1,560,299 44% Shift of 13% of total MSW from landfill to recycling.
2030 2,214,420 1.89 4,185,254 1,297,428 31% 1,046,313 25% 1,841,513 44% MSW increase of 18.0% over 2015

SOLID WASTE ELEMENT
Broward County Page 6-71 Comprehensive Plan
Volume 4, Support Documents Solid Waste Element
Scenario F2 ASSUMPTIONS: 1. No reduction in generation rate. 2. Add 10% to W-T-E participation rate by 2015. 3. Achieve State recycling goal of 75% (including 31% net W-T-E) by 2030. Projections of Municipal Solid Waste Generated in Broward County (waste amounts are tons/year)
Population
Gen. Rate
Total Annual MSW
[Net] Waste-to-
Energy
%
Landfill
%
Recycling
%
Comments
2010 1,772,060 1.89 3,349,193 803,807 24% 1,708,088 51% 837,298 25% Current distribution
Adjust for more cities using W-T-E
3,349,193 1,138,726 34% 1,373,169 41% 837,298 25% Shift of 10% of total; MSW from landfill to WTE
Adjust for increased recycling to 31%
3,349,193 1,038,250 31% 1,272,693 38% 1,038,250 31% Shift split evenly between landfill and W-T-E
2015 1,876,261 1.89 3,546,133 1,099,301 31% 1,347,531 38% 1,099.301 31% MSW increase of 5.9% over 2010
Adjust for increased recycling to 50%
3,546,133 1,099,301 31% 886,533 25% 1,560,299 44% Shift of 13% of total MSW from landfill to recycling.
2030 2,214,420 1.89 4,185,254 1,297,428 31% 1,046,313 25% 1,841,513 44% MSW increase of 18.0% over 2015

SOLID WASTE ELEMENT
Broward County Page 6-72 Comprehensive Plan
Volume 4, Support Documents Solid Waste Element
APPENDIX B - Analysis of Scenarios for Remaining Waste-to-Energy Capacity
Although FDEP uses net tonnage at the County’s Waste to Energy plants, for reporting on the disposition of Municipal Solid Waste, the gross tonnage should be used for a capacity analysis. The total design capacity of the two plants is 1.6 million tons annually. According to Broward County Waste and Recycling Services, the 2007 gross combusted tonnage for the Waste to Energy facilities was 1,191,972. Subtracted from this total were 372,987 tons of LF combustor ash, and 10,734 tons of recovered metals, for a net combusted total of 808,251 tons. This data produces a factor of 1.47, to convert net combusted to gross combusted. The table below shows under which scenarios these plants are at or over capacity, for 2015 and for 2030.
Scenario Net WTE
tonnage in 2015
Gross WTE tonnage in
2015
At or over capacity in
2015?
Net WTE tonnage in
2030
Gross WTE tonnage in
2030
At or over capacity in
2030?
A1 736,808 1,083,108 No 1,235,646 1,816,400 Yes*
A2 1,087,668 1,598,872 Yes 1,235,646 1,816,400 Yes*
B1 724,987 1,065,731 No 1,167,000 1,715,490 Yes
B2 1,070,219 1,573,222 Yes 1,167,000 1,715,490 Yes
C1 736,808 1,083,108 No 996,489 1,464,839 No
C2 1,087,668 1,598,872 Yes 996,489 1,464,839 No
D1 724,987 1,065,731 No 941,129 1,383,457 No
D2 1,070,219 1,573,222 Yes 941,129 1,383,457 No
E1 744,688 1,094,691 No 1,046,314 1,538,081 No
E2 1,099,301 1,615,972 Yes 1,046,314 1,538,081 No
F1 744,668 1.094,691 No 1,297,428 1,907,219 Yes*
F2 1,099,301 1,615,972 Yes 1,297,428 1,907,219 Yes* * Gross WTE tonnage greater than 1.8 million would require expansion of both plants, or equivalent capacity elsewhere.

SOLID WASTE ELEMENT
Broward County Page 6-73 Comprehensive Plan
Volume 4, Support Documents Solid Waste Element
APPENDIX C - Analysis of Scenarios for Remaining Landfill Capacity
Remaining CDSL Capacity – Scenarios A1 & C1
Year MSW from Broward (million tons per year)
From outside of Broward (million tons per year)
Non-MSW from Broward (million tons per year)
Remaining Capacity (million tons per year)
2008 23.6
2009 1.41 0.31 0.25 21.63
2010 1.41 0.32 0.25 19.65
2011 1.40 0.32 0.25 17.68
2012 1.40 0.32 0.26 15.70
2013 1.39 0.33 0.26 13.72
2014 1.39 0.33 0.26 11.74
2015 1.38 0.33 0.26 9.77
2016 1.34 0.34 0.27 7.82
2017 1.29 0.34 0.27 5.92
2018 1.25 0.34 0.27 4.06
2019 1.20 0.35 0.28 2.23
2020 1.16 0.35 0.28 0.44
2021 1.11 0.35 0.28
2022 1.07 0.36 0.28
2023 1.02 0.36 0.29
2024 0.98 0.36 0.29
2025 0.93 0.37 0.29
2026 0.89 0.37 0.30
2027 0.84 0.37 0.30
2028 0.80 0.38 0.30
2029 0.75 0.38 0.30
2030 0.70 0.39 0.31

SOLID WASTE ELEMENT
Broward County Page 6-74 Comprehensive Plan
Volume 4, Support Documents Solid Waste Element
Remaining CDSL Capacity – Scenarios A2 & C2
Year MSW from Broward (million tons per year)
From outside of Broward (million tons per year)
Non-MSW from Broward (million tons per year)
Remaining Capacity (million tons per year)
2008 23.6
2009 1.41 0.31 0.25 21.63
2010 1.41 0.32 0.25 19.65
2011 1.33 0.32 0.25 17.75
2012 1.26 0.32 0.26 15.92
2013 1.18 0.33 0.26 14.15
2014 1.11 0.33 0.26 12.45
2015 1.03 0.33 0.26 10.83
2016 1.01 0.34 0.27 9.21
2017 0.99 0.34 0.27 7.61
2018 0.97 0.34 0.27 6.03
2019 0.94 0.35 0.28 4.46
2020 0.92 0.35 0.28 2.91
2021 0.90 0.35 0.28 1.38
2022 0.88 0.36 0.28
2023 0.85 0.36 0.29
2024 0.83 0.36 0.29
2025 0.81 0.37 0.29
2026 0.79 0.37 0.30
2027 0.76 0.37 0.30
2028 0.74 0.38 0.30
2029 0.72 0.38 0.30
2030 0.70 0.39 0.31

SOLID WASTE ELEMENT
Broward County Page 6-75 Comprehensive Plan
Volume 4, Support Documents Solid Waste Element
Remaining CDSL Capacity – Scenarios B1 & D1
Year
MSW from Broward (million tons per year)
From outside of Broward (million tons per year)
Non-MSW from Broward (million tons per year)
Remaining Capacity (million tons per year)
2008 23.6
2009 1.41 0.31 0.25 21.63
2010 1.41 0.32 0.25 19.65
2011 1.40 0.32 0.25 17.68
2012 1.39 0.32 0.26 15.71
2013 1.38 0.33 0.26 13.74
2014 1.37 0.33 0.26 11.78
2015 1.36 0.33 0.26 9.83
2016 1.31 0.34 0.27 7.91
2017 1.26 0.34 0.27 6.04
2018 1.21 0.34 0.27 4.22
2019 1.16 0.35 0.28 2.43
2020 1.11 0.35 0.28 0.69
2021 1.06 0.35 0.28
2022 1.02 0.36 0.28
2023 0.97 0.36 0.29
2024 0.92 0.36 0.29
2025 0.87 0.37 0.29
2026 0.83 0.37 0.30
2027 0.78 0.37 0.30
2028 0.73 0.38 0.30
2029 0.68 0.38 0.30
2030 0.64 0.39 0.31

SOLID WASTE ELEMENT
Broward County Page 6-76 Comprehensive Plan
Volume 4, Support Documents Solid Waste Element
Remaining CDSL Capacity – Scenarios B2 & D2
Year MSW from Broward (million tons per year)
From outside of Broward (million tons per year)
Non-MSW from Broward (million tons per year)
Remaining Capacity (million tons per year)
2008 23.6
2009 1.41 0.31 0.25 21.63
2010 1.41 0.32 0.25 19.69
2011 1.33 0.32 0.25 17.75
2012 1.25 0.32 0.26 15.92
2013 1.17 0.33 0.26 14.16
2014 1.09 0.33 0.26 12.48
2015 1.01 0.33 0.26 10.88
2016 0.98 0.34 0.27 9.29
2017 0.96 0.34 0.27 7.72
2018 0.93 0.34 0.27 6.18
2019 0.91 0.35 0.28 4.64
2020 0.88 0.35 0.28 3.13
2021 0.86 0.35 0.28 1.64
2022 0.83 0.36 0.28 0.17
2023 0.81 0.36 0.29
2024 0.78 0.36 0.29
2025 0.76 0.37 0.29
2026 0.73 0.37 0.30
2027 0.71 0.37 0.30
2028 0.68 0.38 0.30
2029 0.66 0.38 0.30
2030 0.64 0.39 0.31

SOLID WASTE ELEMENT
Broward County Page 6-77 Comprehensive Plan
Volume 4, Support Documents Solid Waste Element
Remaining CDSL Capacity – Scenario E1 & F1
Year MSW from Broward (million tons per year)
From outside of Broward (million tons per year)
Non-MSW from Broward (million tons per year)
Remaining Capacity (million tons per year)
2008 23.6
2009 1.41 0.31 0.25 21.63
2010 1.41 0.32 0.25 19.65
2011 1.41 0.32 0.25 17.67
2012 1.40 0.32 0.26 15.69
2013 1.40 0.33 0.26 13.70
2014 1.40 0.33 0.26 11.71
2015 1.40 0.33 0.26 9.72
2016 1.36 0.34 0.27 7.75
2017 1.31 0.34 0.27 5.83
2018 1.27 0.34 0.27 3.95
2019 1.22 0.35 0.28 2.10
2020 1.18 0.35 0.28 0.29
2021 1.13 0.35 0.28
2022 1.09 0.36 0.28
2023 1.04 0.36 0.29
2024 1.00 0.36 0.29
2025 1.95 0.37 0.29
2026 0.91 0.37 0.30
2027 0.86 0.37 0.30
2028 0.82 0.38 0.30
2029 0.78 0.38 0.30
2030 0.75 0.39 0.31

SOLID WASTE ELEMENT
Broward County Page 6-78 Comprehensive Plan
Volume 4, Support Documents Solid Waste Element
Remaining CDSL Capacity – Scenario E2 & F2
Year
MSW from Broward (million tons per year)
From outside of Broward (million tons per year)
Non-MSW from Broward (million tons per year)
Remaining Capacity (million tons per year)
2008 23.6
2009 1.41 0.31 0.25 21.63
2010 1.41 0.32 0.25 19.65
2011 1.36 0.32 0.25 17.72
2012 1.31 0.32 0.26 15.83
2013 1.25 0.33 0.26 13.99
2014 1.20 0.33 0.26 12.20
2015 1.15 0.33 0.26 10.46
2016 1.12 0.34 0.27 8.73
2017 1.09 0.34 0.27 7.03
2018 1.07 0.34 0.27 5.35
2019 1.04 0.35 0.28 3.68
2020 1.01 0.35 0.28 2.04
2021 0.98 0.35 0.28 0.43
2022 0.95 0.36 0.28
2023 0.92 0.36 0.29
2024 0.89 0.36 0.29
2025 0.86 0.37 0.29
2026 0.83 0.37 0.30
2027 0.82 0.37 0.30
2028 0.79 0.38 0.30
2029 0.77 0.38 0.30
2030 0.75 0.39 0.31

SOLID WASTE ELEMENT
Broward County Page 6-79 Comprehensive Plan
Volume 4, Support Documents Solid Waste Element
APPENDIX D – Proposed Memorandum of Understanding
MEMORANDUM OF UNDERSTANDING This Memorandum of Understanding (M.O.U.) dated this 1st day of September, 2009 is among Broward County (County), Broward Solid Waste Disposal District, a dependent special district of Broward County (District) and Wheelabrator South Broward Inc. and Wheelabrator North Broward Inc. (both hereinafter Wheelabrator). This M.O.U. reflects the material terms agreed to and negotiated by their respective staffs and forms the basis of an amended Service Agreement which will replace the Service Agreements between Broward County and Wheelabrator; and all amended versions of same along with amendments thereto (the Agreements). The Service Agreement shall include the following material terms: 1).The term shall be ten years from August 4, 2011, with a 10 year extension by mutual agreement. 2). The County, the District and the communities that are parties to the new interlocal agreement with the District will maintain the current flow control ordinances and system. The District, the County and the participating communities will agree to deliver all acceptable waste generated within the system, consistent with present practice (including the present exception for waste destined for out of state disposal) to the Wheelabrator Broward waste to energy facilities, but will not guarantee to deliver any minimum number of tons, provided the flow control ordinances remain in effect. If the flow control ordinances are no longer in effect then the District and the participating communities shall guarantee to deliver a minimum number of tons based on the historical deliveries of solid waste to the Wheelabrator facilities by such communities, as adjusted to reflect changes in law. 3). The County, the District and all participating contract communities agree to use best efforts to enforce the ordinances described in paragraph 2) above. 4). Wheelabrator will accept all waste generated in the system up to the present capacity at both the North and South plants. Wheelabrator and the District will mutually agree on how much waste is delivered to each plant. 5). Wheelabrator will have the right to accept waste -from any party other than the District provided (a) Wheelabrator shall divert such waste from the plants if necessary in order to accept District waste in accordance with paragraph 4 and (b) Wheelabrator shall not charge any non-District municipality-located within the County a service fee less than the service fee charged to the District. 6). Wheelabrator shall charge the District a service fee of $49.75 a ton for each ton tipped at the North or South Plant. The service fee will escalate annually via a CPI/PPI index as described in Addendum A attached hereto. The service fee shall escalate annually by such index up to a maximum of 5% per year but no less than 1% per year. The first CPI/PPI adjustment shall take

SOLID WASTE ELEMENT
Broward County Page 6-80 Comprehensive Plan
Volume 4, Support Documents Solid Waste Element
place on January 1, 2011, based upon the change in CPI/PPI from October, 2009 to January, 2011. 7). Property, real estate, sales taxes and all other non-income taxes shall be a direct pass through expense to the District. In the event of any inability to pass through such taxes to the District the service fee shall be adjusted to reflect the portion of such taxes that Wheelabrator cannot pass through to the District or the District shall otherwise compensate Wheelabrator, in a manner reasonably satisfactory to Wheelabrator, for the financial impact to Wheelabrator of such event . Neither party shall be required to provide representations or warranties as to the enforceability of the pass through provision. 8).The service fee shall be adjusted for new capital costs, increased operating and maintenance costs or reduced revenues of Wheelabrator due to a change in law occurring after the date of the new service agreement. If Wheelabrator realizes any cost savings due to a change in law, the service fee shall be adjusted to reflect such savings. The adjustment to the service fee shall reflect a pro rata portion of such increased costs, reduced revenues or cost savings based on a fraction (a) the numerator of which is the average number of tons that the District delivered to the North and South facilities during the! year period prior to the date the change in law occurred and (b) the denominator of which is the total capacity of such facilities. If the service fee increases by more than 40% from the prior year's service fee due to a change in law, the District may terminate the Service Agreement. If Wheelabrator has additional costs or reduced revenues due to a change in law that are not reimbursed by the District and such costs or revenue reductions are greater than 40% of the prior year's service fee, then Wheelabrator may terminate the service agreement. 9). Wheelabrator shall pay rent for the South waste to energy plant site at the rate of $1,000,000.00 pursuant to an amendment to the present site lease for the South facility. Rent shall escalate yearly, subject to the same CPI/PPI adjustment as provided for in the service fee adjustment, with a minimum of 1% and a maximum of 5%. The first CPI adjustment shall be on January 1, 2011, based upon the change in CPI from October, 2009 to January, 2011. The District shall pay Wheelabrator all costs with respect to the real property located at the South site (excluding the plant), including without limitation, all capital and operating costs of the ash monofill, that the County was obligated to pay during the initial term of the agreements with Wheelabrator that are presently in effect for the South plant; provided, however, any costs or credits for changes of law shall be determined pursuant to the formula in the previous paragraph. 10).The provision in the current Agreements that provides the County and/ or District disposal rights at the facilities at a discount to third party disposal prices if the Agreements are not renewed shall be deleted. 11). The District shall propose to reduce the tipping fees it charges participating contract communities to no more than $12 a ton above the amount Wheelabrator charges the District. 12).The service agreement contemplated pursuant to this M.O.U. shall have an effective date of August 4, 2011. The service fee contemplated herein shall take effect on August 4, 2011 for all District waste delivered to both plants.

SOLID WASTE ELEMENT
Broward County Page 6-81 Comprehensive Plan
Volume 4, Support Documents Solid Waste Element
The District shall pay to Wheelabrator within 60 days from April 1, 2012 an amount equal to (a) the difference between the service fee for the period ended March 22, 2012 under the existing North=site service agreement, and the service fee under the new service agreement (drafted pursuant to this M.O.U.) multiplied by (b) the actual deliveries by the District to the North facility during the period from August 4, 2011 to March 22, 2012. The District shall continue to make deliveries to the North facility consistent with the County's historical practice through March 22, 2012. 13). Wheelabrator's obligations under the new service agreement with the District are subject to the delivery to it, on or prior to August 4, 2011, of evidence reasonably satisfactory to it that the District has the authority and means to perform its obligations hereunder, including without limitation, (a) the adoption and implementation by the District and the County of an effective system for the enforcement of the rules of the District and (b) the District having or the County making available to the District the assets and personnel necessary to perform its obligations under the service agreement. Each of the District and the County shall use their best efforts to satisfy such conditions on or prior to such date. 14). Wheelabrator shall pay a bonus on August 4, 2011 directly to each community that approves this M.O.U., as provided in paragraph 18 below, and also, on or prior to June 30, 2010, enters into a new interlocal agreement with the District that reflects the terms hereof. The total bonus shall be $12,000,000 and will be pro-rated for each community based on the proportion that its deliveries to the Wheelabrator plants bears to the total deliveries from the County/District to the Wheelabrator plants during the 12 months prior to August 4, 2011. Any community that does not approve this M.O.U. shall not be paid any bonus, and such portion of the $12,000,000 remaining shall be paid by Wheelabrator to the District instead. 15). The terms within this M.O.U. shall not be considered binding as to the County and the District unless and until first approved by the Broward Resource Recovery Board, as the governing body of the District and the Broward County Board of County Commissioners. 16. The terms within this M.O.U. shall not be considered binding as to Wheelabrator until and unless first approved by the Board of Directors of Waste Management, Inc. 17). The terms contained within this M.O.U., if approved pursuant to paragraphs 15 and 16, shall remain in effect until January 1, 2010. 18). The parties agree that this M.O.U. shall be binding upon the County, the District, and Wheelabrator upon passage by January 1, 2010 of resolutions approving the terms contained herein by communities within the County whose deliveries of solid waste to the Wheelabrator plants represented at least 80% of the County's/District's historical deliveries to the plants. This M.O.U. shall be superseded by a service agreement to be negotiated between the District and Wheelabrator and an amended site lease for the South site which shall contain the terms contained herein. If communities within the County whose deliveries of solid waste to the Wheelabrator plants represented at least 80% of the County's/District's historical deliveries to the plants have not (a)

SOLID WASTE ELEMENT
Broward County Page 6-82 Comprehensive Plan
Volume 4, Support Documents Solid Waste Element
approved this M.O.U. by January 1, 2010, or (b) entered into a binding interlocal agreement with the District reflecting the terms hereof by June 30, 2010, this M.O.U. shall nevertheless be binding upon the County, the District, and Wheelabrator, including paragraph 14, unless 1). Wheelabrator terminates this M.O.U. by notifying the Executive Director of the Broward Solid Waste Disposal District within 60 days after the applicable date in clause (a) and (b) above. The notice shall be sent by certified mail or overnight courier to Ron Greenstein, the Executive Director of the Broward Solid Waste Disposal District at One North University Drive, Plantation, Florida 33324 or 2). The District terminates this M.O.U. by notifying Wheelabrator within 60 days after the applicable date in clause (a) and (b) above. This notice shall be sent by certified mail or overnight courier to Wheelabrator Technologies Inc., ATTN: General Counsel, 4 Liberty Lane West, Hampton, N.H. 03842. For Wheelabrator South Broward Inc. For Wheelabrator North Broward Inc. For The Broward Solid Waste Disposal District For Broward County Board of County Commissioners

SOLID WASTE ELEMENT
Broward County Page 6-83 Comprehensive Plan
Volume 4, Support Documents Solid Waste Element
APPENDIX E – Recommendations from ―75% Recycling Goal Report to the Legislature‖
(Florida Department of Environmental Protection, January 2010) Recommendations The recommendations that follow—many of which were identified earlier in the report—focus largely on actions that promise the most environmental gain with the least economic impact to Florida’s private and commercial sectors. Not all of the recommendations can or should be implemented immediately, but all are critical to meeting the recycling goal. DEP is working on several of these recommendations now to enhance the recycling program using existing resources. Appendix C includes a list of supplementary recommendations that also warrant consideration. The recommendations are generally listed beginning with the easiest and least costly recommendations. State Government:
Require each state agency to meet the 75% goal.
Require each state agency to designate a single point of contact to coordinate with DMS regarding environmentally preferable purchasing issues and annually report to DMS its total expenditure on and use of products with recycled content and comparing that to the purchase of similar products made from virgin materials.
Develop a Web site that includes electronic brochures, newsletters, etc., for DMS to use for recycling education and getting recycling started in state office buildings. DEP should develop the Web site and help educate state office building managers in this initiative.
Modify the MFMP procurement system and FLAIR procurement for P-Card purchases to capture and report specific commodity purchases for green products, recycled materials and virgin materials.
Local Government:
Apply the new recycling goal to counties with a population greater than 100,000 and cities with a population greater than 50,000, capturing approximately 95% of the state’s population and MSW generated.
Specify that local governments under the population thresholds do not have to meet the goal but must provide recycling opportunities to their residents.
Require commercial recycling in counties with a population greater than 100,000 and cities with a population greater than 50,000. ―Commercial‖ in this context includes multi-family residential units (apartments, condominiums, etc.) as well as institutional accounts (such as schools and hospitals). o Consider a phased approach to requiring commercial recycling, focusing first on office buildings, retail establishments and institutions; and second on multi-family residential units.

SOLID WASTE ELEMENT
Broward County Page 6-84 Comprehensive Plan
Volume 4, Support Documents Solid Waste Element
Public Schools:
Direct all local school districts to implement recycling programs. A local school district could be exempt if: There is no recycling facility within the county or within a reasonable distance in
an adjoining geographic area; or The district cannot locate a recycling vendor to service the school district without
incurring a negative fiscal impact.
Develop a Web page for K-12 school recycling educational materials. Funding:
Create a Recycling Grants or Revolving Loan program for local governments to aid in reaching a 75% recycling goal for their jurisdictions. Structure financial assistance to address both operational and infrastructure
costs. Reserve a minimum percentage of these funds for public education and training. Consider limiting the duration of grants program. Require local program commitment to the recycling goal through matching grant
funds or loan repayment agreements Waste Management:
Phase in the requirement that all existing unlined C&D disposal facilities be modified to incorporate a Materials Recovery Facility at the front end of their process or utilize other existing materials recovery facilities so that recyclable materials such as wood waste, asphalt, concrete, etc., do not become part of the disposal waste stream. All new C&D disposal facilities would be subject to the requirement before operating.
Create a recycling business assistance center similar to what was proposed in Senate Bill 1462 during the 2009 Legislative Session. The center’s focus should be on promoting markets for the entire spectrum of
recyclable MSW materials, organic and inorganic. In addition, Enterprise Florida is an ideal lead agency working in partnership with
DEP in implementing the center’s efforts. The Solid Waste Management Trust Fund would make a logical funding source if new revenue sources are adopted.

SOLID WASTE ELEMENT
Broward County Page 6-85 Comprehensive Plan
Volume 4, Support Documents Solid Waste Element
APPENDIX F – Example of Potential Recycling Changes to Achieve Targets
EXAMPLE OF POTENTIAL RECYCLING CHANGES TO ACHIEVE TARGETS
2010 recycling* 2015 recycling
(based on current tonnage) 2030 recycling
(based on current tonnage)
Item
Current Tons (1000’s)
%
recycled
Tons recycled (1000’s)
Target % recycled
Target tons
(1000’s)
Change in tons
(1000’s)
Target % recycled
Target tons
(1000’s)
Change in tons
(1000’s)
C&D 1044 25% 261 35% 365 104 55% 574 209
Yard waste
441 10% 44 20% 88 44 40% 177 89
Glass 85 19% 16 30% 25 9 70% 60 35
Paper 804 29% 238 35% 281 43 60% 482 201
Metal 338 69% 232 232 75% 254 22
Plastic bottles
56 9% 5 5 35% 20 15
Other plastic
115 6% 7 7 20% 23 16
Food waste
90 0% 0 0 20% 18 18
Misc. 265 0% 0 0 10% 26 26
White goods
45 83% 37 37 90% 41 4
Textiles 40 0% 0 0 0
Tires 6 0% 0 0 0
TOTAL 3349 840 (28No table of figures entries
found.%)
1040 (31%)
200 1675 (50%)
638
*Source: 2007 data from FDEP & WRS, factored to 2010

SOLID WASTE ELEMENT
Broward County Page 6-86 Comprehensive Plan
Volume 4, Support Documents Solid Waste Element
THIS PAGE LEFT BLANK INTENTIONALLY