solid waste generation & composition in gaborone, …488964/fulltext01.pdfcomposition in...
TRANSCRIPT
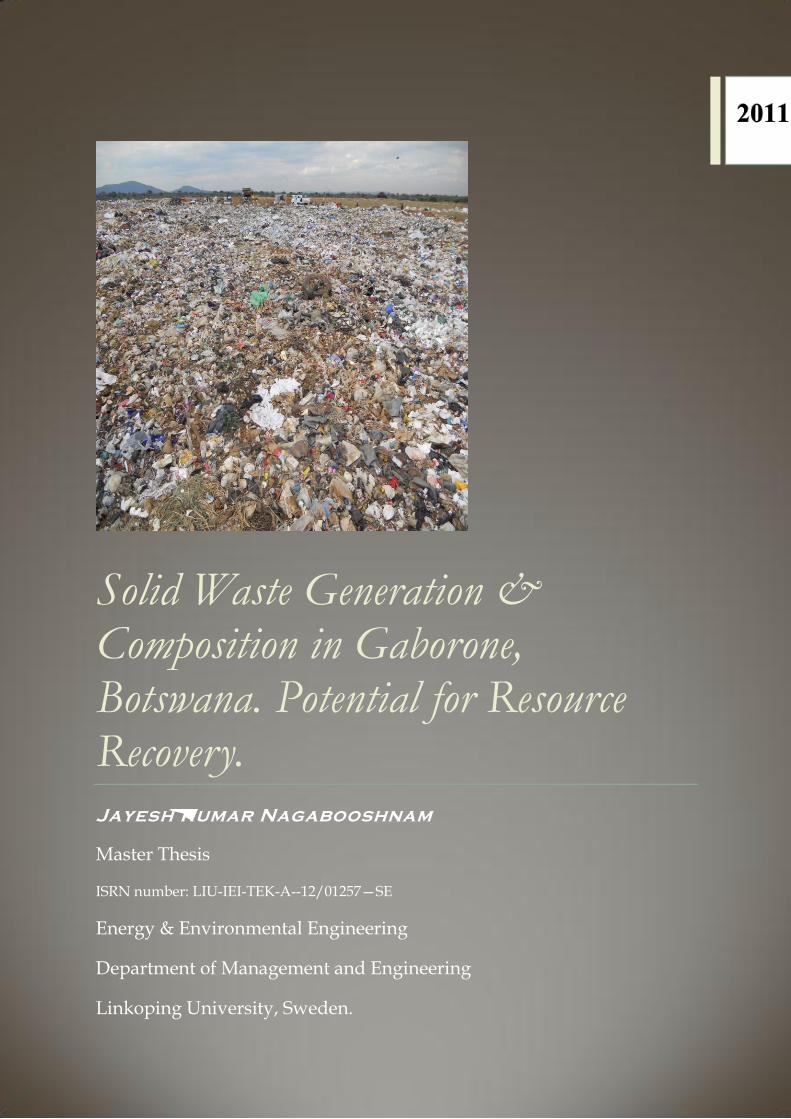
Solid Waste Generation & Composition in Gaborone, Botswana. Potential for Resource Recovery. Jayesh Kumar Nagabooshnam
Master Thesis
ISRN number: LIU-IEI-TEK-A--12/01257—SE
Energy & Environmental Engineering
Department of Management and Engineering
Linkoping University, Sweden.

1 Solid Waste Generation & Composition in Gaborone
Abstract
An analysis of solid waste management was performed in Gaborone, Botswana to identify the
quantity of different types of solid waste that are generated annually and the possible
strategies for improved waste management. In order to achieve the objective of the project,
present waste management practice in Gaborone was analysed and waste composition study
was carried out in Gamodubu landfill, Gaborone. Waste from household, commercial,
industrial and others (defence and institutional) stratums were selected for sampling.
Different samples were taken and forwarded to sorting analysis. The waste was categorized
into 10 categories and one of the categories (plastic) is further divided into 5 Subcategories.
The output of the study results the quantity of solid waste generated in Gaborone,
composition of solid waste categories from different stratums and its flow to the landfill and
the quality of waste, annually. These findings helped in serving the importance and the need
of better waste management system in order to improvise the potential for resource recovery
under social considerations.
Keywords: Solid Waste Management, Waste Composition, Resource and Material recovery,
Gamodubu Landfill, Gaborone Waste Management, Short-term improvements
in waste management

2 Solid Waste Generation & Composition in Gaborone
3 Solid Waste Generation & Composition in Gaborone
Preface
This thesis comes under a section of the Master program in Energy and Environmental
engineering at Linkoping University. The project was carried out in Gaborone, Botswana in
Africa.
The researcher would like to thank all the officials who helped in this thesis directly or
indirectly for graciously allowing us to complete the thesis successfully. First of all, I like to
especially thank my supervisor, Assistant Professor Joakim Krook, Linkoping University,
Division of Environmental Technology and Management for the endeavour in formulating
the master thesis and for giving such a great opportunity. I would like to personally thank to
Associate Professor Mattias Lindhal, Linkoping University for helping us with research
funding and travelling arrangements and Dr. Philimon Odirile, University of Botswana for
coordinating with us in Gaborone throughout the thesis.
I am greatly indebted to the research institute SIDA (Swedish International Development
Cooperation Agency) and AFORSK for helping us financially by providing funds for the
thesis. I heartily appreciate our other researchers from E-waste Management in Botswana and
Waste Management in Botswana for contributing with me in many interview and field
activities.
I would like to convey my thanks and regards to my parents for being a great support
throughout my career and to my friends for encouraging and supporting, for the success of
this thesis.

4 Solid Waste Generation & Composition in Gaborone
5 Solid Waste Generation & Composition in Gaborone
Contents
1. INTRODUCTION............................................................................................................ 11
1.1 OBJECTIVE....................................................................................................................... 12
2. BACKGROUND .............................................................................................................. 12
2.1 GABORONE ..................................................................................................................... 12
2.2 WASTE MANAGEMENT PRACTICE IN GABORONE ........................................................ 13
2.2.1 Generation and collection of waste .......................................................................... 13
2.2.2 Transportation ......................................................................................................... 15
2.2.3 Final Disposal .......................................................................................................... 16
2.3 GAMODUBU REGIONAL LANDFILL ................................................................................ 17
3. THEORETICAL FRAMEWORK ................................................................................... 18
3.1 SOLID WASTE AND ITS TYPES ......................................................................................... 18
3.2 WASTE HIERARCHY MANAGEMENT ............................................................................. 19
3.2.1 Source Reduction ..................................................................................................... 19
3.2.2 Reuse ........................................................................................................................ 20
3.2.3 Recycling ................................................................................................................. 20
3.2.4 Resource Recovery ................................................................................................... 21
3.3 COMPOSITION OF SOLID WASTE MATERIALS ................................................................. 23
3.3.1 Sampling techniques used for Composition of waste .............................................. 23
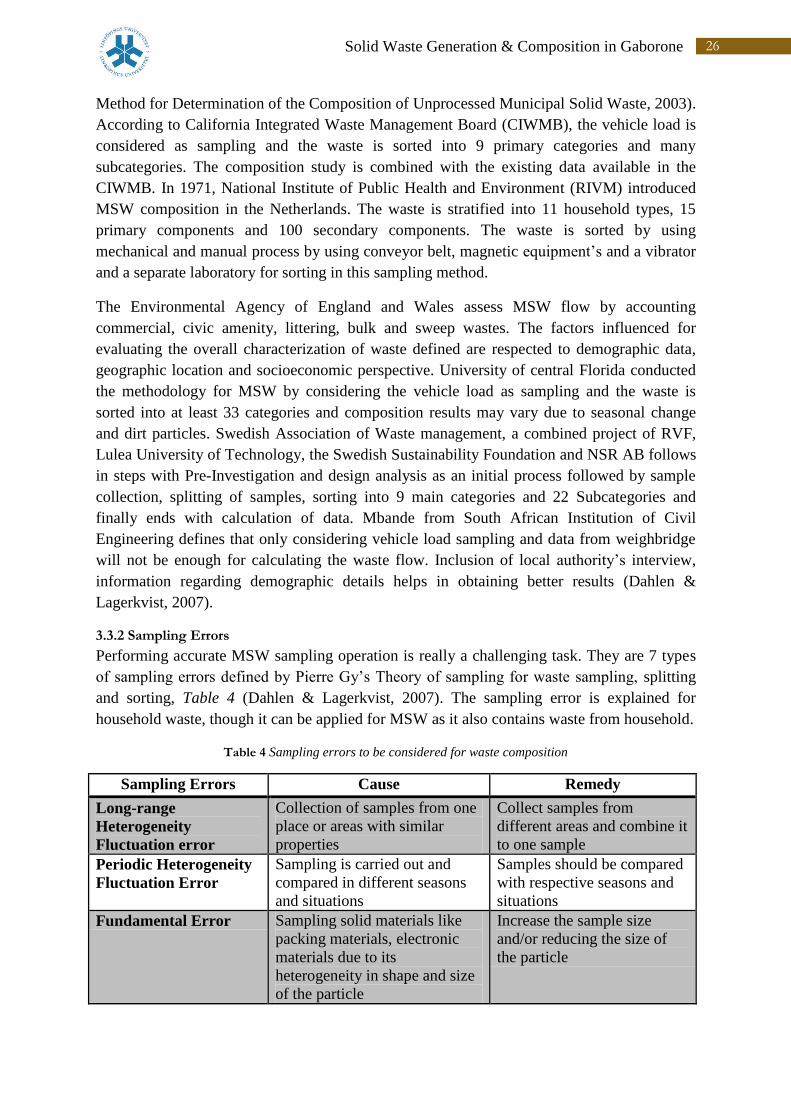
3.3.2 Sampling Errors ...................................................................................................... 26
4. METHOD .......................................................................................................................... 27
4.1 DATA COLLECTION ........................................................................................................ 27
4.2 SOLID WASTE COMPOSITION STUDY AT GAMODUBU LANDFILL .................................. 28
4.2.1 Procedure for Analysing the Solid Waste Composition .......................................... 28
4.2.2 Sample size .............................................................................................................. 29
4.2.3 Tools and Equipment’s used for Sorting ................................................................. 29
4.2.4 Sorting Procedure .................................................................................................... 29
4.3 ASSESSING THE ANNUAL GENERATION RATE .............................................................. 31
4.4 CRITERIA FOR THE IMPROVEMENT OF BETTER WASTE MANAGEMENT SYSTEM .......... 31
5. RESULTS ........................................................................................................................... 32
5.1 ANNUAL GENERATION OF SOLID WASTE IN GABORONE ............................................... 32
5.2 ANNUAL COMPOSITION OF SOLID WASTE FROM DIFFERENT STRATUMS ....................... 32
5.3 AVERAGE COMPOSITION OF THE SOLID WASTE RECEIVED AT THE GAMODUBU
LANDFILL .............................................................................................................................. 33
5.4 TOTAL ANNUAL FLOW OF DIFFERENT WASTE CATEGORIES AND ITS QUALITY .......... 34
5.4.1 Total Annual flow of different plastic waste categories........................................... 35
6. DISCUSSION ................................................................................................................... 36

6 Solid Waste Generation & Composition in Gaborone
6.1 STRATEGIES FOR IMPROVED WASTE MANAGEMENT IN GABORONE ............................ 36
6.1.1 A need for introducing source separation systems .................................................. 37
6.1.2 Improved collection system ..................................................................................... 38
6.1.3 Social Considerations .............................................................................................. 40
7. CONCLUSION ................................................................................................................. 41
8. REFERENCES ................................................................................................................... 42
9. APPENDIX ........................................................................................................................ 47
7 Solid Waste Generation & Composition in Gaborone
List of Figures
Figure 1 Map of Botswana ...................................................................................................................................... 12
Figure 2 Waste collection bin at the University of Botswana .......................................................................... 14
Figure 3 Current waste collection practice in Gaborone ................................................................................. 15
Figure 4 (left) Disposing Waste in Gamodubu Landfill .................................................................................... 16
Figure 5 (Right) Incinerator for Medical Waste in Gamodubu Landfill ....................................................... 16
Figure 6 Gamodubu Regional Landfill ................................................................................................................. 17
Figure 7 Waste Hierarchy Management .............................................................................................................. 19
Figure 8 Plastic Bins Used for Sorting ................................................................................................................. 30
Figure 9 Diagrammatic Representation of Waste Categories ......................................................................... 31
Figure 10 Annual generation of solid waste (in tonnes) for different stratums of Gaborone. The
presented amounts only account for the waste delivered to the Gamodubu landfill. ................................ 32
Figure 11 Composition (in weight- %) of the annually generated waste for 4 different stratums in
Gaborone .................................................................................................................................................................... 33
Figure 12 Average composition (in weight- %) of the total sample size analysed at the Gamodubu
landfill ......................................................................................................................................................................... 34
Figure 13 Total Annual Flow of Different Waste categories to Landfill ....................................................... 35
Figure 14 Composition (in weight- %) of the annually generated plastic waste in Gaborone................. 36
Figure 15 Schematic illustration of an improved waste management system in Gaborone ...................... 39
List of Tables
Table 1 Waste Type and its Cost for Disposal in Landfill ............................................................................... 17
Table 2 Waste Type and its Code........................................................................................................................... 18
Table 3 Sampling techniques for waste composition ........................................................................................ 24
Table 4 Sampling errors to be considered for waste composition ................................................................. 26
Table 5 Tools Used for Sorting .............................................................................................................................. 29
Table 6 Average Composition of different waste categories from the sample size (2400kg) ................... 34
Table 7 Potential for Resource Recovery ............................................................................................................ 37

8 Solid Waste Generation & Composition in Gaborone

9 Solid Waste Generation & Composition in Gaborone
List of Abbreviations
ASTM American Society for Testing and Materials
BMW Biodegradable Municipal Waste
BTV Botswana Television
BWMS Botswana Waste Management Strategy
CIA Central Intelligence Agency
CIWMB California Integrated Waste Management Board
CSO Central Statistics Office
DOC Degradable Organic Carbon
EIONET European Topic Centre on Sustainable Consumption and Production
EPA Environmental Protection Agency
EU European Union
E-waste Electronic Waste
GHG Greenhouse Gas
GWM Global Waste Management
HDPE High Density Polyethylene
HHW Household Hazardous Waste
IEA International Energy Agency
LFG Landfill Gas
LLDPE Linear Low Density Polyethylene
LPDE Low Density Polyethylene
MBT Mechanical Biological Treatment
MSW Municipal Solid Waste
MSWL Municipal Solid Waste Landfill
NGO Non-governmental Organization
OCED Organisation for Economic Co-operation and Development
PET Poly Ethylene Terephthalate
10 Solid Waste Generation & Composition in Gaborone
PP Poly Propylene
PS Poly Styrene
PVC Polyvinyl Chloride
RCRA Resource conservation and Recovery Act
SAEFL Swiss Agency for Environment, Forests and Landscape
SWA Solid Waste Analysis Tool
USEPA United States Environmental Protection Agency
WHO World Health Organization
11 Solid Waste Generation & Composition in Gaborone
1. Introduction
Waste is a material or substance which is no longer to be used and meant to be discarded by
the user (EIONET, 2011). According to the Basel Convention, “wastes are substances or
objects which are disposed of or intended to be disposed of or required to be disposed of by
the provisions of national laws” (UNEP/GRID-Arendal, 2011).
From a global perspective, the generation of solid waste is mainly driven by population
growth, technology improvements and economic development. According to the European
commission, the waste generated by the European Union (EU) is around 3 billion tonnes of
waste per year, where 90 million tonnes of them are hazardous waste. This means that about
6 tonnes of solid waste are generated by each individual per year (Eurostat, 2011).
Furthermore, the Organisation for Economic Cooperation and Development (OECD) reports
that the quantity of waste generated in the period 1990 to 1995 within the European region
has increased by 10%, where 67% of the waste was landfilled. The OECD expects that by
2020 the generation of waste has increased by 45%. Waste Prevention, Recycling and Reuse,
Improving Final disposal and Monitoring are the three main waste management strategies
within the European Union (European Commision, 2011).
The Global Waste Management (GWM) Market Report (2007) show that the MSW generated
in the year 2006 was close to 2 billion tonnes with an annual increase of 7% since 2003. It
has been noted that the generation of MSW from 2007 to 2011 has been increased by 8% per
year and nearly 37.3% in a 5 year period globally. According to WHO, the low income
countries generate approximately 0.5 kg to 3 kg of total health care waste per year by an
individual. Now days, E-waste is considered as one of the most rapidly growing types of
waste with a ratio of average 1% in solid waste and reached 2% in 2010 and to be expected to
increase more in the future (Assessment of Current Waste Management System, 2009). The
per capita solid waste generation in developed countries like Canada, Switzerland, France,
United Kingdom and USA varies between 0.9 – 2.7kg per day and in the developing
countries like India, Sri Lanka and Thailand generates 0.3-0.65kg, 0.4-0.85kg and 0.5-1kg
per day (I. Korner, 2003-2006). From the total quantity of waste generated in Canada, nearly
50% is municipal solid waste. A report from the US Environmental Protection Agency
(USEPA) show that 56.9% of total waste generated in the USA is disposed of in landfills,
27% is material recycled and 16.1% is incinerated (Kuniyal, 2010).
The current handling of solid waste has a wide range of environmental implications such as
generation of methane emissions from landfills contributing to global warming, littering and
various types of pollution caused by leaching from landfills or emissions from waste
treatment facilities. Paper and plastic materials are often major components of solid waste
(Akinbode, 2010). They contain substances which are hazardous to health which may cause
skin disease, respiratory problems, carcinogenic, neurological disease, low birth weight,
chemical poisoning through inhalation. The main factors for the environmental impact of
solid waste are absence of source separation programmes, lack of technical expertise and
institutional arrangements, improper collection, segregation, transportation and disposal
methods, the person's attitude towards waste management, lack of awareness, insufficient
funds, and community involvement.

12 Solid Waste Generation & Composition in Gaborone
Developed regions like Europe and USA have standardised waste management methods for
different kind of waste and defined policies and legislation especially knowledge on waste
and its impacts. The amount of waste generated per capita for both developed and developing
countries may sometimes be more or less the same but the main difference is related to the
waste management strategy and practice. In developing countries like India and Thailand,
virtually all of the generated waste is landfilled. This difference in waste handling depends on
a lack of knowledge on waste and its impacts on environment and human health, improper
collection system for waste, lack of policies and measures for waste management,
unavailability of recycling options and lack of infrastructure.
Likewise other developing countries all over the world, Botswana is also facing the serious
issue of increasing solid waste generation and the main disposal route is landfilling. Apart
from that natural resources are wasted, such a practice results in various environmental
implications, ranging from local pollution concerns and land management issues to global
impacts in terms of several hazardous emissions from the landfill.
1.1 Objective
The overall objective of this thesis is to contribute with knowledge regarding the generation
and composition of solid waste in Gaborone, Botswana. This is in order to provide a
foundation for developing improved waste handling strategies, taking the present technical,
economic and organisational conditions in the country into account.
This objective is divided into the following two research questions:
How much of different types of solid waste are annually generated in Gaborone?
What are the possible strategies for improved waste management in Gaborone?
2. Background
2.1 Gaborone
Gaborone is the capital city for Botswana which is located in the south Eastern edge of the
country on the Notwane river between Kgale and Oodi hills (Njeru, 2006), figure 1 (Zambezi,
2011).
Figure 1 Map of Botswana
13 Solid Waste Generation & Composition in Gaborone
Botswana is situated in southern Africa which is officially called as Republic of Botswana
with the population approximately 2.1 million (year 2010) Batswana (citizens of Botswana).
Compared to other countries in the African continent Botswana has the highest grade of
economy.
Mining industries play the vital role in the economic prospective (Nocera, 2008). Initially
Botswana was one of the poorest countries in Africa with a GDP per capita of about US$70
(The World Bank, 2010), but it has since then been one of the fastest developing countries in
the region with a present GDP per capita of US$6,200 (U.S. Department of State, 2011). The
poverty also has been reduced from 50% to 30% from the time of independence (The World
Bank, 2010). Botswana is one of the world’s largest manufacturers of diamonds. Next to the
mining industry, tourism plays a vital role in the economy of Botswana.
Likewise many other countries, the capital Gaborone has all the modern facilities that could
be expected in a large-sized city, e.g. International and high-standard hotels, casinos, shops,
restaurants, hospitals, banking sector, industries, educational institution, and National
Museums. University of Botswana, one of the top educational institutions in the country is
also located in the capital (Gaborone, 1997). The city is known as governmental capital or
Economic capital, because it holds the headquarters for several companies as like mentioned
above (Njeru, 2006).
2.2 Waste Management Practice in Gaborone
The waste management issues and problems are managed by the Botswana Waste
Management Strategy which was founded in the year 1998. The aims of this strategy are to
decrease the waste generation in industry, waste minimisation in households and commercial
sectors, increase recycling and reuse and propose well-defined collection, transportation and
disposal facilities for waste (Ednah & Luo, 2010). Landfill dumping and littering are the
grievous problems to the environment, which Botswana is facing. Nearly 10,000 tons of
waste is generated in Botswana per day, according to the Central Statistics Office (CSO,
1998). Botswana local governmental bodies consider recycling services, household formation
of trends, and urban consolidation are the main factors in the generation of waste.
2.2.1 Generation and collection of waste
The solid waste generated in Gaborone can be classified into five categories. General waste,
garden waste, soil, clinical waste and construction waste. General waste, garden waste and
soil are considered as domestic waste generated by the individuals in day to day processes.
The generation of general waste and garden waste in commercial sectors and industries is
however quite high when compared with the households. The general waste can be primarily
classified into two sub categories, organic and Inorganic. The organic waste consists of food
waste, garden waste, papers and cardboards, wood and other organic materials. The inorganic
waste consists of bottles, cans, plastic, glass, electronic waste, metals and other kinds of
waste.
The individuals living in the city of Gaborone use polyethylene plastic bags for the collection
of waste generated by them in the household. The peoples living in apartments and multi
14 Solid Waste Generation & Composition in Gaborone
housing and institutions have a garbage container outside their buildings where the collected
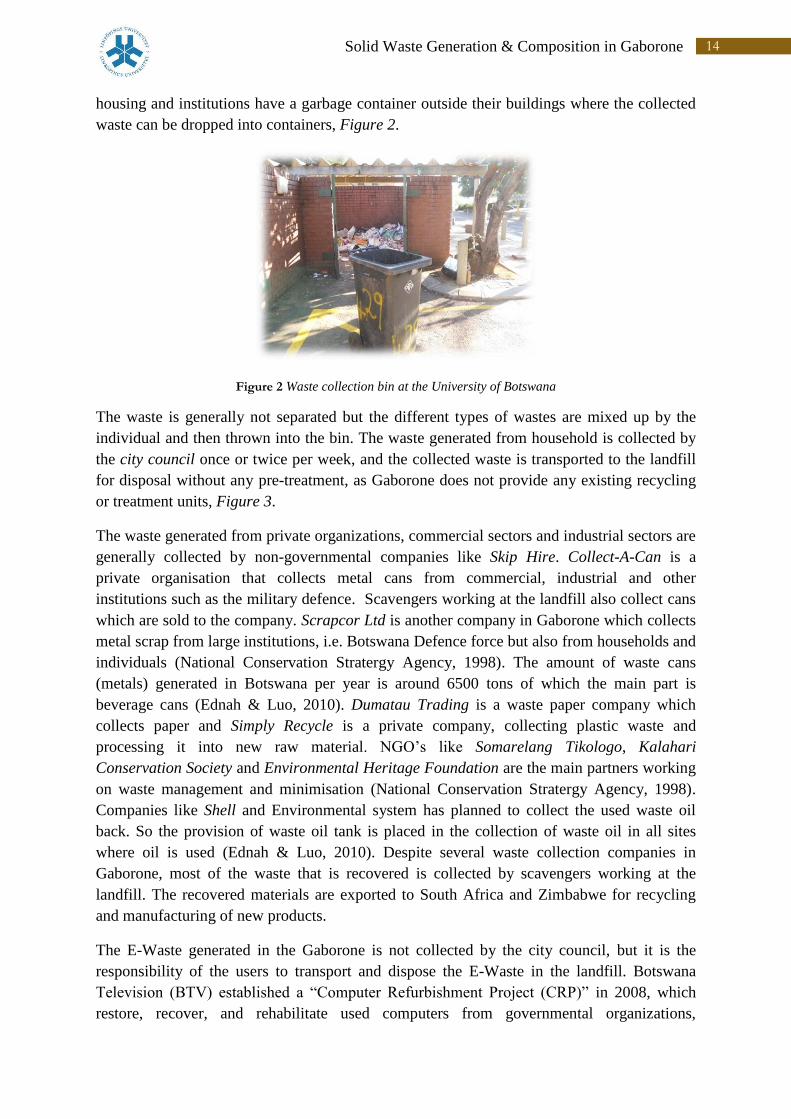
waste can be dropped into containers, Figure 2.
Figure 2 Waste collection bin at the University of Botswana
The waste is generally not separated but the different types of wastes are mixed up by the
individual and then thrown into the bin. The waste generated from household is collected by
the city council once or twice per week, and the collected waste is transported to the landfill
for disposal without any pre-treatment, as Gaborone does not provide any existing recycling
or treatment units, Figure 3.
The waste generated from private organizations, commercial sectors and industrial sectors are
generally collected by non-governmental companies like Skip Hire. Collect-A-Can is a
private organisation that collects metal cans from commercial, industrial and other
institutions such as the military defence. Scavengers working at the landfill also collect cans
which are sold to the company. Scrapcor Ltd is another company in Gaborone which collects
metal scrap from large institutions, i.e. Botswana Defence force but also from households and
individuals (National Conservation Stratergy Agency, 1998). The amount of waste cans
(metals) generated in Botswana per year is around 6500 tons of which the main part is
beverage cans (Ednah & Luo, 2010). Dumatau Trading is a waste paper company which
collects paper and Simply Recycle is a private company, collecting plastic waste and
processing it into new raw material. NGO’s like Somarelang Tikologo, Kalahari
Conservation Society and Environmental Heritage Foundation are the main partners working
on waste management and minimisation (National Conservation Stratergy Agency, 1998).
Companies like Shell and Environmental system has planned to collect the used waste oil
back. So the provision of waste oil tank is placed in the collection of waste oil in all sites
where oil is used (Ednah & Luo, 2010). Despite several waste collection companies in
Gaborone, most of the waste that is recovered is collected by scavengers working at the
landfill. The recovered materials are exported to South Africa and Zimbabwe for recycling
and manufacturing of new products.
The E-Waste generated in the Gaborone is not collected by the city council, but it is the
responsibility of the users to transport and dispose the E-Waste in the landfill. Botswana
Television (BTV) established a “Computer Refurbishment Project (CRP)” in 2008, which
restore, recover, and rehabilitate used computers from governmental organizations,
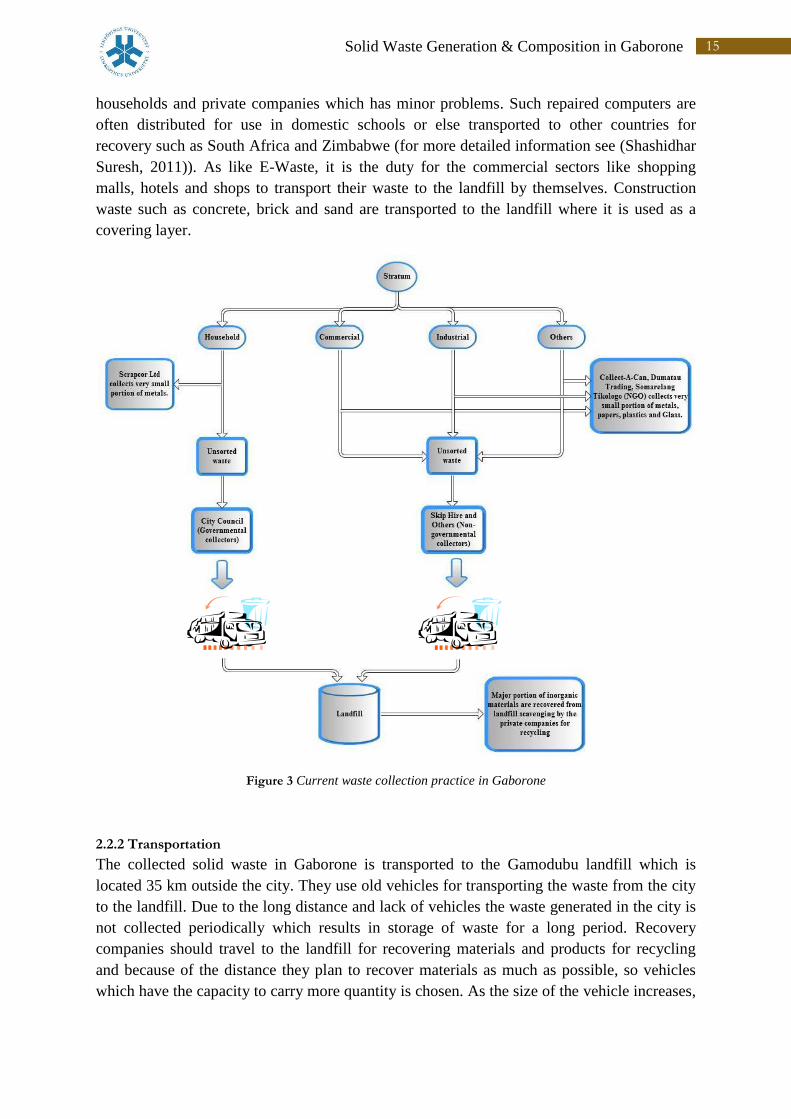
15 Solid Waste Generation & Composition in Gaborone
households and private companies which has minor problems. Such repaired computers are
often distributed for use in domestic schools or else transported to other countries for
recovery such as South Africa and Zimbabwe (for more detailed information see (Shashidhar
Suresh, 2011)). As like E-Waste, it is the duty for the commercial sectors like shopping
malls, hotels and shops to transport their waste to the landfill by themselves. Construction
waste such as concrete, brick and sand are transported to the landfill where it is used as a
covering layer.
Figure 3 Current waste collection practice in Gaborone
2.2.2 Transportation
The collected solid waste in Gaborone is transported to the Gamodubu landfill which is
located 35 km outside the city. They use old vehicles for transporting the waste from the city
to the landfill. Due to the long distance and lack of vehicles the waste generated in the city is
not collected periodically which results in storage of waste for a long period. Recovery
companies should travel to the landfill for recovering materials and products for recycling
and because of the distance they plan to recover materials as much as possible, so vehicles
which have the capacity to carry more quantity is chosen. As the size of the vehicle increases,
16 Solid Waste Generation & Composition in Gaborone
fuel consumption also increases in parallel and also GHG are emitted from the vehicles as it
is old, which has impacts on the environment.
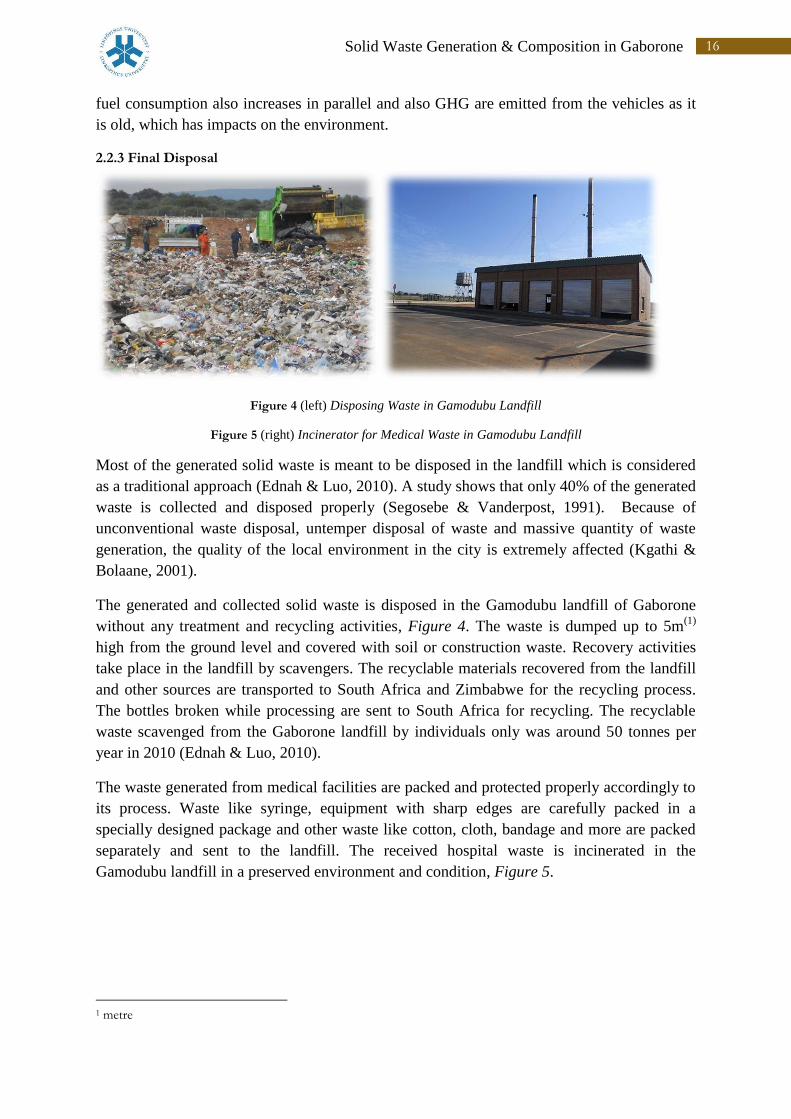
2.2.3 Final Disposal
Figure 4 (left) Disposing Waste in Gamodubu Landfill
Figure 5 (right) Incinerator for Medical Waste in Gamodubu Landfill
Most of the generated solid waste is meant to be disposed in the landfill which is considered
as a traditional approach (Ednah & Luo, 2010). A study shows that only 40% of the generated
waste is collected and disposed properly (Segosebe & Vanderpost, 1991). Because of
unconventional waste disposal, untemper disposal of waste and massive quantity of waste
generation, the quality of the local environment in the city is extremely affected (Kgathi &
Bolaane, 2001).
The generated and collected solid waste is disposed in the Gamodubu landfill of Gaborone
without any treatment and recycling activities, Figure 4. The waste is dumped up to 5m(1)
high from the ground level and covered with soil or construction waste. Recovery activities
take place in the landfill by scavengers. The recyclable materials recovered from the landfill
and other sources are transported to South Africa and Zimbabwe for the recycling process.
The bottles broken while processing are sent to South Africa for recycling. The recyclable
waste scavenged from the Gaborone landfill by individuals only was around 50 tonnes per
year in 2010 (Ednah & Luo, 2010).
The waste generated from medical facilities are packed and protected properly accordingly to
its process. Waste like syringe, equipment with sharp edges are carefully packed in a
specially designed package and other waste like cotton, cloth, bandage and more are packed
separately and sent to the landfill. The received hospital waste is incinerated in the
Gamodubu landfill in a preserved environment and condition, Figure 5.
1 metre

17 Solid Waste Generation & Composition in Gaborone
2.3 Gamodubu Regional landfill
The landfill is located in near the Gamodubu village for about 30km from Molepolole and
35km(2)
from Gaborone with an area of 30 hectares (Botswana Government, 2011).
Figure 6 Gamodubu Regional Landfill
The landfill, Figure 6 has 5 cells, each of them being 1.5m in depth. The cells consist of
drainage pipes which connect to the leachate pond. It is approximated that the landfill can
execute for 20 more years. The old landfill which is called Gaborone landfill was closed as it
was almost filled and presently the generated waste in the Gaborone city is disposed in this
new landfill. Waste from Gaborone and in and around districts like Tlokweng, Mogoditshane,
Molepolole is dumped in the Gamodubu landfill (Botswana Government, 2011). Gamodubu
landfill construction was started in August 2007 and was completed in January 2009. The
project was handled by a China Jiangsu International Botswana and the cost of the project
was P( 3 )
67 million including the cost for the final closure of the Gaborone landfill
(Mokgoabone, 2008). The landfill has tariffs plan for the waste coming to the landfill, Table
1 (Gamodubu Background, 2011).
Table 1 Waste Type and its Cost for Disposal in Landfill
Type of Waste Cost
Health care waste P30.00/kg
Pharmaceutical waste P30.00/kg
Food animal products (poultry waste, sawdust and yeast) P1.00/kg
Abattoir sludge P5.00/kg
Soil material (to be used as cover material) Free
Domestic waste (For Individual) Free
Domestic waste (>1000 kg/1 ton) P40.00/ton
Commercial/Industrial waste P40.00/ton
Confidential documents P40.00/ton
Garden waste P60.00/ton
Scrap metal P60.00/ton
Used tires P50.00/ton
Condemned foodstuffs P20.00/ton
2 Kilometre 3 Pula – Botswana Currency
18 Solid Waste Generation & Composition in Gaborone
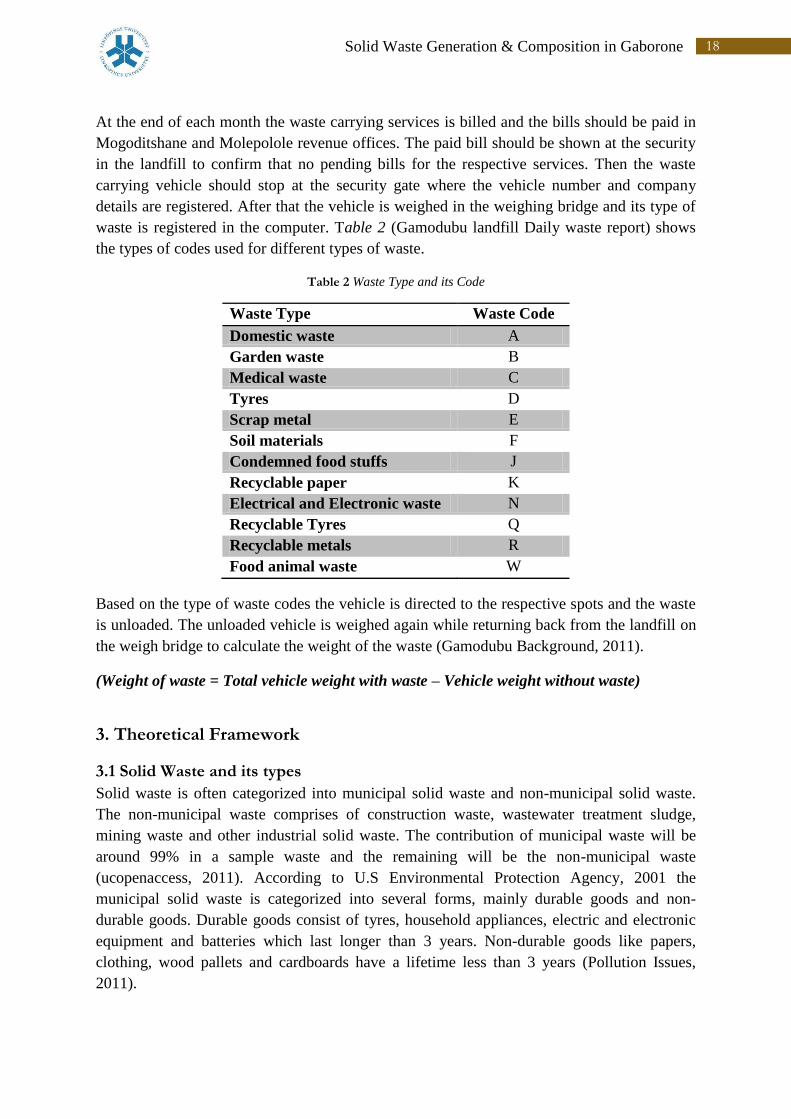
At the end of each month the waste carrying services is billed and the bills should be paid in
Mogoditshane and Molepolole revenue offices. The paid bill should be shown at the security
in the landfill to confirm that no pending bills for the respective services. Then the waste
carrying vehicle should stop at the security gate where the vehicle number and company
details are registered. After that the vehicle is weighed in the weighing bridge and its type of
waste is registered in the computer. Table 2 (Gamodubu landfill Daily waste report) shows
the types of codes used for different types of waste.
Table 2 Waste Type and its Code
Waste Type Waste Code
Domestic waste A
Garden waste B
Medical waste C
Tyres D
Scrap metal E
Soil materials F
Condemned food stuffs J
Recyclable paper K
Electrical and Electronic waste N
Recyclable Tyres Q
Recyclable metals R
Food animal waste W
Based on the type of waste codes the vehicle is directed to the respective spots and the waste
is unloaded. The unloaded vehicle is weighed again while returning back from the landfill on
the weigh bridge to calculate the weight of the waste (Gamodubu Background, 2011).
(Weight of waste = Total vehicle weight with waste – Vehicle weight without waste)
3. Theoretical Framework
3.1 Solid Waste and its types
Solid waste is often categorized into municipal solid waste and non-municipal solid waste.
The non-municipal waste comprises of construction waste, wastewater treatment sludge,
mining waste and other industrial solid waste. The contribution of municipal waste will be
around 99% in a sample waste and the remaining will be the non-municipal waste
(ucopenaccess, 2011). According to U.S Environmental Protection Agency, 2001 the
municipal solid waste is categorized into several forms, mainly durable goods and non-
durable goods. Durable goods consist of tyres, household appliances, electric and electronic
equipment and batteries which last longer than 3 years. Non-durable goods like papers,
clothing, wood pallets and cardboards have a lifetime less than 3 years (Pollution Issues,
2011).

19 Solid Waste Generation & Composition in Gaborone
3.2 Waste Hierarchy Management
The management of solid waste is one of the challenging tasks in the present fast growing
world. In order to maintain a sustainable environment it is important to reduce the amount of
waste generated through recycling or reuse of discarded materials and products. According to
the waste hierarchy, the most preferred option for solid waste is source reduction followed by
re-use of whole products, recycling of materials, resource recovery in means of material and
energy, incineration and finally least preference for landfilling, Figure 7 (Waste Hierarchy
Management, 2011).
Figure 7 Waste Hierarchy Management
3.2.1 Source Reduction
Source reduction is the most preferred waste management Strategy in the hierarchy because it
eradicates the necessity of handling, transportation and disposal of waste. Change in design,
production, packaging, purchase and use of products or materials to reduce the toxicity and
amount of waste generated at the source is referred as Source reduction (USEPA, 2007).
Source reduction is therefore often argued to be the most environmentally sound management
for minimising MSW (Power Score Card, 2000). Any activity which helps in reducing waste,
toxicity, and focusing on reuse and recycling at the source is termed as source reduction. An
individual thinks, consuming fewer products and getting rid of less waste is considered as
source reduction (Sally, 2004). A manufacturer should ensure that the product should last a
long useful life thus produce environmentally sound products by cleaner production
technology. Source reduction or waste minimization and prevention strategy should be
applied in the life cycle analysis of a product from cradle to grave, so that waste generated in
each phase of the product can be identified and minimized at the earlier stages (Kulkarni,
2008). Use of reusable products, buying products with less packaging, using rags instead of
paper towels, electronic newspapers from online for reading news, electronic documents
instead of papers for payment activities, use recycling products like aluminium cans and
glass, purchase products that are non-hazardous, purchase in bulk, buy more durable
20 Solid Waste Generation & Composition in Gaborone
products, minimize the use of product are some of the strategies for source reduction (Source
reduction and Reuse, 2011). Source reduction serves in conserving natural resources by
producing and designing efficient product and also minimizes the quantity of waste as equal
to the waste recycled or incinerated or landfilled (USEPA, 2007).
3.2.2 Reuse
The material or product which can be used more than once for the same or different activities
without any upgrading is defined as reuse (Kulkarni, 2008). Reuse is also an option for
source reduction. The main application of reuse is to extend the life of the product or
material. Use of durable coffee mugs, towels, refilling bottles, reusing cardboard boxes,
donating old computers to schools and NGO’s, second hand furniture’s are some of the
examples for reuse. Compared to recycling, reuse is preferred most as it does not undergo any
upgrading and therefore no material and energy is used and at the same time reduces the cost
and the need for disposal (Kulkarni, 2008). The demerits in reuse are cleaning, transportation
and time consumption for sorting.
3.2.3 Recycling
Recycling is an activity of collecting, sorting and processing of used or discarded materials
into useful products to its original form or for other purposes. It is considered as one of the
effective solution for saving landfill from producing greenhouse gas. The materials from the
municipal waste can be recovered and served in the manufacturing process for producing new
products and material recovery. The foremost aim of recycling treatment method is
converting waste into valuable materials. Materials like paper, plastic, metals and glasses are
some of the recyclable materials used for recycling and manufacturing new products (I.
Korner, 2003-2006).
Papers in landfill consume more space and take approximately 5 to 15 years to break down
and decompose (Hanson, 2011). Roughly 3000KWh to 4000KWh electricity can be saved for
every 1000kg of paper used for recycling (Waste Online, 2006). According to an
Environmental report, recycling 1000kgs of mixed paper conserves energy which is equal to
185 gallons of gasoline and also saves 7000 gallons of water and nearly 3 cubic yards of
landfill space (Complete Recycling, 2011). The waste papers can be cascaded to produce new
paper based products like tissue paper, notebooks, stamps, paper bags and more. Nearly 28%
to 70% of minimum energy is consumed in producing paper products from recycled paper
when compared to virgin material (Waste Online, 2006). Recycling 1000kgs of paper saves
up to 17 trees approximately (Green StudentU, 2011). According to the statistics and facts
from the United States Environmental Protection Agency, 2011 the pollution of water and air
is reduced by 35% and 74% when paper is recycled than producing new paper (Benefits of
Recycling, 2011).
Recycling of plastic is a more efficient method for material and energy recovery than
incinerating and disposing. When plastic is incinerated it highly emits greenhouse gases
which are one of the main causes for environmental impact. It consumes twice the energy for
incinerating the plastic rather than recycling (Recycling Revolution, 2011). When 1000kgs of
plastic is recycled it saves up to 7.4 cubic yards of landfill space (Benefits of Recycling,
21 Solid Waste Generation & Composition in Gaborone
2011). Nearly 10% of energy will be consumed to produce new plastic products from
recycled plastic when compared to virgin materials (Bloch, 2010).
Metal recycling generally leads to material recovery, energy recovery, and minimization of
virgin metals consumption and reduced greenhouse gas emission. According to EU report,
utilizing recycled raw materials for the production of new materials decreases around 200
million tonnes of CO2(4)
emission per year (BMRA, 2010). Recycling aluminium conserves
nearly 95% of energy used for producing new aluminium products from virgin aluminium
(Buxmann, et al.). So, 5% of total energy is used for producing aluminium products with only
5% of CO2 emission (BMRA, 2010). A single aluminium can when recycled conserves
enough energy which can enable to run a television for 3 hours. When 1kg of aluminium is
recycled it merely saves 6kg of bauxite, 4kg of chemical products and 14KWh of electricity
(Benefits of Recycling, 2010).
Glass is the product which does not lose its purity and quality even after recycling for several
times (West , 2011). When 1000kg of recycled glass is used for producing new glass
products, nearly 1200kgs of raw materials are conserved (Waste Online, 2006). According to
the Glass Packing Institute, recycled glass consumes only two third of energy for producing
glass products. Glass recycling facilitates the environment by reducing the amount of CO2
(GHG) exposing to the atmosphere by 315kg per ton, considering transport and processing
emission (Bloch, 2010).
Recycling serves in conserving resources for future, consumes less energy than producing
products from virgin materials, uses and saves valuable metals from dumping, develop
sustainability and reduces landfilling.
3.2.4 Resource Recovery
3.2.4.1 Composting
Composting is a natural way of recycling (Benefits of Recycling, 2010). It is a biological
process which decomposes the organic matters into various micro-organisms under aerobic
conditions (ucopenaccess, 2011). In this process prominent fraction of degradable organic
carbon (DOC) from the waste is changed into carbon dioxide (CO2). Emission of CH4(5)
is
oxidised in this process to a large extent. The result in this process which is called as Humus
is generated from the organic matter act as a main component for the fertile soil. Composting
is an option to retain the nutrients from the waste and deliver back to other organisms in the
natural system (ucopenaccess, 2011). Materials like garden waste, lawn clippings, leaves,
weeds, hay, straw, wood products, food waste and manure are used for composting
(Envirotech Ltd). Soil enrichment, remediate contaminated soil, pollution prevention
(USEPA, 2011), reduction in GHG, regeneration of poor soils (Environmentalist Everyday,
2011), minimize soil erosion, better soil porosity, less consumption of fertilizers and
pesticides, high nutrients to soil are the environmental benefits of composting. Composting
also has environmental impacts by polluting surface, ground water, soil and air due to the
4 Carbon dioxide 5 Methane
22 Solid Waste Generation & Composition in Gaborone
residuals in the process. High investment costs, need of large covered area, need of sorts
waste are the other disadvantages of composting.
3.2.4.2 Anaerobic Digestion
Anaerobic digestion is a natural biological decomposition process of organic matters by
maintaining the heat, pH value and moisture content in the absence of oxygen (Alves, et al.,
2006). As a result, biogas is generated from the process. The biogas consists of 60% of CH4
and remaining 40% of CO2 (Friends of Earth, 2007) and it is separated. Methane is extracted
and is used as fuel for vehicles or may be used as heat and electricity (Alves, et al., 2006) and
the left out CO2 is exposed to the atmosphere. After the extraction of biogas the remaining
residue i.e. digestate is used as fertility for the agricultural lands (Friends of Earth, 2007). On
an average 100 to 200 cubic meters of bio gas is produced from 1000kg of organic waste
(Ann.C, 2011) and 1 cubic meter of bio gas serves in generating 1.7KWh(6)
electricity and
7.7MJ(7)
of heat. Organic waste like sewage sludge, organic farm waste, municipal solid
waste, green waste, industrial and commercial waste are used in anaerobic digestion
processes (Monnet, 2003).
Recently mechanical-biological treatment is getting familiar in most of the countries
especially in Europe. In this MBT the solid waste is sorted mechanically accordingly to the
disposal option (recycling, incineration, composting, anaerobic digestion and landfill) and
then the waste which is to be digested using anaerobic digestion is fed to the biological
treatment and processed (Alves, et al., 2006). The process helps in minimizing GHG and the
energy produced from the process decreases the demand of fossil fuels and the resulted
digestate also helps in minimizing the synthetic fuels used for fertilizer production. The
anaerobic digestion has some potential impacts on the environment as the development
increases and consumes a high operational cost and investment for processing (Monnet,
2003).
3.2.5 Incineration
Waste Incineration is an approach in the waste management hierarchy, which is majorly used
in European and American countries, instead of disposing the waste in the landfill. Burning
of solid waste materials at a very high temperature (ucopenaccess, 2011), is known as
incineration. Electricity and heating are the main products of waste incineration. The heat
produced in burning the trash is used for generating electricity power and used for heating in
cold countries, which is technically pronounced as waste to energy. The residue after burning
the waste is used to extract some of the non-combustible materials like glass, metals (North
Yorkshire County Council, 2010) etc. and rest of the fly ash is used as a mixture for
engineering purposes (Friends of Earth, 2002) and at worst case it is dumped in the landfill.
Comparatively the fly ash consumes less space in the landfill subjected to solid waste. The
main purpose of incineration minimises the volume of combustible by 80% to 90% (Decision
Makers’ Guide to Municipal Solid Waste Incineration, 1999). The advantages of incineration
are it majorly minimizes the volume of waste being dumped in the landfill, produce energy
with the heat produced during combustion (Statistics Canada, 2010). On an average of
6 Kilowatt hour 7 Mega joule
23 Solid Waste Generation & Composition in Gaborone
525KWh electricity can be generated by incinerating 1000kg of combustible waste from
MSW (Combs, 2008). Waste like paper, textiles, garden, wood, plastics comes under
combustible materials. The disadvantages of incineration are air pollution, emission of
chemicals which produce acid rain and ground level ozone, metals (Zinc, Cadmium, Mercury
and Nickel) changes to ash when incinerated which lead to loss of metals (Statistics Canada,
2010).
3.2.6 Landfill
Landfill is a place where the generated wastes are dumped beneath the soil in an isolated
manner. It is one of the more often used methods for the disposal of waste. Around 62% of
municipal wastes are dumped in the landfill (Infoplease, 2000). Due to the landfill disposal
facility many of the developing countries like Botswana, India are dumping their solid waste
instead of recycling or reusing or may be fed to other disposal methods. The main reason for
the closure of landfills at present in many countries is due to the fulfilment of waste in the
landfill and then only comes the life span of the landfill. Plastic and paper waste contributes
major part in land acquisition in the landfill as it is generated numerously and disposed at a
great extent. The environmental impacts due to landfill dumping are Ground water
contamination, Air pollution, Leachate, Emission of CH4 gas, consumption of large volume
of land leads to land scarcity and soil acidification, deposition of metals and scare elements
which intern leads to resource scarcity and waste of energy for extraction of resources. It also
affects the human life by respiratory disease, cancer, birth defects and skin disease (Enviros
Consulting; University of Birmingham;).
3.3 Composition of Solid waste materials
Solid waste composition studies are mainly used for constructing a well-defined waste
management for several reasons which admits potential for material recovery, to find out the
origin of component generation, thermal, to approximate its chemical and physical properties.
Seasonal change and geographic aspect are the factors which influence waste composition
study (Debra & McCauley, 1996). Waste is sorted based on the waste categories for the
composition. Initially a sample wastes is selected and it will be separated into different
categories based on its source of origin, physical and chemical properties and its
characterization. Then the separated waste is further broken down specifically into different
types and the materials or substance in the waste is segregated according to it. Commonly,
the waste is broken down into paper, wood, textile, food, rubber, leather, plastics, garden
waste, metals, glass, e-waste, soil waste and more. The selection for specific type differs
based upon the selector. Now the segregated waste is collected separately and it is weighed.
Comparing the weight of the segregated waste with the sample selected and its composition is
calculated.
3.3.1 Sampling techniques used for the composition of waste
Practically thinking it is not possible to calculate or find the waste composition for the whole
waste generated in Gaborone, so a sampling method should be used to calculate the waste
composition in a sample and it is compared and related with the total waste generation
quantity. There are several waste sampling methods used earlier for finding the composition
of waste generated. Sweden and many others countries in Europe also use different sampling
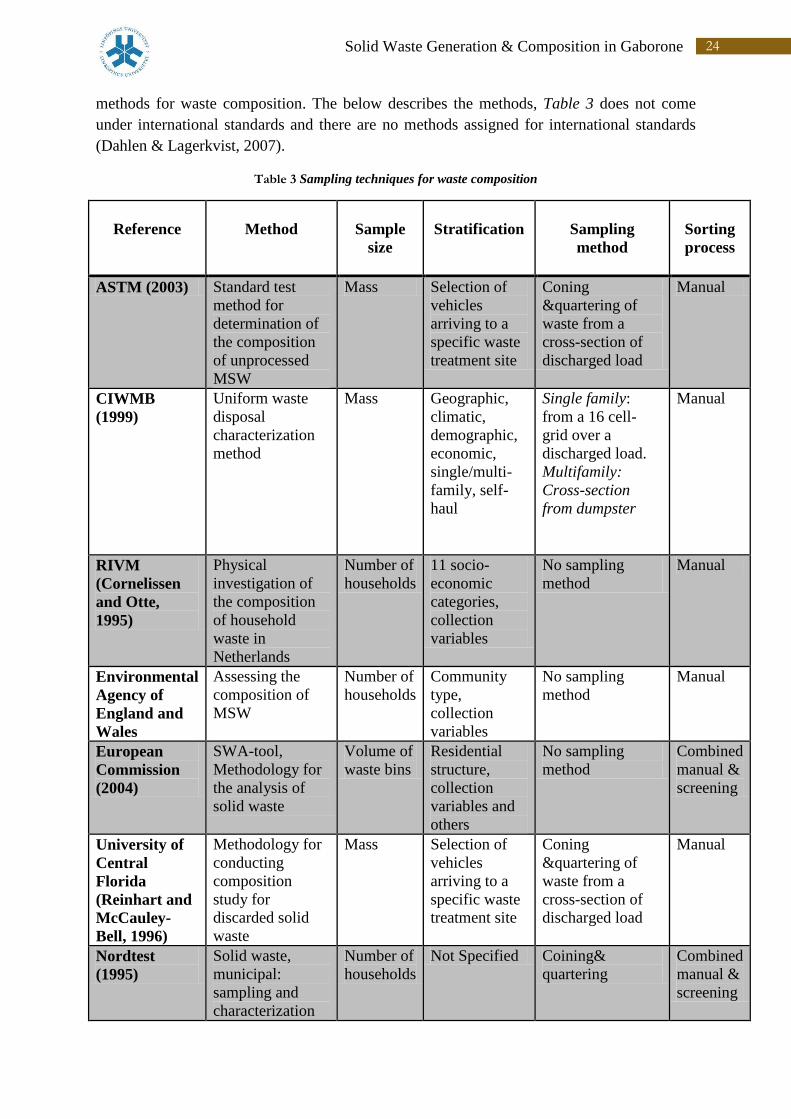
24 Solid Waste Generation & Composition in Gaborone
methods for waste composition. The below describes the methods, Table 3 does not come
under international standards and there are no methods assigned for international standards
(Dahlen & Lagerkvist, 2007).
Table 3 Sampling techniques for waste composition
Reference
Method
Sample
size
Stratification
Sampling
method
Sorting
process
ASTM (2003) Standard test
method for
determination of
the composition
of unprocessed
MSW
Mass Selection of
vehicles
arriving to a
specific waste
treatment site
Coning
&quartering of
waste from a
cross-section of
discharged load
Manual
CIWMB
(1999)
Uniform waste
disposal
characterization
method
Mass Geographic,
climatic,
demographic,
economic,
single/multi-
family, self-
haul
Single family:
from a 16 cell-
grid over a
discharged load.
Multifamily:
Cross-section
from dumpster
Manual
RIVM
(Cornelissen
and Otte,
1995)
Physical
investigation of
the composition
of household
waste in
Netherlands
Number of
households
11 socio-
economic
categories,
collection
variables
No sampling
method
Manual
Environmental
Agency of
England and
Wales
Assessing the
composition of
MSW
Number of
households
Community
type,
collection
variables
No sampling
method
Manual
European
Commission
(2004)
SWA-tool,
Methodology for
the analysis of
solid waste
Volume of
waste bins
Residential
structure,
collection
variables and
others
No sampling
method
Combined
manual &
screening
University of
Central
Florida
(Reinhart and
McCauley-
Bell, 1996)
Methodology for
conducting
composition
study for
discarded solid
waste
Mass Selection of
vehicles
arriving to a
specific waste
treatment site
Coning
&quartering of
waste from a
cross-section of
discharged load
Manual
Nordtest
(1995)
Solid waste,
municipal:
sampling and
characterization
Number of
households
Not Specified Coining&
quartering
Combined
manual &
screening

25 Solid Waste Generation & Composition in Gaborone
NSR (Ohlsson,
1998)
Waste
composition
studies. Methods
and trends
Number of
households
Geographic,
demographic,
collection
variables,
single/multi-
family
Not specified Manual
RVF (2005a) NSR solid waste
characterization
method
Mass Single/multi-
family,
community
Modified
Coining&
quartering
Manual
RVF (2005b) Municipal solid
waste
composition
analysis manual
Mass Single/multi-
family,
collection
variables
Cross-section of
elongated, flat pile
Manual
IEA (Scott,
1995)
Work in
harmonising
sampling and
analytical
protocols elated
to MSW
conservation to
energy
Mass Collection
variables
Discusses some
sampling
procedures
Manual
South African
Institution of
Civil
Engineering
(Mbande,
2003)
Appropriate
approach in
measuring waste
generation
composition and
density in
developing areas
Number of
households
Socio-
economic
No sampling
method
Manual
SAEFL (2004) A survey of the
composition of
household waste
Mass Community
type, socio-
economic,
geographic,
collection
billing system
and others
Not specified Manual
University of
Dalarna
(Petersen,
2004)
Waste component
analysis as a
planning tool
Percentage
of
population
Single/multi-
family,
collection
variables
From a 20-cell
grid over a
discharged,
flattened load
Manual
The American Society for Testing and Materials (ASTM) furnishes sampling method for
unprocessed MSW. This method considers sampling as vehicle load and the waste is spitted
using coning and quartering method (Dahlen & Lagerkvist, 2007). When the sample drops
from the vehicle it forms a conical shape arrangement, then it is made into a circular, flat
cake shape and then it is divided into 4 quarters and 2 opposite quarters are selected for
sampling and other 2 quarters are discarded (Coning and Quartering, 1997). The selected
sample is then manually categorized into 13 categories according to ASTM (Standart Test
26 Solid Waste Generation & Composition in Gaborone
Method for Determination of the Composition of Unprocessed Municipal Solid Waste, 2003).
According to California Integrated Waste Management Board (CIWMB), the vehicle load is
considered as sampling and the waste is sorted into 9 primary categories and many
subcategories. The composition study is combined with the existing data available in the
CIWMB. In 1971, National Institute of Public Health and Environment (RIVM) introduced
MSW composition in the Netherlands. The waste is stratified into 11 household types, 15
primary components and 100 secondary components. The waste is sorted by using
mechanical and manual process by using conveyor belt, magnetic equipment’s and a vibrator
and a separate laboratory for sorting in this sampling method.
The Environmental Agency of England and Wales assess MSW flow by accounting
commercial, civic amenity, littering, bulk and sweep wastes. The factors influenced for
evaluating the overall characterization of waste defined are respected to demographic data,
geographic location and socioeconomic perspective. University of central Florida conducted
the methodology for MSW by considering the vehicle load as sampling and the waste is
sorted into at least 33 categories and composition results may vary due to seasonal change
and dirt particles. Swedish Association of Waste management, a combined project of RVF,
Lulea University of Technology, the Swedish Sustainability Foundation and NSR AB follows
in steps with Pre-Investigation and design analysis as an initial process followed by sample
collection, splitting of samples, sorting into 9 main categories and 22 Subcategories and
finally ends with calculation of data. Mbande from South African Institution of Civil
Engineering defines that only considering vehicle load sampling and data from weighbridge
will not be enough for calculating the waste flow. Inclusion of local authority’s interview,
information regarding demographic details helps in obtaining better results (Dahlen &
Lagerkvist, 2007).
3.3.2 Sampling Errors
Performing accurate MSW sampling operation is really a challenging task. They are 7 types
of sampling errors defined by Pierre Gy’s Theory of sampling for waste sampling, splitting
and sorting, Table 4 (Dahlen & Lagerkvist, 2007). The sampling error is explained for
household waste, though it can be applied for MSW as it also contains waste from household.
Table 4 Sampling errors to be considered for waste composition
Sampling Errors Cause Remedy
Long-range
Heterogeneity
Fluctuation error
Collection of samples from one
place or areas with similar
properties
Collect samples from
different areas and combine it
to one sample
Periodic Heterogeneity
Fluctuation Error
Sampling is carried out and
compared in different seasons
and situations
Samples should be compared
with respective seasons and
situations
Fundamental Error Sampling solid materials like
packing materials, electronic
materials due to its
heterogeneity in shape and size
of the particle
Increase the sample size
and/or reducing the size of
the particle
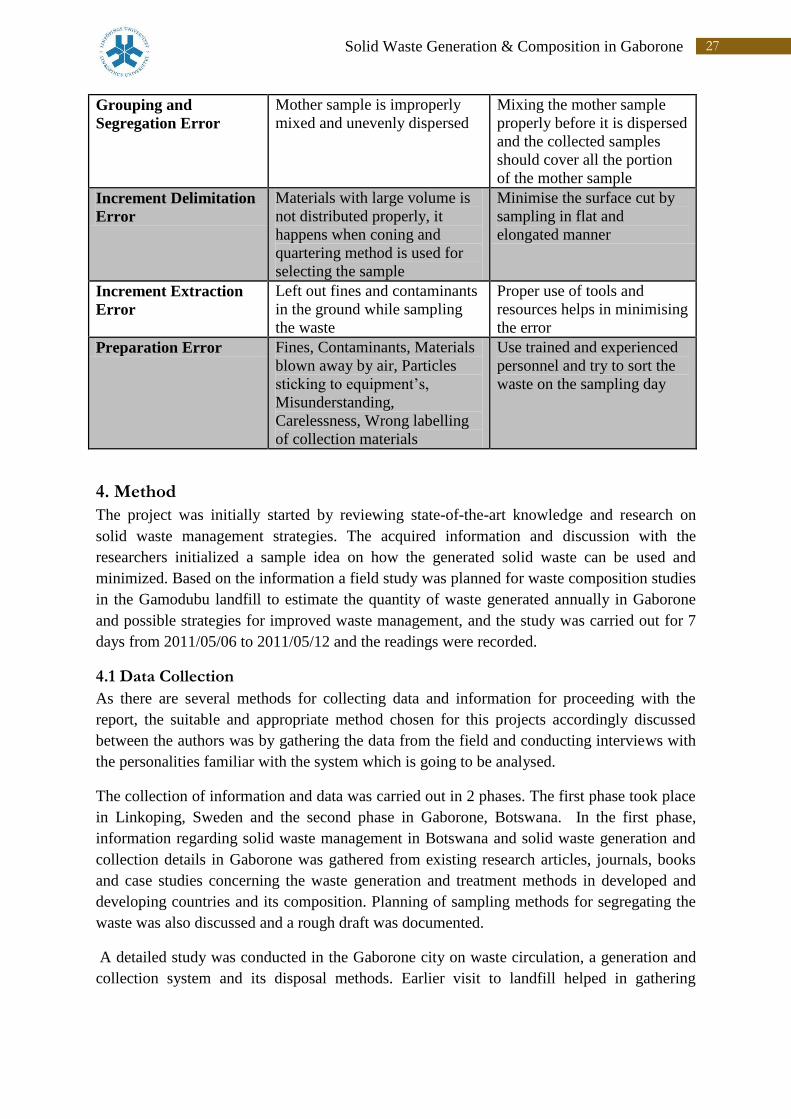
27 Solid Waste Generation & Composition in Gaborone
Grouping and
Segregation Error
Mother sample is improperly
mixed and unevenly dispersed
Mixing the mother sample
properly before it is dispersed
and the collected samples
should cover all the portion
of the mother sample
Increment Delimitation
Error
Materials with large volume is
not distributed properly, it
happens when coning and
quartering method is used for
selecting the sample
Minimise the surface cut by
sampling in flat and
elongated manner
Increment Extraction
Error
Left out fines and contaminants
in the ground while sampling
the waste
Proper use of tools and
resources helps in minimising
the error
Preparation Error Fines, Contaminants, Materials
blown away by air, Particles
sticking to equipment’s,
Misunderstanding,
Carelessness, Wrong labelling
of collection materials
Use trained and experienced
personnel and try to sort the
waste on the sampling day
4. Method
The project was initially started by reviewing state-of-the-art knowledge and research on
solid waste management strategies. The acquired information and discussion with the
researchers initialized a sample idea on how the generated solid waste can be used and
minimized. Based on the information a field study was planned for waste composition studies
in the Gamodubu landfill to estimate the quantity of waste generated annually in Gaborone
and possible strategies for improved waste management, and the study was carried out for 7
days from 2011/05/06 to 2011/05/12 and the readings were recorded.
4.1 Data Collection
As there are several methods for collecting data and information for proceeding with the
report, the suitable and appropriate method chosen for this projects accordingly discussed
between the authors was by gathering the data from the field and conducting interviews with
the personalities familiar with the system which is going to be analysed.
The collection of information and data was carried out in 2 phases. The first phase took place
in Linkoping, Sweden and the second phase in Gaborone, Botswana. In the first phase,
information regarding solid waste management in Botswana and solid waste generation and
collection details in Gaborone was gathered from existing research articles, journals, books
and case studies concerning the waste generation and treatment methods in developed and
developing countries and its composition. Planning of sampling methods for segregating the
waste was also discussed and a rough draft was documented.
A detailed study was conducted in the Gaborone city on waste circulation, a generation and
collection system and its disposal methods. Earlier visit to landfill helped in gathering
28 Solid Waste Generation & Composition in Gaborone
information regarding the waste type, carrier services, scavenging process and quantity of
waste deposited in the landfill.
Compared to other cities in Botswana, Gaborone has a high population density, which intern
serves in generating large quantities of waste per day. As it was not possible to perform a
waste composition study for the whole of the waste, sampling method was used for finding
the composition of solid waste categories. As planned in the first phase vehicles were
selected and sampling was done. Finally, the extracted data and information from both the
phases were roughly drafted initially. Based on the obtained data the result of this project was
formulated.
4.2 Solid Waste Composition Study at Gamodubu landfill
The waste composition study is to identify the amount of waste generated in the respective
region or area. In this case the solid waste composition study is used to identify and quantify
the amount of solid waste generated in the region where most people in Botswana live. The
existing information and data in the city council and Gamodubu landfill clearly states, the
waste generated in Gaborone were collected accordingly to the stratums. The stratums have
numerous garbage collection bins and the waste collection vehicles travel to the respective
stratum and collect waste from all the garbage bins and transport it to the landfill. Waste
collection vehicles are allocated to different stratums by both government and private bodies.
Basically the waste in Gaborone is collected and transported to the landfill accordingly to the
categories like household, commercial and industrial and others. As this project deals only
with Gaborone city, the vehicles carrying the waste from Gaborone was only taken into
account.
The waste composition method applied in this project was not similar to the above described
methods, table 3. The basic idea to perform the waste composition study has been extracted
from the methods as guidance for the project. Most of the methods mainly focus only on the
household waste and some of them uses mechanical equipment for sorting and few does not
possess any sampling method. So, based on the available material, human resources,
geographic, climatic condition and time constraint, unique waste composition method was
discussed and assessed and also sampling errors, table 4 are considered in this field study.
4.2.1 Procedure for Analysing the Solid Waste Composition
Initially the waste was categorized into 4 main primary categories (household waste,
commercial waste, industrial waste and other waste). According to Sharma and McBean
(2006) it was enough to sub categorize to 10 secondary categories to attain the stability of the
waste components. One of the secondary categories (plastics) was further divided into 5 sub
categories. According to the stratums, the vehicles were selected for sampling and 1 vehicle
containing more than 500kg of waste was selected as mother sample every day from each
stratum. Likewise 2 mother samples for the 1 main primary category was sorted for
comparison and for acquiring good results with the consideration of human errors and other
factors like wind and rain which has greater influence on waste in the landfill. So total 8
mother samples, 2 samples from 1 main category was sorted and evaluated. After the
selection of vehicle the waste was unloaded and sorted into 10 secondary categories in
29 Solid Waste Generation & Composition in Gaborone
separate containers and it was weighted using an electronic weighing scale and readings were
recorded.
4.2.2 Sample size
The number of mother samples and sample size were decided based on the theory of
convergence. According to this theory there is no need to consider more samples if the
composition of the waste stream is coherent with the composition of the previously sorted
sample. So, sample size with 300kgs was taken from each mother sample and then it was
sorted.
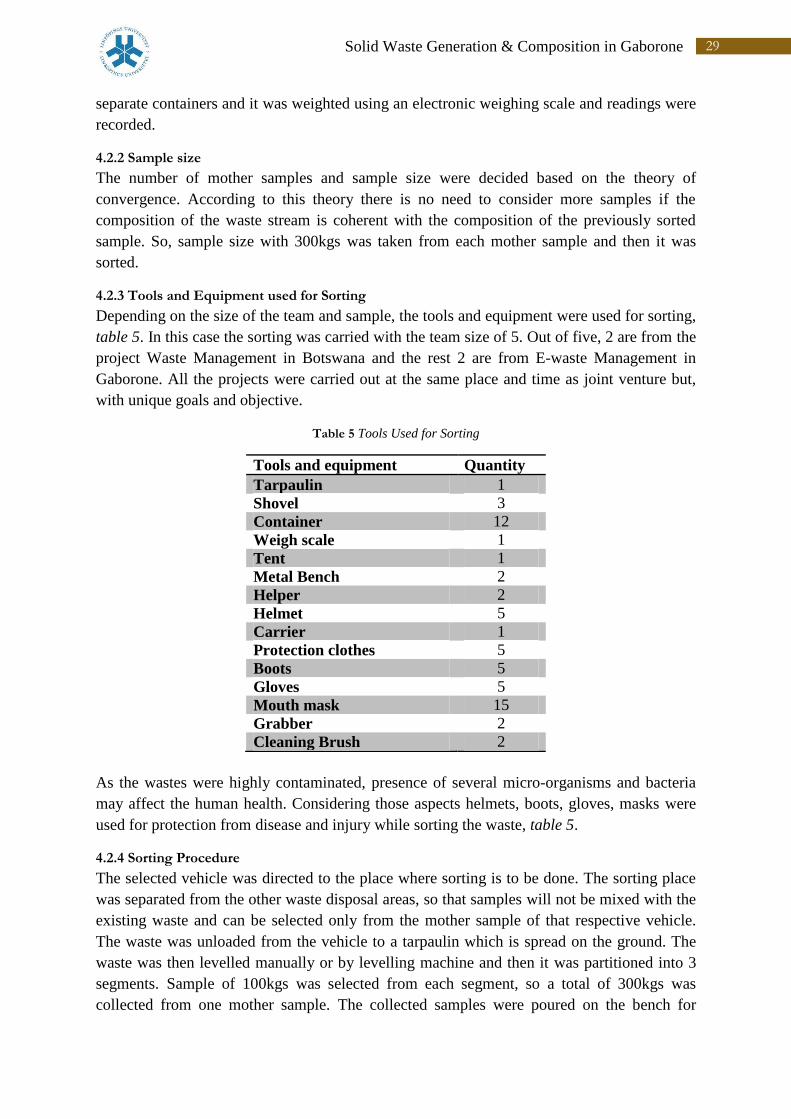
4.2.3 Tools and Equipment used for Sorting
Depending on the size of the team and sample, the tools and equipment were used for sorting,
table 5. In this case the sorting was carried with the team size of 5. Out of five, 2 are from the
project Waste Management in Botswana and the rest 2 are from E-waste Management in
Gaborone. All the projects were carried out at the same place and time as joint venture but,
with unique goals and objective.
Table 5 Tools Used for Sorting
Tools and equipment Quantity
Tarpaulin 1
Shovel 3
Container 12
Weigh scale 1
Tent 1
Metal Bench 2
Helper 2
Helmet 5
Carrier 1
Protection clothes 5
Boots 5
Gloves 5
Mouth mask 15
Grabber 2
Cleaning Brush 2
As the wastes were highly contaminated, presence of several micro-organisms and bacteria
may affect the human health. Considering those aspects helmets, boots, gloves, masks were
used for protection from disease and injury while sorting the waste, table 5.
4.2.4 Sorting Procedure
The selected vehicle was directed to the place where sorting is to be done. The sorting place
was separated from the other waste disposal areas, so that samples will not be mixed with the
existing waste and can be selected only from the mother sample of that respective vehicle.
The waste was unloaded from the vehicle to a tarpaulin which is spread on the ground. The
waste was then levelled manually or by levelling machine and then it was partitioned into 3
segments. Sample of 100kgs was selected from each segment, so a total of 300kgs was
collected from one mother sample. The collected samples were poured on the bench for
30 Solid Waste Generation & Composition in Gaborone
sorting. The waste was then sorted into 10 secondary categories and collected in separate
containers. The containers were weighed and the observations were noted. The container
which consists of sorts plastic waste was again sub-sorted into 5 Subcategories and it was
weighed and noted (for more detailed information see appendix 9.15).
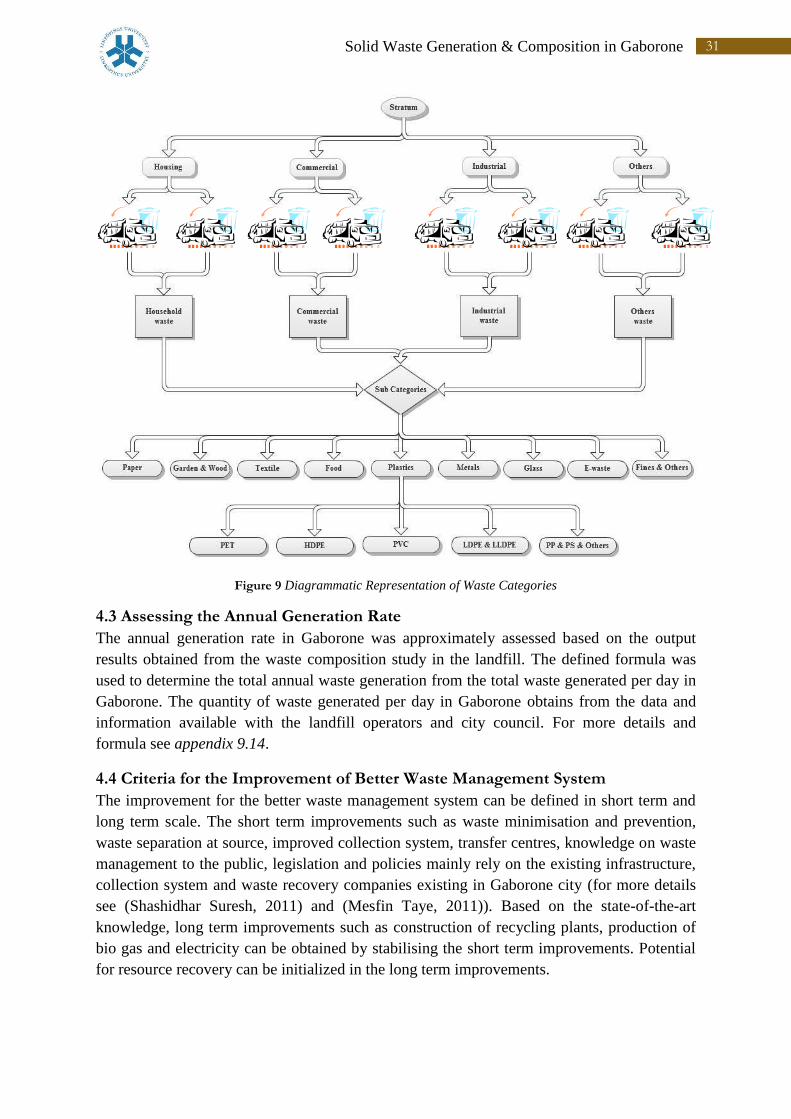
Under each primary category the waste was subdivided into 10 secondary categories as paper,
wood, textile, food, rubber or leather, plastics, garden waste, metals, glass and electronic
waste. The plastics were further sub categorized into LPDE and LLDPE, HDPE, PET, PVC,
PP, PS and others it has been coded as code 1 for PET, code 2 for HDPE, code 3 for PVC,
code 4 for LPDE and LLPDE, code 5 for PP, code 6 for PS and code 7 for others, figure.9.
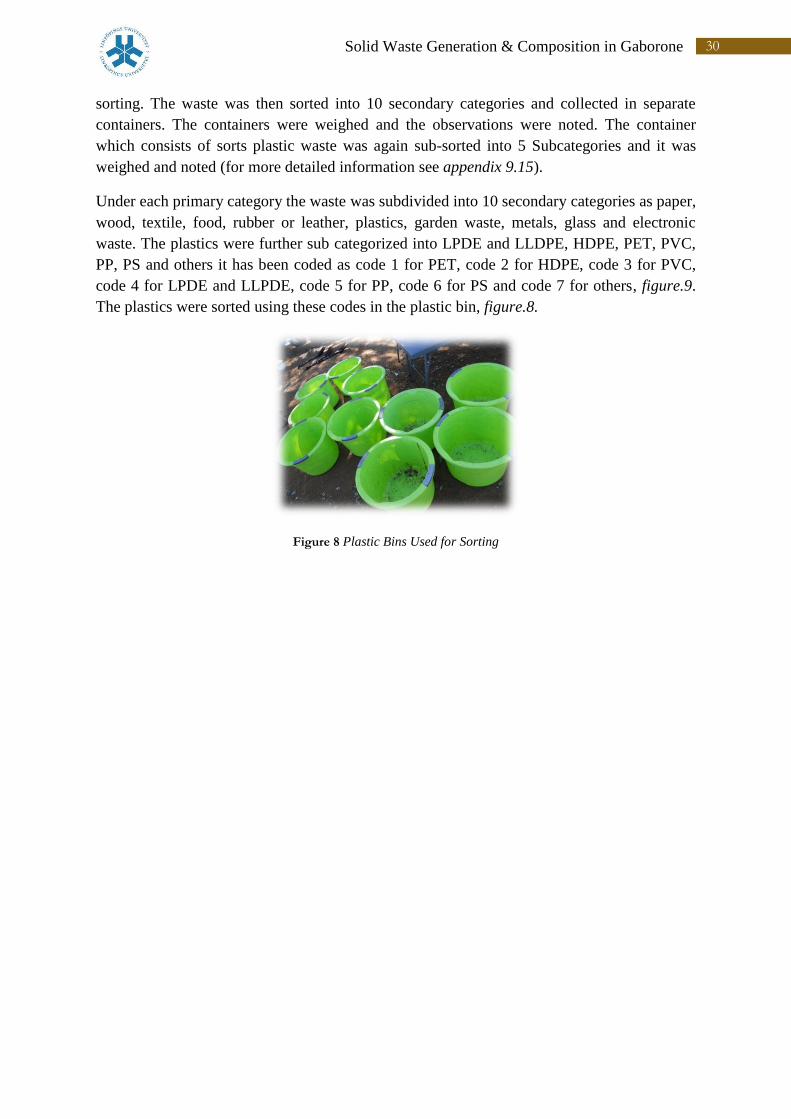
The plastics were sorted using these codes in the plastic bin, figure.8.
Figure 8 Plastic Bins Used for Sorting
31 Solid Waste Generation & Composition in Gaborone
Figure 9 Diagrammatic Representation of Waste Categories
4.3 Assessing the Annual Generation Rate
The annual generation rate in Gaborone was approximately assessed based on the output
results obtained from the waste composition study in the landfill. The defined formula was
used to determine the total annual waste generation from the total waste generated per day in
Gaborone. The quantity of waste generated per day in Gaborone obtains from the data and
information available with the landfill operators and city council. For more details and
formula see appendix 9.14.
4.4 Criteria for the Improvement of Better Waste Management System
The improvement for the better waste management system can be defined in short term and
long term scale. The short term improvements such as waste minimisation and prevention,
waste separation at source, improved collection system, transfer centres, knowledge on waste
management to the public, legislation and policies mainly rely on the existing infrastructure,
collection system and waste recovery companies existing in Gaborone city (for more details
see (Shashidhar Suresh, 2011) and (Mesfin Taye, 2011)). Based on the state-of-the-art
knowledge, long term improvements such as construction of recycling plants, production of
bio gas and electricity can be obtained by stabilising the short term improvements. Potential
for resource recovery can be initialized in the long term improvements.
32 Solid Waste Generation & Composition in Gaborone
5. Results
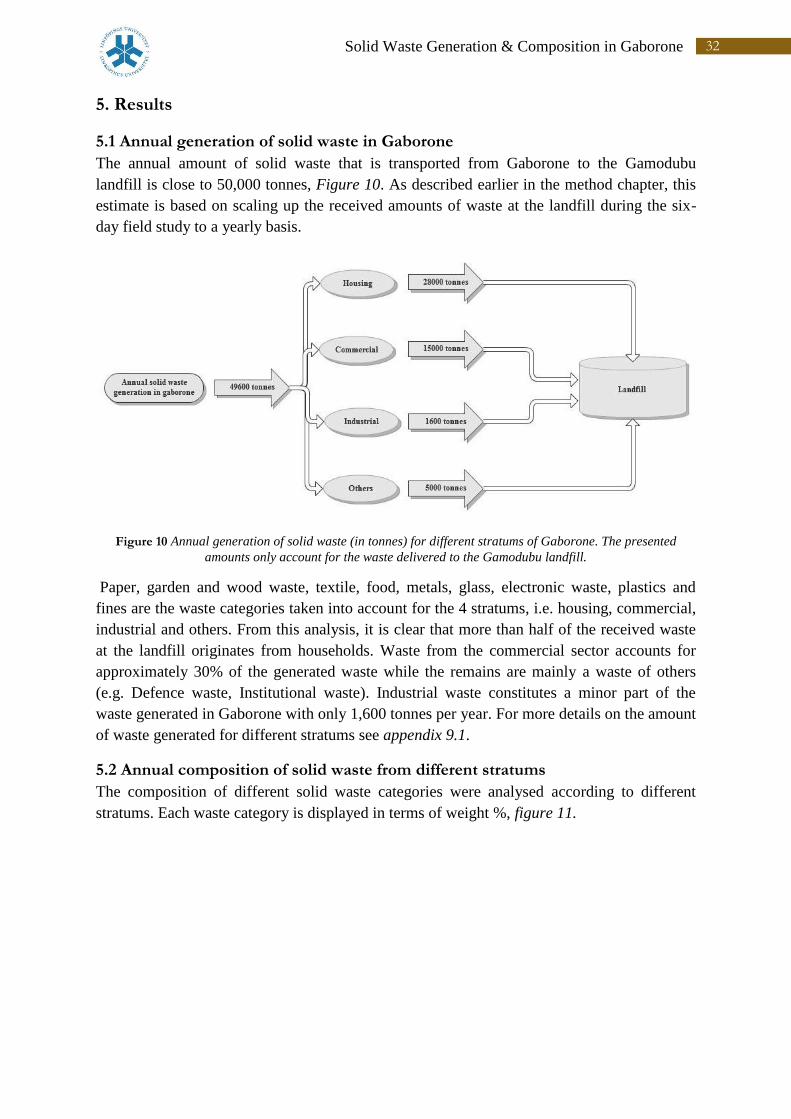
5.1 Annual generation of solid waste in Gaborone
The annual amount of solid waste that is transported from Gaborone to the Gamodubu
landfill is close to 50,000 tonnes, Figure 10. As described earlier in the method chapter, this
estimate is based on scaling up the received amounts of waste at the landfill during the six-
day field study to a yearly basis.
Figure 10 Annual generation of solid waste (in tonnes) for different stratums of Gaborone. The presented
amounts only account for the waste delivered to the Gamodubu landfill.
Paper, garden and wood waste, textile, food, metals, glass, electronic waste, plastics and
fines are the waste categories taken into account for the 4 stratums, i.e. housing, commercial,
industrial and others. From this analysis, it is clear that more than half of the received waste
at the landfill originates from households. Waste from the commercial sector accounts for
approximately 30% of the generated waste while the remains are mainly a waste of others
(e.g. Defence waste, Institutional waste). Industrial waste constitutes a minor part of the
waste generated in Gaborone with only 1,600 tonnes per year. For more details on the amount
of waste generated for different stratums see appendix 9.1.
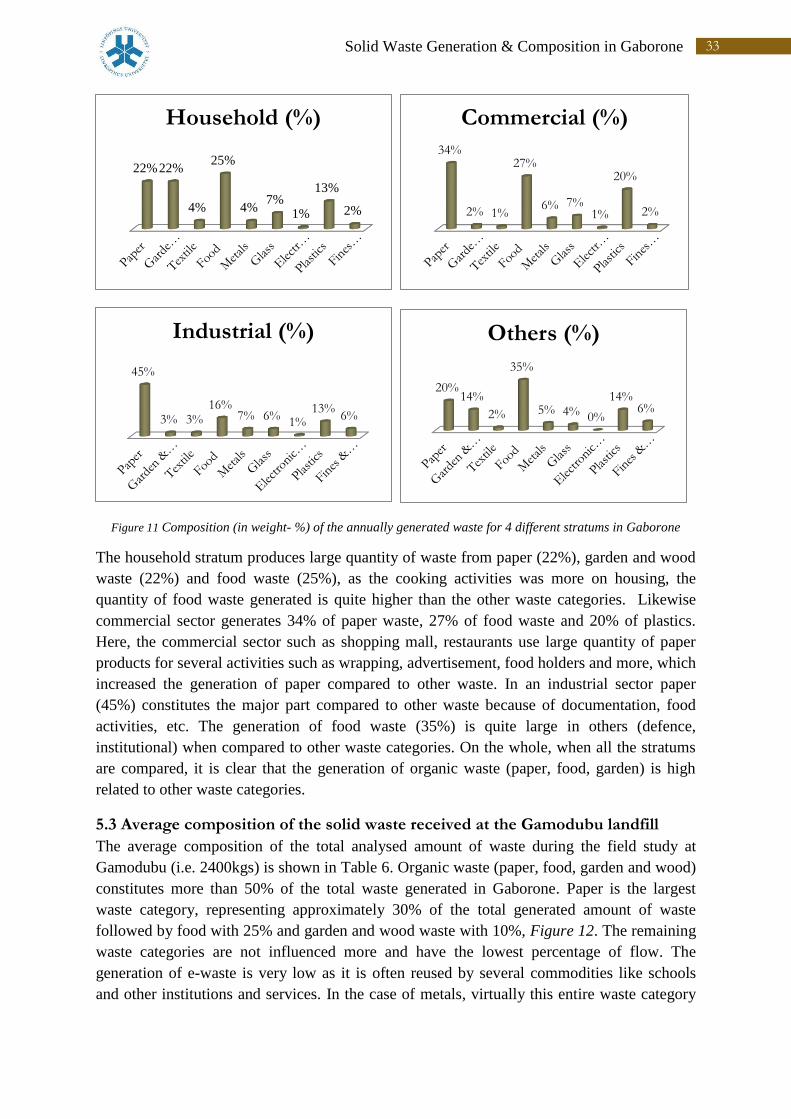
5.2 Annual composition of solid waste from different stratums
The composition of different solid waste categories were analysed according to different
stratums. Each waste category is displayed in terms of weight %, figure 11.
33 Solid Waste Generation & Composition in Gaborone
Figure 11 Composition (in weight- %) of the annually generated waste for 4 different stratums in Gaborone
The household stratum produces large quantity of waste from paper (22%), garden and wood
waste (22%) and food waste (25%), as the cooking activities was more on housing, the
quantity of food waste generated is quite higher than the other waste categories. Likewise
commercial sector generates 34% of paper waste, 27% of food waste and 20% of plastics.
Here, the commercial sector such as shopping mall, restaurants use large quantity of paper
products for several activities such as wrapping, advertisement, food holders and more, which
increased the generation of paper compared to other waste. In an industrial sector paper
(45%) constitutes the major part compared to other waste because of documentation, food
activities, etc. The generation of food waste (35%) is quite large in others (defence,
institutional) when compared to other waste categories. On the whole, when all the stratums
are compared, it is clear that the generation of organic waste (paper, food, garden) is high
related to other waste categories.
5.3 Average composition of the solid waste received at the Gamodubu landfill
The average composition of the total analysed amount of waste during the field study at
Gamodubu (i.e. 2400kgs) is shown in Table 6. Organic waste (paper, food, garden and wood)
constitutes more than 50% of the total waste generated in Gaborone. Paper is the largest
waste category, representing approximately 30% of the total generated amount of waste
followed by food with 25% and garden and wood waste with 10%, Figure 12. The remaining
waste categories are not influenced more and have the lowest percentage of flow. The
generation of e-waste is very low as it is often reused by several commodities like schools
and other institutions and services. In the case of metals, virtually this entire waste category
22% 22%
4%
25%
4% 7%
1%
13%
2%
Household (%)
34%
2% 1%
27%
6% 7% 1%
20%
2%
Commercial (%)
45%
3% 3% 16%
7% 6% 1%
13% 6%
Industrial (%)
20% 14%
2%
35%
5% 4% 0%
14% 6%
Others (%)

34 Solid Waste Generation & Composition in Gaborone
consists of aluminum cans. The use of metal and plastic packaging for food and beverages are
more common in Gaborone than using glass packaging, so the amount of waste plastic
generated is quite high while the amount of discarded metals is more or less equal to
discarded glass bottles. Fines consist of sand and other particles which cannot be processed
further.
Table 6 Amount of different waste categories in total sample size analysed at the Gamodubu landfill (i.e. 2,400
kg)
Waste Categories Amount of different
waste categories in total
sample size
Paper 719.5
Garden & Wood waste 248.2
Textile 69.45
Food 609.8
Metals 135.25
Glass 131.85
Electronic waste 14.78
Plastics 350.8
Fines & Others 111.5
Total 2391
Figure 12 Average composition (in weight- %) of the total sample size analysed at the Gamodubu landfill
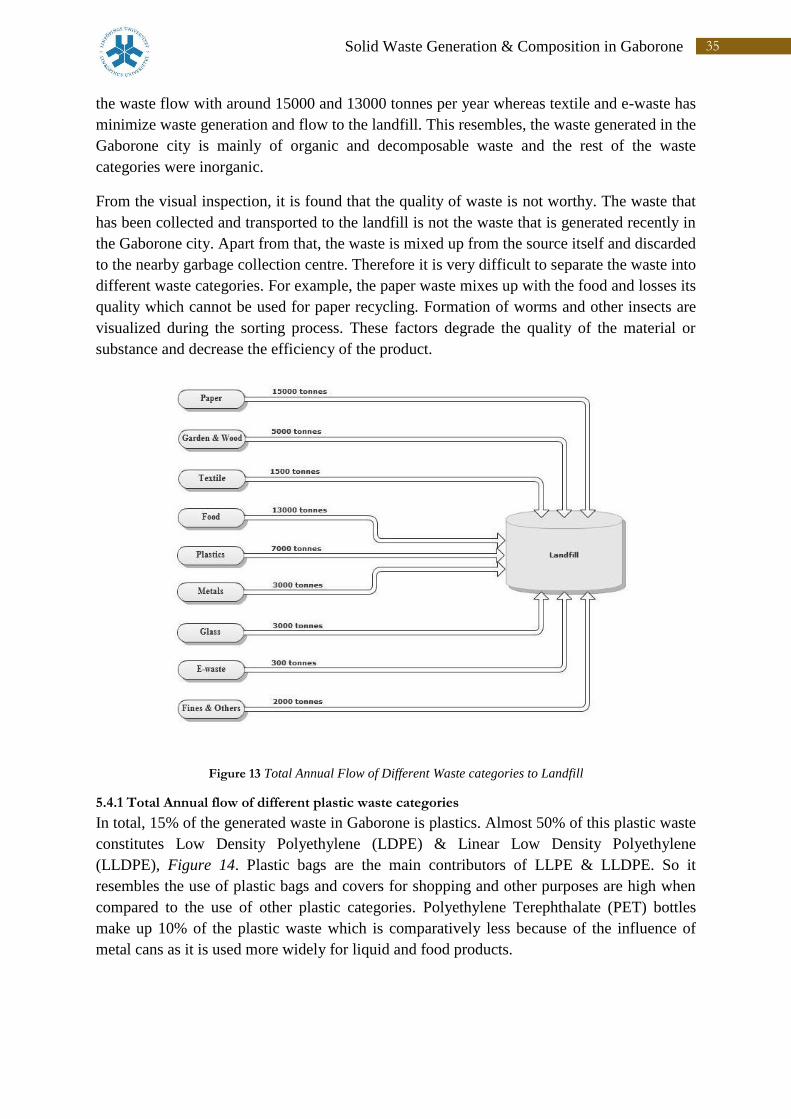
5.4 Total Annual Flow of Different Waste Categories and its Quality
The total annual flow of different waste categories into the Gamodubu landfill is estimated
based on the average composition of waste from different stratums and average amount of
total waste received to the landfill. The annual flow of waste categories from Gaborone to the
landfill is estimated and displayed, Figure 13. Paper and food are the major contributors in
Paper
30%
Garden & Wood
waste
10%
Textile
3%
Food
25%
Metals
6%
Glass
5%
Electronic waste
1% Plastics
15%
Fines & Others
5%
Annual Generation of waste categories in Gaborone
35 Solid Waste Generation & Composition in Gaborone
the waste flow with around 15000 and 13000 tonnes per year whereas textile and e-waste has
minimize waste generation and flow to the landfill. This resembles, the waste generated in the
Gaborone city is mainly of organic and decomposable waste and the rest of the waste
categories were inorganic.
From the visual inspection, it is found that the quality of waste is not worthy. The waste that
has been collected and transported to the landfill is not the waste that is generated recently in
the Gaborone city. Apart from that, the waste is mixed up from the source itself and discarded
to the nearby garbage collection centre. Therefore it is very difficult to separate the waste into
different waste categories. For example, the paper waste mixes up with the food and losses its
quality which cannot be used for paper recycling. Formation of worms and other insects are
visualized during the sorting process. These factors degrade the quality of the material or
substance and decrease the efficiency of the product.
Figure 13 Total Annual Flow of Different Waste categories to Landfill
5.4.1 Total Annual flow of different plastic waste categories
In total, 15% of the generated waste in Gaborone is plastics. Almost 50% of this plastic waste
constitutes Low Density Polyethylene (LDPE) & Linear Low Density Polyethylene
(LLDPE), Figure 14. Plastic bags are the main contributors of LLPE & LLDPE. So it
resembles the use of plastic bags and covers for shopping and other purposes are high when
compared to the use of other plastic categories. Polyethylene Terephthalate (PET) bottles
make up 10% of the plastic waste which is comparatively less because of the influence of
metal cans as it is used more widely for liquid and food products.

36 Solid Waste Generation & Composition in Gaborone
Figure 14 Composition (in weight- %) of the annually generated plastic waste in Gaborone
6. Discussion
The results show that 57% of the generated solid waste in Gaborone originates from
households, followed by 29% of commercial waste, 11% of others and 3% of industrial waste
(for further details, see appendix 9.18). A significant share of the solid waste is organic waste
(Paper 30%, Food 25%, Garden and Wood waste 10%) and only 35% is inorganic (Plastics
15%, Metals 6%, Glass 5%, Fines 5%, Textile 3%, Electronic waste 1%).
A study of municipal solid waste in the Balkan region shows that the organic share of the
waste in Bulgaria and Romania is 58.3% and 59.2%, respectively (Slavko Dvorsak, 2009-
2010). In fact, there are several other studies demonstrating that the amount of organic waste
often comprises more than 50 % of the total generated solid waste in developing countries (E.
Metin, 2003) (Mohee, 2001) (Issam A. Al-Khatib, 2010).
6.1 Strategies for Improved Waste Management in Gaborone
In Table 7( 8 )
, the environmental potential of implementing a more sophisticated waste
management system in Gaborone is presented. The quantity of waste generated annually in
Gaborone has the potential to generate electricity from organic and combustible waste.
Inorganic materials have the potential in raw materials conservation and reduced GHG
emission. However, in order to realize the overall potential of resource recovery of waste in
Gaborone, large investments will be needed for developing waste collection sites,
transportation systems and treatment and recycling plants – investments that probably only
will be possible in a long-term perspective.
8 For reference see (3.2.3, 3.2.5, 3.2.4.2)
PET 10% HDPE
19%
PVC 5%
LDPE & LLDPE
46%
PP, PS & others 20%
Percentage of different plastic waste categories
generated annually
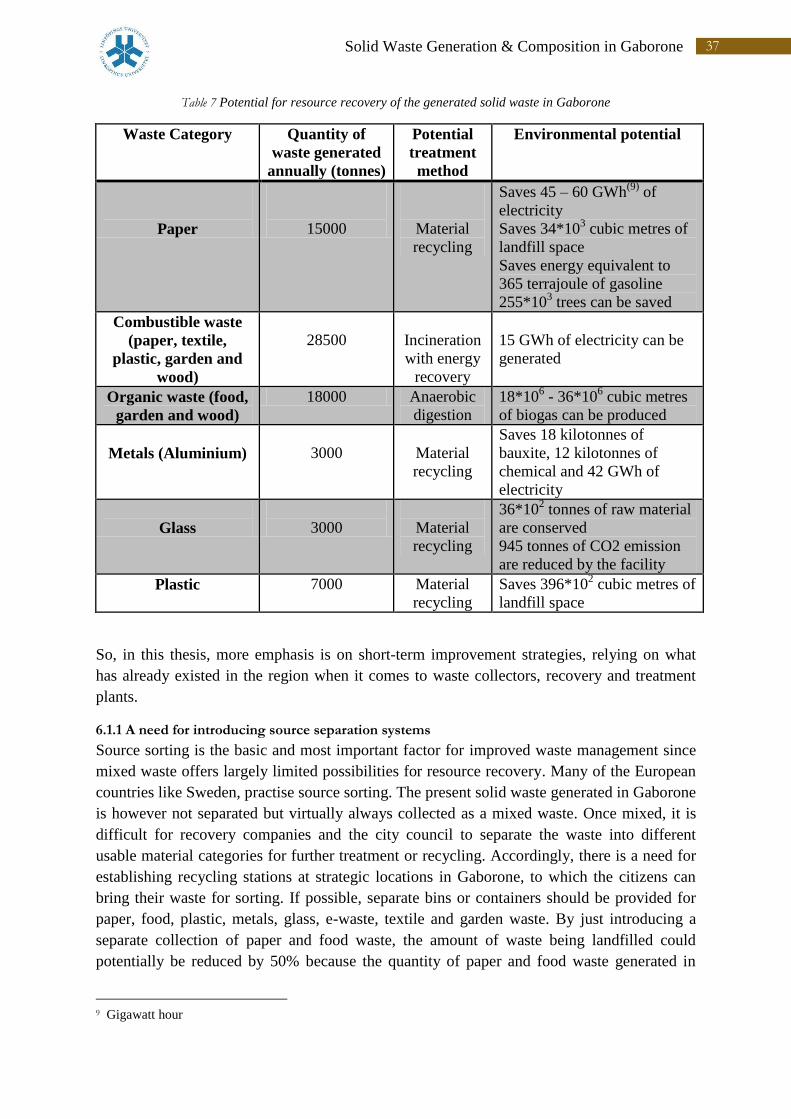
37 Solid Waste Generation & Composition in Gaborone
Table 7 Potential for resource recovery of the generated solid waste in Gaborone
Waste Category Quantity of
waste generated
annually (tonnes)
Potential
treatment
method
Environmental potential
Paper
15000
Material
recycling
Saves 45 – 60 GWh(9)
of
electricity
Saves 34*103 cubic metres of
landfill space
Saves energy equivalent to
365 terrajoule of gasoline
255*103 trees can be saved
Combustible waste
(paper, textile,
plastic, garden and
wood)
28500
Incineration
with energy
recovery
15 GWh of electricity can be
generated
Organic waste (food,
garden and wood)
18000 Anaerobic
digestion
18*106 - 36*10
6 cubic metres
of biogas can be produced
Metals (Aluminium)
3000
Material
recycling
Saves 18 kilotonnes of
bauxite, 12 kilotonnes of
chemical and 42 GWh of
electricity
Glass
3000
Material
recycling
36*102 tonnes of raw material
are conserved
945 tonnes of CO2 emission
are reduced by the facility
Plastic 7000 Material
recycling
Saves 396*102 cubic metres of
landfill space
So, in this thesis, more emphasis is on short-term improvement strategies, relying on what
has already existed in the region when it comes to waste collectors, recovery and treatment
plants.
6.1.1 A need for introducing source separation systems
Source sorting is the basic and most important factor for improved waste management since
mixed waste offers largely limited possibilities for resource recovery. Many of the European
countries like Sweden, practise source sorting. The present solid waste generated in Gaborone
is however not separated but virtually always collected as a mixed waste. Once mixed, it is
difficult for recovery companies and the city council to separate the waste into different
usable material categories for further treatment or recycling. Accordingly, there is a need for
establishing recycling stations at strategic locations in Gaborone, to which the citizens can
bring their waste for sorting. If possible, separate bins or containers should be provided for
paper, food, plastic, metals, glass, e-waste, textile and garden waste. By just introducing a
separate collection of paper and food waste, the amount of waste being landfilled could
potentially be reduced by 50% because the quantity of paper and food waste generated in
9 Gigawatt hour
38 Solid Waste Generation & Composition in Gaborone
Gaborone is more than 50% from the analysis, see Figure 13. For paper waste, there are
already existing collectors in the region and the collected food waste could be treated by
composting in order to produce soil fertilizers. Composting is a relatively simple and
inexpensive treatment method, which might be able to fit into the present social-technical
regime of Gaborone.
6.1.2 Improved collection system
The sorted waste in the recycling stations is then collected by waste collection vehicles. Due
to the long transportation distances to the Gamodubu landfill, a transfer station should be
introduced in the outskirts of the city. Here, the collected waste at recycling stations could be
temporarily stored and later the different waste categories can be distributed to their desired
location. Existing paper, glass, plastic recovery companies could collect their material either
directly from the recycling stations or from the transfer station. The residual mixed waste can
be disposed in the Gamodubu landfill, Figure 15. In case, metals or other valuable materials
still are occurring in the waste, additional recovery will take place at the landfill in terms of
scavengers collecting materials for the exiting waste collectors in the region.
The generated waste near the stratums should be collected periodically, so that the waste will
not degrade much and does not produce the odour smell. Apart from recycling stations,
plastic bottles and metal cans can also be collected by using the “Drop In and Get Paid”
method. Many of the European countries are following this kind of strategy for collecting
plastic and metal cans. In this method, collection machines are placed in shopping malls and
residential areas, and then the individual is given revenue dependent on the number and type
of bottles/cans. These types of improved collection systems will largely minimize the
quantity of waste needing transportation to the landfill and will also provide significantly
more raw material for the existing waste recovery companies in the region.
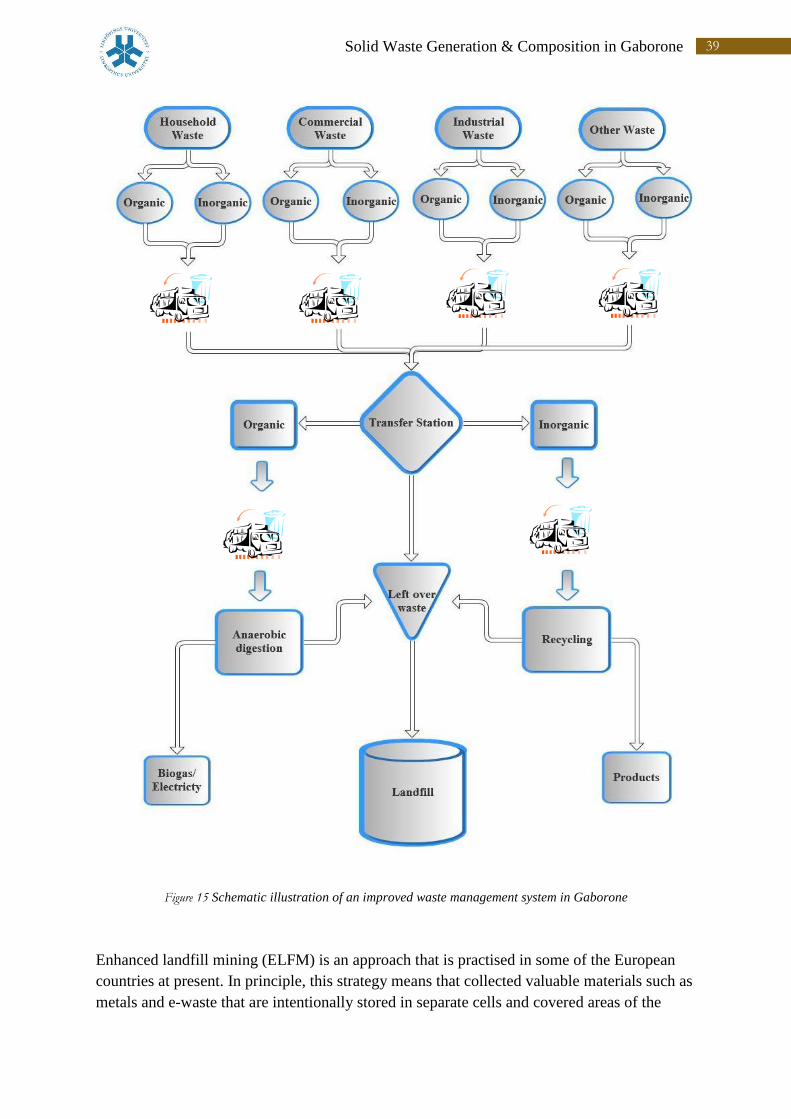
39 Solid Waste Generation & Composition in Gaborone
Figure 15 Schematic illustration of an improved waste management system in Gaborone
Enhanced landfill mining (ELFM) is an approach that is practised in some of the European
countries at present. In principle, this strategy means that collected valuable materials such as
metals and e-waste that are intentionally stored in separate cells and covered areas of the
40 Solid Waste Generation & Composition in Gaborone
landfill in order to facilitate future material valorisation, i.e. when sufficient technologies and
recycling plants have been developed. (Hogland, Hogland, & Marques). Resource scarcity,
material hibernation can be avoided by initialising ELFM. For more details see appendix
9.18.
6.1.3 Social Considerations
Government should create awareness among the public on waste management and its
applications and impacts. Awareness and knowledge sharing programs should be conducted
by the government and non-governmental organisation to increase Batswana skills and
thinking ability to waste. On the policy level, legislation and economic instruments could also
be implemented in order to create stronger incentives for providing alternatives to landfilling.
Such an approach has been widely used in the European region in terms of successively
implemented bans and taxes on landfilling of waste. However, one critical condition for
facilitating realization of the suggested measures is a stronger collaboration between the
government and existing waste recovery companies in the region. Such collaborative
approaches, e.g. public-private partnerships, enables the sharing of costs and benefits related
to developing a more sophisticated waste management system in Gaborone. For instance,
separate collection of paper waste will largely limit the transportation costs for the
government while existing paper collectors will receive significantly more “raw material”.
More detailed studies are however needed in order to illuminate the potential of such
collaborative approaches and if they really have the capacity of creating mutual benefits for
the actors involved in the waste management in the region.
41 Solid Waste Generation & Composition in Gaborone
7. Conclusion
The findings in this project present the current solid waste generation, collection and disposal
methods in Gaborone, Botswana. The strategy for waste management in Gaborone was
mainly driven by the private and government sectors. From the analysis it’s clear that large
quantity of solid waste generated in Gaborone is due to lack of environmental awareness,
improper waste management practice, public-private partnerships, collaborative approaches
and less social-economic considerations. The collection system for solid waste is
comparatively effective in Gaborone but it should be further improved more economical and
periodically. Transportation and disposal of waste are the major conflict in the city. All solid
waste which is generated and collected is disposed directly into the landfill without any waste
treatment methods. This affects the life of the landfill as well as the environment by polluting
air, water and soil and also leads to depletion of resources. The waste composition study in
Gaborone results the annual waste generated in the Gaborone and its composition shows the
percentage of waste categories of different stratums. The composition study shows, the
quantity of organic waste present in the total waste is high when compared to other waste
categories generated in Gaborone. A need for introducing the source separation system,
introducing improved collection system, application of waste treatment techniques and
creating social consideration among the people helps to promote the possibility for long term
improvement and also to find out the potential for improved waste management system,
which serves in improvising fastest growing and developing country into a developed
country. These improvements will lead to a better waste management system in the future
and also creates employment opportunities and awareness among the people on waste
management system. Supportive of governmental and non-governmental organisations,
policies and measures largely influence in building up the improvements for a sustainable
waste management system.

42 Solid Waste Generation & Composition in Gaborone
8. References
Coning and Quartering. (1997). Retrieved September 2011, from IUPAC Compendium of Chemical
Terminology.
Gaborone. (1997). Retrieved September 2011, from Botswana Places: http://www.botswana-
places.co.za/gaborone.html
(1998). National Conservation Stratergy Agency. Gaborone: Botswana's Stratergy for Waste
management.
(1999). Decision Makers’ Guide to Municipal Solid Waste Incineration. Washington, D.C: The World
Bank.
Infoplease. (2000). (Pearson Education) Retrieved September 2011, from
http://www.infoplease.com/ce6/sci/A0861169.html
Power Score Card. (2000). Retrieved October 2011, from
http://www.powerscorecard.org/tech_detail.cfm?resource_id=10
Friends of Earth. (2002, November). Retrieved September 2011, from The Safety of Incinerator
Ash: http://www.foe.co.uk/resource/briefings/safety_incinerator_ash.pdf
(2003). Standart Test Method for Determination of the Composition of Unprocessed Municipal Solid Waste.
The American Society for Testing and Materials (ASTM).
Waste Online. (2006, Januaury). Retrieved October 2011, from
http://dl.dropbox.com/u/21130258/resources/informationsheets/paper.htm
Waste Online. (2006, February). Retrieved October 2011, from
http://dl.dropbox.com/u/21130258/resources/InformationSheets/Glass.htm
Friends of Earth. (2007, September). Retrieved September 2011, from Briefing Anaerobic
digestion: http://www.foe.co.uk/resource/briefings/anaerobic_digestion.pdf
Assessment of Current Waste Management System. (2009). UNEP. IV, p. 21. Osaka/Shinga,
Japan: United Nations Environmental Programme.
Benefits of Recycling. (2010). Retrieved September 2011, from http://www.benefits-of-
recycling.com/definitionofcomposting.html
Benefits of Recycling. (2010). Retrieved October 2011, from http://www.benefits-of-
recycling.com/recyclingmetals.html
BMRA. (2010). Retrieved October 2011, from Metal recycling.
Statistics Canada. (2010, Febrauary 25). Retrieved November 11, 2011, from
http://www.statcan.gc.ca/kits-trousses/environmentlessons-
leconsenvironnement/edu04_0127e-eng.htm

43 Solid Waste Generation & Composition in Gaborone
The World Bank. (2010, September). Retrieved September 2011, from
http://web.worldbank.org/WBSITE/EXTERNAL/COUNTRIES/AFRICAEXT/BO
TSWANAEXTN/0,,menuPK:322821~pagePK:141132~piPK:141107~theSitePK:32280
4,00.html
Benefits of Recycling. (2011). Retrieved October 2011, from http://www.benefits-of-
recycling.com/recyclingpaper.html
Benefits of Recycling. (2011). Retrieved October 2011, from Earth911:
http://earth911.com/recycling/plastic/plastic-bottles/benefits-of-recycling-plastic-
bottles/
Botswana Government. (2011). Retrieved September 2011, from http://www.gov.bw/tn/Ministries-
-Authorities/Ministries/Ministry-of-Local-GovernmentMLG/Local-
Authorities/Kweneng-District-Council/Tools-and-Services/Services/WASTE-
DISPOSAL-SERVICE/
EIONET. (2011). Retrieved September 2011, from http://scp.eionet.europa.eu/themes/waste
Environmentalist Everyday. (2011). Retrieved November 11, 2011, from
http://www.environmentalistseveryday.org/solid-waste-management/environment-
friendly-waste-disposal/about-composting.php
European Commision. (2011). Retrieved November 11, 2011, from
http://ec.europa.eu/environment/waste/index.htm
Eurostat. (2011, April). Retrieved September 2011, from Eurpean commision:
http://epp.eurostat.ec.europa.eu/portal/page/portal/waste/news
Gamodubu Background. (2011). Retrieved September 2011, from Botswana Government:
http://www.gov.bw/tn/Ministries--Authorities/Ministries/Ministry-of-Local-
GovernmentMLG/Local-Authorities/Kweneng-District-Council/Tools-and-
Services/Services/WASTE-DISPOSAL-SERVICE/
Green StudentU. (2011). Retrieved October 2011, from
http://www.greenstudentu.com/encyclopedia/recycling/paper
Pollution Issues. (2011). Retrieved September 2011, from http://www.pollutionissues.com/Re-
Sy/Solid-Waste.html
Recycling Revolution. (2011). Retrieved October 2011, from http://www.recycling-
revolution.com/recycling-facts.html
Source reduction and Reuse. (2011). Retrieved November 12, 2011, from Keep America Beautiful:
http://www.kab.org/site/PageServer?pagename=source_reduc_reuse
U.S. Department of State. (2011, june 29). Retrieved September 2011, from
http://www.state.gov/r/pa/ei/bgn/1830.htm#econ
44 Solid Waste Generation & Composition in Gaborone
ucopenaccess. (2011). Retrieved September 2011, from
http://www.ucopenaccess.org/courses/APEnvSci/course%20files/readings/5b_Solid_
Waste.pdf
UNEP/GRID-Arendal. (2011). Retrieved September 2011, from
http://www.grida.no/publications/vg/waste/page/2853.aspx
USEPA. (2011, March). Retrieved November 11, 2011, from
http://www.epa.gov/epawaste/conserve/rrr/composting/benefits.htm
Waste Hierarchy Management. (2011). Retrieved November 15, 2011, from Earth911:
http://earth911.com/news/2009/03/09/waste-hierarchy-whos-on-top-in-the-game-of-
trash/
Zambezi. (2011). Retrieved September 2011, from
http://www.zambezi.co.uk/safari/botswana/mapbw.html
Akinbode, F. (2010). Enviromental Health. Walden University: PUBH-6165-4.
Alves, J. S., Gao, Q., Cabrera, L. C., Mareckova, K., Oonk, H., Scheehle , E., . . . Yamada, M.
(2006). Biological Treatment for Solid Waste. In R. Pipatt, M. M. Sonia, S. Eggleston, L.
Buendia, K. Miwa, T. Ngara, & K. Tanabe (Eds.), Waste (Vol. 5, pp. 4.1-4.8). Institute for
Global Environmental Strategies (IGES) behalf of Intergovernmental Panel on Climate
Change (IPCC).
Ann.C, D. (2011). Feedstocks for Biogas Production. University of florida, Soil and Water Science
Department. Gainesville: University of Florida.
Bloch, M. (2010, August 08). Recycling Energy savings. Green Living tips. Retrieved October 2011,
from http://www.greenlivingtips.com/articles/182/1/Recycling-energy-savings.html
Buxmann, K., Furrer, P., Gerber, J., Glimm, S., Morrison, J., Schafer, J., & Vigeland, P. (n.d.).
Aluminium Recycling in Europe. European Aluminium Association.
Combs, S. (2008). Municipal Waste Combustion. In S. Combs, The Energy Report. Texas.
Complete Recycling. (2011). Paper Recycling. Retrieved October 2011, from Complete Recycling:
http://www.completerecycling.com/Resources/Paper-Recycling.aspx
Dahlen, L., & Lagerkvist, A. (2007). Methods for household waste composition studies. Luleå University
of Technology, Division of Waste Science and Technology. Luleå: Science Direct.
Debra, R., & McCauley, P. (1996). Methodology for Conducting Composition Study for Discarded Waste.
University of Central Florida, Gainesville, Florida.
E. Metin, A. E. (2003). Solid waste management practices and review of recovery and recycling operations in
Turkey. Waste Management, Turkey.
Ednah, K., & Luo, Z. (2010, May 20). An Evaluation of waste management in Botswana:
Achievements and Challenges. Journal of American Science, 9.
45 Solid Waste Generation & Composition in Gaborone
Enviros Consulting; University of Birmingham;. (n.d.). Review of Environmental and Health
Effects of Waste Management: Municipal Solid Waste and Similar Wastes. United
Kingdom.
Envirotech Ltd. (n.d.). Solid Waste Management Guidance Manual. Retrieved November 11, 2011,
from syrleb: http://syrleb.org/LINKS/SolidWasteManual.pdf
Hanson, R. (2011). Greenliving. Retrieved October 2011, from
http://greenliving.lovetoknow.com/How_Does_Recycling_Paper_Help_Landfills
Hogland, W., Hogland, M., & Marques, M. (n.d.). Enhanced landfill mining. Linnaeus university,
The School of natural Science, Kalmar. Retrieved November 30, 2011, from elfm.
I. Korner, K. L. (2003-2006). Municipal solid Waste Generation in Asia. In R. S. I. Korner, & D.
l. Dr. D. Aslan (Ed.), Solid Waste Management in Asia (p. 220). TUHH, hamburg University
of Technology, Germany.
Issam A. Al-Khatib, M. M. (2010, January 29). Solid waste characterization, quantification and
management practices in developing countries. A case study: Nablus district – Palestine.
Journal of Environmental Management, 8.
Kgathi, D., & Bolaane, B. (2001). Instruments for Sustainable Solid Waste Management in Botswana.
Kulkarni, S. (2008). Solid Waste Management. Environmental Engineering, Kolhapur. Retrieved
November 12, 2011, from Slideshare: http://www.slideshare.net/s181185/study-on-
solid-waste-management-presentation
Kuniyal, J. C. (2010). Solid Waste Management in the Sensitive Hills of the North-western
Himalayas. In J. Singh, R. AL, J. Singh, & R. AL (Eds.), Solid Waste Management - Present
and Future Challenges (p. 260). kullu-Manali: I.K International Publishing House Pvt Ltd.
Mesfin Taye, W. K. (2011). E-waste Management in Botswana. Linkoping University, Environmental
Management and Technology. Linkoping: Linkoping University.
Mohee, R. (2001). Assessing the recovery potential of solid waste in Mauritius. Journal of
Environmental Management.
Mokgoabone, K. (2008, February 14). Landfill for Greater Gaborone being built at Gamodubu.
Mmegi online. Retrieved September 2011, from
http://www.mmegi.bw/index.php?sid=4&aid=14&dir=2008/February/Thursday14
Monnet, F. (2003). An Introduction to Anaerobic Digestion of Organic Waste.
Njeru, P. (2006, May). History of gaborone. The African Executive. Retrieved September 2011,
from http://www.africanexecutive.com/modules/magazine/articles.php?article=703
Nocera, J. (2008, August 8). Diamonds Are Forever in Botswana. The Newyork Times.
North Yorkshire County Council. (2010, October 14). What happens to the ash produced?
North Yorkshire , Northallerton, North Yorkshire.

46 Solid Waste Generation & Composition in Gaborone
Sally, R. (2004). Loudoun County Solid Waste Management Paln. Department of Environmental
Quality. Retrieved November 12, 2011, from
http://www.loudoun.gov/controls/speerio/resources/RenderContent.aspx?data=261fe
1d05619458da36e109160b8d5f1&tabid=331&fmpath=%2FSWMP
Segosebe, E., & Vanderpost, C. (1991). Urban Industrial Pollution Waste in Botswana.
Shashidhar Suresh, V. k. (2011). Solid Waste Management in Gaborone. Linkoping University,
Environmental Technology, Linkoping.
Slavko Dvorsak, J. V. (2009-2010). Sampling and Analysis Of Solid Municipal Waste In Balkan Region:
The First Results And Their Significance. National Technical University of Athens, Chemical
Engineering.
Tielemans, Y., & Laevers, P. (n.d.). Closing the circle, an Enhanced landfill mining case study. Belgium.
USEPA. (2007, December 27). Source Reduction. Retrieved November 12, 2011, from Ecomii:
http://www.ecomii.com/waste/source-reduction?page=2
West , L. (2011). Benefits of Glass Recycling: Why Recycle Glass? Environmental Issues . Retrieved
October 2011, from About Environmental Issues:
http://environment.about.com/od/recycling/a/benefits_of_glass_recycling.htm
47 Solid Waste Generation & Composition in Gaborone
9. Appendix
9.1 Data Collection from Each Stratum
9.1.1 Household (Vehicle 1)
Stratum Household waste Vehicle Reg. No. B390ARV
Client Gaborone City Council Gross weight 28300 kg
Department Gaborone City Council Vehicle weight 15780 kg
Waste type Domestic waste Waste weight 12520 kg
Waste type code A *Total fee P500.85
Rate 0.04 per kg
Waste Categories Weight (kg)
Paper 79.60
Garden & Wood waste 42.45
Textile 12.20
Food 84.25
Metals 18.55
Glass 12.45
Electronic waste 1.11
Plastics 47.30
Fines & Others 1.70
Plastic Categories Weight (kg)
PET (code – 1) 6.05
HDPE (code – 2) 12.80
PVC (code – 3) 1.80
LDPE & LLDPE (code – 4) 14.55
PP (code – 5), PS (code – 6) & others (code – 7) 7.60
9.1.2 Household (vehicle 2)
Stratum Household waste Vehicle Reg. No. B115ARS
Client Gaborone City Council Gross weight 19580 kg
Department Gaborone City Council Vehicle weight 12840 kg
Waste type Domestic waste Waste weight 6740 kg
Waste type code A *Total fee P269.60
Rate 0.04 per kg
48 Solid Waste Generation & Composition in Gaborone
Waste Categories Weight (kg)
Paper 55.05
Garden & Wood waste 87.80
Textile 15.20
Food 59.30
Metals 10.00
Glass 25.65
Electronic waste 3.69
Plastics 30.30
Fines & Others 11.55
Plastic Categories Weight (kg)
PET (code – 1) 3.15
HDPE (code – 2) 5.50
PVC (code – 3) 0.20
LDPE & LLDPE (code – 4) 15.35
PP (code – 5), PS (code – 6) & others (code – 7) 3.25
9.1.3 Commercial (Vehicle 1)
Stratum Commercial waste Vehicle Reg. No. B875AIB
Client Skip Hire Gross weight 13020 kg
Department Skip Hire Vehicle weight 10000 kg
Waste type Domestic waste Waste weight 3020 kg
Waste type code A *Total fee P120.81
Rate 0.04 per kg
Waste Categories Weight (kg)
Paper 92.40
Garden & Wood waste 0.00
Textile 1.45
Food 92.35
Metals 14.25
Glass 34.85
Electronic waste 2.01
Plastics 50.50
Fines & Others 10.95
Plastic Categories Weight (kg)
PET (code – 1) 4.05
HDPE (code – 2) 7.25
49 Solid Waste Generation & Composition in Gaborone
PVC (code – 3) 4.00
LDPE & LLDPE (code – 4) 23.00
PP (code – 5), PS (code – 6) & others (code – 7) 8.30
9.1.4 Commercial (Vehicle 2)
Stratum Commercial waste Vehicle Reg. No. B875AIB
Client Skip Hire Gross weight 13940 kg
Department Skip Hire Vehicle weight 9780 kg
Waste type Domestic waste Waste weight 4160 kg
Waste type code A *Total fee P166.42
Rate 0.04 per kg
Waste Categories Weight (kg)
Paper 113.50
Garden & Wood waste 11.00
Textile 4.00
Food 79.40
Metals 16.25
Glass 10.10
Electronic waste 2.07
Plastics 61.75
Fines & Others 1.20
Plastic Categories Weight (kg)
PET (code – 1) 4.10
HDPE (code – 2) 9.55
PVC (code – 3) 2.95
LDPE & LLDPE (code – 4) 28.90
PP (code – 5), PS (code – 6) & others (code – 7) 9.65
9.1.5 Industrial (Vehicle 1)
Stratum Industrial waste Vehicle Reg. No. B721AMJ
Client Diamond Trading Company Gross weight 4220 kg
Department Diamond Trading Company Vehicle weight 3680 kg
Waste type Domestic waste Waste weight 540 kg
Waste type code A *Total fee P21.60
Rate 0.04 per kg

50 Solid Waste Generation & Composition in Gaborone
Waste Categories Weight (kg)
Paper 134.30
Garden & Wood waste 3.30
Textile 0.75
Food 85.55
Metals 6.45
Glass 5.50
Electronic waste 2.65
Plastics 36.40
Fines & Others 23.15
Plastic Categories Weight (kg)
PET (code – 1) 1.55
HDPE (code – 2) 4.25
PVC (code – 3) 0.05
LDPE & LLDPE (code – 4) 10.55
PP (code – 5), PS (code – 6) & others (code – 7) 16.48
9.1.6 Industrial (Vehicle 2)
Stratum Industrial waste Vehicle Reg. No. B155AJZ
Client Cleaning Wizards Gross weight 9080 kg
Department Cleaning Wizards Vehicle weight 8800 kg
Waste type Domestic waste Waste weight 280 kg
Waste type code A *Total fee P11.20
Rate 0.04 per kg
Waste Categories Weight (kg)
Paper 121.30
Garden & Wood waste 19.00
Textile 20.70
Food 8.70
Metals 40.35
Glass 17.75
Electronic waste 2.95
Plastics 38.60
Fines & Others 28.40
Plastic Categories Weight (kg)
PET (code – 1) 1.90
HDPE (code – 2) 13.50

51 Solid Waste Generation & Composition in Gaborone
PVC (code – 3) 4.50
LDPE & LLDPE (code – 4) 11.85
PP (code – 5), PS (code – 6) & others (code – 7) 5.15
9.1.7 Others (Vehicle 1)
Stratum Other waste Vehicle Reg. No. BDF7018
Client SSKB BDF Gross weight 18540 kg
Department SSKB BDF Vehicle weight 17200 kg
Waste type Domestic waste Waste weight 1340 kg
Waste type code A *Total fee P53.61
Rate 0.04 per kg
Waste Categories Weight (kg)
Paper 47.05
Garden & Wood waste 68.80
Textile 10.50
Food 96.10
Metals 7.00
Glass 20.95
Electronic waste 0.19
Plastics 28.15
Fines & Others 21.15
Plastic Categories Weight (kg)
PET (code – 1) 3.60
HDPE (code – 2) 3.15
PVC (code – 3) 0.65
LDPE & LLDPE (code – 4) 15.85
PP (code – 5), PS (code – 6) & others (code – 7) 3.25
9.1.8 Others (Vehicle 2)
Stratum Other waste Vehicle Reg. No. B249AMM
Client Petrib Marketing Services Gross weight 3340 kg
Department Petrib Marketing Services Vehicle weight 2120 kg
Waste type Domestic waste Waste weight 1220 kg
Waste type code A *Total fee P48.80
Rate 0.04 per kg
52 Solid Waste Generation & Composition in Gaborone
Waste Categories Weight (kg)
Paper 76.30
Garden & Wood waste 15.85
Textile 4.65
Food 104.15
Metals 22.40
Glass 4.60
Electronic waste 0.11
Plastics 57.80
Fines & Others 13.40
Plastic Categories Weight (kg)
PET (code – 1) 6.50
HDPE (code – 2) 6.10
PVC (code – 3) 3.15
LDPE & LLDPE (code – 4) 27.00
PP (code – 5), PS (code – 6) & others (code – 7) 8.50
9.2 Total Amount of Solid Waste generated in the Gamodubu landfill on 2011/05/07
Waste Type Waste Code
Waste Quantity
(kg)
*Amount
(Pula)
Domestic waste A 194440 6088.58
Garden waste B 6620 116.41
Medical waste C 980 17401.74
Tires D 2760 0
Soil material F 940 0
Recyclable tires Q 200 0
9.3 Total Amount of Solid Waste Generated in Landfill on 2011/05/07 based on Stratum
Stratum
Waste Quantity
(kg)
Household waste 101360
Commercial waste 32580
Industrial waste 2140
others 4580
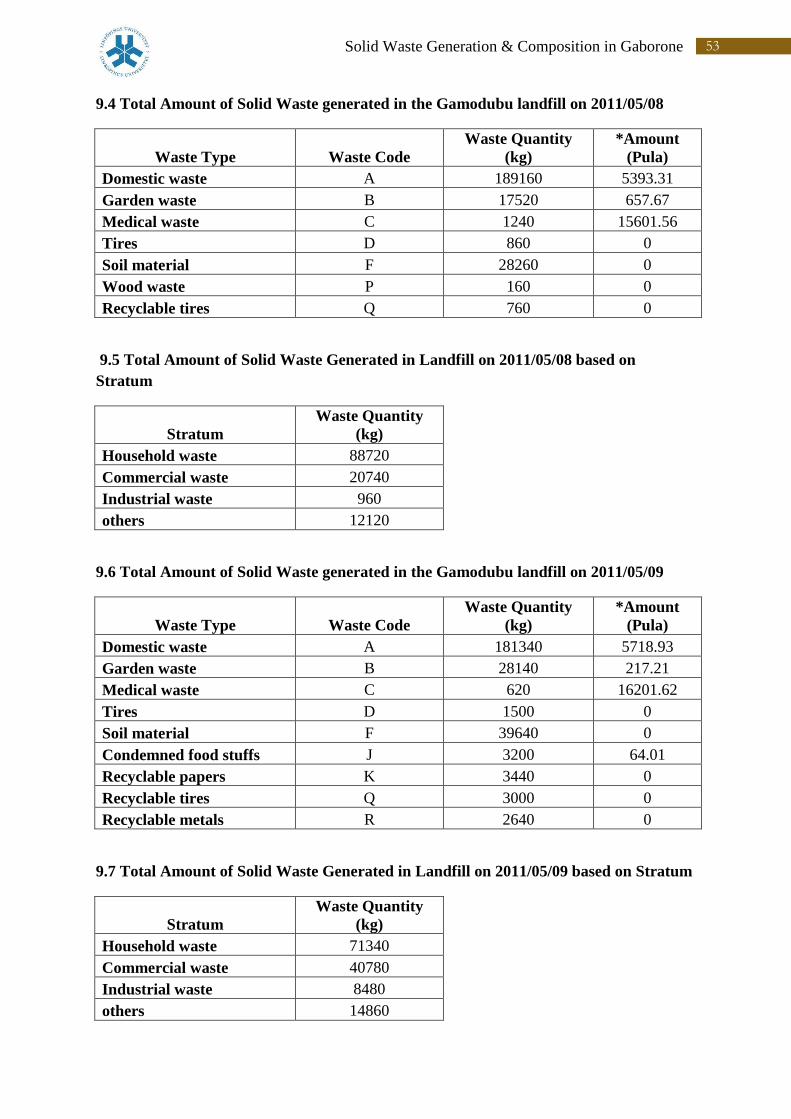
53 Solid Waste Generation & Composition in Gaborone
9.4 Total Amount of Solid Waste generated in the Gamodubu landfill on 2011/05/08
Waste Type Waste Code
Waste Quantity
(kg)
*Amount
(Pula)
Domestic waste A 189160 5393.31
Garden waste B 17520 657.67
Medical waste C 1240 15601.56
Tires D 860 0
Soil material F 28260 0
Wood waste P 160 0
Recyclable tires Q 760 0
9.5 Total Amount of Solid Waste Generated in Landfill on 2011/05/08 based on
Stratum
Stratum
Waste Quantity
(kg)
Household waste 88720
Commercial waste 20740
Industrial waste 960
others 12120
9.6 Total Amount of Solid Waste generated in the Gamodubu landfill on 2011/05/09
Waste Type Waste Code
Waste Quantity
(kg)
*Amount
(Pula)
Domestic waste A 181340 5718.93
Garden waste B 28140 217.21
Medical waste C 620 16201.62
Tires D 1500 0
Soil material F 39640 0
Condemned food stuffs J 3200 64.01
Recyclable papers K 3440 0
Recyclable tires Q 3000 0
Recyclable metals R 2640 0
9.7 Total Amount of Solid Waste Generated in Landfill on 2011/05/09 based on Stratum
Stratum
Waste Quantity
(kg)
Household waste 71340
Commercial waste 40780
Industrial waste 8480
others 14860
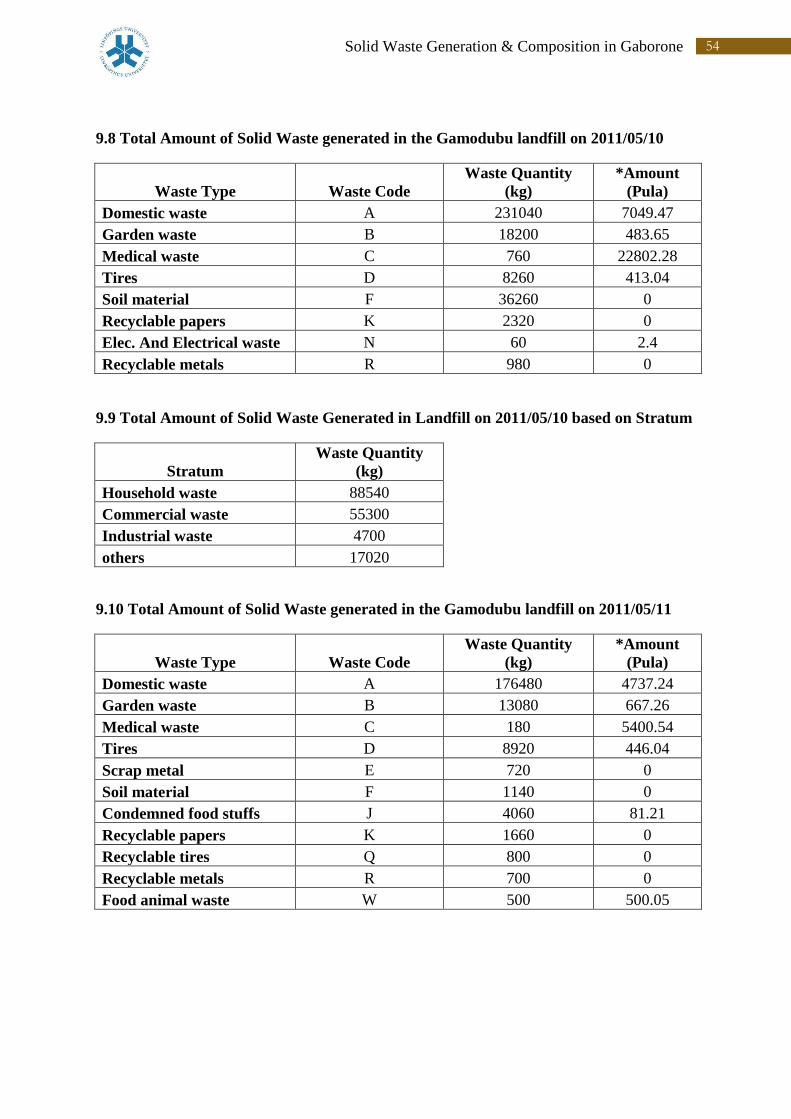
54 Solid Waste Generation & Composition in Gaborone
9.8 Total Amount of Solid Waste generated in the Gamodubu landfill on 2011/05/10
Waste Type Waste Code
Waste Quantity
(kg)
*Amount
(Pula)
Domestic waste A 231040 7049.47
Garden waste B 18200 483.65
Medical waste C 760 22802.28
Tires D 8260 413.04
Soil material F 36260 0
Recyclable papers K 2320 0
Elec. And Electrical waste N 60 2.4
Recyclable metals R 980 0
9.9 Total Amount of Solid Waste Generated in Landfill on 2011/05/10 based on Stratum
Stratum
Waste Quantity
(kg)
Household waste 88540
Commercial waste 55300
Industrial waste 4700
others 17020
9.10 Total Amount of Solid Waste generated in the Gamodubu landfill on 2011/05/11
Waste Type Waste Code
Waste Quantity
(kg)
*Amount
(Pula)
Domestic waste A 176480 4737.24
Garden waste B 13080 667.26
Medical waste C 180 5400.54
Tires D 8920 446.04
Scrap metal E 720 0
Soil material F 1140 0
Condemned food stuffs J 4060 81.21
Recyclable papers K 1660 0
Recyclable tires Q 800 0
Recyclable metals R 700 0
Food animal waste W 500 500.05

55 Solid Waste Generation & Composition in Gaborone
9.11 Total Amount of Solid Waste Generated in Landfill on 2011/05/11 based on
Stratum
Stratum
Waste Quantity
(kg)
Household waste 36440
Commercial waste 47800
Industrial waste 5460
others 22720
9.12 Overall Waste generation in landfill from (2011/05/06 – 2011/05/11)
Stratum
Overall amount of waste generated in
the landfill (kg)
Household 463780
Commercial 242180
Industrial 25660
Others 87640
9.13 Total Amount of Waste composition of plastic from the samples (2400kgs)
Plastic Categories Overall Weight (kg)
PET (code – 1) 30.9
HDPE (code – 2) 62.1
PVC (code – 3) 17.3
LDPE & LLDPE (code – 4) 147.05
PP (code – 5), PS (code – 6) & others (code – 7) 62.18
9.14 Calculation for assessing the annual generation rate of waste
(Total annual waste generation in Gaborone = Total waste generated per day * 365 days)
But, for calculating the total annual waste generation for each stratum and category the
following formula is used.
Total waste generation per day = ((Total waste generated from 2400( 10 )
kg/2400kg)*
Total waste generated during study period in
Gaborone))/6
10 2400kg= 300(sample size)*8 (No.of Vehicles)
56 Solid Waste Generation & Composition in Gaborone
For example,
Total waste generation of paper per day = (Total paper waste generated from
2400kg/2400kg)* Total waste
generated during study period in
Gaborone))/6
(Total annual paper waste generation in Gaborone = Total waste generation of paper per
day * 365 days)
a) For paper
Total waste generation of paper per day = ((Total paper waste generated from
2400kg/2400kg)* Total waste
generated per day in Gaborone))/6
Total waste generation of paper per day = (719.5/2400kg)* 819260))/6
= 40934kg
Total annual waste generation of paper = 40934*365 => 14941 ~= 15000 tonnes
b) For Garden & Wood waste
Total waste generation of garden & wood per day = ((Total paper waste generated from
2400kg/2400kg)* Total waste
generated per day in Gaborone))/6
Total waste generation of garden & wood per day = (248.2/2400kg)* 819260))/6
= 14120kg
Total annual waste generation of garden & wood = 14120*365 => 5154 ~= 5000 tonnes
c) For Textile
Total waste generation of textile per day = ((Total paper waste generated from
2400kg/2400kg)* Total waste
generated per day in Gaborone))/6
Total waste generation of textile per day = (69.45/2400kg)* 819260))/6
= 3951kg
Total annual waste generation of textile = 3951*365 =>1442 ~= 1500 tonnes
d) For Food
Total waste generation of food per day = ((Total paper waste generated from
2400kg/2400kg)* Total waste
generated per day in Gaborone))/6
57 Solid Waste Generation & Composition in Gaborone
Total waste generation of food per day = (609.8/2400kg)* 819260))/6
= 34693kg
Total annual waste generation of food = 34693*365 =>12663 ~= 13000 tonnes
e) For plastics
Total waste generation of plastics per day = ((Total paper waste generated from
2400kg/2400kg)* Total waste
generated per day in Gaborone))/6
Total waste generation of plastics per day = (350.8/2400kg)* 819260))/6
= 19958kg
Total annual waste generation of plastics = 19958*365 =>7284 ~= 7000 tonnes
f) For metals
Total waste generation of metals per day = ((Total paper waste generated from
2400kg/2400kg)* Total waste
generated per day in Gaborone))/6
Total waste generation of metals per day = (135.25/2400kg)* 819260))/6
= 7694kg
Total annual waste generation of metals = 7694*365 =>2808 ~= 3000 tonnes
g) For Glass
Total waste generation of glass per day = ((Total paper waste generated from
2400kg/2400kg)* Total waste
generated per day in Gaborone))/6
Total waste generation of glass per day = (131.85/2400kg)* 819260))/6
= 7501kg
Total annual waste generation of glass = 7501*365 =>2737 ~= 3000 tonnes
h) For E-waste
Total waste generation of plastics per day = ((Total paper waste generated from
2400kg/2400kg)* Total waste
generated per day in Gaborone))/6
Total waste generation of plastics per day = (14.78/2400kg)* 819260))/6
= 840kg
Total annual waste generation of plastics = 840*365 =>306 ~= 300 tonnes
58 Solid Waste Generation & Composition in Gaborone
i) For Fines & Others
Total waste generation of fines & others per day = ((Total paper waste generated from
2400kg/2400kg)* Total waste
generated per day in Gaborone))/6
Total waste generation of fines & others per day = (111.5/2400kg)* 819260))/6
= 6343kg
Total annual waste generation of fines & others = 6343*365 =>2315 ~= 2000 tonnes

59 Solid Waste Generation & Composition in Gaborone
9.15 Pictures of Sorting Procedure
60 Solid Waste Generation & Composition in Gaborone
9.16 Pictures Taken in the Landfill
Materials used for Sorting Place used for Sorting
Waste unloaded form Vehicle Helper sorting the Waste
61 Solid Waste Generation & Composition in Gaborone
Container used to collect Sorted Waste Weigh scale
Researchers working in landfill weigh scale for Weighing Vehicles
Sorted waste is weighed and Recorded Food waste mixed with paper
62 Solid Waste Generation & Composition in Gaborone
Solid waste spread in Landfill Disposing solid waste in landfill
Collect-A-Can Company recovers metal can for recycling
Simple Recycle Company recovering plastic for recycling

63 Solid Waste Generation & Composition in Gaborone
Plastics are processed to raw material in simple recycle plant
“Skip Hire” Carrier used to collect waste from commercial and industrial stratum
9.17 Pictures of Plastics Sorted into Sub categories

64 Solid Waste Generation & Composition in Gaborone
9.18 MSW generation based on regions and countries

65 Solid Waste Generation & Composition in Gaborone
Source (I. Korner, 2003-2006)
66 Solid Waste Generation & Composition in Gaborone
9.18 Enhanced landfill mining flow diagram
ELFM process flow diagram
Source (Tielemans & Laevers)