solids handling optimization at a small domestic
TRANSCRIPT

Solids Handling Optimization at a Small Domestic Wastewater Treatment Plant
Submitted by
A J. MacDonald
B.A., B.Sc., Queen’s University, Canada
A thesis submitted to the Faculty of Graduate Studies and Research in partial fulfillment of the requirements for the degree of
Master of Applied Science
Ottawa-Carleton Institute of Environmental Engineering Carleton University
Ottawa, Ontario, Canada
© A.J. MacDonald August, 2007
The Master of Applied Science in Environmental Engineering Program is a joint program with the University of Ottawa, administered by the Ottawa-Carleton Institute for
Environmental Engineering
Reproduced with permission of the copyright owner. Further reproduction prohibited without permission.

Library and Archives Canada
Bibliotheque et Archives Canada
Published Heritage Branch
395 Wellington Street Ottawa ON K1A 0N4 Canada
Your file Votre reference ISBN: 978-0-494-33661-8 Our file Notre reference ISBN: 978-0-494-33661-8
Direction du Patrimoine de I'edition
395, rue Wellington Ottawa ON K1A 0N4 Canada
NOTICE:The author has granted a nonexclusive license allowing Library and Archives Canada to reproduce, publish, archive, preserve, conserve, communicate to the public by telecommunication or on the Internet, loan, distribute and sell theses worldwide, for commercial or noncommercial purposes, in microform, paper, electronic and/or any other formats.
AVIS:L'auteur a accorde une licence non exclusive permettant a la Bibliotheque et Archives Canada de reproduire, publier, archiver, sauvegarder, conserver, transmettre au public par telecommunication ou par I'lnternet, preter, distribuer et vendre des theses partout dans le monde, a des fins commerciales ou autres, sur support microforme, papier, electronique et/ou autres formats.
The author retains copyright ownership and moral rights in this thesis. Neither the thesis nor substantial extracts from it may be printed or otherwise reproduced without the author's permission.
L'auteur conserve la propriete du droit d'auteur et des droits moraux qui protege cette these.Ni la these ni des extraits substantiels de celle-ci ne doivent etre imprimes ou autrement reproduits sans son autorisation.
In compliance with the Canadian Privacy Act some supporting forms may have been removed from this thesis.
While these forms may be included in the document page count, their removal does not represent any loss of content from the thesis.
Conformement a la loi canadienne sur la protection de la vie privee, quelques formulaires secondaires ont ete enleves de cette these.
Bien que ces formulaires aient inclus dans la pagination, il n'y aura aucun contenu manquant.
i * i
CanadaReproduced with permission of the copyright owner. Further reproduction prohibited without permission.
Abstract
Solids handling refers to the removal and treatment of solid matter from raw wastewater.
In an activated sludge WWTP, this solid matter is typically called sludge, and its
treatment and disposal may represent a significant portion of wastewater treatment
expenditures. This study is focused on optimizing the solids handling at a domestic
WWTP in Crystal Beach, Ontario, Canada, by two main methods. Firstly, testing was
designed to test various types of polymers designed to thicken sludge after it is removed
from wastewater. Secondly, an investigation was devoted to characterizing a persistent
foaming problem that was known to cause problems in the clarification process, which
uses gravity settling basins to separate sludge solids from wastewater. Testing took place
at Crystal Beach WWTP, in Crystal Beach, Ontario, from May to December, 2006. The
results of this study may be used to develop similar solids handling optimization plans at
domestic wastewater treatment facilities.
ii
Reproduced with permission of the copyright owner. Further reproduction prohibited without permission.

Acknowledgements
I gratefully acknowledge the help and guidance I received from my thesis supervisor Dr.
Onita Basu, professor in the Civil and Environmental Engineering Department at
Carleton University. She provided valuable help, advice, and information throughout my
thesis work, and was responsible for initiating my research term at the Region of Niagara.
I would like to also acknowledge the role that The Region of Niagara Public Works
Department, Water and Wastewater Division played in making this project possible. I
received guidance and assistance from countless people who took an interest in this
project. I would like to specifically acknowledge the following people for their
contributions: Deanna Barrow, Chris Howard, George Bis, Mark Solomon, Ray Landry,
Cameron Wilson, Kevin Booth, Dave Rodgers, Kathleen Johnstone and Norma
Linkiewicz.
I would also like to thank Mark Simpson from SNF Canada, Dan Veneruzzo from CEBA
Specialty Chemicals, Jack Schill from Jes-chem Canada, Fintan O’Carroll from Epsilon
Chemicals, and A1 Walz from NasChem for providing chemical samples and advice
throughout this project.
Funding for this project was provided by:
Carleton University Department of Civil and Environmental Engineering
The Regional Municipality of Niagara
iii
Reproduced with permission of the copyright owner. Further reproduction prohibited without permission.

Table of Contents:Abstract............................................................................................. iiAcknowledgements.......................................................................... iiiList of Abbreviations.........................................................................x1 Introduction................................................................................. 1
1.1 Background...............................................................................................................12 Literature Review........................................................................7
2.1 Sludge Thickening Optimization.............................................................................72.1.1 Sludge Thickening.......................................................................................... 72.1.2 Sludge Conditioning....................................................................................... 92.1.3 Polymer Selection and Optimization............................................................13
2.2 Clarifier Optimization.............................................................................................182.2.1 Clarifier Foaming........................................................................................... 182.2.2 Characterization of Microbiology.................................................................212.2.3 Environmental Factors.................................................................................. 252.2.4 Foam Trapping............................................................................................... 262.2.5 Coliform Analysis..........................................................................................272.2.6 Foaming Examples from Literature..............................................................282.2.7 Foaming Control Strategies.......................................................................... 30
3 Methods and Materials..............................................................353.1 Sludge Thickening.................................................................................................35
3.1.1 Polymer Preparation for Bench-Scale Testing.............................................353.1.2 Phase 1 Polymer Testing - Oxidation-Reduction Potential........................ 363.1.3 Phase 2 Polymer Testing................................................................................373.1.4 Phase 3 Polymer Testing................................................................................443.1.5 Polymer Full-Scale Testing........................................................................... 453.1.6 Description of Thickening Process at Crystal Beach W W TP....................45
3.2 Foam Control.......................................................................................................... 483.2.1 Microbial Identification.................................................................................483.2.2 Microbial Enumeration..................................................................................493.2.3 Process Adjustment........................................................................................ 49
4 Results....................................................................................... 514.1 Polymer T esting...................................................................................................... 51
4.1.1 Pre Screening (Phase 1).................................................................................514.1.2 Polymer Testing - Screen Test (Phase 2 ) .....................................................534.1.3 Bench Scale Testing - Nutrient Values Adjusted........................................ 674.1.4 Summary of Bench-Scale Polymer Screening............................................. 694.1.5 Polymer Testing - Screen Test (Phase 3 ).....................................................714.1.6 Polymer Testing - Full Scale Trials (Phase 4)............................................. 754.1.7 Data From Full-Scale Sampling.................................................................... 764.1.8 Examination of Trial Polymers at Lower Doses.......................................... 844.1.9 Summary of Polymer Optimization.............................................................. 86
4.2 Clarifier Foaming.................................................................................................... 884.2.1 Microscope Analysis...................................................................................... 884.2.2 E. Coli Enumeration Analysis....................................................................... 95
iv
Reproduced with permission of the copyright owner. Further reproduction prohibited without permission.

4.2.3 Process Data Analysis.....................................................................................964.2.4 Control of Clarifier Foaming........................................................................1014.2.5 Summary of Clarifier Foaming Research....................................................102
5 Conclusions............................................................................ 1046 References............................................................................... 107Appendix 1 - Index of Filamentous Organisms......................... 112Appendix 2 - Calculations............................................................115Appendix 3 - Foaming Spray System......................................... 119Appendix 4 - Polymer Characteristics....................................... 121Appendix 5 - T test for Paired Datasets..................................... 123Appendix 6 - Polymer Selection Using Standard Scores 128Appendix 7 - Comparison of Bench Scale and Full ScalePolymer Testing............................................................................ 131Appendix 8 - Tabulated Data.......................................................138
A8.1 Bench Scale Polymer Testing................................................................................ 138A8.2 Full Scale Polymer Testing....................................................................................147A8.3 E. coli Enumeration Data.......................................................................................155A7.4 Process Data from Crystal Beach WWTP........................................................... 155
v
Reproduced with permission of the copyright owner. Further reproduction prohibited without permission.

List of Tables:
Table 2.1 - Summary of Causes of Foaming Problems in Domestic WWTP................... 27Table 3.1 - Summary of Sludge Characteristics at Crystal Beach WWTP:...................... 38Table 3.2 - Parameters for Polymer Screening Tests:..........................................................39Table 3.3 - Polymer Concentrations for Phase 3 and Phase 4 Testing...............................44Table 4.1 - Summary of Data from Bench-Scale Polymer Testing - Solid Phase............70Table 4.2 - Summary of Data from Bench-Scale Polymer Testing - Liquid Phase 71Table 4.3 - Summary of Full-Scale Data - Thickened Sludge ± 1 Standard Deviation.. 87Table 4.4 - Summary of Full-Scale Data - Filtrate ± 1 Standard Deviation..................... 87Table 4.5 - Summary of Findings of Microscope Analysis............................................... 89Table 4.6 - Summary of Process Parameter Records at Crystal Beach W W TP............. 101Table A 1.1 - Filamentous Organisms that may Cause Sludge Bulking and/or Foaming 112Table A 1.2 - Ranking of Filament Abundance in Microscopic Evaluation.....................114Table A2.1 - List of Derived Parameters........................................................................... 115Table A4.1 - Polymer Characteristics................................................................................ 121Table A5.1 - Summary of Paired T Test Results.............................................................. 125Table A6.1 - Hypothetical Weighting Scheme for Polymer Selection............................ 129Table A6.2 - Summary of Combined Z-scores from Bench Scale Polymer Testing 130Table A8.1 - Polymer Solution Oxidation-Reduction Potential Data.............................. 138Table A8.2 - Bench Scale Thickened Sludge Data........................................................... 138Table A8.3 - Bench Scale Filtrate Data.............................................................................. 139Table A8.4 - Bench Scale Polymer Dosage Testing - Sludge Toteil Solids.................... 140Table A8.5 - Bench Scale Polymer Dosage Testing - Sludge TKN Concentration 141Table A8.6 - Bench Scale Polymer Dosage Testing - Sludge Total PhosphorousConcentration........................................................................................................................142Table A8.7 - Bench Scale Polymer Dosage Testing - Filtrate Total Solids....................143Table A8.8 - Bench Scale Polymer Dosage Testing - Filtrate Turbidity........................144Table A8.9 - Bench Scale Polymer Dosage Testing - Filtrate Ammonia Concentration................................................................................................................................................ 145Table A8.10 - Bench Scale Polymer Dosage Testing - Filtrate Total PhosphorousConcentration........................................................................................................................ 146Table A8.11 - Bench Scale Polymer Dosage Testing - Filtrate Total BOD Concentration................................................................................................................................................ 146Table A8.12 - Full Scale Thickened Sludge Data - Total Solids.................................... 147Table A8.13 - Full Scale Thickened Sludge Data - TKN Concentration........................148Table A8.14 - Full Scale Thickened Sludge Data - Total Phosphorous Concentration 149Table A8.15 - Full Scale Filtrate Data - Percent Total Solids..........................................150Table A8.16 - Full Scale Filtrate Data - Suspended Solids Concentration.....................151Table A8.17 - Full Scale Filtrate Data - Turbidity........................................................... 152Table A8.18 - Full Scale Filtrate Data - Total Phosphorus..............................................153Table A8.19 - Full Scale Filtrate Data - Ammonia.......................................................... 154Table A8.20 - E. coli Concentration Measured at Crystal Beach WWTP.......................155Table A8.21 - Solid Retention Time Observed at Crystal Beach WWTP 2006............ 155
vi
with permission of the copyright owner. Further reproduction prohibited without permission.

Table A7.22 - Dissolved Oxygen Concentration Observed at Crystal Beach WWTP December 2006.................................................................................................................... 157
vii
Reproduced with permission of the copyright owner. Further reproduction prohibited without permission.

List of Figures:
Figure 1.1 - Crystal Beach WWTP Activated Sludge System Schematic............................5Figure 3.2 - ORP Testing of Polymer Solution.................................................................... 36Figure 3.3 - Polymer Thickening Apparatus.........................................................................39Figure 3.4 - Full-scale Filtrate Sampling..............................................................................46Figure 4.1 - Polymer Solution Oxidation-Reduction Potential ± 1 Standard Deviation .. 53Figure 4.2 - Thickened Sludge Percent Total Solids...........................................................54Figure 4.3 - Thickened Sludge Percent Volatile Solids.......................................................56Figure 4.4 - Total Phosphorous Content of Thickened Sludge........................................... 58Figure 4.5 -Total Kjeldahl Nitrogen Content of Thickened Sludge...................................59Figure 4.6 - Total BOD of Thickened Sludge...................................................................... 61Figure 4.7 - Filtrate Percent Total Solids..............................................................................62Figure 4.8 - Concentration of Ammonia in Filtrate............................................................. 64Figure 4.9 - Concentration of TKN in Filtrate..................................................................... 65Figure 4.10 - Total Phosphorous Concentration of Filtrate................................................ 66Figure 4.11 - Total Phosphorous Concentration of Thickened Sludge Normalized UsingTotal Solids.............................................................................................................................68Figure 4.12 - TKN Concentration of Thickened Sludge Normalized Using Total Solids 68 Figure 4.13 - Thickened Sludge Percent Solids ± 1 Standard Deviation Dosage Curve.. 72Figure 4.14 - Percent Solids ± 1 Standard Deviation and Total BOD of Filtrate 73Figure 4.15 - Filtrate Turbidity ± 1 Standard Deviation Dosage Curve.............................74Figure 4.16 - Full-scale Percent Total Solids of Thickened Sludge ± 1 Standard Deviation..................................................................................................................................................77Figure 4.17 - Full-scale Thickened Sludge TKN Concentration ± 1 Standard Deviation 78 Figure 4.18 - Full-scale Thickened Sludge Total Phosphorous Concentration ± 1 StandardDeviation................................................................................................................................. 79Figure 4.19 - Full-scale Suspended Solids Concentration in Filtrate ± 1 StandardDeviation................................................................................................................................. 80Figure 4.20 - Full-scale Filtrate Turbidity ± 1 Standard Deviation..................................... 81Figure 4.21 - Full-scale Total Phosphorous Concentration in Filtrate ± 1 StandardDeviation................................................................................................................................. 82Figure 4.22 - Full-scale Ammonia Concentration in Filtrate ± 1 Standard Deviation 83Figure 4.27 - Dilute Clarifier Foam - 100 Times Magnification....................................... 90Figure 4.28 - Dilute Clarifier Foam - 100 Times Magnification, Gram Stained..............91Figure 4.29- Clarifier Foam - 100 Times Magnification, Gram Stained.......................... 92Figure 4.30 - Clarifier Foam at 100 times magnification, Phase Contrast........................ 93Figure 4.31 - Clarifier Foam - 1000 Times Magnification, Gram Stained....................... 94Figure 4.32 - E. coli Concentration at Three Different Sample Locations (n=3)............ 96Figure 4.33 - Solid Retention Time Observed at Crystal Beach WWTP 2006................98Figure 4.34 - F/M Ratio Observed at Crystal Beach WWTP 2006....................................99Figure 4.35 - Dissolved Oxygen Concentration Observed at Crystal Beach WWTPDecember 2006.................................................................................................................... 100Figure A3.1 - Foam Trapping at Clarifier Inlet................................................................119Figure A3.2 Spray System in Use at Crystal Beach WWTP.............................................120Figure A7.1- Thickened Sludge Percent Total Solids....................................................... 131
viii
Reproduced with permission of the copyright owner. Further reproduction prohibited without permission.

ix
Figure A7.2 - Total Phosphorous Content of Thickened Sludge.......................................132Figure A7.3 - TKN Content of Thickened Sludge............................................................ 132Figure A7.4 - Filtrate Percent Total Solids........................................................................ 134Figure A7.5 - Filtrate Total Phosphorous Concentration.................................................. 134Figure A7.6 - Filtrate Ammonia Concentration.................................................................135
ix
Reproduced with permission of the copyright owner. Further reproduction prohibited without permission.

X
List of Abbreviations
Term Definition UnitsBOD Biochemical Oxygen Demand mg/L; mg/kgtBOD Total Biochemical Oxygen Demand mg/L; mg/kgtBOD5 Total Five-Day Biochemical Oxygen Demand mg/L; mg/kgCBOD Carbonaceous Biochemical Oxygen Demand mg/L; mg/kgCOD Chemical Oxygen Demand mg/L; mg/kgDAF Dissolved Air Floatation Thickener N/ADO Dissolved Oxygen Concentration mg/LF/M Food to Microorganism Ratio mg CBOD/mg
MLVSSGBT Gravity Belt Thickener N/AMLVSS Mixed Liquor Volatile Suspended Solids mg/LORP Oxidation-Reduction Potential mVP Phosphorus mg/L; mg/kgRAS Return Activated Sludge N/ARDT Rotary Drum Thickener N/ASRT Solid Retention Time DaysSS Suspended Solids mg/LTKN Total Kjeldahl Nitrogen mg/L; mg/kgTSS Total Suspended Solids mg/LVSS Volatile Suspended Solids mg/LWAS Waste Activated Sludge N/AWWTP Wastewater Treatment Plant N/A
X
Reproduced with permission of the copyright owner. Further reproduction prohibited without permission.

1
1 Introduction
1.1 Background
Wastewater treatment is the process used to remove contaminants from wastewater so
that it may be reintroduced to the natural environment, protecting natural aquatic
ecosystems as well as human health. A considerable amount of technology, money, time
and effort are invested to ensure that treated wastewater is of sufficient quality so that
natural watercourses can maintain healthy and sustainable ecosystems. However, the
product of the wastewater treatment process is more than just treated water. There are
also vast amounts of solids that are removed from wastewater flows. These solids,
known collectively as sludge, may have very different compositions, depending on the
type and level of treatment they have undergone, and also on the composition of the
wastewater itself. Handling and disposal of sludge solids represents a great public
expense (Krishnamurthy and Viraraghavan, 2005; Deneux-Mustin et al., 2001; US EPA,
1987), and so research efforts dedicated to improving solids handling can represent not
only environmental utility, but economic benefits as well. This study is dedicated to
improving solids handling at a small domestic wastewater treatment facility in Crystal
Beach, Ontario.
In general, treatment processes can be divided into primary, secondary, and tertiary
processes. In primary treatment, grit, fats, oils and greases are separated from the
wastewater. Most primary treatment configurations consist of screening to remove large
particles and grit, and primary clarification, which allows some particles to settle to the
bottom of primary clarifiers, while floatable oil and grease are skimmed from the surface.
1
Reproduced with permission of the copyright owner. Further reproduction prohibited without permission.
2
Primary treatment produces a liquid stream, called primary effluent, and a solid product
called primary sludge. In secondary treatment, primary effluent, or screened raw sewage,
(where primary clarification is not utilized), is introduced to some form of biological
treatment. In biological treatment, aquatic microorganisms are used to stabilize the
waste, and lower the organic content and oxygen demand. There are various methods
that are used to provide secondary treatment. Some systems use attached growth
technology, in which bacteria grow on a solid media which passes through wastewater,
(e.g. rotating biological contactors), or has wastewater pass through it, (e.g. trickling
filters). A common system called an activated sludge process uses a large tank in which
sewage is combined with an aquatic mixture containing a variety of microorganisms
through which air is continuously passed. In some systems, where additional nutrient
removal is required, processes such as denitrification, which converts ammonia to
nitrates, are used (Metcalf and Eddy, 2003). Activated sludge processes, (after primary
treatment), typically remove about 85 percent of the total suspended solids, (TSS) and
biochemical oxygen demand, (BOD) in wastewater (Droste, 1997). The heart of the
activated sludge process is the cultivation and maintenance of microbial populations that
naturally process and stabilize wastewater (Metcalf and Eddy, 2003; Droste, 1997). In
practice, primary effluent, (or raw sewage where primary clarification is not utilized), is
combined with a suspension of microorganisms, (i.e. activated sludge; also called mixed
liquor), which is aerated, and the mixture flows into clarification tanks to settle. The
solids then settle to the bottom of the clarifiers, and are collected by mechanical scrapers.
This separation process relies mainly on gravity, since the sludge solids are denser than
water, sludge may separate from the bulk water phase, causing separation. A portion of
2
Reproduced with permission of the copyright owner. Further reproduction prohibited without permission.

3
the sludge, called return activated sludge (RAS), is reintroduced to the aeration system to
maintain the population of microorganisms. The remainder of the sludge, called waste
activated sludge (WAS), is often sent to another type of biological treatment called a
digester for stabilization or may simply be collected, thickened, and disposed of in a
landfill. The digestion process may use bacteria in either an aerobic or an anaerobic
environment. At Crystal Beach WWTP, as in many domestic plants, an anaerobic
environment is maintained for digestion. The digester is a large cylindrical tank with
sloping floors and a floating roof that can accommodate fluctuations in pressure within
the tank due to gas production. Before the digestion process, the WAS is first thickened
from about 1% to about 4% solids, then pumped to the anaerobic digester. The digestion
process involves a series of anaerobic bacterial reactions that breakdown complex
molecules in the WAS, making the digested sludge relatively inert, reducing odour
generation, and destroying pathogenic organisms found within undigested sludge, as well
as making the sludge less likely to be a food source for disease carrying animals, (such as
insects), after its final disposal (Metcalf and Eddy, 2003; Droste, 1997). Digestion also
reduces the total volume of sludge, which makes hauling and disposal of digested sludge
easier and more economical. Digested sludge also undergoes stabilization, which refers
to the processing of sludge until decomposition is slowed and pathogens are largely
destroyed or inactivated. This helps to make digested sludge suitable as a soil
conditioner. The liquid effluent from secondary treatment generally undergoes final
disinfection where pathogenic bacteria such as E. coli that may cause public health
problems are decreased in number. In Ontario, standards for WWTP effluents are
specific to the plant. In consultation with district and regional offices of the Ministry of
3
Reproduced with permission of the copyright owner. Further reproduction prohibited without permission.

4
the Environment (M.O.E.), the proponent of a WWTP is expected to conduct an
assimilative capacity study of the receiving waters and to propose site specific effluent
limits which are reviewed and approved. The plant is then designed to meet the criteria
(Ontario Ministry of the Environment, 2007). For example, the certificate of approval at
Crystal Beach WWTP allows an upper limit of 200 colony forming units of E. coli
bacteria per 100 milliliters, (200 cfu/lOOmL), based on a monthly geometric mean.
The WWTP at Crystal Beach is an extended aeration facility with no primary
clarification. The raw wastewater is derived from domestic sources with no heavy
industrial input. Influent wastewater is screened through bar screens, and grit is removed
using centrifugal grit chambers, before entering plug flow aeration basins with fine
bubble diffusers. Sludge is wasted from the system manually in batch fashion, at the
discretion of operators. Waste activated sludge is stored in air-mixed tanks prior to
thickening on a gravity belt thickener (GBT). Thickened sludge then undergoes a
mesophilic anaerobic digestion process, in a floating roof digester that is mixed with a
recirculation pump. Digested sludge is hauled away for disposal at sludge lagoons
nearby. The design capacity of the plant is 9.1 ML/d, with a peak capacity of 27.3 ML/d.
The average flow through the plant in 2006 was approximately 5.5 ML/d, which is about
60 percent of the design capacity. A schematic of the activated sludge system at Crystal
Beach WWTP is shown in Figure 1.1.
4
Reproduced with permission of the copyright owner. Further reproduction prohibited without permission.

5
Air
Influent -
I a e r a t io n !
'Aeration Reactor •
<? ' v><,* . * *4*. v , i v* b i i ■ ^
/ Activated ^ Sludge
Recycled Soli dr
I CL ARIFIC ATIONI
“ Clarifier —
Ith ic k en in g I IDIGESTIONl
-►Effluent
POLYMERADDITION
4 Gravity Belt....... 'W asteSolids.*. Thickener
AnaerobicDigester
Final Solids Disposal
Figure 1.1 - Crystal Beach WWTP Activated Sludge System Schematic
The objective of this study is to optimize the solids handling processes at Crystal Beach
WWTP, by improving the thickening of WAS before digestion, and solids separation
process that occurs in the clarification process. This is broken down into two main areas:
1) Polymer selection for sludge thickening. 2) Preventing separation problems in the
clarification system due to sludge foaming.
The sludge thickening study will investigate the performance of various commercially
available polymers, with respect to both the solids capture and the delivery of nutrient
chemicals (various compounds containing nitrogen and/or phosphorous) to solid and
liquid streams. In this context, the solid stream refers to the thickened solids that are
delivered to the digestion process, while the liquid stream refers to the filtrate from the
thickening process, which is reincorporated with the plant influent. In other words, the
examination of polymer performance will focus not only on the solids content of the
thickened sludge, but also on the concentration of nutrient chemicals such as nitrogen and
5
Reproduced with permission of the copyright owner. Further reproduction prohibited without permission.
6
phosphorous. The selection of an optimal polymer is intended to ensure that the
thickening process concentrates nutrients in the solid phase, while reducing nutrient
loading in the plant from recycled liquid streams. The polymer selection process will
initially be based on laboratory work, and those results will allow for the selection of
candidate polymers that may be tested full-scale.
The clarification study will be focused on characterizing the causes of a continual sludge
foaming problem, and identifying full-scale, process-based control methods that can
ensure that conditions conducive to foaming do not occur. This is expected to improve
the quality of the effluent from the activated sludge process by lowering the
concentration of potentially pathogenic coliform bacteria in the effluent, and may lower
the suspended solids concentration as well. This will also decrease the chlorine demand
of the clarifier effluent, resulting in plant effluent of higher quality, with a lower
suspended solids concentration and lower chlorine residual, representing environmental
and economic benefits. The foam control research will provide plant operators with the
necessary methodology for maintaining an activated sludge environment that continues to
produce superior solid and liquid effluents than currently generated at Crystal Beach
Wastewater Treatment Plant.
6
Reproduced with permission of the copyright owner. Further reproduction prohibited without permission.

7
2 Literature Review
2.1 Sludge Thickening Optimization
2.1.1 Sludge Thickening
Thickening is the process of removing water from WAS in order to provide sludge of
lower volume and higher solids content for subsequent sludge treatment processes such
as the digestion process or for final disposal. The effectiveness of a thickening operation
is typically termed the solids capture, defined as the percentage of solids in the influent
that is captured in the thickened sludge. For example, a solids capture of 95 percent
indicates that 5 percent of the influent mass ends up as liquid, back in the treatment
process train, and the remaining 95 percent of the mass is contained in the thickened
sludge, delivered to subsequent solids handling process(es) (Olezskiewicz and Mavinc,
2001). There is significant variability in methods that are commonly available for sludge
thickening. The simplest form of sludge thickening is gravity sedimentation. Sludge sits
in a basin, (called a clarifier), typically 3 to 4 meters in depth, with a sloping floor that
allows solids to be concentrated at the bottom of the tank, while the liquid supemantant
can be removed from the top of the tank (Metcalf and Eddy, 2003). Most thickening
processes are somewhat more complex, and use some type of machine to improve
thickening over simple sedimentation. Gravity belt thickening (GBT), for example,
employs a porous conveyor belt that allows conditioned sludge to be spread over the belt,
concentrating solids on the top of the belt, and allowing water to pass through the pores,
to be removed and delivered back to the treatment process train. The belt then travels
under the unit and may be cleaned with a water spray (Kiely, 1997). Thickening by GBT
7
Reproduced with permission of the copyright owner. Further reproduction prohibited without permission.

8
removes the unbound water in the sludge, typically increasing the total solids
concentration from about 1 percent to about 5 percent, reducing the volume of sludge by
about 5 times, and concentrating the sludge before it is introduced to a subsequent
digestion process (Dentel, 2001; Olezskiewicz and Mavinic, 2001; Kiely, 1997).
Dissolved air flotation (DAF) is another physical separation process which saturates an
unthickened sludge with air, allowing air bubbles to attach to sludge floes, which then
float the sludge to the surface of a tank. The sludge may then be removed using surface
skimmers or scrapers. DAF is commonly used for activated sludge, since it is generally
lighter than sludge from primary clarification (Metcalf and Eddy, 2003). The specific
gravity of WAS is very close to 1.0, which allows dissolved air to provide sufficient
buoyancy for the sludge floes to float to the surface (Vesilind et al., 1986). DAF is also
commonly used in plants where it is advantageous to thicken activated sludge directly
from the aeration system (Oleszkiewicz and Mavinic, 2001). Rotary drum thickeners
(RDT) consist of a large cylindrical drum which uses gravity to thicken sludge as the
drum is rotating in a horizontal plane. The motion of the drum causes sludge to move up
the walls of the RDT, allowing free water to pass through the solids for removal (Chen et
al., 2002). Another common method is the centrifuge, which is similar to the RDT, but
uses a more rapid spinning motion, creating centrifugal force to shear unbound water
from sludge floes, allowing water to be removed from the unit, while sludge is thickened
to a higher solids concentration (Metcalf and Eddy, 2003). The centrifuge generally
consists of a bowl with a tapered end, (called the beach), which is rotated horizontally to
create centripetal forces that can be many times the force of gravity. As the solids settle
8
Reproduced with permission of the copyright owner. Further reproduction prohibited without permission.
9
to the outside of the bowl, a spiral scroll pulls solids to the beach, while liquid centrate is
removed from the opposite end (Metcalf and Eddy, 2003; Vesilind et al., 1986).
2.1.2 Sludge Conditioning
Thickening and dewatering of wastewater sludge is enhanced by a conditioning process.
Sludge is made up of negatively charged particles in an aqueous suspension (Metcalf and
Eddy, 2003; Dentel, 2001; Droste, 1997). Conditioning processes may be physical, such
as using temperature to alter the structure of the sludge, or chemical, such as adding
chemical additives that enhance solid-liquid separation through bond formation and
charge neutralization. Overall, the chemical conditioning processes are much more
popular for the treatment of wastewater sludge, since physical conditioning methods such
as freezing or heating are energy intensive in most climates (Dentel, 2001). Chemical
conditioning involves using additives that neutralize the charges on sludge particles,
allowing the particles to agglomerate into larger particles called floes. The negatively
charged particles naturally resist clumping because they repel one another due to
electrostatic forces. The conditioning process is used to stabilize the particles,
neutralizing the negative charge at the particle surface, using adsorptive chemical species,
or causing particles to stick together by entangling them with long polymer chains.
Sometimes, both processes are used to allow flocculation to occur (Chitikela and Dentel,
1998; Droste, 1997). There are two main types of chemical sludge conditioning
technology, inorganic conditioning and organic conditioning. The inorganic conditioning
processes usually use some type of iron or aluminium salts, typically combined with
lime. The metallic salts undergo hydrolysis and precipitation reactions, forming
9
Reproduced with permission of the copyright owner. Further reproduction prohibited without permission.

10
precipitates such as ferric hydroxide, which adsorbs to sludge particles, neutralizing the
charges on sludge particles. Lime is often used to form calcium carbonate that reacts
with the sludge, forming a conditioned sludge with less chemically bound water, and
greater permeability (Dentel, 2001). Inorganic conditioning processes such as using iron
salts combined with lime have been shown to alter the compressibility of the sludge, and
thus are commonly used for mechanical dewatering applications, which produce sludge
cake with solids content well over 10% total solids (Novak et al., 1999). Deneux-Mustin
et al., (2001), used transmission electron microscopy to examine the surface of sludge
floes during chemical conditioning. They found that a shell of crystalline precipitate was
formed on the surface of floes, maintaining floe structure and transmitting stress to inner
parts of the floes under mechanical stress. For other types of dewatering and for simple
thickening applications, inorganic conditioning is seldom used, as the volume and dry
weight of conditioned sludge increases, and inorganic conditioners must be used at higher
doses relative to organic conditioning agents (Dentel, 2001). Dosages of chemical
conditioners by weight may be as much as 30 times greater than those of organic
conditioners (Krishanmurthy and Viraraghavan, 2005). In some cases, chemical
conditioners may be used in conjunction with organic conditioners in order to provide
both charge neutralization and interparticle bridging. The chemical conditioners provide
charge neutralization, while subsequent application of polymer allows for particles to
flocculate due to entanglement and bridging (Chitikela and Dentel, 1998).
Organic conditioning refers to the use of polymers to create electrolytic aqueous solutions
that contain charged functional groups able to neutralize the charge on sludge particles.
10
Reproduced with permission of the copyright owner. Further reproduction prohibited without permission.

11
Organic polymers are also commonly known as polyelectrolytes, as they dissolve in
water and dissociate into charged particles, increasing the conductivity of the solution
(Dentel, 2001). Because sludge particles are mostly negatively charged, cationic
polymers are frequently used to neutralize the charge and stabilize the particles (Metcalf
and Eddy, 2003). Organic cationic polyelectrolytes dissociate in water into many anions,
(such as Cl ), and few long chain polymers with positively charged functional groups that
attract many negatively charged sludge particles, forming a floe (Dentel, 2001). In some
applications, anionic or non-ionic polymers may be used. Non-ionic and/or anionic
polymers may be used in conjunction with cationic polymers, to enhance floe structure by
bridging and entangling effects (Ayoll et al., 2005). The increase in particle size due to
conditioning allows the thickening process to produce a more porous sludge, reducing
viscous drag on unbound water. The floes are much larger and heavier than the particles
before conditioning, which makes them more likely to settle, and allows unbound water
in the sludge to be removed more easily (Metcalf and Eddy 2003; Chen et al., 2002;
Dentel, 2001; Benitez et al., 1994).
At Crystal Beach WWTP, cationic polymers are the conditioner of choice used to
neutralize the negatively charged sludge particles so that they may aggregate into floes.
Polymers tend to be popular for use in gravity drainage systems, due to their ease of use
compared to alternatives such as lime and iron salts (Novak et al., 1999). Organic
polymers are also popular for gravity thickening applications since they may be effective
at lower doses than inorganic conditioning agents, (Krishanmurthy and Viraraghavan,
2006; Dentel, 2001; Chitikela and Dentel, 1998). Organic polymers are manufactured in
11
Reproduced with permission of the copyright owner. Further reproduction prohibited without permission.

12
a wide variety of molecular weight and charge, which makes them suitable for very
specific applications. Organic polymers may also be advantageous from an overall
environmental perspective, as they are biodegradable (Saveyn et al., 2005). In general,
the most important characteristics of a polymer when considering its conditioning
effectiveness with respect to given sludge are the molecular weight and charge density,
(Saveyn et al., 2005; Dentel, 2001). The molecular weight of a given polymer refers to
the length of the polymer chain. Higher molecular weight polymers are longer chains of
monomers, and so they may be more effective at entangling sludge particles, or they may
dissociate into more polymer segments in solution. The charge of a given polymer refers
to the density of electrical charge that exists over the polymer molecules (Dentel, 2001).
Vaxelaire and Olivier (2006), found that higher molecular weight polymers produced
thickened sludge that was faster to thicken to maximum solids content, but with greater
overall moisture content. Although polymers with higher molecular weight and charge
density intuitively may seem to be the best choice for neutralizing charges on a
suspension of sludge particles, it is important to select a polymer that works well in
practice, and is economically feasible. Higher molecular weight and charge polymers
may also be more expensive, so field testing of a variety of polymers is prudent. One
way to characterize the ability of an aqueous polymer solution to neutralize a solution of
charged particles is to measure the oxidation-reduction potential (ORP). ORP measures
the ability of a solution to accept or donate electrons, and thus measures the
transferability of charge provided by a given chemical species (Atkins and Jones, 2005).
Since WAS is made up of a suspension of mainly negatively charged particles, we should
expect WAS to have a negative ORP value, since it is an electron donor, not an acceptor.
12
Reproduced with permission of the copyright owner. Further reproduction prohibited without permission.

13
Cationic polymer solutions, on the other hand, should have positive ORP values, since
they are electron acceptors, not donors. Polymers also come in a variety of physical
configurations, including polymer solutions, polymers in emulsifications, and granular
polymers available as powders or microbeads. These configurations are designed for
different distribution systems that employ various methods of dissolving and/or diluting
polymer prior to thickening.
2.1.3 Polymer Selection and Optimization
Field research of polymer testing often focuses on the ability of a given polymer to
separate solids from the liquid phase within the sludge (Al-Mutairi et al., 2004; Olivier et
a l, 2004; Al-Muzaini and Hamoda, 1998; Severin et al., 1999; Severin and Grethlein,
1996). This information, along with the cost per unit dry solids is typically used to select
a polymer for sludge thickening. The optimal dose of polymer in low pressure gravity
thickening may be one that maximizes the uptake of dispersed particles into the floe
structure, and so the dose is linked to the turbidity of the pre-thickened sludge (Mikkelsen
and Keiding, 2001). Alternatively, the optimal polymer dose may be one that comes
closest to neutralizing the charges on particles in the sludge (Dentel, 2001).
Al-Muzaini and Hamoda (1998), used a pilot-scale centrifuge unit to test the
effectiveness of both centrifuge and belt filter systems to dewater WAS at a WWTP in
Kuwait, and focused on the total suspended solids (TSS) and volatile suspended solids
(VSS) concentrations observed in the final sludge cake. They found that polymer
conditioning prior to mechanical sludge dewatering, was preferred, and achieved a total
13
Reproduced with permission of the copyright owner. Further reproduction prohibited without permission.

14
solids concentration of 35 percent using the belt filter press. Al Mutairi et al. (2004)
compared the effectiveness of using polymer versus inorganic conditioners to condition a
highly organic activated sludge produced at a slaughterhouse in Kuwait. They focused
on the ability of a DAF unit to remove SS and chemical oxygen demand (COD) from the
sludge. Results indicated that with respect to solids removal, the optimal dose of alum
achieved 99 percent suspended solids removal, while the optimal dose of polymer
achieved 96 percent removal. With respect to filterable COD, a maximum of 20 percent
removal was obtained using alum, while a 43 percent removal was achieved using
polymer. However, the maximum COD removal achieved using polymer was observed
at much higher doses than the dose providing maximum solids removal. They found that
using alum they produced a more compact sludge, but observed significant decreases in
the pH of supernatant, from approximately 7.8 to a minimum of 4. Ayoll et al. (2005),
used a combination of both cationic and non-ionic polymers to perform bench-scale
testing of sludge conditioning, focusing on the turbidity of filtrate and the shear strength
of the floe structure. They found that polymer charge was important for both polymers,
regardless of the order in which they were applied, suggesting that it is unlikely that the
first polymer neutralizes charge, while the second polymer works primarily as a tether,
bridging particles together. They found that dual polymer conditioning offered only
modest advantages versus single polymer conditioning, and suggest that the additional
cost associated with implementing dual polymer systems makes a full-scale application
unlikely. Olivier et al. (2004) tested the performance of GBT thickening at lab scale, and
predicted full-scale performance. The solids content of the thickened sludge was
monitored to gauge the effectiveness of a given dose. Using an empirical model, and a
14
Reproduced with permission of the copyright owner. Further reproduction prohibited without permission.

15
mathematical model for gravity drainage based on Darcy’s law, they scaled up bench
scale results to predict full scale performance. They were able to predict full-scale
performance of a belt filter based on laboratory data, and developed a model of full scale
thickening performance that was within approximately 10 percent of actual results.
Overall, it appears that research in the field of sludge conditioning is more often
dedicated to the conditioning and dewatering of digested sludge than to the thickening of
sludge before digestion. The existing literature is commonly focused on using mainly
physical parameters to characterize sludge before and after conditioning and subsequent
thickening and/or dewatering processes occur. The evaluation of polymers may,
however, be based not only on their performance with respect to solids capture, but also
on an evaluation of how different polymers direct nutrients to solid and liquid phases
during thickening. Chemicals such as ammonia nitrogen, total Kjeldahl nitrogen, (TKN),
phosphorous (P), biochemical oxygen demand (BOD), may be examined in the separated
thickened solids and liquid filtrate to characterize how each polymer performs with
respect to the phase selection of nutrients. These nutrients may be important to either or
both of the digestion process and/or land application of biosolids after digestion. The
importance of this separation process is two-fold: Firstly, the digested biosolids will be
most useful and beneficial if the digested sludge is high in nutrients. They will also be
more likely to meet regulations, since the land application standards in Ontario are
expressed as minimum nutrient to metal ratios (Government of Ontario, 2002). The
concentration of metals in sludge is correlated to the composition of the wastewater, and
thus is difficult to manipulate, but if the concentration of nutrients is maximized, the
15
Reproduced with permission of the copyright owner. Further reproduction prohibited without permission.

16
digested sludge will be more likely to meet regulations. Secondly, understanding the
differences in nutrient selection with respect to various polymers will allow for tighter
control of what is recycled through the WWTP. When thickening takes place, the liquid
stream, (e.g.. filtrate from a GBT), is incorporated into the inflow to the plant. This is an
important mechanism, because nutrient chemicals may be removed from wastewater
using expensive and/or sensitive processes. For example, phosphorous is often
precipitated out of activated sludge using coagulants such as ferric chloride.
Phosphorous in the form of phosphates can cause imbalances in the natural aquatic
ecosystem, and so regulations limit the amount of phosphorous that may be present in
WWTP effluent. To ensure regulatory compliance, coagulants are mixed with activated
sludge in the aeration basins. In the case of ferric chloride, the coagulation mechanism
involves a reaction between iron salts and phosphates in the activated sludge, which
forms insoluble phosphorous precipitates that settle to the bottom of clarifiers (Droste,
1997). Therefore, if the phosphorous concentration of the activated sludge is increased
by the recycling of phosphorous within GBT filtrate, the demand for coagulant chemicals
will increase to maintain compliance. Understanding how polymers affect the nutrient
concentration of solid and liquid streams may prevent using a polymer that offers solids
capture advantages while simultaneously increasing chemical loading through the plant.
Furthermore, in many localities, regulations require removal of various forms of nitrogen
from plant effluent. In the future in Canada, implementation of the Proposed Risk
Management Strategy Addressing Ammonia Dissolved in Water, Inorganic Chloramines
and Chlorinated Wastewater will introduce regulations establishing or reducing limits on
the maximum concentrations of various chemicals in WWTP effluent (Government of
16
Reproduced with permission of the copyright owner. Further reproduction prohibited without permission.

17
Canada, 2003). Thus, with respect to the nutrient loading of the plant, using a polymer
that is effective at producing GBT filtrate with a relatively low nutrient concentration,
(and, conversely, thickened sludge with a relatively high nutrient concentration), will be
economically and environmentally advantageous.
An important consideration in any polymer selection study is the difference between
bench-scale and full-scale testing. Often, a period of bench-scale or pilot-scale testing is
used to test alternatives that may be identified as potential candidates for full-scale
testing. This requires development of bench-scale apparatus, model(s) and testing
methodology that can mimic full-scale plant behaviour. However, bench-scale conditions
are only an approximation of the full-scale conditions, and thus the relative performance
of alternatives observed at bench-scale may be different than that observed at full-scale.
Thus, one of the secondary objectives of the polymer optimization research is to highlight
important differences between the data obtained from bench-scale and full-scale testing.
Some steps must be taken to ensure that bench-scale separation is a good approximation
of what may be expected at full-scale. Severin and Grethlein (1996) suggest methods for
mimicking full-scale belt filtration of conditioned wastewater sludge using bench-scale
apparatus. They assert that bench-scale apparatus should use filter material of the same
aperture size, age, and condition of the full-scale apparatus, and that loading rates should
be properly scaled up using the relative surface area of surfaces in bench-scale versus
full-scale testing. Severin et al. (1999) suggest that a major problem in modeling full-
scale gravity drainage at full-scale is overloading the filter, and so proper loading is
required. Furthermore, at full-scale, the use of plows or chicanes is useful to protect
17
Reproduced with permission of the copyright owner. Further reproduction prohibited without permission.

18
filters from clogging, and so simulating the action of those mechanisms at bench scale is
recommended.
2.2 Clarifier Optimization
2.2.1 Clarifier Foaming
In addition to the polymer optimization study, a study designed to investigate a persistent
foaming problem in the clarification basins was undertaken. Thick brown foam forms on
the clarifiers and compromises the quality of the plant effluent at Crystal Beach and
indeed at many WWTP locations throughout the world (Jenkins et al., 2004). This type
of clarifier foaming is typically biological in origin, caused by various types of
filamentous bacteria that have hydrophobic cell walls, and grow in activated sludge. The
filamentous bacteria tend to grow in dense mats within the activated sludge, and can
entrap gas and oils which cause the activated sludge to float on the surface of the
clarifiers, instead of settling. This type of foaming is well documented in literature
(Frigon et al., 2006; Jenkins et al., 2004; Richard, 2003; Parker et al., 2003; Oerther et
al., 2001; Lemmer et al., 2000; Pagilla et al., 1998; Iwahori et al., 1997; Sodell and
Seviour, 1996; Blackall et al., 1991; Baumann et al., 1988; Lemmer at al., 1988; Lemmer
and Baumann [2], 1988; Lemmer et al., 1986). The foam may be characterized as a
solids separation problem, as it can cause sludge to float on the surface of clarifiers,
impacting the quality of secondary effluent (Jenkins et al., 2004; Knoop and Kunst,
1998). Because the WWTP certificates of approval require that the WWTP effluent does
not exceed a given concentration of colony forming units of E. coli per 100 millilitres,
18
Reproduced with permission of the copyright owner. Further reproduction prohibited without permission.

19
excess coliform bacteria that may exist in the clarifier effluent due to the presence of
activated sludge foam require excess chlorine to be neutralized. The foam also contains
suspended solids that may wash over effluent weirs, increasing the suspended solids
concentration of the effluent (Jenkins et al., 2004; Knoop and Kunst, 1998). Large areas
of foam may also cause odour problems, and can overwhelm the scum troughs at the exit
side of the clarifiers, requiring operators to descum the surface manually, using hoses. In
winter months, the foam may freeze and disrupt the operation of the chain and flight
sludge collectors (Jess, 2005).
Options to control clarifier foaming include installing specialized compartments in the
aeration basin called selectors, or using chemicals to selectively target the foam (Jenkins
et al., 2004; Parker et al., 2003), however, in the former case the selector cells may be
expensive to implement and in the latter the chemicals mask the problem instead of
solving the reason for the foam generation. Thus, the purpose of this part of the project is
to attempt to characterize the plant characteristics that may cause foaming, and to
highlight possible process-based solutions that will not require physical alteration to the
structure of the plant.
The characterization of foaming problems in WWTP often involves examining the
microbial population responsible for the foaming, quantifying the concentration of
bacteria in the foam and identifying where the bacteria proliferate. Applying process-
based control strategies that do not involve large-scale, capital-intensive alterations of the
plant may then be used to rule out where the causes for foaming exist. The purpose of
19
Reproduced with permission of the copyright owner. Further reproduction prohibited without permission.

20
the microbial analysis is to: 1. Identify which types of foaming bacteria are present; 2.
Identify where the microbes responsible for the foaming initiate; 3. Determine if and
where microbes may be proliferating throughout the treatment process. This is
accomplished by examining samples of plant contents at various locations throughout the
treatment train. These types of projects are typically undertaken at full-scale in
continuously operating plants, and so any adjustment to the parameters or conditions
within the WWTP must be performed slowly, in order to avoid or reduce upset to the
activated sludge system.
There is a significant body of literature on the subject of foaming in activated sludge
plants that includes information on the growth and characteristics of the causative
bacteria (Eales et al., 2005; Jenkins et al., 2004; Lemmer et al., 2000; Iwahori et al.,
1997; Kappeler and Gujer, 1994). Some research is devoted to surveys of individual
plants across various regions (Blackall et al., 1991; Lemmer and Baumann, 1988), and
evaluations of the effectiveness of control strategies (Jenkins et al., 2004; Parker et al.,
2003). This work will provide an example of a single, small Canadian plant, and evaluate
the potential effectiveness of low-cost, process-based controls, implemented full-scale to
combat foaming in the activated sludge system. Furthermore, this study will underscore
the importance of taking an exhaustive, scientific approach to identifying foaming
problems. Because foaming problems are typically the result of various causative factors,
which may be difficult to discover and to control, it is essential to isolate important
preconditions for foaming wherever possible.
20
Reproduced with permission of the copyright owner. Further reproduction prohibited without permission.

21
2.2.2 Characterization of Microbiology
The microbiology of the foam is an important characterization. Foaming may be caused
by a multitude of different types of organisms, which can occur in different environments
(Jenkins et al., 2004; Richard, 2003; Lemmer et al., 2000). Appendix 1 provides a list of
common organisms found in foaming WWTP, including characteristics and causes.
Jenkins et al. (2004), implicate 26 different types of bacteria, and various types of fungi
that may cause activated sludge to exhibit bulking, foaming, or both during aeration and
clarification processes. In general, the goal of microbiological characterization is to
understand which type(s) of microorganisms may dominate the foam layer, allowing for
an evaluation of the plant conditions that allow a given population of microorganisms to
survive. Using this information, it is possible to consult literature sources that focus on
the ecology of various types of filamentous bacteria, to implicate conditions at the plant
which may be conducive to foaming problems. Richard (2003), suggests that there are
various microbial reasons for sludge separation problems. Slime bulking and foaming
may occur when bacteria in sludge floes produce excess amounts of polysaccharide. This
tends to occur during periods of high organic loading, when the food to microorganism,
(F/M) ratio is high. In other words, the amount of biochemical oxygen demand, (or
BOD, a surrogate measure of the substrate available), coming in, divided by the mass of
mixed liquor volatile suspended solids, (MLVSS, a surrogate measure of the mass of
organisms in activated sludge), is higher than optimal. According to Jenkins et al (2004),
slime bulking, also known as viscous bulking, can occur in plants when wastewater is
characterized by abundant amounts of soluble and metabolizable organics, but chemical
nutrients such as phosphorous and nitrogen are deficient. Even when nutrients are
21
Reproduced with permission of the copyright owner. Further reproduction prohibited without permission.
22
present in sufficient amounts, slime bulking and foaming can occur when the activated
sludge organisms are operating at high metabolic rates. Zoogloea bulking and foaming
can occur when Zoogloea ramigera, a common bacteria found in sludge floes, becomes
overgrown, causing sludge bulking, and hindering sludge settling (Jenkins et al., 2004;
Richard, 2003). Richard (2003) suggests that Zoogloea bulking and foaming occur when
the polysaccharide levels in sludge are normal, but low oxygen levels have encouraged
formation of organic acids that stimulate growth of Z. ramigera. Fungi have also been
implicated as potential agents causing foaming problems. The appearance of fungi at
levels great enough to cause solids separation problems has been shown to occur mainly
at low pH levels, particularly in plants that accept acidic industrial wastes (Jenkins et al.,
2004; Richard, 2003). Treatment plants that exhibit nutrient deficient environments may
also develop foaming problems due to filamentous bacteria. Jenkins et al. (2004)
implicate nutrient deficiency as a possible cause for bulking and foaming bacteria such as
Thiothrix spp, S. Natans, H. hydrossis, N. limicola III and Type 02IN. Foaming due to
nutrient deficiency is unlikely to occur in a domestic WWTP since domestic wastewater
tends to be rich in nutrients. Plants that use a nitrification-denitrification process to
convert ammonia nitrogen to nitrogen gas may also be susceptible to foaming, as nitrogen
bubbles produced in denitrification can provide buoyancy to sludge particles (Jenkins et
al., 2004).
A common and persistent type of foaming observed in domestic WWTP occurs due to a
large biomass of filamentous bacteria that may cause sludge to float on clarifier surfaces
instead of settling. One of the most commonly implicated types of foam-forming bacteria
22
Reproduced with permission of the copyright owner. Further reproduction prohibited without permission.

23
is Microthrix parvicella. These filamentous organisms have hydrophobic cell walls, and
can cause stable foams on clarifier and digester surfaces, by causing bridging between
sludge floes, and entrapping gas and hydrophobic substrates (Jenkins et al., 2004;
Westlund et al., 1998). This type of foaming is often observed in plants where the
retention time of activated sludge within the aeration system (called solids retention time
or SRT), is above optimal, the dissolved oxygen concentration (DO) concentration is
below optimal, and temperatures in aeration reactors are below about 15 degrees Celsius
(Jenkins et al., 2004; Richard, 2003; Lemmer et al., 2000; Knoop and Kunst, 1998).
Knoop and Kunst (1998) surveyed activated sludge WWTP with various nutrient loading
rates and nutrient removal processes, and found that M. parvicella occurred most often in
nitrification-denitrification configurations which operate at high SRT, (over
approximately 15 days), and seasonally in spring and fall, when activated sludge
temperature drops below 12 to 15 degrees Celsius. Furthermore, they found that M.
parvicella is more common in plants with relatively higher sludge loading rates.
Eikelboom et al. (1998) found that M. parvicella was the most common filamentous
microorganism observed in nutrient removal WWTP in a survey of four countries in
Northern Europe. They looked specifically at nutrient removal WWTP because they tend
to operate at higher SRT in order to remove ammonia-nitrogen through nitrification-
denitrification reactions. They suggest that low activated sludge temperature, and pre
settling of influent, (i.e. primary clarification), are two factors that may increase the
abundance of M. parvicella.
23
Reproduced with permission of the copyright owner. Further reproduction prohibited without permission.

24
Filamentous foaming is also commonly caused by a type of filamentous bacteria known
as actinomycetes or mycolata (Frigon et a l, 2006; Jenkins et a l, 2004; Richard, 2003;
Oerther et al., 2001; Lemmer et al., 2000; Iwahori et al., 1997; Blackall et al., 1991;
Baumann et al., 1988; Lemmer and Baumann, 1988; Lemmer and Baumann [2], 1988;
Lemmer, 1986). These bacteria, which are of the genus Nocardia, have hydrophobic cell
walls, and form the basis of a foam layer made up of stable, gas filled cells that strongly
resist settling (Lemmer et al., 2000). When organic loading is low, and F/M ratio drops,
Nocardia bacteria grow excessively, and are able to feed selectively on hydrophobic
substrates at the gas-water interface (Richard, 2003; Lemmer et al., 2000). Soddell and
Seviour (1996) examined the growth kinetics of Nocardia pinensis on various substrates.
Their study indicated that this type of organism grows at a faster rate and produces a
more substantial biomass on hydrophobic substrates such as polysorbate 80, (a nonionic
detergent and emulsifier derived from polyoxylated sorbitol and oleic acid), and olive oil
than the more ubiquitous glucose, a simple sugar. They suggest that uptake of glucose by
some Nocardia bacteria may be increased, however, when surface-active ingredients are
included in the growth medium. Eales et al. (2005) also studied the effects of
hydrophobic substrates on Nocardia pinensis, and found that these organisms are capable
of utilizing the hydrophobic substrate oleic acid under aerobic, anaerobic, and anoxic
conditions. Baumann et al. (1988) suggest that the ability to grow on refractory
substrates such as complex organic acids and pesticides may give foam-causing bacteria a
selective advantage over some other types of activated sludge microorganisms, but only
when the generation time is long enough to allow the slow metabolization processes to
occur. Many of the more desirable microorganisms in activated sludge grow more
24
Reproduced with permission of the copyright owner. Further reproduction prohibited without permission.

25
quickly than foam causing bacteria when substrates are abundant and easily metabolised,
but the foam causing bacteria can grow slowly on less easily metabolized substrates
while the other types of microorganisms starve (Baumann et al., 1988; Lemmer, 1986).
Furthermore, the hydrophobic cell walls of foam-causing bacteria may provide an
advantage over other microorganisms in activated sludge because hydrophobic substrates
may become concentrated at the gas-liquid interface of air bubbles, forming micro-zones
rich with nutrients available to the foam-forming bacteria (Lemmer and Baumann, 1988).
The foam-forming bacteria can multiply and proliferate while floating on clarifiers, due
to their ability to exploit the nutrient rich gas-liquid interfaces, and to their ability to store
polyphosphates and poly-Beta-hydroxybutyric acid as a food source during starvation
cycles (Lemmer and Baumann [2], 1988). Thus, the input of oils and grease into the
WWTP may cause excessive episodes of foaming to occur, as an abundance of
hydrophobic substrates may offer advantages to microorganisms that can cause foaming.
High grease and oil inputs into secondary treatment processes may also occur in plants
where primary clarification is not used, since oil and grease are partially removed during
primary clarification (Lemmer et al., 2000).
2.2.3 Environmental Factors
Some environmental features of the activated sludge process can cause various types of
foam-causing bacteria to occur. Scruggs and Randall (1998) developed laboratory-scale
apparatus to test the effects of DO concentration and F/M ratio on various species of
filamentous bacteria known to cause foaming or bulking problems. To test the effect of
DO, they maintained a constant F/M ratio and varied DO in the aeration reactor. They
25
Reproduced with permission of the copyright owner. Further reproduction prohibited without permission.
26
found that the growth of Nocardia was enhanced by DO concentrations above 1.0 mg/L.
They observed a nearly linear increase in growth relative to DO as concentration
increased from 1.0 to 5.0 mg/L. When DO was held constant and the F/M ratio was
varied, Nocardia was observed to be stimulated at F/M ratios of approximately 0.1 to 0.2
mg soluble chemical oxygen demand per mg mixed liquor suspended solids. Around this
same range of F/M ratio, some other types of filamentous bacteria that have been
observed to cause bulking and/or foaming to occur, such as type 0041, and type 1851
bacteria. Thus, these types of bacteria, (including Nocardia), are sometimes known as
low F/M filaments.
2.2.4 Foam Trapping
A phenomenon known as foam trapping has also been implicated as a possible
aggravation to foaming problems (Jenkins et al., 2004; Cha et al., 1992). When floating
foam is trapped due to physical features of the plant, such as restrictive piping or baffles
between aeration basins and clarifiers, the volume of foam is observed to increase. Cha
et al. (1992) performed tests using simulated foam trapping at bench-scale. They found
that foam trapping configurations increased Nocardia filament counts up to five times.
Jenkins et al. (2004) observed that plants with multiple paths between aeration basins and
clarifiers with varying degrees of foam trapping potential exhibit more intense foaming
where foam trapping features are more effective at trapping foam. Blackall et al. (1991)
performed lab experiments that mimicked foam trapping by growing floating Nocardia
filaments and removing bulk liquid from below the surface. They found that subsurface
26
Reproduced with permission of the copyright owner. Further reproduction prohibited without permission.

27
withdrawal of cultures (as opposed to surface withdrawal), encouraged growth of
Nocardia amarae. A summary of common causes of foaming is shown in Table 2.1.
Table 2.1 - Summary of Causes of Foaming Problems in Domestic WWTPType of Foaming Description Causes ReferenceDispersed Growth High growth rate of
floc-forming species causes excessive bacterial growth with poor flocculation of sludge, causing poor settling
Organic loading rate is too high, requiring reduction in food to microorganism ratio
Jenkins et al., 2004; Richard, 2003
Nitrification and Denitrification
Gas bubbles from nitrification and denitrification may cause sludge blanket to float to surface of clarifiers
High SRT; DO too low; sludge blanket spends too much time in clarifiers
Jenkins et al., 2004; Richard, 2003
Zoogleal Bulking and Foaming
Viscous, bulking and poorly settling sludge may form layer of foam in aeration and/or clarification system(s)
Excessive amount of exocellular polymer due to high carbohydrate loading; high F/M ratio
Jenkins et al., 2004; Richard, 2003
Type 1863 Foaming White, air-filled, collapsible foam
SRT too low; may be due to hydraulic short- circuiting
Richard, 2003
M. Parvicella Foaming Thick, brown, viscous foam in clarifiers and/or digesters
High SRT, low temperature, low DO concentration
Jenkins et al., 2004; Richard, 2003; Knoop and Kunst, 1998
Nocardia Foaming Thick, brown, viscous foam in aeration and clarification systems
High SRT, high aeration system temperature, exacerbated by foam trapping
Jenkins et al., 2004; Richard, 2003; Frigon et al., 2006
2.2.5 Coliform Analysis
Another important facet of the microbial analysis of the foam is to identify the
concentration of coliform bacteria in the foam. Coliform bacteria in natural aquatic
environments may cause public health problems, as some species of coliform bacteria can
cause debilitating and/or fatal reactions in humans (Droste, 1997). Activated sludge
contains high concentrations of coliform bacteria, and so because the foaming problem
27
Reproduced with permission of the copyright owner. Further reproduction prohibited without permission.

28
brings activated sludge to the surface of the clarifiers, it is possible that the foam causes a
greater concentration of coliform bacteria to be present in the secondary clarifier effluent.
To maintain regulatory compliance, disinfection processes are used to destroy or
inactivate coliform bacteria. Thus, identifying coliform bacteria in the foam justifies the
eradication of the foam from a public health perspective. To test samples of clarifier
liquid and foam, the most probable number technique is recommended, as this allows for
relatively large samples to be tested, relative to alternative coliform enumeration
techniques such as the colony count technique (American Public Health Association,
1998).
2.2.6 Foaming Examples from Literature
Blackall et al. (1991) conducted a survey of 283 samples from 46 plants in Queensland,
Australia. Using microscopic identification and gram-staining, they identified Nocardia
amarae and Nocardia pinensis as the most common organisms found to be concentrated
in the foam phase. They also found significant amounts of other Nocardioform species.
Frigon et al. (2006) conducted an 8 year surveillance study of a WWTP in Illinois that
was know to persistently exhibit seasonal episodes of foaming. They identified Gordonia
amarae, (also known as Nocardia amarae), Skermania piniformis, (an organism related
to Nocardia pinensis), and Rhodococcus rhodochrous as the dominant organisms.
Collectively, these organisms are called mycolata, referring to actinomycetes containing
mycolic acid. The authors suggest two main factors that may be responsible for the
observed foaming problems: 1.) an activated sludge reactor temperature above 18 degrees
Celsius, and 2.) bypass of primary clarifiers They surmise that bypassing of the primary
28
Reproduced with permission of the copyright owner. Further reproduction prohibited without permission.
29
clarifiers allows elevated levels of oil, grease, and hydrophobic substrates into the
activated sludge reactor, which provide substrate for foam-causing filamentous bacteria.
Using samples from the same WWTP, Oerther et al. (2001) quantified the actual
concentrations of Nocardia bacteria in activated sludge using bench-scale tests and full-
scale assays. They discovered that foaming incidents were concurrent with relatively
large populations of filamentous bacteria. The abundance of Nocardia bacteria was
observed to increase fivefold during foaming. They implicate several conditions as
important precursors to foaming episodes, including high aeration reactor temperature
(greater than or equal to 23 degrees Celsius), high MLSS concentration, (above 1900
mg/L), higher SRT, and low F/M ratio. In Japan, Iwahori et al. (1997), conducted a one-
year survey of a plant known to have continual foaming problems. The foam layer
occurred in the aeration cells and secondary clarifiers, and was shown microscopically to
have a dominant population of Nocardia Amarae bacteria. The authors surmised that the
Nocardia bacteria are concentrated at various points in the plant. Firstly, they suggest
that recycling of foam removed from the secondary clarifiers back to the primary
clarifiers concentrates Nocardia bacteria in the primary clarifiers. Secondly, Nocardia
bacteria are concentrated in the aeration system, as this is the only part of the plant where
Nocardia bacteria actually grow. Using mass balances, the authors showed that 95
percent of the Nocardia bacteria in secondary clarifier influent were returned at some
point to the aeration system, greatly increasing the retention time of scum causing
bacteria versus settlable solids in the treatment system. The effect of recycle streams on
plants that exhibited foaming problems was also investigated by Pagilla et al. (1998). The
authors found that Nocardia bacteria may reseed populations upstream when recycle
29
Reproduced with permission of the copyright owner. Further reproduction prohibited without permission.
30
streams, (such as RAS recycle or DAF thickener supernatant), are reintroduced to
secondary treatment. They focused especially on DAF liquid streams being recycled, and
concluded that reseeding may occur due to floe breakdown, whereby Nocardia bacteria
within the floe may be exposed, or due to lysed bacterial cells releasing foam-stabilizing
compounds in the digester. They also concluded that the reseeding mechanism may be so
effective that Nocardia in WAS can reseed populations in the aeration system, even when
filament counting analysis of recycle streams does not indicate that Nocardia bacteria are
present.
2.2.7 Foaming Control Strategies
There are various methods that may be useful for controlling the occurrence of foaming
in activated sludge WWTPs. Jenkins et al. (2004) suggest that process-based control
strategies may be difficult to implement and control, particularly when a large portion of
the plant solids inventory is incorporated in the foam layer. They suggest that providing
different types of specialized environments in specialized reactors called selectors may be
used to provide an environment in which desirable activated sludge microorganisms are
able to uptake substrate faster than scum forming bacteria such as Nocardia. In an
experiment by Cha et al. (1992), it was shown that Nocardia filament counts were
significantly lower in an aerobic selector when compared to a completely mixed aeration
reactor, (which was maintained at the same temperature and DO concentration as the
selector), when the retention time of the selector was 5 days. At a solids retention time of
10 days, the Nocardia filament counts were much closer in magnitude in the two
environments. In an anoxic selector, (i.e. one in which oxygen is not present but nitrite or
30
Reproduced with permission of the copyright owner. Further reproduction prohibited without permission.

31
nitrate is), using a retention time of 12 days, Nocardia filament counts were reduced by
about 75 percent after 48 days. Anaerobic selectors have been shown to be effective in
some instances, but only when enhanced biological phosphorous removal is practiced
(Jenkins et al., 2004; Blackall et al., 1991). Another type of selector, known as a
classifying selector, has also been used to control Nocardia foaming with some success.
This technology uses a physical process to selectively waste foam solids prior to
secondary clarification, in order to prevent foaming in clarifiers. The classifying selector
allows floating foam on the aeration tanks that is high in foam-causing bacteria to flow
out of the activated sludge system for disposal (Jenkins et al., 2004; Parker et al., 2003).
Parker et al. (2003) performed a survey of seven plants with foaming problems in the
United States, most of which had foam trapping problems that were thought to intensify
the problem. The installation of classifying selectors was observed to remove some or all
of the observed foam on secondary clarifiers.
Various chemical methods of foaming suppression have been attempted at wastewater
treatment plants. For example, chlorination has become a relatively common method
used to neutralize foam-causing filamentous bacteria (Jess, 2005; Jenkins et al., 2004).
One way of using disinfectant chemicals is to introduce them into RAS flows, in order to
destroy foam-causing bacteria before they are reintroduced into the aeration system. This
may be a problematic strategy, as chlorine dosing of RAS will result in the destruction of
beneficial organisms as well as deleterious ones. Excessive doses can also cause floe
break-up, which may hamper downstream solids separation processes (Jenkins et al.,
2004). A potentially more effective method of using disinfectant chemicals to control
31
Reproduced with permission of the copyright owner. Further reproduction prohibited without permission.
32
foaming is to use a spray system to contact the surface of floating foam (Jess, 2005;
Jenkins et al., 2004). Jess (2005) showed that a rudimentary surface spray system that
used a chlorinated solution sprayed on the surface of biological foam with shower heads
eradicated a clarifier foaming problem at a WWTP in Calgary. In practice, this type of
system may represent a way to use foam trapping as an advantage, since foam is easily
targeted in a contained environment, and altering structural components of existing plants
with foam trapping problems is a difficult task. Chemical methods of foam control also
include the use of anti-foaming agents or filamenticides that are designed to cause
chemical reactions that eliminate biological foams. These may be proprietary chemicals
that are produced for specific applications. Although research of these types of chemicals
is lacking, some suggest that these can produce effluent toxicity if used improperly
(Jenkins et al., 2004). Chemical methods of controlling foam-causing bacteria may also
be useful if the filamentous bacteria population may be reseeded by the recycle streams.
If it is discovered that the filamentous bacteria are able to survive in part due to reseeding
of the population by recycling processes, selectively destroying these bacteria before they
re-enter the activated sludge system may mitigate foaming problems (Jenkins et al., 2004;
Pagilla et al., 1998).
The addition of cationic polymers to activated sludge in the aeration basin has been used
in some plants to control Nocardia foaming. Clarifier foaming may be due to the
presence of Nocardia filaments both within sludge floes, and those floating freely in
mixed liquor, and so the use of polymers to coagulate free-floating filaments is a logical
control measure (Jenkins et al., 2004; Shao et al., 1997). Shao et al. (1997) performed
32
Reproduced with permission of the copyright owner. Further reproduction prohibited without permission.
33
experiments that suggest that free-floating Nocardia bacteria are more effective at
causing foaming problems than those contained within floes. They surmised that anionic
surfactants in the influent at a WWTP in Los Angeles may be contributing to Nocardia
foaming in the aeration and clarification systems, and so they experimented with addition
of a cationic polyacrylamide solution. They found that polymer addition eliminated the
episodic foaming problem. Jenkins et al. (2004) discuss polymer addition to prevent
foaming and bulking problems, and warn that polymer addition for these purposes should
be closely controlled and monitored to prevent sludge gelling, which may in fact make
bulking and/or settling problems worse. A major disadvantage of polymer addition to
control bulking or foaming problems is the expense associated with an increased
continuous polymer demand in the plant.
According to many sources (Frigon et al., 2006; Jenkins et al., 2004; Iwahori et al., 1997;
Blackall et al., 1991; Lemmer, 1986) the time that microorganisms spend in the activated
sludge system, (i.e. the SRT), may be an important control on the occurrence and
persistence of foaming in the secondary clarifier. This is mainly because foam-causing
bacteria tend to be slowly growing relative to other microorganisms in the activated
sludge, and develop significant populations only if given sufficient time to grow and
multiply (Jenkins etal., 2004; Baumann etal., 1988; Lemmer, 1986). Kappeler and Gujer
(1994) suggest that scum causing bacteria may be washed out of WWTPs at low solids
retention times of approximately 2 days. Even when the average SRT is relatively low,
erratic SRT may encourage foam-causing bacteria to proliferate in periods of relatively
high SRT, and remain in the activated sludge system due to the influence of recycle
33
Reproduced with permission of the copyright owner. Further reproduction prohibited without permission.

34
streams and/or foam-trapping (Jenkins et al., 2004). Therefore, it may be advantageous
to implement automatic SRT control using computer-based process logic that maintains a
pre-set SRT. Jenkins et al. (2004), suggest that it is possible to maintain a foam-free
environment at higher SRT with automatic SRT control, compared to when SRT is
controlled manually. Automating SRT involves returning RAS and wasting WAS from
the activated sludge system at a constant rate, so that the amount of time that activated
sludge solids spend in the process train is maintained at a constant value. This type of
process control may also be used to regulate the F/M ratio, especially at domestic plants
such as Crystal Beach WWTP, where the composition of the influent remains relatively
constant, because the concentration of microorganisms in the activated sludge,
(approximated by the MLVSS concentration), remains constant. This is an important
consideration because the food to micro-organism (F/M) ratio, defined as the mass of
incoming carbonaceous BOD per day, divided by the mass of micro-organisms housed in
the aeration basins, (which is related to the SRT), may also be an important control on the
prevalence of foaming (Jenkins et al., 2004; Kappeler and Brodmann, 1995; Lemmer
1986). Because the slowly growing filamentous bacteria can metabolize a larger variety
of substrates relative to other microorganisms in activated sludge, foam-causing bacteria
may obtain a competitive advantage at low F/M ratios (Jenkins et al., 2004; Kappeler and
Brodmann, 1995; Blackall et al., 1991). Although it is difficult to alter the character of
the plant influent, (i.e. the food), it is possible to adjust the amount of microorganisms in
the aeration basin by controlling the ratio of the amount of sludge wasted to the amount
of sludge returned (Metcalf and Eddy, 2003; Droste, 1997).
34
Reproduced with permission of the copyright owner. Further reproduction prohibited without permission.

35
3 Methods and Materials
3.1 Sludge Thickening
The polymer selection process employed 4 phases. From a group of 20 samples, 3 were
selected for full-scale testing. The progression is outlined in Figure 3.1.
Phase 1: SCREENING
20 POLYMERS
Figure 3.1 - Polymer Testing Progression
3.1.1 Polymer Preparation for Bench-Scale Testing
All polymers tested in this study are cationic granular polymers. For all bench-scale
testing, each type of polymer is prepared in a stock solution at 0.1%, using tap water at 20
degrees Celsius. Each solution is mixed on a jar test apparatus at 25 rpm for 1 hour.
Polymer solutions are prepared each day for testing.
35
Reproduced with permission of the copyright owner. Further reproduction prohibited without permission.

36
3.1.2 Phase 1 Polymer Testing - Oxidation-Reduction Potential
Polymer solutions are prepared in triplicate for phase 1 testing. To characterize the
ability of the polymers to neutralize the negatively charged particles within the WAS, the
polymer solutions are tested for oxidation-reduction potential (ORP) using an extech
RE300 handheld probe. This device measures the ability of a solution to donate or accept
electrons, and thus gives a measure of the polymers ability to neutralize charged sludge
particles, and allow flocculation to occur. After the probe is inserted into the polymer
solution, the reading is allowed to stabilize for at least 90 seconds, and each solution is
tested twice. 1.00 M KCL standard redox solution is used as a reference standard after
every measurement. The calculation of the oxidation-reduction potential (ORP) is done
using methods described in Standard Methods, 20th edition, (American Public Health
Association, 1998). ORP testing is shown below in Figure 3.2. See Appendix 2 for
calculations.
Figure 3.2 - ORP Testing of Polymer Solution
36
Reproduced with permission of the copyright owner. Further reproduction prohibited without permission.
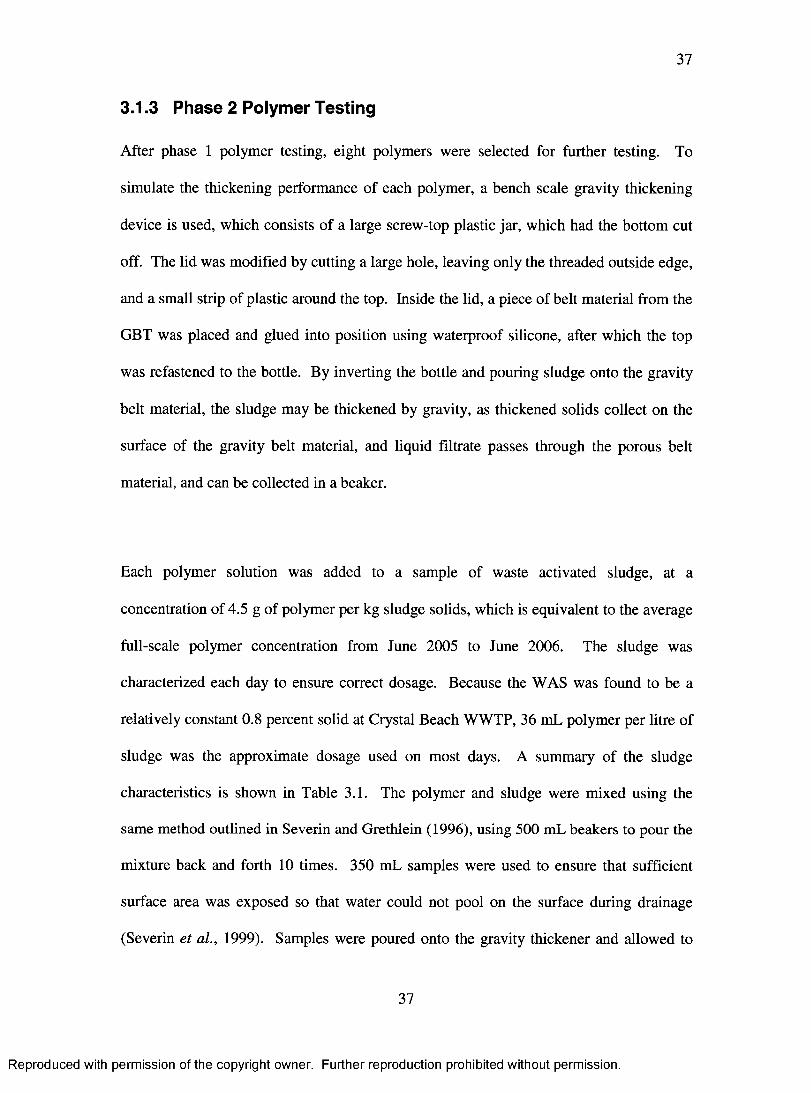
37
3.1.3 Phase 2 Polymer Testing
After phase 1 polymer testing, eight polymers were selected for further testing. To
simulate the thickening performance of each polymer, a bench scale gravity thickening
device is used, which consists of a large screw-top plastic jar, which had the bottom cut
off. The lid was modified by cutting a large hole, leaving only the threaded outside edge,
and a small strip of plastic around the top. Inside the lid, a piece of belt material from the
GBT was placed and glued into position using waterproof silicone, after which the top
was refastened to the bottle. By inverting the bottle and pouring sludge onto the gravity
belt material, the sludge may be thickened by gravity, as thickened solids collect on the
surface of the gravity belt material, and liquid filtrate passes through the porous belt
material, and can be collected in a beaker.
Each polymer solution was added to a sample of waste activated sludge, at a
concentration of 4.5 g of polymer per kg sludge solids, which is equivalent to the average
full-scale polymer concentration from June 2005 to June 2006. The sludge was
characterized each day to ensure correct dosage. Because the WAS was found to be a
relatively constant 0.8 percent solid at Crystal Beach WWTP, 36 mL polymer per litre of
sludge was the approximate dosage used on most days. A summary of the sludge
characteristics is shown in Table 3.1. The polymer and sludge were mixed using the
same method outlined in Severin and Grethlein (1996), using 500 mL beakers to pour the
mixture back and forth 10 times. 350 mL samples were used to ensure that sufficient
surface area was exposed so that water could not pool on the surface during drainage
(Severin et al., 1999). Samples were poured onto the gravity thickener and allowed to
37
Reproduced with permission of the copyright owner. Further reproduction prohibited without permission.

38
drain for 10 minutes. Testing was then performed on the separated solid and liquid
phases. The thickening apparatus is shown below in Figure 3.3.
Table 3.1 - Summary of Sludge Characteristics at Crystal Beach WWTP:
Sample Type Activated Sludge Waste Activated Sludge
Parameter Suspended Solids (mg/L)
VolatileSuspended Solids (%)
Total Solids (%) Total Volatile Solids (%)
Average 3360 66 0.83 34Standard Deviation 758 11 0.15 3
Methods for the tests performed were taken from Standard Methods (American Public
Health Association, 1998). Solid phase testing included: total solids, total volatile solids,
total phosphorous, total Kjeldahl nitrogen, ammonia nitrogen, and total five-day BOD.
The same parameters were measured in the liquid samples except total volatile solids; in
addition liquid samples were tested for total suspended solids and turbidity. Table 3.2
summarizes the parameters tested. Please see Appendix 2 for calculations related to
analytical methods.
38
Reproduced with permission of the copyright owner. Further reproduction prohibited without permission.
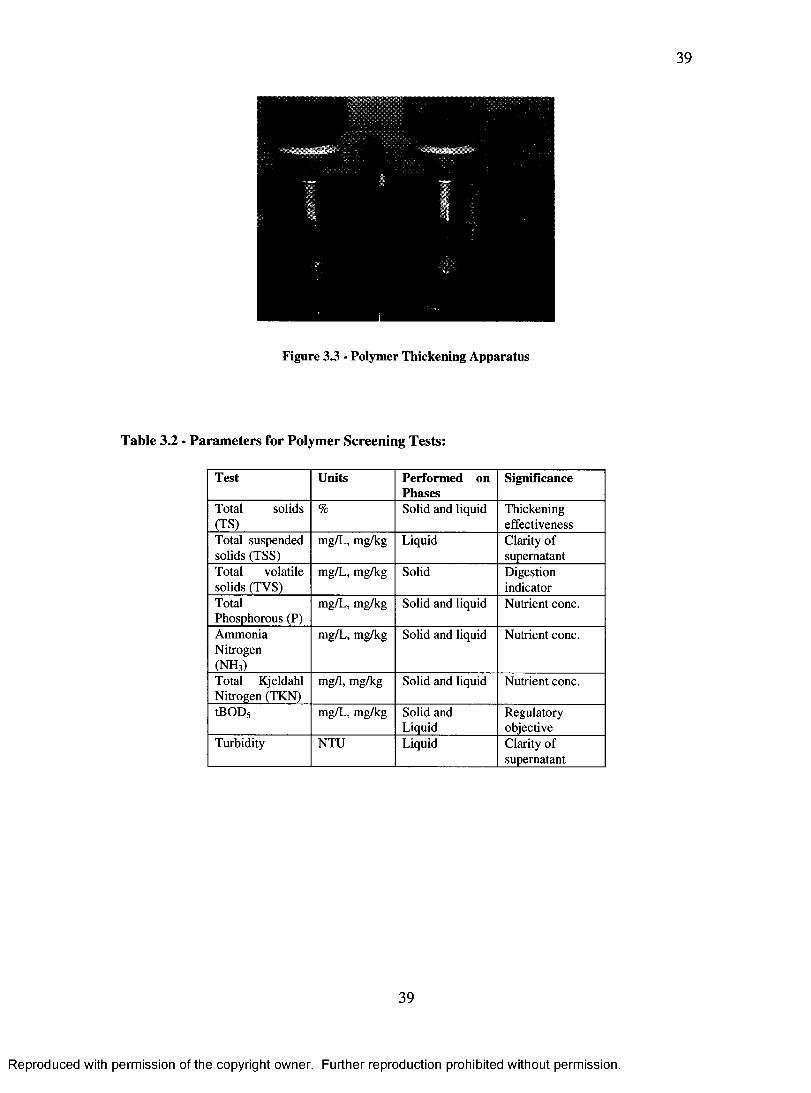
Figure 3.3 - Polymer Thickening Apparatus
Table 3.2 - Param eters for Polym er Screening Tests:
Test Units Performed on Phases
Significance
Total solids (TS)
% Solid and liquid Thickeningeffectiveness
Total suspended solids (TSS)
mg/L, mg/kg Liquid Clarity of supernatant
Total volatile solids (TVS)
mg/L, mg/kg Solid Digestionindicator
TotalPhosphorous (P)
mg/L, mg/kg Solid and liquid Nutrient conc.
AmmoniaNitrogen(NH3)
mg/L, mg/kg Solid and liquid Nutrient conc.
Total Kjeldahl Nitrogen (TKN)
mg/1, mg/kg Solid and liquid Nutrient conc.
tBOD5 mg/L, mg/kg Solid and Liquid
Regulatoryobjective
Turbidity NTU Liquid Clarity of supernatant
39
Reproduced with permission of the copyright owner. Further reproduction prohibited without permission.

40
3.1.3.1 Total Solids Test
Samples of approximately 20 g (for solids), or 20 mL (for liquids), were dried in ceramic
crucibles at 105 degrees Celsius for 18 hours, allowed to cool in a desiccator to room
temperature, and weighed on an electronic balance (Sartorius™ Model 1200s).
3.1.3.2 Total Suspended Solids Test
Whatman™ 934-AH glass fibre filter papers (1.5 pm aperture size), were removed from
a dessicator and weighed on an electronic balance. Liquid samples of 100 mL were
vacuum filtered through the filter papers using a Buchner funnel, and papers were rinsed
with distilled water. The filter papers were then dried at 105 degrees Celsius for 18
hours, allowed to cool in a dessicator to room temperature, and weighed on an electronic
balance.
3.1.3.3 Total Volatile Solids Test
After total solids testing, (see section 3.1.3.1), the contents of the crucibles were burned
at 550 degrees Celsius for 2 hours, allowed to cool in a dessicator to room temperature,
and weighed on an electronic balance. The difference in mass between the crucibles after
total solids testing and the crucibles after burning is converted into a percentage, and
reported as the percent total volatile solids (see Appendix 2). This test shows what
percentage of the dried solids that are volatized at 550 degrees Celsius.
40
Reproduced with permission of the copyright owner. Further reproduction prohibited without permission.

41
3.1.3.4 Total Phosphorous Test
The total phosphorous test consists of a digestion phase in which phosphorous is
converted to ortho-phosphate in a reaction with sulfuric acid, potassium sulfate and
mercuric sulfate. Ortho-phosphate then reacts with ammonium molybdate and potassium
antimony tartrate to form an antimony-phospho-molybdate complex. This complex is
reduced by ascorbic acid, after which it exhibits a blue colour that can be identified by a
spectrophotometer at 880 nm (Cheese, 2005).
For liquid samples, 12.5 mL of sample is diluted with 12.5 mL deinonized (DI) water.
For solid samples, approximately 0.2 g of sample is weighed on an electronic balance,
and mixed with enough DI water to make a sample of 25 mL total volume. Between four
and six Hengar boiling stones are added to each test tube. 5 mL of digestion solution is
added. The digestion solution is made by adding 650 mL DI water to a 1 liter flask, then
adding 134 g of potassium sulphate, and 200 mL of sulfuric acid (97 percent
concentration). While stirring, 25 mL of mercuric sulfate solution, (87.5 percent DI
water, 12.5 percent sulphuric acid, 8.0 g mercuric oxide) is added. The solution is mixed
on a vortex mixer and heated at 200 degrees Celsius in a digestion rack for 180 minutes,
and then at 380 degrees Celsius for 60 minutes. Samples are cooled at 20 degrees Celsius
for 30 minutes. Samples are brought back up to 25 mL with DI water, and mixed again
on the vortex mixer. Solid samples are diluted by a factor of 10 after digestion. Samples
are then transferred to 10 ml autosampler tubes, and measured for absorbance at 880 nm
using a Skalar 01- SAN Plus System- Model # 4001 Segmented Flow Analyser.
41
Reproduced with permission of the copyright owner. Further reproduction prohibited without permission.

42
3.1.3.5 Ammonia Nitrogen Test
The ammonia nitrogen test uses chlorine to form monochloramine, which then reacts
with salicylate to form 5-aminosalicylate. The solution is oxidized and forms a green
coloured complex, which is measured for absorbance at 660 nm, (Linkiewicz, 2005).
For liquid samples, approximately 10 mL of sample is poured into a 12 ml autosampler
tube. Solid samples are prepared by weighing 1 g of sample into a 50 ml plastic tube
using an electronic balance, and then adding 50 mL DI water, and 3 drops of sulphuric
acid (97 percent concentration). Samples are then placed in a sonicator for 20 minutes,
then filtered with a 0.45 micron filter. Samples are diluted by a factor of 10 prior to
measuring absorbance.
3.1.3.6 Total Kjeldahl Nitrogen Test
The Total Kjeldahl Nitrogen, (TKN) test employs a digestion phase identical to the one
used in the total phosphorous test, (see section 3.1.3.4). Since TKN is equal to the
amount of organic nitrogen plus ammonia, the reaction to form an oxidized 5-
aminosalicylate complex is also performed as in section 3.1.3.5
3.1.3.7 Total Biochemical Oxygen Demand Test
The tBODs test employs the Hach BODTrak apparatus. This equipment uses air tight
sample containers equipped with pressure sensors. Samples are incubated for five days,
and reductions in headspace pressure in the bottles are equated to oxygen uptake by
42
Reproduced with permission of the copyright owner. Further reproduction prohibited without permission.

43
microorganisms and chemical oxidation processes. To prevent inaccurate measurements,
lithium hydroxide crystals are present below the pressure sensor to absorb carbon dioxide
formed by the oxidation of organic matter (Hach Company, 2006). Since the equipment
does not allow measurement of chemical oxygen demand early in the five day testing
interval, the COD is not subtracted from the measurement, and the results are listed as
total biochemical oxygen demand, not total biological oxygen demand.
Liquid samples were diluted by a factor of 10 by volume, while solid samples were
diluted by a factor of 100 by weight using distilled water. Using a graduated cylinder,
approximately 85.5 mL of sample were poured into sample bottles. Using a pipette, 9.5
mL of raw sewage influent of known tBODs (-200 mg/L tBOD5) is inserted into each
bottle. 0.5 mL of nutrient buffer is added (Hach Company product # 1416066), to ensure
optimal bacterial growth, and a 1 cm magnetic stir bar is inserted. Each sample container
is capped with a rubber seal that includes a cup fdled with lithium hydroxide crystals.
Sample bottles are placed on magnetic stirrers, and sealed with pressure sensitive tops.
The BODTrak unit and samples are incubated at 20 degrees Celsius for five days. A
quality control sample is obtained by using a glucose-glutamic acid standard solution at 2
percent concentration. Samples are discarded if standard solution tBOD5 is not measured
at 198 ± 30.5 mg/L, (American Public Health Association, 1998).
3.1.3.8 Turbidity Test
Turbidity tests were performed using the Hach 2100P portable turbidimeter. Liquid
samples are swirled by hand, and approximately 15 mL of sample are poured into 20 mL
43
Reproduced with permission of the copyright owner. Further reproduction prohibited without permission.
44
glass sample cells that have been rinsed with DI water. Sample cells are placed in the
turbidimeter, and turbidity measured. Quality control is established by using a 100 NTU
formazin calibration standard.
3.1.4 Phase 3 Polymer Testing
After phase 2 polymer testing, three polymers were tested further to determine
appropriate polymer dosages for subsequent full scale testing.
The dosages used are described in Table 3.3
Table 3.3 - Polym er Concentrations for Phase 3 and Phase 4 Testing
Dose Control 1 2 3 4 5g polymer solids
kg sludge0 2.75 3.65 4.55 5.45 6.35
The polymer was added to the sludge samples using a pipette, and the mixture was rapid
mixed for 30 seconds at 300 rpm, then slowly mixed at 25 rpm for 3 minutes on the jar
test apparatus. After mixing, 500 mL of flocculated sludge was poured through the
gravity filter, and allowed to drain for 10 minutes. The thickened solids and the collected
filtrate were stored separately for testing.
Both solid and liquid phases were tested for total solids. The solid phase samples were
also tested for total phosphorous and total Kjeldahl nitrogen. The liquid phase was tested
for ammonia and total BOD (tBOD). Because of equipment limitations, only 4 liquid
samples were tested for tBOD. The 3.65, 4.55, 5.45, and 6.35 g polymer per kg sludge
solids concentration samples were used for tBOD testing.
44
Reproduced with permission of the copyright owner. Further reproduction prohibited without permission.

45
A sample of filtrate was also collected after 12 seconds of drainage, and tested for
turbidity. This test approximated the contact time that the sludge and polymer mixture
achieves at full scale on the GBT.
3.1.5 Polymer Full-Scale Testing
Three polymer types, (including the incumbent), were selected for two-week trials at full-
scale. Samples of the thickened sludge and the filtrate from the thickening process were
tested weekly for the parameters listed in Table 3.2. In this segment of testing, the
polymer solutions are mixed automatically using tap water. The temperature of the mix
water was not controlled at this point, but batches of polymer solutions were mixed at
least 12 hours before testing, and kept at stored at room temperature, approximately 20
degrees Celsius.
3.1.6 Description of Thickening Process at Crystal Beach WWTP
At Crystal Beach, the GBT is the device used to thicken WAS, primarily because of its
ease of operation and its ability to thicken automatically, with minimal operator
supervision. The unit uses a variable speed belt with 200 pm aperture, which is capable
of accepting up to 80 m2 of WAS per hour. Typically, the unit is operated at a flow rate
of approximately 60 m per hour, for 0 to 6 hours per day. The WAS is first conditioned
using a cationic polymer that increases the effectiveness of the thickening process. The
WAS is mixed with an aqueous polymer solution by turbulence in a cylindrical
45
Reproduced with permission of the copyright owner. Further reproduction prohibited without permission.

46
headstock, and the flocculated sludge overflows the headstock and is spread over the belt.
Typically, flocculated sludge spends approximately 8 to 10 seconds on the belt, travelling
3.5 meters before being conveyed by gravity into an outlet hopper that uses thickened
waste activated sludge pumps to pump the thickened sludge to the anaerobic digester.
Sampling from the GBT was done by hand, using 500 mL plastic jars. Thickened sludge
was collected from the GBT outlet hopper, while filtrate was sampled using a 2.5 m
metal sampling pole to which the sampling jars were attached. The filtrate sampling is
shown in Figure 3.4.
i
Figure 3.4 - Full-scale Filtrate Sampling
3.1.6.1 Total Phosphorous Test
During full-scale testing, the PhosVer 3™ with acid persulfate digestion method was
used for liquid samples of GBT filtrate (Hach Company method 8190). Samples were
diluted by a factor of five, and 5 mL of diluted sample was inserted into glass test vials.
Potassium persulfate pillows, (Hach product 20847-66), were emptied into each vial, and
vials capped and shaken to mix contents. Vials were incubated at 150 degrees Celsius in
46
Reproduced with permission of the copyright owner. Further reproduction prohibited without permission.

47
a DRB 200 reactor for 30 minutes, and then cooled to room temperature. Using a pipette,
2 mL of 1.54 N sodium hydroxide is added to each sample, and vials are capped and
shaken. Vials are placed into Hach DRB 2800 spectrophotometer analyzer unit cell
holder, and zeroed. The contents of one PhosVer™ powder pillow, (Hach product
21060-46), are added, and vials capped and shaken for 15 seconds. After a three minute
reaction period, vials are placed into analyzer cell holder. The results are expressed in
mg/L PO43'.
3.1.6.2 Ammonia Nitrogen Test
The Nessler method for nitrogen ammonia analysis was used during full-scale testing,
(Hach method 8038). A 25 mL mixing graduated cylinder was filled with sample, and
three drops of mineral stabilizer (Hach product 23776-26), were added to complex
hardness. The cylinders were sealed with stoppers, and inverted four times to mix
contents. Three drops of polyvinyl alcohol were added to each sample, (Hach product
23765-26), and samples mixed once more by inverting four times. Using a pipette, 1 mL
of Nessler reagent, a 0.09 mol/L solution of potassium tetraiodomercurate(II) (K2[HgL])
in 2.5 mol/L potassium hydroxide, (Hach product 21194-49), is inserted into each
sample, and cylinders are sealed and inverted four times to mix. After a one-minute
reaction period, samples are placed in Hach DRB 2800 spectrophotometer analyzer cell
holder, and measured for ammonia concentration. Each sample is measured directly after
a DI water blank containing the same reagents, used to zero the meter.
47
Reproduced with permission of the copyright owner. Further reproduction prohibited without permission.

48
3.2 Foam Control
3.2.1 Microbial Identification
To determine the composition of the clarifier foam, a sample is obtained from the
clarifier and examined under a compound binocular laboratory microscope. Samples are
collected from the clarifier surface using a 500 mL polyethylene terephthalate (PET)
plastic sample container. Samples of clarifier foam were collected in June, August,
October, and December, to determine whether the dominant species remain so over time.
Samples were also obtained from other points in the process stream, to understand how
filamentous bacteria may be surviving, proliferating, and possibly reintroduced into the
activated sludge system. Samples of raw influent from the headworks of the plant, from
the waste activated sludge storage tanks, from the return activated sludge system, and
from the sludge thickening filtrate, (which is sent to the aeration basins for treatment),
were all examined.
Samples were examined at 100 times magnification for initial characterization of
representative bacteria. Each sample was then stained using the crystal violet gram-
staining method: After using a dropper to deposit approximately 1 mL of foam sample
on slide, the slides were warmed at 40 degrees Celsius for approximately five minutes.
The slides were then flooded with crystal violet solution (2 g crystal violet dissolved in
20 mL ethanol, mixed with 0.8 g ammonium oxalate dissolved in 80 mL distilled water)
and rinsed with distilled water. Slides were then flooded with Lugol’s Iodine (2 g
potassium iodide and 1 g iodine crystals dissolved in 100 mL distilled water), and rinsed
again with distilled water. A three-second rinse with acetone was then performed to
48
Reproduced with permission of the copyright owner. Further reproduction prohibited without permission.

49
decolourize the slides, and then they were counter-stained using a wash of saffranin red
(0.25 g saffranin O powder dissolved in 10 mL ethanol, mixed with 90 mL distilled
water). After staining, the slides were re-examined at 100 times magnification, then
examined again at 1000 times magnification using an oil mount objective lens.
3.2.2 Microbial Enumeration
To determine the concentration of E. coli culture forming units (cfu) in the foam, the
Colilert™ system was used. This system uses a substrate that contains a combination of
salts, nitrogen, and carbon sources designed specifically as a substrate for coliform
bacteria. When metabolized by E. coli, a compound is released that fluoresces in the
presence of UV light. Samples were well mixed with 10 mL distilled water, and placed
in reactor tubes, which were pre-filled with fluorescent reagent. The tubes were mixed
vigorously, and incubated at 35 degrees Celsius for 24 hours. After incubation, the tubes
were observed under natural and UV light. By counting the number of fluorescent tubes
under UV light, and comparing with a table of values, a 95 percent confidence level
range was identified for the concentration of E. coli.
3.2.3 Process Adjustment
To prevent filamentous bacteria from existing in sufficient numbers to cause foaming
problems, numerous areas requiring adjustment were identified: 1.) The SRT maintained
in the activated sludge system. 2.) The F/M ratio range that was typical at the plant. 3.)
The possibility of foam trapping occurring between the aeration cells and clarifiers.
49
Reproduced with permission of the copyright owner. Further reproduction prohibited without permission.

50
Areas 1.) and 3.) were specifically identified for further investigation. To control the
SRT, the plant will automate the sludge wasting and return processes. In other words, the
sludge wasting and return valves at the plant will be operated automatically by computer-
based process control logic. This will ensure that the plant operates at a consistent SRT
that may be adjusted in order to make it more difficult for filamentous bacteria to survive.
Two out of four clarifiers will be taken out of service, which will lower the SRT by
causing the total plant flow to progress through the plant more quickly. To understand
how foaming may be affected by the physical character of the activated sludge passage
from the aeration system to the clarification system, a baffle wall will be installed on one
of two clarifiers to show how foam trapping may play a role in the sludge separation
problem. To prevent foam from becoming more concentrated in trapping areas, a surface
spray system was tested. This system was made using four segments of garden hose that
had showerheads at their ends to allow a diffuse spray to contact the foam surface. The
hose segments were attached to a plastic cylinder that could be opened to insert a chlorine
puck. This allowed testing to determine the relative difference between a pure water
spray and a chlorinated water spray. The results from the trial of the spray system are
presented in Appendix 3.
50
Reproduced with permission of the copyright owner. Further reproduction prohibited without permission.

51
4 Results
4.1 Polymer Testing
4.1.1 Pre Screening (Phase 1)
As discussed in Section 2.1.2, the purpose of sludge conditioning is to coagulate sludge
particles by neutralizing the charge, and/or enhance floe formation by entangling sludge
particles (Dentel, 2001). In this study, the oxidation-reduction potential (ORP) of the
aqueous polymer solutions is measured in order to characterize the electrochemistry of
the polymer solutions. Using an ORP test allows measurement of the ability of a solution
to act as an electron donor or acceptor, and so an estimation of the ability of a polymer to
neutralize charged sludge particles may be made. Electron acceptors, such as cationic
polymers, should have positive ORP values, while electron donors, such as negatively
charged sludge particles in WAS, should have negative ORP values (Atkins and Jones,
2005). The results from the ORP testing are shown in Figure 4.1. The data shows the
mean values of three trials (n = 3), plus or minus one standard deviation. The data
showed that all polymer solutions had mean oxidation-reduction potentials between 190
and 280 millivolts. It is clear that there is significant variability in the data among
different polymer types, but nonetheless, it seems that some polymer solutions may be
characterized by larger oxidation-reduction potentials (e.g. CIBA 8160), while others
have relatively lower oxidation-reduction potentials (e.g. SNF 4190). In theory, the
polymers which have high ORP values in solution are those that have a high molecular
weight and/or charge density, and so produce a solution with greater transferability of
charge (Atkins and Jones, 2005; Dentel, 2001). Conversely, the polymers with low ORP
51
Reproduced with permission of the copyright owner. Further reproduction prohibited without permission.

52
values in solution should theoretically have lower molecular weight and/or charge. For
example, polymers CEBA 8160 and EC 4925 produced solutions with the highest
observable ORP values. These polymers are high molecular weight, high charge density,
and are specialized for conditioning of biological sludge. Polymer EC 4925 is commonly
used to condition activated sludge from slaughterhouses, which is typically difficult to
dewater relative to domestic wastewater sludge (A1 Mutairi et al., 2004). Lower ORP
polymers, such as SNF 4290 are mainly lower charge density polymers commonly used
in domestic wastewater applications. See Appendix 4 for a summary of the charge
density and molecular weight characteristics of the polymers. The eight polymer types
selected for screen testing, (listed with asterisks in Figure 4.1), have a range of ORP
values, and were selected to give an approximate cross-section of the larger group. The
group of selected polymers also contain at least one representative from each of the
polymer supply companies that furnished samples for this study. The charge density of
the eight polymers range from low to high, while the molecular weights range from
medium to very high.
52
Reproduced with permission of the copyright owner. Further reproduction prohibited without permission.

53
_ 290
E 280n 270c&0 260
1 250? 240
(E 230Ic9 220*-<(0■o‘5O
210
200
#w #w ̂ ^Polymer Solutions (0.1% concentration, n=3)
Figure 4.1 - Polymer Solution Oxidation-Reduction Potential ± 1 Standard Deviation
4.1.2 Polymer Testing - Screen Test (Phase 2)
After pre-screening, eight polymers were used for the second phase of testing. This
section shows the results of testing of solid samples (i.e. thickened sludge), and liquid
samples (i.e. filtrate from the thickening process). Solid samples were tested for percent
total solids, percent volatile solids, TKN concentration, total phosphorous concentration,
and total BOD concentration. Liquid samples were tested for percent total solids,
ammonia concentration, TKN concentration, and total phosphorous concentration.
Figures 4.2 to 4.9 summarize the results. Each chart shows polymers listed by company
name and model number, and includes a control sample (which was sludge that was
53
Reproduced with permission of the copyright owner. Further reproduction prohibited without permission.

54
thickened without adding polymer to condition the sludge) and a sample from the full-
scale GBT apparatus (labelled GBT). Polymer CB 4450 is shown on the left-hand side of
all graphs, and is the incumbent polymer that was being used full-scale at the time of
testing. All graphs show the average of two samples (n = 2), and show the results of
polymers being applied at a dosage of 4.5 g polymer per kilogram sludge solids. The
data, including maximum and minimum values for each data series are presented in
Appendix 7, section A7.1. Further information on the preparation of data can be found in
Appendix 5.
CB CIBA SNF SNF CIBA EC JC49 JC473 Control GBT4450 7557 4140 4290 8160 4925
Polymer (4.5 g polymer/kg sludge solids, n=2)
Figure 4.2 - Thickened Sludge Percent Total Solids
Figure 4.2 shows the percent total solids measured of each thickened sludge sample at
bench scale. This test measures the mass of thickened sludge samples before and after
drying, and thus reveals the amount of dry solids in the thickened sludge. The goal of
thickening in this application is to produce thickened sludge that is between
54
Reproduced with permission of the copyright owner. Further reproduction prohibited without permission.

55
approximately 4 and 6 percent total solids. The data shows that most polymers provide
thickened sludge of higher total solids content than the control sample, which contained
no polymer. The notable exceptions are the JC 49 and JC 473 polymers, which do not
improve thickening relative to the control sample, and produced thickened sludge well
below the required 4 to 6 percent total solids range. This may be because the JC
polymers were not applied at a high enough dosage to condition sludge properly for
thickening. The CIBA polymers produced thickened sludge with relatively high levels of
total solids, approximately 5 percent, but the results observed also contain relatively high
variability. SNF 4290, CB 4450, and EC 4925 all produced thickened sludge with over 4
percent total solids content, and were less variable in performance than others were. At
bench-scale, five of the eight polymers produced thickened sludge within the target range
of 4 to 6 percent total solids, one polymer produced sludge slightly below this range,
(approximately 3.5 percent total solids), and two polymers produced thickened sludge
significantly below this range, (approximately 1 percent total solids). So there do seem to
be some distinct advantages in solids capture provided by some polymers. This means
that some polymers provide a combination of charge neutralization and interparticle
bridging that allow for proper thickening to occur. Other polymers may be better suited
to different WWTP sites and/or different types of thickening apparatus. Also, it is
notable that one of the most effective polymers in this test, EC 4925, and one of the least
effective polymers in this test, JC 49, were both among the very highest in ORP values in
phase one testing. Thus, the ORP test as performed appears not to be useful for gauging
the solids capture performance of polymers in this context. It is also notable that the full-
scale GBT performs better than the bench-scale GBT using the incumbent polymer (CB
55
Reproduced with permission of the copyright owner. Further reproduction prohibited without permission.

56
4450). The bench-scale apparatus delivers thickened sludge of approximately 4.5 percent
total solids, while the full-scale GBT delivers thickened sludge of approximately 6
percent total solids, a 33 percent difference. This suggests that the bench-scale testing is
likely to underestimate the performance of a given polymer. There are various reasons
why this may be. One is that on the full-scale GBT, thickened sludge collects at the
outlet end, increasing the retention time that sludge achieves on the belt. The thickened
sludge also piles up, which may cause pressure at the belt surface, increasing the
compressive force that the sludge undergoes. Because of this, during full-scale trials,
sludge is sampled from the belt immediately before the outlet where the sludge piles up.
40
35CO2o
(A® 30s«o>£ 25a>oL_4>a.
20
15CB CIBA SNF SNF CIBA EC JC49 JC473 Control GBT
4450 7557 4140 4290 8160 4925
Polymer (4.5 g polymer/kg sludge solids, n=2)
Figure 4.3 - Thickened Sludge Percent Volatile Solids
Figure 4.3 shows the volatile solids concentration of thickened sludge. This test reveals
the percentage of mass of dried sludge that is volatized at 550 degrees Celsius. This
56
Reproduced with permission of the copyright owner. Further reproduction prohibited without permission.
57
value approximates the amount of organic matter in the dried sludge. Because the
thickened sludge will be introduced to further biological treatment, (i.e. digestion), and
organic matter within the sludge may be used as substrate for the microorganisms in this
process, the TVS measurement allows us to characterize how much substrate may be
available for the digestion process (Droste, 1997). The results show that all thickened
sludge samples were measured to be within one standard deviation of approximately 30
percent volatile solids. The full-scale GBT produced thickened sludge with a very high
variability, and so perhaps the thickened sludge is naturally variable in volatile solids
content, or perhaps the method used to measure volatile solids is imprecise. In these
experiments, the amount of thickened sludge that could be collected in the bench-scale
apparatus was tested for 8 different parameters, and so only a small amount (less than 0.1
kg) was used for TS and TVS testing. Perhaps with larger sample sizes, less variable
results may have been achieved. However, due to the variability observed, the percent
volatile solids of thickened sludge was not used as a selection parameter for subsequent
testing.
57
Reproduced with permission of the copyright owner. Further reproduction prohibited without permission.

58
1200
Polymer (4.5 g polymer/kg sludge solids, n=2)
Figure 4.4 - Total Phosphorous Content of Thickened Sludge
The total phosphorous concentration in thickened sludge is shown in Figure 4.4. Polymer
SNF 4290 produced thickened sludge with a total phosphorous concentration of
approximately 1100 mg total phosphorous per kg of thickened sludge, and polymer EC
4925 produce thickened sludge with approximately 900 mg/kg total phosphorous. With
the exception of JC 49 and JC 473, the other polymers delivered thickened sludge with a
total phosphorous concentration between 500 and 700 mg/kg. The full-scale GBT value
shown above represents only one sample tested. The GBT sample was measured to be
highest in total phosphorous content at 1125 mg/kg. This data suggests that some
polymers do offer an advantage in nutrient selection. Polymer SNF 4290 produced
thickened sludge at bench-scale with approximately twice as much total phosphorous as
the incumbent polymer, CB 4450, while polymers JC 49 and JC 473 produced thickened
sludge with about half of the concentration of total phosphorous relative to the incumbent
58
Reproduced with permission of the copyright owner. Further reproduction prohibited without permission.

59
polymer. The differences observed in total phosphorous in thickened sludge between the
bench-scale and full-scale applications may be due in part to the higher percent total
solids found in the full-scale thickened sludge (approximately 33 percent higher total
solids in the GBT samples), since the sludge solids are the source of nutrient chemicals
such as total phosphorous in WAS. So we should expect that the total phosphorous
concentration of the thickened sludge should be higher when the solids content is higher.
This dependence on solids content is discussed further in Section 4.2.1.
4000
3500
3000
P> 2500
E, 2000zH 1500
1000
500
0
oN'Polymer (4.5 g polymer/kg sludge solids, n=2)
Figure 4.5 -Total Kjeldahl Nitrogen Content of Thickened Sludge
The TKN content of the samples is shown in Figure 4.5. The TKN content is an
important parameter in this study, because this form of nitrogen appeared to be much
more significant than ammonia nitrogen in the characterization of solid samples. Most
samples had ammonia nitrogen contents that were very similar in magnitude, and very
59
Reproduced with permission of the copyright owner. Further reproduction prohibited without permission.

60
close to the lower detection limit of the lab tests, which is 30 mg ammonia nitrogen per
kilogram solids. For all solid samples tested the TKN concentration was over 500 mg/kg,
and so the concentration of TKN greatly outweighs the concentration of ammonia
nitrogen in this case. Since organic nitrogen is equal to the TKN value minus the
ammonia nitrogen value, TKN is a good estimator of organic nitrogen in this context.
The TKN concentration results are similar to the total phosphorous results observed in
Figure 1.5. The full-scale GBT value shown above represents only one sample tested.
Polymers SNF 4290 and EC 4925 produce thickened sludge with relatively high levels of
TKN compared to other polymer types, and exhibit less variability. Thus, this data also
suggests an advantage in nutrient selection. Polymers SNF 4290, CIBA 8160, and EC
4925 concentrate approximately twice as much TKN in thickened sludge relative to CB
4450. We may note, again, that the comparison of relative polymer performance with
respect to nutrient concentrations is somewhat similar to a comparison of total solids
concentrations. In other words, thickened sludge with higher nutrient concentrations
seems to be due in part to a higher total solids concentration. A comparison of total
solids concentration and nutrient concentration does yield some interesting information,
however. With respect to total phosphorous concentration, polymers SNF 4290 and EC
4925 produce thickened sludge with higher total phosphorous concentration compared to
other polymers which perform about as well with respect to total solids, (such as CB
4450 and CIBA 7557). With respect to TKN, SNF 4290, EC 4925, and CIBA 8160 all
out-perform polymers with similar solids capture. Since SNF 4290 and EC 4925 offered
advantages in both phosphorous and ammonia concentration, they were selected as the
strongest candidates for full-scale trials.
60
Reproduced with permission of the copyright owner. Further reproduction prohibited without permission.

61
25000
20000
g 15000
10000
Polymer (4.5 g polymer/kg sludge solids, n=2)
Figure 4.6 - Total BOD of Thickened Sludge
The total BOD of the thickened solid samples is shown in Figure 4.6. This test shows the
amount of oxygen that is consumed by biological and chemical processes over a five-day
period. This parameter measures the potency of wastewater, in terms of its ability to
affect an aquatic environment. High BOD wastewater is thus potent in its ability to
remove oxygen from an aquatic environment, which can greatly degrade habitat for
aerobic aquatic organisms such as fish (Metcalf and Eddy, 2003; Droste 1997).
Therefore, producing thickened sludge with high BOD is desirable compared to allowing
it to persist in the liquid stream of the plant. Since removing BOD from wastewater is
one of the primary goals of wastewater treatment in general, (Metcalf and Eddy, 2003;
Droste, 1997), selecting polymers that concentrate the components that contribute to the
BOD in waste sludge more efficiently can improve the overall effectiveness of the
treatment process. This test revealed that polymers SNF 4290 and CIBA 7557 produce
61
Reproduced with permission of the copyright owner. Further reproduction prohibited without permission.
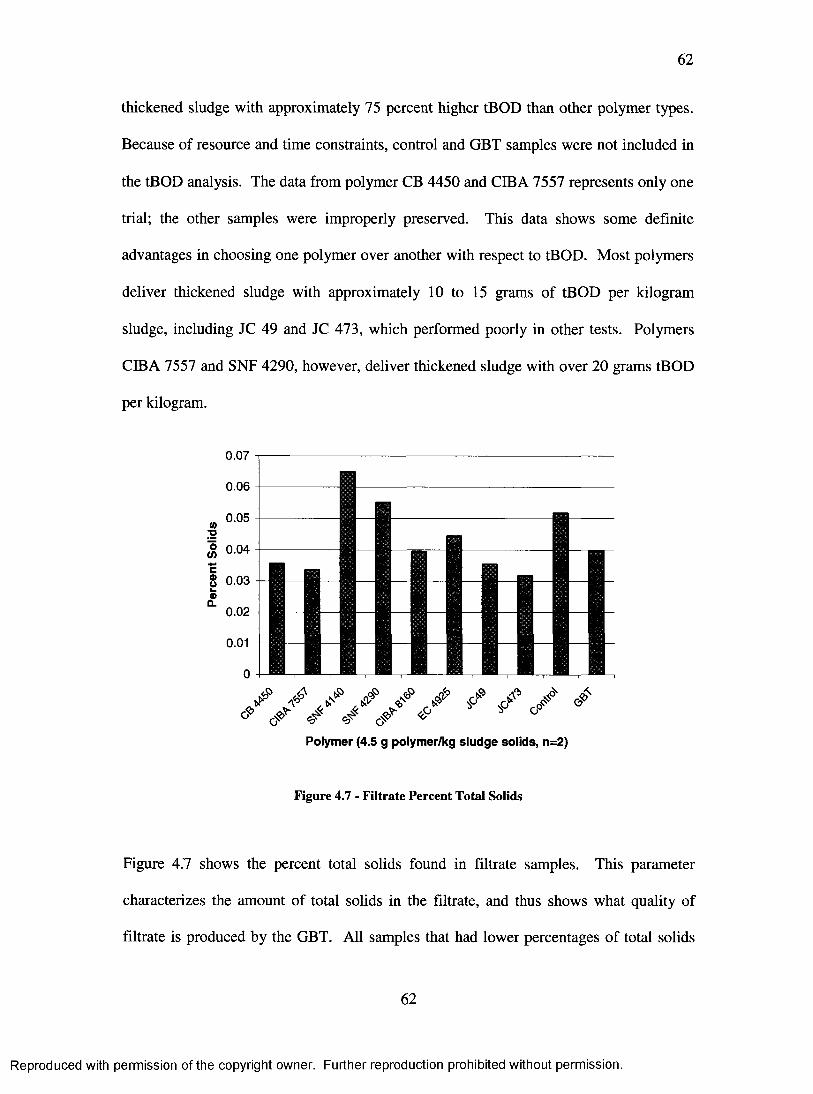
62
thickened sludge with approximately 75 percent higher tBOD than other polymer types.
Because of resource and time constraints, control and GBT samples were not included in
the tBOD analysis. The data from polymer CB 4450 and CIBA 7557 represents only one
trial; the other samples were improperly preserved. This data shows some definite
advantages in choosing one polymer over another with respect to tBOD. Most polymers
deliver thickened sludge with approximately 10 to 15 grams of tBOD per kilogram
sludge, including JC 49 and JC 473, which performed poorly in other tests. Polymers
CIBA 7557 and SNF 4290, however, deliver thickened sludge with over 20 grams tBOD
per kilogram.
Polymer (4.5 g polymer/kg sludge solids, n=2)
Figure 4.7 - Filtrate Percent Total Solids
Figure 4.7 shows the percent total solids found in filtrate samples. This parameter
characterizes the amount of total solids in the filtrate, and thus shows what quality of
filtrate is produced by the GBT. All samples that had lower percentages of total solids
62
Reproduced with permission of the copyright owner. Further reproduction prohibited without permission.

63
than the control sample had standard deviations of at least 25 percent of mean values.
Since it should be expected that most polymers would produce filtrate with significantly
lower total solids content than the control, it is possible that this data has a high
experimental error associated with it. Since the filtrate percent solid values are around
0.05 percent, we are measuring very small amounts of total solids in these samples. To
achieve better results, a larger amount of filtrate may have been beneficial, but the
crucibles used to dry the samples had a capacity of approximately 0.1 L. Essentially, the
equipment used to measure total solids is designed for solid samples with high total solids
(such as thickened sludge samples), as opposed to samples which characteristically are
mostly liquid (such as filtrate samples). Therefore, to accurately measure filtrate total
solids, higher capacity crucibles that can be used to dry larger samples would be useful.
Because of the high variability observed, this parameter was not considered when
selecting polymers for subsequent testing.
63
Reproduced with permission of the copyright owner. Further reproduction prohibited without permission.

64
■B> 0 .8
S> 0.6
0.4
0.2N/A
0.0A
•y ou
Polymer (4.5 g polymer/kg sludge solids, n=2)
Figure 4.8 - Concentration of Ammonia in Filtrate
Figures 4.8, 4.9, and 4.10 show the concentration of ammonia, TKN and total
phosphorous in filtrate, respectively. Characterizing the concentration of nutrient
chemicals in the fdtrate is important because filtrate is recycled back through the plant to
be retreated. Thus, polymers that produce filtrate with relatively lower concentrations of
nutrient chemicals will be desirable. Figure 4.8 shows the concentration of ammonia in
the filtrate. The variability observed may be due in part to the variability observed in the
solids concentration of the filtrate. The solids tested for ammonia nitrogen all had
concentrations near or below the lower limit of the testing equipment of 30 mg/kg
thickened solids. This is highly concentrated in ammonia compared to the filtrate, as no
average concentration of filtrate for any polymer exceeded 1.0 mg ammonia/liter filtrate.
Therefore, it seems that even small changes in total solids percentage of filtrate may
result in large differences in the concentration of ammonia measured in the filtrate. A
64
Reproduced with permission of the copyright owner. Further reproduction prohibited without permission.

65
study focused specifically on the removal of nutrient chemicals from the filtrate of
thickening processes may benefit from tighter control of conditions to isolate the effects
of polymers on nutrient concentrations in liquid streams. The variability in the data,
particularly the relatively high variability associated with the control sample, makes it
difficult to choose polymer types based on the filtrate ammonia data.
"i3>E
10
9
87
65
4
3
2N/A1
0A&
Polymer (4.5 g polymer/kg sludge solids, n=2)
Figure 4.9 - Concentration of TKN in Filtrate
The data in figure 4.9 shows that the SNF polymers lower the TKN concentration in the
filtrate to approximately 3 mg/L versus the control sample, which averages about 8 mg/L
TKN. CIBA 8160 and EC 4925 produce filtrate below 4 mg/L TKN, while CB 4450 and
CIBA 7557 produce filtrate between 5 and 6 mg/L TKN, within one standard deviation of
the control sample.
65
Reproduced with permission of the copyright owner. Further reproduction prohibited without permission.

66
3 .5
3
d 2.5
2
1.5
1
0.5N/A
0/{i> j&- />S
t ? c / && ^ sO J *
Polymer (4.5 g polymer/kg sludge solids, n=2)
Figure 4.10 - Total Phosphorous Concentration of Filtrate
The concentration of total phosphorous in filtrate is shown in Figure 4.10. This is a
particularly important parameter, because chemical coagulants are used to remove
phosphorous from wastewater at Crystal Beach WWTP. Thus, using a polymer that
reduces the amount of total phosphorous in the recycled filtrate may improve plant
effluent and save money. The data suggests that, with the exception of polymer JC49, all
polymers reduce the amount of total phosphorous in the filtrate compared to control
samples, which averaged about 2.5 mg total phosphorous per liter filtrate. Polymers CB
4450, CIBA 8160 and EC 4925 lower the total phosphorous concentration in filtrate to
between 1 and 1.5 mg total phosphorous per liter (about half the concentration of the
control sample). Polymer CIBA 7557 produced filtrate with a toted phosphorous
concentration of approximately 1.0 mg/L. With respect to total phosphorous removal, the
SNF polymers appear to do the best job, producing filtrate with approximately 0.5 mg
66
Reproduced with permission of the copyright owner. Further reproduction prohibited without permission.

67
total phosphorous per liter, reducing total phosphorous by about 80 percent relative to the
control sample.
4.1.3 Bench Scale Testing - Nutrient Values Adjusted
In this section, the concentration of total phosphorous and TKN in solid phase is
examined in concert with the percent total solids data, by using the total solids percentage
to normalize the nutrient data. In other words, the nutrient concentrations observed in
this section are not expressed in mg per kg thickened sludge, they are listed in mg per kg
dry solids. The nutrient concentration data are divided by the total solids percentage in
this analysis, (see Appendix 2 for sample calculation). This analysis ties the nutrient
concentration of the sludge to the total solids content, thereby correcting for differences
in the liquid content of the sludge. In section 4.1.2, the nutrient concentration of
thickened sludge is measured by sampling the thickened sludge as it is thickened by the
gravity filter. This means that the sludge samples may have very different percentages of
solid material. For example, sludge thickened using polymer CIBA 8160 averaged over
5 percent total solids, while sludge thickened using polymer JC 49 averaged under one
percent total solids. Since the sludge solids are a potent source of nutrient chemicals,
sludge with a higher solids percentage also has a higher concentration of nutrient
chemicals. By dividing the nutrient chemical concentrations by the percent total solids, it
is possible to characterize the chemistry of the sludge without allowing differences in
solids content affect the results. In Figure 4.11, the total phosphorus concentration of the
thickened sludge is examined, while in Figure 4.12, the TKN concentration of the sludge
is displayed
67
Reproduced with permission of the copyright owner. Further reproduction prohibited without permission.

68
25000
* 20000
I , 15000 E,<0i 10000
CB CIBA SNF SNF CIBA EC JC 49 JC 473 Control GBT 4450 7557 4140 4290 8160 4925
Polymer (4.5 mg dry polymer/kg sludge solids, n=2)
Figure 4.11 - Total Phosphorous Concentration of Thickened Sludge Normalized Using Total Solids
80000
60000
40000
Z 20000
Polymer (4.5 mg dry polymer/kg sludge solids, n=2)
Figure 4.12 - TKN Concentration of Thickened Sludge Normalized Using Total Solids
This analysis shows that there may indeed be chemical differences in the sludge produced
by the different polymers. For example, with the exception of polymer SNF 4290, all
68
Reproduced with permission of the copyright owner. Further reproduction prohibited without permission.

69
polymers produce sludge with lower concentrations of total phosphorous and TKN per
unit weight of dried solids than the control sample, which was not dosed with polymer.
In fact, the incumbent polymer produced sludge with the lowest levels of total
phosphorous and TKN per kilogram dried solids on average. This suggests that the
polymers may dilute the nutrient concentration of the sludge to varying degrees. Perhaps
polymers cause chemical reactions that alter nutrient chemicals, making them unavailable
for other chemical reactions. Polymers may cause damage to organisms in the sludge,
causing cell lysis and/or breakdown of organics. In the future, a more in depth look at the
interactions between polymers and nutrient chemicals in sludge during thickening may
shed some light on the effects of polymer conditioning on the availability of nutrients in
thickened sludge. A similar analysis was not performed using the filtrate data, due to the
high variability in the solids content of filtrate samples (see Figure 4.7).
4.1.4 Summary of Bench-Scale Polymer Screening
The data from bench-scale polymer testing are presented in Table 4.1 (thickened sludge
data) and Table 4.2 (filtrate data), along with the rank of each polymer in each test. In
the case of the thickened, a rank of 1 indicates the polymer that was most effective at
producing sludge with the highest total solids percentage or highest nutrient
concentration. In the case of the filtrate, the opposite is true; a rank of 1 indicates the
polymer that was most effective at producing filtrate with the lowest solids percentage
and nutrient concentration. For subsequent testing, polymers SNF 4290 and EC 4925
were chosen. Polymer SNF 4290 had the lowest average rank for both thickened sludge
and filtrate testing, (average rank of 3). Polymers CIBA 7557, CIBA 8160, and EC 4925
69
Reproduced with permission of the copyright owner. Further reproduction prohibited without permission.

70
had the next average rank, (average rank of 4.25). Polymer EC 4925 seemed to be most
consistent of these three, exhibiting lower variability, and producing thickened sludge
with relatively high levels of total solids, TKN and total phosphorous. Both polymers
selected for subsequent testing were relatively effective at producing thickened sludge
with consistent solids content, and were most effective at producing thickened sludge
with high nutrient content relative to other polymer types. From a practical perspective,
the nutrient content of the sludge was a secondary objective compared to the solids
percentage, because the thickened sludge must have solid content within the design
specifications of the full-scale thickening apparatus, between 4 and 6 percent total solids.
Overall, the filtrate data appeared to be less important for selection. The filtrate samples
had highly variable values for nutrient concentrations, probably because it was difficult to
produce filtrate with consistent total solids content. An alternative and automatic way of
analysing the bench-scale data was also explored. To rank polymer performance, the
data for a given parameter was averaged across all the polymers, and the datasets could
then be converted to z-scores. This allowed for different parameters to be weighted when
calculating the average rank of a given polymer. To see the analysis, see Appendix 6.
Table 4.1 - Summary of Data from Bench-Scale Polymer Testing - Solid PhasePolymer Total Total TKN tBOD Average
Solids Phosphorous Rank
% Rank mg/kg Rank mg/kg Rank mg/kg Rank
CB 4450 4.5 5 519 6 1480 6 13380 4 5.25CIBA 7557 4.9 3 651 4 1830 4 22030 2 3.25SNF 4140 3.4 6 550 5 1685 5 13960 3 4.75SNF 4290 4.6 4 1085 1 3370 1 22950 1 1.75CIBA 8160 5.2 1 687 3 3220 3 11540 5 3.00EC 4925 5.1 2 913 2 3320 2 11390 6 3.00JC 49 0.8 9 166 9 513 9 10130 7 8.50JC 473 2.1 7 265 7 844 7 9500 8 7.25Control 1.3 8 250 8 744 8 N/A N/A 8.00
70
Reproduced with permission of the copyright owner. Further reproduction prohibited without permission.

71
Table 4.2 - Summary of Data from Bench-Scale Polymer Testing - Liquid PhasePolymer Total Solids Ammonia TKN Total Average
Nitrogen Phosphorous Rank
% Rank mg/L Rank mg/L Rank mg/L Rank
CB 4450 .036 4 .96 9 5.6 7 1.18 5 6.25CIBA 7557 .033 2 .68 8 5.2 6 1.01 4 5.00SNF 4140 .065 9 .34 4 2.7 1 0.53 2 4.00SNF 4290 .055 8 .40 6 2.9 2 0.52 1 4.25CIBA 8160 .039 5 .61 7 3.5 3 1.31 6 5.25EC 4925 .044 6 .38 5 3.5 3 1.45 7 5.25JC 49 .035 3 .16 2 9.1 9 2.89 9 5.75JC 473 .032 1 .15 1 3.9 5 0.95 3 2.50Control .052 7 .29 3 7.9 8 2.59 8 6.50
4.1.5 Polymer Testing - Screen Test (Phase 3)
The purpose of the Phase 3 testing plan was to determine appropriate dosages for the
polymers for subsequent full-scale testing. In Figure 4.13, the curve shows the percent
solids of thickened sludge after conditioning with three different polymer types. Polymer
CB 4450, represented by the diamond-shaped data points, is the incumbent polymer at
Crystal Beach WWTP. Each polymer type is tested at five different dosages. The data
shows that over the dosage range used, the polymers are always within one percentage
point of one another. It is also apparent that increasing the dosage past a certain point
only causes a marginal increase in solids percentage, and that increasing further may
actually cause thickened sludge with lower total solids. It is expected that an overdose of
polymer may increase the moisture content of thickened sludge, as excess polymer may
produce large, loosely bound floes with water incorporated into the floe structure
(Vaxelaire and Olivier, 2006; Mikkelsen and Keiding, 2001). Therefore, it seems that to
achieve a thickened sludge total solids percentage of about five percent requires a dosage
71
Reproduced with permission of the copyright owner. Further reproduction prohibited without permission.

72
of about 3.75 g dry polymer per kilogram sludge solids. Increasing the dose will be only
marginally effective, and may actually lower the solids content of the sludge.
7.0
6.0
w 5.0 25 4.0
3.0o>a- 2.0
0.00.00 3.75 4.38 5.00 5.63
Polymer Dose (g Dry Polymer/kg Sludge Solids) n=3
— CB 4450 SNF 4290 —A— EC 4925
Figure 4.13 - Thickened Sludge Percent Solids ± 1 Standard Deviation Dosage Curve
Figure 4.14 shows the liquid phase solids percentage on the left vertical axis, and tBOD
concentration on the right vertical axis. This shows that the dose of polymer may affect
the filtrate solids concentration differently than it affects the oxygen demand of the
filtrate. Achieving a total solids percentage of approximately 0.05 percent is possible
with the lowest polymer dose, (3.75 g dry polymer per kg sludge solids), and higher
doses do not appear to result in significantly lower percent total solids. However,
maximum reductions in tBOD concentration occur only at a much higher dose, (5.00 g
dry polymer per kg sludge solids). This data suggests that achieving simultaneous
advantages in tBOD and solids removal from GBT filtrate may be impractical, since the
dose required to maximize solids removal is much lower than the dose required to
72
Reproduced with permission of the copyright owner. Further reproduction prohibited without permission.

73
maximize tBOD removal. In this case, it is helpful to consider tBOD to be akin to the
nutrient chemicals examined, such as phosphorous and nitrogen. While this is not
technically true, it is common to consider BOD a pseudo-nutrient, as it is an indicator of
the potency of wastewater, and is a measure of a type of load (i.e. a demand for oxygen),
that can affect aquatic environments (Droste, 1997). The importance of this tBOD
analysis is that we are able to see the difference between how a polymer affects solids
capture versus the chemistry of the filtrate. Using polymer dosing to minimize the tBOD
of GBT filtrate requires 75 percent higher polymer dose than that required to minimize
filtrate percent solids.
(0■uo(0*-•c0)ok0>0.<D(0
I- 400
- 350
- 300
- 250
- 200
- 150
100
0.00 3.75 4.38 5.00 5.63
Polymer Dose (g Dry Polymer/kg Sludge Solids) n=3
-% Solids CB 4450 —♦— % Solids SNF 4290 -tBOD CB 4450 X tBOD SNF 4290
% Solids EC 4925 tBOD EC 4925
Figure 4.14 - Percent Solids ± 1 Standard Deviation and Total BOD of Filtrate
73
Reproduced with permission of the copyright owner. Further reproduction prohibited without permission.

74
In Figure 4.15, the filtrate is characterized by turbidity over a range of polymer doses.
The dosage range is slightly different than that used in figure 4.14. This was necessary
because at low polymer doses, the filtrate is too turbid for accurate measurement, and so
higher polymer doses were used for this test. The data suggests that SNF 4290 and EC
4925 may be more effective at lowering filtrate turbidity than polymer CB 4450 at doses
below 3.75 grams dry polymer per kilogram sludge solids. Therefore, the two trial
polymers were tested at full-scale at a minimum dose of 1.85 g dry polymer/kilogram
sludge solids, while the minimum dose that the incumbent CB 4450 polymer was tested
at was 2.75 g dry polymer/kg sludge solids. See figures 4.19 and 4.20 for a comparison
to full-scale filtrate suspended solids content and turbidity.
140
5 > 120 H5 , 100
80
60
40
20
02.25 3.00 3.75 4.50 5.25 6.00
Polymer Dose (g Dry Polymer/kg Sludge Solids) n=3
SNF 4290 - 9 r - CB 4450 - ± - EC 4925
Figure 4.15 - Filtrate Turbidity ± 1 Standard Deviation Dosage Curve
74
Reproduced with permission of the copyright owner. Further reproduction prohibited without permission.

75
4.1.6 Polymer Testing - Full Scale Trials (Phase 4)
In the following sections, the results of full-scale sampling and analysis are discussed.
During full-scale sampling, one of the three polymer types were tested for two weeks.
For each week, samples were collected in triplicate over a range of six dosages. The
following week, the same dosages were applied, in order to ensure that the data obtained
in the first week was reproducible on the second week. To test whether the data was
indeed similar on both weeks, a Student’s t-test of paired comparison was performed to
ensure that the data sets for each dose came from the same population of data. Although
the majority of data sets were within a 95 percent confidence interval, some were outside
the 95 percent interval. To see the results of the statistical analysis of the paired full-
scale data, see Appendix 5.
The dosage range was implemented by adjusting the polymer distribution system pump to
deliver a set amount of polymer solution to the WAS before reaching the GBT. Although
bench scale testing occurred at only one dose, it was possible to compare bench scale
testing with some of the full scale results. However, since the loading rates of the bench
apparatus in phase 2 testing was different from the full scale loading rate and timing on
the full scale apparatus, a direct comparison of bench scale versus full scale results was
not one of the major investigations pursued in this research. Bench scale testing was
designed to predict the relative performance of different polymers at full scale. See
Appendix 7 for a direct comparison of bench scale and full scale results. Thickened
sludge samples were taken from the GBT belt just prior to the outlet, while filtrate was
sampled from the filtrate collection pipes before entering the filtrate drain beneath the
75
Reproduced with permission of the copyright owner. Further reproduction prohibited without permission.

76
GBT. The data obtained from analysing the thickened sludge and filtrate samples is
presented graphically in Sections 4.17 and 4.18.
4.1.7 Data From Full-Scale Sampling
Figure 4.16 shows total solids percentage of thickened sludge samples. All three
polymers produce sludge between 4 and 5 percent total solids at a dosage of 3.65 g dry
polymer per kg sludge solids. At a lower dose of 2.75 g dry polymer per kg sludge
solids, the two trial polymers deliver sludge over 4 percent total solids, while the
incumbent delivers sludge under 2 percent total solids. This data suggests that achieving
sludge total solids percentage of over 4 percent can be done at a lower dose with either
trial polymer relative to the incumbent polymer. At doses above 3.65 g dry polymer per
kilogram sludge solids, increases in percent total solids were small, and all three
polymers produced thickened sludge between approximately 5 and 6 percent. This
suggests that with respect to solids capture, either trial polymer may produce a savings in
polymer demand of about 25 percent, as long as proper dose control is maintained, and
assuming that thickened sludge with a total solids percentage of 4 percent is acceptable.
There is some discrepancy between the bench-scale data observed in Figure 4.13 and the
full-scale data observed in Figure 4.16. The bench-scale dosage data suggested that
increasing polymer dose above 4.55 g dry polymer per kilogram digested sludge will
negatively impact sludge total solids. At bench-scale, a dose of 5.63 g dry polymer per
kilogram sludge solids produced thickened sludge below 4 percent solids, for all
76
Reproduced with permission of the copyright owner. Further reproduction prohibited without permission.

77
polymers tested. On the other hand, the full-scale data shows that dosages up to 7.25 g
dry polymer per kilogram sludge solids produced sludge between approximately 5 and 6
percent solids. This highlights an important difference between the bench-scale model
and the full-scale application. There seems to be a need for developing dedicated models
that can be used to mimic full-scale plant behaviour at bench or pilot scale. Perhaps
conditioning occurs more efficiently at higher polymer doses in the full-scale apparatus
than in the bench-scale simulation. In the future, studies dedicated to characterizing these
differences would be useful, and would allow for a more deliberate bench-scale
investigation of polymer performance.
0)2oc/>ra*-»o
ca)ov.4>Q.
7.0
6.0
5.07 r -a r
4.0
3.0
2.0
1.0
0.01.85 2.75 3.65 4.55 5.45 6.35 7.25
Polymer Dose (g dry polymer/kg sludge solids) n=6
• CB4450 -SNF4290 —A— EC4925
Figure 4.16 - Full-scale Percent Total Solids of Thickened Sludge ± 1 Standard Deviation
Figure 4.17 and Figure 4.18 examine the TKN and total phosphorous content of
thickened sludge. The data shows that at low doses, (1.85 to 2.75 g dry polymer per kg
77
Reproduced with permission of the copyright owner. Further reproduction prohibited without permission.

78
sludge solids), polymer SNF 4290 produces thickened sludge with a higher concentration
of nutrient chemicals, increasing both the TKN and total phosphorous concentration of
thickened sludge by approximately two and a half times. At a dosage of 3.65 g dry
polymer per kg sludge solids, the two polymers perform within one standard deviation of
one another. At dosages between 4.55 and 5.65 g dry polymer per kg sludge solids,
however, the incumbent polymer CB 4450 produces sludge with relatively higher TKN
and toted phosphorous concentration in thickened sludge, increasing both parameters by
approximately 50 percent relative to polymer SNF 4290.
o> 4500
!» 4000
id 35000)o>1 3000
<0 2500
g 2000■g 1500
■- 500
1.85 2.75 3.65 4.55 5.45 6.35 7.25
Polymer Dose (g dry polymer/kg sludge solids) n=6
— CB4450 — SNF4290 —A— EC 4925
Figure 4.17 - Full-scale Thickened Sludge TKN Concentration ± 1 Standard Deviation
78
Reproduced with permission of the copyright owner. Further reproduction prohibited without permission.
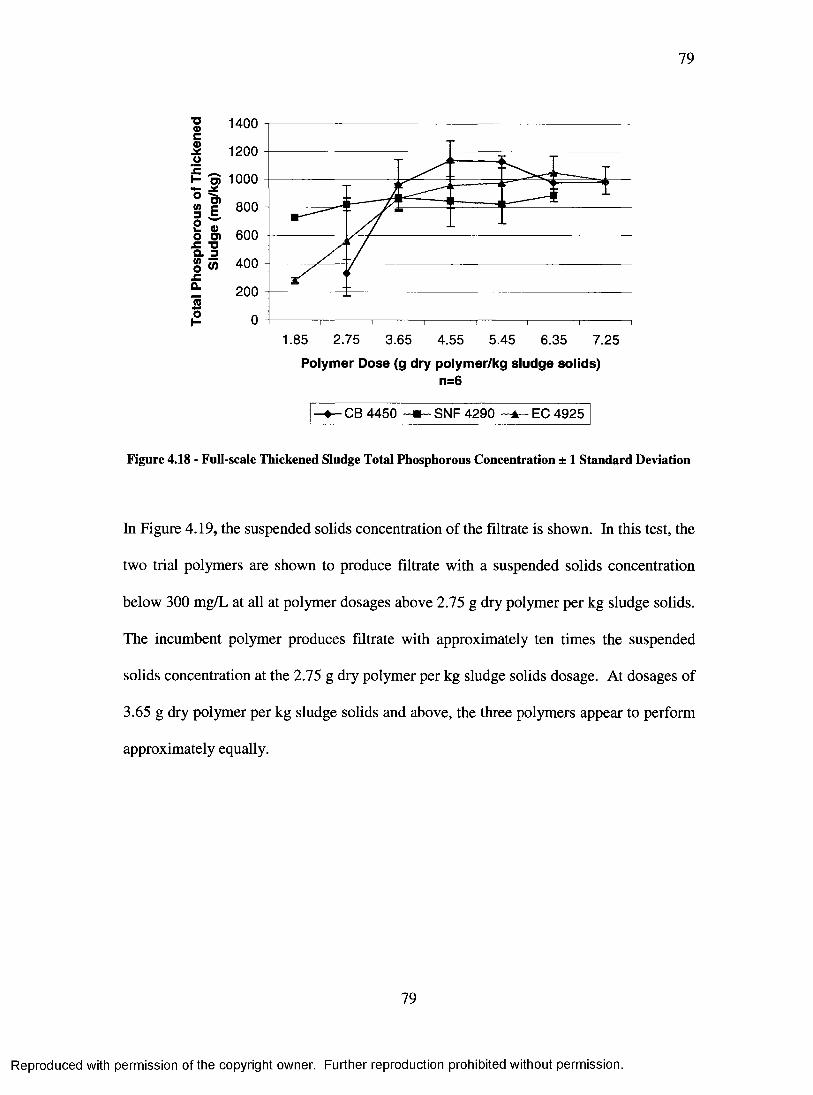
79
1400
1200
1000
1* 800
S) 600■oS 400
o>a
200
1.85 2.75 3.65 4.55 5.45 6.35 7.25
Polymer Dose (g dry polymer/kg sludge solids) n=6
CB 4450 -his- SNF 4290 EC 4925
Figure 4.18 - Full-scale Thickened Sludge Total Phosphorous Concentration ± 1 Standard Deviation
In Figure 4.19, the suspended solids concentration of the filtrate is shown. In this test, the
two trial polymers are shown to produce filtrate with a suspended solids concentration
below 300 mg/L at all at polymer dosages above 2.75 g dry polymer per kg sludge solids.
The incumbent polymer produces filtrate with approximately ten times the suspended
solids concentration at the 2.75 g dry polymer per kg sludge solids dosage. At dosages of
3.65 g dry polymer per kg sludge solids and above, the three polymers appear to perform
approximately equally.
79
Reproduced with permission of the copyright owner. Further reproduction prohibited without permission.

80
4000_i"9>E 3500
■g 3000
S) 2500
| 2000
| 1500
W 1000a>2 500
i l 01 2 3 4 5 6 7 8
Polymer Dose (g Dry Polymer/kg Sludge Solids) n=6
— CB4450 — SNF4290 -^ -E C 4 9 2 5
Figure 4.19 - Full-scale Suspended Solids Concentration in Filtrate ± 1 Standard Deviation
In Figure 4.20, the data shows that trial polymers produce filtrate with turbidity below
200 NTU at all dosages from 2.75 g dry polymer per kg sludge solids. At a dose of 2.75
g dry polymer per kilogram sludge solids, the trial polymers produce filtrate with 80
percent lower turbidity than the incumbent. The incumbent polymer must be applied at a
dosage of at least 3.65 g dry polymer per kg sludge solids to achieve filtrate turbidity
below 200 NTU.
80
Reproduced with permission of the copyright owner. Further reproduction prohibited without permission.

81
1200
1000DI-Z 800>>22i_3Ha>13wil
600
400
200
1 3 62 4 7 85
Polymer Dose (g dry polymer/kg sludge solids) n=5
— CB4450 — SNF4290 A EC4925
Figure 4.20 - Full-scale Filtrate Turbidity ± 1 Standard Deviation
The total phosphorous concentration observed in filtrate is shown in Figure 4.21. This
data is less conclusive than the data pertaining to the solid phase analysis in Figures 4.16,
4.17 and 4.18. Due to the variability observed, it seems that dosages of 3.65 g dry
polymer per kg sludge solids or more are needed to ensure total phosphorous
concentration in filtrate of 5 mg/L. At the dose of 2.75 g dry polymer per kilogram
sludge solids, the incumbent polymer produces filtrate with mean total phosphorous
concentration 75 percent higher than polymer SNF 4290, and 300 percent higher than EC
4925, although the data from CB 4450 and SNF 4290 are within one standard deviation
of one another. At higher doses, however, all polymers perform similarly. Thus, at full-
scale, it seems unlikely that an overall reduction in total phosphorous in filtrate is
possible with any of the polymers tested, even though an overall polymer savings may be
observed when either trial polymer is used. This data shows that switching polymers to
81
Reproduced with permission of the copyright owner. Further reproduction prohibited without permission.
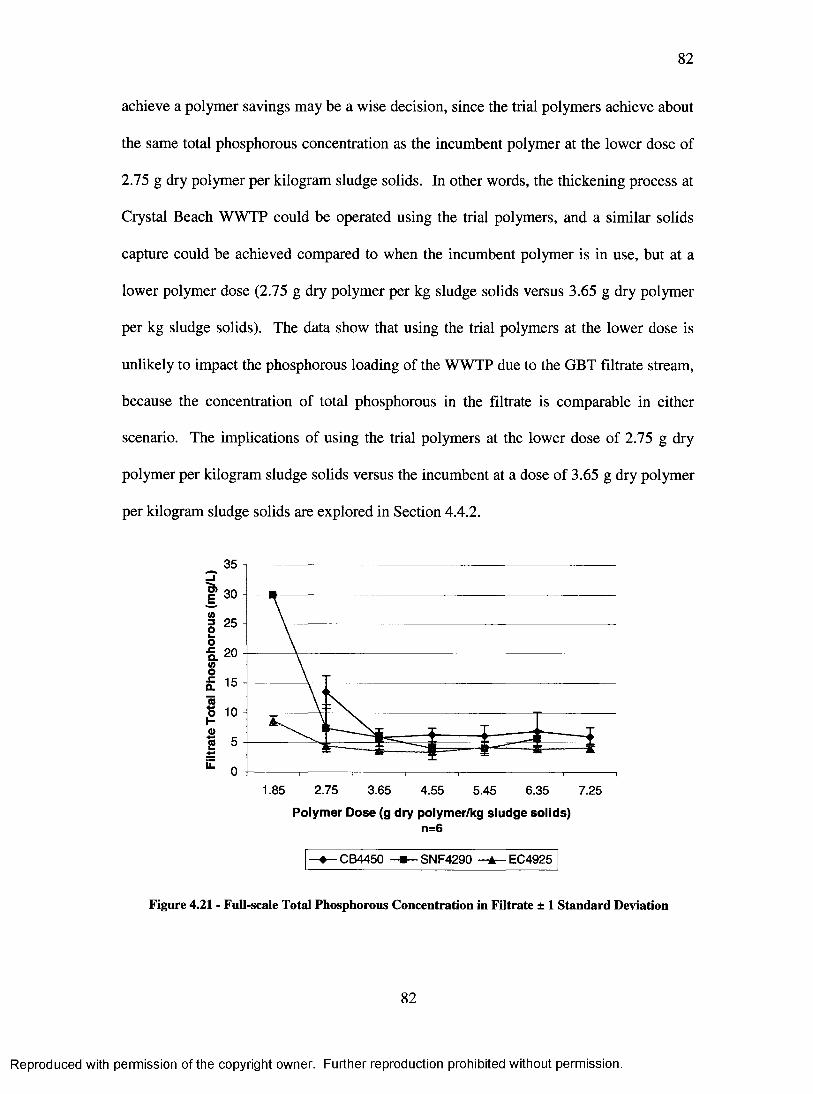
82
achieve a polymer savings may be a wise decision, since the trial polymers achieve about
the same total phosphorous concentration as the incumbent polymer at the lower dose of
2.75 g dry polymer per kilogram sludge solids. In other words, the thickening process at
Crystal Beach WWTP could be operated using the trial polymers, and a similar solids
capture could be achieved compared to when the incumbent polymer is in use, but at a
lower polymer dose (2.75 g dry polymer per kg sludge solids versus 3.65 g dry polymer
per kg sludge solids). The data show that using the trial polymers at the lower dose is
unlikely to impact the phosphorous loading of the WWTP due to the GBT filtrate stream,
because the concentration of total phosphorous in the filtrate is comparable in either
scenario. The implications of using the trial polymers at the lower dose of 2.75 g dry
polymer per kilogram sludge solids versus the incumbent at a dose of 3.65 g dry polymer
per kilogram sludge solids are explored in Section 4.4.2.
E.(03Ok .o.co.(0o4=
Q -
75?a>13
35
30
25
20
15
10
5
01.85 2.75 3.65 4.55 6.35 7.255.45
Polymer Dose (g dry polymer/kg sludge solids) n=6
■ CB4450 ■ SNF4290 —± —EC4925
Figure 4.21 - Full-scale Total Phosphorous Concentration in Filtrate ± 1 Standard Deviation
82
Reproduced with permission of the copyright owner. Further reproduction prohibited without permission.

83
Figure 4.22 shows the ammonia concentration observed in filtrate. The data shows that at
dosages of 2.75 g dry polymer per kg sludge solids and up, the trial polymers produce
filtrate with an ammonia concentration near 0.5 mg ammonia per liter filtrate, while the
incumbent produces filtrate with an ammonia concentration about 4 times higher at the
2.75 g dry polymer per kilogram sludge solids dosage. The incumbent polymer achieves
filtrate concentration around 5 mg/L only at the two highest dosages, above 6.35 g dry
polymer per kilogram sludge solids.
3.5
_iE 2.5mcoEE<v13 1
E 0.5
1 2 3 4 5 6 87
Polymer Dose (g dry polymer/kg sludge solids) n=6
CB4450 — SNF4290 -*~~EC4925
Figure 4.22 - Full-scale Ammonia Concentration in Filtrate ± 1 Standard Deviation
83
Reproduced with permission of the copyright owner. Further reproduction prohibited without permission.

84
4.1.8 Examination of Trial Polymers at Lower Doses
The data presented in Section 4.4.1 suggests that achieving a total solids level of
thickened sludge between 4 and 5 percent may be achieved at a 25 percent lower polymer
dose using one of the trial polymers instead of the incumbent polymers. However, the
purpose of this study has been to look at both the solids capture and the nutrient loading
of solid and liquid streams during thickening. Therefore, in order to justify using a trial
polymer in place of the incumbent, it is necessary to examine how the trial polymers will
affect nutrient direction at the lower dose. The doses examined are 2.75 g dry polymer
per kilogram sludge solids and 3.65 g dry polymer per kilogram sludge solids. Figure
4.23 shows that the trial polymers achieve a solids capture at either dose between 4 and 5
percent total solids, which is approximately equal to the incumbent polymer, but only
when the incumbent is applied at the higher dose. In Figure 4.24, the full-scale TKN
content of thickened sludge is shown, while in Figure 4.25, the corresponding total
phosphorous data is shown. In both cases, at the lower dose, polymer SNF 4290 clearly
outperforms the incumbent polymer. Furthermore, at the lower dose, SNF 4290 produces
sludge within about 10 percent of the TKN and total phosphorous content of the
incumbent polymer at the higher dose. Polymer EC 4925, on the other hand, produces
thickened sludge only about half as concentrated in TKN and total phosphorous at the
lower dose compared to the incumbent at the higher dose. In Figure 4.26, the total
phosphorous content of filtrate is shown. Polymer SNF 4290 produces filtrate averaging
about 25 percent higher in total phosphorous using the lower dose than the incumbent
polymer dose at the higher dose, although there is a fair degree of variability in this data.
Overall, the data shown here allow for a more deliberate decision making process. It is
84
Reproduced with permission of the copyright owner. Further reproduction prohibited without permission.
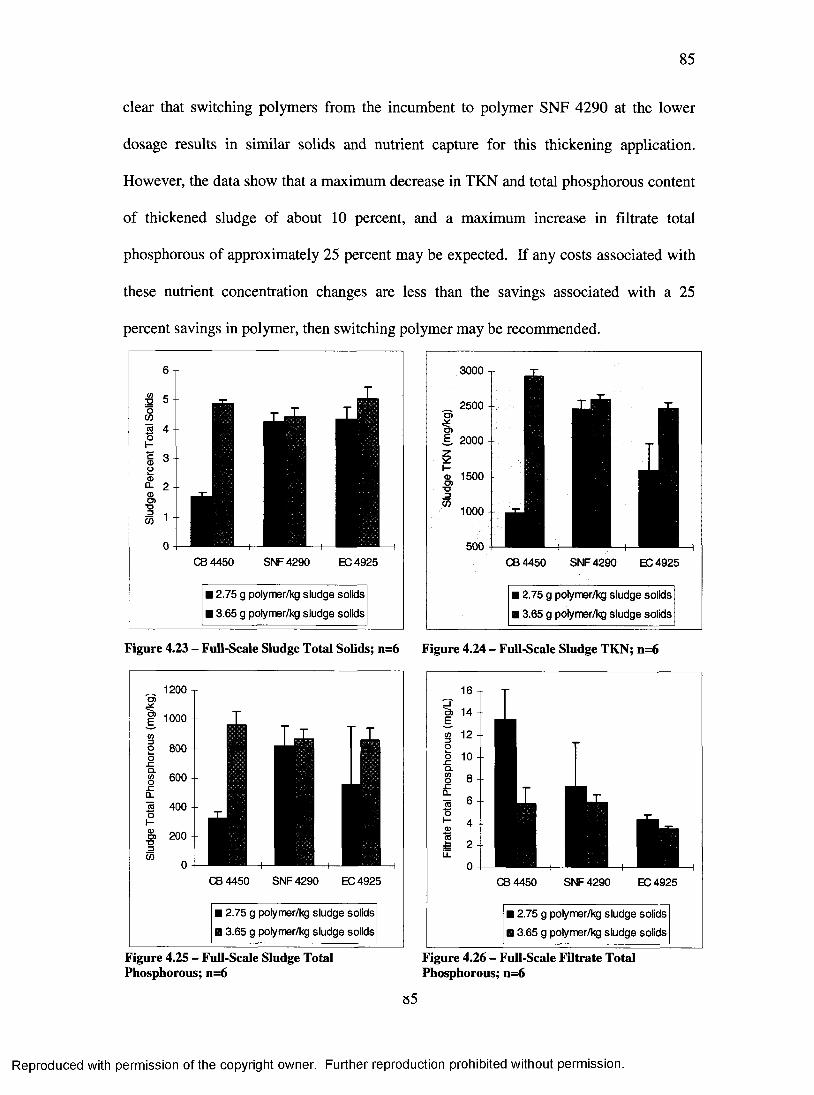
85
clear that switching polymers from the incumbent to polymer SNF 4290 at the lower
dosage results in similar solids and nutrient capture for this thickening application.
However, the data show that a maximum decrease in TKN and total phosphorous content
of thickened sludge of about 10 percent, and a maximum increase in fdtrate total
phosphorous of approximately 25 percent may be expected. If any costs associated with
these nutrient concentration changes are less than the savings associated with a 25
percent savings in polymer, then switching polymer may be recommended.
CB 4450 SNF 4290 EC 4925
■ 2.75 g polymer/kg sludge solids
■ 3.65 g polymer/kg sludge solids
CB 4450 SNF 4290 EC 4925
■ 2.75 g polymer/kg sludge solids
■ 3.65 g polymer/kg sludge solids
Figure 4.23 - Full-Scale Sludge Total Solids; n=6 Figure 4.24 - Full-Scale Sludge TKN; n=6
1200o>I 1 1000 (0o 800O.c§■ 600.cQ_
400iiuo> 200 •o3CO 0 +-
CB 4450 SNF 4290 EC 4925
12.75 g polymer/kg sludge solids
13.65 g polymer/kg sludge solids
16 T
a> 14
a 12
o 10
CB 4450 SNF 4290 EC 4925
12.75 g polymer/kg sludge solids
13.65 g polymer/kg sludge solids
Figure 4.25 - Full-Scale Sludge Total Phosphorous; n=6
Figure 4.26 - Full-Scale Filtrate Total Phosphorous; n=6
»5
Reproduced with permission of the copyright owner. Further reproduction prohibited without permission.

86
4.1.9 Summary of Polymer Optimization
In general, the overall advantage in selecting one polymer over another seems to
disappear at higher polymer doses. At low polymer doses, however, the trial polymers
SNF 4290 and EC 4925 outperformed the incumbent polymer. Achieving thickened
sludge with over 4 percent solids is possible with the trial polymers at a dose
approximately 25 percent less than the incumbent polymer. The picture is slightly more
complicated when the nutrient selection is considered. At the lower dose of 2.75 g dry
polymer per kilogram sludge solids, trial polymer SNF 4290 produced thickened sludge
with approximately two and a half times higher TKN and total phosphorous
concentration than the incumbent. At higher doses between 4.55 and 5.65 g dry polymer
per kilogram sludge solids, the incumbent polymer produced thickened sludge with
approximately 50 percent higher concentrations of TKN and total phosphorous. Filtrate
turbidity was about five times lower during trials of SNF 4290 and EC 4925 than when
the incumbent polymer was used, when the polymer dosage was 2.75 g dry polymer per
kilogram sludge solids, but at higher doses the polymers performed approximately
equally. At the 2.75 g dry polymer per kilogram sludge solids, the ammonia
concentration of filtrate was about four times higher when the incumbent polymer was
used versus the trial polymers, but the differences between polymer types fell within a
one standard deviation at higher doses. Similarly, with respect to total phosphorous in
filtrate, a significant difference between polymer types was observed only at the lower
dose of 2.75 g dry polymer per kilogram sludge solids. The full-scale data from
thickened sludge samples is summarized in Table 4.3, and the data from filtrate is
presented in Table 4..4.
86
Reproduced with permission of the copyright owner. Further reproduction prohibited without permission.

87
Table 4.3 - Summary of Full-Scale Data - Thickened Sludge ± 1 Standard DeviationDosage (g dry polymer /kg sludge solids) —»
1.85 2.75 3.65 4.55 5.45 6.35
Parameter J.Polymer CB 4450
Total Solids (%) n=6 N/A 1.7 ±0.1 4.9 ±0.8 5.6 ±0.2 5.9 ±0.2 6.1 ±0.4Total Phosphorous (mg/kg) n=6
N/A330 ±47 960 ± 100
1138 ± 182
1125 ± 138 978 ±43
TKN (mg/kg) n=6 N/A988 ± 68
2927 ± 323
3365 ± 143
3448 ± 226
3521 ± 428
Polymer SNF 4290Total Solids (% ) n=6 1.1 ±0.1 4.3 ±0.3 4.4 ± 0.4 4.9 ± 0.8 5.7 ±0.8 6.0 ± 0.4Total Phosphorous (mg/kg) n=6 723 ± 65 818 ± 135 869 ± 64 843 ± 123 820 ± 108 883 ± 178TKN (mg/kg) n=6 2185 ±
2642453 ±
4792603 ±
2672452 ±
3922493 ±
2822695 ±
500Polymer EC 4925
Total Solids (% ) n=6 3.7 ±0.3 (n=3) 4.4 ± 0.4 5.0 ± 0.7 5.0 ± 0.5 4.8 ±0.3 4.8 ±0.7
Total Phosphorous (mg/kg) n= 6
281 ±18 (n=3) 561 ±391 862 ± 78 958 ± 164 975 ± 149
1050 ± 117
TKN (mg/kg) n=6 606 ± 29 (n=3)
1592 ± 1131
2480 ± 499
2715 ± 556
2895 ± 598
3162 ± 412
Table 4.4 - Summary of Full-Scale Data - Filtrate ± 1 Standard DeviationDosage (g dry polymer /kg sludge solids) —>
1.85 2.75 3.65 4.55 5.45 6.35
Parameter jPolymer CB 4450
Total Solids (%) n=6N/A
0.259 ± .160
0.057 ± 0.014
0.059 ± 0.019
0.043 ± 0.21
0.068 ± 0.08
Total Phosphorous (mg/L) n=6
N/A13.4 ±2.8 5.8 ± 1.5 6.3 ±1.1 6.1 ±1.8 6.9 ±3.2
Ammonia (mg/L) n=6 N/A 2.3 ±0.8 1.1 ±0.7 1.2 ±0.7 0.9 ± 0.6 0.5 ±0.1Polymer SNF 4290
Total Solids (%) n=6 0.363 ± 0.131
0.084 ± 0.014
0.061 ± 0.011
0.050 ± 0.013
0.043 ± 0.019
0.048 ± 0.012
Total Phosphorous (mg/L) n=6 >30 7.4 ±4.0 5.9 ±0.7 4.1 ± 1.1 4.0 ± 1.2 5.7 ±1.2Ammonia (mg/L) n=6 >3.0 0.7 ± 0.2 0.6 ±0.1 0.3 ±0.1 0.3 ±0.1 0.4 ±0.1
Polymer EC 4925Total Solids (%) n=6 0.071 ±
0.01 (n=3)0.048 ± 0.021
0.052 ± 0.016
0.066 ± 0.007
0.060 ± 0.006
0.061 ± 0.005
Total Phosphorous (mg/L) n=6
8.7 ±0.8 (n-3) 4.4 ± 0.4 3.6 ±0.3 3.4 ±1.3 4.3 ± 1.0 3.9 ±0.6
Ammonia (mg/L) n=6 1.0 ±0.3 (n=3) 0.4 ± 0.2 0.4 ± 0.01 0.4 ± 0.03 0.4 ±0.02 0.5 ± 0.02
87
Reproduced with permission of the copyright owner. Further reproduction prohibited without permission.

88
At doses above 3.65 g dry polymer per kg sludge solids in almost every case, the
polymers seem to exhibit similar performance. The only exception was when the TKN
and total phosphorous concentrations of thickened sludge were examined at relatively
high polymer doses, where the incumbent polymer outperformed the trial polymers.
Therefore, this study only found simultaneous advantages in solids and nutrient delivery
at low polymer doses.
4.2 Clarifier Foaming
4.2.1 Microscope Analysis
In this section, the focus is on characterizing a foaming problem that exists in the
clarification basins at Crystal Beach WWTP. The clarifiers are designed to let solids in
the activated sludge settle out of suspension, so that sludge may be collected, and the
clarified liquid may be separated from the sludge solids. Foaming problems cause sludge
to float on the clarifier surfaces, causing operational problems and impacting the quality
of the effluent liquid that exits the clarifiers. Microscope analysis of the foam is useful to
identify the types of microbes present in the foam, which is useful as a first step towards
characterizing the nature and causes of the foaming problem (Jenkins et al., 2004;
Richard, 2003). The samples used in this study were obtained from the surface of
clarification and aeration basins, as well as from GBT filtrate, from WAS storage tanks,
and from raw influent. The samples used from the clarification basin surfaces were used
to characterize the foaming problem directly. The samples taken from aeration basins
were used to determine the relative abundance of foam-causing microorganisms in
88
Reproduced with permission of the copyright owner. Further reproduction prohibited without permission.

89
surface foam versus in the bulk liquid. This comparison is useful to determine the
microbial culprit(s) that can be implicated as causative factors in foaming issues, (Jenkins
et al., 2004; Richard, 2003; Parker et al., 2003). The samples obtained from GBT filtrate,
WAS storage tanks, and raw influent were used to determine whether foam-causing
microorganisms were recycled through the plant during thickening, proliferating in
sludge storage before thickening, or introduced from an exogenous source. Table 4.5
summarizes the major findings of the microscope analysis.
Table 4.5 - Summary of Findings of Microscope AnalysisSample Location Foam Causing Microbes Conclusion(s)Clarifier Surface Nocardia (excessive)
Type 0041 (very common) Beggiatoa (rare)
Foaming in clarifiers characteristic of Nocardia foaming. Type 0041 also present in foam
Clarifier Bulk Liquid Nocardia (few) Foam may be floating from trapping locations at clarifier inlets
Aeration Foam Nocardia (common) Type 0041 (few)
Fewer Nocardia and Type 0041 in aeration suggest growth between aeration and clarification, possibly foam trapping
Aeration Liquid Nocardia (few) Fewer Nocardia in bulk liquid suggests stable foam
Raw Sewage None Foaming microbes endogenous to plant
WAS Storage None Foaming microbes not proliferating in sludge storage
GBT filtrate None Foaming microbes not recycled in filtrate from thickening
* See Appendix 1 for summary of filamentous organisms and classification of abundance
Figures 4.29 to 4.32 show the photographs obtained from the microscopic analysis of
clarifier foam. These figures are used to identify the types of filamentous bacteria that
dominate the foam (Jenkins et al., 2004). Since different types of filamentous bacteria
are known to thrive under specific conditions, process adjustment can be used to cause
89
Reproduced with permission of the copyright owner. Further reproduction prohibited without permission.

90
conditions in the plant that may cause physical stress to targeted filamentous bacteria
(Jenkins et al, 2004; Parker et al., 2003; Iwahori et al., 1997).
SludgeParticle
FilamentousBacteria
Figure 4.27 - Dilute Clarifier Foam — 100 Times Magnification
The foam shown in Figure 4.27 is mixed with clarifier liquid, and is somewhat dilute
compared to the thick surface foam. The sample contains a noticeable amount of
filamentous bacteria. The dark spots are sludge particles, which appear to be enmeshed
within the filamentous structure of the bacteria. The filaments can become entangled,
causing bridging between sludge particles, and forming large, loose clumps that do not
settle easily (Frigon et al., 2006; Jenkins et al., 2004; Richard, 2003; Baumann et al.,
1988).
90
Reproduced with permission of the copyright owner. Further reproduction prohibited without permission.

Figure 4.28 - Dilute Clarifier Foam - 100 Times Magnification, Gram Stained
The photograph shown in Figure 4.28 shows a similar mixed foam and liquid sample as
in Figure 4.27. This microscope slide shows the effect of gram-staining, which makes
the bacteria easier to identify against the background. From this photo, it is possible to
determine that the foam is dominated by Nocardia bacteria. These are gram-positive
bacteria that stain a dark colour against the background, and exhibit branching
physiology (Eales et al., 2005; Jenkins et al., 2004). The bridging mechanism by which
the filamentous bacteria can cause sludge particles to become enmeshed into larger
particles is also evident. The filamentous bacteria form dense mats of intertwined
bacteria.
91
Reproduced with permission of the copyright owner. Further reproduction prohibited without permission.

92
Figure 4.29- Clarifier Foam - 100 Times Magnification, Gram Stained
In Figure 4.29, the thick, floating foam from the clarifier surface is shown at 100 times
magnification after gram staining. It appears that the thick foam is formed mainly of
large masses of attached filamentous bacteria. An air bubble at the center of the figure
helps show how dense the bacterial colony is within the thick surface foam.
92
Reproduced with permission of the copyright owner. Further reproduction prohibited without permission.

93
Figure 4.30 - Clarifier Foam at 100 times magnification, Phase Contrast
In Figure 4.30, the branching physiology of the filamentous bacteria is shown by
observing the slide using a phase contrast light filter. The dense, brightly coloured sludge
particles are entwined within a network of dark, branching bacterial hyphae. This is
thought to hamper settling, and may also cause sludge bulking, (Jenkins et al., 2004;
Richard, 2003).
93
Reproduced with permission of the copyright owner. Further reproduction prohibited without permission.

94
Nocardia
Type0041
Figure 4.31 - Clarifier Foam - 1000 Times Magnification, Gram Stained
Figure 4.31 shows the filamentous bacteria at 1000 times magnification. At this
magnification, it is possible to identify two specific species in the clarifier foam. The
bacterium in the center exhibits gram-positive staining characteristics, (appearing purple),
and true branching, characteristic of Nocardia bacteria. The longer, gently curving
bacteria that exhibit gram-variable staining, (appearing purple and orange), are identified
as type 0041 bacteria (Jenkins et al., 2004).
Microscopic analysis of samples taken from the plant influent, the waste activated sludge
storage, and the filtrate from sludge thickening showed very little filamentous bacteria.
This suggests that the filamentous bacteria responsible for the observed foaming originate
in the activated sludge system, and do not survive well in other parts of the process
stream. Because the sample from the plant headworks was free of filamentous bacteria, it
94
Reproduced with permission of the copyright owner. Further reproduction prohibited without permission.

95
appears that the filamentous bacteria are endogenous to the plant, and not imported
within raw influent.
4.2.2 E. Coli Enumeration Analysis
Figure 4.32 shows the results of E. coli testing of foam from the aeration and clarification
systems, and clarifier effluent. The Ontario regulation for plant effluent is shown with a
red line. Practically, the disinfection process that occurs after clarification must bring the
E. coli concentration from about 105 cfu/lOOmL down to the regulatory limit of 200
cfu/lOOmL. The data suggests that the clarifier foam is a potent source of E. coli,
approximately 100 times as concentrated in E. coli colony forming units than the clarifier
effluent, and approximately fifty thousand times more concentrated than regulations
permit in plant effluent. In other words, at Crystal Beach, it seems that foam mixes with
bulk liquid from the clarifiers, and the E. coli concentration observed is approximately
four orders of magnitude higher than the certificate of approval objective for effluent E.
coli concentration. This suggests that the foam may increase the need for chlorine
disinfection to kill E. coli and maintain compliance. At this point, there does not appear
to be an abundance of literature sources that have examined the connection between
sludge foaming and elevated levels of E. coli and/or suspended solids in clarifier effluent.
Future work may be directed towards specifically measuring how foaming problems
impact the quality of clarifier effluent, and discovering important mechanisms that may
be at work. For example, it is not understood whether activated sludge foam is high in E.
coli due to the presence of sludge particles within the foam matrix, or whether E. coli is
able to proliferate in the foam layer.
95
Reproduced with permission of the copyright owner. Further reproduction prohibited without permission.

96
1.0E+08
ra 1.0E+07 oO 1.0E+0601 1.0E+05_i| 1.0E+04 og 1.0E+03
~ 1.0E+02 o o
UJ: 1.0E+01
1 .OE+OO
Crystal Beach WWTP Effluent Discharge Limit
Aeration Foam Clarifier Foam Clarifier Effluent
Figure 4.32 - E. coli Concentration at Three Different Sample Locations (n=3)
4.2.3 Process Data Analysis
Some research has suggested that both Nocardia and type 0041 thrive when SRT is too
long, temperature is too high, the F/M ratio is too low, and the dissolved oxygen (DO)
concentration is erratic, (Frigon et al., 2006; Jenkins et al., 2004; Parker et al., 2003;
Scruggs and Randall, 1998; Kappeler and Brodmann, 1995; Blackall et al., 1991; Wanner
and Grau, 1989; Baumann et al., 1988; Lemmer and Baumann, 1988). Using data from
plant records, analysis was performed to determine whether the conditions at the plant are
conducive to filamentous bacteria growth and may potentially allow foaming problems to
occur. Figure 4.33 shows the SRT observed at Crystal Beach WWTP in 2006. This
parameter represents the average amount of time that activated sludge solids reside in the
aeration and clarification systems. The red line represents a conventional design
96
Reproduced with permission of the copyright owner. Further reproduction prohibited without permission.

97
parameter of eight days. Some studies suggest that in plants susceptible to filamentous
bacteria foaming, SRT should be set as low as two days, (Jenkins et al., 2004; Blackall et
al., 1991). Crystal Beach WWTP, however has an extended aeration system, which
keeps organics and microorganisms under aeration for a greater period of time, in order
to allow microorganisms to metabolize more organic matter. The SRT levels maintained
at these types of plants is commonly longer, as high as 25 days (Metcalf and Eddy, 2005).
However, because Crystal Beach does have foaming problems, and because higher SRTs
are not maintained in order to allow nitrification-denitrification reactions to occur, (since
Crystal Beach WWTP does not have regulated ammonia limits for the effluent), it has
historically been operated with an eight day SRT target. The data shown in Figure 4.33
suggest that there is significant variability in the SRT maintained in the activated sludge
system at Crystal Beach WWTP. Because the automatic flow meters that regulate SRT
do not operate properly, it is difficult for operators to maintain a consistent SRT. This is
an important point, since an erratic SRT has been implicated as a exacerbating factor in
plants susceptible to Nocardia foaming problems (Jenkins et al., 2004). Providing
operators with the ability to automate and analyze parameters such as SRT may allow the
plant to maintain consistent conditions under which foaming is less likely to continue.
97
Reproduced with permission of the copyright owner. Further reproduction prohibited without permission.

98
6 0
50
I 45 <0S' 40
Target SRT
2 25
20
Figure 4.33 - Solid Retention Time Observed at Crystal Beach WWTP 2006
In Figure 4.34, the F/M ratio at Crystal Beach WWTP is shown. The red line shows the
maximum F/M prescribed by the design parameters for extended aeration plants of 0.15
mg CBOD/mg mixed liquor volatile suspended solids. It is apparent that Crystal Beach
WWTP tends to operate well above the designed F/M ratio, and exhibits a highly variable
measured F/M ratio. By controlling SRT, and maintaining a range of values that is
adjusted automatically instead of manually, related parameters such as F/M will also
become less variable. The F/M ratio data does not appear to support the assumption that
Nocardia bacteria proliferate under low F/M conditions. However, conventional
activated sludge plants without extended aeration typically maintain F/M values around
0.3 mg CBOD/mg MLVSS, (Metcalf and Eddy, 2005). Crystal Beach WWTP may
98
Reproduced with permission of the copyright owner. Further reproduction prohibited without permission.

99
behave more like a typical conventional activated sludge plant, in which case, the
observed F/M may periodically be lower than ideal.
Target F/M Ratio(00)>_is 0.9O) „ „ E 0.80.7 0.6
o> 0.5 <§■ 0.4 | 0.3
0.2
QOmo
1/0 4/9 7/18 10/26 2/3
Date (month/day)
Figure 4.34 - F/M Ratio Observed at Crystal Beach WWTP 2006
Figure 4.35 shows the dissolved oxygen concentration in the aeration system at Crystal
Beach WWTP observed over a three-week period in December 2006. Scruggs and
Randall (1998) noted that scum causing Nocardia bacteria was enhanced by DO
concentrations above 1.0 mg/L, and that growth of Nocardia increased linearly with DO
concentration as DO increases from 1.0 to 5.0 mg/L. Jenkins et al., (2004) suggested that
the filamentous bacteria type 0041 may thrive in conditions with erratic DO
concentration. The DO data in Figure 4.35 reveals that the DO concentration reaches up
99
Reproduced with permission of the copyright owner. Further reproduction prohibited without permission.

1 0 0
to 8 mg/L, and that the concentration is also somewhat erratic, fluctuating up to 2 mg/L in
the interval shown. The design DO concentration for the plant is 2.0 mg/L.
9
8
7
6
5
4
3
2
1
Day
Figure 4.35 - Dissolved Oxygen Concentration Observed at Crystal Beach WWTP December 2006
The process data is summarized in Table 4.6, along with suggested design parameters.
The data is listed by average, and the range observed over a given period of time is listed,
to show the variability observed.
100
Reproduced with permission of the copyright owner. Further reproduction prohibited without permission.

1 0 1
Table 4.6 - Summary of Process Parameter Records at Crystal Beach WWTPParameter Time
IntervalAverageValue
Range Recommended Value Source(s)
SRT 2006 5.30 0.31-55.45
8.0 (design)2.0 (to wash out foam)
Jenkins et al., 2004; Blackall etal., 1991
F/M 2006 0.32 0.05-0.86
0.15 (design standard for extended aeration)0.3 (design standard for conventional WWTP)
Metcalf and Eddy, 2003
DO December2006
7.1
©001o\v-i <1.0 (to combat foam microbes) 2.0 (design standard)
Scruggs and Randall, 1998
4.2.4 Control of Clarifier Foaming
To control the observed clarifier foaming problem at Crystal Beach WWTP, a number of
methods have been recommended for the future. To reduce the generation time of
filamentous bacteria in the activated sludge, the SRT must be controlled and reduced. An
examination of the plant revealed that stabilizing SRT automatically is not currently
possible. This is due to the current configuration of the sludge return and wasting
equipment. Setting an automatic SRT will require that the sludge return rate is set as a
proportion of wastewater influent flow, which at present is not possible due to poorly
functioning flow meters and automatic valves at critical locations in the plant. Setting an
automatic SRT will also regulate the F/M ratio, since Crystal Beach is known to receive
influent at a relatively consistent CBOD concentration, probably because the influent is
made up mainly of domestic wastewater.
The DO concentration must be regulated as well, and lowered to the design concentration
of 2.0 mg/L. At present, this is not possible because the valves from the blowers to the
diffusers in the aeration system will not allow the air flow to be manipulated. Also, the
101
Reproduced with permission of the copyright owner. Further reproduction prohibited without permission.

1 0 2
blowers in use at the plant are oversized, and so excess air is delivered to the aeration
cells. Reduction and proper control of DO concentration will require automatically
controlled valves that adjust air input according to the DO levels measured in the aeration
cells.
4.2.5 Summary of Clarifier Foaming Research
The major benefit of the clarifier foaming study was to provide information that did not
exist previously. The persistent foaming problem was known to occur year-round, and
was characterized by thick, brown, viscous foam that re-established itself after manual
removal. The foam was known to cause activated sludge to float on the surface of the
clarifiers, and was thought to increase the demand for chlorine in the disinfection process.
The microscope analysis provided the necessary information to determine the dominant
types of filamentous bacteria in the foam, and to rule out recycling and proliferation of
filamentous bacteria in the plant in areas other than the clarification and aeration systems.
Furthermore, the microscope analysis showed that the bacteria responsible for foaming
were not imported to the plant in the raw influent, but rather were growing within the
plant. After identifying the dominant bacteria in the foam (such as Nocardia), it was
possible to consult literature sources that suggested specific conditions under which
particular species can persist and proliferate. An examination of plant records suggested
that important parameters such as SRT, F/M ratio, and DO may require adjustment and/or
automation to maintain important target ranges that will make conditions less favourable
for filamentous organisms and foaming incidents. In the future, the effectiveness of
controlling process parameters at the plant may be documented, to show whether the
102
Reproduced with permission of the copyright owner. Further reproduction prohibited without permission.

103
foaming problem could be solved using a process-based approach, and to underscore the
importance of taking an exhaustive approach that begins primarily with characterization
of the microbiological community in the foam, and in the plant at various points in the
process stream.
The E. coli analysis proved that the foam was a potent source of E. coli bacteria,
approximately four orders or magnitude higher in E. coli colony forming units than the
plant effluent discharge limit. In the future, an analysis of the effect of foaming on the
chlorine demand on the disinfection process may prove that eradicating foaming
problems is more important than simply rectifying a nuisance, but also a way to lower
cost economically by lowering chlorine demand, and environmentally by lowering the
amount of chlorine introduced into the natural aquatic environment.
103
Reproduced with permission of the copyright owner. Further reproduction prohibited without permission.

104
5 Conclusions
This research was aimed at improving the solids handling at a domestic WWTP by
focusing on two main studies:
1.) Identifying the performance of a number of commercially available polymers in an
existing sludge thickening system.
2.) Characterizing and recommending possible control strategies to combat a persistent,
year round foaming problem that causes activated sludge to float on clarifier surfaces.
The polymer study took a practical approach to investigating the performance of a
number of polymers at bench and full-scale, both in terms of solids capture, and nutrient
selection during phase separation. To pre-screen polymers for solids capture and nutrient
testing, an oxidation-reduction test was used. Polymers were then tested on a bench-scale
gravity filter. Solid and liquid samples were tested for a variety of physical and chemical
parameters. Some polymers produced sludge with higher concentrations of TKN than
others, although significant advantages in total phosphorous concentration of filtrate were
unclear. Three polymers were tested at full-scale. The two trial polymers appeared to be
more effective than the incumbent polymer at lower dosages with respect to both solids
capture, and nutrient delivery to the thickened sludge. The data shows that at lower
doses, the trial polymers produced thickened sludge higher in TKN concentration, and
filtrate lower in ammonia concentration, compared to the incumbent polymer. At higher
doses, however, the incumbent polymer was better than the trial polymer SNF 4920 at
concentrating TKN in solid phase at doses over 3.65 g polymer per kilogram sludge
solids. Trial polymer EC 4925 appeared to outperform the other two polymers at
104
Reproduced with permission of the copyright owner. Further reproduction prohibited without permission.

105
maintaining a low concentration of total phosphorous in filtrate, but only at doses below
3.65 g polymer per kilogram sludge solids. Overall, the trial polymers tested offer
simultaneous advantages in both solids capture and nutrient selection at relatively lower
doses than the incumbent polymer. The results confirm that polymer selection can
influence nutrient delivery to thickened WAS, which does not appear to have been
previously reported in literature.
The foaming research completed to date has proven that the foaming problem observed at
Crystal Beach is due mainly to a persistent, endogenous population of Nocardia bacteria,
(among other less dominant filamentous bacteria), that cause sludge separation problems
in the aeration cells and clarification basins. The foam that floats on the clarification
basins overwhelms the automatic scum removal system, and requires additional work
hours for operators to remove scum from clarifier surfaces manually. The foam may also
compromise the quality of the effluent, and has been shown to be a potent source of E.
coli, which requires an excessive amount of sodium hypochlorite to be used for
disinfection, increasing the chlorine residual delivered to the natural aquatic environment.
This foaming phenomenon is believed to be due in large part to the environment
maintained in the activated sludge system. This study has shown that the activated
sludge system is characterized by somewhat variable conditions. The SRT, F/M ratio,
and DO concentration, three standard measures of activated sludge system conditions, are
historically erratic, and may be maintained far outside of the design ranges. As a result of
these findings, recommendations have been made to impose controls on the activated
sludge system, (especially the SRT), by automating sludge wasting and return, processes
105
Reproduced with permission of the copyright owner. Further reproduction prohibited without permission.

106
that currently are controlled manually, and maintaining a constant DO concentration in
the aeration system that is within the design specifications of the plant. The clarifier
foaming study was mainly focused on characterizing the problem, and so a follow-up
study should be conducted to evaluate the effectiveness of the recommended control
strategies.
106
Reproduced with permission of the copyright owner. Further reproduction prohibited without permission.

107
6 References
Al-Mutairi, N.Z., Hamoda, M.F., Al-Ghusain, I. (2004). Coagulant selection and sludge conditioning in a slaughterhouse wastewater treatment plant. Bioresource Technology 95,115-119.
Al-Muzaini, S., Hamoda, M.F. (1998). Selection of an effective sludge dewatering system for a small wastewater treatment plant. Environment International, 25(8), 983- 990.
American Public Health Association/American Water Works Association. (1998). Standard methods for the examination of water and wastewater 20th edn
Atkins, P., Jones, L. (2005). Chemical Principles, 3rd ed., W.H. Freeman and Company. New York.
Ayoll, A, Dentel, S.K., Filibeli, A. (2005). Dual polymer conditioning of water treatment residuals. Journal of Environmental Engineering.
Baumann, M., Lemmer, H., Ries, H. (1988) Scum actinomycetes in sewage treatment plants - part 1. Water Research, 22, 6, 755-759.
Benitez, J., Rodriguez, A., Suarez, A. (1994). Optimization technique for sewage sludge conditioning with polymer and skeleton builders. Water Research, 28(10), 2067-2073.
Blackall, L.L., Harbers, A.E., Greenfield, P.F., Hayward, A.C. (1991). Foaming in activated sludge plants: A survey in Queensland, Australia and an evaluation of some control strategies. Water Research, 25(3), 313-317.
Cha, D.K., Jenkins, D., Lewis, W.P., Kido, W.H. (1992). Process control factors influencing Nocardia populations in activated sludge. Water Environment Research, 64, 37.
Chen, G., Yue, P.L., Mujumder, A.S. (2002). Sludge dewatering and drying. Drying Technology, 20(4&5), 883-916.
Chitikela, S., Dentel, S.K. (1998). Dual-chemical conditioning and dewatering of anaerobically digested biosolids: laboratory evaluations. Water Environment Research, 70(5), 1062-1069.
Deneux-Mustin, S., Lartiges, B.S., Villemin, G., Thomas, F., Yvon, J., Bersillon, J.L., Snidaro, D. (2001). Ferric chloride and lime conditioning of activated sludges: an
107
Reproduced with permission of the copyright owner. Further reproduction prohibited without permission.

108
electron microscopic study on resin embedded samples. Water Research, 35(12), 3018- 3024.
Dentel, S.K., in: Spinosa L., Vesilind P.A. (Eds.), Sludge into biosolids, IWA Publishing, London, 2001, Chapter 16.
Dentel, S.K. (2001). Conditioning, thickening, and dewatering - research update/research needs. Water Science and Technology, 44(10), 9-18.
Droste, R.L. (1997). Theory and Practice of Water and Wastewater Treatment. John Wiley and Sons. Toronto.
Eales, K., Nielsen, J.L., Kragelund, C., Seviour, R., Nielson, P.H. (2005). The in-situ physiology of pine tree like organisms in activated sludge foams. Acta Hydrochimica et Hydrobiologica, 33(3), 203-209.
Eikelboom, D.H., Andreadakis, A., Andreasen, K. (1998). Survey of filamentous populations in nutrient removal plants in four European countries. Water Science and Technology, 37(4-5), 281-289.
Frigon, D., Guthrie, R.M., Bachman, G.T., Royer, J., Bailey, B., Raskin, L. (2006). Long term analysis of a full-scale activated sludge wastewater treatment system exhibiting seasonal biological foaming. Water Research, 40, 990-1008.
Government of Ontario. (2002). Nutrient management act. c.4, s.6 (2).
Government of Canada. (2003). Canada Gazette, Part II, 135(1) 143-153.
Iwahori, K., Taki, H., Miyata, N., Fujita, M. (1997). Analysis of nocardia amarae profiles in actual foaming activated sludge plant with viable cell count measurement. Journal of Fermentation and Bioengineering, 84, 98-102.
Jenkins, D., Richard, M.G., Daigger, G.T. (2004). Manual on the causes and control of activated sludge bulking and foaming. Lewis Publishers. 3rd edition.
Jess, D. (2005). Secondary foam chlorination the easy way. Environmental Science and Engineering. January: 28.
Kappeler, J., Brodmann, R. (1995). Low F/M bulking and scumming: towards a better understanding by modelling. Water Science and Technology, 31(2), 225-234.
108
Reproduced with permission of the copyright owner. Further reproduction prohibited without permission.

109
Kappeler, J., Gujer, W. (1994). Scumming due to actinomycetes: toward a better understanding by modeling. Water Research, 28(4), 763-779.
Kiely, P. (1997). Environmental engineering. McGraw-Hill. NewYork
Knoop, S., Kunst, S. (1998). Influence of temperature and sludge loading on activated sludge settling, especially on Microthrix Parvicella. Water Science and Technology, 37(4-5), 37-45.
Krishnamurthy, S. and Viraraghavan, T. (2005). Chemical conditioning for dewatering municipal wastewater sludges. Energy Sources, Part A: Recovery, Utilization, and Environmental Effects, 27(1), 113 - 122.
Lemmer, H., Baumann, M. (1988). Scum actinomycetes in sewage treatment plants- part2. Water Research, 22(6), 761-763.
Lemmer, H., Baumann, M. (1988). Scum actinomycetes in sewage treatment plants - Part 3. Water Research 22(6), 765-767.
Lemmer, H., Lind, G., Muller, E., Schade, M., Ziegelmayer, B. (2000). Scum in activated sludge plants: impact of filamentous and non-filamentous bacteria. Acta Hydrochimico et Hydrobiologico 28(1), 34-40.
Lemmer, H. (1986). The ecology of scum causing actinomycetes in sewage treatment plants. Water Research 20(4), 531-535.
Mikkelsen, L.H., Keiding, K. (2001). Effects of solids concentration on activated sludge deflocculation, conditioning and dewatering. Water Science and Technology, 44(2-3), 417-26.
Metcalf and Eddy Incorporated. (2003) Wastewater engineering, treatment and reuse, 4th edition. McGraw-Hill College Publications. New York
Novak, J.T., Agerbaek, M.L., Sprensen, B.L., Hansen, J.A. (1999). Conditioning, filtering, and expressing waste activated sludge. Journal of Environmental Engineering 125(9), 816-824.
109
Reproduced with permission of the copyright owner. Further reproduction prohibited without permission.

1 1 0
Oerther, D.B., De Los Reyes III, F.L., De Los Reyes, M.F., Raskin, L. (2001). Quantifying filamentous microorganisms in activated sludge before, during, and after an incident of foaming by oligonucleotide probe hybridizations and antibody staining.Water Research 35(14), 3325-3326.
Olezskiewicz, J.A., Mavinic, D.S. (2001). Wastewater biosolids: an overview ofprocessing, treatment, and management. Canadian Journal of Environmental Engineering. 28, 102-114.
Olivier, J., Vaxelaire, J., Ginisty, P. (2004). Gravity drainage of activated sludge: from laboratory experiments to industrial process. Journal of Chemical Technology and Biotechnology. 79,461-467.
Pagilla, K.R., Jenkins, D., Kido, W. (1998). Nocardia effects in waste activated sludge. Water Science and Technology. 38(2), 49-54.
Parker, D., Geary, S., Jones, G., McIntyre, L., Oppenheim, S., Pedregon, V., Pope, R., Richards, T., Voight, C., Volpe, G., Willis, J., Witzgall, R. (2003). Making classifying selectors work for foam elimination in the activated sludge process. Water Environment Research, 75(1), 83-92.
Richard, M. (2003). Activated sludge microbiology problems and their control.Presented at the 20th Annual USEPA Nation Operator Training Conference. Buffalo,New York.
Saveyn, H.., Meersseman, S., Thas , O., Van der Meeren, P. (2005). Influence of polyelectrolyte characteristics on pressure-driven activated sludge dewatering. Colloids and Surfaces A: Physicochemical Engineering Aspects 262,40-51
Scales, P.J., Lester, D., Dixon, D.R., in: Spinosa L., Vesilind P.A. (Eds.), Sludge into biosolids, IWA Publishing, London, 2001, Chapter 17.
Scruggs, C.E., Randall, C.W. (1998). Evaluation of filamentous microorganism growth factors in an industrial wastewater activated sludge system. Water Science and Technology, 37(4-5), 263-270.
Severin, B.F., Grethlein, H.E. (1996). Laboratory Simulation of belt press dewatering: application of the Darcy equation to gravity drainage. Water Environment Research. 68 (3), 359-369.
Severin, B.F., Nye, J.V., Kim, B.J. (1999). Model and analysis of belt drainage thickening. Journal o f Environmental Engineering. 125 (9), 807-815.
110
Reproduced with permission of the copyright owner. Further reproduction prohibited without permission.

I l l
Shao, Y.J., Starr, M., Kaporis, K., Kim, H.S., Jenkins, D. (1997). Polymer addition as a solution to Nocardia foaming problems. Water Environment Research. 69, 25-27.
Sodell, J., Seviour, R. (1996). Growth of activated sludge foam-forming bacterium, Nocardia Pinensis on hydrophobic substrates. Water Science and Technology, 34(5-6), 113-118.
U.S. Environmental Protection Agency. (1987). Design manual: Dewatering municipal wastewater sludges, EPA-625/1-79-011, Washington, D.C.: Office of Research and Development, 37-55.
Vaxelaire, J., Olivier, J. (2006). Conditioning for municipal sludge dewatering. From filtration compression cell tests to belt press. Drying Technology, 24,1225-1233.
Vesilind, P.A., Hartman, G.C., Skene, E.T. (1986). Sludge management and disposal for the practicing engineer. Lewis Publishers. Michigan.
Wanner, J., Grau, P. (1989). Identification of filamentous organisms from activated sludge: a compromise between wishes, needs, and possibilities. Water Resources, 23(7) 883-891.
Westlund, A.D., Hagland, E., Rothman, M. (1998). Foaming in anaerobic digesters caused by Microthrix Parvicella. Water Science and Technology, 37(4-5), 51-55.
I l l
Reproduced with permission of the copyright owner. Further reproduction prohibited without permission.

1 1 2
Appendix 1 - Index of Filamentous Organisms
This appendix identifies a selection of filamentous organisms that have been documented
in studies that have explored the problems of activated sludge bulking and foaming. In
Table A 1.1, organisms are listed with their physical characteristics, conditions that may
allow them to exist and/or proliferate, and some methods that may be useful to control
their occurrence. In Table A 1.2, a method from Jenkins et al. (2004), for characterizing
the abundance of individual species during microscopic evaluation of samples is
presented.
Table Al.l - Filamentous Organisms that may Cause Sludge Bulking and/or FoamingOrganism Name Characteristics Conditions Control SourceNocardioform Filaments with true
branching morphology 5 to 30 pm in length
Mixed aeration systems; High SRT/Low F/M; High water temp, (above 15 °C); Hydrophobic substrates; Slowly degradable substrates; Oleic acid substrate; Foam trapping
Decrease mixing in aeration system; Decrease SRT; Reduce foam trapping
Jenkins et al. 2004; Richard, 2003; Lemmer et al., 2000;
Type 0041 Straight filaments 100 to 500 pm in length; Gram variable
High SRT/Low F/M; Slowly degradable substrates
Decrease SRT Jenkins et al. 2004; Richard, 2003; Lemmer et al., 2000
Beggiatoa sp. Straight or curved filaments 100 to 500 pm in length; Gram negative; motile
May be imported from outside WWTP; Sulfide substrate; Septicity
Remove septic conditions; Discourage attached growth on septic surfaces
Jenkins et al. 2004;Kappeler and Gujer, 1994
MicrothrixParvicella
Coiled filaments 50 to 200 pm; Gram positive
High SRT/Low F/M; Low DO; Low water temp, (below 10 °C); Hydrophobic substrates; Slowly degradable substrates; Oleic acid substrate; Foam trapping
Decrease SRT; Increase DO; Reduce foam trapping
Jenkins et al. 2004; Richard, 2003; Lemmer et al., 2000;
Sphaerotilus Natans Straight or gently curved filaments;
Mixed aeration systems; Low DO;
Reduce mixing in aeration
Jenkins et al. 2004;
112
Reproduced with permission of the copyright owner. Further reproduction prohibited without permission.

113
100 to 500 pm in length; Gram- negative; non- motile
Phosphorus deficiency; Simple sugar substrate; May be imported from outside the WWTP
system; increase DO; anoxic or anaerobic selectors
Richard,2003;Kappeler and Gujer, 1994
Type 1701 Straight, curved or bent filaments; 10 to 150 pm in length; Gram- negative
Mixed aeration systems; Low DO; Simple sugar substrate;
Reduce mixing in aeration system; increase DO; anoxic or anaerobic selectors
Jenkins et al. 2004;Richard, 2003
Haliscomenobacterhydrossis
Straight or bent filaments 10 to 100 |xm in length;Gram negative
Mixed aeration systems; Low DO; Simple sugar substrate; volatile fatty acid substrate
Reduce mixing in aeration system; increase DO; anoxic or anaerobic selectors
Jenkins et al. 2004;Richard, 2003
Type 021N Curved filaments; 50 to 500pm in length; Gram negative
Mixed aeration systems; Nitrogen deficiency; Volatile fatty acid substrates; Sulfide substrate; Septicity;
Reduce mixing in aeration system; increase DO; anoxic or anaerobic selectors; Remove septic conditions
Jenkins et al. 2004;Richard, 2003
Thiothrix I Straight or curved filaments 100 to 500 pm in length; Gram negative, but may stain Gram positive when sulphide present
Nitrogen deficiency; Volatile fatty acid substrate; Sulfide substrate; Septicity;
Remove septic conditions
Jenkins et al. 2004;Richard, 2003
Thiothrix 11 Straight or curved filaments 50 to 200 pm in length;Gram negative, but may stain Gram positive when sulphide present
Nitrogen deficiency; Volatile fatty acid substrate; Sulfide substrate; Septicity;
Remove septic conditions
Jenkins et al. 2004;Richard, 2003
Type 0914 Straight or curved filaments 50 to 200 pm in length;Gram negative, but may stain Gram positive when sulphide present
Volatile fatty acid substrate; Sulfide substrate;
Site-specificcontrols
Jenkins et al. 2004;Richard, 2003
Nostocoida limicola Bent filaments 40 to 100 pm in length; Gram positive in municipal wastewaters
Phosphorous deficiency; Simple sugar substrates; Volatile fatty acid substrates
Site-specificcontrols
Jenkins et al. 2004; Richard, 2003; Lemmer et al., 2000
Type 0411 Curved filaments 50 to 150 pm in length; Gram negative
Low SRT/High F/M; Volatile fatty acid substrate;
Increase SRT Jenkins et al. 2004;Richard, 2003
113
Reproduced with permission of the copyright owner. Further reproduction prohibited without permission.

114
Type 0092 Straight or bent filaments 10 to 80 pm in length; Gram negative
Slowly degradable substrates; High water temp, (above 15 °C);
Site-specificcontrols
Jenkins et al. 2004; Lemmer et al., 2000
Type 0581 Curved or spiral filaments 100 to 200pm in length; Gram negative
High SRT/Low F/M Decrease SRT Jenkins et al. 2004;Richard, 2003
Type 0675 Straight filaments 50 to 150 |im in length; Gram variable or Gram positive
High SRT/Low F/M; Slowly degradable substrates;
Decrease SRT Jenkins et al. 2004;Richard, 2003
Type 1851 Straight or curved filaments in bundles 50 to 200 pm in length; Gram variable or Gram positive
High SRT/Low F/M; Simple sugar substrate;
Decrease SRT Jenkins et al. 2004; Richard, 2003; Lemmer et al., 2000
Type 0803 Straight filaments 50 to 150 pm in length; Gram negative
High SRT/Low F/M; Decrease SRT Jenkins et al. 2004;Richard, 2003
Type 1863 Bent or curved filaments 10 to 50 pm in length; Gram negative
Low SRT/High F/M; Hydrophobic substrates
Increase SRT Jenkins et al. 2004;Richard, 2003
Fungi Filaments with true branching morphology 100 to 1000 pm in length; Gram positive
Low pH (< 6); Septicity; May be imported from outside the WWTP.
Increase pH; Remove septicity
Jenkins et al. 2004; Richard, 2003;Kappeler and Gujer, 1994
Table A1.2 - Ranking of Filament Abundance in Microscopic EvaluationNumerical Value Descriptor Filament0 None None observedl Few Only observed in some floes2 Some Observed in most but not all floes3 Common 1 to 5 filaments observed per floe4 Very Common 5 to 20 filaments observed per floe5 Abundant > 20 filaments per floe6 Excessive Filaments more abundant than floes, and observed in bulk
solution
114
Reproduced with permission of the copyright owner. Further reproduction prohibited without permission.

115
Appendix 2 - Calculations
This appendix lists and explains the calculations used to develop parameters that were
subject to analysis in this study. The parameters discussed here and in the Results section
(section 4) are outlined below in Table A2.1. The equations used to derive the
parameters are listed below.
Table A2.1 - List of Derived ParametersEquation Term Description1 ORP (mV) ORP is a measure of the oxidation-reduction potential
of a solution. It measures the ability of a solution to gain or lose electrons, and thus ORP measures the transferability of charge of a solution.
2 Total Solids (%) The total solids test measures the percentage of dry solids within a sample.
3 Total Suspended Solids (mg/L) Total suspended solids tests measure the mass of dried solids that are removed from a liquid sample after vacuum filtration through 1.5 pm aperture size filter paper
4 Total Volatile Solids (%) The total volatile solids test measures the percentage of mass of dried solids that is volatized at 550 °C.
5 Solid Retention Time (d) The SRT measures the amount of time that activated sludge is retained in the aeration system.
1.) The calculation used to determine the oxidation-reduction potential of polymer
solutions is shown in equation [1]:
= E + E —Esystem observed reference reference(observed)
Where: Esystem is the oxidation-reduction potential of the solution (mV)
Eobserved is the oxidation-reduction potential measured by the ORP probe
(mV)
115
Reproduced with permission of the copyright owner. Further reproduction prohibited without permission.

116
Ereference is the true oxidation-reduction potential of the reference solution
(mV)
Ereference (observed) is the measured oxidation-reduction potential of the
reference solution (mV)
The reference solution used for this procedure is 1.00 M KCL standard redox solution. It
provides a benchmark by which the ORP of the polymer solution is adjusted so that
fluctuations in the sensitivity of the electrode may be accounted for.
2.) The calculation used to determine the total solids percentage of a sample is shown in
equation [2]:
3.) The calculation used to determine the total suspended solids concentration of a
sample is shown in equation [3]:
rs=^os_xl00M s
[2]
Where: TS is the total solids percentage of the sample (%)
MDs is the mass of sample after dying (g)
Ms is the mass of sample before drying (g)
SS = - p-s- MVs
—x 1000 [3]
Where: SS is the concentration of suspended solids in the sample (mg/L)
116
Reproduced with permission of the copyright owner. Further reproduction prohibited without permission.

117
Mps is the mass of paper after sample filtration and drying (g)
Mp is the mass of paper before sample filtration (g)
Vs is the volume of sample (mL)
4.) The calculation used to determine the percentage mass of total volatile solids is
shown in equation [4]:
VS = M °s ~ Mys xlOO [4]Mas
Where: VS is the percentage of dried solids in the sample that are volatile (%)
Mds is the mass of sample after drying (g)
Mvs is the mass of sample after burning at 550 °C
5.) The calculation used to determine the solid retention time is shown in equation (5):
V XSRT = ------- 2_a------ [5]QwX w + QeX e
Where: SRT is the solid retention time (d)
Va is the volume of the aeration reactor(s) (m3)
Xa is the concentration of suspended solids in activated sludge within the
aeration reactor (g/m3)
Qw is the flow of WAS out of the activated sludge system (m3 / d)
Xw is the concentration of suspended solids in WAS (g/m3)
Qe is the flow of liquid effluent out of the WWTP (m3 / d)
117
Reproduced with permission of the copyright owner. Further reproduction prohibited without permission.
118
Xw is the concentration of suspended solids in of liquid effluent out of the
WWTP (g/m3)
118
Reproduced with permission of the copyright owner. Further reproduction prohibited without permission.

119
Appendix 3 - Foaming Spray System
In this appendix, the trial of a spray system used to combat foaming is presented. The
reason that a spray system was identified as a potential solution for combating the
foaming problem is that foam-trapping has been shown to exacerbate foaming problems
in secondary clarifiers. According to Jenkins et al. (2004), and Cha et al. (1992), foam
trapping can cause the volume of filamentous bacteria foam to increase greatly. At
Crystal Beach WWTP, the secondary clarifier inlets (shown in Figure A3.1), were
identified as an area where foam trapping occurred continuously.
Therefore, a chlorine spray system was designed to test the effectiveness of water or
chlorinated water used to contact the foam and cause the foam to subside. Figure A3.2
shows a photograph of the spray system. The system was ineffective at eradicating all of
the observed foam from the trial clarifier. This was due to the fact that the range of the
spray was not large enough to target the entire surface of the foam. Thus, a permanent
Figure A3.1 - Foam Trapping at Clarifier Inlet
119
Reproduced with permission of the copyright owner. Further reproduction prohibited without permission.

spray system wtl ne ^ ^ economically, a more
area, in order to be effective at reducing foam trapp g.
powerful effluent waterpump would be useM so that plant effluent may be used, as
opposed to municipally treated potable •; water.
'^ -.u T S p r., System '■» U* a. Cry-1 Beach WWTP
120
„ Further reproduction prohibited without perm ission.a th n e r m is s io n o f the copyright owner. Further rep
Reproduced with permission

1 2 1
Appendix 4 - Polymer Characteristics
This appendix presents the chemical characteristics of the polymers that were tested in
this study. The charge density refers to the percentage of the polymer chain that exhibits
a positive charge. This percentage may be very low (less than 10 percent), low (10 to 30
percent), medium (30 to 50 percent), high (50 to 70 percent), or very high (over 70
percent. The molecular weight refers to the average mass in grams of one mole of
polymer molecules. Among the polymers tested in this study, the molecular weight may
be medium (between approximately 105 and 106 g/mol), medium-high (approximately
106 g/mol), high (between approximately 106 and 107 g/mol), or very high (over 107
g/mol).
Table A4.1 - Polymer CharacteristicsSupplier Polymer Name Charge Density Molecular Weight CommentsInvestmentRecoveryGroup
CB 4450 Medium High Incumbent Polymer at Crystal Beach WWTP
CIBAChemical
7557 Medium Medium Used for bench- scale testing
7587 High Medium8180 High Medium - High8160 Medium Medium - High Used for bench-
scale testingJes-Chem 49 Low High Used for bench-
scale testing60 Medium High473 High High Used for bench-
scale testingSNF Chemical 4550 High High
4140 Very low Medium - High4190 Low High Used for bench-
scale testing4240 Low High4210 Low Very High4290 Low High Used for bench-
scale and full-scale testing
4700 High Medium - High4800 Very High Medium - High
121
Reproduced with permission of the copyright owner. Further reproduction prohibited without permission.
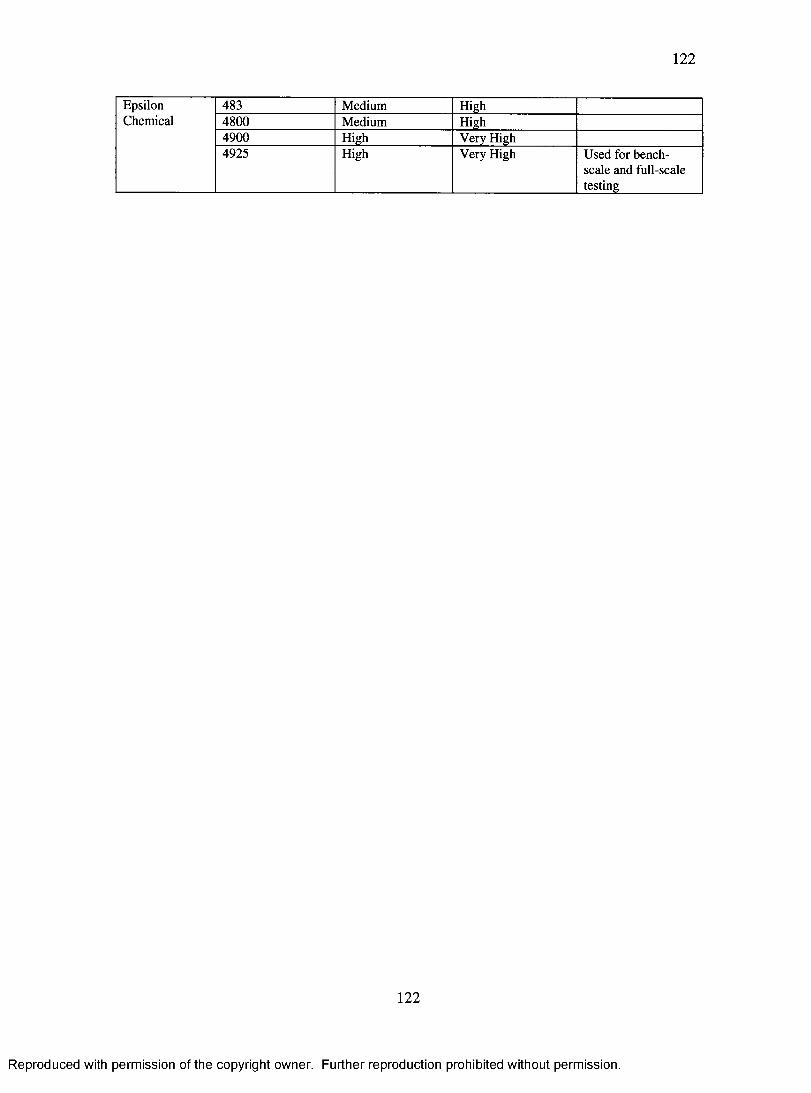
1 2 2
EpsilonChemical
483 Medium High4800 Medium High4900 High Very High4925 High Very High Used for bench-
scale and full-scale testing
122
Reproduced with permission of the copyright owner. Further reproduction prohibited without permission.

123
Appendix 5 - T test for Paired Datasets
In this Appendix, the full-scale polymer data is examined with a Student’s t test to
determine the reproducibility of data from week one testing to week two testing. T
statistics from two different confidence intervals are listed, a 95 percent confidence
interval and a 99 percent confidence interval. If the calculated t value (t calculated) is
less than t statistic corresponding to a given confidence interval (t critical), then it is
assumed that the data sets came from the same data population, and thus combining the
data from the two different data sets (i.e. week 1 and week 2), is statistically justifiable.
For the purpose of this study, the 99 percent confidence interval was selected as the
critical t value. The sample calculation below uses the following two equations [5] and
[6] to calculate the t statistic:
s 8x s fl0+kxy)N + N h
[5]
Where: Sc is the pooled estimate of variance between dataset a and dataset b
Na is the number of samples in dataset a
sa2 is the standard deviation of dataset a
Nb is the number of samples in dataset b
Sb2 is the standard deviation of dataset b
123
Reproduced with permission of the copyright owner. Further reproduction prohibited without permission.
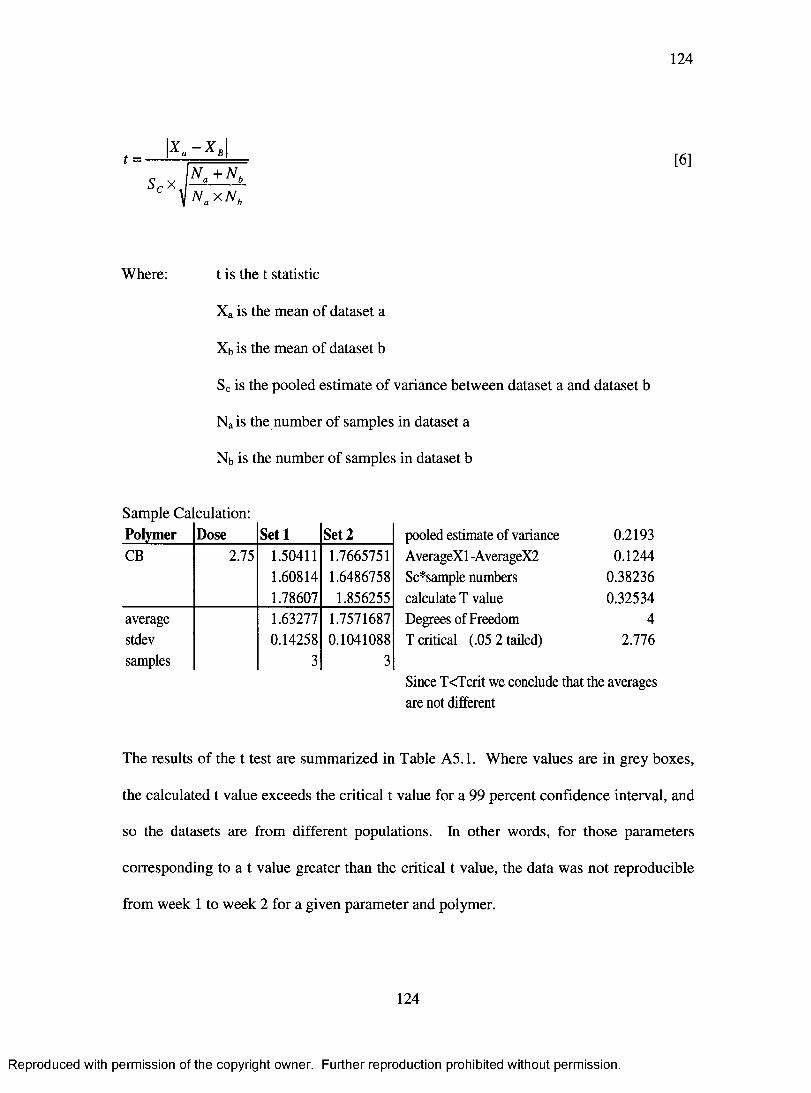
124
.\x-zLN a + N h
S ^ x bN„ x N.
[6]
Where: t is the t statistic
Xa is the mean of dataset a
Xb is the mean of dataset b
Sc is the pooled estimate of variance between dataset a and dataset b
Na is the number of samples in dataset a
Nb is the number of samples in dataset b
Sample Ca Polymer
culation:Dose Set 1 Set 2 pooled estimate of variance 0.2193
CB 2.75 1.50411 1.7665751 AverageXl -AverageX2 0.12441.60814 1.6486758 Sc*sample numbers 0.382361.78607 1.856255 calculate T value 0.32534
average 1.63277 1.7571687 Degrees of Freedom 4stdev 0.14258 0.1041088 T critical (.05 2 tailed) 2.776samples 3 3
Since T<Tcrit we conclude that the averages are not different
The results of the t test are summarized in Table A5.1. Where values are in grey boxes,
the calculated t value exceeds the critical t value for a 99 percent confidence interval, and
so the datasets are from different populations. In other words, for those parameters
corresponding to a t value greater than the critical t value, the data was not reproducible
from week 1 to week 2 for a given parameter and polymer.
124
Reproduced with permission of the copyright owner. Further reproduction prohibited without permission.

125
Table A5.1 - Summary of Paired T Test ResultsT Test Summary - Thickened Sludge
Parameter Polymer Dose (g dry polymer/kg sludge solids)
T critical (.95)
T Critical (.99)
TCalculated
% Solid CB4450 2.75 2.78 4.60 0.333.65 2.78 4.60 2.424.55 2.78 4.60 1.115.45 2.78 4.60 0.296.35 2.78 4.60 0.437.25 2.78 4.60 0.94
SNF4290 1.85 2.78 4.60 0.032.75 2.78 4.60 1.413.65 2.78 4.60 1.014.55 2.78 4.60 3.135.45 2.78 4.60 2.376.35 2.78 4.60 1.15
EC4925 2.75 2.78 4.60 2.803.65 2.78 4.60 2.614.55 2.78 4.60 2.105.45 2.78 4.60 0.646.35 2.78 4.60 3.06
TotalPhosphorous
CB4450 2.75 2.78 4.60
9*
3.65 2.78 4.60 1.544.55 2.78 4.60 3.465.45 2.78 4.60 3.956.35 2.78 4.60 0.667.25 2.78 4.60 0.35
SNF4290 1.85 2.78 4.60 4.142.75 2.78 4.60 2.743.65 2.78 4.60 0.584.55 2.78 4.60 0.235.45 2.78 4.60 4.386.35 2.78 4.60 2.85
EC4925 2.75 2.78 4.60 63.583.65 2.78 4.60 4.66 14.55 2.78 4.60 * 0 4 15.45 2.78 4.606.35 2.78 4.60
TKN CB4450 2.75 2.78 4.60 0.843.65 2.78 4.60 2.204.55 2.78 4.60 2.455.45 2.78 4.60 0.966.35 2.78 4.607.25 2.78 4.60 2.30
SNF4290 1.85 2.78 4.60 f | 3 |2.75 2.78 4.60 3.65
125
Reproduced with permission of the copyright owner. Further reproduction prohibited without permission.

126
3.65 2.78 4.60 2.824.55 2.78 4.60 0.905.45 2.78 4.60 3.316.35 2.78 4.60 2.24
EC4925 2.75 2.78 4.603.65 2.78 4.60 4.22 ]4.55 2.78 4.60 24.855.45 2.78 4.60 4.956.35 2.78 4.60 2.51
T Test Summary - FiltrateParameter Polymer Dose (g dry polymer/kg
sludge solids)T critical
(.95)T Critical
(.99)T
Calculated% Solid CB4450 2.75 2.78 4.60 1.41
3.65 2.78 4.60 0.154.55 2.78 4.60 0.035.45 2.78 4.60 0.336.35 2.78 4.60 0.127.25 2.78 4.60 0.06
SNF4290 1.85 2.78 4.60 1.512.75 2.78 4.60 0.613.65 2.78 4.60 0.074.55 2.78 4.60 0.255.45 2.78 4.60 0.306.35 2.78 4.60 0.15
EC4925 2.75 2.78 4.60 0.493.65 2.78 4.60 0.244.55 2.78 4.60 0.315.45 2.78 4.60 0.016.35 2.78 4.60 0.23
SS CB4450 2.75 2.78 4.60 12.213.65 2.78 4.60 9.084.55 2.78 4.60 3.32 15.45 2.78 4.606.35 2.78 4.60 0.547.25 2.78 4.60 7.89
SNF4290 1.85 2.78 4.60 2.392.75 2.78 4.60 _ _3.65 2.78 4.604.55 2.78 4.60 13.235.45 2.78 4.60 0.586.35 2.78 4.60 2.48
EC4925 2.75 2.78 4.60 1.043.65 2.78 4.60 8.214.55 2.78 4.60 32.125.45 2.78 4.60 1.946.35 2.78 4.60 0.60
TotalPhosphorous
CB4450 2.75 2.78 4.600.97
3.65 2.78 4.60 2.704.55 2.78 4.60 1.695.45 2.78 4.60 2.456.35 2.78 4.60 0.927.25 2.78 4.60 1.48
SNF4290 1.85 2.78 4.60 N/A
126
Reproduced with permission of the copyright owner. Further reproduction prohibited without permission.

127
2.75 2.78 4.60 6.93 13.65 2.78 4.60 0.674.55 2.78 4.60 3.225.45 2.78 4.60 1.546.35 2.78 4.60 0.09
EC4925 2.75 2.78 4.60 0.273.65 2.78 4.60 0.544.55 2.78 4.60 0.545.45 2.78 4.60 0.456.35 2.78 4.60 1.20
Ammonia CB4450 2.75 2.78 4.60 N/A3.65 2.78 4.60 3.774.55 2.78 4.60 3.115.45 2.78 4.60 2.886.35 2.78 4.60 0.027.25 2.78 4.60 0.23
SNF4290 1.85 2.78 4.60 N/A2.75 2.78 4.60 1.413.65 2.78 4.60 0.044.55 2.78 4.60 0.095.45 2.78 4.60 0.246.35 2.78 4.60 0.04
EC4925 2.75 2.78 4.60 1.373.65 2.78 4.60 0.024.55 2.78 4.60 0.535.45 2.78 4.60 0.046.35 2.78 4.60 0.18
127
Reproduced with permission of the copyright owner. Further reproduction prohibited without permission.

128
Appendix 6 - Polymer Selection Using Standard Scores
In this appendix, an alternate method of selecting polymers for full-scale testing is
presented. During bench-scale polymer testing, it became necessary to develop a
decision-making methodology for selecting polymers for full-scale trials, as the polymers
were evaluated at bench-scale with respect to a wide variety of parameters. The
parameters listed in Table 3.1 were weighted according to a prioritization of polymer
performance. The values obtained in the testing were then converted to z-scores, (i.e.
normalized). By multiplying the z-score for each polymer in each test by the relative
weight of that parameter, and adding those figures together for each polymer, the relative
performance of each polymer can be evaluated. Furthermore, polymer performance with
respect to both the thickened solids produced and the filtrate could be combined into one
value. In this case, the data from all polymers for a given parameter is averaged, and the
standard deviation is computed. Then, the value for any one parameter may be converted
to a z-score using the following formula:
[7]
z is the value of the standardized z-score, in units of standard deviation
x is the value of the raw data point
p is the sample mean of the raw data
a is the sample standard deviation of the raw data
128
x - u z - — —
Where:
Reproduced with permission of the copyright owner. Further reproduction prohibited without permission.

129
In practice, the relative weights of the parameters may be varied to reflect different
priorities, and the best polymer with respect to a given weighting scheme may be
determined. For example, the weighting scheme shown in Table A6.1 may be used. In
this example, each parameter is weighted separately, and the weights for each the solid
phase and the liquid phase add up to one. Because it is desirable to have thickened
sludge relatively high in the parameters listed below and filtrate relatively low in the
parameters listed below, it is necessary to multiply the z-scores generated from the filtrate
data by negative one before adding them together. To combine the results from solid
phase and liquid phase testing, each total is weighted and added together. In this case,
the solid phase data is given double the weight of the liquid phase data. Once the data is
added up, the resulting scores represent a weighted average of the z-scores for the
combined dataset. These averages may be above or below zero, so for analysis purposes,
an arbitrary value may be added to all values, in order to make all numbers positive.
Table A6.1 - Hypothetical W eighting Scheme for Polym er SelectionPhase Parameter Parameter Weight Phase Weight
Thickened Sludge Total Solids 0.4
Total Volatile Solids 0.1
TKN 0.2
Total Phosphorus 0.2
Total BOD 0.1
TOTAL 1.0 0.67
Filtrate Total Solids 0.1
Turbidity 0.1
TKN 0.2
Ammonia 0.3
Total Phosphorous 0.3
TOTAL 1.0 0.33
129
Reproduced with permission of the copyright owner. Further reproduction prohibited without permission.

130
Using the weighting scheme presented in Table A6.1 to analyze the actual bench-scale
polymer data, the data in Table A6.2 are generated. These data represent combined
weighted averages of the standardized z-scores, with an arbitrary value of 2 added to
make all numbers positive. Because negative signs have been removed, higher numbers
represent desirable polymer performance.
Table A6.2 - Summary of Combined Z-scores from Bench Scale Polymer TestingPolymer Thickened Sludge Filtrate Total
CB 4450 2 . 2 2 0.63 1.69CIBA 7557 2.24 1.15 1 . 8 8
SNF4140 2 . 0 1 1.37 1.80SNF 4290 2.07 1.58 1.90CIBA 8160 1.96 2.28 2.07EC 4925 2.30 2.24 2.28JC 49 2.82 2.17 2.60JC 473 2.52 2.23 2.42
In this example, polymers JC 49 and JC 473 appear to be the most desirable polymers,
while polymer CB 4450 is the least desirable. Ultimately, this weighting scheme would
lead one to make a poor choice of polymer for the thickening application at Crystal
Beach WWTP. Polymers JC 49 and JC 473 produced thickened sludge with a total solids
content of less than 2 percent. This method of polymer selection proved less effective
than the simpler approach described in Section 4.1.4.
130
Reproduced with permission of the copyright owner. Further reproduction prohibited without permission.

131
Appendix 7 - Comparison of Bench Scale and Full Scale
Polymer Testing
In this section, the polymer testing results from bench scale testing are compared to
results from full scale testing. Although full scale testing was performed over a range of
dosages of polymer and bench scale was performed at only one dose, a dosage of 4.5
grams of dry polymer per kilogram sludge solids was used during both phases. Figures
A7.1 to A7.6 show the results.
CB 4450
Polymer (4.5 g dry polymer/kg sludge solids)
■ Bench Scale (n=2) ■ Full Scale (n=3)
Figure A7.1- Thickened Sludge Percent Total Solids
131
Reproduced with permission of the copyright owner. Further reproduction prohibited without permission.

132
1 2 0 0
^ 1000 - d)Eto 8003O| 600 -Q.(0£ 400 -0.
£ 200 - I-
0 -
■ Bench Scale (n=2) ■ Full Scale (n=3)
Figure A7.2 - Total Phosphorous Content of Thickened Sludge
^ 4000O)I , 3500* 3000 co> 2500 o2 2000
■ 1500 2“ • 1000
2 500o h0
CB 4450
Polymer (4.5 g polymer/kg sludge solids)
■ Bench Scale (n=2) ■ Full Scale (n=3)
Figure A7.3 - TKN Content of Thickened Sludge
132
Reproduced with permission of the copyright owner. Further reproduction prohibited without permission.
CB 4450
Polymer (4.5 dry polymer/kg sludge solids)

133
Figures A7.1, A7.2 and A7.3 show the percent total solids, total phosphorous content,
and TKN content of thickened sludge. The total solids data reveal that the bench scale
testing allowed accurate prediction of full scale results for the two trial polymers (SNF
4290 and EC 4925), as in both cases, bench scale percent solids data are no more than
one quarter of a percentage point different than the full scale percent solids data. In the
case of the incumbent polymer (CB 4450), the results are about one and a half percentage
points apart. In the case of the incumbent polymer, bench scale testing underestimated
the percent total solids achieved at full-scale.
The total phosphorous content of thickened sludge that was measured at bench scale was
a relatively good predictor of the levels found at full-scale for polymer EC 4925, (within
approximately 5 percent). For the other polymers, the correlation is much weaker.
Sludge thickened using polymer SNF 4290 was about 20 percent higher in total
phosphorous at bench scale than at full scale. Sludge thickened using polymer CB 4450
was about 60 percent lower in total phosphorous at bench scale than at full scale. The
TKN data show that for both SNF 4290 and EC 4925, thickened sludge was about 25
percent higher in TKN at bench scale than at full scale.
133
Reproduced with permission of the copyright owner. Further reproduction prohibited without permission.

Tota
l Ph
osph
orou
s (m
g/L)
Pe
rcen
t To
tal
Solid
s
134
0.07 -r
0.06 -
0.05 -
0.04 -
0.03 -
0.02 -
0.01 -
0 -CB 4450
Polymer (4.5 g polymer/kg sludge solids)
■ Bench Scale (n=2) ■ Full Scale (n=3)
Figure A7.4 - Filtrate Percent Total Solids
14
12
10
8
6
4
2
0CB 4450
Polymer (4.5 g polymer/kg sludge solids)
■ Bench Scale ■ Full Scale
Figure A7.5 - Filtrate Total Phosphorous Concentration
Reproduced with permission of the copyright owner. Further reproduction prohibited without permission.
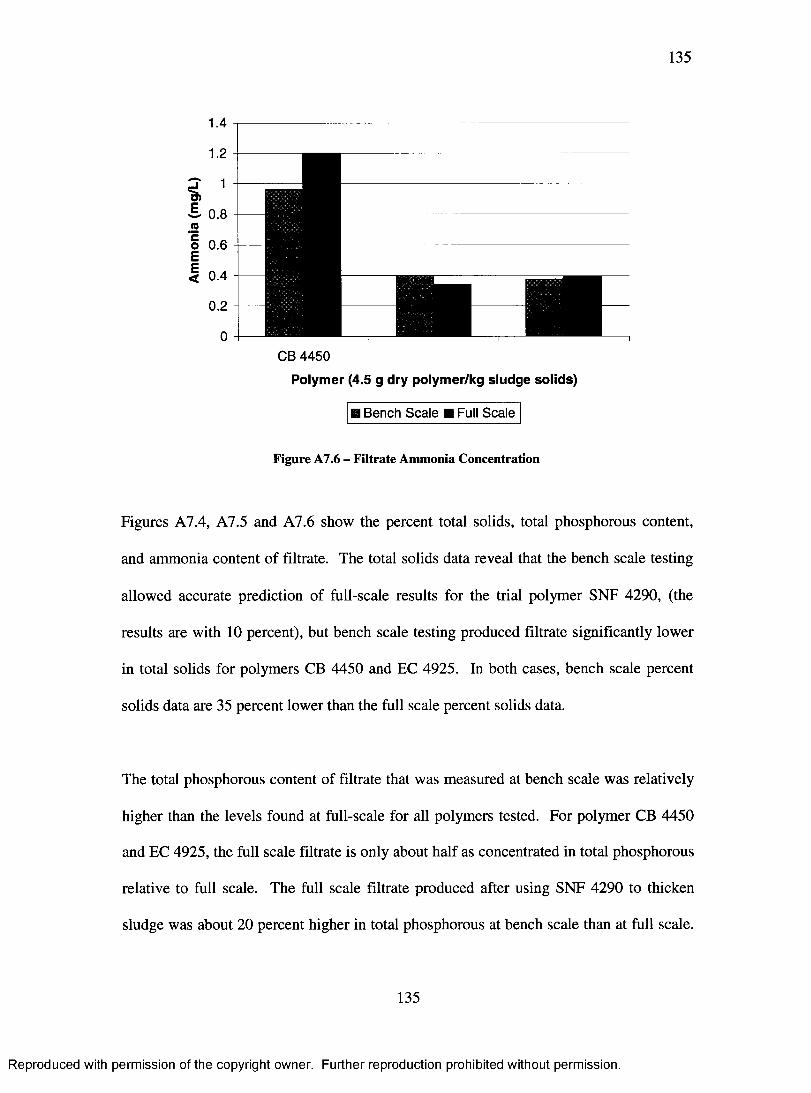
135
CB 4450
Polymer (4.5 g dry polymer/kg sludge solids)
■ Bench Scale ■ Full Scale
Figure A7.6 - Filtrate Ammonia Concentration
Figures A7.4, A7.5 and A7.6 show the percent total solids, total phosphorous content,
and ammonia content of filtrate. The total solids data reveal that the bench scale testing
allowed accurate prediction of full-scale results for the trial polymer SNF 4290, (the
results are with 10 percent), but bench scale testing produced filtrate significantly lower
in total solids for polymers CB 4450 and EC 4925. In both cases, bench scale percent
solids data are 35 percent lower than the full scale percent solids data.
The total phosphorous content of filtrate that was measured at bench scale was relatively
higher than the levels found at full-scale for all polymers tested. For polymer CB 4450
and EC 4925, the full scale filtrate is only about half as concentrated in total phosphorous
relative to full scale. The full scale filtrate produced after using SNF 4290 to thicken
sludge was about 20 percent higher in total phosphorous at bench scale than at full scale.
135
Reproduced with permission of the copyright owner. Further reproduction prohibited without permission.

136
Filtrate produced after using polymers SNF 4290 and EC 4925 at bench scale was very
close in ammonia content to filtrate produced at full scale. Polymer CB 4450 produced
filtrate at bench scale about 20 percent lower in ammonia relative to filtrate produced at
full-scale.
In general, the bench scale research that was performed did not indicate that bench scale
results were a uniformly accurate predictor of full scale results. In some cases however,
(when examining sludge total solids, sludge total phosphorous, and filtrate ammonia),
bench scale testing does approximate the relative differences between polymer types
observed at full scale. The goal of the bench scale research was to identify polymers that
were relatively effective when compared to other polymer types. The differences
between bench scale and full scale results may be due to the fact that Phase 2 bench scale
testing could not be designed to exactly match the full scale loading and timing of the full
scale GBT. Because the scale of the bench scale apparatus was much smaller than the
full scale GBT, it was difficult to obtain sufficiently sized samples for accurate
measurement of the various physical and chemical parameters included in this study, and
so the loading rate of pre-thickened sludge on the bench scale apparatus was significantly
higher than on the full scale GBT. During Phase 3 bench scale testing, when the dosage
range for subsequent full scale testing was determined, the loading rate and retention time
of the full scale GBT was simulated, but the sample sizes of thickened sludge and filtrate
were too small to perform the number of tests performed in Phase 2 bench scale testing
and full scale testing. In the future, a study designed to accurately predict the
composition of sludge thickened at full scale from sludge thickened at bench scale would
136
Reproduced with permission of the copyright owner. Further reproduction prohibited without permission.

137
require a bench scale apparatus that can simulate the full scale application, while
providing samples of sufficient size to allow multiple physical and/or chemical tests to
take place.
137
Reproduced with permission of the copyright owner. Further reproduction prohibited without permission.

138
Appendix 8 - Tabulated Data
A8.1 Bench Scale Polymer Testing
Table A8.1 - Polymer Solution Oxidation-Reduction Potential Data
PolymerCB4450
CIBA7557
CIBA7587
CIBA8180
CIBA8160
JC49
JC60
JC473
SNF4550
SNF4140
210 208 217 215 270 269 260 246 250 237224 222 227 226 270 267 264 241 246 243240 232 238 232 268 261 268 254 226 246197 210 210 192 269 265 255 236 232 246224 224 227 226 266 259 253 257 241 253241 240 237 235 266 259 252 266 244 245
Average 223 223 226 221 268 263 259 250 240 245Std Deviation 17 12 11 16 2 4 6 11 9 5
PolymerSNF4190
SNF4240
SNF4210
SNF4290
SNF4700
SNF4800
EC483
EC4800
EC4900
EC4925
192 197 205 214 218 223 221 223 265 265209 217 223 221 228 232 230 232 260 259218 219 223 221 230 232 235 231 270 264218 219 225 223 233 227 205 210 264 266212 217 224 222 238 239 232 232 275 277221 225 232 230 235 230 238 239 266 279
Average 212 216 222 222 230 231 227 228 267 268Std Deviation 11 10 9 5 7 5 12 10 5 8
Table A8.2 - Bench Scale Thickened Sludge Data
Polymer Trial
TotalSolids(%) TVS (%)
BOD(mg/kg)
TKN(mg/kg)
NH3-N(mg/kg)
Total P (mg/kg)
CB 44501 4.28 29.85 13378 1150 20 4402 4.64 34.98 N/A 1810 20 600
CIBA 75571 5.43 26.68 22033 2270 20 7302 4.32 34.56 N/A 1390 20 570
SNF 41401 4.05 29.39 14078 1900 20 6302 2.70 29.36 13847 1470 20 470
SNF 42901 4.40 29.37 20941 3390 20 11202 4.75 26.20 24967 3350 20 1050
CIBA 81601 5.63 32.64 10398 3250 22 6202 4.80 29.76 12685 3190 23 750
EC 49251 4.94 32.62 11621 3450 20 8802 5.22 25.75 11161 3190 20 940
JC49 1 0.80 30.74 10244 510 20 1702 0.91 28.87 10022 510 20 170
Reproduced with permission of the copyright owner. Further reproduction prohibited without permission.

139
3 0.69 44.42 N/A N/A N/A N/A
JC473
1 1.47 25.39 10689 860 20 2702 1.53 27.44 8244 830 20 2603 3.17 31.93 N/A N/A N/A N/A
Control
1 1.30 28.56 N/A 1000 21 3002 1.31 31.11 N/A 890 20 2803 0.85 28.03 N/A 760 20 3204 1.33 29.41 N/A 510 20 1705 1.54 32.87 N/A 570 20 190
GBT
1 5.71 17.80 N/A 3290 70 11202 6.41 33.69 N/A 4140 N/A N/A3 6.36 29.82 N/A 3450 N/A N/A
Table A8.3 - Bench Scale Filtrate Data
Polymer TrialTotal Solids(%)
TKN(mg/L)
NH3-N(mg/L)
Total P (mg/L)
Turbidity(NTU)
CB 44501 0.05 5.17 1.1 1.02 4.42 0.02 5.96 0.81 1.34 2.3
CIBA 75571 0.06 5.48 0.64 1.01 6.32 0.00 4.91 0.71 1 2.1
SNF 41401 0.07 2.97 0.57 0.55 2.62 0.06 2.34 0.11 0.5 3.3
SNF 42901 0.05 3.03 0.64 0.48 1.92 0.06 2.86 0.15 0.55 5.0
CIBA 81601 0.06 3.29 0.49 1.26 3.22 0.02 3.65 0.72 1.36 2.7
EC 49251 0.04 3.4 0.23 1.42 1.32 0.05 3.63 0.52 1.47 2.0
JC49
1 0.05 9.75 0.16 3.09 51.82 0.03 8.54 N/A 2.69 53.23 0.02 N/A N/A N/A 7.1
JC473
1 0.04 3.16 0.15 0.62 3.72 0.02 4.66 N/A 1.27 29.73 0.03 N/A N/A N/A 3.1
Control
1 0.06 11 0.78 3.38 48.42 0.05 7.24 0.04 2.34 32.53 0.05 5.36 0.04 2.05 29.4
GBT1 0.04 6.83 0.08 3.16 6.42 0.04 N/A N/A N/A N/A
Reproduced with permission of the copyright owner. Further reproduction prohibited without permission.

140
Table A8.4 - Bench Scale Polymer Dosage Testing - Sludge Total SolidsParameterPolymer
Total Solids (%) CB4450
Dosage 0 . 0 0 3.75 4.38 5.00 5.63Trial 1 0.57 5.10 5.43 4.57 2.15Trial 2 0.68 4.65 5.11 4.61 2.08Trial 3 0.60 4.61 5.25 4.46 2.15Average 0.61 4.79 5.26 4.54 2.13Std. Deviation 0.06 0.27 0.16 0.08 0.04ParameterPolymer
Total Solids (%) SNF4290
Dosage 0 . 0 0 3.75 4.38 5.00 5.63Trial 1 0.78 4.88 5.65 5.22 2.12Trial 2 0.46 5.12 6.12 4.87 3.55Trial 3 N/A 5.09 5.51 5.03 1.53Average 0.62 5.03 5.76 5.04 2.40Std. Deviation 0.23 0.13 0.32 0.18 1.04ParameterPolymer
Total Solids (%) EC4925
Dosage 0 . 0 0 3.75 4.38 5.00 5.63Trial 1 0.83 5.08 5.27 2.84 2.89Trial 2 0.68 4.64 5.42 5.28 3.67Trial 3 0.84 5.60 5.15 2.89 3.03Average 0.78 5.11 5.28 3.67 3.19Std. Deviation 0.09 0.48 0.14 1.39 0.42
140
Reproduced with permission of the copyright owner. Further reproduction prohibited without permission.

141
Table A8.5 - Bench Scale Polymer Dosage Testing - Sludge TKN ConcentrationParameterPolymer
TKN (mg/kg sludge) CB4450
Dosage 0 . 0 0 3.75 4.38 5.00 5.63Trial 1 445 2230 2870 2430 1250Trial 2 406 2590 2590 2310 1250Average 426 2410 2730 2370 1250Std. Deviation 28 255 198 85 0ParameterPolymer
TKN (mg/kg sludge) SNF4290
Dosage 0 . 0 0 3.75 4.38 5.00 5.63Trial 1 438 843 1680 1200 1080Trial 2 289 909 779 740 1730Average 364 876 1230 970 1405Std. Deviation 105 47 637 325 460ParameterPolymer
TKN (mg/kg sludge) EC4925
Dosage 0 . 0 0 3.75 4.38 5.00 5.63Trial 1 775 2250 2890 2100 1670Trial 2 806 2880 2760 1940 405Average 791 2565 2825 2020 1038Std. Deviation 22 445 92 113 894
141
Reproduced with permission of the copyright owner. Further reproduction prohibited without permission.

142
Table A8.6 - Bench Scale Polymer Dosage Testing - Sludge Total PhosphorousConcentration
ParameterPolymer
P (mg/kg sludge) CB4450
Dosage 0 . 0 0 3.75 4.38 5.00 5.63Trial 1 144 733 940 791 415Trial 2 125 857 838 741 405Average 135 795 889 766 410Std. Deviation 13 88 72 35 7ParameterPolymer
P (mg/kg sludge) SNF4290
Dosage 0 . 0 0 3.75 4.38 5.00 5.63Trial 1 156 288 580 455 403Trial 2 103 317 269 249 609Average 130 303 425 352 506Std. Deviation 37 21 220 146 146ParameterPolymer
P (mg/kg sludge) EC4925
Dosage 0 . 0 0 3.75 4.38 5.00 5.63Trial 1 190 907 830 756 505Trial 2 142 722 920 766 470Average 166 815 875 761 488Std. Deviation 34 131 64 7 25
142
Reproduced with permission of the copyright owner. Further reproduction prohibited without permission.

143
Table A8.7 - Bench Scale Polymer Dosage Testing - Filtrate Total SolidsParameterPolymer
Total Solids (%) CB4450
Dosage 0 . 0 0 3.75 4.38 5.00 5.63Trial 1 0.14 0.08 0.05 0.04 0.04Trial 2 0.24 0.06 0.05 0.03 0.01Trial 3 0.12 0.06 0.05 0.03 0.03Average 0.17 0.06 0.05 0.03 0.03Std. Deviation 0.06 0.01 0.00 0.01 0.01ParameterPolymer
Total Solids (%) SNF4290
Dosage 0 . 0 0 3.75 4.38 5.00 5.63Trial 1 0.14 0.07 0.06 0.04 0.04Trial 2 0.27 0.07 0.08 0.06 0.04Trial 3 N/A 0.07 0.03 0.03 0.03Average 0.20 0.07 0.06 0.04 0.04Std. Deviation 0.09 0.00 0.03 0.02 0.01ParameterPolymer
Total Solids (%) EC4925
Dosage 0 . 0 0 3.75 4.38 5.00 5.63Trial 1 0.11 0.02 0.03 0.03 0.06Trial 2 0.11 0.04 0.03 0.06 0.05Trial 3 0.11 0.03 0.03 0.05 0.06Average 0.11 0.03 0.03 0.05 0.05Std. Deviation 0.00 0.01 0.00 0.02 0.00
143
Reproduced with permission of the copyright owner. Further reproduction prohibited without permission.

144
Table A8.8 - Bench Scale Polymer Dosage Testing - Filtrate TurbidityParameterPolymer
Turbidity (NTU) CB4450
Dosage 2.25 3 3.75 4.5 5.25 6Trial 1 102 8 2 2 4 12Trial 2 89 9 2 3 5 9Trial 3 87 10 2 2 4 11Average 92.7 9.0 2.0 2.1 4.2 11.1Std. Deviation 8.1 0.8 0.2 0.4 0.3 1.5ParameterPolymer
Turbidity (NTU) SNF4290
Dosage 2.25 3 3.75 4.5 5.25 6Trial 1 N/A 108 8 2 3 9Trial 2 N/A 92 7 2 3 12Trial 3 N/A 87 6 2 7 23Average N/A 95.7 7.0 1.9 4.1 14.6Std. Deviation N/A 11.0 0.8 0.3 2.2 7.5ParameterPolymer
Turbidity (NTU) EC4925
Dosage 2.25 3 3.75 4.5 5.25 6Trial 1 142 43 3 1 2 13Trial 2 112 22 3 2 4 14Trial 3 134 34 4 2 4 21Average 129.3 33.0 3.3 1.7 3.5 15.8Std. Deviation 15.5 10.5 0.7 0.5 1.0 4.7
144
Reproduced with permission of the copyright owner. Further reproduction prohibited without permission.

145
Table A8.9 - Bench Scale Polymer Dosage Testing - Filtrate Ammonia ConcentrationParameterPolymer
NH3 (mg/L filtrate) CB4450
Dosage 0 . 0 0 3.75 4.38 5.00 5.63Trial 1 0.27 0.09 0.15 0.70 0.91Trial 2 0.88 0.41 0.62 1.42 1.10Average 0.58 0.25 0.39 1.06 1.01Std. Deviation 0.43 0.23 0.33 0.51 0.13ParameterPolymer
NH3 (mg/L filtrate) SNF4290
Dosage 0 . 0 0 3.75 4.38 5.00 5.63Trial 1 0.66 0.17 0.27 0.48 0.77Trial 2 1.40 0.30 0.46 0.55 0.65Average 1.03 0.24 0.37 0.52 0.71Std. Deviation 0.52 0.09 0.13 0.05 0.08ParameterPolymer
NH3 (mg/L filtrate) EC4925
Dosage 0 . 0 0 3.75 4.38 5.00 5.63Trial 1 0.22 1.27 1.50 2.62 2.86Trial 2 0.23 1.21 1.39 2.89 2.74Average 0.23 1.24 1.45 2.76 2.80Std. Deviation 0.01 0.04 0.08 0.19 0.08
145
Reproduced with permission of the copyright owner. Further reproduction prohibited without permission.

146
Table A8.10 - Bench Scale Polymer Dosage Testing - Filtrate Total PhosphorousConcentration
ParameterPolymer
P (mg/L filtrate) CB4450
Dosage 0 . 0 0 3.75 4.38 5.00 5.63Trial 1 28.90 0.23 0.60 0.27 0.41Trial 2 46.80 0.20 0.13 0.51 0.44Average 37.85 0.22 0.37 0.39 0.43Std. Deviation 12.66 0.02 0.33 0.17 0.02ParameterPolymer
P (mg/L filtrate) SNF4290
Dosage 0 . 0 0 3.75 4.38 5.00 5.63Trial 1 25.30 7.00 5.30 4.45 2.22Trial 2 >50 8.60 9.70 5.30 2.25Average N/A 7.80 7.50 4.88 2.24Std. Deviation N/A 1.13 3.11 0.60 0.02ParameterPolymer
P (mg/L filtrate) EC4925
Dosage 0 . 0 0 3.75 4.38 5.00 5.63Trial 1 13.80 0.44 0.75 0.99 1.53Trial 2 28.30 0.47 0.71 1.04 1.55Average 21.05 0.46 0.73 1.02 1.54Std. Deviation 10.25 0.02 0.03 0.04 0.01
Table A8.ll - Bench Scale Polymer Dosage Testing - Filtrate Total BOD ConcentrationParameter tBOD5 (mg/L)
Dosage 0 . 0 0 3.75 4.38 5.00 5.63CB 4450 N/A 357 355 91 334SNF 4290 N/A 339 293 162 317EC 4925 N/A 394 261 150 83
Reproduced with permission of the copyright owner. Further reproduction prohibited without permission.

147
A8.2 Full Scale Polymer Testing
Table A8.12 - Full Scale Thickened Sludge Data - Total SolidsParameter Total Solids (%) Polymer CB4450
Dosage 1.85 2.75 3.65 4.55 5.45 6.35 7.25Week 1 Trial 1
Trial 2 Trial 3
N/A 1.50 5.47 5.70 5.62 6.91 6.44N/A 1.61 5.29 5.70 5.56 5.79 5.99N/A 1.79 5.82 5.78 5.95 6.21 5.78
Week 2 Trial 1 Trial 2 Trial 3
N/A 1.77 4.10 5.90 5.65 5.70 5.44N/A 1.65 4.49 6.01 5.24 6.27 5.20N/A 1.86 4.08 6.05 5.81 5.95 5.84
Average 1.69 4.87 5.85 5.64 6.14 5.78Standard deviation 0.13 0.75 0.16 0.24 0.44 0.43Parameter Total Solids (%) Polymer SNF4290
Dosage 1.85 2.75 3.65 4.55 5.45 6.35 7.25Week 1 Trial 1
Trial 2 Trial 3
1.06 4.38 4.83 5.68 6.12 6.29 N/A1.21 4.57 4.48 5.43 6.30 6.46 N/A0.97 4.57 4.65 5.75 6.71 6.05 N/A
Week 2 Trial 1 Trial 2 Trial 3
1.16 3.85 4.23 4.20 4.84 5.23 N/A1.07 4.18 4.32 4.55 5.21 5.80 N/A1.04 4.02 4.13 4.04 5.10 6.01 N/A
Average 1.09 4.26 4.44 4.94 5.71 5.97Standard deviation 0.08 0.30 0.26 0.77 0.76 0.43Parameter Total Solids (%) Polymer EC4925
Dosage 1.85 2.75 3.65 4.55 5.45 6.35 7.25Week 1 Trial 1
Trial 2 Trial 3
3.52 3.97 4.56 4.77 5.01 5.24 N/A4.09 3.97 4.11 4.57 4.68 5.55 N/A3.38 4.08 4.52 4.42 5.11 5.44 N/A
Week 2 Trial 1 Trial 2 Trial 3
N/A 4.72 5.67 5.66 4.88 4.10 4.59N/A 4.87 5.72 5.39 4.19 3.84 5.04N/A 4.62 5.68 5.43 4.74 4.38 4.81
Average 3.66 4.37 5.04 5.04 4.77 4.76 4.81Standard deviation 0.38 0.41 0.73 0.52 0.32 0.74 0.22
147
Reproduced with permission of the copyright owner. Further reproduction prohibited without permission.

148
Table A8.13 - Full Scale Thickened Sludge Data - TKN ConcentrationParameter TKN (mg/kg sludge) Polymer CB4450
Dosage 1.85 2.75 3.65 4.55 5.45 6.35 7.25Week 1 Trial 1
Trial 2 Trial 3
N/A 1060 2860 3420 3470 3280 3030N/A 900 2930 3280 3370 3060 2940N/A 960 3480 3150 3250 3160 3270
Week 2 Trial 1 Trial 2 Trial 3
N/A 970 2890 3480 3200 2680 3150N/A 960 2470 3320 3600 2960 3220N/A 1080 2930 3540 3800 2880 2600
Average 990 2927 3365 3448 3003 3035Standard deviation 68 323 143 226 213 245Parameter TKN (mg/kg sludge) Polymer SNF4290
Dosage 1.85 2.75 3.65 4.55 5.45 6.35 7.25Week 1 Trial 1
Trial 2 Trial 3
2030 2230 2850 2200 2680 2030 N/A1880 1940 2380 2420 2830 1880 N/A1950 2060 2210 2300 2610 1950 N/A
Week 2 Trial 1 Trial 2 Trial 3
2520 3140 2690 2519 2080 2210 N/A2380 2910 2890 3190 2240 2070 N/A2350 2440 2600 2090 2520 2920 N/A
Average 2185 2453 2603 2453 2493 2177Standard deviation 264 479 267 392 282 381.0337Parameter TKN (mg/kg sludge) Polymer EC4925
Dosage 1.85 2.75 3.65 4.55 5.45 6.35 7.25Week 1 Trial 1
Trial 2 Trial 3
620 2410 2770 3280 3430 3500 N/A570 2840 2610 3190 3060 3170 N/A630 2600 2510 3190 3640 3780 N/A
Week 2 Trial 1 Trial 2 Trial 3
N/A 590 2250 2250 2120 2680 3150N/A 600 2270 2250 2780 2960 3220N/A 520 2470 2130 2340 2880 2600
Average 606 1592 2480 2715 2895 3162 2990Standard deviation 29 1131 200 556 598 412 340
148
Reproduced with permission of the copyright owner. Further reproduction prohibited without permission.
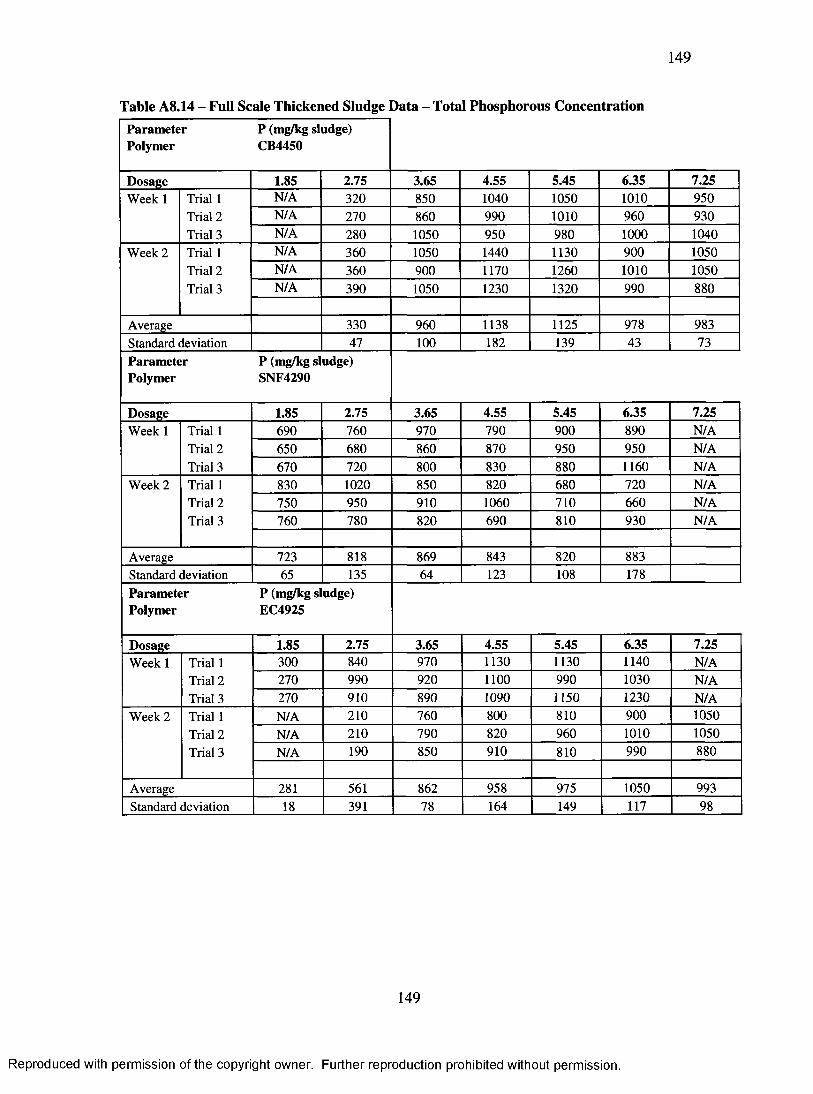
149
Table A8.14 - Full Scale Thickened Sludge Data - Total Phosphorous ConcentrationParameter P (mg/kg sludge) Polymer CB4450
Dosage 1.85 2.75 3.65 4.55 5.45 6.35 7.25Week 1 Trial 1
Trial 2 Trial 3
N/A 320 850 1040 1050 1010 950N/A 270 860 990 1010 960 930N/A 280 1050 950 980 1000 1040
Week 2 Trial 1 Trial 2 Trial 3
N/A 360 1050 1440 1130 900 1050N/A 360 900 1170 1260 1010 1050N/A 390 1050 1230 1320 990 880
Average 330 960 1138 1125 978 983Standard deviation 47 100 182 139 43 73Parameter P (mg/kg sludge) Polymer SNF4290
Dosage 1.85 2.75 3.65 4.55 5.45 6.35 7.25Week 1 Trial 1
Trial 2 Trial 3
690 760 970 790 900 890 N/A650 680 860 870 950 950 N/A670 720 800 830 880 1160 N/A
Week 2 Trial 1 Trial 2 Trial 3
830 1020 850 820 680 720 N/A750 950 910 1060 710 660 N/A760 780 820 690 810 930 N/A
Average 723 818 869 843 820 883Standard deviation 65 135 64 123 108 178Parameter P (mg/kg sludge) Polymer EC4925
Dosage 1.85 2.75 3.65 4.55 5.45 6.35 7.25Week 1 Trial 1
Trial 2 Trial 3
300 840 970 1130 1130 1140 N/A270 990 920 1100 990 1030 N/A270 910 890 1090 1150 1230 N/A
Week 2 Trial 1 Trial 2 Trial 3
N/A 210 760 800 810 900 1050N/A 210 790 820 960 1010 1050N/A 190 850 910 810 990 880
Average 281 561 862 958 975 1050 993Standard deviation 18 391 78 164 149 117 98
149
Reproduced with permission of the copyright owner. Further reproduction prohibited without permission.

150
Table A8.15 - Full Scale Filtrate Data - Percent Total SolidsParameter Total Solids (%) Polymer CB4450
Dosage 1.85 2.75 3.65 4.55 5.45 6.35 7.25Week 1 Trial 1
Trial 2 Trial 3
N/A 0.37 0.06 0.08 0.04 0.08 0.05N/A 0.45 0.04 0.07 0.01 0.07 0.06N/A 0.40 0.05 0.02 0.03 0.07 0.06
Week 2 Trial 1 Trial 2 Trial 3
N/A 0.10 0.07 0.06 0.06 0.06 0.07N/A 0.12 0.05 0.07 0.06 0.06 0.06N/A 0.11 0.08 0.06 0.06 0.07 0.06
Average 0.26 0.06 0.06 0.04 0.07 0.06Standard deviation 0.16 0.01 0.02 0.02 0.01 0.01Parameter Total Solids (%) Polymer SNF4290
Dosage 1.85 2.75 3.65 4.55 5.45 6.35 7.25Week 1 Trial 1
Trial 2 Trial 3
0.23 0.07 0.05 0.06 0.02 0.04 N/A0.27 0.07 0.07 0.05 0.04 0.03 N/A0.23 0.07 0.07 0.06 0.02 0.05 N/A
Week 2 Trial 1 Trial 2 Trial 3
0.44 0.10 0.06 0.04 0.06 0.05 N/A0.54 0.10 0.07 0.03 0.06 0.06 N/A0.47 0.10 0.04 0.06 0.06 0.06 N/A
Average 0.36 0.08 0.06 0.05 0.04 0.05Standard deviation 0.13 0.01 0.01 0.01 0.02 0.01Parameter Total Solids (%) Polymer EC4925
Dosage 1.85 2.75 3.65 4.55 5.45 6.35 7.25Week 1 Trial 1
Trial 2 Trial 3
0.06 0.06 0.05 0.07 0.06 0.06 N/A0.08 0.06 0.07 0.07 0.06 0.07 N/A0.08 0.06 0.06 0.07 0.06 0.06 N/A
Week 2 Trial 1 Trial 2 Trial 3
N/A 0.06 0.03 0.06 0.05 0.06 0.04N/A 0.01 0.05 0.06 0.07 0.06 0.06N/A 0.04 0.04 0.06 0.06 0.05 0.06
Average 0.07 0.05 0.05 0.07 0.06 0.06 0.06Standard deviation 0.01 0.02 0.02 0.01 0.01 0.01 0.01
150
Reproduced with permission of the copyright owner. Further reproduction prohibited without permission.

151
Table A8.16 - Full Scale Filtrate Data - Suspended Solids ConcentrationParameter SS (mg/L nitrate) Polymer CB4450
Dosage 1.85 2.75 3.65 4.55 5.45 6.35 7.25Week 1 Trial 1
Trial 2 Trial 3
N/A 2450 234 168 106 154 102N/A 3364 228 264 114 162 84N/A 3596 232 216 148 212 96
Week 2 Trial 1 Trial 2 Trial 3
N/A 2628 176 108 158 162 250N/A 2688 152 182 156 200 216N/A 2572 168 122 166 186 196
Average 2883 198 177 141 179 157Standard deviation 475 37 58 25 24 72Parameter SS (mg/L filtrate) Polymer SNF4290
Dosage 1.85 2.75 3.65 4.55 5.45 6.35 7.25Week 1 Trial 1
Trial 2 Trial 3
1894 152 266 130 156 124 N/A2064 164 212 68 92 210 N/A1928 160 198 70 138 166 N/A
Week 2 Trial 1 Trial 2 Trial 3
2178 308 232 182 132 198 N/A2296 358 196 174 120 164 N/A2010 264 206 186 122 162 N/A
Average 2062 234 218 135 127 171Standard deviation 153 88 27 55 21 30Parameter SS (mg/L filtrate) Polymer EC4925
Dosage 1.85 2.75 3.65 4.55 5.45 6.35 7.25Week 1 Trial 1
Trial 2 Trial 3
1252 140 80 98 126 172 N/A1274 130 100 112 120 154 N/A1276 124 106 96 104 200 N/A
Week 2 Trial 1 Trial 2 Trial 3
N/A 208 94 180 370 336 182N/A 142 94 156 350 234 138N/A 202 76 180 350 198 192
Average 1267 158 92 137 237 216 171Standard deviation 13 37 12 40 132 65 29
151
Reproduced with permission of the copyright owner. Further reproduction prohibited without permission.

152
Table A8.17 - Full Scale Filtrate Data - TurbidityParameter Turbidity (NTU) Polymer CB4450
Dosage 1.85 2.75 3.65 4.55 5.45 6.35 7.25Week 1 Trial 1
Trial 2 Trial 3
N/A >1000 179 78 40 26 53N/A >1000 154 91 46 40 48N/A >1000 208 90 53 42 53
Week 2 Trial 1 Trial 2 Trial 3
N/A >1000 98 87 46 44 82N/A >1000 105 83 43 35 88N/A N/A N/A N/A N/A N/A N/A
Average >1000 149 86 46 38 65Standard deviation N/A 47 5 5 7 19Parameter Turbidity (NTU) Polymer SNF4290
Dosage 1.85 2.75 3.65 4.55 5.45 6.35 7.25Week 1 Trial 1
Trial 2 Trial 3
>1000 107 81 43 27 15 N/A>1000 92 87 47 23 24 N/A>1000 104 63 46 17 23 N/A
Week 2 Trial 1 Trial 2 Trial 3
>1000 222 58 38 39 21 N/A>1000 175 49 36 42 26 N/AN/A N/A N/A N/A N/A 26 N/A
Average >1000 140 68 42 30 22Standard deviation N/A 56 16 5 11 4Parameter Turbidity (NTU) Polymer EC4925
Dosage 1.85 2.75 3.65 4.55 5.45 6.35 7.25Week 1 Trial 1
Trial 2 Trial 3
236 135 51 33 53 83 N/A250 162 44 34 51 76 N/A264 150 44 21 45 66 N/A
Week 2 Trial 1 Trial 2 Trial 3
N/A 108 55 22 42 43 69N/A 104 41 22 52 66 89N/A 113 30 22 47 50 45
Average 250 129 44 26 48 64 68Standard deviation 14 24 9 6 4 15 18
152
Reproduced with permission of the copyright owner. Further reproduction prohibited without permission.

153
Table A8.18 - Full Scale Filtrate Data - Total PhosphorusParameter P (mg/L filtrate) Polymer CB4450
Dosage 1.85 2.75 3.65 4.55 5.45 6.35 7.25Week 1 Trial 1
Trial 2 Trial 3
N/A 16.5 4.7 5 4.1 4.9 6.2N/A 10.8 4.6 6.1 5 7.9 4N/A 9.9 4.8 5.4 5.1 3.9 4.8
Week 2 Trial 1 Trial 2 Trial 3
N/A 15.7 5.4 8.2 8.3 8.6 5.5N/A 15.2 7.7 6.2 8.5 3.8 7.1N/A 12.5 7.6 6.9 5.8 12 8.3
Average 13.4 5.8 6.3 6.1 6.9 6.0Standard deviation 2.8 1.5 1.1 1.8 3.2 1.6Parameter P (mg/L filtrate) Polymer SNF4290
Dosage 1.85 2.75 3.65 4.55 5.45 6.35 7.25Week 1 Trial 1
Trial 2 Trial 3
>30.0 2.7 6.4 3.3 3.2 4.6 N/A>30.0 4.1 5.9 2.9 2.9 7.6 N/A>30.0 4.7 4.5 3.3 3.7 4.6 N/A
Week 2 Trial 1 Trial 2 Trial 3
>30.0 10.6 6.3 5.6 5.4 4.6 N/A>30.0 11.2 6.1 4.8 5.6 5.4 N/A>30.0 11.1 6.4 4.6 3.3 7.2 N/A
Average >30.0 7.4 5.9 4.1 4.0 5.7Standard deviation N/A 4.0 0.7 1.1 1.2 1.4Parameter P (mg/L filtrate) Polymer EC4925
Dosage 1.85 2.75 3.65 4.55 5.45 6.35 7.25Week 1 Trial 1
Trial 2 Trial 3
7.8 3.8 3.8 6.1 3 4.1 N/A8.9 4.3 3.5 2.7 4.5 4.2 N/A9.4 4.8 3.7 2.6 6.1 4.5 N/A
Week 2 Trial 1 Trial 2 Trial 3
N/A 4.1 3.7 2.9 4 3.4 3.6N/A 4.5 3.1 2.9 4.2 4.3 3.8N/A 4.9 3.5 3.3 3.7 2.9 4.9
Average 8.7 4.4 3.6 3.4 4.3 3.9 4.1Standard deviation 0.8 0.4 0.3 1.3 1.0 0.6 0.7
153
Reproduced with permission of the copyright owner. Further reproduction prohibited without permission.

154
Table A8.19 - Full Scale Filtrate Data - AmmoniaParameter NH3 (mg/L filtrate) Polymer CB4450
Dosage 1.85 2.75 3.65 4.55 5.45 6.35 7.25Week 1 Trial 1
Trial 2 Trial 3
N/A >3.00 1.78 1.67 1.31 0.55 0.54N/A >3.00 1.59 1.82 1.46 0.43 0.68N/A >3.00 1.67 1.92 1.57 0.39 0.61
Week 2 Trial 1 Trial 2 Trial 3
N/A 1.62 0.60 0.28 0.36 0.51 0.65N/A 1.81 0.50 0.70 0.41 0.43 0.5N/A 1.29 0.34 0.80 0.44 0.41 0.49
Average N/A 1.08 1.20 0.93 0.45 0.58Standard deviation N/A 0.67 0.69 0.58 0.06 0.08Parameter NH3 (mg/L filtrate) Polymer SNF4290
Dosage 1.85 2.75 3.65 4.55 5.45 6.35 7.25Week 1 Trial 1
Trial 2 Trial 3
>3.00 0.40 0.67 0.35 0.36 0.46 N/A>3.00 0.53 0.55 0.27 0.29 0.34 N/A>3.00 0.50 0.52 0.36 0.31 0.45 N/A
Week 2 Trial 1 Trial 2 Trial 3
>3.00 0.94 0.57 0.34 0.43 0.47 N/A>3.00 0.95 0.57 0.41 0.31 0.45 N/A>3.00 0.70 0.63 0.29 0.36 0.48 N/A
Average >3.00 0.67 0.59 0.34 0.34 0.44Standard deviation N/A 0.23 0.06 0.05 0.05 0.05Parameter NH3 (mg/L filtrate) Polymer EC4925
Dosage 1.85 2.75 3.65 4.55 5.45 6.35 7.25Week 1 Trial 1
Trial 2 Trial 3
0.89 0.25 0.35 0.37 0.43 0.46 N/A1.28 0.21 0.35 0.36 0.41 0.47 N/A0.80 0.29 0.39 0.35 0.46 0.51 N/A
Week 2 Trial 1 Trial 2 Trial 3
N/A 0.50 0.36 0.41 0.45 0.49 0.61N/A 0.64 0.39 0.40 0.42 0.50 0.61N/A 0.46 0.35 0.43 0.45 0.54 0.59
Average 0.99 0.39 0.37 0.39 0.44 0.50 0.60Standard deviation 0.26 0.17 0.02 0.03 0.02 0.03 0.01
154
Reproduced with permission of the copyright owner. Further reproduction prohibited without permission.

155
A8.3 E. coli Enumeration Data
Table A8.20 - E. coli Concentration Measured at Crystal Beach WWTP
ParameterE. coli Concentration (cfu/100 mL)
Sample Location Aeration Foam Clarifier Foam Clarifier EffluentTrial 1 15531000 7270000 130000Trial 2 24200000 14136000 155300Trial 3 29875000 8400000 147000Average 23202000 9935333 144100Std. deviation 7223890 3681498 12897
A7.4 Process Data from Crystal Beach WWTP
Table A8.21 - Solid Retention Time Observed at Crystal Beach WWTP 2006Date SRT F/M Date SRT F/M Date SRT F/M Date SRT F/M1-Jan 6.31 31-Mar 4.47 29-Jun 2.43 27-Sep 3.992-Jan 12.65 1-Apr 5.33 30-Jun 4.71 28-Sep 1.243-Jan 13.48 0.13 2-Apr 4.67 0.80 1-Jul 3.59 29-Sep 2.284-Jan 10.21 3-Apr 5.76 2-Jul 1.26 30-Sep 2.355-Jan 15.78 4-Apr 5.64 3-Jul 3.00 0.39 1 -Oct 3.34 0.246 -Jan 5.94 5-Apr 9.95 4-Jul 3.39 2-Oct 6.887-Jan 6.32 6 -Apr 8.92 5-Jul 2.36 3-Oct 3.108 -Jan 8.11 7-Apr 5.49 6 -Jul 4.81 4-Oct 6.069-Jan 3.29 0.46 8 -Apr 4.77 7-Jul 4.66 5-Oct 3.4410-Jan 9.30 9-Apr 4.51 8 -Jul 4.31 6 -Oct 2.1111-Jan 21.01 10-Apr 7.35 0.31 9-Jul 3.34 0.31 7-Oct 3.651 2 -Jan 7.82 11-Apr 10.45 10-Jul 3.51 8 -Oct 2.5313-Jan 4.79 12-Apr 4.54 11-Jul 3.66 9-Oct 55.4514-Jan 4.38 13-Apr 6.82 12-Jul 2.10 10-Oct 4.9615-Jan 11.72 14-Apr 2.91 13-Jul 2.88 1 1 -Oct 1.3016-Jan 9.19 15-Apr 3.69 14-Jul 3.37 12-Oct 0.83 0.1817-Jan 5.61 0.64 16-Apr 3.49 15-Jul 3.43 13-Oct 1.1518-Jan 8.08 17-Apr 6.62 16-Jul 15.82 14-Oct 1.1119-Jan 5.04 18-Apr 3.69 17-Jul 3.94 0.23 15-Oct 1.122 0 -Jan 11.05 19-Apr 3.16 18-Jul 4.43 16-Oct 1.5821-Jan 10.31 20-Apr 8.24 19-Jul 3.79 17-Oct 1.52 0.8022-Jan 6.22 21-Apr 7.35 20-Jul 2.88 18-Oct 1.1723-Jan 10.87 0.11 22-Apr 3.76 21-Jul 1.25 19-Oct 5.5124-Jan 17.08 23-Apr 2.61 22-Jul 2.40 20-Oct 2.8925-Jan 3.89 24-Apr 6.90 0.58 23-Jul 5.02 0.35 21-Oct 5.8826-Jan 11.89 25-Apr 6.18 24-Jul 4.01 22-Oct 1.8827-Jan 16.89 26-Apr 6.25 25-JuI 8.30 23-Oct 0.97
155
Reproduced with permission of the copyright owner. Further reproduction prohibited without permission.

156
28-Jan 12.37 27-Apr 4.29 26-Jul 6.54 24-Oct 4.4229-Jan 11.60 28-Apr 4.53 27-Jul 5.92 25-Oct 3.71 0.6230-Jan 2.82 29-Apr 6.31 28-Jul 2.42 26-Oct 4.3431-Jan 4.55 0.52 30-Apr 6.31 0.15 29-Jul 2.64 27-Oct 2.831-Feb 8.25 1-May 5.22 30-Jul 3.03 28-Oct 1.242-Feb 47.37 2-May 4.31 31-Jul 3.32 0.56 29-Oct 1.423-Feb 11.18 3-May 5.01 1-Aug 3.17 30-Oct 2.36 0.274-Feb 9.81 4-May 4.11 2-Aug 3.37 31-Oct 3.255-Feb 4.83 5-May 5.14 3-Aug 3.05 1-Nov 2.316-Feb 8.11 0.49 6-May 4.63 4-Aug 2.36 2-Nov 3.087-Feb 5.47 7-May 3.19 5-Aug 3.57 3-Nov 5.588-Feb 4.83 8-May 3.47 0.14 6-Aug 3.83 4-Nov 3.909-Feb 3.63 9-May 5.95 7-Aug 4.59 0.33 5-Nov 2.1710-Feb 4.37 10-May 4.17 8-Aug 5.08 6-Nov 3.9211-Feb 9.04 11-May 2.93 9-Aug 3.53 7-Nov 5.44 0.2712-Feb 3.75 12-May 2.05 10-Aug 2.94 8-Nov 5.0313-Feb 5.19 13-May 2.82 11-Aug 4.41 9-Nov 0.9914-Feb 9.42 0.21 14-May 15.53 0.19 12-Aug 4.50 10-Nov 2.0615-Feb 6.20 15-May 10.11 13-Aug 3.18 11-Nov 4.2416-Feb 8.24 16-May 4.43 14-Aug 4.21 0.35 12-Nov 2.4717-Feb 6.94 17-May 1.52 15-Aug 5.65 13-Nov 1.57 0.3918-Feb 9.53 18-May 5.58 16-Aug 5.05 14-Nov 3.0019-Feb 14.08 19-May 6.39 17-Aug 3.14 15-Nov 2.4720-Feb 8.96 20-May 3.82 18-Aug 3.27 16-Nov 1.2221-Feb 12.41 21-May 3.82 19-Aug 2.82 17-Nov 0.8422-Feb 5.41 22-May 4.19 0.28 20-Aug 2.91 0.38 18-Nov 2.3123-Feb 7.12 0.44 23-May 8.11 21-Aug 2.28 19-Nov 6.0524-Feb 8.09 24-May 5.17 22-Aug 2.69 20-Nov 3.0825-Feb 10.02 25-May 5.51 23-Aug 3.34 21-Nov 3.24 0.3826-Feb 4.76 26-May 5.71 24-Aug 5.26 22-Nov 2.8627-Feb 6.12 27-May 3.44 25-Aug 3.71 23-Nov 5.2028-Feb 11.28 0.39 28-May 3.57 0.26 26-Aug 3.47 24-Nov 4.1829-Feb 7.43 29-May 3.84 27-Aug 2.50 25-Nov 8.741-Mar 6.92 30-May 7.58 28-Aug 2.21 0.44 26-Nov 6.092-Mar 11.27 31-May 3.44 29-Aug 2.79 27-Nov 2.27 0.113-Mar 7.62 1-Jun 2.79 30-Aug 2.03 28-Nov 2.264-Mar 14.93 2-Jun 5.53 31-Aug 2.35 29-Nov 3.205-Mar 4.48 0.85 3-Jun 19.23 1-Sep 3.04 30-Nov 6.426-Mar 6.45 4-Jun 5.03 2-Sep 4.38 1-Dec 1.917-Mar 3.36 5-Jun 2.82 0.18 3-Sep 1.59 2-Dec 0.318-Mar 2.31 6-Jun 4.84 4-Sep 0.48 0.35 3-Dec 3.689-Mar 2.07 7-Jun 4.91 5-Sep 2.63 4-Dec 9.4210-Mar 5.27 8-Jun 1.67 6-Sep 2.32 0.46 5-Dec 10.93 0.1711-Mar 8.82 9-Jun 3.21 7-Sep 2.87 6-Dec 10.6212-Mar 3.87 10-Jun 3.69 8-Sep 3.87 7-Dec 7.1313-Mar 4.57 1.25 11-Jun 2.90 0.21 9-Sep 3.44 8-Dec 3.5614-Mar 2.74 12-Jun 4.74 10-Sep 3.70 9-Dec 20.8515-Mar 6.30 13-Jun 2.61 11-Sep 2.81 10-Dec 2.90
156
Reproduced with permission of the copyright owner. Further reproduction prohibited without permission.

157
16-Mar 5.35 14-Jun 3.90 0.21 12-Sep 2.85 11-Dec 13.4817-Mar 4.83 15-Jun 2.23 13-Sep 1.67 12-Dec 14.43 0.1918-Mar 6.33 16-Jun 3.63 14-Sep 2.59 13-Dec 6.1319-Mar 8.97 0.66 17-Jun 4.13 15-Sep 3.24 14-Dec 3.6920-Mar 7.92 18-Jun 0.34 16-Sep 3.21 15-Dec 3.6121-Mar 2.91 19-Jun 3.72 0.30 17-Sep 2.71 16-Dec 2.7722-Mar 2.51 20-Jun 3.63 18-Sep 1.02 0.69 17-Dec 5.1623-Mar 4.81 21-Jun 5.30 19-Sep 1.60 18-Dec 5.5424-Mar 7.79 22-Jun 5.53 20-Sep 2.00 19-Dec 7.1025-Mar 6.72 23-Jun 7.09 21-Sep 7.12 20-Dec 4.23 0.3726-Mar 2.73 24-Jun 8.70 22-Sep 4.96 21-Dec 3.6727-Mar 7.11 0.76 25-Jun 7.92 0.30 23-Sep 2.19 22-Dec 5.3428-Mar 3.29 26-Jun 3.32 24-Sep 0.80 0.23 23-Dec 3.4129-Mar 5.37 27-Jun 3.90 25-Sep 4.89 24-Dec 3.8930-Mar 12.37 28-Jun 6.61 26-Sep 3.33
Table A7.22 - Dissolved Oxygen Concentration Observed at Crystal Beach WWTP December 2006
Date DO Concentration11-Dec 7.012-Dec 6.513-Dec 6.714-Dec 6.515-Dec 7.016-Dec 6.717-Dec 5.918-Dec 6.619-Dec 6.420-Dec 6.421-Dec 7.622-Dec 7.623-Dec 7.124-Dec 6.825-Dec 8.026-Dec 7.827-Dec 7.828-Dec 7.429-Dec 6.630-Dec 8.031-Dec 7.8
Average 7.1Maximum 8.0Minimum 5.9
157
Reproduced with permission of the copyright owner. Further reproduction prohibited without permission.