solomon islands: tax summary and statistical appendix · international monetary fund solomon...
TRANSCRIPT
© 2007 International Monetary Fund September 2007 IMF Country Report No. 07/303
Solomon Islands: Tax Summary and Statistical Appendix This Tax Summary and Statistical Appendix paper for the Solomon Islands was prepared by a staff team of the International Monetary Fund as background documentation for the periodic consultation with the member country. It is based on the information available at the time it was completed on July 2, 2007. The views expressed in this document are those of the staff team and do not necessarily reflect the views of the government of the Solomon Islands or the Executive Board of the IMF. The policy of publication of staff reports and other documents by the IMF allows for the deletion of market-sensitive information. To assist the IMF in evaluating the publication policy, reader comments are invited and may be sent by e-mail to [email protected].
Copies of this report are available to the public from
International Monetary Fund • Publication Services
700 19th Street, N.W. • Washington, D.C. 20431 Telephone: (202) 623-7430 • Telefax: (202) 623-7201
E-mail: [email protected] • Internet: http://www.imf.org
Price: $18.00 a copy
International Monetary Fund Washington, D.C.

INTERNATIONAL MONETARY FUND
SOLOMON ISLANDS
Tax Summary and Statistical Appendix
Prepared by Eric Sidgwick and Gilda Fernandez (both APD) and Michael Pedroni (FIN)
Approved by Asia and Pacific Department
July 2, 2007
Contents Page I. Tax Summary...............................................................................................................3 Statistical Tables 1. Summary of Real Sector Indicators, 2000–06 ...........................................................11 2. Real GDP Growth Rates by Sectoral Origin, 2000–06..............................................12 3. Honiara Retail Price Index, 2000–07.........................................................................13 4. Formal Employment, 2000–06 ..................................................................................14 5. Central Government Operations, 2001–06 ................................................................15 6. Central Government Revenue and Grants, 2001–06 .................................................16 7. Central Government Expenditure, 2001–06 ..............................................................17 8. Central Government Budget Financing, 2001–06 .....................................................18 9. Central Government Gross Domestic Debt, 2002–06 ...............................................19 10. Equity Investment of the Investment Corporation of Solomon Islands, 2002–06...................................................................................20 11. Summary Accounts of the Banking System, 2002–06 ..............................................21 12. Assets and Liabilities of the Central Bank of Solomon Islands, 2002–06.................22 13. Assets and Liabilities of Commercial Banks, 2002–06 .............................................23 14a. Commercial Bank Advances and Loans, 2002–07 ....................................................24 14b. Commercial Bank Advances and Loans, 2002–07 ....................................................25 15. Commercial Bank Interest Rates on Savings and Time Deposits, 2002–07..............26 16. Commercial Bank Interest Rates on Loans and Overdrafts, 2002–07.......................27 17. Assets and Liabilities of the National Provident Fund, 2002–06 ..............................28 18. Income Statement of the National Provident Fund, 2002–06....................................29 19. Assets and Liabilities of the Development Bank of Solomon Islands, 2002–06.......30 20. Income Statement of the Development Bank of Solomon Islands, 2002–06 ............31 21. Balance of Payments, 2000–06..................................................................................32
2
22. Trade Indicators, 2000–06 .........................................................................................33 23. Composition of Exports, 2000–06 .............................................................................34 24. Composition of Imports, 2000–06 .............................................................................35 25. Exports by Country of Destination, 2000–06 ............................................................36 26. Imports by Country of Origin, 2000–06 ....................................................................37 27. Services, Income, and Transfers, 2000–06 ................................................................38 28. Medium- and Long-Term Government External Debt and Disbursements, 2000–06 ...............................................................................39 29. Medium- and Long-Term External Government Debt-Service Payments, 2000–06........................................................................40 30. Medium- and Long-Term External Debt Indicators, 2000–06 ..................................41 31. Bilateral Exchange Rates, 2000–07 ...........................................................................42 32. Exchange Rate Indicators, 2000–07 ..........................................................................43
3
TAX SUMMARY1
I. DIRECT TAXES Taxation of Individuals Nature of Tax: Residents are taxed on their worldwide income. Nonresidents are taxed on income sourced from the Solomon Islands. The tax year is the calendar year. Chargeable Income is income according to ordinary concepts and includes income from business, employment, lease and rent, dividends, interest, discounts, pensions, charges, annuities, and alimony received. Income from employment includes wages, salaries, other cash allowances, benefits-in-kind, and any private expenditure either paid for or reimbursed by an employer. Certain costs borne by an employer are excluded from employment income, such as employee home passage, medical services, and contributions paid to an approved pension fund. Many types of income are subject to presumptive or final taxes. These, with few specific exceptions, include income from employment, dividends, and interest. As such with effect from January 1, 2006, most employees or those individuals not in business are not required to lodge income tax returns.
Resident Individuals Rates (in percent) Up to $15,000
$15,001–$30,000 $30,001–$60,000 $60,001 and up
11 23 35 40
Exemptions and deductions: Normal business expenses are deductible against chargeable income. A $7,800 personal exemption applies to both resident and nonresident individuals. This general exemption is subject to apportionment on a pro-rata basis should the individual commence work part way through the year. In addition, the first $5,000 of interest income on deposits made with any savings bank or on fixed deposit accounts with any bank in the Solomon Islands are excluded from chargeable income. Alimony payments are also deductible against chargeable income. Residents are able to claim foreign tax credits for any overseas income tax.
Taxation of Companies Nature of tax: Tax is payable on the worldwide income of a resident company, whereas a nonresident company is taxed on income accrued in or derived from the Solomon Islands.
1 As of June 2007.
4
The tax year is the calendar year, although any person may apply for a substituted accounting period. Companies incorporated in the Solomon Islands are residents. Resident companies are taxed at a flat rate of 30 percent, with nonresident companies being subject to a 35 percent tax rate. To prevent the double taxation of corporate profits, a deduction is allowed for any dividend paid where dividend withholding tax has been correctly deducted and remitted. The rate of dividend withholding tax for a resident company or individual shareholder is 20 percent with 30 percent applying to a nonresident or a resident body of persons other than a corporation. The withholding tax deducted is final for a nonresident, a resident body of persons other than a company, and a resident individual where the total amount of dividends, directors fees, and interest income for the year is less than $10,000. A provisional payment system for income tax applies to companies and businesses. Quarterly payments of taxes are made in the current year, based on the assessed income of the previous year. Such payments are credited against the tax for the year when the annual assessment is made. For those taxpayers in a loss situation, a turnover tax of 0.5 percent of gross income applies. The maximum of income tax payable for these taxpayers is $20,000. Exemptions and deductions: Both resident and nonresident investors undertaking commercial, economic, industrial or professional activity in the Solomon Islands may apply to the Commissioner of Inland Revenue for an exemption from income tax. Depending upon the type of enterprise, the tax holiday may be for periods ranging from three to ten years. Strict criteria apply, with the benefits and costs to the national interest of the country being the chief consideration. Where the original investor proposes additional investment to the value of $10,000,000 or more, and has satisfied the conditions stipulated in relation to the original investment, the Commissioner may grant a further tax holiday of up to five years. Rural community developments with investment of $5,000,000 or more may also qualify for tax holiday. The Commissioner may also grant full or partial exemptions from income tax for certain activities:
• Tourist hotels, resorts and other tourist oriented projects (5 years); • Export projects (3 to 6 years); • Agricultural, forestry, animal husbandry and fisheries activities (profits for 5 of
10 years); • Factory construction (40 percent depreciation in year one, then 5 percent per year
thereafter); • 200 percent deduction for costs of higher education courses (local and overseas) and
apprentices at the Solomon Islands College of Higher Education; and • 150 percent deduction for inter-provincial transport costs of raw material and
qualifying products.
5
The Minister of Finance also has the discretion to exempt any income or class of income by way of Order. Statutory exemption from income tax applies to a range of government, quasi government, nonprofit, religious and sporting bodies.
Losses are able to be carried forward for five years and be set off against future profits if majority shareholding remains unchanged. Bond issues are exempt until the amount capitalized is distributed. Business license fees paid to provinces may be claimed as a deduction or treated as prepayments of income tax. Accelerated depreciation is provided for capital expenditure in timber and mining operations, while certain expenditures on agricultural development, including for coconuts, palm oil, and cocoa, can be written off in full in the year they are incurred. Social Security Contributions Nature of tax: Compulsory social security scheme for all public and private employees. A total of 7.5 percent of earnings is paid by the employer, and 5 percent by the employee. Capital Gains Tax None, except for business assets. Withholding Taxes Certain payments made to both resident and nonresident taxpayers are subject to withholding taxes. The list below specifies the nature of the payment subject to withholding tax. The payer is required to withhold the specified percentage of gross payment and forward such to the Commissioner on behalf of the payee. Depending on the circumstances of the taxpayer, the withholding tax may be deemed final or interim.

6
Rates (in percent) Companies incorporated in the Solomon Islands Other companies Residents: Income from contracting Royalties Fishing operations Lease of property Sale of marine products Stevedoring services Nonresidents: Interest Professional Services Royalties Income from contracting Income from ships and aircraft Insurance premiums Film rental Remuneration to pole and line or long-line fishermen Remuneration to Purse Seiner fishermen Lease income Interest paid overseas by a mining company Management services
30 35
7.5 10 10 10 10 15
15 20 15 7.5 5
15 5
10 15 15
As provided by the Minister 35
Dividend Taxes Rates (in percent) Residents Nonresidents
20 30
II. INDIRECT TAXES
Excise Duties Nature of tax: An excise duty is levied on plugs, twist, fig, stick, cake, and coarse cut tobacco, and on beer and cigarettes produced in Solomon Islands. Imported excisable goods pay import duties at the following specific rates:
Rates Beer
Tobacco Cigarettes
$4.00 per liter $40.00 per kg.
$0.185 per stick or $277.00 per kg for cigarettes containing tobacco with a tar content more than 16 milligrams per cigarette.

7
Goods Tax Nature of tax: Imposed and levied on the final wholesale price of goods that are produced domestically or imported, whether new or used. Manufacturers and wholesale merchants are required to register with the Inland Revenue and are obliged to calculate the tax payable, charge and collect the tax from customers, and pay the tax to the Inland Revenue Division each month. Nonregistered importers, or those that choose not to quote their registration on import documentation, pay Goods Tax before goods are cleared by Customs. The value for Goods Tax in these cases is 130 percent of the sum of the Cost-in-Freight Customs value and the Customs duty.
Rates Imported goods Locally manufactured goods Rice
15 10 5
Exemptions and deductions: Exemption from Goods Tax applies to the following goods.
• Drugs and medicine, and surgical tools; • Educational, scientific and religious goods, works of art and antiques; • Goods for use by governments, representatives of governments, and public
bodies; • Goods manufactured and sold by small businesses; • Containers; and • Miscellaneous: contraceptives, goods designed for use by disabled people,
secondhand goods, goods purchased for export, coffins, bird food, aquatic and marine food, coins, goods used as aids to manufacture, safety equipment, aircraft, buses, flags, awards, and fire equipment.
The Minister of Finance has by way of Order discretion to exempt specific goods from goods tax. Official guidelines have been released setting out the criteria for exemption applications. The guidelines approved by the Minister of Finance in June 2006 state that exemptions will be assessed on the benefits and costs to the national interest and requires that details of all exemptions granted be Gazetted. Both the Inland Revenue Division and Customs Division have established Exemption Committees to consider applications and provide advice to the Minister. Import Taxes Nature of tax: Levied at an ad valorem rate on the c.i.f. value of imports, although specific rates apply on alcoholic beverages, tobacco products, and fuel.
8
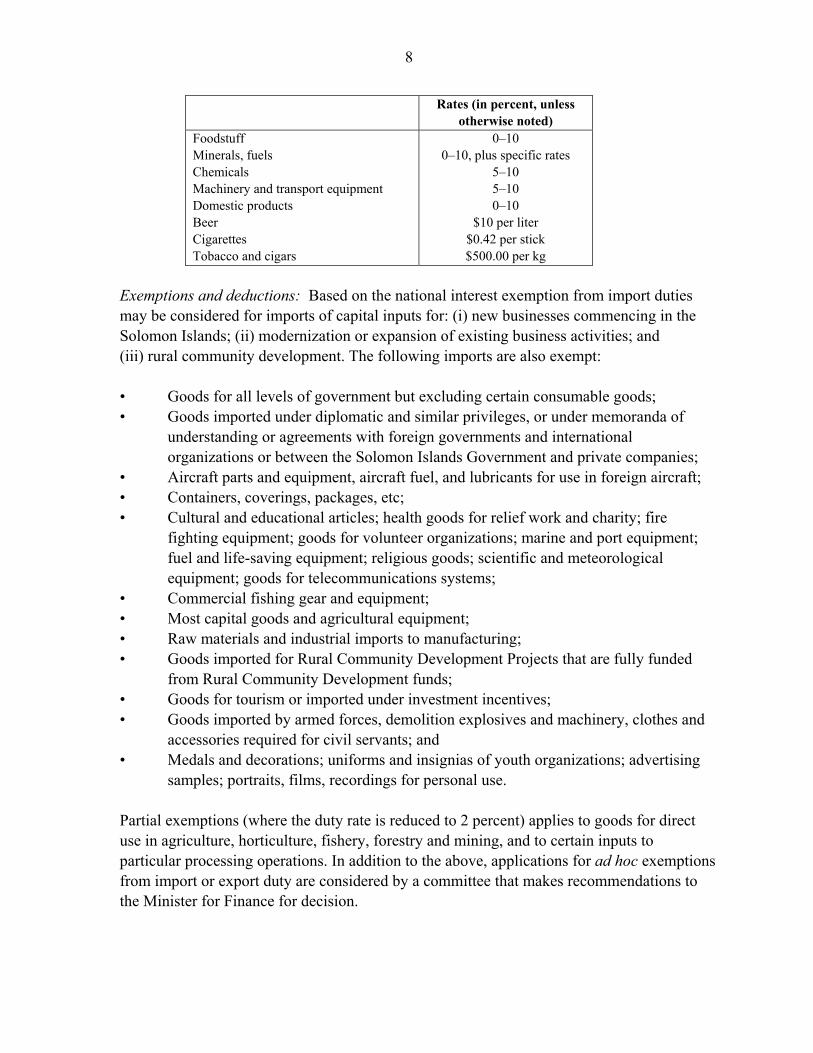
Rates (in percent, unless otherwise noted)
Foodstuff Minerals, fuels Chemicals Machinery and transport equipment Domestic products Beer Cigarettes Tobacco and cigars
0–10 0–10, plus specific rates
5–10 5–10 0–10
$10 per liter $0.42 per stick $500.00 per kg
Exemptions and deductions: Based on the national interest exemption from import duties may be considered for imports of capital inputs for: (i) new businesses commencing in the Solomon Islands; (ii) modernization or expansion of existing business activities; and (iii) rural community development. The following imports are also exempt: • Goods for all levels of government but excluding certain consumable goods; • Goods imported under diplomatic and similar privileges, or under memoranda of
understanding or agreements with foreign governments and international organizations or between the Solomon Islands Government and private companies;
• Aircraft parts and equipment, aircraft fuel, and lubricants for use in foreign aircraft; • Containers, coverings, packages, etc; • Cultural and educational articles; health goods for relief work and charity; fire
fighting equipment; goods for volunteer organizations; marine and port equipment; fuel and life-saving equipment; religious goods; scientific and meteorological equipment; goods for telecommunications systems;
• Commercial fishing gear and equipment; • Most capital goods and agricultural equipment; • Raw materials and industrial imports to manufacturing; • Goods imported for Rural Community Development Projects that are fully funded
from Rural Community Development funds; • Goods for tourism or imported under investment incentives; • Goods imported by armed forces, demolition explosives and machinery, clothes and
accessories required for civil servants; and • Medals and decorations; uniforms and insignias of youth organizations; advertising
samples; portraits, films, recordings for personal use. Partial exemptions (where the duty rate is reduced to 2 percent) applies to goods for direct use in agriculture, horticulture, fishery, forestry and mining, and to certain inputs to particular processing operations. In addition to the above, applications for ad hoc exemptions from import or export duty are considered by a committee that makes recommendations to the Minister for Finance for decision.

9
Sales Tax Nature of tax: A sales tax is levied at the retail level for specified services.
Rates (in percent, unless otherwise noted)
Local and overseas telecommunications Restaurant services Tickets for overseas travel Tickets for domestic air travel Tickets for domestic sea travel Hire of video Movie tickets Accounting, legal, and security services Motor vehicle rental Real estate agency services Professional services Petroleum and diesel Video equipment hires Computer equipment hires Hire of vessel and aircraft Hire of plant machinery and equipment Electronic repairs and equipment Hairdresser and barber shops including beauty parlors Casinos Laundry services Tire services
10 10
$10 $10 10
$2 per tape $0.50 per ticket
10 10 10 10
$0.1 per liter 10 10 10 10 10 10
$5 per entrance 10 10
Export Taxes Nature of tax: Levied only on various land and marine fauna shells, gold, metal scrap, logs and lumber, fish, and various agricultural products. The valuation base is the f.o.b. price or value of the export, except in the case of timber and some fish where the value for duty is a “determined value” adjustable from time to time. Exemptions and deductions: Spices, coconut, palm oil, canned fish, rice, some shells, copra, biscuits, beer, and manufactured tobacco. Exemptions for export taxes on logs are granted on a case-by-case basis. Recently, the Minister of Finance announced the revocation of some logging duty exemptions.

10
Rates (in percent, unless otherwise
noted) Trocus, green snail and black lip shells Gold Metal scrap—nonferrous Metal scrap Timber logs: If valued up to $500/m3
If valued between $550–850/m3 If valued more than $850/m3 Fresh, chilled, or frozen fish (some) Dried, salted, smoked or cooked fish Various other agricultural, forest, marine products
30 5
$1.5/metric ton 15
25 percent (of the determined value) $137.50 plus 40 percent of difference $257.50 plus 60 percent of difference
5 20
III. OTHER TAXES AND CHARGES
Business Licenses Nature of tax: Annual levy payable by retail traders at various rates. Other Licenses Nature of tax: Licenses on motor vehicles, driving permits, fishing vessels, work permits, and firearms.
Motor vehicles Driving license Dealer license Work permits application
Specific rates according to engine displacement and weight varying from $150 to $2,500 $75 $10,000 $200, and upon approval $500 for two years
Stamp Duties Nature of tax: Levied on agreements, insurance policies, bills of sales and exchange, promissory notes, and various property and title transfers. Some are ad valorem, some specific. The duty varies from $50 on any instrument, and between 2.0–4.0 percent depending on the value of property. Exemptions and deductions: Bills of exchange by any bank for government purposes.
11
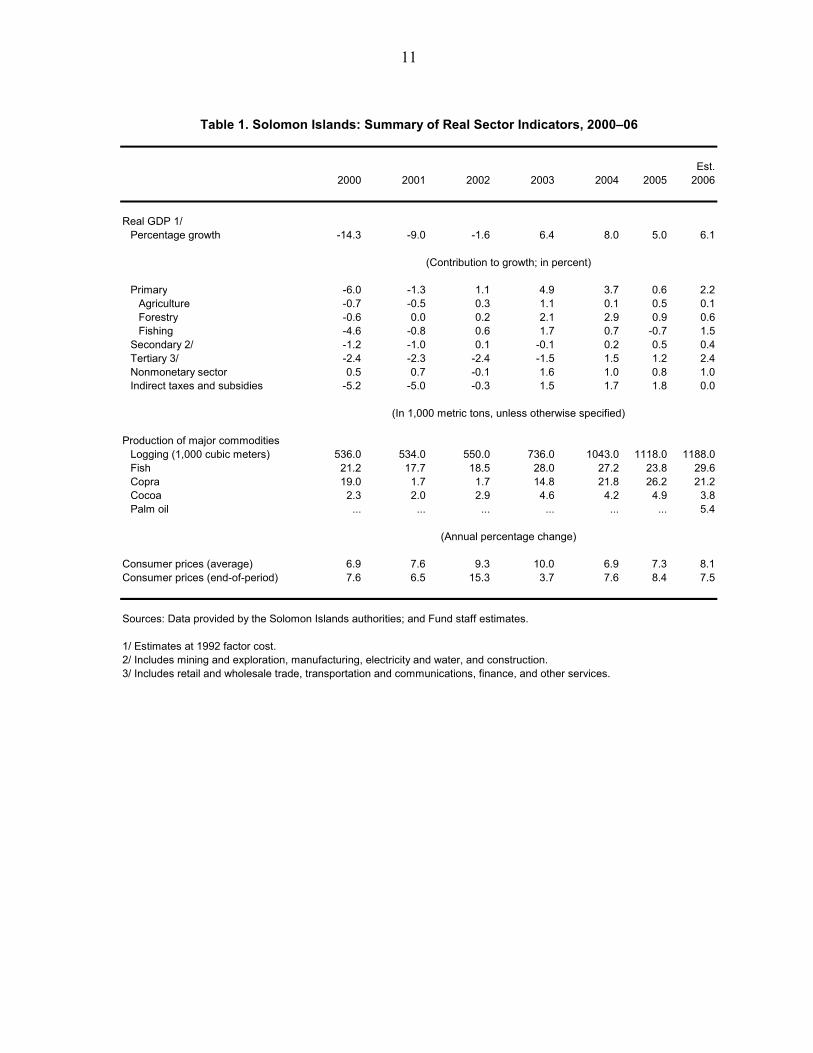
Est.2000 2001 2002 2003 2004 2005 2006
Real GDP 1/Percentage growth -14.3 -9.0 -1.6 6.4 8.0 5.0 6.1
Primary -6.0 -1.3 1.1 4.9 3.7 0.6 2.2Agriculture -0.7 -0.5 0.3 1.1 0.1 0.5 0.1Forestry -0.6 0.0 0.2 2.1 2.9 0.9 0.6Fishing -4.6 -0.8 0.6 1.7 0.7 -0.7 1.5
Secondary 2/ -1.2 -1.0 0.1 -0.1 0.2 0.5 0.4Tertiary 3/ -2.4 -2.3 -2.4 -1.5 1.5 1.2 2.4Nonmonetary sector 0.5 0.7 -0.1 1.6 1.0 0.8 1.0Indirect taxes and subsidies -5.2 -5.0 -0.3 1.5 1.7 1.8 0.0
Production of major commoditiesLogging (1,000 cubic meters) 536.0 534.0 550.0 736.0 1043.0 1118.0 1188.0Fish 21.2 17.7 18.5 28.0 27.2 23.8 29.6Copra 19.0 1.7 1.7 14.8 21.8 26.2 21.2Cocoa 2.3 2.0 2.9 4.6 4.2 4.9 3.8Palm oil ... ... ... ... ... ... 5.4
Consumer prices (average) 6.9 7.6 9.3 10.0 6.9 7.3 8.1Consumer prices (end-of-period) 7.6 6.5 15.3 3.7 7.6 8.4 7.5
Sources: Data provided by the Solomon Islands authorities; and Fund staff estimates.
1/ Estimates at 1992 factor cost.2/ Includes mining and exploration, manufacturing, electricity and water, and construction.3/ Includes retail and wholesale trade, transportation and communications, finance, and other services.
(Annual percentage change)
Table 1. Solomon Islands: Summary of Real Sector Indicators, 2000–06
(Contribution to growth; in percent)
(In 1,000 metric tons, unless otherwise specified)
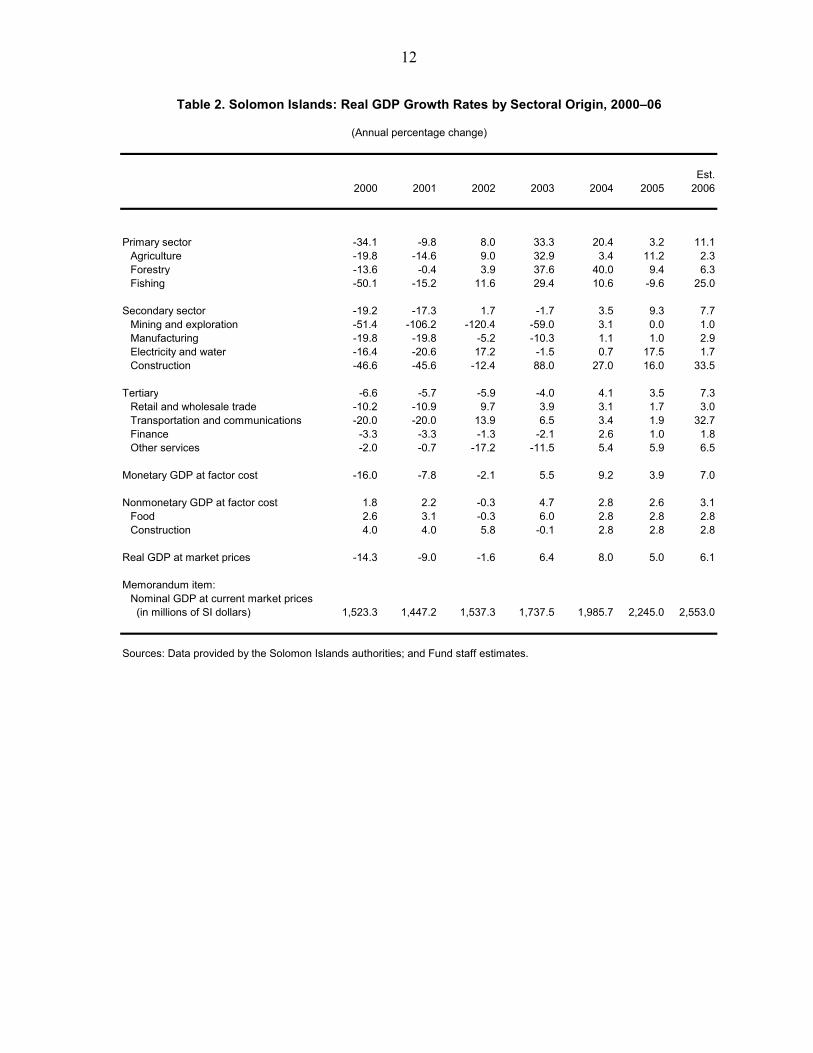
12
Est.2000 2001 2002 2003 2004 2005 2006
Primary sector -34.1 -9.8 8.0 33.3 20.4 3.2 11.1Agriculture -19.8 -14.6 9.0 32.9 3.4 11.2 2.3Forestry -13.6 -0.4 3.9 37.6 40.0 9.4 6.3Fishing -50.1 -15.2 11.6 29.4 10.6 -9.6 25.0
Secondary sector -19.2 -17.3 1.7 -1.7 3.5 9.3 7.7Mining and exploration -51.4 -106.2 -120.4 -59.0 3.1 0.0 1.0Manufacturing -19.8 -19.8 -5.2 -10.3 1.1 1.0 2.9Electricity and water -16.4 -20.6 17.2 -1.5 0.7 17.5 1.7Construction -46.6 -45.6 -12.4 88.0 27.0 16.0 33.5
Tertiary -6.6 -5.7 -5.9 -4.0 4.1 3.5 7.3Retail and wholesale trade -10.2 -10.9 9.7 3.9 3.1 1.7 3.0Transportation and communications -20.0 -20.0 13.9 6.5 3.4 1.9 32.7Finance -3.3 -3.3 -1.3 -2.1 2.6 1.0 1.8Other services -2.0 -0.7 -17.2 -11.5 5.4 5.9 6.5
Monetary GDP at factor cost -16.0 -7.8 -2.1 5.5 9.2 3.9 7.0
Nonmonetary GDP at factor cost 1.8 2.2 -0.3 4.7 2.8 2.6 3.1Food 2.6 3.1 -0.3 6.0 2.8 2.8 2.8Construction 4.0 4.0 5.8 -0.1 2.8 2.8 2.8
Real GDP at market prices -14.3 -9.0 -1.6 6.4 8.0 5.0 6.1
Memorandum item:Nominal GDP at current market prices (in millions of SI dollars) 1,523.3 1,447.2 1,537.3 1,737.5 1,985.7 2,245.0 2,553.0
Sources: Data provided by the Solomon Islands authorities; and Fund staff estimates.
Table 2. Solomon Islands: Real GDP Growth Rates by Sectoral Origin, 2000–06
(Annual percentage change)
13 13 13 13
Drin
kC
loth
ing
Hou
sing
Tr
ansp
ort
Rec
reat
iona
lan
dan
dan
dH
ouse
hold
and
Hea
lth a
ndM
isce
llane
ous
Impo
rted
Loca
lA
llFo
odTo
bacc
oFo
otw
ear
Util
ities
Ope
ratio
nsC
omm
unic
atio
nO
ther
Ser
vice
sIte
ms
Item
sIte
ms
Item
sW
eigh
t46
850
5711
010
999
7928
571
429
1,00
0
2000
215.
123
1.1
137.
420
7.9
199.
121
3.1
211.
917
6.3
171.
923
3.1
207.
420
0123
5.3
240.
413
6.9
224.
019
7.3
220.
323
7.5
178.
117
6.6
257.
322
3.3
2002
260.
428
2.3
138.
324
7.8
206.
625
4.5
256.
618
1.7
197.
627
8.0
244.
220
0327
1.0
314.
113
9.3
310.
524
2.7
288.
829
4.5
198.
723
6.7
291.
626
8.5
2004
295.
132
8.8
139.
931
8.0
257.
731
1.7
315.
420
6.1
251.
531
3.0
287.
120
0531
2.4
321.
514
0.0
356.
526
8.7
362.
934
8.1
213.
926
4.6
339.
130
8.2
2006
337.
234
4.4
143.
540
0.1
280.
340
6.3
366.
821
8.5
283.
636
7.8
333.
1
2005
Janu
ary
295.
232
6.4
140.
034
1.7
260.
132
4.7
343.
120
9.0
255.
332
0.7
293.
5Fe
brua
ry30
0.2
326.
614
0.0
333.
026
0.3
321.
334
3.1
209.
425
3.6
323.
829
4.6
Mar
ch30
6.0
326.
514
0.0
334.
726
1.2
322.
634
3.0
211.
425
5.9
327.
629
7.8
Apr
il30
4.1
326.
414
0.0
334.
726
1.2
329.
634
4.2
214.
225
7.7
326.
229
7.7
May
314.
830
9.8
140.
135
0.7
270.
332
7.7
350.
221
3.4
266.
033
2.6
304.
9Ju
ne31
1.7
316.
014
0.1
365.
727
1.2
327.
735
0.2
213.
526
7.5
332.
730
5.6
July
317.
931
6.0
140.
136
4.2
271.
739
8.6
350.
421
4.7
267.
834
9.3
315.
4A
ugus
t32
8.2
321.
614
0.1
366.
727
3.6
398.
335
0.4
215.
326
9.5
357.
632
1.0
Sep
tem
ber
321.
232
1.4
140.
136
8.2
274.
139
9.8
350.
721
6.0
270.
135
2.3
318.
1O
ctob
er31
8.5
321.
214
0.1
368.
227
3.4
399.
835
0.6
216.
426
9.8
350.
231
6.8
Nov
embe
r31
4.5
321.
814
0.1
375.
927
3.6
405.
435
0.7
216.
427
1.0
347.
131
6.3
Dec
embe
r31
6.8
324.
714
0.1
373.
627
3.9
399.
435
0.8
216.
627
1.3
349.
231
6.8
2006
Janu
ary
318.
033
2.9
140.
138
5.7
279.
140
2.7
357.
821
5.9
271.
835
5.1
320.
5Fe
brua
ry31
8.7
331.
613
9.8
383.
127
9.4
400.
635
7.8
215.
927
1.0
355.
332
0.3
Mar
ch32
3.8
325.
814
0.0
388.
028
0.2
401.
736
2.5
214.
527
4.0
358.
732
3.4
Apr
il33
3.0
320.
114
0.0
394.
027
9.8
402.
836
4.4
214.
727
6.9
365.
132
8.3
May
335.
734
0.5
140.
039
4.8
279.
840
2.7
364.
421
6.1
277.
436
8.9
330.
8Ju
ne34
6.1
340.
214
0.0
400.
527
9.9
404.
736
6.7
216.
228
4.2
374.
133
6.6
July
345.
535
2.6
140.
040
1.3
280.
140
5.6
369.
321
5.9
286.
737
3.6
337.
3A
ugus
t35
0.2
353.
214
0.0
405.
828
0.7
407.
036
9.5
216.
228
8.0
376.
334
0.3
Sep
tem
ber
343.
435
0.3
140.
040
5.8
280.
740
7.0
369.
821
6.5
288.
437
0.3
337.
0O
ctob
er34
5.1
367.
514
6.1
411.
028
0.9
413.
437
2.1
219.
529
2.0
373.
534
0.5
Nov
embe
r34
4.4
363.
215
8.2
414.
728
1.3
413.
937
3.2
229.
429
5.9
372.
434
1.5
Dec
embe
r34
2.3
355.
115
8.2
416.
728
1.5
414.
037
3.8
230.
929
6.5
370.
134
0.5
2007
Janu
ary
341.
936
3.9
158.
341
6.2
284.
441
5.4
374.
723
1.4
297.
737
0.6
341.
2Fe
brua
ry33
7.7
364.
115
8.3
440.
028
4.5
415.
537
4.7
231.
429
8.0
371.
534
1.9
Mar
ch34
0.7
362.
015
9.4
462.
128
5.0
415.
537
7.1
231.
229
6.7
379.
434
5.9
Apr
il34
3.3
363.
815
9.4
458.
928
5.9
417.
437
7.1
231.
029
7.8
380.
734
7.1
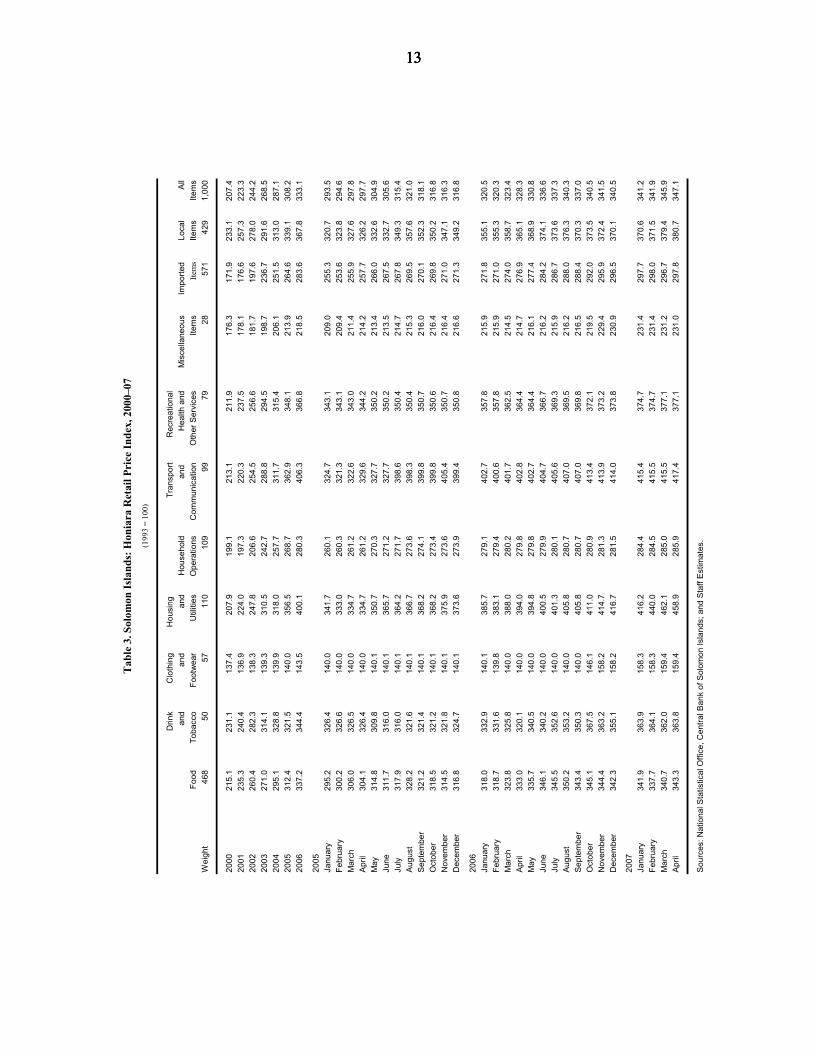
Sou
rces
: Nat
iona
l Sta
tistic
al O
ffice
, Cen
tral B
ank
of S
olom
on Is
land
s; a
nd S
taff
Est
imat
es.
Tab
le 3
. Sol
omon
Isla
nds:
Hon
iara
Ret
ail P
rice
Inde
x, 2
000–
07(1
993
= 10
0)

14 14 14 14
Est.
Est.
Est.
Est.
2000
2001
2002
2003
2004
2005
2006
Tota
l54
,517
52
,925
50
,890
51
,518
52
,121
56,5
59
59
,161
Cla
ssifi
catio
n by
indu
stry
Agric
ultu
re7,
381
7,10
2
6,
691
6,51
0
6,
342
……
Fore
stry
3,22
6
3,
192
3,13
2
3,
285
3,48
2
…
…Fi
shin
g5,
315
5,17
9
5,
030
5,01
5
5,
114
……
Man
ufac
turin
g 1/
1,48
0
1,
452
1,42
4
1,
444
1,47
6
…
…El
ectri
city
and
wat
er52
4
507
48
2
470
46
9
……
Con
stru
ctio
n1,
569
1,49
8
1,
427
1,40
0
1,
397
……
Trad
ing
2/3,
309
3,21
3
3,
111
3,12
4
3,
274
……
Tran
spor
tatio
n an
d co
mm
unic
atio
ns1,
385
1,34
8
1,
287
1,25
4
1,
246
……
Fina
nce
826
82
3
805
79
8
806
…
…Ad
min
istra
tion
6,65
9
6,
435
6,13
8
6,
800
6,75
8
…
…O
ther
ser
vice
s22
,843
22
,176
21
,363
21
,418
21
,757
……
Sour
ces:
Nat
iona
l Sta
tistic
al O
ffice
; and
Cen
tral B
ank
of S
olom
on Is
land
s.
1/ M
anuf
actu
ring
incl
udes
min
ing.
2/ T
radi
ng in
clud
es re
tail,
who
lesa
le, r
esta
uran
ts, a
nd h
otel
s.
(Num
ber o
f em
ploy
ees)
Tabl
e 4.
Sol
omon
Isla
nds:
For
mal
Em
ploy
men
t, 20
00–0
6
15
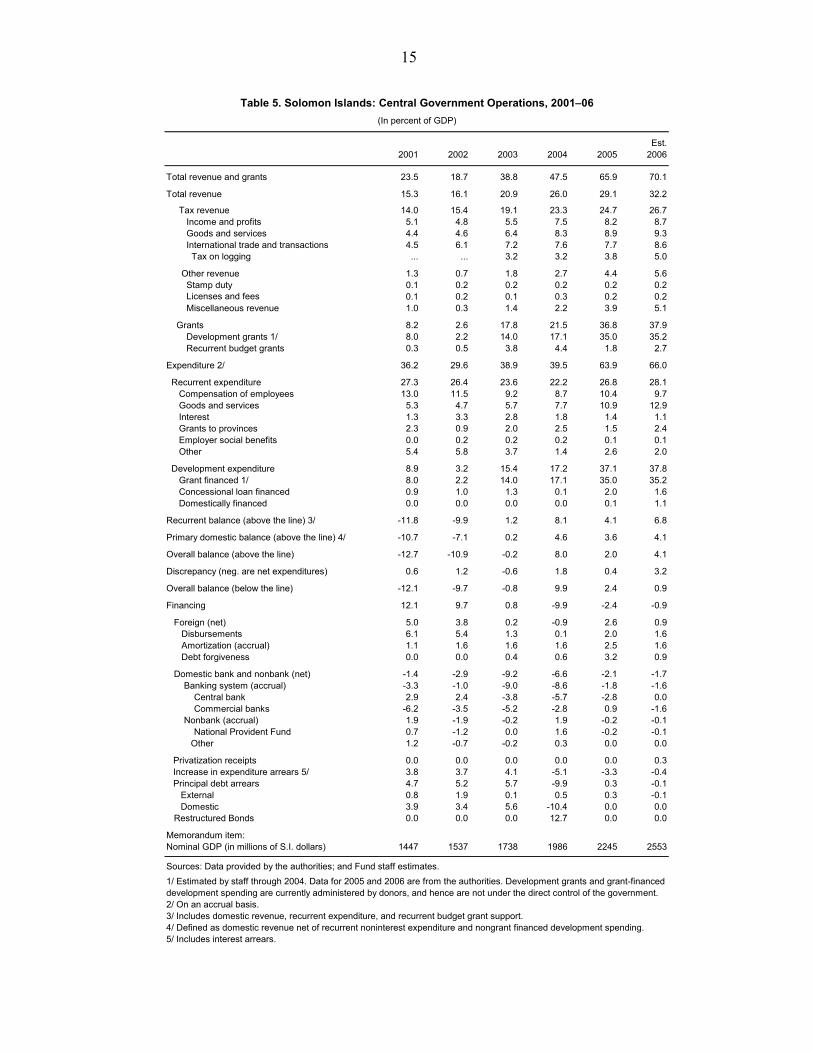
Est.2001 2002 2003 2004 2005 2006
Total revenue and grants 23.5 18.7 38.8 47.5 65.9 70.1
Total revenue 15.3 16.1 20.9 26.0 29.1 32.2
Tax revenue 14.0 15.4 19.1 23.3 24.7 26.7 Income and profits 5.1 4.8 5.5 7.5 8.2 8.7 Goods and services 4.4 4.6 6.4 8.3 8.9 9.3 International trade and transactions 4.5 6.1 7.2 7.6 7.7 8.6 Tax on logging ... ... 3.2 3.2 3.8 5.0
Other revenue 1.3 0.7 1.8 2.7 4.4 5.6 Stamp duty 0.1 0.2 0.2 0.2 0.2 0.2 Licenses and fees 0.1 0.2 0.1 0.3 0.2 0.2 Miscellaneous revenue 1.0 0.3 1.4 2.2 3.9 5.1
Grants 8.2 2.6 17.8 21.5 36.8 37.9 Development grants 1/ 8.0 2.2 14.0 17.1 35.0 35.2 Recurrent budget grants 0.3 0.5 3.8 4.4 1.8 2.7
Expenditure 2/ 36.2 29.6 38.9 39.5 63.9 66.0
Recurrent expenditure 27.3 26.4 23.6 22.2 26.8 28.1 Compensation of employees 13.0 11.5 9.2 8.7 10.4 9.7 Goods and services 5.3 4.7 5.7 7.7 10.9 12.9 Interest 1.3 3.3 2.8 1.8 1.4 1.1 Grants to provinces 2.3 0.9 2.0 2.5 1.5 2.4 Employer social benefits 0.0 0.2 0.2 0.2 0.1 0.1 Other 5.4 5.8 3.7 1.4 2.6 2.0
Development expenditure 8.9 3.2 15.4 17.2 37.1 37.8 Grant financed 1/ 8.0 2.2 14.0 17.1 35.0 35.2 Concessional loan financed 0.9 1.0 1.3 0.1 2.0 1.6 Domestically financed 0.0 0.0 0.0 0.0 0.1 1.1
Recurrent balance (above the line) 3/ -11.8 -9.9 1.2 8.1 4.1 6.8
Primary domestic balance (above the line) 4/ -10.7 -7.1 0.2 4.6 3.6 4.1
Overall balance (above the line) -12.7 -10.9 -0.2 8.0 2.0 4.1
Discrepancy (neg. are net expenditures) 0.6 1.2 -0.6 1.8 0.4 3.2
Overall balance (below the line) -12.1 -9.7 -0.8 9.9 2.4 0.9
Financing 12.1 9.7 0.8 -9.9 -2.4 -0.9
Foreign (net) 5.0 3.8 0.2 -0.9 2.6 0.9 Disbursements 6.1 5.4 1.3 0.1 2.0 1.6 Amortization (accrual) 1.1 1.6 1.6 1.6 2.5 1.6 Debt forgiveness 0.0 0.0 0.4 0.6 3.2 0.9
Domestic bank and nonbank (net) -1.4 -2.9 -9.2 -6.6 -2.1 -1.7 Banking system (accrual) -3.3 -1.0 -9.0 -8.6 -1.8 -1.6 Central bank 2.9 2.4 -3.8 -5.7 -2.8 0.0 Commercial banks -6.2 -3.5 -5.2 -2.8 0.9 -1.6 Nonbank (accrual) 1.9 -1.9 -0.2 1.9 -0.2 -0.1 National Provident Fund 0.7 -1.2 0.0 1.6 -0.2 -0.1
Other 1.2 -0.7 -0.2 0.3 0.0 0.0
Privatization receipts 0.0 0.0 0.0 0.0 0.0 0.3Increase in expenditure arrears 5/ 3.8 3.7 4.1 -5.1 -3.3 -0.4Principal debt arrears 4.7 5.2 5.7 -9.9 0.3 -0.1 External 0.8 1.9 0.1 0.5 0.3 -0.1 Domestic 3.9 3.4 5.6 -10.4 0.0 0.0
Restructured Bonds 0.0 0.0 0.0 12.7 0.0 0.0
Memorandum item:Nominal GDP (in millions of S.I. dollars) 1447 1537 1738 1986 2245 2553
Sources: Data provided by the authorities; and Fund staff estimates.1/ Estimated by staff through 2004. Data for 2005 and 2006 are from the authorities. Development grants and grant-financeddevelopment spending are currently administered by donors, and hence are not under the direct control of the government.2/ On an accrual basis. 3/ Includes domestic revenue, recurrent expenditure, and recurrent budget grant support.4/ Defined as domestic revenue net of recurrent noninterest expenditure and nongrant financed development spending.5/ Includes interest arrears.
Table 5. Solomon Islands: Central Government Operations, 2001–06(In percent of GDP)
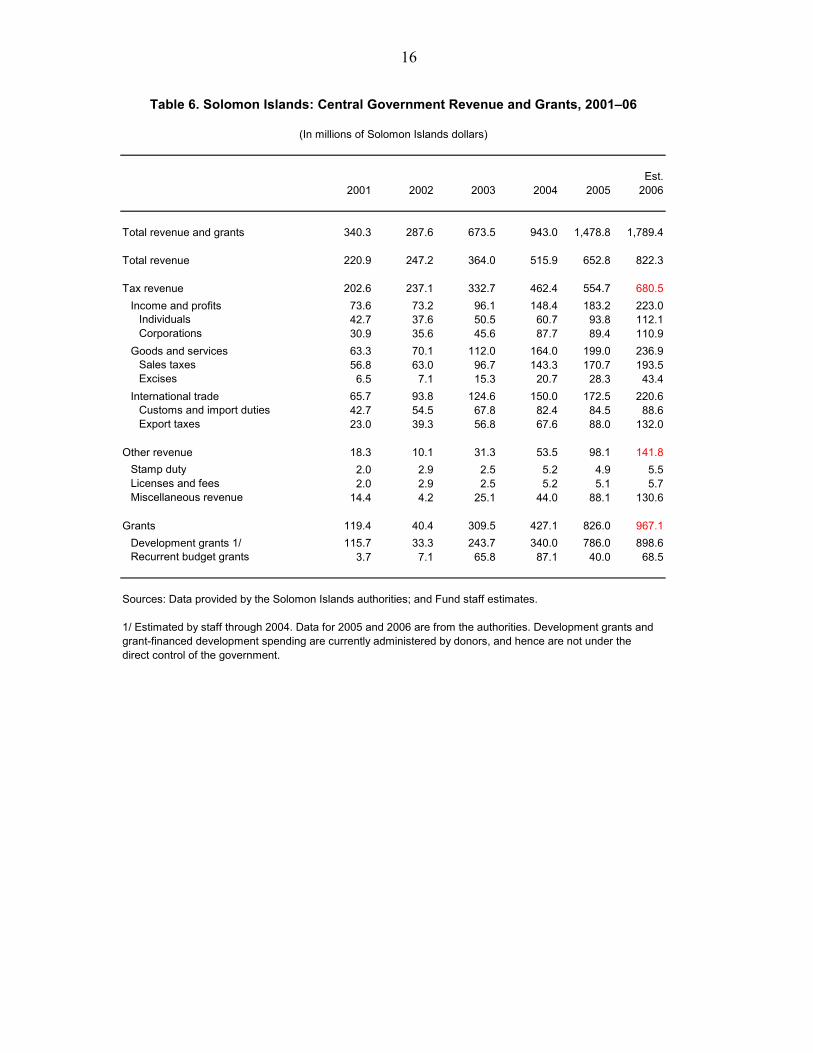
16
Est.2001 2002 2003 2004 2005 2006
Total revenue and grants 340.3 287.6 673.5 943.0 1,478.8 1,789.4
Total revenue 220.9 247.2 364.0 515.9 652.8 822.3
Tax revenue 202.6 237.1 332.7 462.4 554.7 680.5Income and profits 73.6 73.2 96.1 148.4 183.2 223.0
Individuals 42.7 37.6 50.5 60.7 93.8 112.1Corporations 30.9 35.6 45.6 87.7 89.4 110.9
Goods and services 63.3 70.1 112.0 164.0 199.0 236.9Sales taxes 56.8 63.0 96.7 143.3 170.7 193.5Excises 6.5 7.1 15.3 20.7 28.3 43.4
International trade 65.7 93.8 124.6 150.0 172.5 220.6Customs and import duties 42.7 54.5 67.8 82.4 84.5 88.6Export taxes 23.0 39.3 56.8 67.6 88.0 132.0
Other revenue 18.3 10.1 31.3 53.5 98.1 141.8Stamp duty 2.0 2.9 2.5 5.2 4.9 5.5Licenses and fees 2.0 2.9 2.5 5.2 5.1 5.7Miscellaneous revenue 14.4 4.2 25.1 44.0 88.1 130.6
Grants 119.4 40.4 309.5 427.1 826.0 967.1Development grants 1/ 115.7 33.3 243.7 340.0 786.0 898.6Recurrent budget grants 3.7 7.1 65.8 87.1 40.0 68.5
Sources: Data provided by the Solomon Islands authorities; and Fund staff estimates.
1/ Estimated by staff through 2004. Data for 2005 and 2006 are from the authorities. Development grants and grant-financed development spending are currently administered by donors, and hence are not under thedirect control of the government.
Table 6. Solomon Islands: Central Government Revenue and Grants, 2001–06
(In millions of Solomon Islands dollars)
17
Est.2001 2002 2003 2004 2005 2006
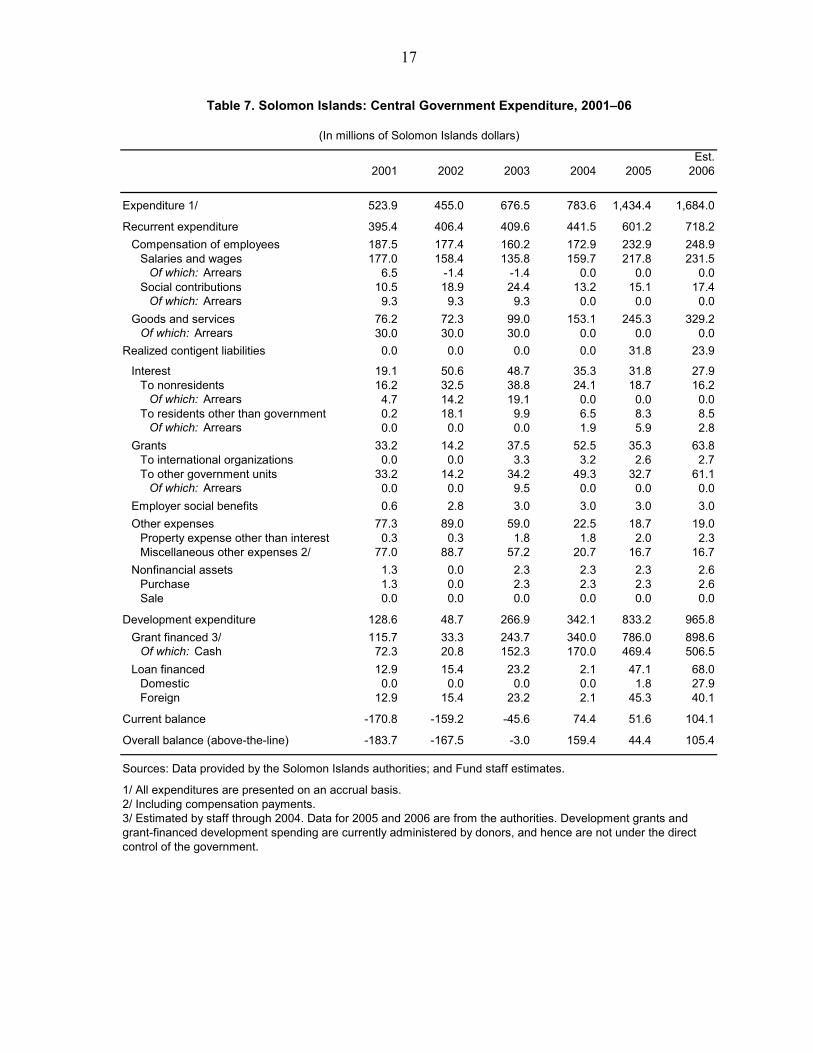
Expenditure 1/ 523.9 455.0 676.5 783.6 1,434.4 1,684.0
Recurrent expenditure 395.4 406.4 409.6 441.5 601.2 718.2Compensation of employees 187.5 177.4 160.2 172.9 232.9 248.9
Salaries and wages 177.0 158.4 135.8 159.7 217.8 231.5Of which: Arrears 6.5 -1.4 -1.4 0.0 0.0 0.0
Social contributions 10.5 18.9 24.4 13.2 15.1 17.4Of which: Arrears 9.3 9.3 9.3 0.0 0.0 0.0
Goods and services 76.2 72.3 99.0 153.1 245.3 329.2Of which: Arrears 30.0 30.0 30.0 0.0 0.0 0.0
Realized contigent liabilities 0.0 0.0 0.0 0.0 31.8 23.9
Interest 19.1 50.6 48.7 35.3 31.8 27.9To nonresidents 16.2 32.5 38.8 24.1 18.7 16.2
Of which: Arrears 4.7 14.2 19.1 0.0 0.0 0.0To residents other than government 0.2 18.1 9.9 6.5 8.3 8.5
Of which: Arrears 0.0 0.0 0.0 1.9 5.9 2.8Grants 33.2 14.2 37.5 52.5 35.3 63.8
To international organizations 0.0 0.0 3.3 3.2 2.6 2.7To other government units 33.2 14.2 34.2 49.3 32.7 61.1
Of which: Arrears 0.0 0.0 9.5 0.0 0.0 0.0Employer social benefits 0.6 2.8 3.0 3.0 3.0 3.0Other expenses 77.3 89.0 59.0 22.5 18.7 19.0
Property expense other than interest 0.3 0.3 1.8 1.8 2.0 2.3Miscellaneous other expenses 2/ 77.0 88.7 57.2 20.7 16.7 16.7
Nonfinancial assets 1.3 0.0 2.3 2.3 2.3 2.6Purchase 1.3 0.0 2.3 2.3 2.3 2.6Sale 0.0 0.0 0.0 0.0 0.0 0.0
Development expenditure 128.6 48.7 266.9 342.1 833.2 965.8Grant financed 3/ 115.7 33.3 243.7 340.0 786.0 898.6
Of which: Cash 72.3 20.8 152.3 170.0 469.4 506.5Loan financed 12.9 15.4 23.2 2.1 47.1 68.0
Domestic 0.0 0.0 0.0 0.0 1.8 27.9Foreign 12.9 15.4 23.2 2.1 45.3 40.1
Current balance -170.8 -159.2 -45.6 74.4 51.6 104.1
Overall balance (above-the-line) -183.7 -167.5 -3.0 159.4 44.4 105.4
Sources: Data provided by the Solomon Islands authorities; and Fund staff estimates.
1/ All expenditures are presented on an accrual basis.2/ Including compensation payments.3/ Estimated by staff through 2004. Data for 2005 and 2006 are from the authorities. Development grants and grant-financed development spending are currently administered by donors, and hence are not under the direct control of the government.
Table 7. Solomon Islands: Central Government Expenditure, 2001–06
(In millions of Solomon Islands dollars)

18
Est.2001 2002 2003 2004 2005 2006
Total financing 174.6 149.6 14.1 -195.6 -39.1 -22.7
Foreign (net) 72.5 58.1 3.2 -18.5 59.2 22.4Disbursement 88.6 82.8 23.2 2.1 45.3 40.1Amortization 16.1 24.7 27.3 32.1 56.9 40.5Debt forgiveness 0.0 0.0 7.3 11.5 70.7 22.8
Domestic bank and nonbank (net) -20.5 -45.1 -159.4 -131.7 -46.0 -42.4Banking sector -47.7 -16.1 -156.8 -170.1 -41.2 -40.7
Central bank (net) 42.3 37.3 -66.0 -114.1 -62.0 0.7Securities 0.0 0.2 -0.1 0.1 -0.1 120.8Lending 130.7 0.9 -0.7 0.0 11.4 -156.0Drawdown in deposits -88.4 36.2 -65.1 -114.2 -73.3 35.9
Commercial banks (net) -90.0 -53.3 -90.9 -56.0 20.7 -41.4Securities -91.2 -51.5 -83.7 -18.3 -4.1 -8.5Lending 0.0 0.0 0.0 0.0 0.0 0.0Drawdown in deposits 1.2 -1.8 -7.2 -37.7 24.8 -32.8
Nonbank sector 27.2 -29.1 -2.6 38.3 -4.8 -1.7Development Bank 0.0 0.0 0.0 0.0 0.0 0.0National Provident Fund 9.8 -18.4 0.0 31.8 -4.8 -1.7Other 17.4 -10.7 -2.6 6.5 0.0 0.0
Privatization receipts 0.0 0.0 0.0 0.0 0.0 8.2
Increase in expenditure arrears 54.5 56.2 70.5 -101.1 -74.6 -9.4Interest 8.7 18.3 23.2 -11.3 -23.5 6.2
External 4.7 14.2 19.1 4.9 -23.5 6.2Domestic 4.1 4.1 4.1 -16.2 0.0 0.0
Other expenditure 45.8 37.9 47.4 -89.7 -51.0 -15.6
Increase in principal debt arrears 68.1 80.5 99.8 -196.1 7.9 -1.6External 11.4 29.0 1.8 10.2 7.9 -1.6Domestic 56.7 51.5 98.1 -206.3 0.0 0.0
Restructured Arrears 0.0 0.0 0.0 251.7 14.5 0.0
Sources: Data provided by the Solomon Islands authorities; and Fund staff estimates.
1/ All debt servicing is presented on an accrual basis.
Table 8. Solomon Islands: Central Government Budget Financing, 2001–06 1/
(In millions of Solomon Islands dollars)

19
Est.2002 2003 2004 2005 2006
Total 452.9 469.8 488.1 490.6 446.4Securities 277.9 295.5 313.8 304.8 416.0
Bonds 256.9 256.8 280.7 267.7 376.0Bills 21.0 38.7 33.0 37.1 40.0
Loans 175.0 174.3 174.3 185.8 30.4
Central bank 41.1 39.5 38.0 40.1 36.2Securities 2.5 2.4 2.3 2.3 29.4
Bonds 2.5 2.4 2.3 2.3 29.4Bills 0.0 0.0 0.0 0.0 0.0
Loans 38.6 37.1 35.7 37.9 6.8
Commercial banks 33.1 36.1 30.7 29.8 29.9Securities 33.1 36.1 30.7 29.8 29.9
Bonds 33.1 31.9 29.1 27.5 28.7Bills 0.0 4.2 1.6 2.2 1.1
Loans 0.0 0.0 0.0 0.0 0.0
National Provident Fund 20.8 20.1 25.8 24.7 26.8Securities 20.8 20.1 25.8 24.7 26.8
Bonds 20.8 20.1 25.8 24.5 25.8Bills 0.0 0.0 0.0 0.2 1.0
Loans 0.0 0.0 0.0 0.0 0.0
Others 5.0 4.3 5.2 5.4 7.0Securities 5.0 4.3 5.2 5.4 7.0
Bonds 0.3 0.3 0.3 0.3 0.3Bills 4.6 4.0 4.9 5.1 6.8
Sources: Central Bank of Solomon Islands; Ministry of Finance; and Fund staff estimates.
Table 9. Solomon Islands: Central Government Gross Domestic Debt, 2002–06
(In millions of Solomon Islands dollars)
(In percent of total)

20
2002 2003 2004 2005 2006
Nonfinancial sector
Agriculture/agro-industry sectorsSolomon Islands Plantation Ltd. 30 30 30 98 98Kolombangara Forestry and Plantation Ltd. 19 19 19 40 40Solomon Taiyo Ltd. … … … … …Soltai Fishing Company 1/ 51 51 51 51 51
OthersSasape Marina Ltd. 100 100 100 100 100Solomon Airlines 100 100 100 100 100Solomon Telekom 7 7 7 3 3Pacific Forum Line Ltd. … … … 0.6 0.6Solomon Islands Printers 100 100 100 100 100
Financial sector
Development Bank of Solomon Islands 10 10 10 10 10Central Bank of Solomon Islands 100 100 100 100 100
Source: Central Bank of Solomon Islands Annual Report .
1/ Incorporated to take over Solomon Taiyo's assets. The remaining 49 percent is owned by the Western Province government.
Table 10. Solomon Islands: Equity Investment of theInvestment Corporation of Solomon Islands, 2002–06
(Percent share)
21
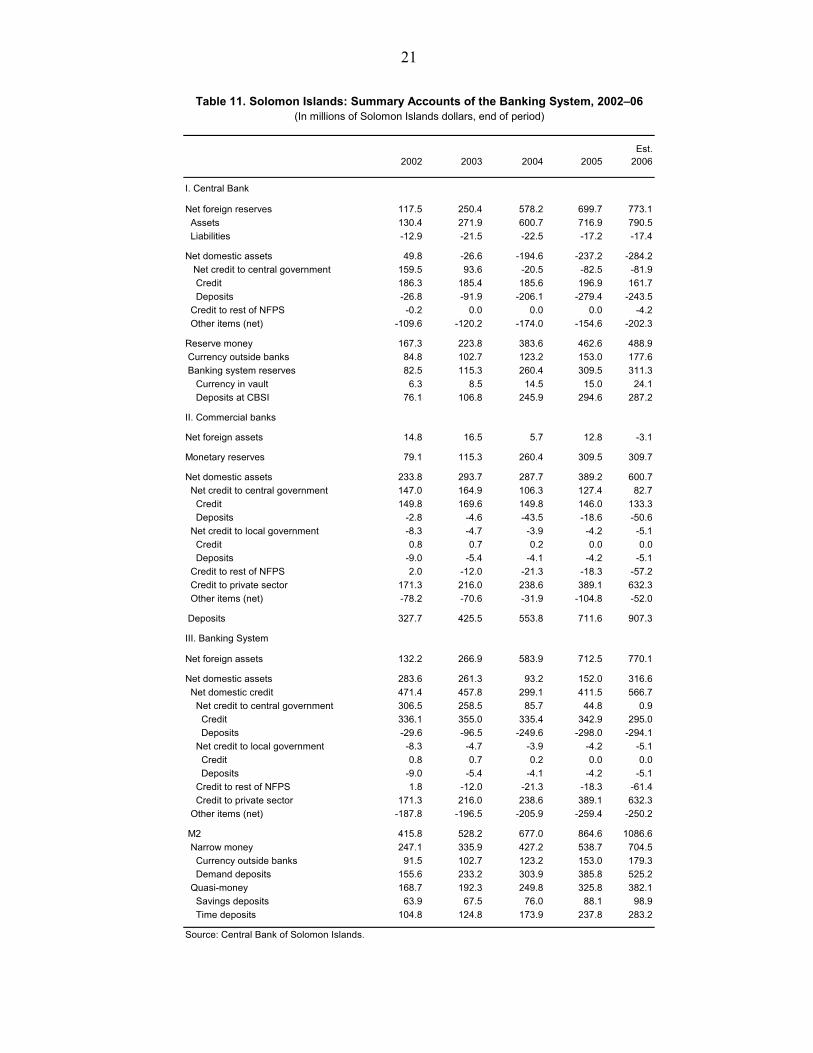
Est.2002 2003 2004 2005 2006
I. Central Bank
Net foreign reserves 117.5 250.4 578.2 699.7 773.1 Assets 130.4 271.9 600.7 716.9 790.5 Liabilities -12.9 -21.5 -22.5 -17.2 -17.4
Net domestic assets 49.8 -26.6 -194.6 -237.2 -284.2 Net credit to central government 159.5 93.6 -20.5 -82.5 -81.9 Credit 186.3 185.4 185.6 196.9 161.7 Deposits -26.8 -91.9 -206.1 -279.4 -243.5 Credit to rest of NFPS -0.2 0.0 0.0 0.0 -4.2 Other items (net) -109.6 -120.2 -174.0 -154.6 -202.3
Reserve money 167.3 223.8 383.6 462.6 488.9 Currency outside banks 84.8 102.7 123.2 153.0 177.6 Banking system reserves 82.5 115.3 260.4 309.5 311.3 Currency in vault 6.3 8.5 14.5 15.0 24.1 Deposits at CBSI 76.1 106.8 245.9 294.6 287.2
II. Commercial banks
Net foreign assets 14.8 16.5 5.7 12.8 -3.1
Monetary reserves 79.1 115.3 260.4 309.5 309.7
Net domestic assets 233.8 293.7 287.7 389.2 600.7 Net credit to central government 147.0 164.9 106.3 127.4 82.7 Credit 149.8 169.6 149.8 146.0 133.3 Deposits -2.8 -4.6 -43.5 -18.6 -50.6 Net credit to local government -8.3 -4.7 -3.9 -4.2 -5.1 Credit 0.8 0.7 0.2 0.0 0.0 Deposits -9.0 -5.4 -4.1 -4.2 -5.1 Credit to rest of NFPS 2.0 -12.0 -21.3 -18.3 -57.2 Credit to private sector 171.3 216.0 238.6 389.1 632.3 Other items (net) -78.2 -70.6 -31.9 -104.8 -52.0
Deposits 327.7 425.5 553.8 711.6 907.3
III. Banking System
Net foreign assets 132.2 266.9 583.9 712.5 770.1
Net domestic assets 283.6 261.3 93.2 152.0 316.6 Net domestic credit 471.4 457.8 299.1 411.5 566.7 Net credit to central government 306.5 258.5 85.7 44.8 0.9 Credit 336.1 355.0 335.4 342.9 295.0 Deposits -29.6 -96.5 -249.6 -298.0 -294.1 Net credit to local government -8.3 -4.7 -3.9 -4.2 -5.1 Credit 0.8 0.7 0.2 0.0 0.0 Deposits -9.0 -5.4 -4.1 -4.2 -5.1 Credit to rest of NFPS 1.8 -12.0 -21.3 -18.3 -61.4 Credit to private sector 171.3 216.0 238.6 389.1 632.3 Other items (net) -187.8 -196.5 -205.9 -259.4 -250.2
M2 415.8 528.2 677.0 864.6 1086.6 Narrow money 247.1 335.9 427.2 538.7 704.5 Currency outside banks 91.5 102.7 123.2 153.0 179.3 Demand deposits 155.6 233.2 303.9 385.8 525.2 Quasi-money 168.7 192.3 249.8 325.8 382.1 Savings deposits 63.9 67.5 76.0 88.1 98.9 Time deposits 104.8 124.8 173.9 237.8 283.2
Source: Central Bank of Solomon Islands.
Table 11. Solomon Islands: Summary Accounts of the Banking System, 2002–06(In millions of Solomon Islands dollars, end of period)

22
Est2002 2003 2004 2005 2006
Assets 340.6 486.7 813.9 942.2 1004.0External 130.4 271.8 600.7 716.9 790.5Domestic 210.2 217.0 213.2 225.3 213.5
Central government 186.3 185.4 185.6 196.9 161.7Loans 175.0 174.3 174.3 185.8 30.4Securities 11.3 11.2 11.3 11.1 131.3
Other domestic assets 23.9 30.6 27.8 28.4 51.8Securities and investments 2.0 1.3 0.7 0.0 0.0Other 21.9 29.3 27.2 28.4 51.8
Liabilities 340.6 486.7 813.9 942.2 1004.0External 12.9 21.4 22.5 17.2 17.4Domestic 327.7 465.3 791.4 925.0 986.6
Currency issued 97.8 111.2 137.7 168.0 201.7Deposits 103.0 202.7 451.9 575.2 534.8
Banks 76.1 110.7 244.6 294.7 287.1Central government 26.8 91.8 206.1 279.4 243.5Other 0.1 0.2 1.2 1.1 4.2
Central bank bills 0.0 0.0 0.0 0.0 0.0Other (including provisions) 177.9 178.9 185.5 158.6 160.2Capital -51.0 -27.6 16.3 23.2 89.8
Source: Central Bank of Solomon Islands.
(In millions of Solomon Islands dollars, end of period)
Table 12. Solomon Islands: Assets and Liabilities of the Central Bank of Solomon Islands, 2002–06
23
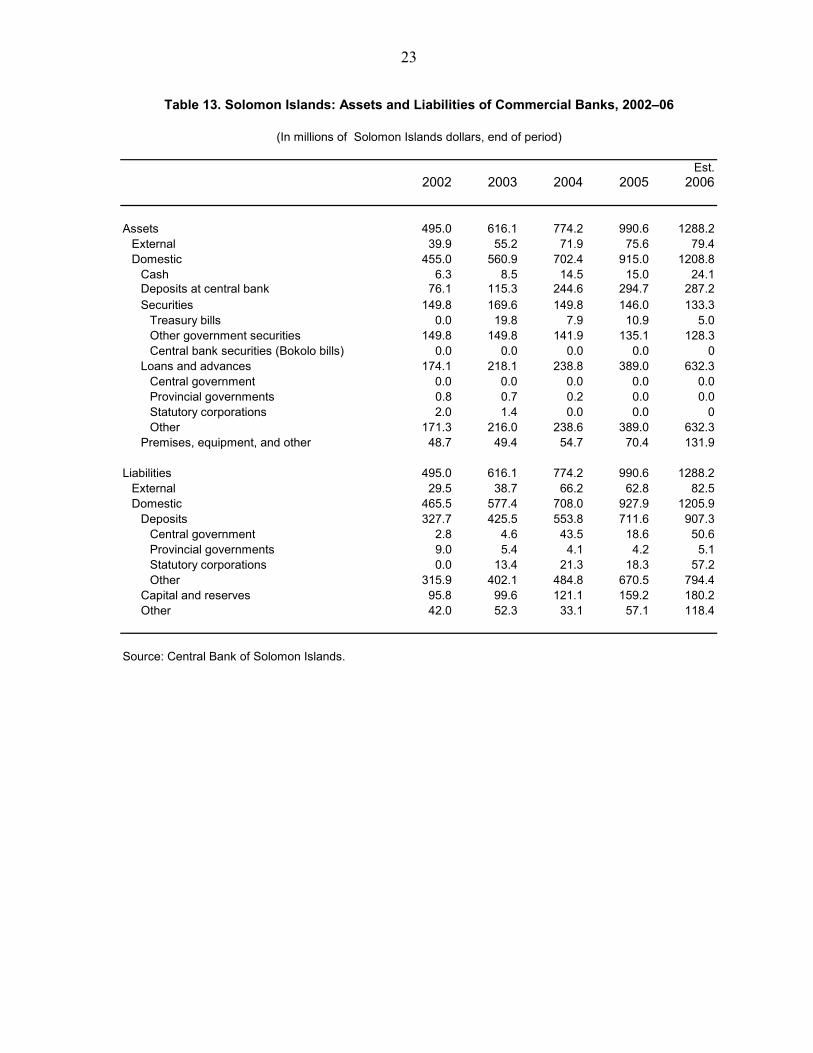
Est.2002 2003 2004 2005 2006
Assets 495.0 616.1 774.2 990.6 1288.2External 39.9 55.2 71.9 75.6 79.4Domestic 455.0 560.9 702.4 915.0 1208.8
Cash 6.3 8.5 14.5 15.0 24.1Deposits at central bank 76.1 115.3 244.6 294.7 287.2Securities 149.8 169.6 149.8 146.0 133.3
Treasury bills 0.0 19.8 7.9 10.9 5.0Other government securities 149.8 149.8 141.9 135.1 128.3Central bank securities (Bokolo bills) 0.0 0.0 0.0 0.0 0
Loans and advances 174.1 218.1 238.8 389.0 632.3Central government 0.0 0.0 0.0 0.0 0.0Provincial governments 0.8 0.7 0.2 0.0 0.0Statutory corporations 2.0 1.4 0.0 0.0 0Other 171.3 216.0 238.6 389.0 632.3
Premises, equipment, and other 48.7 49.4 54.7 70.4 131.9
Liabilities 495.0 616.1 774.2 990.6 1288.2External 29.5 38.7 66.2 62.8 82.5Domestic 465.5 577.4 708.0 927.9 1205.9
Deposits 327.7 425.5 553.8 711.6 907.3Central government 2.8 4.6 43.5 18.6 50.6Provincial governments 9.0 5.4 4.1 4.2 5.1Statutory corporations 0.0 13.4 21.3 18.3 57.2Other 315.9 402.1 484.8 670.5 794.4
Capital and reserves 95.8 99.6 121.1 159.2 180.2Other 42.0 52.3 33.1 57.1 118.4
Source: Central Bank of Solomon Islands.
Table 13. Solomon Islands: Assets and Liabilities of Commercial Banks, 2002–06
(In millions of Solomon Islands dollars, end of period)
24
Min
ing
&Te
leco
m-
Dis
tribu
-E
nd o
f Per
iod
Agr
icul
ture
Fore
str y
Fish
erie
sQ
uarry
ing
Man
ufac
turin
gC
onst
ruct
ion
Tran
spor
tm
unic
atio
nstio
nTo
uris
m
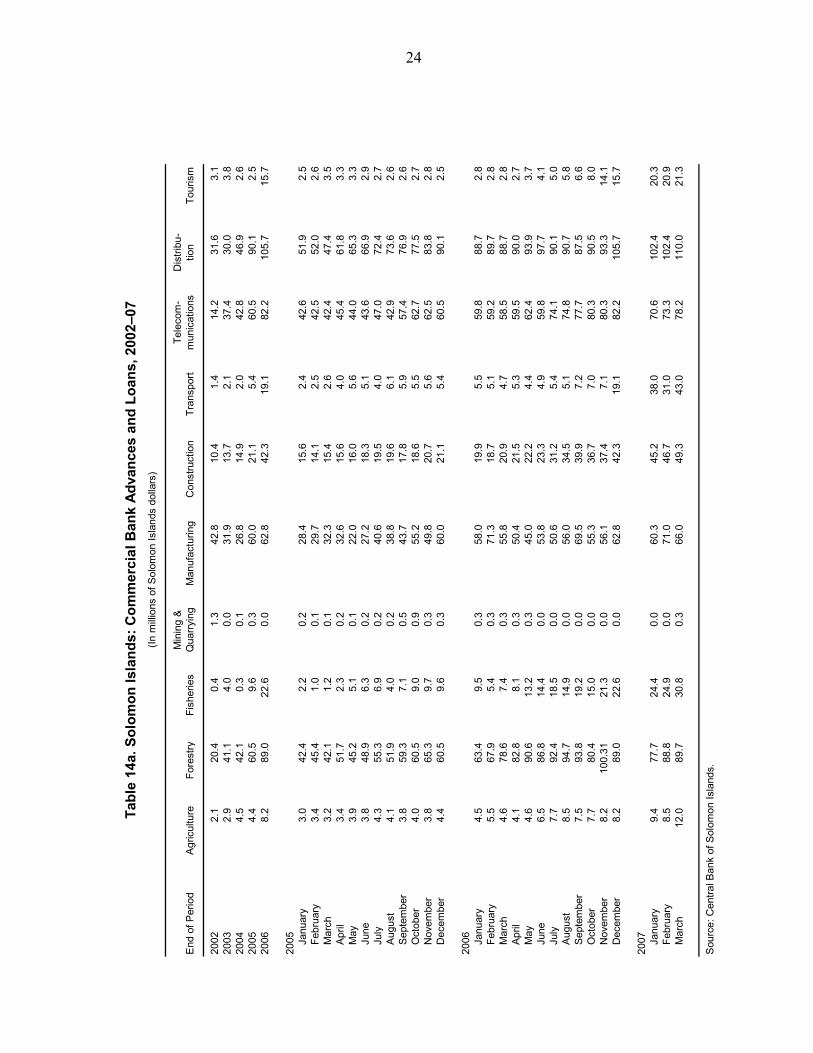
2002
2.1
20.4
0.4
1.3
42.8
10.4
1.4
14.2
31.6
3.1
2003
2.9
41.1
4.0
0.0
31.9
13.7
2.1
37.4
30.0
3.8
2004
4.5
42.1
0.3
0.1
26.8
14.9
2.0
42.8
46.9
2.6
2005
4.4
60.5
9.6
0.3
60.0
21.1
5.4
60.5
90.1
2.5
2006
8.2
89.0
22.6
0.0
62.8
42.3
19.1
82.2
105.
715
.7
2005 Ja
nuar
y3.
042
.42.
20.
228
.415
.62.
442
.651
.92.
5Fe
brua
ry3.
445
.41.
00.
129
.714
.12.
542
.552
.02.
6M
arch
3.2
42.1
1.2
0.1
32.3
15.4
2.6
42.4
47.4
3.5
Apr
il3.
451
.72.
30.
232
.615
.64.
045
.461
.83.
3M
ay3.
945
.25.
10.
122
.016
.05.
644
.065
.33.
3Ju
ne3.
848
.96.
30.
227
.218
.35.
143
.666
.92.
9Ju
ly4.
355
.36.
90.
240
.619
.54.
047
.072
.42.
7A
ugus
t4.
151
.94.
00.
238
.819
.66.
142
.973
.62.
6S
epte
mbe
r3.
859
.37.
10.
543
.717
.85.
957
.476
.92.
6O
ctob
er4.
060
.59.
00.
955
.218
.65.
562
.777
.52.
7N
ovem
ber
3.8
65.3
9.7
0.3
49.8
20.7
5.6
62.5
83.8
2.8
Dec
embe
r4.
460
.59.
60.
360
.021
.15.
460
.590
.12.
5
2006 Ja
nuar
y4.
563
.49.
50.
358
.019
.95.
559
.888
.72.
8Fe
brua
ry5.
567
.95.
40.
371
.318
.75.
159
.289
.72.
8M
arch
4.6
78.6
7.4
0.3
55.8
20.9
4.7
58.5
88.7
2.8
Apr
il4.
182
.88.
10.
350
.421
.55.
359
.590
.02.
7M
ay4.
690
.613
.20.
345
.022
.24.
462
.493
.93.
7Ju
ne6.
586
.814
.40.
053
.823
.34.
959
.897
.74.
1Ju
l y7.
792
.418
.50.
050
.631
.25.
474
.190
.15.
0A
ugus
t8.
594
.714
.90.
056
.034
.55.
174
.890
.75.
8S
epte
mbe
r7.
593
.819
.20.
069
.539
.97.
277
.787
.56.
6O
ctob
er7.
780
.415
.00.
055
.336
.77.
080
.390
.58.
0N
ovem
ber
8.2
100.
3121
.30.
056
.137
.47.
180
.393
.314
.1D
ecem
ber
8.2
89.0
22.6
0.0
62.8
42.3
19.1
82.2
105.
715
.7
2007 Ja
nuar
y9.
477
.724
.40.
060
.345
.238
.070
.610
2.4
20.3
Febr
uary
8.5
88.8
24.9
0.0
71.0
46.7
31.0
73.3
102.
420
.9M
arch
12.0
89.7
30.8
0.3
66.0
49.3
43.0
78.2
110.
021
.3
Sou
rce:
Cen
tral B
ank
of S
olom
on Is
land
s.
(In m
illio
ns o
f Sol
omon
Isla
nds
dolla
rs)
Tabl
e 14
a. S
olom
on Is
land
s: C
omm
erci
al B
ank
Adva
nces
and
Loa
ns, 2
002–
07

25
Ent
erta
inm
ent
Sta
tuto
ryP
ublic
Fin
anci
alPr
ivat
e Fi
nanc
ial
Pro
fess
iona
l &N
on-
End
of P
erio
d&
Cat
erin
gG
over
nmen
tC
orpo
ratio
nsIn
stitu
tions
Inst
itutio
nsO
ther
Ser
vice
sP
erso
nal
Tota
lR
esid
ent
2002
1.2
0.8
2.0
0.0
0.3
8.5
33.7
171.
30.
120
030.
80.
71.
40.
00.
313
.934
.121
6.0
0.2
2004
1.7
0.4
0.1
0.0
0.1
15.0
40.9
238.
91.
620
053.
90.
00.
00.
00.
017
.363
.238
9.1
4.5
2006
4.5
0.0
1.0
0.0
0.2
46.1
117.
361
6.7
0.4
2005 Ja
nuar
y1.
60.
20.
00.
00.
016
.741
.025
0.9
1.6
Febr
uary
1.7
0.0
0.0
0.1
0.0
15.6
42.2
252.
81.
6M
arch
3.6
0.0
0.0
0.3
0.7
14.5
43.3
262.
61.
5A
pril
3.2
0.0
0.0
0.0
0.0
13.8
43.6
281.
01.
4M
ay3.
80.
00.
00.
00.
012
.445
.127
1.9
1.4
June
3.4
0.0
0.0
0.1
0.0
13.0
44.7
284.
40.
5Ju
ly3.
70.
00.
00.
00.
014
.647
.931
9.1
0.5
Aug
ust
3.3
0.0
0.0
0.0
0.0
14.6
49.3
311.
10.
0S
epte
mbe
r3.
50.
10.
00.
00.
012
.254
.134
5.1
0.5
Oct
ober
3.6
0.1
0.0
0.0
0.0
14.2
57.5
372.
00.
5N
ovem
ber
3.7
0.0
0.0
0.0
0.0
14.8
60.6
383.
40.
4D
ecem
ber
3.9
0.0
0.0
0.0
0.0
17.3
63.2
389.
14.
5
2006 Ja
nuar
y4.
10.
00.
20.
00.
018
.864
.640
0.5
0.4
Febr
uary
4.3
0.0
0.0
0.0
0.0
25.2
68.8
424.
70.
4M
arch
4.4
0.0
0.3
0.0
0.3
27.7
76.9
432.
20.
4A
pril
4.5
0.0
0.1
0.0
0.3
28.7
76.1
434.
60.
4M
ay4.
40.
10.
00.
00.
331
.379
.945
6.3
0.4
June
4.4
0.0
0.0
0.0
0.3
35.6
84.0
475.
70.
4Ju
ly4.
50.
00.
10.
00.
336
.287
.360
3.5
0.4
Aug
ust
3.3
0.0
0.1
0.0
0.2
37.6
91.2
617.
30.
5S
epte
mbe
r3.
20.
00.
40.
00.
244
.091
.954
8.7
0.4
Oct
ober
3.4
0.0
0.9
0.3
0.2
43.2
99.1
556.
70.
4N
ovem
ber
3.6
0.0
0.9
0.2
0.2
43.4
107.
057
3.6
0.4
Dec
embe
r4.
50.
01.
00.
00.
246
.111
7.3
616.
70.
4
2007 Ja
nuar
y3.
80.
01.
00.
30.
247
.312
3.6
624.
90.
4Fe
brua
ry4.
10.
01.
20.
30.
349
.913
3.9
657.
70.
5M
arch
5.1
1.6
1.7
0.3
0.3
56.2
136.
770
3.1
0.5
Sour
ce: C
entra
l Ban
k of
Sol
omon
Isla
nds.
Tabl
e 14
b. S
olom
on Is
land
s: C
omm
erci
al B
ank
Adva
nces
and
Loa
ns, 2
002–
07(In
milli
ons
of S
olom
on Is
land
s do
llars
)

26
Wei
ghte
d A
vera
geR
ate
of In
tere
stE
nd o
f Per
iod
From
To
From
To
From
ToFr
om T
oFr
om T
oO
n D
epos
its
2002
0.25
-0.
510.
50-
0.76
0.50
-1.
011.
00-
1.51
0.00
-1.
510.
6420
030.
25-
0.50
0.50
-1.
000.
50-
1.50
0.50
-2.
250.
50-
3.00
0.94
2004
0.25
-2.
000.
25-
1.00
0.50
-1.
250.
50-
1.50
0.00
-2.
000.
9520
050.
25-
2.00
0.25
-1.
000.
25-
1.25
0.25
-1.
500.
00-
2.25
0.94
2006
0.25
-2.
000.
25-
1.00
0.25
-1.
250.
25-
1.50
0.00
-2.
250.
94
2005 Ja
nuar
y0.
25-
2.00
0.25
-1.
000.
50-
1.25
0.50
-1.
500.
00-
2.00
0.95
Febr
uary
0.25
-2.
000.
25-
0.75
0.25
-1.
000.
25-
1.50
0.00
-1.
500.
80M
arch
0.25
-2.
000.
25-
1.00
0.25
-1.
250.
25-
1.50
0.00
-2.
250.
95A
pril
0.25
-2.
000.
25-
1.00
0.25
-1.
250.
25-
1.50
0.00
-2.
250.
98M
ay0.
25-
2.00
0.25
-1.
000.
25-
1.25
0.25
-1.
500.
00-
2.25
0.95
June
0.25
-2.
000.
25-
1.00
0.25
-1.
250.
25-
1.50
0.00
-2.
250.
95Ju
ly0.
25-
2.00
0.25
-1.
000.
25-
1.25
0.25
-1.
500.
00-
2.25
0.95
Aug
ust
0.25
-2.
000.
25-
1.00
0.25
-1.
250.
25-
1.50
0.00
-2.
250.
94S
epte
mbe
r0.
25-
2.00
0.25
-1.
000.
25-
1.25
0.25
-1.
500.
00-
2.25
0.94
Oct
obe r
0.25
-2.
000.
25-
1.00
0.25
-1.
250.
25-
1.50
0.00
-2.
250.
94N
ovem
ber
0.25
-2.
000.
25-
1.00
0.25
-1.
250.
25-
1.50
0.00
-2.
250.
94D
ecem
ber
0.25
-2.
000.
25-
1.00
0.25
-1.
250.
25-
1.50
0.00
-2.
250.
94
2006 Ja
nuar
y0.
25-
2.00
0.25
-1.
000.
25-
1.25
0.25
-1.
500.
00-
2.25
0.94
Febr
uary
0.25
-2.
000.
25-
1.00
0.25
-1.
250.
25-
1.50
0.00
-2.
250.
94M
arch
0.25
-2.
000.
25-
1.00
0.25
-1.
250.
25-
1.50
0.00
-2.
250.
94A
pril
0.25
-2.
000.
25-
1.00
0.25
-1.
250.
25-
1.50
0.00
-2.
250.
94M
ay0.
25-
2.00
0.25
-1.
000.
25-
1.25
0.50
-1.
500.
00-
2.25
0.99
June
0.25
-2.
000.
25-
1.00
0.25
-1.
250.
50-
1.50
0.00
-2.
250.
98Ju
ly0.
25-
2.00
0.25
-1.
000.
25-
1.25
0.25
-1.
500.
00-
2.25
0.94
Aug
ust
0.25
-2.
000.
25-
1.00
0.25
-1.
250.
25-
1.50
0.00
-2.
250.
94S
epte
mbe
r0.
25-
2.00
0.25
-1.
000.
25-
1.25
0.25
-1.
500.
00-
2.25
0.94
Oct
obe r
0.25
-2.
000.
25-
1.00
0.25
-1.
250.
25-
1.50
0.00
-2.
250.
94N
ovem
ber
0.25
-2.
000.
25-
1.00
0.25
-1.
250.
25-
1.50
0.00
-2.
250.
94D
ecem
ber
0.25
-2.
000.
25-
1.00
0.25
-1.
250.
25-
1.50
0.00
-2.
250.
94
2007 Ja
nuar
y0.
25-
2.00
0.25
-1.
000.
25-
1.25
0.25
-1.
500.
00-
2.25
0.94
Febr
uary
0.25
-2.
000.
25-
1.00
0.25
-1.
250.
25-
1.50
0.00
-2.
250.
94M
arch
0.25
-2.
000.
25-
1.00
0.25
-1.
250.
25-
1.50
0.00
-2.
250.
94
Sou
rce:
Cen
tral B
ank
of S
olom
on Is
land
s.
12 M
onth
s
Tabl
e 15
. Sol
omon
Isla
nds:
Com
mer
cial
Ban
k In
tere
st R
ates
on
Savi
ngs
and
Tim
e D
epos
its, 2
002–
07
Tim
e D
epos
its
Sav
ings
Dep
osits
Up
to 3
Mon
ths
3–6
Mon
ths
6–12
Mon
ths
(In p
erce
nt, e
nd o
f per
iod)
Ove
r
27
Weighted Average Rate of Interest on
End of Period Loans and Overdrafts
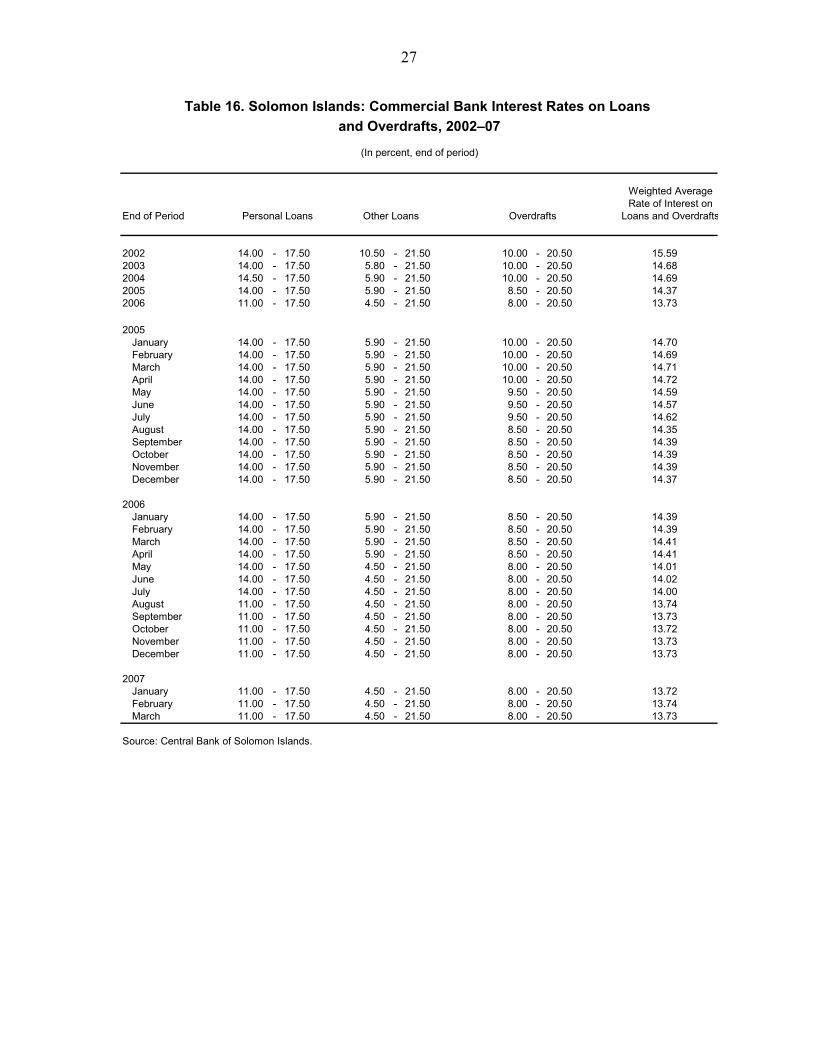
2002 14.00 - 17.50 10.50 - 21.50 10.00 - 20.50 15.592003 14.00 - 17.50 5.80 - 21.50 10.00 - 20.50 14.682004 14.50 - 17.50 5.90 - 21.50 10.00 - 20.50 14.692005 14.00 - 17.50 5.90 - 21.50 8.50 - 20.50 14.372006 11.00 - 17.50 4.50 - 21.50 8.00 - 20.50 13.73
2005January 14.00 - 17.50 5.90 - 21.50 10.00 - 20.50 14.70February 14.00 - 17.50 5.90 - 21.50 10.00 - 20.50 14.69March 14.00 - 17.50 5.90 - 21.50 10.00 - 20.50 14.71April 14.00 - 17.50 5.90 - 21.50 10.00 - 20.50 14.72May 14.00 - 17.50 5.90 - 21.50 9.50 - 20.50 14.59June 14.00 - 17.50 5.90 - 21.50 9.50 - 20.50 14.57July 14.00 - 17.50 5.90 - 21.50 9.50 - 20.50 14.62August 14.00 - 17.50 5.90 - 21.50 8.50 - 20.50 14.35September 14.00 - 17.50 5.90 - 21.50 8.50 - 20.50 14.39October 14.00 - 17.50 5.90 - 21.50 8.50 - 20.50 14.39November 14.00 - 17.50 5.90 - 21.50 8.50 - 20.50 14.39December 14.00 - 17.50 5.90 - 21.50 8.50 - 20.50 14.37
2006January 14.00 - 17.50 5.90 - 21.50 8.50 - 20.50 14.39February 14.00 - 17.50 5.90 - 21.50 8.50 - 20.50 14.39March 14.00 - 17.50 5.90 - 21.50 8.50 - 20.50 14.41April 14.00 - 17.50 5.90 - 21.50 8.50 - 20.50 14.41May 14.00 - 17.50 4.50 - 21.50 8.00 - 20.50 14.01June 14.00 - 17.50 4.50 - 21.50 8.00 - 20.50 14.02July 14.00 - 17.50 4.50 - 21.50 8.00 - 20.50 14.00August 11.00 - 17.50 4.50 - 21.50 8.00 - 20.50 13.74September 11.00 - 17.50 4.50 - 21.50 8.00 - 20.50 13.73October 11.00 - 17.50 4.50 - 21.50 8.00 - 20.50 13.72November 11.00 - 17.50 4.50 - 21.50 8.00 - 20.50 13.73December 11.00 - 17.50 4.50 - 21.50 8.00 - 20.50 13.73
2007January 11.00 - 17.50 4.50 - 21.50 8.00 - 20.50 13.72February 11.00 - 17.50 4.50 - 21.50 8.00 - 20.50 13.74March 11.00 - 17.50 4.50 - 21.50 8.00 - 20.50 13.73
Source: Central Bank of Solomon Islands.
Table 16. Solomon Islands: Commercial Bank Interest Rates on Loans and Overdrafts, 2002–07
Overdrafts Personal Loans Other Loans
(In percent, end of period)

28 28
Ban
ksD
evel
op-
Res
truc-
Loan
s to
Loan
s to
Fixe
dC
ontri
-Ac
cum
u-O
ther
Tota
l E
nd o
fTe
rmTr
easu
rym
ent
ture
dS
tatu
tory
Priv
ate
Asse
tsO
the r
butio
nla
ted
Liab
i-A
sset
s an
dP
erio
dD
epos
itsB
ills
Bon
dsBo
nds
Aut
horit
ies
Sec
tor 1
/(N
et) 2
/A
sset
sAc
coun
tFu
nds
litie
sLi
abili
ties
2002
25.3
0.0
38.8
55.5
62.4
54.9
40.1
92.9
316.
945
.08.
036
9.9
2003
43.8
0.
038
.855
.567
.451
.540
.710
4.6
340.
146
.116
.140
2.3
2004
73.3
0.0
74.2
51.9
64.3
46.3
58.2
106.
541
0.1
9.6
52.6
474.
720
0513
1.5
1.1
70.4
49.8
57.7
39.7
21.2
153.
545
9.2
8.1
57.7
525.
020
0618
4.5
4.3
66.9
48.3
44.8
32.8
55.7
158.
352
5.0
35.3
35.3
595.
6
2005 Ja
nuar
y78
.30.
074
.251
.263
.846
.157
.910
7.9
415.
29.
255
.147
9.5
Febr
uary
82.3
0.0
74.2
50.4
63.7
45.5
57.7
108.
141
8.3
8.4
55.3
481.
9M
arch
84.3
0.0
74.3
49.8
63.5
44.5
57.4
107.
542
1.5
4.5
55.3
481.
4A
pril
89.3
3.5
74.5
49.2
61.0
44.2
57.1
105.
242
4.3
4.0
55.7
484.
0M
ay97
.35.
074
.648
.559
.143
.456
.810
3.2
429.
03.
455
.648
8.0
June
100.
36.
272
.151
.261
.442
.556
.311
7.3
434.
711
.561
.150
7.3
July
104.
98.
572
.350
.563
.942
.221
.314
6.3
438.
111
.060
.850
9.9
Aug
ust
106.
98.
672
.447
.662
.341
.921
.815
2.4
442.
111
.460
.351
3.8
Sep
tem
ber
114.
89.
272
.546
.261
.441
.621
.215
1.2
446.
411
.759
.851
8.0
Oct
ober
127.
99.
272
.641
.661
.440
.521
.114
8.0
452.
013
.656
.652
2.2
Nov
embe
r13
2.6
9.2
72.7
41.0
61.3
40.1
21.3
147.
145
5.2
13.7
56.4
525.
3D
ecem
ber
131.
51.
170
.449
.857
.739
.721
.215
3.5
459.
28.
157
.752
5.0
2006 Ja
nuar
y13
1.4
1.0
70.1
49.9
61.5
39.0
21.2
157.
340
1.9
10.8
118.
753
1.4
Febr
uary
130.
71.
069
.850
.061
.738
.921
.116
0.3
464.
311
.158
.153
3.5
Mar
ch12
9.2
3.4
69.5
49.8
62.0
37.9
21.3
166.
746
7.5
14.8
57.5
539.
8A
pril
159.
14.
469
.249
.344
.937
.921
.416
1.3
471.
916
.858
.854
7.5
May
164.
25.
668
.948
.844
.935
.822
.016
8.6
476.
629
.752
.555
8.8
June
169.
35.
758
.648
.544
.935
.822
.217
7.5
489.
320
.752
.556
2.5
July
182.
83.
368
.748
.244
.934
.921
.315
9.9
493.
517
.453
.156
4.0
Aug
ust
185.
31.
868
.148
.344
.934
.922
.516
1.1
497.
816
.053
.156
6.9
Sep
tem
ber
185.
30.
867
.648
.044
.834
.624
.817
0.6
503.
819
.353
.457
6.5
Oct
ober
185.
32.
867
.548
.244
.834
.055
.314
2.2
509.
518
.152
.558
0.1
Nov
embe
r17
2.0
4.3
67.2
48.2
44.8
33.3
55.4
159.
152
0.1
29.7
34.5
584.
3D
ecem
ber
184.
54.
366
.948
.344
.832
.855
.715
8.3
525.
035
.335
.359
5.6
Sou
rce:
Nat
iona
l Pro
vide
nt F
und.
1/ In
clud
es s
taff
loan
s, W
este
rn P
rovi
nce
Hou
sing
Sch
eme,
and
NP
F H
ousi
ng S
chem
e.2/
Incl
udes
cas
h at
ban
k, a
ccru
ed in
tere
st, r
ent i
n ar
rear
s, a
nd b
ank
over
draf
ts.
(In m
illio
ns o
f Sol
omon
Isla
nds
dolla
rs)
Tabl
e 17
. Sol
omon
Isla
nds:
Ass
ets
and
Liab
ilitie
s of
the
Nat
iona
l Pro
vide
nt F
und,
200
2–06
Liab
ilitie
sA
sset
s
29
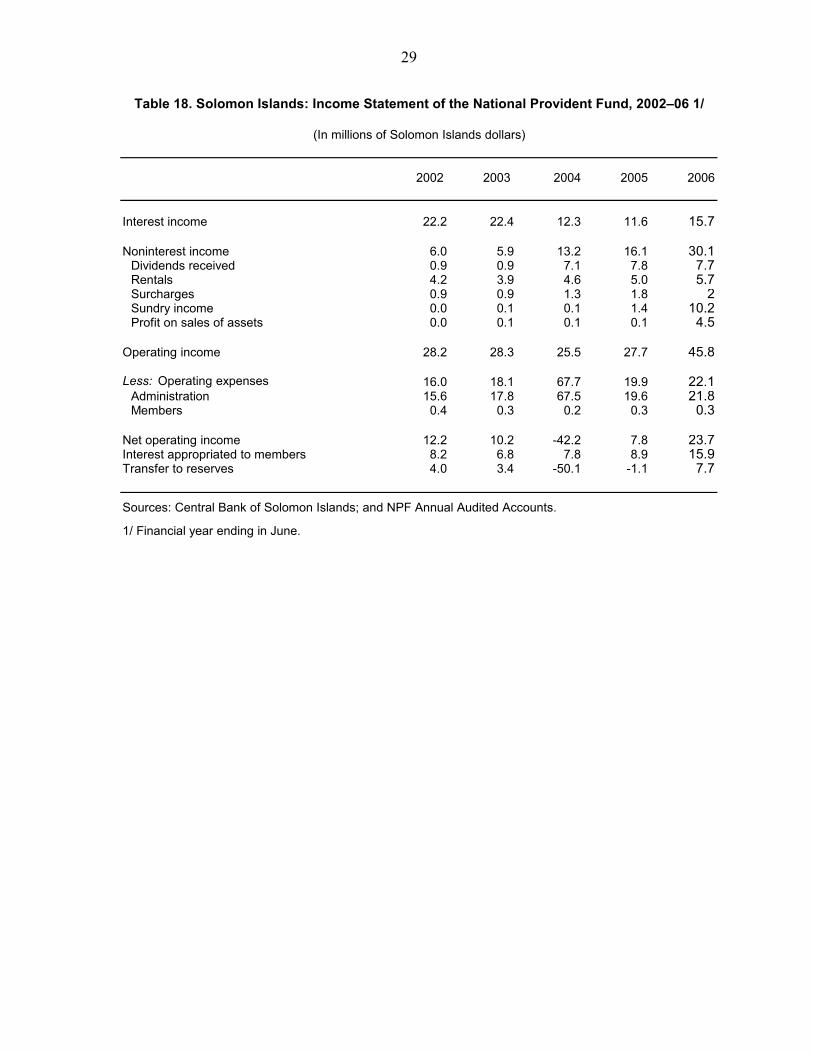
2002 2003 2004 2005 2006
Interest income 22.2 22.4 12.3 11.6 15.7
Noninterest income 6.0 5.9 13.2 16.1 30.1Dividends received 0.9 0.9 7.1 7.8 7.7Rentals 4.2 3.9 4.6 5.0 5.7Surcharges 0.9 0.9 1.3 1.8 2Sundry income 0.0 0.1 0.1 1.4 10.2Profit on sales of assets 0.0 0.1 0.1 0.1 4.5
Operating income 28.2 28.3 25.5 27.7 45.8
Less: Operating expenses 16.0 18.1 67.7 19.9 22.1Administration 15.6 17.8 67.5 19.6 21.8Members 0.4 0.3 0.2 0.3 0.3
Net operating income 12.2 10.2 -42.2 7.8 23.7Interest appropriated to members 8.2 6.8 7.8 8.9 15.9Transfer to reserves 4.0 3.4 -50.1 -1.1 7.7
Sources: Central Bank of Solomon Islands; and NPF Annual Audited Accounts.
1/ Financial year ending in June.
Table 18. Solomon Islands: Income Statement of the National Provident Fund, 2002–06 1/
(In millions of Solomon Islands dollars)
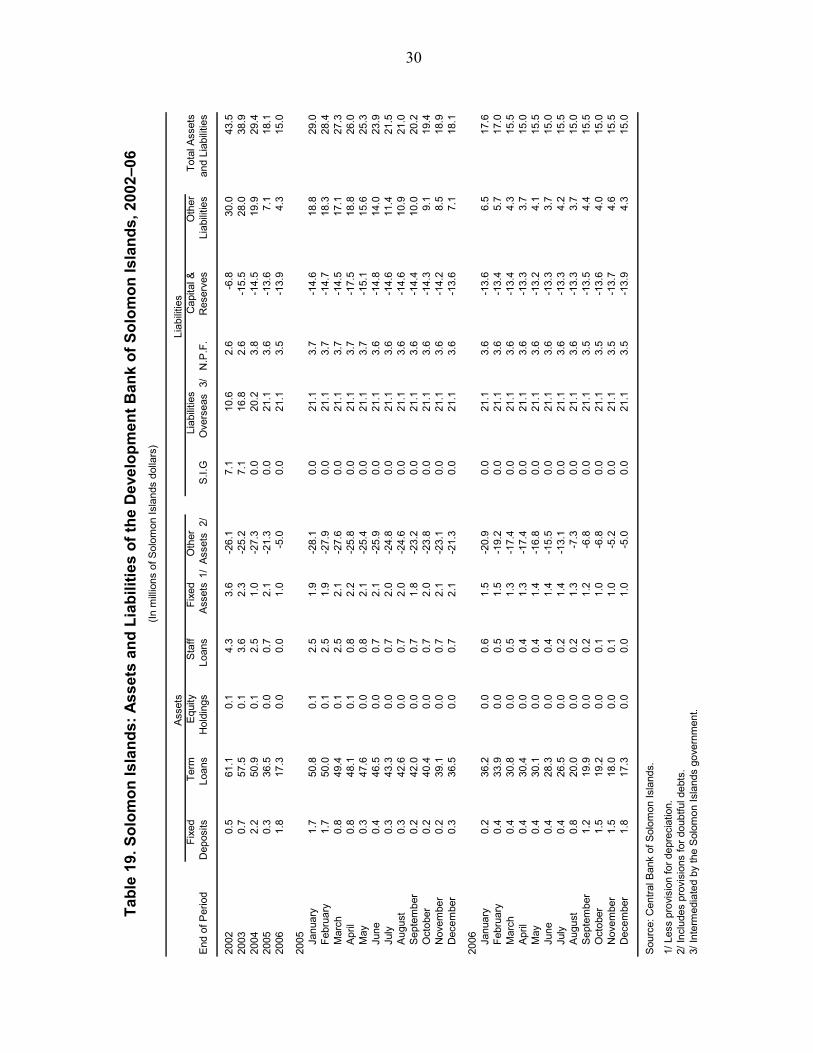
30
Asse
tsFi
xed
Term
Equ
ityS
taff
Fixe
dO
ther
Liab
ilitie
sC
apita
l &O
ther
Tota
l Ass
ets
End
of P
erio
dD
epos
itsLo
ans
Hol
ding
sLo
ans
Ass
ets
1/As
sets
2/
S.I.G
Ove
rsea
s 3/
N.P
.F.
Res
erve
sLi
abili
ties
and
Liab
ilitie
s
2002
0.5
61.1
0.1
4.3
3.6
-26.
17.
110
.62.
6-6
.830
.043
.520
030.
757
.50.
13.
62.
3-2
5.2
7.1
16.8
2.6
-15.
528
.038
.920
042.
250
.90.
12.
51.
0-2
7.3
0.0
20.2
3.8
-14.
519
.929
.420
050.
336
.50.
00.
72.
1-2
1.3
0.0
21.1
3.6
-13.
67.
118
.120
061.
817
.30.
00.
01.
0-5
.00.
021
.13.
5-1
3.9
4.3
15.0
2005 Ja
nuar
y1.
750
.80.
12.
51.
9-2
8.1
0.0
21.1
3.7
-14.
618
.829
.0Fe
brua
ry1.
750
.00.
12.
51.
9-2
7.9
0.0
21.1
3.7
-14.
718
.328
.4M
arch
0.8
49.4
0.1
2.5
2.1
-27.
60.
021
.13.
7-1
4.5
17.1
27.3
Apr
il0.
848
.10.
10.
82.
2-2
5.8
0.0
21.1
3.7
-17.
518
.826
.0M
ay0.
347
.60.
00.
82.
1-2
5.4
0.0
21.1
3.7
-15.
115
.625
.3Ju
ne0.
446
.50.
00.
72.
1-2
5.9
0.0
21.1
3.6
-14.
814
.023
.9Ju
ly0.
343
.30.
00.
72.
0-2
4.8
0.0
21.1
3.6
-14.
611
.421
.5A
ugus
t0.
342
.60.
00.
72.
0-2
4.6
0.0
21.1
3.6
-14.
610
.921
.0S
epte
mbe
r0.
242
.00.
00.
71.
8-2
3.2
0.0
21.1
3.6
-14.
410
.020
.2O
ctob
er0.
240
.40.
00.
72.
0-2
3.8
0.0
21.1
3.6
-14.
39.
119
.4N
ovem
ber
0.2
39.1
0.0
0.7
2.1
-23.
10.
021
.13.
6-1
4.2
8.5
18.9
Dec
embe
r0.
336
.50.
00.
72.
1-2
1.3
0.0
21.1
3.6
-13.
67.
118
.1
2006 Ja
nuar
y0.
236
.20.
00.
61.
5-2
0.9
0.0
21.1
3.6
-13.
66.
517
.6Fe
brua
ry0.
433
.90.
00.
51.
5-1
9.2
0.0
21.1
3.6
-13.
45.
717
.0M
arch
0.4
30.8
0.0
0.5
1.3
-17.
40.
021
.13.
6-1
3.4
4.3
15.5
Apr
il0.
430
.40.
00.
41.
3-1
7.4
0.0
21.1
3.6
-13.
33.
715
.0M
ay0.
430
.10.
00.
41.
4-1
6.8
0.0
21.1
3.6
-13.
24.
115
.5Ju
ne0.
428
.30.
00.
41.
4-1
5.5
0.0
21.1
3.6
-13.
33.
715
.0Ju
ly0.
426
.50.
00.
21.
4-1
3.1
0.0
21.1
3.6
-13.
34.
215
.5A
ugus
t0.
820
.00.
00.
21.
3-7
.30.
021
.13.
6-1
3.3
3.7
15.0
Sep
tem
ber
1.2
19.9
0.0
0.2
1.2
-6.8
0.0
21.1
3.5
-13.
54.
415
.5O
ctob
er1.
519
.20.
00.
11.
0-6
.80.
021
.13.
5-1
3.6
4.0
15.0
Nov
embe
r1.
518
.00.
00.
11.
0-5
.20.
021
.13.
5-1
3.7
4.6
15.5
Dec
embe
r1.
817
.30.
00.
01.
0-5
.00.
021
.13.
5-1
3.9
4.3
15.0
Sou
rce:
Cen
tral B
ank
of S
olom
on Is
land
s.
1/ L
ess
prov
isio
n fo
r dep
reci
atio
n.2/
Incl
udes
pro
visi
ons
for d
oubt
ful d
ebts
.3/
Inte
rmed
iate
d by
the
Sol
omon
Isla
nds
gove
rnm
ent.
(In m
illio
ns o
f Sol
omon
Isla
nds
dolla
rs)
Tabl
e 19
. Sol
omon
Isla
nds:
Ass
ets
and
Liab
ilitie
s of
the
Dev
elop
men
t Ban
k of
Sol
omon
Isla
nds,
200
2–06
Liab
ilitie
s
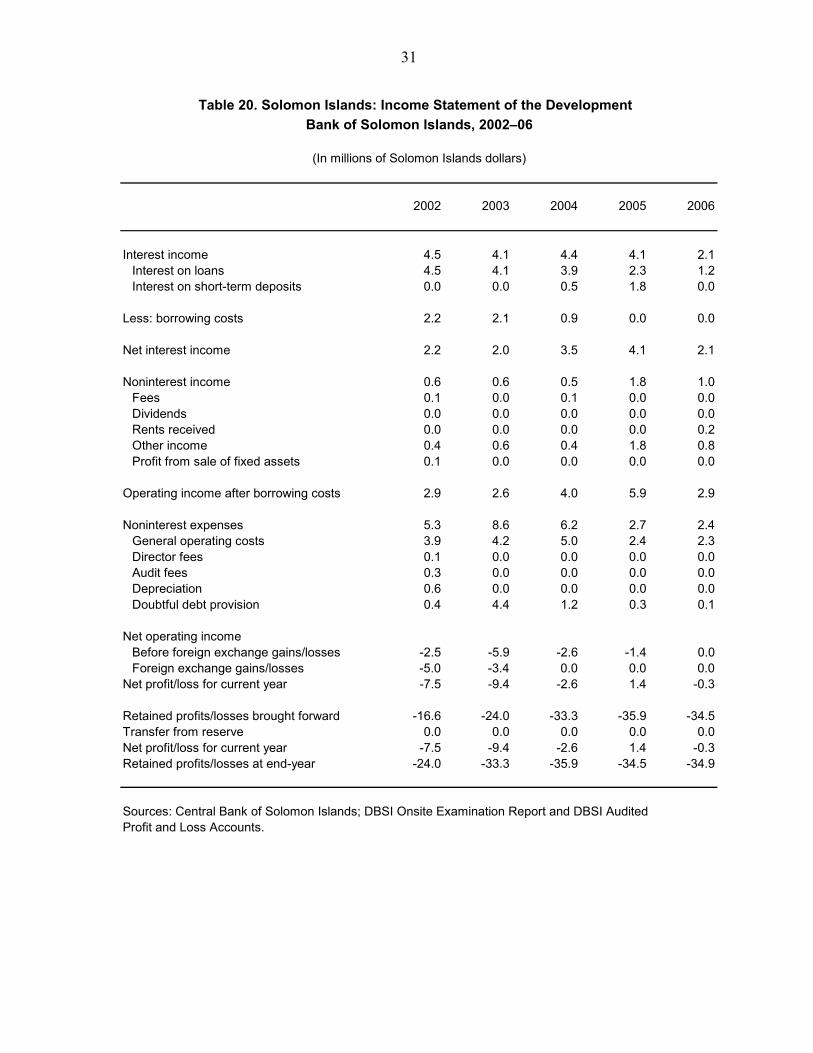
31
2002 2003 2004 2005 2006
Interest income 4.5 4.1 4.4 4.1 2.1Interest on loans 4.5 4.1 3.9 2.3 1.2Interest on short-term deposits 0.0 0.0 0.5 1.8 0.0
Less: borrowing costs 2.2 2.1 0.9 0.0 0.0
Net interest income 2.2 2.0 3.5 4.1 2.1
Noninterest income 0.6 0.6 0.5 1.8 1.0Fees 0.1 0.0 0.1 0.0 0.0Dividends 0.0 0.0 0.0 0.0 0.0Rents received 0.0 0.0 0.0 0.0 0.2Other income 0.4 0.6 0.4 1.8 0.8Profit from sale of fixed assets 0.1 0.0 0.0 0.0 0.0
Operating income after borrowing costs 2.9 2.6 4.0 5.9 2.9
Noninterest expenses 5.3 8.6 6.2 2.7 2.4General operating costs 3.9 4.2 5.0 2.4 2.3Director fees 0.1 0.0 0.0 0.0 0.0Audit fees 0.3 0.0 0.0 0.0 0.0Depreciation 0.6 0.0 0.0 0.0 0.0Doubtful debt provision 0.4 4.4 1.2 0.3 0.1
Net operating incomeBefore foreign exchange gains/losses -2.5 -5.9 -2.6 -1.4 0.0Foreign exchange gains/losses -5.0 -3.4 0.0 0.0 0.0
Net profit/loss for current year -7.5 -9.4 -2.6 1.4 -0.3
Retained profits/losses brought forward -16.6 -24.0 -33.3 -35.9 -34.5Transfer from reserve 0.0 0.0 0.0 0.0 0.0Net profit/loss for current year -7.5 -9.4 -2.6 1.4 -0.3Retained profits/losses at end-year -24.0 -33.3 -35.9 -34.5 -34.9
Sources: Central Bank of Solomon Islands; DBSI Onsite Examination Report and DBSI Audited Profit and Loss Accounts.
Table 20. Solomon Islands: Income Statement of the Development Bank of Solomon Islands, 2002–06
(In millions of Solomon Islands dollars)
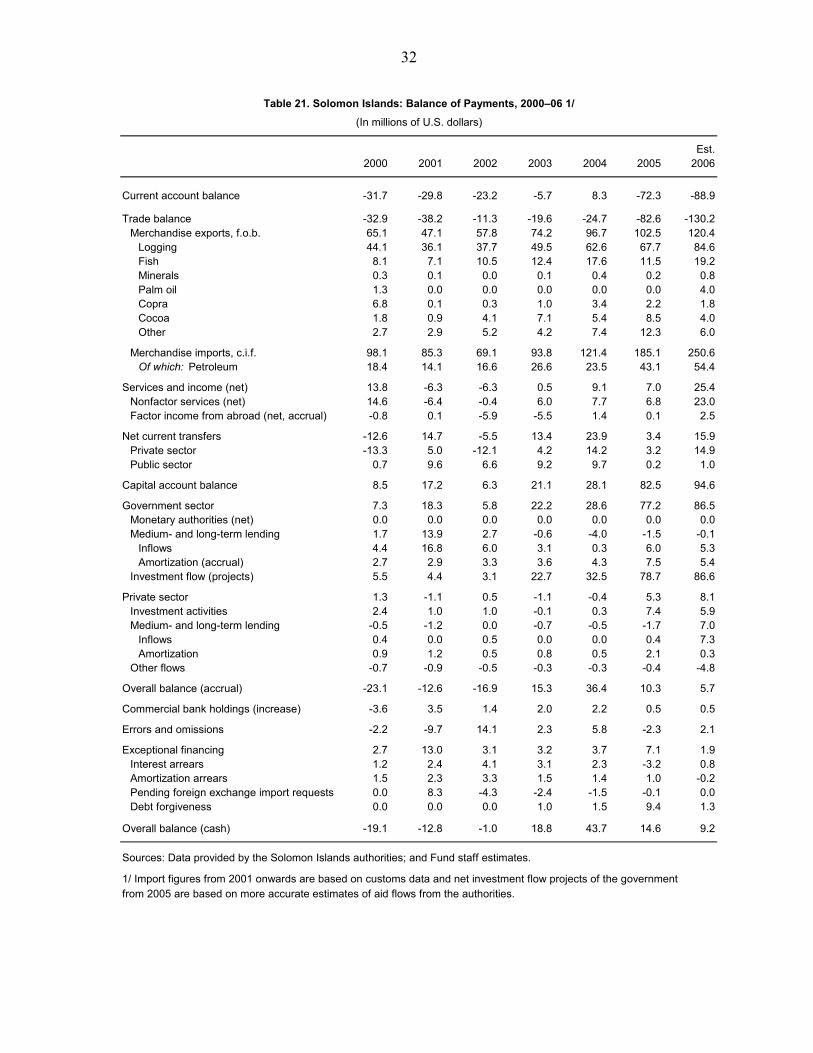
32
Est.2000 2001 2002 2003 2004 2005 2006
Current account balance -31.7 -29.8 -23.2 -5.7 8.3 -72.3 -88.9
Trade balance -32.9 -38.2 -11.3 -19.6 -24.7 -82.6 -130.2Merchandise exports, f.o.b. 65.1 47.1 57.8 74.2 96.7 102.5 120.4
Logging 44.1 36.1 37.7 49.5 62.6 67.7 84.6Fish 8.1 7.1 10.5 12.4 17.6 11.5 19.2Minerals 0.3 0.1 0.0 0.1 0.4 0.2 0.8Palm oil 1.3 0.0 0.0 0.0 0.0 0.0 4.0Copra 6.8 0.1 0.3 1.0 3.4 2.2 1.8Cocoa 1.8 0.9 4.1 7.1 5.4 8.5 4.0Other 2.7 2.9 5.2 4.2 7.4 12.3 6.0
Merchandise imports, c.i.f. 98.1 85.3 69.1 93.8 121.4 185.1 250.6Of which: Petroleum 18.4 14.1 16.6 26.6 23.5 43.1 54.4
Services and income (net) 13.8 -6.3 -6.3 0.5 9.1 7.0 25.4Nonfactor services (net) 14.6 -6.4 -0.4 6.0 7.7 6.8 23.0Factor income from abroad (net, accrual) -0.8 0.1 -5.9 -5.5 1.4 0.1 2.5
Net current transfers -12.6 14.7 -5.5 13.4 23.9 3.4 15.9Private sector -13.3 5.0 -12.1 4.2 14.2 3.2 14.9Public sector 0.7 9.6 6.6 9.2 9.7 0.2 1.0
Capital account balance 8.5 17.2 6.3 21.1 28.1 82.5 94.6
Government sector 7.3 18.3 5.8 22.2 28.6 77.2 86.5Monetary authorities (net) 0.0 0.0 0.0 0.0 0.0 0.0 0.0Medium- and long-term lending 1.7 13.9 2.7 -0.6 -4.0 -1.5 -0.1
Inflows 4.4 16.8 6.0 3.1 0.3 6.0 5.3Amortization (accrual) 2.7 2.9 3.3 3.6 4.3 7.5 5.4
Investment flow (projects) 5.5 4.4 3.1 22.7 32.5 78.7 86.6
Private sector 1.3 -1.1 0.5 -1.1 -0.4 5.3 8.1Investment activities 2.4 1.0 1.0 -0.1 0.3 7.4 5.9Medium- and long-term lending -0.5 -1.2 0.0 -0.7 -0.5 -1.7 7.0
Inflows 0.4 0.0 0.5 0.0 0.0 0.4 7.3Amortization 0.9 1.2 0.5 0.8 0.5 2.1 0.3
Other flows -0.7 -0.9 -0.5 -0.3 -0.3 -0.4 -4.8
Overall balance (accrual) -23.1 -12.6 -16.9 15.3 36.4 10.3 5.7
Commercial bank holdings (increase) -3.6 3.5 1.4 2.0 2.2 0.5 0.5
Errors and omissions -2.2 -9.7 14.1 2.3 5.8 -2.3 2.1
Exceptional financing 2.7 13.0 3.1 3.2 3.7 7.1 1.9Interest arrears 1.2 2.4 4.1 3.1 2.3 -3.2 0.8Amortization arrears 1.5 2.3 3.3 1.5 1.4 1.0 -0.2Pending foreign exchange import requests 0.0 8.3 -4.3 -2.4 -1.5 -0.1 0.0Debt forgiveness 0.0 0.0 0.0 1.0 1.5 9.4 1.3
Overall balance (cash) -19.1 -12.8 -1.0 18.8 43.7 14.6 9.2
Sources: Data provided by the Solomon Islands authorities; and Fund staff estimates.
1/ Import figures from 2001 onwards are based on customs data and net investment flow projects of the government from 2005 are based on more accurate estimates of aid flows from the authorities.
Table 21. Solomon Islands: Balance of Payments, 2000–06 1/(In millions of U.S. dollars)

33
Est.2000 2001 2002 2003 2004 2005 2006
Terms of trade -5.0 0.3 -20.1 -16.6 -11.2 -12.6 8.3
Export indicesValue -48.1 -27.6 22.6 28.4 30.4 5.9 17.5Volume -40.4 -13.2 7.0 38.7 31.9 9.3 -2.2Unit price -13.0 -16.7 14.6 -7.4 -1.2 -3.1 20.1
Import indicesValue -11.9 -13.0 -19.0 35.7 29.4 52.4 35.4Volume -14.7 -6.2 -21.2 20.1 10.1 37.5 22.1Unit price 3.3 -7.2 2.8 13.0 17.5 10.8 10.9
Current account balance Including transfers -10.6 -10.9 -10.2 -2.5 3.1 -24.2 -26.5Excluding transfers -10.8 -14.4 -13.1 -6.4 -0.5 -24.3 -26.8
Sources: Data provided by the Solomon Islands authorities; and Fund staff estimates.
(Percentage change)
(In percent of GDP)
Table 22. Solomon Islands: Trade Indicators, 2000–06

34
Est.2000 2001 2002 2003 2004 2005 2006
Timber, logs (cubic meters)Value 44,100 36,085 37,659 49,480 62,551 67,744 84,576Unit value 1/ 82 68 68 67 60 61 71Volume 536,000 534,000 550,000 736,000 1,043,000 1,117,928 1,188,000Unit value change -1.2 -17.9 1.3 -1.8 -10.8 1.0 17.5
FishValue 8,091 7,074 10,484 12,373 17,643 11,542 19,168Unit value 1/ 382 399 566 441 647 484 648Volume 21,163 17,720 18,520 28,072 27,249 23,853 29,597Unit value change -44.2 4.4 41.8 -22.1 46.9 -25.3 33.8
CopraValue 6,827 82 329 1,042 3,413 2,180 1,848Unit value 1/ 359 48 190 70 156 83 87Volume 19,004 1,701 1,731 14,848 21,831 26,182 21,214Unit value change 2.8 -86.6 294.6 -63.0 122.8 -46.7 4.6
Cocoa Value 1,823 859 4,109 7,086 5,400 8,542 3,976Unit value 1/ 787 422 1,413 1,545 1,292 1,733 1,039Volume 2,316 2,038 2,907 4,587 4,181 4,928 3,828Unit value change -62.6 -46.4 235.2 9.3 -16.4 34.2 -40.1
Palm oilValue 1,290 45 0 0 0 0 4,037Unit value 1/ … ... ... ... … … 744Volume 0 0 0 0 0 0 5,427Unit value change … -96.5 ... ... … … …
Other (value) 2,972 2,972 5,210 4,229 7,740 12,457 6,788
Total exports, f.o.b. 65,102 47,118 57,790 74,210 96,747 102,465 120,393
Sources: Data provided by the Solomon Islands authorities; and Fund staff estimates.
1/ Unit values reported are implied by data on the total volume and value of exports.
Table 23. Solomon Islands: Composition of Exports, 2000–06
(Total values in thousands of U.S. dollars; unit values in U.S. dollars; volumes in metric tons unless noted otherwise)
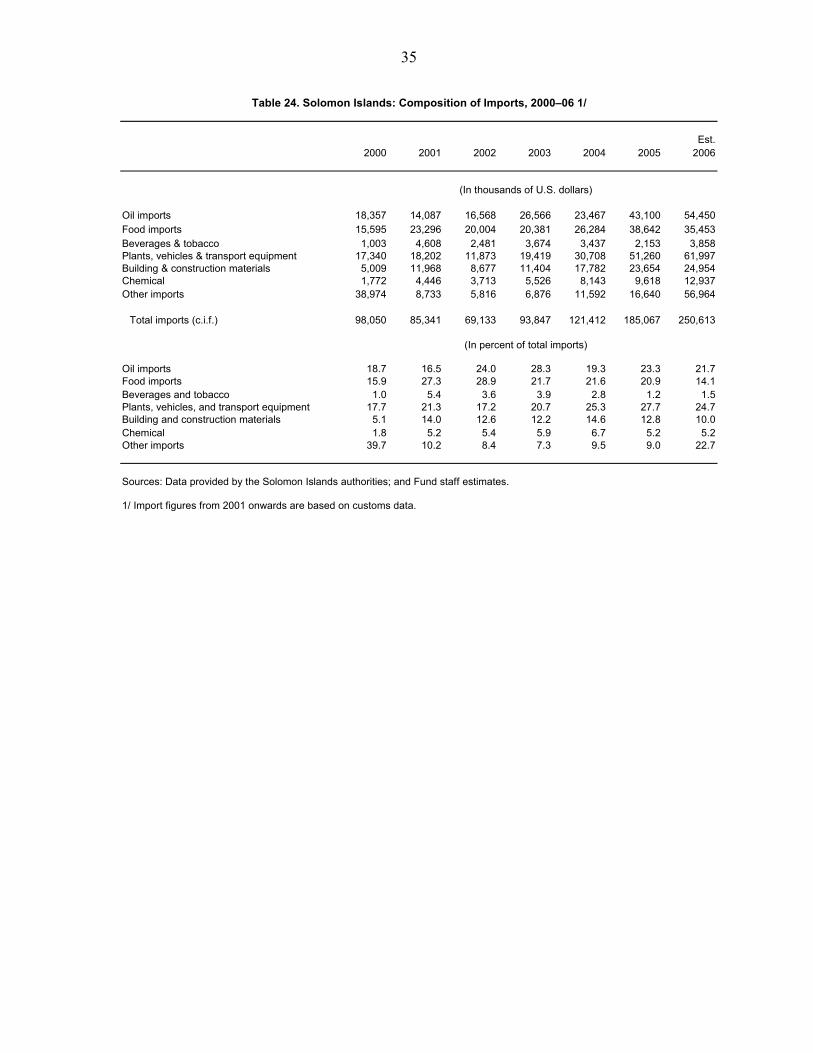
35
Est.2000 2001 2002 2003 2004 2005 2006
Oil imports 18,357 14,087 16,568 26,566 23,467 43,100 54,450Food imports 15,595 23,296 20,004 20,381 26,284 38,642 35,453Beverages & tobacco 1,003 4,608 2,481 3,674 3,437 2,153 3,858Plants, vehicles & transport equipment 17,340 18,202 11,873 19,419 30,708 51,260 61,997Building & construction materials 5,009 11,968 8,677 11,404 17,782 23,654 24,954Chemical 1,772 4,446 3,713 5,526 8,143 9,618 12,937Other imports 38,974 8,733 5,816 6,876 11,592 16,640 56,964
Total imports (c.i.f.) 98,050 85,341 69,133 93,847 121,412 185,067 250,613
Oil imports 18.7 16.5 24.0 28.3 19.3 23.3 21.7Food imports 15.9 27.3 28.9 21.7 21.6 20.9 14.1Beverages and tobacco 1.0 5.4 3.6 3.9 2.8 1.2 1.5Plants, vehicles, and transport equipment 17.7 21.3 17.2 20.7 25.3 27.7 24.7Building and construction materials 5.1 14.0 12.6 12.2 14.6 12.8 10.0Chemical 1.8 5.2 5.4 5.9 6.7 5.2 5.2Other imports 39.7 10.2 8.4 7.3 9.5 9.0 22.7
Sources: Data provided by the Solomon Islands authorities; and Fund staff estimates.
1/ Import figures from 2001 onwards are based on customs data.
Table 24. Solomon Islands: Composition of Imports, 2000–06 1/
(In thousands of U.S. dollars)
(In percent of total imports)

36
Est.2000 2001 2002 2003 2004 2005 2006
Industrial countries 35.4 29.4 22.7 19.2 20.4 17.3 16.8Of which:
Japan 20.8 19.7 19.2 12.9 9.3 6.4 8.5European Union 10.6 4.9 1.9 2.2 7.0 8.3 5.4Australia 2.6 1.5 0.8 2.6 2.1 1.3 1.2New Zealand 0.7 0.3 0.2 0.5 0.3 0.3 0.7Other 0.7 3.0 0.6 1.0 1.7 1.0 1.1
Asia 1/ 58.2 62.0 69.2 72.9 72.3 75.6 75.8Of which:
Korea 16.3 17.8 14.7 17.0 16.2 13.5 14.0China 14.0 10.6 20.1 24.6 26.9 42.3 45.7Philippines 9.7 8.5 9.4 7.9 4.6 4.6 4.0Thailand 5.1 8.6 6.9 5.9 15.1 7.1 4.4Singapore 0.8 1.1 3.7 5.3 2.8 1.5 1.2Malaysia 1.6 1.5 2.2 1.9 1.0 1.3 1.2Papua New Guinea 1.2 1.5 1.4 1.4 1.3 1.3 1.3Other 9.6 12.5 10.7 8.9 4.4 4.1 3.9
Other countries 6.4 8.6 8.1 7.9 7.3 7.0 7.3
Source: IMF, Direction of Trade Statistics.
1/ Excluding Japan.
Table 25. Solomon Islands: Exports by Country of Destination, 2000–06
(Percent of total)
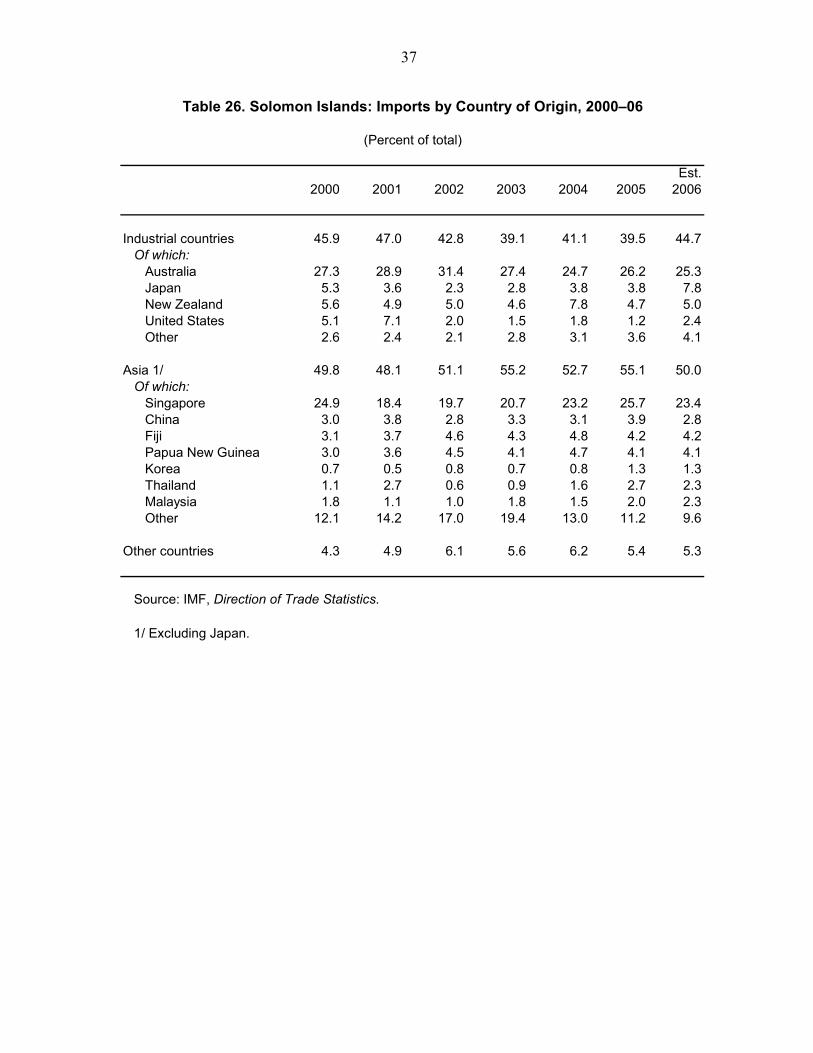
37
Est.2000 2001 2002 2003 2004 2005 2006
Industrial countries 45.9 47.0 42.8 39.1 41.1 39.5 44.7Of which:
Australia 27.3 28.9 31.4 27.4 24.7 26.2 25.3Japan 5.3 3.6 2.3 2.8 3.8 3.8 7.8New Zealand 5.6 4.9 5.0 4.6 7.8 4.7 5.0United States 5.1 7.1 2.0 1.5 1.8 1.2 2.4Other 2.6 2.4 2.1 2.8 3.1 3.6 4.1
Asia 1/ 49.8 48.1 51.1 55.2 52.7 55.1 50.0Of which:
Singapore 24.9 18.4 19.7 20.7 23.2 25.7 23.4China 3.0 3.8 2.8 3.3 3.1 3.9 2.8Fiji 3.1 3.7 4.6 4.3 4.8 4.2 4.2Papua New Guinea 3.0 3.6 4.5 4.1 4.7 4.1 4.1Korea 0.7 0.5 0.8 0.7 0.8 1.3 1.3Thailand 1.1 2.7 0.6 0.9 1.6 2.7 2.3Malaysia 1.8 1.1 1.0 1.8 1.5 2.0 2.3Other 12.1 14.2 17.0 19.4 13.0 11.2 9.6
Other countries 4.3 4.9 6.1 5.6 6.2 5.4 5.3
Source: IMF, Direction of Trade Statistics.
1/ Excluding Japan.
Table 26. Solomon Islands: Imports by Country of Origin, 2000–06
(Percent of total)

38
Est.2000 2001 2002 2003 2004 2005 2006
Services and income 13.8 -6.3 -6.3 0.5 9.1 7.0 25.4
Nonfactor services (net) 14.6 -6.4 -0.4 6.0 7.7 6.8 23.0
Exports 48.6 24.7 16.7 21.2 30.4 36.3 53.1Transportation 0.6 1.2 1.0 1.0 0.4 1.2 1.4Travel 3.6 2.2 1.5 2.3 4.4 3.3 4.1Communications 1.8 0.0 2.8 0.1 0.1 1.4 1.3Financial services 21.7 7.9 0.1 0.9 1.2 0.6 4.1Other 20.8 13.4 11.3 17.0 24.2 29.8 42.2
Imports 34.0 31.1 17.1 15.3 22.7 29.4 30.2Transportation 4.6 3.3 3.8 3.1 6.0 8.7 9.9Travel 8.7 6.5 4.4 4.5 4.4 4.7 4.1Communications 2.7 1.6 1.8 2.2 1.6 1.9 1.7Financial services 2.8 6.2 1.7 0.8 1.6 1.9 2.9Other 15.3 13.5 5.5 4.6 9.1 12.2 11.7
Factor income (net) -0.8 0.1 -5.9 -5.5 1.4 0.1 2.5Credit 7.2 6.2 2.7 3.5 8.5 8.5 11.4
Official interest 2.7 1.1 0.5 0.7 2.5 3.1 4.4Other 4.5 5.1 2.2 2.8 6.0 5.3 7.0
Debit 8.0 6.1 8.6 9.0 7.1 8.3 9.0Official interest (accrual) 1.8 2.9 4.4 5.2 3.2 2.5 2.1Other 6.2 3.2 4.3 3.8 3.9 5.9 6.8
Current transfers (net) -12.6 14.7 -5.5 13.4 23.9 3.4 15.9Private sector -13.3 5.0 -12.1 4.2 14.2 3.2 14.9
Receipts 16.5 24.0 15.9 18.4 37.1 35.0 50.1Payments 29.7 19.0 28.1 14.2 22.9 31.8 35.2
Public sector 0.7 9.6 6.6 9.2 9.7 0.2 1.0Receipts 2.2 10.0 7.3 14.3 11.6 5.3 7.1Payments 1.5 0.4 0.7 5.2 1.9 5.1 6.1
Sources: Data provided by the Solomon Islands authorities; and Fund staff estimates.
Table 27. Solomon Islands: Services, Income, and Transfers, 2000–06
(In millions of U.S. dollars)
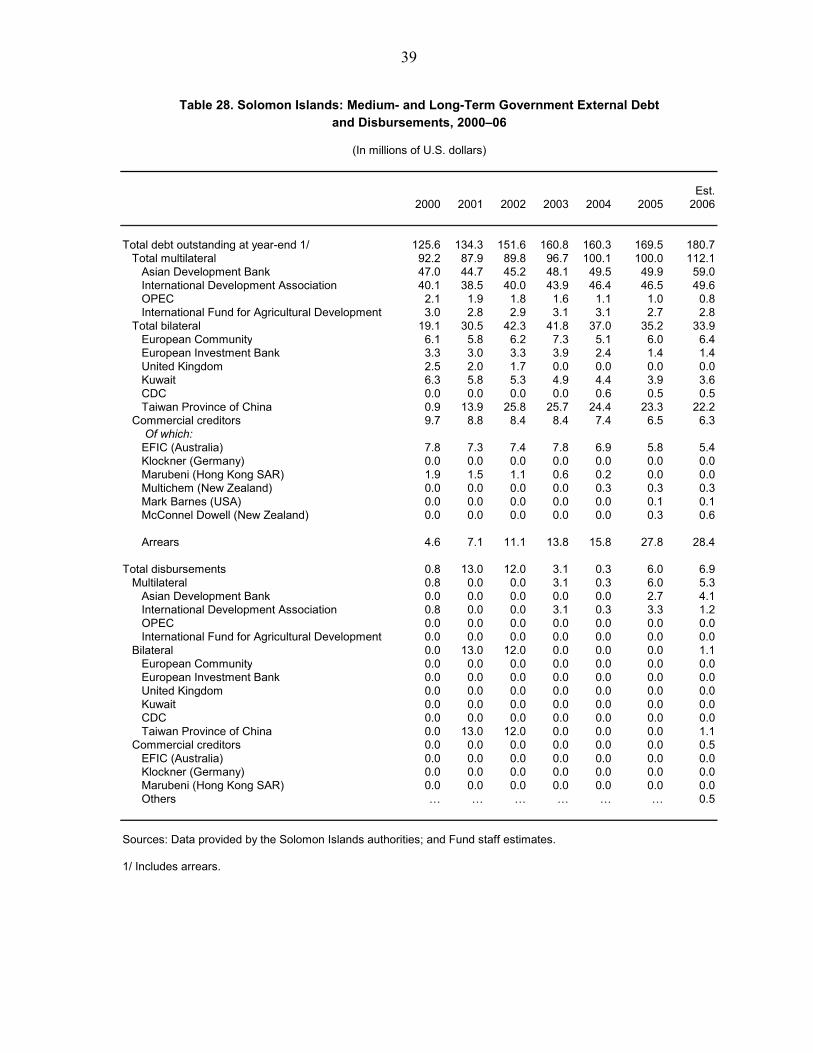
39
Est.2000 2001 2002 2003 2004 2005 2006
Total debt outstanding at year-end 1/ 125.6 134.3 151.6 160.8 160.3 169.5 180.7Total multilateral 92.2 87.9 89.8 96.7 100.1 100.0 112.1
Asian Development Bank 47.0 44.7 45.2 48.1 49.5 49.9 59.0International Development Association 40.1 38.5 40.0 43.9 46.4 46.5 49.6OPEC 2.1 1.9 1.8 1.6 1.1 1.0 0.8International Fund for Agricultural Development 3.0 2.8 2.9 3.1 3.1 2.7 2.8
Total bilateral 19.1 30.5 42.3 41.8 37.0 35.2 33.9European Community 6.1 5.8 6.2 7.3 5.1 6.0 6.4European Investment Bank 3.3 3.0 3.3 3.9 2.4 1.4 1.4United Kingdom 2.5 2.0 1.7 0.0 0.0 0.0 0.0Kuwait 6.3 5.8 5.3 4.9 4.4 3.9 3.6CDC 0.0 0.0 0.0 0.0 0.6 0.5 0.5Taiwan Province of China 0.9 13.9 25.8 25.7 24.4 23.3 22.2
Commercial creditors 9.7 8.8 8.4 8.4 7.4 6.5 6.3 Of which:
EFIC (Australia) 7.8 7.3 7.4 7.8 6.9 5.8 5.4Klockner (Germany) 0.0 0.0 0.0 0.0 0.0 0.0 0.0Marubeni (Hong Kong SAR) 1.9 1.5 1.1 0.6 0.2 0.0 0.0Multichem (New Zealand) 0.0 0.0 0.0 0.0 0.3 0.3 0.3Mark Barnes (USA) 0.0 0.0 0.0 0.0 0.0 0.1 0.1McConnel Dowell (New Zealand) 0.0 0.0 0.0 0.0 0.0 0.3 0.6 Arrears 4.6 7.1 11.1 13.8 15.8 27.8 28.4
Total disbursements 0.8 13.0 12.0 3.1 0.3 6.0 6.9Multilateral 0.8 0.0 0.0 3.1 0.3 6.0 5.3
Asian Development Bank 0.0 0.0 0.0 0.0 0.0 2.7 4.1International Development Association 0.8 0.0 0.0 3.1 0.3 3.3 1.2OPEC 0.0 0.0 0.0 0.0 0.0 0.0 0.0International Fund for Agricultural Development 0.0 0.0 0.0 0.0 0.0 0.0 0.0
Bilateral 0.0 13.0 12.0 0.0 0.0 0.0 1.1European Community 0.0 0.0 0.0 0.0 0.0 0.0 0.0European Investment Bank 0.0 0.0 0.0 0.0 0.0 0.0 0.0United Kingdom 0.0 0.0 0.0 0.0 0.0 0.0 0.0Kuwait 0.0 0.0 0.0 0.0 0.0 0.0 0.0CDC 0.0 0.0 0.0 0.0 0.0 0.0 0.0Taiwan Province of China 0.0 13.0 12.0 0.0 0.0 0.0 1.1
Commercial creditors 0.0 0.0 0.0 0.0 0.0 0.0 0.5EFIC (Australia) 0.0 0.0 0.0 0.0 0.0 0.0 0.0Klockner (Germany) 0.0 0.0 0.0 0.0 0.0 0.0 0.0Marubeni (Hong Kong SAR) 0.0 0.0 0.0 0.0 0.0 0.0 0.0Others … … … … … … 0.5
Sources: Data provided by the Solomon Islands authorities; and Fund staff estimates.
1/ Includes arrears.
Table 28. Solomon Islands: Medium- and Long-Term Government External Debtand Disbursements, 2000–06
(In millions of U.S. dollars)
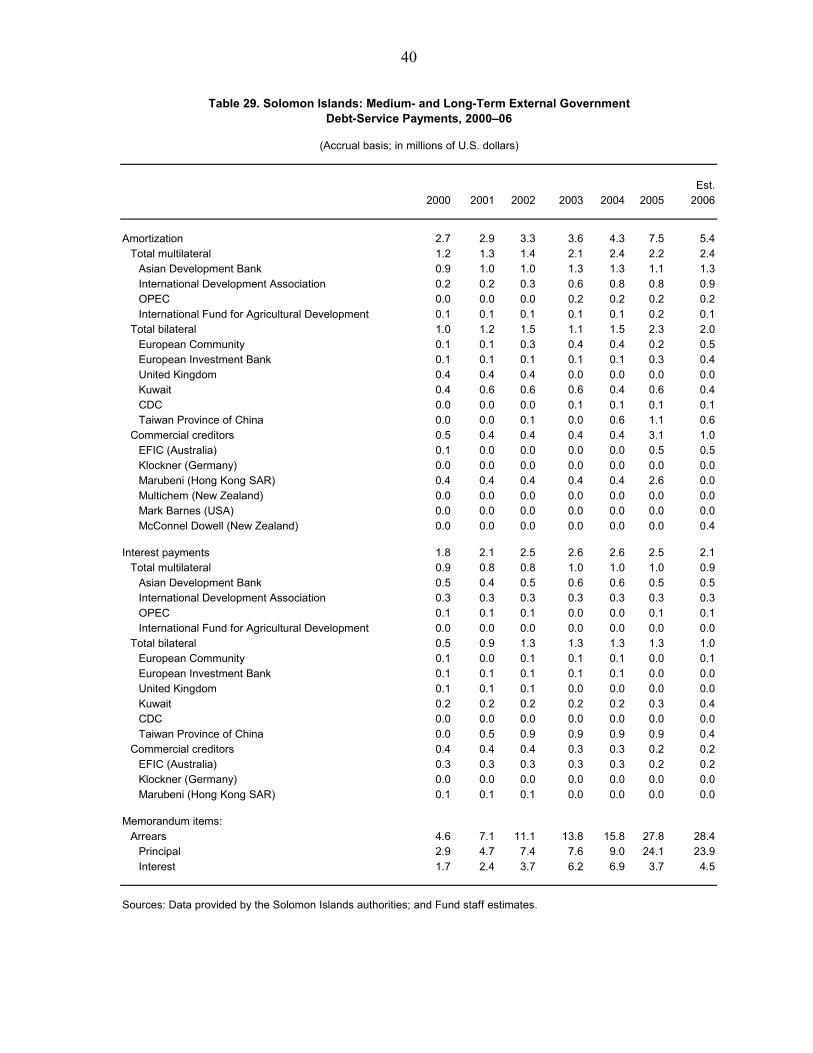
40
Est.2000 2001 2002 2003 2004 2005 2006
Amortization 2.7 2.9 3.3 3.6 4.3 7.5 5.4Total multilateral 1.2 1.3 1.4 2.1 2.4 2.2 2.4
Asian Development Bank 0.9 1.0 1.0 1.3 1.3 1.1 1.3International Development Association 0.2 0.2 0.3 0.6 0.8 0.8 0.9OPEC 0.0 0.0 0.0 0.2 0.2 0.2 0.2International Fund for Agricultural Development 0.1 0.1 0.1 0.1 0.1 0.2 0.1
Total bilateral 1.0 1.2 1.5 1.1 1.5 2.3 2.0European Community 0.1 0.1 0.3 0.4 0.4 0.2 0.5European Investment Bank 0.1 0.1 0.1 0.1 0.1 0.3 0.4United Kingdom 0.4 0.4 0.4 0.0 0.0 0.0 0.0Kuwait 0.4 0.6 0.6 0.6 0.4 0.6 0.4CDC 0.0 0.0 0.0 0.1 0.1 0.1 0.1Taiwan Province of China 0.0 0.0 0.1 0.0 0.6 1.1 0.6
Commercial creditors 0.5 0.4 0.4 0.4 0.4 3.1 1.0EFIC (Australia) 0.1 0.0 0.0 0.0 0.0 0.5 0.5Klockner (Germany) 0.0 0.0 0.0 0.0 0.0 0.0 0.0Marubeni (Hong Kong SAR) 0.4 0.4 0.4 0.4 0.4 2.6 0.0Multichem (New Zealand) 0.0 0.0 0.0 0.0 0.0 0.0 0.0Mark Barnes (USA) 0.0 0.0 0.0 0.0 0.0 0.0 0.0McConnel Dowell (New Zealand) 0.0 0.0 0.0 0.0 0.0 0.0 0.4
Interest payments 1.8 2.1 2.5 2.6 2.6 2.5 2.1Total multilateral 0.9 0.8 0.8 1.0 1.0 1.0 0.9
Asian Development Bank 0.5 0.4 0.5 0.6 0.6 0.5 0.5International Development Association 0.3 0.3 0.3 0.3 0.3 0.3 0.3OPEC 0.1 0.1 0.1 0.0 0.0 0.1 0.1International Fund for Agricultural Development 0.0 0.0 0.0 0.0 0.0 0.0 0.0
Total bilateral 0.5 0.9 1.3 1.3 1.3 1.3 1.0European Community 0.1 0.0 0.1 0.1 0.1 0.0 0.1European Investment Bank 0.1 0.1 0.1 0.1 0.1 0.0 0.0United Kingdom 0.1 0.1 0.1 0.0 0.0 0.0 0.0Kuwait 0.2 0.2 0.2 0.2 0.2 0.3 0.4CDC 0.0 0.0 0.0 0.0 0.0 0.0 0.0Taiwan Province of China 0.0 0.5 0.9 0.9 0.9 0.9 0.4
Commercial creditors 0.4 0.4 0.4 0.3 0.3 0.2 0.2EFIC (Australia) 0.3 0.3 0.3 0.3 0.3 0.2 0.2Klockner (Germany) 0.0 0.0 0.0 0.0 0.0 0.0 0.0Marubeni (Hong Kong SAR) 0.1 0.1 0.1 0.0 0.0 0.0 0.0
Memorandum items:Arrears 4.6 7.1 11.1 13.8 15.8 27.8 28.4
Principal 2.9 4.7 7.4 7.6 9.0 24.1 23.9Interest 1.7 2.4 3.7 6.2 6.9 3.7 4.5
Sources: Data provided by the Solomon Islands authorities; and Fund staff estimates.
Table 29. Solomon Islands: Medium- and Long-Term External GovernmentDebt-Service Payments, 2000–06
(Accrual basis; in millions of U.S. dollars)

41
Est.2000 2001 2002 2003 2004 2005 2006
Total debt service 3.6 10.1 9.3 7.3 8.5 10.7 8.0Amortization 3.6 4.1 3.8 4.4 5.9 8.1 5.9Interest payments ... 6.0 5.5 2.8 2.6 2.5 2.1
Public sector 4.4 4.9 5.7 6.3 6.8 10.0 7.5Amortization 2.7 2.9 3.3 3.6 4.3 7.5 5.4Interest payments 1/ 1.7 2.0 2.4 2.6 2.6 2.5 2.1
Private sector ... 5.2 3.6 1.0 1.7 0.7 0.5Amortization 0.9 1.2 0.5 0.8 1.6 0.6 0.5Interest payments ... 4.0 3.1 0.2 0.1 0.1 0.0
Total debt service ... 14.1 12.5 7.6 6.7 7.7 4.6Amortization 3.1 5.7 5.1 4.7 4.6 5.8 3.4Interest payments ... 8.4 7.4 3.0 2.1 1.8 1.2
Public sector 3.9 6.9 7.7 6.6 5.4 7.2 4.3Amortization 2.4 4.0 4.5 3.8 3.4 5.4 3.1Interest payments 1/ 1.5 2.8 3.2 2.8 2.0 1.8 1.2
Private sector ... 7.3 4.8 1.0 1.3 0.5 0.3Amortization 0.8 1.7 0.6 0.8 1.3 0.4 0.3Interest payments ... 5.6 4.2 0.2 0.1 0.1 0.0
Memorandum items:Exports of goods and nonfactor services
(in millions of U.S. dollars) 113.7 71.8 74.5 95.4 127.1 138.7 173.6 External government debt
(percent of GDP) 2/ 42.0 49.0 66.6 69.5 60.4 56.9 53.9Implied interest rate on stock of
external debt (percent) 1.4 1.5 1.6 1.6 1.6 1.5 1.2
Sources: Data provided by the Solomon Islands authorities; and Fund staff estimates.
1/ Excludes interest arrears.2/ Includes external debt arrears.
(Percent of exports of goods and nonfactor services)
Table 30. Solomon Islands: Medium- and Long-Term External Debt Indicators, 2000–06
(Accrual basis; in millions of U.S. dollars)

42
Australian Japanese New Zealand U.S. U.K. PoundDollar Yen 1/ Dollar Dollar Sterling SDR
Annual averages2000 2.93 4.70 2.31 5.09 7.71 6.702001 2.72 4.34 2.21 5.30 7.63 6.732002 3.82 5.63 3.27 6.99 10.58 9.102003 4.94 6.50 4.40 7.51 12.37 10.572004 5.51 6.95 4.97 7.49 13.72 11.112005 5.74 6.81 5.29 7.53 13.65 11.102006 5.76 6.54 4.95 7.60 14.09 11.22
2004January 5.75 7.10 5.03 7.52 13.62 11.14February 5.77 6.87 5.14 7.49 13.84 11.08March 5.68 7.17 4.91 7.48 13.72 11.07April 5.40 6.79 4.65 7.48 13.26 10.86May 5.33 6.76 4.71 7.47 13.70 10.97June 5.14 6.89 4.71 7.46 13.52 10.94July 5.22 6.66 4.72 7.47 13.56 10.89August 5.25 6.83 4.87 7.49 13.43 10.94September 5.36 6.76 5.02 7.50 13.49 11.02October 5.59 7.06 5.12 7.50 13.73 11.24November 5.83 7.27 5.36 7.50 14.30 11.51December 5.85 7.21 5.39 7.51 14.50 11.66
2005January 5.81 7.22 5.33 7.51 14.11 11.45February 5.93 7.17 5.42 7.51 14.43 11.50March 5.80 7.00 5.32 7.51 14.14 11.35April 5.87 7.10 5.47 7.51 14.37 11.40May 5.68 6.96 5.35 7.52 13.67 11.09June 5.74 6.81 5.26 7.51 13.47 10.94July 5.71 6.71 5.14 7.52 13.21 10.92August 5.63 6.77 5.17 7.53 13.43 10.99September 5.76 6.68 5.21 7.56 13.35 10.96October 5.67 6.55 5.33 7.58 13.47 10.95November 5.67 6.33 5.31 7.58 13.08 10.79December 5.56 6.42 5.16 7.58 13.04 10.83
2006January 5.70 6.45 5.17 7.59 13.44 10.97February 5.61 6.53 5.01 7.59 13.26 10.90March 5.44 6.47 4.66 7.59 13.17 10.94April 5.73 6.64 4.81 7.59 13.73 11.17May 5.81 6.78 4.86 7.60 14.30 11.36June 5.65 6.61 4.59 7.60 13.94 11.24July 5.82 6.62 4.70 7.60 14.17 11.28August 5.80 6.49 4.95 7.61 14.52 11.33September 5.70 6.47 4.98 7.62 14.24 11.24October 5.86 6.47 5.07 7.62 14.46 11.27November 5.98 6.54 5.17 7.62 14.90 11.48December 6.03 6.40 5.38 7.62 14.95 11.46
2007January 5.90 6.28 5.25 7.64 14.92 11.42February 6.02 6.45 5.35 7.64 14.95 11.43March 6.17 6.49 5.45 7.64 14.96 11.52
Sources: IMF, International Financial Statistics; and Fund staff estimates.1/ Solomon Islands dollar per 100 yen.
Table 31. Solomon Islands: Bilateral Exchange Rates, 2000–07(In Solomon Islands dollars; per unit of foreign currency, end of period)

43
Real Effective Nominal Effective Relative Price Exchange RateExchange Rate Exchange Rate Index 1/ Index 2/
Annual averages2000 100.0 100.0 100.0 100.02001 108.7 103.4 105.2 96.52002 90.2 80.1 113.1 76.12003 78.5 64.4 122.1 67.82004 77.1 60.3 128.0 68.02005 79.5 59.1 134.6 67.62006 83.4 58.5 142.0 66.9
2000 I 93.1 96.3 96.7 100.2II 97.1 98.7 98.5 100.0III 103.3 100.7 102.7 99.9IV 106.5 104.3 102.1 99.8
2001 I 108.8 104.3 104.4 99.5II 110.8 105.3 105.3 97.2III 107.8 103.0 104.7 96.0IV 107.3 101.1 106.3 93.3
2002 I 102.2 94.9 107.8 86.7II 90.3 82.3 109.8 78.0III 82.6 72.1 114.7 70.1IV 85.5 71.2 120.2 69.4
2003 I 80.7 67.1 120.4 68.0II 79.6 64.8 122.9 67.7III 78.2 64.2 121.9 67.7IV 75.5 61.4 123.1 67.8
2004 I 75.5 59.5 126.9 67.9II 78.6 61.5 128.0 68.1III 78.3 61.3 127.9 68.1IV 76.0 58.8 129.4 67.9
2005 I 75.7 57.9 130.8 67.8II 77.9 58.7 132.8 67.7III 81.8 59.6 137.4 67.6IV 82.5 60.2 137.2 67.2
2006 I 83.3 59.6 139.0 67.0II 83.5 58.7 141.6 67.0III 83.4 58.3 142.3 66.9IV 83.3 57.5 144.9 66.7
2007 I 82.7 57.0 145.2 66.7
Source: IMF, Information Notice System.
1/ Consumer price index in the Solomon Islands relative to a weighted average of consumer price indices in major trading partners.2/ U.S. dollar/Solomon Islands dollar exchange rate index.
Table 32. Solomon Islands: Exchange Rate Indicators, 2000–07(Index: 2000=100)