solute in high arctic glacier snow cover and its impact on runoff chemistry · solute in high...
TRANSCRIPT
Annals qfGlaciology 26 1998 © International Glaciological Society
Solute in High Arctic glacier snow cover and its impact on runoff chemistry
RICHARD HODGKINS,I MARTYNTRANTER2
I Department qf Geography, Royal Holloway, University qf London, Egham, Surrey TW20 OEX, England 2Department qfGeography, University qf Bristol, Bristol BS81SS, England
ABSTRACT. The chemical composition of snow a nd meltwater in the 13 km 2 catchment ofScottTurnerbreen, Svalbard, was investigated during the spring and summer of 1993. Thi s paper assesses the provenance of solute in the snowpack and its impact on runoff chemistry. Dry snow contains 420 /leg I I of solute, is slightly acidic (pH 5.4) and is dominated by Na + and CC Wet snow is more dilute (tota l concentration 340 /leg I I), a nd less acidic (pH 5.9). This is consistent with the elution of ions from the snowpack by meltwate r. Snow pack solute can be pa rtitioned into the fo llowing fractions: sea-sa lt aerosol , acid aerosol and crusta!' About 98% of snowpack solute is sea salt, yi elding 22000 kg km 2 a I. The behaviour of snow pack-derived Cl in runoffi s distinctive, peaking at over 800 /leg I- I early in the melt season as runoff picks up, before declining guasiexponenti a lly. This represents the discha rge of snow melt concentrated by elution within the snowpack, whi ch ubsequently becom es relatively dilute. A solute yie ld o f 140 kg km - 2 a - I can be a ttributed to a nthropogenically generated acid aerosols, representing long-range atmospheric transport of pollutants, a potential contributor to Arctic runoff acidification.
INTRODUCTION
Glacier snowpacks can be regarded as solute stores. \I\Tinter precipitation scavenges sea salt and acid aerosols from the atmosphere, incorporating them into the snowpack a long with aeolian dust. This solute is subsequently released to
catchment runoffas the snow pack melts. The purpose of thi s paper is to describe the chemical composition of the snowpack covering a High Arctic glacier, the provenance of the solute, and its impact on the composition of run ofT from the glacier.
SITE AND METHODS
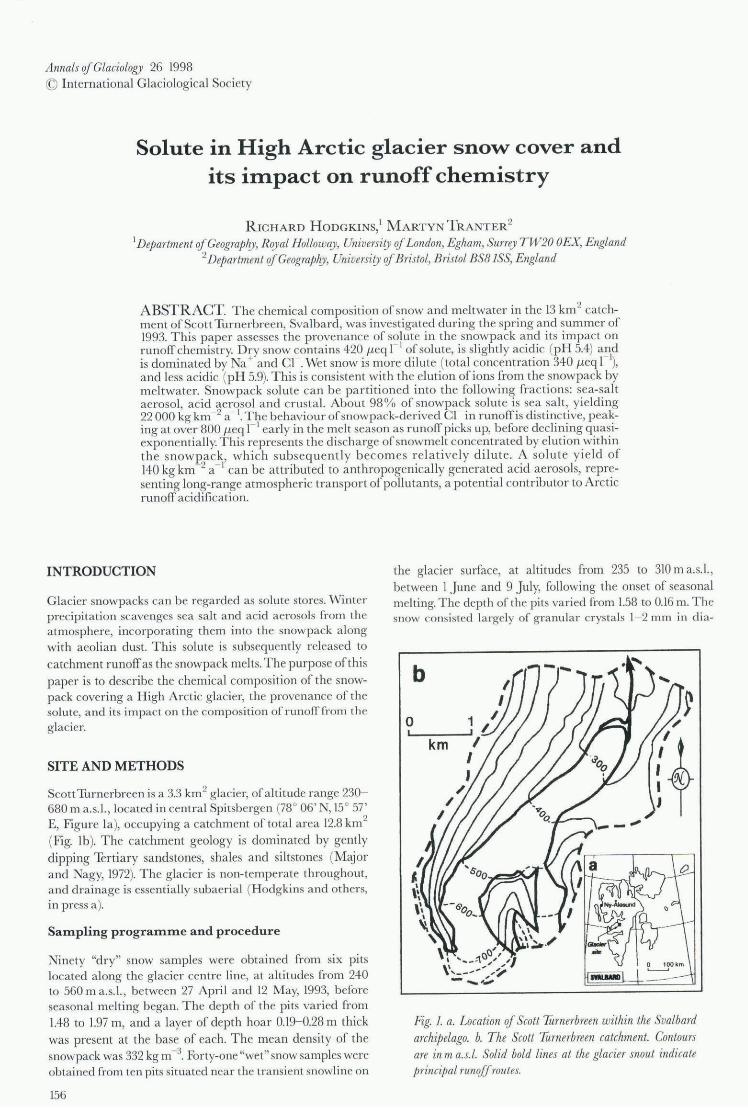
ScottTurnerbreen is a 3.3 km 2 glacier, of alti tude range 230-680 m a. s.!. , located in centra l Spitsbergen (78 0 06 ' N, 15 0 57' E, Figure la ), occupying a catchment of tota l a rea 12.8 km2
(Fig. lb ). The catchment geology is dominated by gently dipping Tertiary sandstones, shales and siltstones (M ajor a nd Nagy, 1972). The glacier is non-temperate throughout, and drainage is essentially subaerial (H odgkins and others, in press a ).
SaInpling prograInIne and procedure
Ninety "dry" snow samples were obtained from six pits located along the glacier centre line, at altitudes from 240 to 560 m a.s. !. , between 27 April and 12 May, 1993, before seasonal melting began. The depth of the pits varied from 1.48 to 1.97 m, and a layer of depth hoar 0.19- 0.28 m thick was present at the base of each. The mean density of the snow pack was 332 kg m - 3. Forty-one "wet" snow samples were obtained from ten pits situated near the transient snowline on
156
the glacier surface, at altitudes from 235 to 310 m a.s. !. , between I June and 9 July, following the onset of seasonal melting. The depth of the pits vari ed from !.58 to 0.16 m. The snow consisted la rgely of granular crys ta ls 1- 2 mm in dia-
Fig. 1. a. Location qf ScoN Turnerbreen within the Svalbard archipelago. b. The Scott Turnerbreen catchment. Contours are in m a. s.l. Solid bold lines at the glacier snout indicate principal runqjJ routes.

Hodgkills and 7imller: Solule in glacier snow cover and imjJact Oil runoffchemist1J1
meter. Depth hoar was absent and ice layers were frequently encountered, particularly arter 18 June. The mean density of the melting snowpack during the period 1- 18 June was
425 kg m 3. In addition, seventy-two meltwater samples were collected from the trunk stream draining the glac ier, between 14 June and 10 July. The sample series commences with the onset of proglacial surface runoff. At least two samples per day were collected, at times as close as possible to minimum and maximum discharge (respectiyely 10.00
hours and 17.00 hours, on average). Snow samples were sea led in polythene bags and subse
quently melted by immersion in warm water, then immediately vacuum filtered through 0.45 p,m cellu lose nitrate membranes. Two 60 ml aliquots of filtrate (onc for cation and Si, the other for anion and alka linity analyses ) were stored a ir-free in polypropylene bottles in cool, dark conditions until return to the U.K. Care was taken to pre-rinse the filtration apparatus and storage bottles with sample and filtrate as appropriate, to avoid contamination. Meltwater samples were collected in a pre-rinsed 500 ml polypropylene bottle, then immediately filtered and stored in the same way as the solid samples.
Stream stage was measured every 5 minutes with a Druck PDCR830 pressure transducer in a stable stretch of unbraided proglacial stream, c. 250 m downstream of the confluence of the ice-marginal streams which drain the glacier. Stream stage was logged as hourly means over the
period 15 June-ll July. Discrete discharge measurements were undertaken at the same location by the relative dilution method and used to obtain a rating relationship for converti ng stage to discharge. The typical error of the relationship is ± 8%.
Laboratory analyses
pH was determined on samples no later than 14 days after collection; air-free storage should have prevented sign ificant change in sample pH. pH was determined with an Or
ion 290a portable pH meter with Ross combination electrode, calibrated with Orion low ionic strength buffers of pH 4.0 and 7.0. The temperature compensation applied was that appropriate for the measured temperature of the buffer. The precision of the measurements is ± 0.2 pH units.
The mcyor ion and Si concentrations of samples returned to the U.K. were determined as follows. The concentrations of major base cations (Na + , K + , Mg2 ' , Ca2+) and acid anions (CI- , N03 , SO f2 ) were determined by ion chromatography on a Dionex 4000i ion chromatograph with, respectively, CGI2/CSI2 and Fast Anion-l columns, and MSA (methane su lphonic ac id ) and NaH C03/Na,COJ
eluents. Sample loop volumes were either 50 or 200 p,1, depending on concentration. The detection limits for these determinations are approximately 0.1 f.1Cq I I. The precision of the analysis varies with the concentration of the sample, from ± 3% at concentrations in excess of 50 /-Leq I 1 to ± 100 % at I l1eq I I
The concentration of dissolved Si was determinrd by f1ow-il~ection analysis, using a Tecator FIAstar 5010 system with FIAstar 5023 spectrophotometer, VIOO il~ector, Type III Chemifold and automatic sampler. I ml samples were injected into a stream of ammonium molybdate, oxal ic acid and acidified stannous ch loride to determine the concentration of molybdate- reactive Si, detected co lorimetricall y at a wayelength of 695 nm. The detection limit of this system is I J-Lmol I I, and the preci 'ion of the analysis ± 2 p, moll I.
Alkalinity (HCO] ) was determined by titrating 25 ml of filtered sample to an end point pH or +.5, using 0.01 M HCI (standardized with 0.01 M NasC03), detected with BDH mixed indicator. Titre volumes ranged from 0. 10 to 6.35 ml. The precision of the analysis varies with titre volume, from ± I to 50 %. HC03 - is overestimated at low concentrations.
RESULTS
Snow cOITIposition
The compos ition of snow samples is summarised in Table 1. Dry snow is generall y dilute, although there is considerable \'a riability between samplrs, with a I-ange of c. 5000 l1eq I I.
Maximum concentrations correspond with a layer discoloured by aeolian dust, which was present in a ll snow pits.
The dry snowpack is sl ightly acidic overall, with a mean pH of 5.4, and its composition is dominated by Na + and Cl . Si and NO~l were present in trace quantities, the former probably being derived from aeol ian dust and the latter from acid-nitrate aerosol. Dry-snowpack solu te profil es are
Table 1. Summa1J1slatisticsJor the comjJositions qf dly (sta ndard letl) and wet (bold texl) snow samples. Ratios qfthe concentrations qf ions to Cl in seawater areJrom Holland (1978)
pI! Si . \ il - ft- ,11/ Ct,c Ct .\ 0 ; sol J1.1ll011 I J1.eq I I ~ieq I I Ilcq I I /lCq I I ~ieq I I peq I I Wq I I
ITIlt1. 5.0 0.0 + 0 0 0 0 0 0 5.2 0.0 2 0 0 0 0 0
lllax. 6.7 1..'> 2000 96 200 +6 2+00 7 2+0 6.6 1.5 1300 45 150 llO 1700 5 200
Inean 5.-1- 0.0 170 5 19 -I- 200 25 5.9 0.8 120 4 17 11 150 34
s.d. 0.4 0.0 320 12 35 9 390 38 0.4 0.0 230 7 33 24 310 1 54
n 90 90 90 90 90 90 90 90 90 29 41 41 41 41 41 41 41 41
ratio lO Cl 0.85 0.025 0.095 0.020 1.0 0.0050 0.13 0.85 0.027 0.12 0.25 1.0 0.0050 0.23
ratio lO Cl in seawater 0.86 0.018 0.19 0.038 1.0 0.10
157

Hodgkins and Tranter: Solute ill glacier snow cover and impact on runoffchemisl1y
02
0.4
E. o. ~ S" o. ~ 1.0 fiJ
12
1.4
1.
a b c
I----~t:......----i
4.8 52 5.6 6.0 6.4 0.0 0.5 1.0 1.5 2.0 0.0 0.4 0.8 12 1.6 2.0 Mean pH ± standard deviation Mean ~ cations Mean ~ anions
± standard deviation, meq r1 ± standard deviation, meq r1
Fig. 2. Dry snow pnfiles. a, pH; b, cations'sum; c, anions'sum. In each case, the plotted value is the mean ofsix measurements in different snow pits at equivalent frac tional depths; each prrifile has been standardized to the mean depth of the dry snowpack.
presented in Figure 2a- c; these are derived from the mean concentrations of all samples a t equivalent proportional snow-pit depths (n = 6 for each of 15 depth intervals), standardized to the mean snow depth. Wet snow is more dilu te than d ry snow (mean to tal solu te concentration 340 as oppo ed to 420 /Leq I I), and less acidic (mean pH of 5.9). T his is consistent wi th the elution of ions from the snowpack by mel twater Ooha nnessen and Henriksen, 1978; Davies a nd others, 1982; Brimblecombe and others, 1985; u 'anter, 1991; Goto-Azuma and others, 1993b), as previously observed on Svalbard (Goto-Azuma and others, 1993a; Hodson, 1994).
The stati stical significance of the differences in concentration between sample types cannot satisfactorily be tested (Hodgkins and others, in press b). A non-parametric test is required because of the highly skewed frequency distributions. A M ann- Whitney U test is not sufficiently sensitive to vari ations in concentration (differences of I and 1000 /Leq r l being assigned equal importance through ranking), while a dilute sample in which all ion species a re represented is not sensitively di stinguished from a concentrated
_ Na+ ---o--CI--..-Mg2. ---tr---SO 4 2- a --Ca2' --O--HCO,,-
~--.--r----'----'-----';'---.-v----'--I'l 1.6
1.4 ~
1.2 E oi
1.0 E' co ~
0.8 ~ ;;
0.6 li -co 0.4 !
Gi 0.2 ::::E
0.0 0.0 140017100 201002310026100 29100 CJ210705107 0810711107
Date 1993
sample from which one or two are absent. Furthermore, concentrations of ion species cannot be converted into mutually exclusive comparative frequency categories with sufficient cases to perform a valid X2 tes t.
Runoff cOITIposition
Significant temporal vari ations occur in the chemical composition of runoff. The overall trend is for the runoff to
become more dilute as the melt season progresses but there are also significant variations in the relative proportions of ion species (Fig. 3a). \"'hen runoff commences on 14 June, the composition of the bulk meltwater is dominated by Na + and HC0 3 , with minor proportions ofSO / - , Ca2+, Mg2+ and Cl- . By 23 June, the dominant ions are Na + and Cl- , with minor proportions ofMg2
+ , S042 , Ca2
+ and H C0 3 .
From aro und 30 June to the end of the monitored period, H C0 3 again becomes the dominant anion. K + and especially N03 are present in only trace quantities throughout.
-total --0-- snowpack b
3.5 ~~-~-.,.-----,-~-~--,.-------,--v-1 1.6
~30~ .2.5
t:
1.4 ~
1.2 E of
1.0 E' .2 tU 2.0
E ~ 1.5
8 ~ S
! 0.8 ~
;; · 0.6 li -co
0.4 ! Gi
0.2 ::::E <o:?~
0.0 0.0 140017100 20100 2310026100 29100 CJ2107 05107 0810711107
Date 1993
Fig. 3. Runoff time series. a. Individual ion -species concentrations and meltwater discharge; b. Total solute concentration, snowpack-derived solute concentration and discharge.
158

Hodgkins and 'Hanler: Solute in glacier snow cover and imjJac/ on m nriffchemis/l) '
SOLUTE PROVENANCE
Solute within the snow pack has been partiti oned into seasalt aerosol, acid aerosol a nd crusta l components following Sha rp and others (1995). The mean ionic concentrations of dry snow were the basis of the calculations, full details of which have been g iven by H odgkins and others (in press b ). Br iefl y, a ll N03 was ass umed to be aerosol-derived (preci
pi tation-scavenged acid-nitrate aerosol ) and all Cl- to be
sea-salt-derived (precipita tion-scavenged sea-salt aerosol). Sea-salt contribu tions to Na+, K +, M g2+ and Ca2+ were then determined fro m the C l concentration using standard sea-water ratios (Holland, 1978). Residual concentrations of these ions were att ributed to a crustal source (aeolian dust); Si is entirely crustally derived . A snowpack-derived SO/ concentration was determined [rom the Cl concentration using the mean ratio (assumed constant ) of these species in the pre-melt season snowpack (0.125); the sea-salt component o[ this concentration was determined [rom the standa rd sea-water rati o, and the remainder is apportioned to precipitation-scavenged acid-sulphate aeroso l. Th e resulting pa rtitioned concentrations in units of /-Leq I 1 were conver ted to units of kg m- 3
, a nd then to masses in kg by multiplying by the water-equi valent volume of the glacier snowpack. Al though snow-density data a rc not availablc for a ll samples, mean concentrations are here believed to be a reasonable approximation to volume-weighted means, as measured snowpack density profiles a rc relatively uni[orm (standard deviation 0.05 kg m -3). The glacier area is 3.3 x 10⁶ m2, the mean glacier snow depth is 1.6 m (162 point measurements) and the snow density 330 kg m 3 (40 measurements in [our separate snow pits). The glacier snow
volume is therefore 5.4 x 10⁶ m 3 and the water-equivalent glacier snow vo lume 1.8 x 10⁶ m 3
. The res ults a re given in Tabl e 2. The snowpack composition is clearly domina ted by sea salt, which accounts for abo ut 98% of tota l solute by mass. This resul t is supported by the ratios of the concentrations o[ ions to Cl in the dry snowpack, which a re very close to those in sea water (Table 1). The total solute mass of the glacier snowpack corresponds to a yield of 23 000 kg km- 2 a 1
SNOWPACK SOLUTE IN RUNOFF
Hodgkins and others (in press a ) have described the hydro
chemistry of runoff from Scott Turnerbreen in detail and have indicated that high but rapidly declining solute concentrat ions in the earliest days of the melt season (e.g. Na +, H CO :l and SO.,2 , Fig. 3a) can be attributed to solute acquisition from a proglacial icing, which represents concentrated, stored winter runoff. The behaviour of Cl- in runoffis distinc
tive: its concentration increases from less than 200 /-Leq I 1
when runoff commences on 14 June, to over 800 /-Leq lion 23 June, declining thereafter to about 50 /-Leq I 1 a t the end of the moni tored period (Fig. 3a). M g2 I follows a simil a r pattern, and so, to a lesser extent, do Na + and Ca 2+ (Fig. 3a).
The only source of Cl to the bulk meltwate r is the snow
pack (precipitation-scavenged sea-salt aerosol). Having established that elution of solutes occurs within the snowpack, the timing of the C l peak relative to the onse t of sustained high discharge of mel twater strongly suggests that this represents the di scha rge of concentrated snowmelt. The three- five-fold concentration o[ CI- in the runoff, rela
tive to the snow pack, is consistent with fi eld and laboratory studies of the composition of snowmelt and its concentration
Table 2. The /JTOvenance and yield ifsolutesJrom the 1992- 93 Scott Tumnbreen snowpack. 7i'ace quantities if Si are present
Species Sea salt Aerosol Crusta l 10tal
Na + (kg) 6960 0 0 6960
K + (kg) 251 0 97 3-l8
M g2+ (kg) -lll 0 0 -l ll
Ca2+ (kg) 1-l3 0 0 1-l3
Cl- (kg) 12627 0 0 12627
N0 3 (kg) 0 110 0 110
SO/- (kg) 1779 359 0 2138
Si (kg) 0 0 0 0
Total (kg) 22171 -l69 97 22737
Total (% ) 97.5 2. 1 O.-l lOO
Yield (kg km .)
1) 6728 1+2 29 6899 -a
by elution within snow Oohannessen and H enriksen, 1978; Colbeck, 1981; Davies and others, 1982; Brimblccombe and others, 1987; Tranter, 1991).
This concentration pea k is the prod uct o[ processes that concentrate solutes on the surface of individua l ice g rains, i. e. melt- freeze cycles (Ba les and others, 1989) and yapour transfer (C ragin and others, 1993), and the initia l di stribution (Bales and others, 1989) and subsequent redi stribution by perco lat ing meltwater (Colbeck, 1981) of so lutes within the snowpac k. Snowmelt therefore becomes relatiyely dilute for the remainder of the mel t season. The snow pack-derived
concentration of a given ion in the runoff, Cx snow/1IIl1qffca n
be estim ated from the product of the concentration o[ C I in runoff, CC! <IIOW,/' III1q[[, and the ratio of the ion to Cl in the dry snowpack, K , assumed to be constant, i.e. C.\· SIlOl( ', nlllq[[
= K[Ccl '<IIow"IIIl~[fl The assu mption that K is consta nt implies that significant priferential elution of ion species does not occur; reference to the rati os of ion concentrations to C l inTabl e 1 suggests that this is reasonable. Total and snowpack-derived so lute concentrat ion time seri es are shown in Figure 3b, which illustrates the rapid early melt-season "Oush" of concentrated snowpack solute in runoff, and its subsequent dilution.
DISCUSSION
The res ults presented in thi s paper confirm the dominance of sea-sa lt-derived solute in the snow cover of Svalbard. Arkhipov and others (1992) sampled the snow CO\'er on Kongs
vegen and Amundsenisen, and concluded that sea-sa lt aerosols dominated the composition of the snowpack. Semb and others (1984) concluded tha t the obse rved concentrations of ions in snow were consistent with precipi tation scavenging from a nea r-surface a tmospheric layer, and that sea salt was the dominant source of solute. By pa rtitioning
snowpack so lute according to provenance, thi s paper has quantified the relative contributions of sea-salt aerosol, ac id aerosol and aeoli an dust to the snowpack: 97.5, 2.1 and 0.4%, respectively (Table 2).
The composition of snow sampled at Scott lurnerbreen prior to and following the onset o[ seasonal melting is consistent with the elution of ions from the snowpack by meltwater. The results presented in this paper enable the impac t
159

Hodgkins and Tranter: Solute in glacier snow cover and impact on runrfJ chemistry
of this process to be traced quantitatively from the snowpack to the runoff. The proportion of snowpack-derived solute in total meltwater solute is 12% when surface runoff commences on 14 June; it increases linearly to a maximum of 75% on 24 June, then decreases quasi-exponentially to 17% at the end of the monitored period on lOJuly (Fig. 3b). The contribution of snow pack solute to runoff can therefore be demonstrated to be a brief but intense concentration episode early in the melt season.
Goto-Az uma and others (1993b) found that 10- 60% of snow pack SO/ at Austre Broggerbreen in Svalbard was from non-sea-salt sources. Other measured non-sea-salt SO/ concentrations in snow from Svalbard are in the range 4.5- 11 J.lCq I I (Gjessing, 1977; Semb and others, 1984). The results presented in this paper quantify the amounts of solute derived from sources other than sea salt, principally acid aerosols. The snowpack acid aerosol solute yield amounts to 140 kg km-2 a \ or 2.1 % of the total snow pack solute yield (Table 2). The High Arctic islands are sinks for long-range, traIlS-boundary atmospheric pollution (Hansen and others, 1996). The supply of atmospheric pollutants to Svalbard exhibits strong seasonality, and is at a maximum during Februa ry- April (R ahn and M cCaffrey, 1980;J oran
ger and Ottar, 1984), corresponding to the winter precipitation maximum in this part of the archipelago (H anssenBauer and others, 1990). Winter prevailing winds in the Svalbard archipelago are easterly and southeasterly (20 % and 40% frequencies, respectively; H anssen-Bauer and others, 1990), i. e. from the direction of industrial Eurasian regions. D eposition of precipitation-scavenged acid sulphate and nitrate aerosols therefore occurs in the Svalbard snow pack and is a potenti a l contributor to meltwater acidification . A three- five-fold increase in H + in runoff, consistent with the concentration of sol u tes due to snowpack fl ush i ng described in thi s paper, could decrease the mean pH of runoff from 7.3 to 6.6- 6.8, other factors remaining equal (since -loglO (H +) = pH, where H + is in units of mol I- I). Though aquatic ecosystems are not typically well developed in glacierized catchments, the buffering capacity of such catchments is also characteristically limited, so meltwater acidi ty is unlikely to be effectively neutralized.
ACKNOWLEDGEMENTS
This work was funded through u.K. Natural Environment Research Council research studentship GT4j91jAAPSjll and research grant GR9j946. Support from a Royal Society conference grant is gratefu lly acknowledged. S. Godden prepared Figure I and H . G. Jones provided constructive comments on the text.
160
REFERENCES
Arkhipov, S., 1\1. Moskalevsky, A. Glazovsky, P. Mayewski and S. Whitlow. 1992. Snow cover geochemistry on the Kongsvegen glac ier a nd Amundscnisen (Spitsbergen ). III Pulina, 1\1. and A. Eraso, eds. Proceedillgs, 2nd Inlernational Symposium if GLacier Caves and Karst ill PoLar Regions, l\Iied;:,), g6rze- Velkci l\Iorava, 10-16 February 1992. Sosnowiec, Poland, University of Silesia, 7- 20.
Bales, R. c. , R. E. Davis a nd D. E. Stanley. 1989. Ion elution lhrough sha llow homogeneous snow. Jl ater Resollr. Res. , 25 (8), 1869- 1877.
Brimblecombe, P. , 1\1. Tranler, P. vv. Abrahams, I. B1ackwood, T. D. Davies and C. E. Vincent. 1985. Relocat ion and preferelllia l elu tion of ac idic solute through the snowpack of a small, remote, high-a ltitude Scottish catchment. Ann. Glaciol. , 7, /4/- 147.
Colbeck, S. C. 1981. A sim ulation of the enrichment of atmospheric polluta llls in snow cover runoff Water Resollr. Res., 17 (5), 1383- 1388.
Brimblecombe, 1'. , S. L. C legg, T. D. Dav ies, D. Shooter a nd 1\1. Tranter. 1987. Observations of the preferential loss of maj or iOIls from melting snow and laboratory ice. J later Res. , 21 (10),1279- 1286.
Cragin, ]. H., A. D. H ewi ll and S. C. Colbeck. 1993. Elution of ions from melting snow: chromatographic ve rsus metamorphic mechanisms. CRREL Rep. 93-8, 1- 13.
Davies, T. D. , C. E. Vincent and P. Brimblecombe. 1982. Preferen ti a l elution of strong acids from a Norwegian ice cap. Nature, 300(5888), 161- 163.
Gjessing, Y. T. 1977. Episodic va ri ations of snow conlamination of an Arctic snowfi eld. Almo.<. Environ., 11 (7), 643 647.
GOLO-Azuma, K., H. Enomoto, S. Takahashi, S. Kobayashi, T. Kameda and O. \Vatanabe. 1993a. Leaching of ions from the surface of glac iers in wes
tern Svalbard. Bull. Glacier Res. 11,39- 50. Goto-Azuma, K. , M. Nakawo, M. Shimizu, N. Azuma, M. Nakayama and
K. Yokoyama. 1993b. Tempora l changes in chemica l stratigraphy of snow cover. Ann. Glaciol., 18, 8.) 91.
Hansen, ]. R ., R. Hanson and S. Norris, eds. 1996. The slate if Ihe European A relic environment. Oslo, Norwegian Pola r Institute. (EEA Environmental t- !onograph 3.)
Hanssen-Bauer, 1. , M. K. Solas and E. L. Steffensen. 1990. The climate if Spitsbergen. Oslo, Norsk t-leteorologisk lnstitutt. (Rapport 39/90.)
Hodgkins, R. , M. T\-anter and]. A. Dowdeswell.ln press a. Tbe hydrochemistry of runoff from a "cold-based" glac ier in the High Arctic (Scot t Tl,rnerbreen, Svalbard ). H.vdrol. Processes.
Hodgk ins, R. , M. Tranter and j. A. Dowdeswcll. In press b. Solute provenance, transport and denudation in a High-Arctic glac ierised catchment. f{ydrol. Processes.
Hodson, A. 1994. Climate, hydrology and sediment transfer process interactions in a sub-pola r glacier basin, Svalbard. (Ph.D. thesis, Un iversity of Southampton.)
Holl and , H . D. 1978. The chemistry ifihe atmosphere and oceans. New York, etc. , J ohn Wile)' and Sons .
.Iohannessen, M. and A. Henriksen. 1978. Chemistry of snow melt water: changes in concentration during melting. J Valer Resollr. Res. , 14(4), 615- 619.
JOt'anger, E. and B. Oltar. 1984. Air pollution studies in the Norwegian Arctic. GeojJhys. Res. Lelt., 11 (5), 365- 368.
Major, H . andj. Nagy. 1972. Geology of the Adventdalen map a rea. For. Polarillst. Skr. 138.
Rahn, K. and R.j. McCaffrcy. 1980. On the origin and transport ofwinter Arctic ae rosol. Anl1 . .N.Y /lead. Sei., 338, 485- 503.
Semb, A., R. Brekkan and E.Joranger. 1984. Maj or ions in Spitsbcrgen snow sam pies. GeopllJs. Res. Lell. , 11 (5), 445 48.
Sharp, M., M. Ti'anter, G. H. Brown and M. Skid more. 1995. Rates of chemica l denudation and CO2 draw-down in a glacier-covered Alpine catchment. GeoLogy, 23 (1), 61 - 64.
Tranter, 1\1. 1991. Controls on the composi tion of snow melt. In Davies,T. D. , 1\1. Tranter and H . G. J ones, eds. Seasonal snowpaeks: processes qf eompos;tional change. Berlin, etc., Springer-Verlag, 241 - 271. (NATO AS] Series G: Ecologica l Sciences 28.