solution thermodynamics: applications chapter 12-part ii
TRANSCRIPT

Solution Thermodynamics: Applications
Chapter 12-Part II
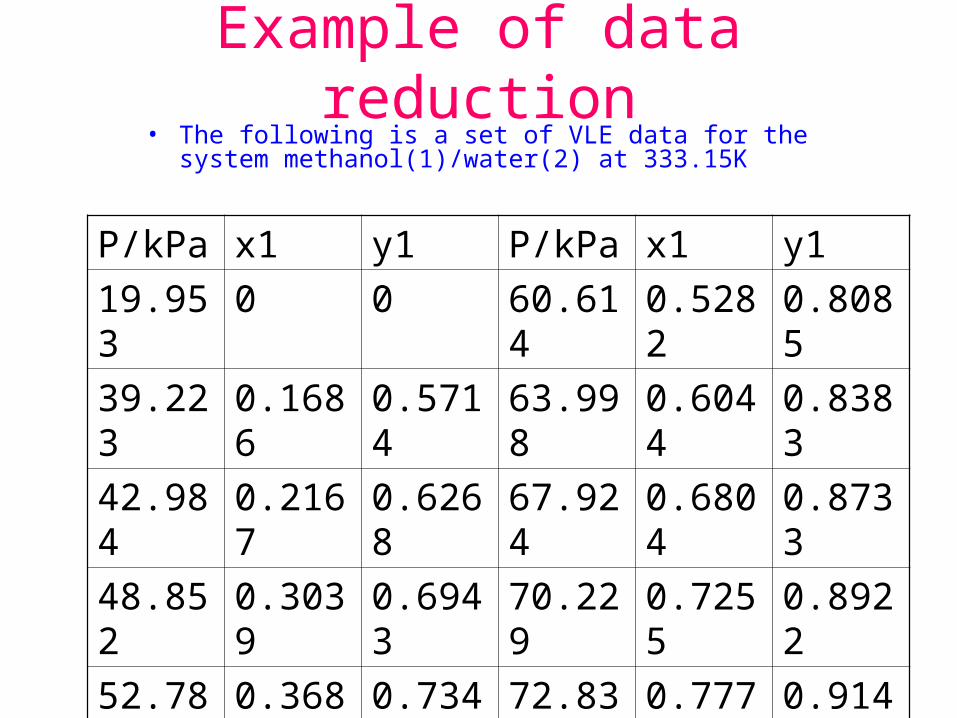
Example of data reduction• The following is a set of VLE data for the system
methanol(1)/water(2) at 333.15K
P/kPa x1 y1 P/kPa x1 y1
19.953 0 0 60.614 0.5282 0.8085
39.223 0.1686 0.5714 63.998 0.6044 0.8383
42.984 0.2167 0.6268 67.924 0.6804 0.8733
48.852 0.3039 0.6943 70.229 0.7255 0.8922
52.784 0.3681 0.7345 72.832 0.7776 0.9141
56.652 0.4461 0.7742 84.562 1 1
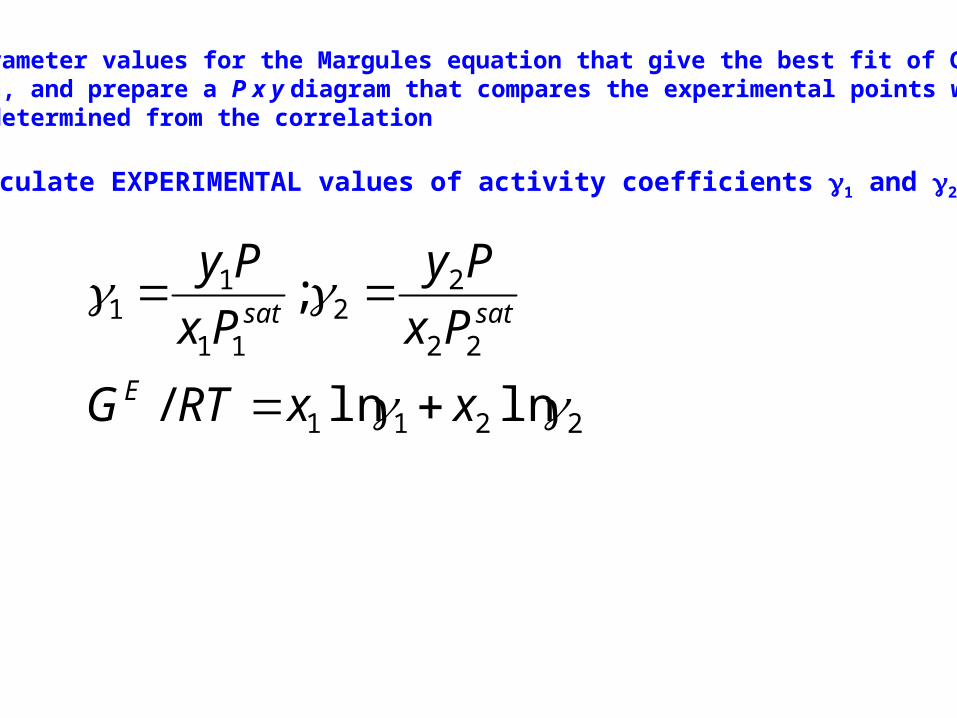
Find parameter values for the Margules equation that give the best fit of GE/RT to the data, and prepare a P x y diagram that compares the experimental points withcurves determined from the correlation
1) Calculate EXPERIMENTAL values of activity coefficients 1 and 2 and GE
2211
22
22
11
11
lnln/
;
xxRTG
Px
Py
Px
Py
E
satsat

We have shown that:
21212121
xAxARTxx
GE
])(2[ln
])(2[ln
2211221212
1122112221
xAAAx
xAAAx
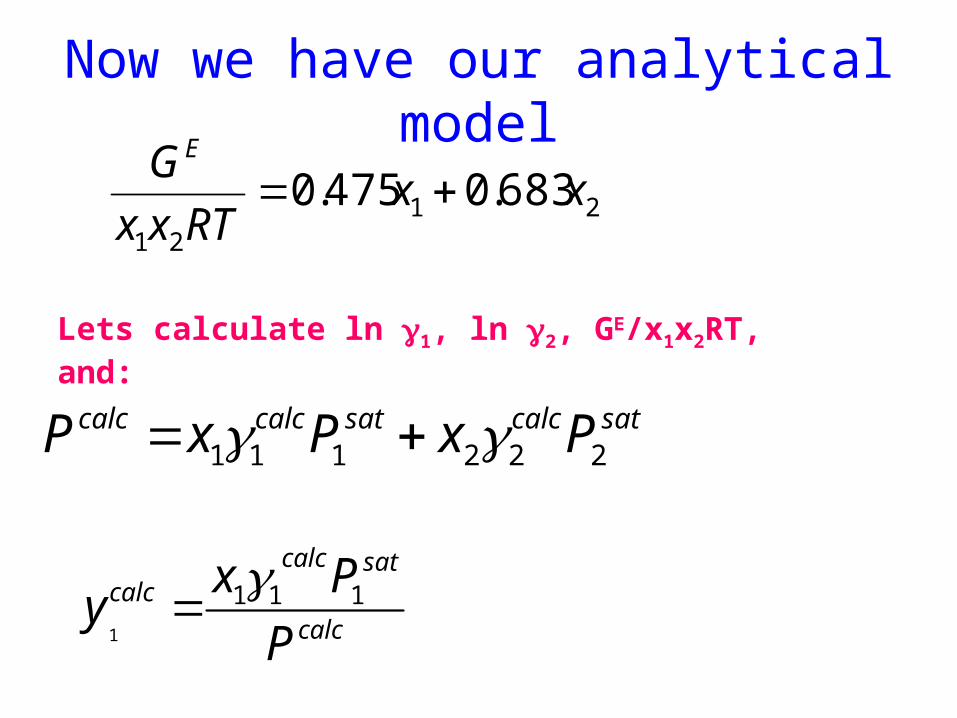
Now we have our analytical model
2121
683.0475.0 xxRTxx
GE
satcalcsatcalccalc PxPxP 222111
Lets calculate ln 1, ln 2, GE/x1x2RT, and:
calc
satcalccalc
P
Pxy 111
1
0
10
20
30
40
50
60
70
80
90
0 0.1 0.2 0.3 0.4 0.5 0.6 0.7 0.8 0.9 1
x1, y1
P,
P c
alc
x1
y1
Pcalc
y1calc
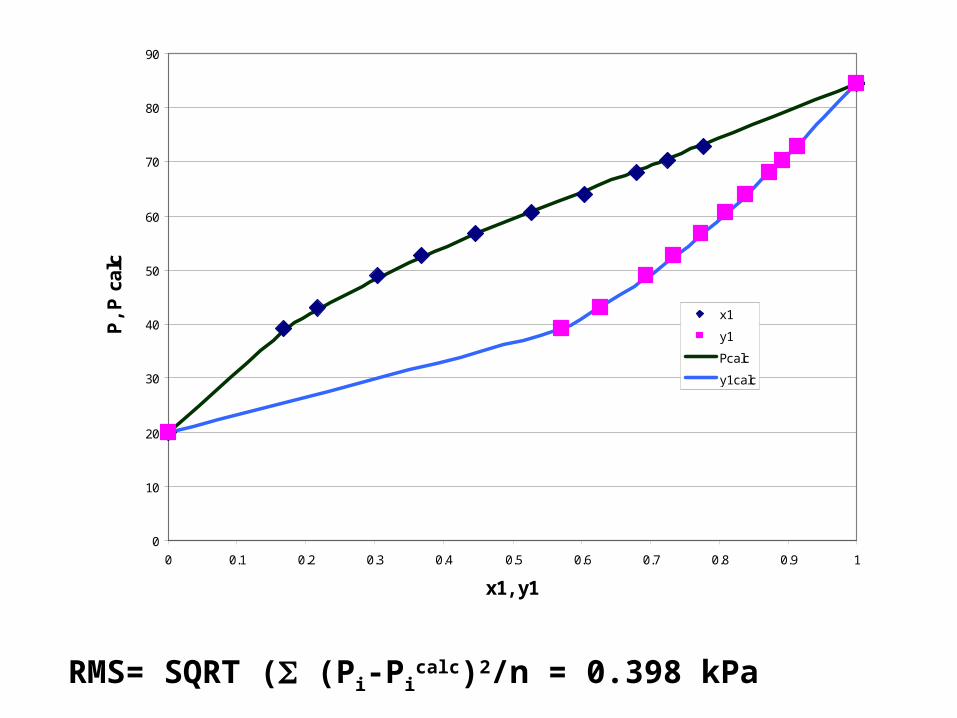
RMS= SQRT ( (Pi-Picalc)2/n = 0.398 kPa

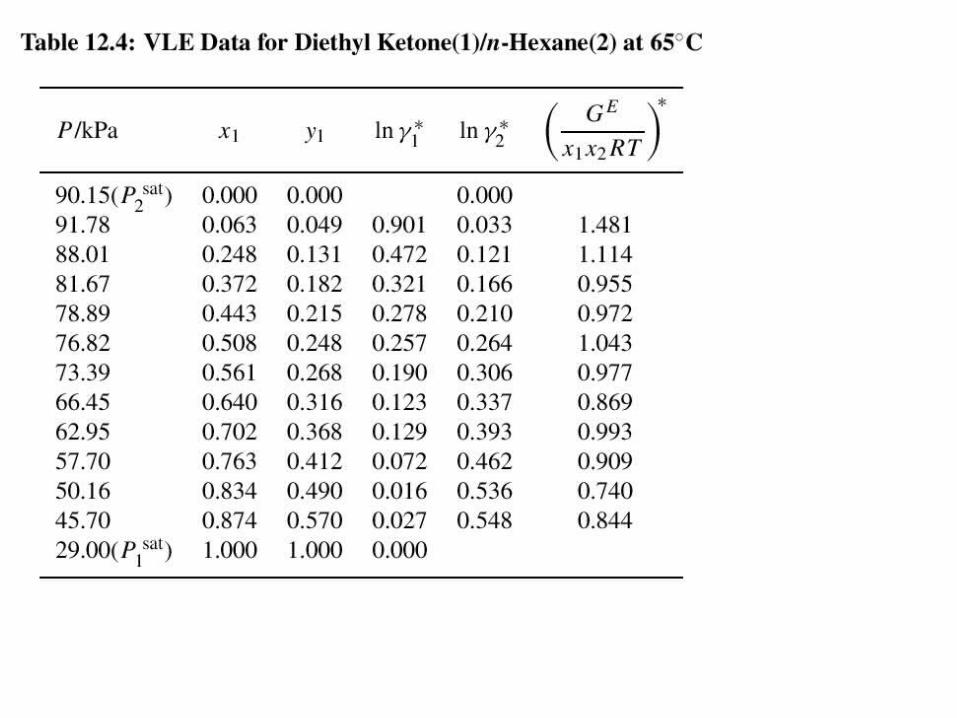
Thermodynamic consistency
• We need to check that the experimentally obtained activity coefficients satisfy the Gibbs-Duhem equation.
• If the experimental data are inconsistent with the G-D equation, they are not correct
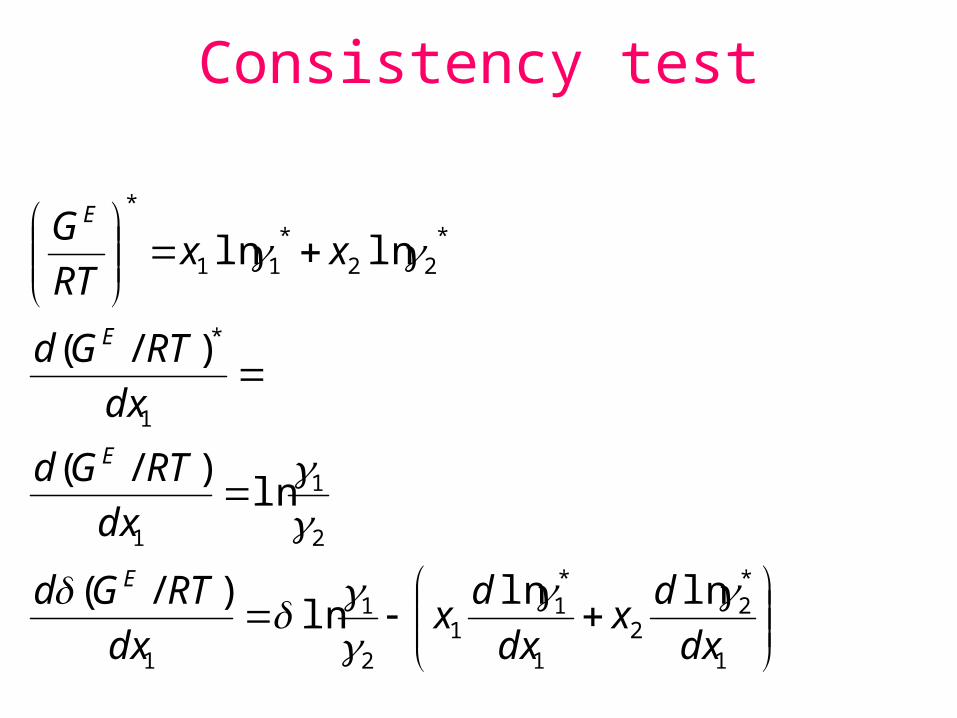
Consistency test
1
*2
21
*1
12
1
1
2
1
1
1
*
*22
*11
*
lnlnln
)/(
ln)/(
)/(
lnln
dx
dx
dx
dx
dx
RTGd
dx
RTGd
dx
RTGd
xxRT
G
E
E
E
E
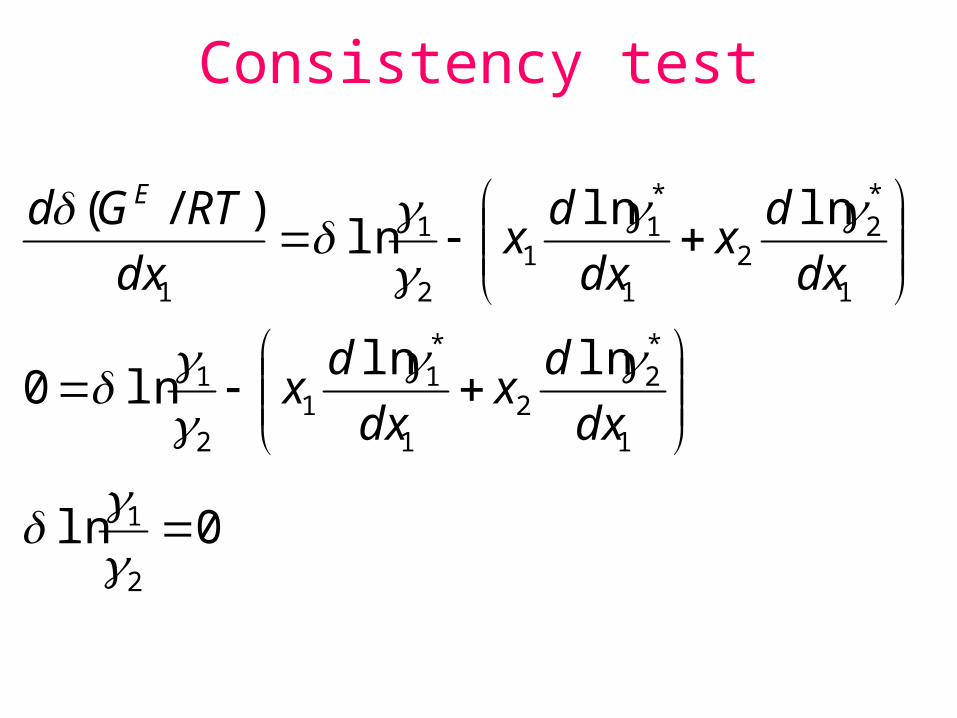
Consistency test
0ln
lnlnln0
lnlnln
)/(
2
1
1
*2
21
*1
12
1
1
*2
21
*1
12
1
1
dx
dx
dx
dx
dx
dx
dx
dx
dx
RTGd E

Solid lines are the result of data reduction adjusting GE/RT
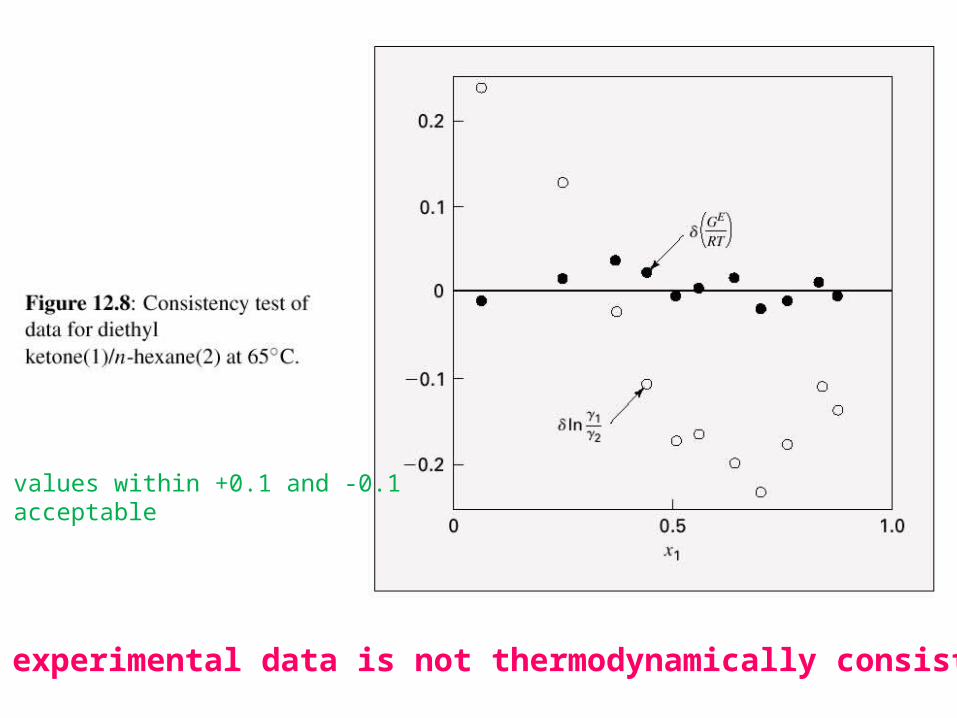
The experimental data is not thermodynamically consistent
Avg values within +0.1 and -0.1are acceptable
An alternative objective function: Barker’s method
• Fit the model GE/RT to make the calculated pressures the closest possible to the experimental data.
• For example, obtain A12 and A21 for the Margules equation to minimize the calculated pressures with respect to the experimental values. (see dashed lines in Figure 12.7)

example
• Using Barker’s method, find parameters for the Margules eqn that provide the best fit of GE/RT to the data, and prepare a Pxy diagram that compares the experimental points with curves determined form the correlation.
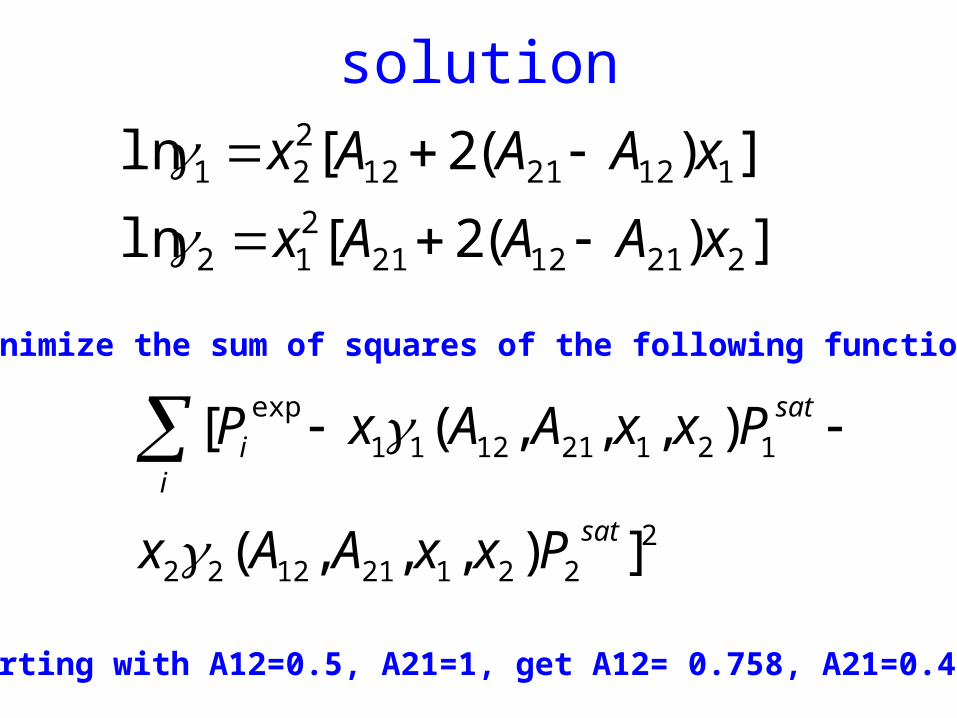
solution
])(2[ln
])(2[ln
2211221212
1122112221
xAAAx
xAAAx
Minimize the sum of squares of the following function:
2221211222
121211211
exp
]),,,(
),,,([
sat
sat
ii
PxxAAx
PxxAAxP
Starting with A12=0.5, A21=1, get A12= 0.758, A21=0.435

Calculate the RMS for PRMS= SQRT ( (Pi-Pi
calc)2/n = 0.167 kPa
-0.4
-0.3
-0.2
-0.1
0
0.1
0.2
0.3
0.4
0 0.1 0.2 0.3 0.4 0.5 0.6 0.7 0.8 0.9 1
x1
P-P
calc
, y-
ycal
c
P-Pcalc
y - ycalc