solutions that meet your demands for food testing ... · solutions that meet your demands for ......
TRANSCRIPT

food testing &agriculture
Solutions that meetyour demands for
Our measure is your success.
Excellent choices forfood & agricultureapplications
products I applications I software I services Agilent Technologies
Trace Metals
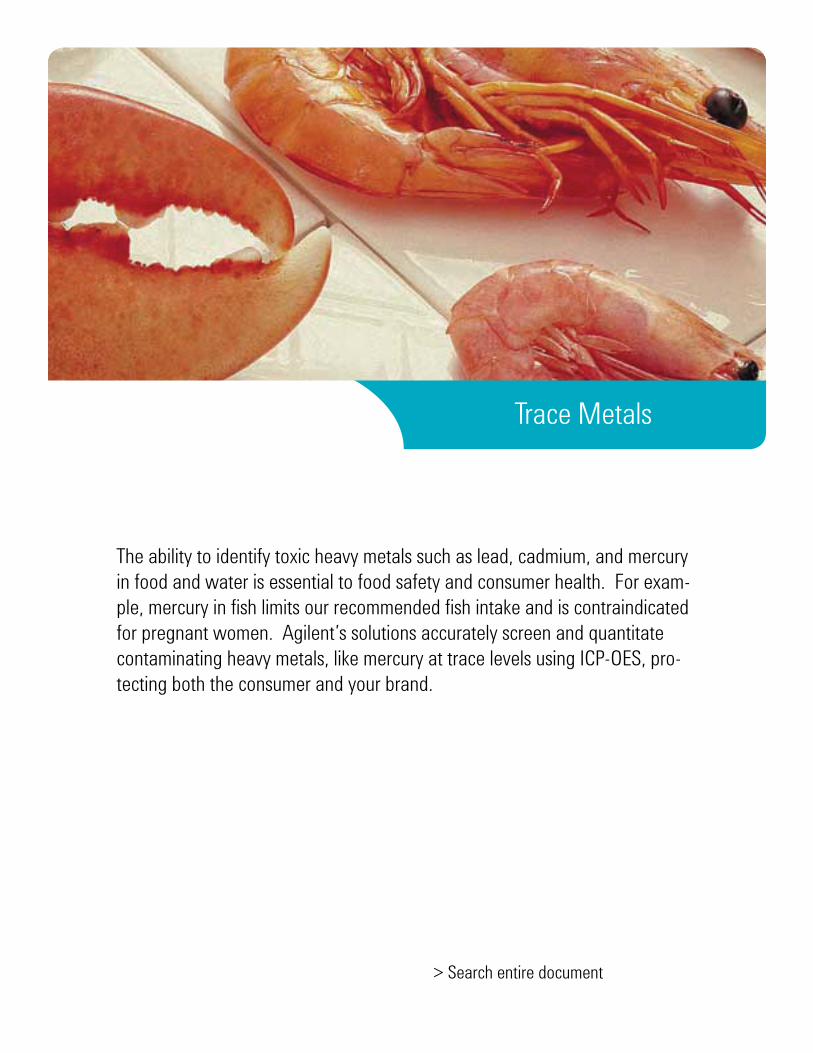
The ability to identify toxic heavy metals such as lead, cadmium, and mercury in food and water is essential to food safety and consumer health. For exam-ple, mercury in fish limits our recommended fish intake and is contraindicated for pregnant women. Agilent’s solutions accurately screen and quantitate contaminating heavy metals, like mercury at trace levels using ICP-OES, pro-tecting both the consumer and your brand.
> Search entire document
Direct Analysis of Milk Powder byAxially-Viewed SimultaneousICP-OES
Authors
Andrew Tame
Dennis Hoobin
Application Note
Inductively Coupled Plasma-Optical Emission Spectrometers
Introduction
The elemental analysis of milk is important both as an indicator of environmentalcontamination and because milk is a significant pathway for toxic metal intake anda source of essential nutrients [1] for humans.
The accepted methods for elemental analysis of milk have traditionally includedeither wet digestion or dry ashing [3–6]. These are time consuming and involve pro-cedures using potentially hazardous chemicals. A direct method of analysis byInductively Coupled Plasma Atomic Emission Spectrometry (ICP-OES) would obvi-ously be preferable, but this relies upon the instrument tolerating high levels of dis-solved solids while providing sufficient sensitivity to measure toxic trace elementsand the dynamic range to measure nutritional major elements.
The use of a sequential ICP-OES for direct analysis of milk has been previouslydescribed by Ryan [2]. This work describes the direct analysis of milk powder usingstandard quantitative calibration with aqueous standards using a simultaneousICP-OES system. Viscosity effects of the milk powder solutions are corrected usingscandium (361.383 nm—ionic line) as an internal standard. Major, minor and traceelements were determined in a single analysis. Less sensitive lines are used for thedetermination of major elements allowing both major and minor elements to bedetermined from a single solution.
Many of the major constituents in milk powder such as Na, K and Ca are EasilyIonized Elements (EIE) which can cause ionization interferences. Previous work [2]has shown that the addition of caesium as an ionization suppressant and internalstandard to the standards and samples was beneficial. The ionization suppressantand internal standards are conveniently introduced into the plasma on-line, via thethird channel of the peristaltic pump. The accuracy and validity of the method wasassessed by the use of National Institute of Standards and Technology (NIST)Standard Reference Material (SRM) 8435 Whole Milk Powder.

2
potassium were internally standardized with the caesium372.328 nm line, using added caesium as both the ionizationsuppressant and internal standard. Scandium was used as aninternal standard for all other lines.
Standard PreparationAqueous standards were prepared from 1000 mg/L single ele-ment standards (Spectrosol, BDH Chemicals). The standardswere made up in 18 M! Milli-Q water with 0.5% v/v HNO3and 0.002% v/v Triton X100 prepared from a 1% w/v TritonX100 solution.
Table 2: Calibration Standards Prepared
Standard Elements and concentration (mg/L)
Standard 1 Ba (0.5), Mn (0.5), Zn (0.5), Sr (0.5)
Standard 2 Ba (1.0), Fe (1.0), Mn (1.0), Zn (2.0), Sr (5.0)
Standard 3 Mg (5.0), Fe (5.0)
Standard 4 Mg (25.0), Na (25.0), Ca (25.0)
Standard 5 Na (100), Ca(100), K (100)
Standard 6 K (200)
Standard 7 S (10.0), P (50.0)
Standard 8 S (50.0), P (150.0)
Standard 9 S (100.0), P (200.0), Ca (250.0)
Standard 10 Ca (1000)
Standard 11 K (1000)
Standard 12 Na (1000)
Rinse and calibration blank solutions were prepared from18 M! Milli-Q water with 0.5% HNO3 and 0.002% Triton X100.
Sample PreparationSolutions were prepared from samples supplied by theMinistry of Agriculture and Fisheries (MAF), New Zealand andSRM 8435 Whole Milk Powder.
Milk powder suspensions containing 2% w/v were preparedfor all samples. The sample was accurately weighed and thentransferred into a volumetric flask. The flask was filledapproximately 3/4 full with 18 M! Milli-Q water and gentlyshaken until the milk powder was evenly mixed. Triton X100was added to give a concentration of 0.002%. Acid was notadded to the samples as it causes the precipitation of protein.
The samples were made up to the mark and placed in anultrasonic bath for 5 minutes. The samples were then shakenvigorously for 1 minute.
A separate rinse containing 0.002% v/v Triton X100 and noacid was used for rinsing between samples.
Experimental
InstrumentalThe Vista simultaneous ICP-OES axially viewed plasma wasused for the analysis. The Vista features a free running, aircooled, 40 MHz RF generator and cooled cone interface. TheVista’s optical system is based on an echelle polychromatorwith Charged Coupled Device (CCD) detector. The polychro-mator is thermostatted to 35 °C for stability, and the uniqueCCD detector features 70,000 pixels (detectors) arranged toexactly match the 2 dimensional echellogram. Sophisticateddesign of the detector has resulted in a rapid readout withexcellent detection limits [4]. The instrument was controlledby an IBM computer with an Intel Pentium processor andAgilent’s Vista worksheet software running under Microsoft’sWindows NT operating system.
In this work a Vista with manual gas pressure regulator wasused. Mass flow control of the nebulizer flow, which allowsthe nebulizer gas flow to be automatically adjusted, is avail-able as an option. This work took advantage of the third chan-nel pump to add internal standard and ionization suppressanton line. The Vista instrument is available with either the twoor three channel pump option.
Table 1. Instrument Operating Conditions
Power 1.35 kW
Plasma gas flow 15.0 L/min
Auxiliary gas flow 1.5 L/min
Spray chamber type Sturman-Masters
Torch Standard axial torch with 2.3 mm id injector
Nebulizer V-groove
Nebulizer pressure 240 kPa
Pump tube Inlet PVC black-black
Outlet PVC, blue-blue, 1.65 mm id
Polychromator purge Boost (3.7 L/min)
Pump speed 15 rpm
Sample uptake rate 0.6 mL/min
Integration time 3 seconds
No. of replicates 3
Sample delay time 20 seconds
Fast pump On
Stabilization time 20 seconds
Background correction Fitted, 2 points/peak
To make sure that the milk powder sample was evenly mixedand in suspension while being aspirated, the solution wascontinuously stirred with a magnetic stirrer. Sodium and

3
Both caesium and scandium were used as internal standardsin the analysis. Caesium also acted as an ionization suppres-sant. A bulk solution of 1% CsCl and scandium (0.5 mg/L)and was added to all solutions via the third channel of theperistaltic pump.
Results and Discussion
Milk Powder AnalysisThe results presented in Tables 3–5 represent the concentra-tions of constituent elements in the milk powder on a dryweight basis. Previous work [2] had shown that the milkpowder samples typically have low moisture contentsand the samples were determined directly from the rawmaterial without drying.
Table 3. Analysis of Standard Reference Material, S.R.M. 8435
2.0% S.R.M. 8435 S.R.M. 8435Wavelength whole milk powder certified value
Element (nm) (ppm) (ppm)
Ba 493.408 0.72 ± 0.03 0.58 ± 0.23
Ca 373.690 8990 ± 340 9220 ± 490
K 404.721 12580 ± 210 13630 ± 470
Fe 238.204 1.07 ± 0.01 1.80 ± 1.1
Mg 285.213 838 ± 27 814 ± 76
Mn 257.610 0.17 ± 0.02 0.17 ± 0.05
Na 588.995 3810 ± 40 3560 ± 400
P 185.878 7400 ± 300 7800 ± 490
S 180.669 2320 ± 90 2650 ± 400
Sr 407.771 4.10 ± 0.20 4.35 ± 0.50
Zn 202.548 25.2 ± 0.9 28.0 ± 3.1
Table 4: Analysis of 2% Milk Powder
Wavelength 2.0% Milk powderElement (nm) sample (wt%)
Ba 493.408 0.97
Ca 373.690 8909
K 404.721 11657
Fe 238.204 1.76
Mg 285.213 796
Mn 257.610 0.37
Na 588.995 3118
P 185.878 7729
S 180.669 2278
Sr 407.771 5.48
Zn 202.548 28.4
Table 5. Analysis of MAF#1
The “Known values” are values supplied by the New ZealandDairy Research Institute.
Wavelength 2.0% MAF#1 sample Known valueElement (nm) (ppm) (ppm)
Ba 493.408 3.24 ± 0.01 –
Ca 373.690 13750 ± 9 13274
K 404.721 15600 ± 120 17040
Fe 238.204 1.36 ± 0.04 2.0
Mn 257.610 0.310 ± 0.0001 –
Na 588.995 4000 ± 50 3490
P 185.878 10600 ± 140 9930
S 180.669 3280 ± 40 3280
Sr 407.771 3.99 ± 0.03 –
Zn 202.548 40.2 ± 0.8 37.33
Summary
The concentrations of various elements of both nutritionaland environmental interest in milk powder samples weredetermined directly using the axially viewed Vista simultane-ous ICP-OES. Aqueous calibration solutions were used andthe scandium and caesium internal standards successfullycorrected for the viscosity effects of the samples.
The addition of caesium as an ionization suppressant elimi-nated ionization interferences and the need for dilution,allowing both major and minor constituents to be measuredin a single solution. Both trace and major element concentra-tions were able to be determined in the 2% w/v milk powdersamples, with less sensitive analytical lines chosen for theelements present in the greatest concentrations, such as Ca.This wavelength selection flexibility, provided by the opticaland detector design of the Vista, avoided the need to re-measure samples using the less sensitive radial opticalconfiguration.
All measured values are in very good agreement with the cer-tified values for the standard reference material, validatingthe accuracy of the method.
Acknowledgments
The authors wish to thank the New Zealand Dairy ResearchInstitute for providing samples and test results, as well asStewart Carter for help in preparing this manuscript.
References
P. D. Kluckner, D. F. Brown, R. Sylvestre, “Analysis of milk byplasma emission spectrometry”. ICP Information Newsletter,1981, 7, 83.
A. J. Ryan, “Direct analysis of milk powder on the LibertySeries II ICP-AES with the axially-viewed plasma”. ICPInstruments At Work, 1997, ICP-21
R. C. Munter, R. A. Grande, P. C. Ahn, “Analysis of animaltissue and food materials by inductively coupled plasma emis-sion spectrometry in a university research service laboratory”.ICP Information Newsletter, 1979, 5, 368.
N. W. Barnett, L. S. Chen, G. F. Kirkbright, “Determination oftrace concentrations of lead and nickel in freeze-dried humanmilk by atomic absorption spectrometry and inductively cou-pled plasma emission spectrometry”. Analytica Chimica Acta,1983, 149, 115-121.
J. Borkowska-Burnecka, E. Szmigiel, W. Zyrnicki,“Determination of major and trace elements in powdered milkby inductively coupled plasma atomic emission spectrometry”.Chemia Analityczna (Warsaw), 1996, 41, 625-632.
S. E. Emmett, “Analysis of liquid milk by inductively coupledplasma mass spectrometry”. Journal of Analytical AtomicSpectrometry, 1988, 3, 1145-1146.
C. Dubuisson, E. Poussel, J. M. Mermet, “Comparison of axi-ally and radially viewed inductively coupled plasma atomicemission spectrometry in terms of signal-to-background ratioand matrix effects”. Journal of Analytical AtomicSpectrometry, 1997, 12, 281-286.
www.agilent.com/chem
Agilent shall not be liable for errors contained herein orfor incidental or consequential damages in connectionwith the furnishing, performance, or use of this material.
Information, descriptions, and specifications in this publication are subject to change without notice.
© Agilent Technologies, Inc., 1999Printed in the USANovember 1, 2010ICPES-26
For More Information
For more information on our products and services, visit ourWeb site at www.agilent.com/chem

The Direct Analysis of Milk Powderon the Liberty Series II ICP-OES withthe Axially-Viewed Plasma
Author
Andrew Ryan
Application Note
Inductively Coupled Plasma-Optical Emission Spectrometers
Introduction
The analysis of milk is important because milk is an indicator of environmental cont-amination, a significant pathway for toxic metal intake by humans and a source ofessential nutrients. Previously, milk liquid and milk powder analysis was carried outusing flame and graphite furnace atomic absorption spectrometry and even anodicstripping voltammetry [1]. Inductively coupled plasma atomic emission spectrometry(ICP-OES) and inductively coupled plasma mass spectrometry (ICP-MS) are nowpreferred for routine determinations because of the rapid multi-element analysiscapabilities of these techniques.
Generally, milk samples are prepared by either wet digestion or dry ashing [1-5].These are time consuming and involve procedures using potentially hazardouschemicals. Direct slurry nebulization combined with standard additions calibrationhas also been reported for ICP-MS with varying success [5,6]. The accuracy of stan-dard additions is greatly influenced by calibration linearity and the presence of spec-tral interference. The ICP-MS technique has the advantage of sensitivity but isunable to analyzse high dissolved solid contents for long periods of time and theinstrumentation is more expensive than ICP-OES.
This work describes the direct analysis of milk powder using standard quantitativecalibration with aqueous standards. Viscosity effects of the milk powder solutionsare corrected for using scandium (361.384 nm—ionic line) as an internal standard.Major, minor and trace elements were determined in a single analysis. Less sensi-tive lines are used for the determination of major elements allowing both major andminor elements to be determined from a single sample solution.
Many of the major constituents in milk powder such as Na, K and Ca are easily ion-ized elements (EIE) that have been reported to cause ionization interferences.Ionization interferences tend to cause a reduction in signal intensity with increasingconcentration of EIE and the effect is prominent at interferent concentrations at orabove 100 mg/L. The atomic lines of Na and, K, and to a lesser extent Ca(422.673 nm) and Li, exhibit signal enhancement with increasing concentrations of

2
Table 1: Instrument Operating Conditions
Power 1.30 kW
Plasma gas flow 15.0 L/min
Auxiliary gas flow 1.5 L/min
Spray chamber type Sturman- Masters
Torch Standard axial torch with 2.3 mm id injector
Nebulizer V-groove
Nebulizer pressure 240 kPa
Pump tube Inlet - PVC grey-grey, 1.30 mm id
Outlet - PVC, blue-blue, 1.65 mm id
Pump speedrate 15 rpm
Sample uptake rate 1.5 mL/min
Integration time 1 second for Ca, K, Mg, Na, P, S and Sr
3 seconds for Ba, Fe, Mn, Zn and Sc
No. of replicates 3
Sample delay time 25 seconds
Fast pump On
Stabilization time 20 seconds
Background correction Polynomial plotted background
PMT voltage 600 V
For the determination of sulfur, an Auxiliary Gas Module-2(AGM-2) is required. The AGM provides a nitrogen purge forthe monochromator to extend the working wavelength rangefrom 189 nm down to 175 nm.
To make sure that the milk powder sample was evenly mixedand in suspension while being aspirated, the solution wascontinuously stirred with a magnetic stirrer.
Standard PreparationAqueous standards were prepared from Custom-Grade Multi-element Solutions Var Cal 1, Var Cal 2 and Var Majors 1(Inorganic Ventures, Inc.) and from 1000 mg/L single elementstandards (Spectrosol, BDH Chemicals). The standards weremade up in 18 MW Milli-Q water with 0.5% v/v HNO3 and0.002% v/v Triton X100 prepared from a 1% w/v Triton X100solution. Scandium was added to each solution as an internalstandard with a final concentration of 0.5 mg/L.
The following calibration standards were prepared.
EIE. The effect can be easily minimized or eliminated on aradially-viewed ICP-OES by adjusting the viewing height. Forthe more sensitive axially-viewed ICP-OES, many reports ofinterferences due to EIE have been described [7,8]. In onereport, scandium used as an internal standard was found tocompensate for part of the signal depression [8]. Ionizationinterferences on the axially-viewed plasma have been foundto be reduced by lowering the nebulizer pressure and increas-ing the power. Increasing the power increases the electrondensity in the plasma thus reducing the effect of electronscontributed by the EIE. Generally, when analyzsing samplesthat contain high levels of EIE, it is recommended that allstandards have similar levels of EIE added (matrix matching).
An alternative is to saturate the plasma with a high concentra-tion of another EIE such as caesium. Therefore, the effect ofadding caesium as an ionization suppressant to the standardsand samples was also investigated.
The accuracy and validity of the method was assessed by theuse of National Institute of Standards and Technology (NIST)Standard Reference Material (SRM) 8435 Whole Milk Powder.
Experimental
InstrumentalAn Agilent Liberty Series II ICP-OES with the axially-viewedplasma was used for the analysis.
The Liberty Series II ICP features a 40 MHz free running RFgenerator, a 0.75 m Czerny-Turner monochromator with a1800 grooves/mm holographic grating used in up to fourorders. The resolution of the optical system ranges from0.018 nm in the 1st order to 0.006 nm in the 4th order.
The instrument was controlled with a Digital EquipmentCorporation (DEC) Venturis computer with an Intel Pentiumprocessor and Agilent’s Plasma 96 software running underMicrosoft’s Windows 95 operating system.
The instrument operating conditions are listed in Table 1.
3
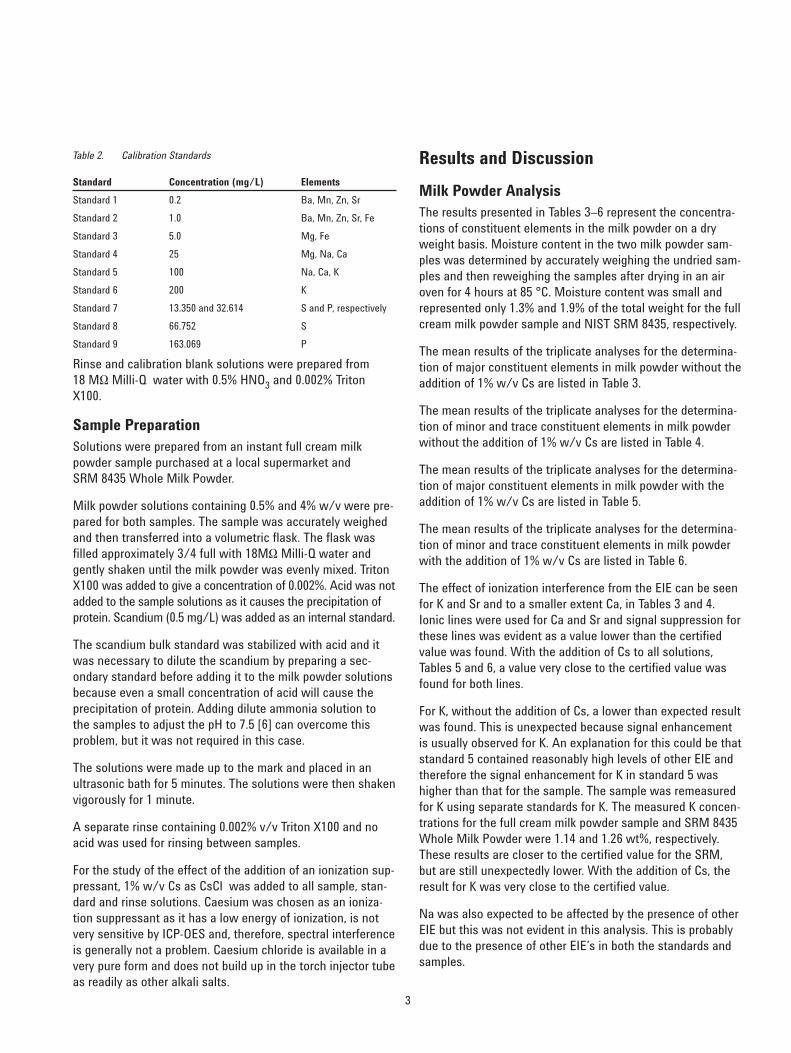
Table 2. Calibration Standards
Standard Concentration (mg/L) Elements
Standard 1 0.2 Ba, Mn, Zn, Sr
Standard 2 1.0 Ba, Mn, Zn, Sr, Fe
Standard 3 5.0 Mg, Fe
Standard 4 25 Mg, Na, Ca
Standard 5 100 Na, Ca, K
Standard 6 200 K
Standard 7 13.350 and 32.614 S and P, respectively
Standard 8 66.752 S
Standard 9 163.069 P
Rinse and calibration blank solutions were prepared from 18 MW Milli-Q water with 0.5% HNO3 and 0.002% TritonX100.
Sample PreparationSolutions were prepared from an instant full cream milkpowder sample purchased at a local supermarket and SRM 8435 Whole Milk Powder.
Milk powder solutions containing 0.5% and 4% w/v were pre-pared for both samples. The sample was accurately weighedand then transferred into a volumetric flask. The flask wasfilled approximately 3/4 full with 18MW Milli-Q water andgently shaken until the milk powder was evenly mixed. TritonX100 was added to give a concentration of 0.002%. Acid was notadded to the sample solutions as it causes the precipitation ofprotein. Scandium (0.5 mg/L) was added as an internal standard.
The scandium bulk standard was stabilized with acid and itwas necessary to dilute the scandium by preparing a sec-ondary standard before adding it to the milk powder solutionsbecause even a small concentration of acid will cause theprecipitation of protein. Adding dilute ammonia solution tothe samples to adjust the pH to 7.5 [6] can overcome thisproblem, but it was not required in this case.
The solutions were made up to the mark and placed in anultrasonic bath for 5 minutes. The solutions were then shakenvigorously for 1 minute.
A separate rinse containing 0.002% v/v Triton X100 and noacid was used for rinsing between samples.
For the study of the effect of the addition of an ionization sup-pressant, 1% w/v Cs as CsCl was added to all sample, stan-dard and rinse solutions. Caesium was chosen as an ioniza-tion suppressant as it has a low energy of ionization, is notvery sensitive by ICP-OES and, therefore, spectral interferenceis generally not a problem. Caesium chloride is available in avery pure form and does not build up in the torch injector tubeas readily as other alkali salts.
Results and Discussion
Milk Powder AnalysisThe results presented in Tables 3–6 represent the concentra-tions of constituent elements in the milk powder on a dryweight basis. Moisture content in the two milk powder sam-ples was determined by accurately weighing the undried sam-ples and then reweighing the samples after drying in an airoven for 4 hours at 85 °C. Moisture content was small andrepresented only 1.3% and 1.9% of the total weight for the fullcream milk powder sample and NIST SRM 8435, respectively.
The mean results of the triplicate analyses for the determina-tion of major constituent elements in milk powder without theaddition of 1% w/v Cs are listed in Table 3.
The mean results of the triplicate analyses for the determina-tion of minor and trace constituent elements in milk powderwithout the addition of 1% w/v Cs are listed in Table 4.
The mean results of the triplicate analyses for the determina-tion of major constituent elements in milk powder with theaddition of 1% w/v Cs are listed in Table 5.
The mean results of the triplicate analyses for the determina-tion of minor and trace constituent elements in milk powderwith the addition of 1% w/v Cs are listed in Table 6.
The effect of ionization interference from the EIE can be seenfor K and Sr and to a smaller extent Ca, in Tables 3 and 4.Ionic lines were used for Ca and Sr and signal suppression forthese lines was evident as a value lower than the certifiedvalue was found. With the addition of Cs to all solutions,Tables 5 and 6, a value very close to the certified value wasfound for both lines.
For K, without the addition of Cs, a lower than expected resultwas found. This is unexpected because signal enhancementis usually observed for K. An explanation for this could be thatstandard 5 contained reasonably high levels of other EIE andtherefore the signal enhancement for K in standard 5 washigher than that for the sample. The sample was remeasuredfor K using separate standards for K. The measured K concen-trations for the full cream milk powder sample and SRM 8435Whole Milk Powder were 1.14 and 1.26 wt%, respectively.These results are closer to the certified value for the SRM,but are still unexpectedly lower. With the addition of Cs, theresult for K was very close to the certified value.
Na was also expected to be affected by the presence of otherEIE but this was not evident in this analysis. This is probablydue to the presence of other EIE’s in both the standards andsamples.

4
The remaining elements did not appear to be greatly affected bythe EIE because much of the signal depression was corrected bythe internal standard.
For the 4% milk powder solutions without added Cs, EIE con-centration was approximately 1000 mg/L and ionization inter-
ference is reportedly [8] quite significant at these levels.Despite this, results very close to the certified values werefound for Ba, Fe and Mn. This suggests the internal standardnot only successfully corrected for the different viscosity ofthe samples but also corrected for ionization interference forthese elements.
Table 3. Major Elements in Milk Powder Without the Addition of Caesium
Element Wavelength (nm) 0.5% Milk powder sample (wt%) 0.5%S.R.M. 8435 Whole milk powder (wt%) S.R.M. 8435 Certified value (wt%)
Ca 315.887 0.849 ± 0.033 0.876 ± 0.008 0.922 ± 0.049
K 769.896 0.844 ± 0.044 0.975 ± 0.020 1.363 ± 0.047
Na 588.995 0.277 ± 0.010 0.376 ± 0.004 0.356 ± 0.040
P 213.618 0.761 ± 0.031 0.784 ± 0.019 0.780 ± 0.049
S 180.731 0.263 ± 0.019 0.268 ± 0.006 0.265 ± 0.035
Table 4. Minor and Trace Elements in Milk Powder Without the Addition of Caesium
0.5% S.R.M. (mg/kg) 4% S.R.M. S.R.M. 8435 0.5% Milk powder 4% Milk powder 8435 Whole milk 8435 Whole milk Certified value
Element Wavelength (nm) sample (mg/kg) sample (mg/kg) powder (mg/kg) powder (mg/kg) (mg/kg)
Mg 285.213 754 ± 23 808 ± 22 814 ± 76
Sr 407.771 4.65 ± 0.04 3.77 ± 0.03 4.35 ± 0.50
Zn 213.856 27.5 ± 1.5 25.5 ± 0.8 28.0 ± 3.1
Ba 455.403 0.70 ± 0.03 0.57 ± 0.02 0.58 ± 0.23
Fe 259.940 2.30 ± 0.05 1.70 ± 0.03 1.8 ± 1.1
Mn 257.610 0.242 ± 0.001 0.151 ± 0.004 0.17 ± 0.05
Table 5. Major Elements in Milk Powder With the Addition of 1% (w/v) Caesium
Element Wavelength (nm) 0.5% Milk powder sample (wt%) 0.5%S.R.M. 8435 Whole milk powder (wt%) S.R.M. 8435 Certified value (wt%)
Ca 315.887 0.931 ± 0.019 0.899 ± 0.021 0.922 ± 0.049
K 769.896 1.304 ± 0.032 1.397 ± 0.024 1.363 ± 0.047
Na 588.995 0.298 ± 0.004 0.378 ± 0.004 0.356 ± 0.040
Na 330.237 0.280 ± 0.004 0.360 ± 0.007 0.356 ± 0.040
P 213.618 0.775 ± 0.017 0.758 ± 0.004 0.780 ± 0.049
S 180.731 0.252 ± 0.007 0.254 ± 0.006 0.265 ± 0.035
Table 6. Minor and Trace Elements in Milk Powder With the Addition of 1% (w/v) Caesium
0.5% S.R.M. (mg/kg) 4% S.R.M. S.R.M. 8435 0.5% Milk powder 4% Milk powder 8435 Whole milk 8435 Whole milk Certified value
Element Wavelength (nm) sample (mg/kg) sample (mg/kg) powder (mg/kg) powder (mg/kg) (mg/kg)
Mg 285.213 761 ± 14 775 ± 13 814 ± 76
Sr 407.771 5.53 ± 0.05 4.40 ± 0.07 4.35 ± 0.50
Zn 213.856 30.0 0.7 26.3 ± 0.5 28.0 ± 3.1
Ba 455.403 0.79 ± 0.02 0.62 ± 0.01 0.58 ± 0.23
Fe 259.940 2.23 ± 0.07 1.76 ± 0.06 1.8 ± 1.1
Mn 257.610 0.269 ± 0.004 0.167 ± 0.007 0.17 ± 0.05

5
Long Term Stability
The long term stability was determined for the most concentratedmilk powder solution to show that good stability can be obtainedover a reasonable period of time for a solution containing a highcontent of dissolved and undissolved solids. The effect of internalstandardization on long term stability was also studied.
Long term stability was evaluated by continuously aspirating4% instant full cream milk powder solution over a period oftime. A one minute rinse was performed at the maximumpump rate of 50 rpm (fast pump) between measurements.
The precision of the measurements over one and a half hours withinternal standardization correction ranged from 1.2 and 2.0 %RSD.
The long term stability plots for major constituents Ca and Mgand minor constituents Ba, Mn and Sr with and without internalstandardization are displayed in Figures 1 and 2, respectively.
Figure 2. Signal stability over one and a half hours for a 4% full cream milkpowder solution without internal standardization.
Figure 1. Signal stability over one and a half hours for a 4% full cream milkpowder solution with internal standardization.
After the milk powder solution had been aspirated for overone and a half hours, the injector tube showed signs of block-age due to deposition of the milk powder. Figure 2 shows theeffect of the build up of milk powder on the signal. Not onlydoes the internal standard correct for viscosity effects andsome ionization interferences, from Figure 1 it can be seenthat it is also very effective in compensating for drift causedby the gradual build up of milk powder in the injector tube ofthe torch.
Five replicates were measured at an integration time of threeseconds for each line. The precision for each measurementranged from 0.1 to 1.6 %RSD for the major constituent ele-ments and 0.2 to 3.0 %RSD for minor and trace constituentelements.
Sample Delay and Stabilization TimesWhen differing matrices are aspirated into a spray chamber,some time must be allowed so that the solution can reach theplasma and for the signal to stabilize. The time required toallow the system to stabilize when switching from aqueoussolutions to the milk powder solutions was studied.
This was evaluated by firstly aspirating the rinse solution fol-lowed by a 4% full cream milk powder solution. The pumpspeed was set to 50 rpm (fast pump speed), which is thepump rate used during the sample delay stage, and the signalwas monitored for Sc.
A plot of the signal over a short period of time is displayed inFigure 3.
Figure 3. Stabilization profile for a 4% full cream milk powder solution.

www.agilent.com/chem
Agilent shall not be liable for errors contained herein orfor incidental or consequential damages in connectionwith the furnishing, performance, or use of this material.
Information, descriptions, and specifications in this publication are subject to change without notice.
© Agilent Technologies, Inc., 1997Printed in the USANovember 1, 2010ICPES-21
When switching from the rinse solution to the 4% milkpowder solution, the signal was found to stabilize after 20–25 seconds. Therefore, for the analysis of the milk powdersolutions, a sample delay time of 25 seconds was used. Thestabilization time was set to 20 seconds. The stabilizationtime is the time allowed for the pump to slow down from fullspeed to the analysis pump speed—in this case, 15 rpm.
It was observed that the presence of Triton X100 detergent,which is often used for slurry nebulization to help keep thesample in suspension, greatly reduced the stabilization time.
Summary
The concentrations of various elements of both nutritional andenvironmental interest in milk powder samples were deter-mined on the Liberty Series II with the axially-viewed plasma.
Aqueous calibration solutions were used and the scandiuminternal standard successfully corrected for the viscosityeffects of the samples, improved the long term stability of theanalysis and corrected for some ionization interferences dueto the high levels of EIE.
The time required for the system to stabilize after switchingfrom aqueous solutions to the milk powder solutions wasfound to be very short.
The addition of caesium as an ionization suppressant eliminatedionization interferences and the need for dilution, allowing bothmajor and minor constituents to be measured in a single solu-tion. For the determination of trace elements such as strontiumwhere a more concentrated milk powder solution is required, theaddition of caesium becomes an important factor.
With the addition of 1% caesium, all measured values are invery good agreement with the certified values for the standardreference material, validating the accuracy of the method.
References
1. P. D. Kluckner, D. F. Brown, R. Sylvestre, “Analysis of milkby plasma emission spectrometry”. ICP InformationNewsletter, 1981, 7, 83.
2. R. C. Munter, R. A. Grande, P. C. Ahn, “Analysis of animaltissue and food materials by inductively coupled plasmaemission spectrometry in a university research servicelaboratory”. ICP Information Newsletter, 1979, 5, 368.
3. N. W. Barnett, L. S. Chen, G. F. Kirkbright, “Determinationof trace concentrations of lead and nickel in freeze-driedhuman milk by atomic absorption spectrometry and induc-tively coupled plasma emission spectrometry”. AnalyticaChimica Acta, 1983, 149, 115-121.
4. J. Borkowska-Burnecka, E. Szmigiel, W. Zyrnicki,“Determination of major and trace elements in powderedmilk by inductively coupled plasma atomic emission spec-trometry”. Chemia Analityczna (Warsaw), 1996, 41, 625-632.
5. S. E. Emmett, “Analysis of liquid milk by inductively cou-pled plasma mass spectrometry”. Journal of AnalyticalAtomic Spectrometry, 1988, 3, 1145-1146.
6. J. R. Dean, L. Ebdon, R. Massey, “Selection of mode forthe measurement of lead isotope ratios by inductivelycoupled plasma mass spectrometry and its applicationto milk powder analysis”. Journal of Analytical AtomicSpectrometry, 1987, 2, 369-374.
7. C. Dubuisson, E. Poussel, J-M. Mermet, “Comparison ofaxially and radially viewed inductively coupled plasmaatomic emission spectrometry in terms of signal-to-background ratio and matrix effects”. Journal ofAnalytical Atomic Spectrometry, 1997, 12, 281-286.
8. I. B. Brenner, A. Zander, M. Cole, “Characterization of anaxially and radially viewed inductively coupled plasma -influence of Na and Ca”. Journal of Analytical AtomicSpectrometry, In Press.
For More Information
For more information on our products and services, visit ourWeb site at www.agilent.com/chem

Analysis of Shellfish Tissue forCadmium, Mercury and Nickel
Author
Jonathan H. Moffett
Application Note
Atomic Absorption
Introduction
Huge amounts of toxic effluents are being dumped either directly or indirectly intothe world’s oceans. The ocean's organisms concentrate these toxic chemicals withunfortunate effects on humans. Since the tragedy at Minamata Bay, Japan, in the1950s, the levels of toxic metals in seafood have been carefully monitored [1]. Thisis especially important around coastal industrial and mining areas as well as rivermouths.
Shellfish such as oysters and mussels are bottom-dwelling non-mobile filter feed-ers. These factors mean that shellfish are very good environmental indicators andcan locate sources of pollution.
The screening of fish must be rapid and accurate. A method for digesting fish formercury determinations by cold vapor has been described [1]. As mercury is veryvolatile, the digestion method should be applicable to other toxic heavy metals.
A freeze dried sample of shellfish tissue was supplied and a method was requiredfor digestion and analysis.
2
Reference Sample A National Institute of Science and Technology (NIST) stan-dard reference material, bovine liver (1577), was used as areference sample.
Sample Preparation Two digestion procedures were considered. The first digestionmethod was shown to be suitable for mercury in fish tissue[1]. In this method a sample (1g) was digested in concen-trated nitric acid (10 mL). This method was eventually usedfor this study.
The second method was used to determine As, Sb and Se invarious environmental matrices [3]. This method is a modifiedversion of the first method by including hydrogen peroxide.
NIST 1577 Concentrated nitric acid (10 mL) was added to a known massof liver (1 g) in a test tube [1]. After heating for three hours at125 °C, the warm yellow solution was quantitatively trans-ferred to a 50-mL volumetric flask. When made up to the markwith DD water, fat solidified as a precipitate. This did notappear to affect results.
Shellfish Sample One fish sample was cut into halves using stainless steelscissors. Each half was digested separately. The digestionquantities above were scaled down by a factor of 10 becauseeach half weighed about
0.1 g. Heating times were not changed. The solutions weretransferred to 5-mL volumetric flasks. These were subsequently diluted as needed.
All masses and final volumes of the samples are shown inTable 2.
Experimental
Reagents All reagents were AR grade. Water was deionized distilled(DD) water (18 M-ohm grade).
Standards Standards were diluted from 1000 mg/L commercial atomicabsorption solutions in deionized distilled (DD) water withdilute nitric acid as stabilizer. Working concentrations usedare shown in Table 1.
Table 1. Working Concentration of Standards
Cd 5.00 µg/L in 0.08 M HNO3Ni 50.0 µg/L in 0.08 M HNO3Hg 0.50 µg/L in 0.3 M HNO3/0.04% (m/v) K2Cr2O7
Modifier
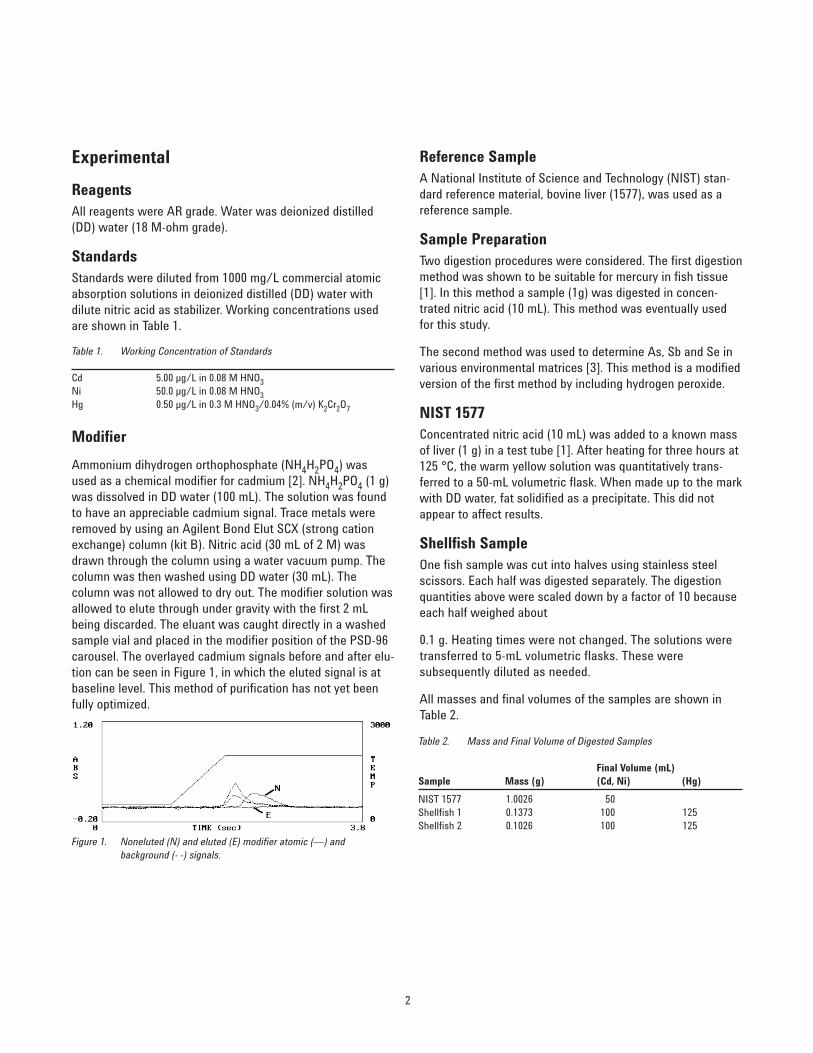
Ammonium dihydrogen orthophosphate (NH4H2PO4) wasused as a chemical modifier for cadmium [2]. NH4H2PO4 (1 g)was dissolved in DD water (100 mL). The solution was foundto have an appreciable cadmium signal. Trace metals wereremoved by using an Agilent Bond Elut SCX (strong cationexchange) column (kit B). Nitric acid (30 mL of 2 M) wasdrawn through the column using a water vacuum pump. Thecolumn was then washed using DD water (30 mL). Thecolumn was not allowed to dry out. The modifier solution wasallowed to elute through under gravity with the first 2 mLbeing discarded. The eluant was caught directly in a washedsample vial and placed in the modifier position of the PSD-96carousel. The overlayed cadmium signals before and after elu-tion can be seen in Figure 1, in which the eluted signal is atbaseline level. This method of purification has not yet beenfully optimized.
Table 2. Mass and Final Volume of Digested Samples
Final Volume (mL)Sample Mass (g) (Cd, Ni) (Hg)
NIST 1577 1.0026 50Shellfish 1 0.1373 100 125Shellfish 2 0.1026 100 125
Figure 1. Noneluted (N) and eluted (E) modifier atomic (—) and background (- -) signals.
3
Instrumentation
For the determination of nickel and cadmium, an AgilentSpectrAA-300GZ atomic absorption spectrometer withZeeman background correction, and fitted with a PSD-96 sam-pler, was used. Atomization for cadmium was from a pyrolyticforked platform. Atomization for nickel was from the wall of apyrolytic coated partition tube. Argon was the inert gas.
For the determination of mercury, an Agilent SpectrAA-20ABQatomic absorption spectrometer fitted with a VGA-76 vaporgeneration accessory and an MCA-90 mercury concentrationaccessory were used [4].
Lamps were standard Agilent hollow cathode lamps for eachof the elements.
Recovery studies for nickel and cadmium were performedusing Quality Control Protocol (QCP V2.0). Signal graphicswere captured using Signal Graphics Library (SGL V1.01).
Instrument parameters are given in Tables 3a, 3b and 3c.
Results and Discussion
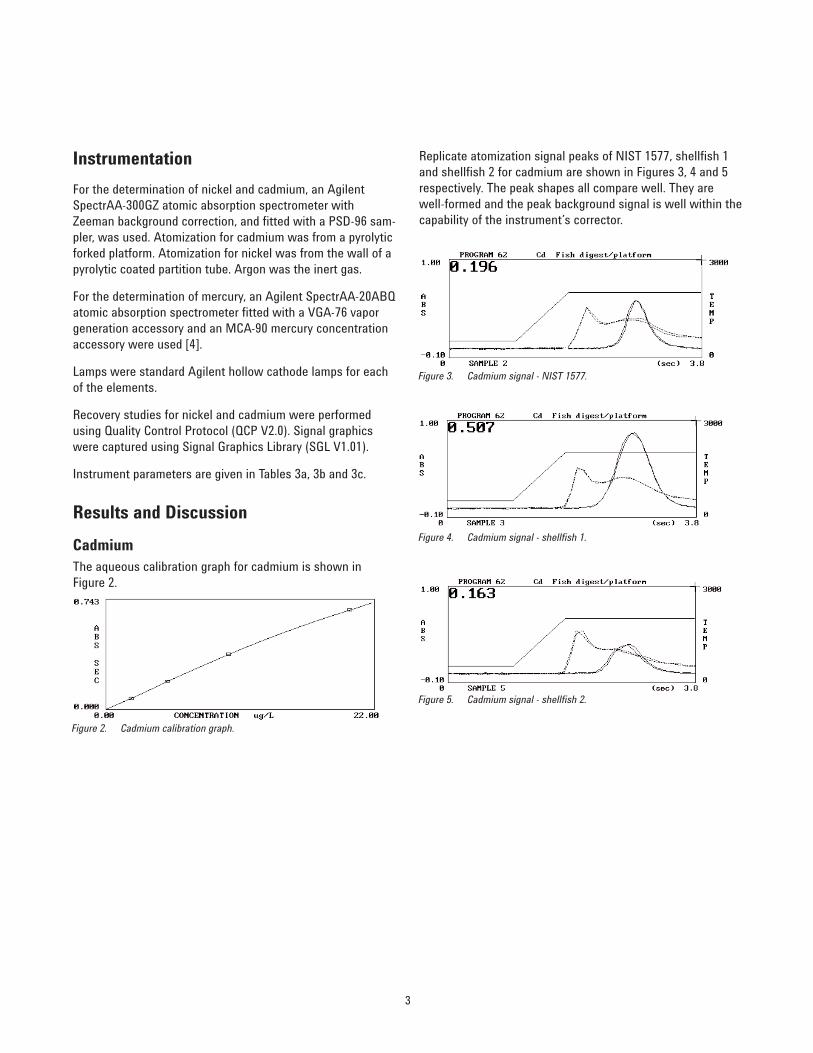
Cadmium The aqueous calibration graph for cadmium is shown inFigure 2.
Replicate atomization signal peaks of NIST 1577, shellfish 1and shellfish 2 for cadmium are shown in Figures 3, 4 and 5respectively. The peak shapes all compare well. They arewell-formed and the peak background signal is well within thecapability of the instrument’s corrector.
Figure 2. Cadmium calibration graph.
Figure 3. Cadmium signal - NIST 1577.
Figure 4. Cadmium signal - shellfish 1.
Figure 5. Cadmium signal - shellfish 2.

4
Table 3a. Instrument Parameters for the Determination of Cadmium
Program 62: Cd fish digest/platform
Instrument mode AbsorbanceCalibration mode ConcentrationMeasurement mode Peak areaLamp position 3Lamp current (mA) 4Slit width (nm) 0.5Slit height NormalWavelength (nm) 228.8Sample introduction Sampler automixingTime constant 0.05Measurement time (s) 1.0Replicates 2Background correction OnMaximum absorbance 0.70
Furnace parametersStep Temperature Time Gas flow Readno. (C) (s) (L/min) Gas type command
1 350 20.0 3.0 Normal No2 500 15.0 3.0 Normal No3 500 10.0 3.0 Normal No4 500 1.0 3.0 Normal No5 2000 0.8 0.0 Normal Yes6 2000 2.0 0.0 Normal Yes7 2500 2.0 3.0 Normal No
Sampler parametersVolumes (µL)
Solution Blank Modifier
Blank – 20 5Standard 1 2 18 5Standard 2 5 15 5Standard 3 10 10 5Standard 4 20 5Sample 5 15 5
Recalibration rate 0Reslope rate 0
Multiple inject No Hot inject Yes Pre inject NoTemperature 150Inject rate 5
Table 3b. Instrument Parameters for the Determination of Nickel
Program 66: Ni fish digest/wall
Instrument mode AbsorbanceCalibration mode ConcentrationMeasurement mode Peak areaLamp position 2Lamp current (mA) 6Slit width (nm) 0.2Slit height NormalWavelength (nm) 232.0Sample introduction Sampler automixingTime constant 0.05Measurement time (s) 1.0Replicates 2Background correction OnMaximum absorbance 1.00
Furnace parametersStep Temperature Time Gas flow Readno. (C) (s) (L/min) Gas type command
1 150 20.0 3.0 Normal No2 700 15.0 3.0 Normal No3 700 10.0 3.0 Normal No4 700 1.0 3.0 Normal No5 2400 0.9 0.0 Normal Yes6 2400 2.0 0.0 Normal Yes7 2500 2.0 3.0 Normal No
Sampler parametersVolumes (µL)
Solution Blank Modifier
Blank – 20Standard 1 2 18Standard 2 5 15Standard 3 10 10Standard 4 20Sample 10 10
Recalibration rate 0Reslope rate 0
Multiple inject No Hot inject Yes Pre inject NoTemperature 120Inject rate 5
5
The close result between shellfish 1 and shellfish 2 for nickelindicates homogeneous distribution in the original sample.NIST 1577 does not have a certified level of nickel.
Recovery Studies QCP software allows a QC spike recovery by spiking thefinal solution with standard solution during injection intothe furnace. The recovery (%R) is calculated as below:
%R = (SSR-SR)/SA ! 100
where
SSR = Spiked sample result
SR = Sample result
SA = Spike added
If recovery is between 85% to 115% the aqueous calibrationgraph is normally considered to be a close match for thesample solution. A recovery of less than 40% usually indi-cates either a severe matrix effect or else measurement closeto or greater than the maximum absorbance of the elementusing a Zeeman effect instrument. The recovery results forthe samples are given in Table 4a, 4b and 4c.
The result of the NIST 1577 analysis for cadmium tends tosupport the validity of the digestion and calibration proce-dures. Table 4a shows the result is very close to the certifiedvalue.
The wide difference between shellfish 1 and shellfish 2 forcadmium cannot be explained from this study alone. The dis-crepancy is caused either by contamination or by inhomoge-neous distribution of cadmium in the original sample, withcontamination being the most likely cause.
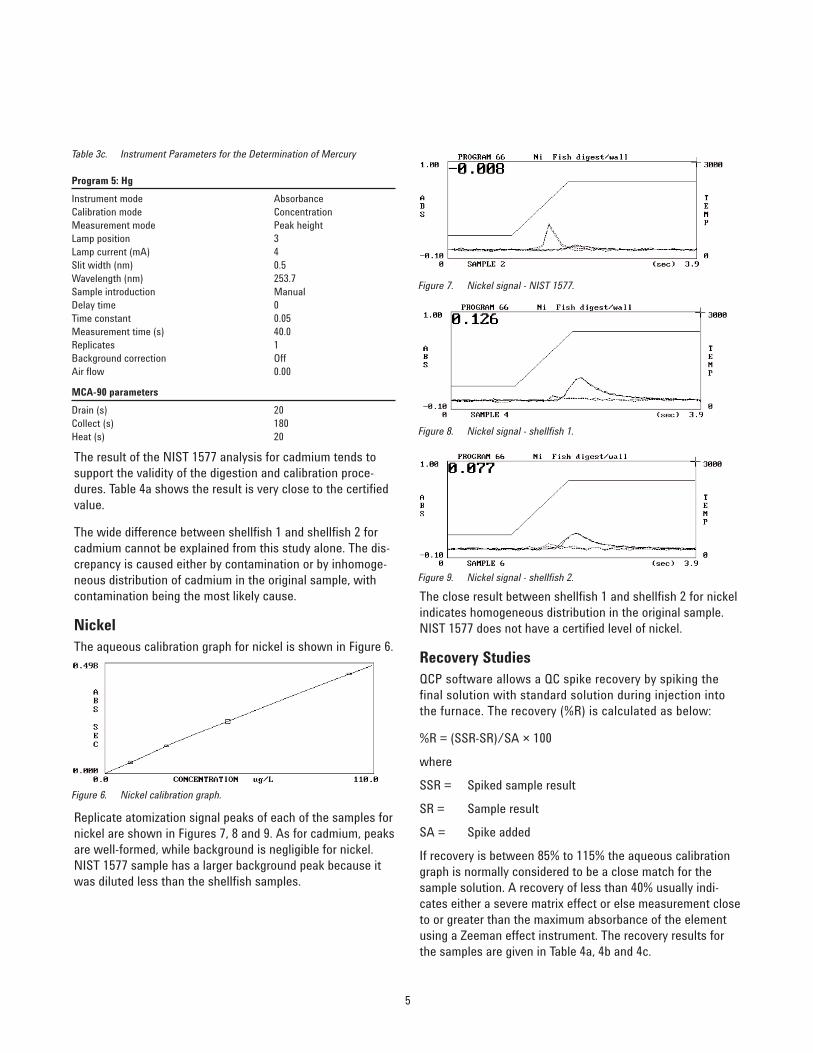
Nickel The aqueous calibration graph for nickel is shown in Figure 6.
Replicate atomization signal peaks of each of the samples fornickel are shown in Figures 7, 8 and 9. As for cadmium, peaksare well-formed, while background is negligible for nickel.NIST 1577 sample has a larger background peak because itwas diluted less than the shellfish samples.
Table 3c. Instrument Parameters for the Determination of Mercury
Program 5: Hg
Instrument mode AbsorbanceCalibration mode ConcentrationMeasurement mode Peak heightLamp position 3Lamp current (mA) 4Slit width (nm) 0.5Wavelength (nm) 253.7Sample introduction ManualDelay time 0Time constant 0.05Measurement time (s) 40.0Replicates 1Background correction OffAir flow 0.00
MCA-90 parameters
Drain (s) 20Collect (s) 180Heat (s) 20
Figure 7. Nickel signal - NIST 1577.
Figure 8. Nickel signal - shellfish 1.
Figure 9. Nickel signal - shellfish 2.
Figure 6. Nickel calibration graph.
6
The recoveries for cadmium are good except for both aliquotsof shellfish 1. The instrument software has flagged the resultsin Table 4a with an asterisk. This indicates that the maximumabsorbance (0.7) for cadmium has been exceeded. The unex-pectedly high result for shellfish 1 strongly suggested conta-mination of this sample and further studies (including dilutionor reduced sample volumes) were not performed.
The results for shellfish 2 are below the maximumabsorbance limit and the recoveries are very good.
The recoveries are also good for nickel except for one ofshellfish 2 results. However, a portion of the same solutionwhich immediately preceded this one had an excellentrecovery.
A complete recovery study should also include a matrixspike which is the addition of analyte to a sample beforedigestion. The limited amount of sample available did notpermit such study.
Mercury The low levels of mercury in solution required the use of theMCA-90 [4,5]. This measurement consumes about 20 mg ofsample. The amount of sample did not allow spike recoverystudies. The close result of NIST 1577 with the certified valueand the similar results for shellfish 1 and 2 suggests that themeasured results are accurate.
Conclusion
The close agreement of the NIST 1577 results with the certi-fied results indicates that the digestion procedure used wasentirely satisfactory for the volatile elements mercury andcadmium. It seems reasonable that the same would be truefor the shellfish. The final volumes in Table 2 should beadjusted to measure the expected levels in individual sam-ples. They were suitable for the levels of the metals in NIST1577 and shellfish 2.
The generally good recovery study results for the shellfishindicate the results are accurate. Certainly the calibrationprocedure is valid. Confirming the accuracy of any sampleanalysis requires a considerable amount of work. Proceduresshould include: long-term trend studies, inter-laboratorystudies and using (if available) a certified reference fishsample.
Table 4a. Summary of Analytical Results for Cadmium in Shellfish
Soln Conc Certifconc found value RSD recov
Sample (µg/L) (µg/L) (µg/L) (%) (%)
NIST 1577 5.17 0.26 0.27 ± 0.04 0.4 94.5NIST 1577 5.16 0.26 1.5 86.2shellfish 1 14.08* 10.25* 0.3 28.3shellfish 1 13.85* 10.09* 1.2 35.8shellfish 2 4.34 4.23 3.3 85.5shellfish 2 4.32 4.21 1.8 83.9
* is a software label to indicate the measured absorbance exceeded the maxi-mum recommended Zeeman absorbance.
Table 4b. Summary of Analytical Results for Nickel in Shellfish
Soln Conc Certifconc found value RSD recov
Sample (µg/L) (µg/L) (µg/L) (%) (%)
NIST 1577 0.5 0.0 not certified 99.9 83.9NIST 1577 -1.7 -0.1 47.2 102.5shellfish 1 25.9 18.9 0.3 99.6shellfish 1 25.2 18.4 1.0 95.1shellfish 2 15.8 15.4 2.3 91.2shellfish 2 15.8 15.4 6.7 79.3
Table 4c. Summary of Analytical Results for Mercury in Shellfish
Soln Conc Certifiedconc found value
Sample (µg/L) (µg/L) (µg/L)
NIST 1577 0.332 0.0166 0.016 ± 0.002shellfish 1 0.344 0.313shellfish 2 0.372 0.453

7
References
1. S. J. Evans, M. S. Johnson, and, R. T. Leah. VarianInstruments At Work AA-60, May 1986.
2. L. M. Beach. Varian Instruments At Work AA-90, June1989.
3. L. M. Beach. Varian Instruments At Work AA-105,February 1992.
4. J. H. Moffett. Varian Instruments At Work AA-104,December 1991.
5. L. M. Beach. Varian Instruments At Work AA-108,October 1992.
For More Information
For more information on our products and services, visit ourWeb site at www.agilent.com/chem

www.agilent.com/chem
Agilent shall not be liable for errors contained herein orfor incidental or consequential damages in connectionwith the furnishing, performance, or use of this material.
Information, descriptions, and specifications in this publication are subject to change without notice.
© Agilent Technologies, Inc., 1993Printed in the USANovember 1, 2010AA112
!
!
!"#$%&!'()*!+#,-,.(!/)-$,#!-,!0$#-$%&1$#2!
3(-4((%!5)6.7(#!,8!-2(!9:)*$-$,%)7!
;2$%(#(!<(*$=$%(!0)%>#2(%!
! ! ! ! ! !"#$#%&'($)
! !
! ))
) ))
)
)
)
)
!?1-2,:#! "#$%&'$!()#$!
*%+,#$-!.#/)$0,0%+#1!(023!4-5!
()+$6!
!
()60&0$%!76$%3!8)+&0$%!9'6$%!:!;+60<'!=6$%!
*$6,&-+/6,!>/+#$/#1!46?0<6-0<&!!
;+6@#$!A$+B#<1+-&!
;+6@#$!CDEFFG!
()+$6!
?3#-:)=-!
!"#$%"&'()*+,$"-./0)(1*2'"&()$*3(#45#*6#44*
7&)-.%'5).%1*8+23967:*;#4*"4)$*.'*$).)%5/,)*()#$*
83<:*/4'.'&)*%#./'4*/,*=#,94>),?*#*.1&)*'@*>)%<*"4)$*/,*
A%#$/./',#(*2>/,)4)*6)$/-/,)4*8A26:?*#,$*/,*;#.)%*
#,$*4'/(*4#5&()4*#((*.#B),*@%'5*.>)*4#5)*C)'C%#&>/-#(*
('-#./',D***A>)*&%)-/4/',*'<.#/,)$*@'%*.>)*EFG3<H
EFI3<*
%#./'?*.>)*EFJ3<H
EFI3<*%#./'*#,$*.>)*
EFK3<H
EFI3<*%#./'*
0#(")4*;#4*-',4/$)%#<(1*(';)%*.>#,*FDLM*
$)5',4.%#./,C*.>)*#&&(/-#</(/.1*'@*.>)*.)->,/N")*@'%*3<*
/4'.'&)*%#./'*4."$/)4D*A>)*%)4"(.4*4>';*.>#.*/.*/4*
&'44/<()*.'*$/4./,C"/4>*=#,94>),*4#5&()4*'%/C/,#./,C*
@%'5*$/@@)%),.*C)'C%#&>/-#(*#%)#4*"4/,C*3<*/4'.'&)*
%#./'*5)#4"%)5),.4D*O4*.>)*5)$/-/,#(*)@@)-./0),)44*'@*
#*A26*/4*>/C>(1*$)&),$#,.*',*.>)*4'"%-)*'@*'%/C/,*'@*
/.4*>)%<*-'5&',),.4?*/.*/4*"4)@"(*.'*>#0)*#*%)(/#<()?*
%'"./,)*5)#,4*'@*P@/,C)%&%/,./,CQ*.>)*-'5&',),.4*
C%';,*/,*$/@@)%),.*>#</.#.4D!
*
+%-:,*1=-$,%!!
!
H01-!.<65+-+0$6,!()+$#1#!H#5+/+$#1!I.(H1J!6<#!6!
@+K-'<#!0L!1#B#<6,!5+LL#<#$-!)#<?1!-)6-!'$5#<%0!1M#/+6,!
-<#6-@#$-!-0!@6N#!-)#@!'1#L',2!.)#!6@0'$-1!0L!-)#!
#LL#/-+B#!/0@M0$#$-1!+$!-)#!M,6$-1!6<#!+$L,'#$/#5!?&!-)#!
10+,3!O6-#<3!O#6-)#<!/0$5+-+0$1!#-/!+$!-)#!6<#6!O)#<#!-)#&!
6<#!%<0O$2!PKM#<+#$/#5!M<6/-+-+0$#<1!0L!-<65+-+0$6,!
()+$#1#!)#6,+$%!N$0O!-)6-!-)#!Q'6,+-&!0L!)#<?!@#5+/+$#1!+1!
1-<0$%,&!<#,6-#5!-0!-)#+<!10'</#!0L!0<+%+$2!R-!+1!-)#<#L0<#!
+@M0<-6$-!-0!N$0O!-)#!1M#/+L+/!,0/6-+0$!0L!6!.(H!)#<?!
/0@M0$#$-!10!#$1'<#!+-1!#LL#/-+B#$#112!
!
H6$&!-#/)$+Q'#1!)6B#!?##$!6MM,+#5!-0!/)6<6/-#<+S#!
B6<+0'1!)#<?!@#5+/+$#1!6$5!-0!/0<<#,6-#!-)#@!O+-)!-)#+<!
M,6/#!0L!0<+%+$2!9+%)!T#<L0<@6$/#!4+Q'+5!
()<0@6-0%<6M)&3!H611!>M#/-<0@#-<&3!U'/,#6<!H6%$#-+/!
V#10$6$/#3!R$L<6<#5!>M#/-<01/0M&!6$5!;W<6&!
X,'0<#1/#$/#!)6B#!6,,!?##$!'1#5!-0!M<05'/#!1M#/-<6!-)6-!
/6$!?#!'1#5!-0!YL+$%#<M<+$-Z!-)#!.(H!)6?+-6-2!!
!
4#65!+10-0M#!<6-+0!@#61'<#@#$-1!M<0B+5#!6$6,&-+/6,!
+$L0<@6-+0$!<#,6-+$%!-0!-)#!10'</#!0L!,#65!/0$-6@+$6-+0$!+$!
$6-'<6,,&!0//'<<+$%!16@M,#12!(0$/#$-<6-+0$!@#61'<#@#$-1!
/6$$0-!M<0B+5#!-)+1!+$L0<@6-+0$2!>-'5+#1!0L!-)#!+10-0M+/!
/0@M01+-+0$!0L!,#65!6<#!-)#<#L0<#!/0@@0$,&!'1#5!+$!
#$B+<0$@#$-6,!1/+#$/#!61!O#,,!61!%#0,0%+/6,!6$5!
6$-)<0M0,0%+/6,!1-'5+#12!*@0$%!6,,!-)#!$6-'<6,,&!0//'<<+$%!
,#65!+10-0M#13!0$,&![F\T?!+1!$0$W<65+0%#$+/3!O)#<#613!
[FDT?3!
[F]T?!6$5!
[F^T?!6<#!-)#!56'%)-#<!M<05'/-1!L<0@!-)#!
<65+06/-+B#!5#/6&!0L
!"#$%&'(&)*(("+"$,*#,*$-&.",/""$&)*(("+"$,&01#$,&%'2+3"%&'(&
'+*-*$4&&5(&3'2+%"6&1'3#1&1"#)&1"7"1%&!#8&."3'!"&!*9")&
/*,:&"9,"+$#1&%'2+3"%&'(&3'$,#!*$#,*'$&;"4-4,'!'.*1"&
"9:#2%,<&,:#,&7#+8&/*,:&,*!"&)"0"$)*$-&'$&,:"&
#$,:+'0'-"$*3,*7*,84&=:"%"&!*9*$-&0+'3"%%"%&3#$&."&
>2#$,*(*")&#%&1'$-&#%&"#3:&1"#)&%'2+3"&%:'/%&#&)*(("+"$,&
1"#)&*%','0"&#.2$)#$3"4&=:"&/'+?&)"%3+*.")&*$&,:*%&
#001*3#,*'$&$',"&/#%&2$)"+,#?"$&,'&*$7"%,*-#,"&*(&1"#)&
*%','0"&+#,*'%&3#$&."&2%")&,'&@(*$-"+0+*$,A&,:"&B#$C%:"$&
:"+.&-+'/$&*$&)*(("+"$,&:#.*,#,%4&D:*1"&*%','0"&+#,*'&
%,2)*"%&:#7"&,+#)*,*'$#118&.""$&2$)"+,#?"$&/*,:&#&
!21,*3'11"3,'+&!#%%&%0"3,+'!","+&%23:&#%&=:"+!#1&
E'$*F#,*'$&G#%%&H0"3,+'!",+8&;=EGH<6&,:"&,"3:$*>2"&*%&
+"1#,*7"18&%1'/&#$)&,:"&*$%,+2!"$,#,*'$&*%&"90"$%*7"4&&
=:"%"&"90"+*!"$,%&/"+"&3#++*")&2%*$-&>2#)+20'1"&
E$)23,*7"18&I'201")&J1#%!#&G#%%&H0"3,+'!",+8&;EIJC
GH<&,:#,&0+'7*)"%&#&(#%,6&3'$7"$*"$,&#$)&0+"3*%"&!",:')&
,'&)","+!*$"&*%','0"&+#,*'%4&&&
&
=:"&K-*1"$,&LMNN&H"+*"%&EIJCGH&*%&#$&"93"11"$,&,''1&('+&
+'2,*$"&*%','0"&+#,*'&!"#%2+"!"$,%4&E,&*%&"#%8&,'&'0"+#,"&
/*,:&*,%&(2118,'!#,")&'0,*!*F#,*'$&%8%,"!&;K2,'C,2$"&
(2$3,*'$<&#$)&*,%&2%"+C(+*"$)18&%'(,/#+"4&O"3#2%"&'(&,:"%"&
#)7#$,#-"%6&K-*1"$,&EIJCGH&%8%,"!%&:#7"&.""$&/*)"18&
2%")&('+&*%','0"&+#,*'&%,2)*"%&('+&"$7*+'$!"$,#1&
!'$*,'+*$-*3#,*'$%&#$)&$231"#+&+"%"#+3:&0+'P"3,%6&
"4-46&Q&*%','0"&+#,*'%&*$&:2!#$&2+*$"&RST6&*$&,:"&3''1*$-&
/#,"+&'(&$231"#+&01#$,%&",346&,:"&3"+,*(*")&7#12"%&'(&%'!"&
3"+,*(*")&+"("+"$3"&!#,"+*#1%&%23:&#%&+'3?&%#!01"%&RUT6&
.*'1'-*3#1&%#!01"%&RU6VT&.8&*%','0"&)*12,*'$4&E$&W$3*$#+&",&
#14X%&/'+?RV6MT6&#$&'1)"+&!')"1&K-*1"$,&EIJCGH&;YJCVMNN<&
/#%&2%")6&#$)&,:"&0"+('+!#$3"&/#%&#%&-'')&#%&,:"&!'+"&
"90"$%*7"&!21,*C3'11"3,'+&EIJCGH&#$)&)'2.1"&('32%*$-&
%"3,'+&(*"1)&EIJCGH&"%0"3*#118&('+&1'$-&,"+!&%,#.*1*,8&#$)&
*%','0"&)*12,*'$*3#,*'$%4
!"#$%&'$()*+,
-(.)%/'$()*)&0(,
K$&K-*1"$,&LMNN*&EIJCGH6&;K-*1"$,&="3:$'1'-*"%6&J#1'&
K1,'6&IK6&QHK<6&(*,,")&/*,:&#&JZK&!*3+'&(1'/&$".21*F"+&
;[NN&2\]!*$<&*$&%"1(C#%0*+#,*'$&!')"6&#&>2#+,F&%0+#8&
3:#!."+&#$)&#&'$"C0*"3"&>2#+,F&,'+3:&/#%&2%")&
,:+'2-:'2,&,:"&%,2)84&
&
K&G^CEE&!*3+'/#7"&%#!01"&)*-"%,*'$&%8%,"!&;H:#$-&Y#*&
_*$&^"&Z#3,'+86&I:*$#<&/#%&2%")&('+&%#!01"&)*-"%,*'$4&&
,
1$*2$().,
&
=:"&('11'/*$-&+"#-"$,%&/"+"&2%")&)2+*$-&,:"&3'2+%"&'(&,:"&
%,2)8`&
• HaGbc[&;d#,*'$#1&E$%,*,2,"&'(&H,#$)#+)%&e&="3:$'1'-86&QHK<&C&('+&!#%%&.*#%&3'++"3,*'$4&
• YO+6&YI16&YZ6&#$)&Yd5U6&;fa&-+#)"6&#(,"+&%2.C.'*1*$-&02+*(*3#,*'$<&C&('+&%#!01"&)*-"%,*'$&#$)&
)*12,*'$4&
• K$*'$&"93:#$-"&+"%*$&;B5DW_&[gc6&SNNCVNN&!"%:6&QHK<6&C&('+&%"0#+#,*$-&J.&(+'!&,:"&!#,+*9&*$&,:"&
%#!01"%4&
• Q1,+#&J2+"&D#,"+6&%2001*")&.8&G*11*Ch&/#,"+&%8%,"!&;[c4S&G5:!%<&&
&
3*'#+$,#%$#*%*)&0(,
&
B+8&%#!01"%&#$)&(*1,"+")&/#,"+&%#!01"%&/"+"&)*-"%,")&
2%*$-&#&Yd5U]YZ*)&!*9,2+"&*$&#&!*3+'/#7"&'7"$&,:"$&
:"#,")&,'&)+8$"%%&*$&#&(2!"&320.'#+)&,'&+"!'7"&,:"&YZ4&
[4N&!\&YO+&;N4Md<&/#%&2%")&,'&+")*%%'17"&,:"&+"%*)2"4&&
H#!01"%&/"+"&,:"$&0#%%")&,:+'2-:&#&B5DW_&[gc&
3'12!$&,'&+"!'7"&,:"&!#,+*94&=:"&J.&3'$,#*$*$-&"12#$,&
/#%&)+*")&#$)&)*12,")&/*,:&Ui&Yd5U4&E$&'+)"+&,''*)&
!"!'+8&"(("3,%&#$)&,'&?""0&,:"&EIJCGH&)","3,'+&/'+?*$-&
*$&021%"&3'2$,*$-&!')"&'$186&,:"&3'$3"$,+#,*'$%&/"+"&
3'$,+'11")&.",/""$&[&#$)&cN&2-]\4&
50,*!*F#,*'$&'(&,:"&EIJCGH&'0"+#,*'$&0#+#!","+%&
H*$3"&,:"&%#!01"&7'12!"%&3'11"3,")&#(,"+&,:"&3'12!$&
0+",+"#,!"$,&%,"0&/"+"&1*!*,")6&!'%,&'(&,:"!&/"+"&1"%%&
,:#$&[&!\6&,:"&K-*1"$,&JZK&!*3+'&(1'/&$".21*F"+&;[NN&2\&
,80"<&/#%&%"1"3,")&('+&%#!01"&*$,+')23,*'$4&H"1(C#%0*+#,*'$&
!')"&/#%&2%")&#$)&,:"&3#++*"+&-#%&(1'/&+#,"&/#%&
3'$,+'11")&,'&!#*$,#*$&,:"&%#!01"&*$,+')23,*'$&(1'/&+#,"&#,&
#.'2,&MN&2\]!*$4&&=:"&[&!\&%#!01"&/#%&%2((*3*"$,&('+&S&'+&
U&*$)*7*)2#1&!"#%2+"!"$,%&%'&,:#,&+"0"#,&#$#18%"%&3'21)&
."&2$)"+,#?"$&*$&3#%"&'(&"++'+&)2+*$-&,:"&)","+!*$#,*'$4&
&
E$%,+2!"$,&%"$%*,*7*,8&#$)&,:"&',:"+&0#+#!","+%6&%23:&#%&
'9*)"&1"7"1&#$)&)'2.18&3:#+-")&*'$%6&/"+"&'0,*!*F")&
#2,'!#,*3#118&2%*$-&,:"&K2,'=2$"&("#,2+"&'(&I:"!H,#,*'$&
'$&#&[N&00.&,2$*$-&%'12,*'$&3'$,#*$*$-&\*6&j6&I"6&=14&=:"&
3#++*"+&-#%&/#%&,:"$&%",&,'&N4V&\]!*$&,'&'.,#*$&#&%#!01"&
20,#?"&+#,"&'(&#.'2,&MN&2\]!*$4&Z*$#1186&,:"&!#?"C20&-#%&
/#%&#)P2%,")&,'&0+')23"&,:"&."%,&%"$%*,*7*,*"%&#$)&1'/"%,&
*$,"+("+"$3"%4&
&
E$%,+2!"$,&'0"+#,*$-&0#+#!","+%&#+"&-*7"$&*$&=#.1"&[4&

!"#$%&'(&&)*+,-.&/0%1"2345&6/47323/48&
&
+$"89"&*/47323/48:&
!
"#!$%&'()! ! ! *+,-!.!
"#!/0123456)!! ! ! *789!
:0;$<'!='$13)!! ! ! 8!;;!
>%(23?@)!! ! ! -!;;!
>%(23?9)!! ! ! -7A!;;!
B0((4'(!C0D)!! ! ! -7E!FG;45!
/0H'?I$!C0D)!! ! ! -7J!;FG;45!!
K'(4$I;$*)!! ! ! -7*!($D!
:$(0L!B30;M'(!>';$'(01I(')!! +7-!N'6B!
&
&
&
;"2"&<6=>38323/4&+"1"9%2%18:&
!OPD%1%$'!"014%!Q50<LD4DR!;%N'S!*---!D205GD'2S!;454;I;!
N&'<<!14;'!*--!ID7!>3'!451'6(014%5!14;'D!&'('!+-D'2!T%(!+-EKMS!*-D'2!T%(!
+-UKM!05N!
+-8KMS!,!D'2!T%(!
+-VKM7!W023!N010!
$%451!4D!13'!0X'(06'!%T!A!('$'1414%5D7!
!"#$%&#'!
Y'T%('!M'6455456!13'!050<LD4DS!13'!45D1(I;'51!&0D!0<<%&'N!
A-!;45I1'D!T%<<%&456!$<0D;0!465414%5!1%!('023!13'(;0<!
D10M4<41L7!!Q!+-$$M!D%<I14%5!%T!ZP:>!:"/!JV*!4D%1%$'!
(014%!D105N0(N!&0D!;'0DI('N!0T1'(!'X'(L!,!I5H5%&5D7!!
>34D!N010!$(%X4N'N!13'!8,--4!D3%(1?1'(;!05N!<%56?1'(;!
D10M4<41L!45T%(;014%5!05N!$(%X4N'N!0!;'05D!%T!;0H456!13'!
D;0<<!;0DD!M40D!2%(('214%5D!('[I4('N7!>3'!45D1(I;'51!
N';%5D1(01'N!'\2'<<'51!$('24D4%57!:''!>0M<'D!+!05N!A7!!
Z%1'!1301!13'!45D1(I;'51!2%5D4D1'51<L!N'<4X'('N!]":=^D!01!
<'DD!1305!-7*]!%X'(!13'!D3%(1!05N!<%56!1'(;7!
!"#$%&?:&.@/12,2%19&.2"#3$32A&/B&+#&)8/2/0%&C"23/&;%2%1934"23/48&/B&?D&00#&.C-EF'&>8345&2@%&<53$%42&GHDD3&)*+,-.&
I?D934J&H&9%"8>1%9%428K&
()%"'*+,"' -./012345' -./012.45' -./012645' -./012545' -./012745' !"#$%&'
()*'#+,-' ./0'1'2334' ./0'1'2334' ./0'1'2334' ./0'1'2334' ./0'1'2334' '
()*'567-' 89:;'<=' 89;3'<=' 89;;'<=' :933'<=' :93>'<=' '
23:?5@,+A' 3B34:2C' 3B34:2>' 3B34:2>' 3B34:2>' 3B34:2;' 3B3;''
23>?5@,+A' 3B2:48' 3B2:4:' 3B2:4:' 3B2:4;' 3B2:4>' 3B3;''
23C?5@,+A' 3B2244' 3B223D' 3B2231' 3B2231' 3B2231' 3B3;''
23D?5@,+A' 3B;288' 3B;28;' 3B;28;' 3B;288' 3B;282' 3B38''
23:?23>' 3B3;148' 3B3;13:' 3B3;13C' 3B3;13>' 3B3;D1C' 3B43''
23C?23>' 3B14>8' 3B14:>' 3B14:1' 3B14:>' 3B14::' 3B3D''
23D?23>' 2B4>1'' 2B4>D'' 2B4>1'' 2B4>C'' 2B4>;'' 3B3D''
!"#$%&L(&M/45,2%19&.2"#3$32A&I'D&@/>18K&/B&+#&)8/2/0%&C"23/&;%2%1934"23/48&/B&?D&00#&.C-EF'&>8345&2@%&<53$%42&GHDD3&
)*+,-.&
()%"'*+,"' 389'5+&"' 389':),"' 012;:<&+%' 01=;:<&+% 01>;:<&+% 01=;012' 01>;012'
<E23F(B#' ./0'1'2334' >94:'(=' 3B2:44'' 3B2231'' 3B;28;'' 3B14>2'' 2B4C4''
<E23FEB#' ./0'1'2334' >92>'(=' 3B2:42'' 3B2231'' 3B;28>'' 3B14;1'' 2B4C4''
<E23FGB#' ./0'1'2334' >988'(=' 3B2:42'' 3B2231'' 3B;28;'' 3B14;D'' 2B4C3''
<E23F#B#' ./0'1'2334' >9:3'(=' 3B2:44'' 3B2243'' 3B;28>'' 3B14>C'' 2B4C2''
<E23H4(B#' ./0'1'2334' C9;1'(=' 3B2:44'' 3B2244'' 3B;28>'' 3B14C2'' 2B4C2''
<IF232(B#' ./0'1'2334' 1942'(=' 3B2:43'' 3B2244'' 3B;28>'' 3B14C8'' 2B4C2''
<EH232EB#' ./0'1'2334' 194D'(=' 3B2:4:'' 3B2243'' 3B;28:'' 3B14;8'' 2B4>D''
<EF238(B#' ./0'1'2334' 4494C'(=' 3B2:48'' 3B2244'' 3B;288'' 3B14>4'' 2B4>D''
<EF23:(B#' ./0'1'2334' 429;2'<=' 3B2:42'' 3B2242'' 3B;288'' 3B14>D'' 2B4>1''
<EF23:EB#' ./0'1'2334' 429;1'<=' 3B2:43'' 3B224:'' 3B;28:'' 3B14D;'' 2B4C2''
<EH23;(B#' ./0'1'2334' 292C'<=' 3B2:42'' 3B2243'' 3B;28>'' 3B14>8'' 2B4C4''
<EH23;EB#' ./0'1'2334' 2982'<=' 3B2:4;'' 3B2243'' 3B;282'' 3B14;8'' 2B4>C''
!?5@AB' ' ' 1412'' 141='' 141C'' 14D1'' 141>''

!"#$#%&#''#()$*#+,')+$-*./$)"#$012!$3,4'5)6$4++,*4(&#$
+4/7'#$+,88#+)$)"4)$)"#$94)4$-*./$)"#$,(:(.;($+4/7'#+$5+$
4'+.$<#*6$*#'54='#$4(9$&4($=#$*#7.*)#9$;5)"$4$"58"$9#8*##$
.-$&.(-59#(&#>$$1($)"5+$+),96?$)"*##$)67#+$.-$+4/7'#+$;#*#$
/#4+,*#9@$
$
• A.,*$+4/7'#+$.-$+,*-4&#$;4)#*$)4:#($-*./$
95--#*#()$4*#4+$5($B".(8CD54(8?$25CE",4($
F*.<5(&#$
• 2.5'$+4/7'#+$&4/#$-*./$G*CH#5$H.,()45($IJK?$
B".(8CD54(8?$25CE",4($F*.<5(&#$ILK?$D54(8CM5$
F*.<5(&#$INK$
• O4($2"#($7'4()$+4/7'#+$;#*#$-*./$B".(8CD54(8?$
25CE",4($F*.<5(&#$IPK?$G*CH#5$H.,()45($IJK?$
Q#5CD5(8$INK?$D54(8CM5$F*.<5(&#$INK?$!45$
H.,()45(?$2"4(CO.(8$F*.<5(&#$INK?$2"4(8CR,.?$
2"4(CM5$F*.<5(&#$INK?$M5(CD54(8$F*.<5(&#$INK?$
S#C04($F*.<5(&#$INK$
$
T''$)"#$+4/7'#+$;#*#$)4:#($-*./$95--#*#()$4*#4+$#<#($
;5)"5($)"#$+4/#$7*.<5(&#>$!"#$/#4+,*#9$*#+,')+$4(9$)"#$
+)4(94*9$9#<54)5.(+$4*#$'5+)#9$5($!4='#$U$4C&>
!
"#$%&!'#(!)&*+%,*!-.!/$!0*-,-1&!)#,2-!3&#*+4&5&6,*!-.!7#68*9&6!/%#6,!:#51%&*!
!"#$%&'("#&')*+',-'.
)*/',-'01234567'
)*8',-'.
)*/',-'01234567'
9:"4;<=:',>?@:4A&' *B8C8D'0'*B***D' )B*+E'0'*B**)'
!F"4<GH?I'!F"4<=:',>?@:4A&' *B8D*)'0'*B**JC' )BJ**'0'*B**)'
K&:<9:4;' *B8/+C'0'*B**JE' )BJDE'0'*B**6'
!F"4'L?4;',>?@:4A&' *B8D+*'0'*B**J8' )BJ*+0'*B**)'
=:4<9:"4;',>?@:4A&' *B8CED'0'*B***+' )B*ED'0'*B**J'
M&<("4',>?@:4A&' *B8D+/'0'*B***+' )BJJD'0'*B**)'
N>O&:'O?H4P":4I'LJ' *B8C/+'0'*B***6' )B*E6'0'*B**J'
N>O&:'O?H4P":4I'L)' *B8C/E'0'*B***C' )B*ED'0'*B**C'
QF?4;<9:"4;I'LJ' *B8D)E'0'*B**))' )BJ*D'0'*B**C'
QF?4;<9:"4;I'L)' *B8D)C'0'*B**J)' )BJ*D'0'*B**)'
QF?4;<9:"4;I'L6' *B8D6+0'*B***6' )BJ*6'0'*B**)'
"#$%&!'$(!)&*+%,*!-.!/$!0*-,-1&!)#,2-!3&#*+4&5&6,*!-.!:-2%!:#51%&*!
!
!"#$%&'("#&')*+',-'.
)*/',-'01234567'
)*8',-'.
)*/',-'01234567'
9:"4;<=:',>?@:4A&' *B8C/'60'*B**J+' )B*E*'0'*B**J'
N>O&:'O?H4P":4I'RJ' *B8D)*'0'*B**J/' )BJ*J'0'*B**C'
N>O&:'O?H4P":4I'R)' *B8D)6'0'*B***+' )BJ*6'0'*B**J'
QF?4;<9:"4;I'RJ'' *B86ED'0'*B***+' )B*8C'0'*B**J'
QF?4;<9:"4;I'R)' *B8CJ+'0'*B***C' )B*8E'0'*B**J'
QF?4;<9:"4;I'R6' *B8CJJ'0'*B**JD' )B*8C'0'*B**)'
QF?4;<9:"4;I'RC' *B8C**'0'*B***+' )B*E*'0'*B**J'
QF?4;<9:"4;I'RD' *B86EJ'0'*B**JC' )B*86'0'*B**)'
"#$%&!';(!)&*+%,*!-.!/$!0*-,-1&!)#,2-!3&#*+4&5&6,*!-.!<#,&4!:#51%&*!
!
!"#$%&'("#&')*+',-'.
)*/',-'01234567'
)*8',-'.
)*/',-'01234567'
QF?4;<9:"4;I'SJ' *B8+*)'0'*B**JD' )BJC*'0'*B**6'
QF?4;<9:"4;I'S)' *B8+6D'0'*B***D' )BJ6+'0'*B**)'
QF?4;<9:"4;I'S6' *B8/+D'0'*B***)' )BJ6/'0'*B**)'
QF?4;<9:"4;I'SC' *B8/E6'0'*B**JC' )BJ68'0'*B**6'
!
!
!"#$%##"&'(
!
"#$%&!'()*+,!
'(-*+!.$/!
'(0*+!.1&!23&!/.4532&1!617/4%28!
917:!23&!1./#7.%2#;&!/&%.<!79!'=0>!.$/!
'=?>!.$/!
'='@3!
1&86&%2#;&A<,!23&!*+!#87276&!.+4$/.$%&!;.1#&8!#$!$.241&B!C$!
:782!79!23&!8.:6A&8,!23&!'(0*+D
'()*+!1.2#7!;.A4&8!.1&!
+&2E&&$!FBG?!.$/!'BF?,!23&!'(-*+D
'()*+!1.2#7!;.A4&8!.1&!
+&2E&&$!(B-0!.$/!(B0)!.$/!23&!'(H*+D
'()*+!1.2#7!;.A4&8!.1&!
+&2E&&$!(B(?!.$/!(B()IFJB!C$!71/&1!27!/#82#$54#83!+&2E&&$!
23&!/#99&1&$2!2<6&8!79!8.:6A&8!+<!23!A&./!#87276&!1.2#7,!
23&!:&.841&:&$2!61&%#8#7$!#8!&K21&:&A<!#:6712.$2,!+723!
7;&1!23&!83712!.$/!A7$5!2&1:B!@3&!L"M!!
!
!
;.A4&8!8374A/!+&!.2!:782!(B?N!#$!71/&1!27!:.O&!.!%A&.1!
/#99&1&$2#.2#7$!+&2E&&$!23&!8.:6A&8B!P8!#$/#%.2&/!#$!!
!
@.+A&!H.Q%,!23&!"M!;.A4&8!971!23&!/&2&1:#$.2#7$8!.1&!
%7$8#/&1.+A<!+&22&1!RA7E&1S!23.$!(B?N,!87!#2!#8!6788#+A&!27!
48&!A&./!#87276&!1.2#7!:&.841&:&$28!27!/#82#$54#83!
+&2E&&$!23&!/#99&1&$2!8.:6A&8B!
!
!
!
(
!" #$
!" #%
!" #&
!" '
!" ''
!" '!
!" '(
!" ')
!" '*
!" '+
!" '$
#" %)* #" %* #" %** #" %+ #" %+* #" %$
!#$,-. !#+,-
!#%,-.!#+,-
T#.$5QU#
V&QW.$
"3.$QM7$5
X&#QT#$5
U#$QT#.$5
/0 1234
567891 :4 ;89
<6;81=4
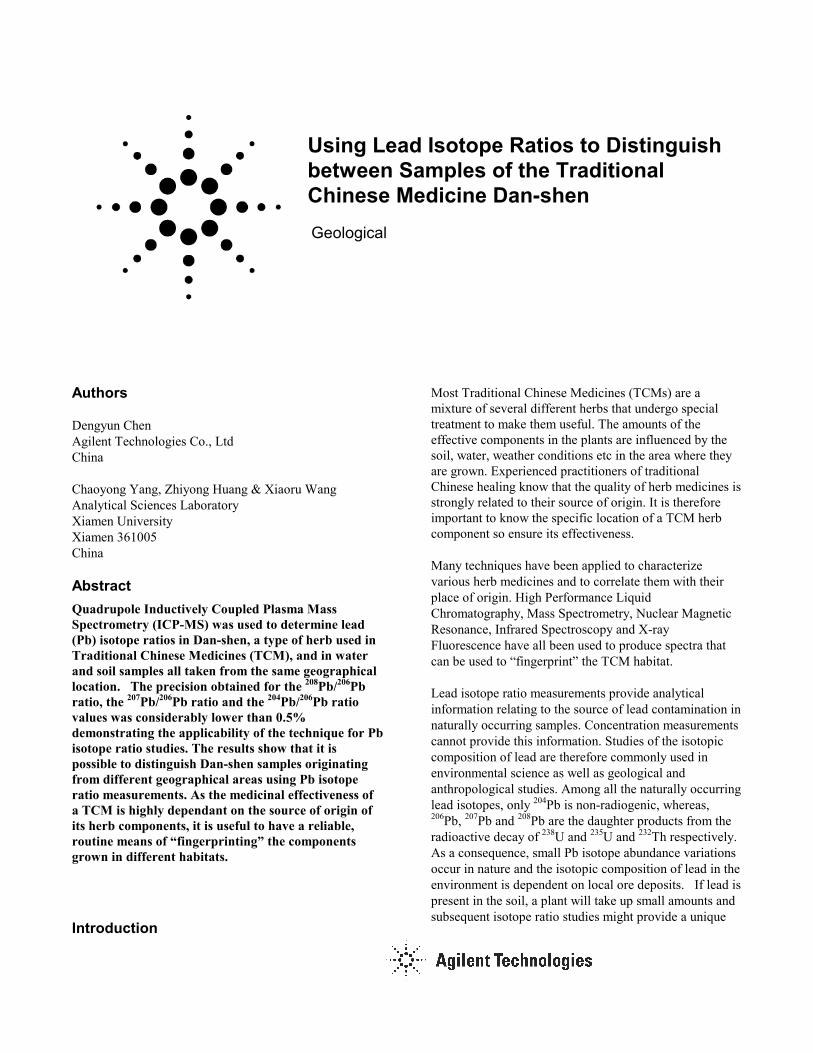
(!"#$%&'()''*+',-./.0&'12/".'3"-/%"+$/".4'.5'/6&'7&%+'8&9":"4&;'324<=6&4;'5%.>'3"55&%&4/'=.$%:&-'
!
P8!.!:&.$8!79!A77O#$5!971!;.1#.2#7$8D8#:#A.1#2#&8!#$!23&!
:&.841&:&$28,!23&!'(0*+D
'()*+!1.2#7!;.A4&8!E&1&!6A722&/!7$!
23&!<Q.K#8!;8!23&!'(-*+D
'()*+!1.2#7!;.A4&8!7$!23&!KQ.K#8B!!
Y#541&!F!#AA4821.2&8!23&!/.2.!917:!23&!.$.A<8&8!79!23&!M.$Q
83&$!6A.$2!.$/!837E8!;&1<!#$2&1&82#$5!1&84A28B!!Z+;#748A<,!
23&!*+!#87276&!1.2#7!;.A4&8!837E!23!7E$!86&%#.A!6.22&1$!
971!23&!M.$Q83&$!8.:6A&8!917:!/#99&1&$2!8741%&8B!Y71!
&K.:6A&,!M.$Q83&$!8.:6A&8!517E$!#$!23&![37$5QT#.$5!
.1&.!3.;&!8#:#A.1!*+!#87276&!1.2#7!;.A4&8,!.A237453!23&!
8.:6A&8!E&1&!2.O&$!917:!/#99&1&$2!8.:6A#$5!.1&.8B!\3&$!
%7:6.1&/!27!23&!*+!#87276&!;.A4&8!79!23&!M.$Q83&$!
8.:6A&8!917:!23&!]1Q^&#!^74$2.#$!1&5#7$!R23&!2E7!
8.:6A&8!.A87!3.;&!8#:#A.1!*+!#87276&!1.2#7!;.A4&8S,!23&!
/#99&1&$%&!#8!/#82#$%2B!C$!%7$%A48#7$,!#2!#8!6788#+A&!27!
/#82#$54#83!23&!M.$Q83&$!8.:6A&8!917:!/#99&1&$2!8741%&8B!!
!
!
!
!
!" #$
!" #$%
!" #&
!" #&%
!" '
!" '#%
!" ''
#" $() #" $($ #" $* #" $*! #" $** #" $*) #" $*$ #" $% #" $%! #" $%* #" $%)
!#+,-. !#),-
!#$,-.!#),-
/01234 56 7238 916 :
;< 4=>6 8 ?72490>2
;< 4=>6 8 916 :
/01234 56 7238 ?72490>2
!
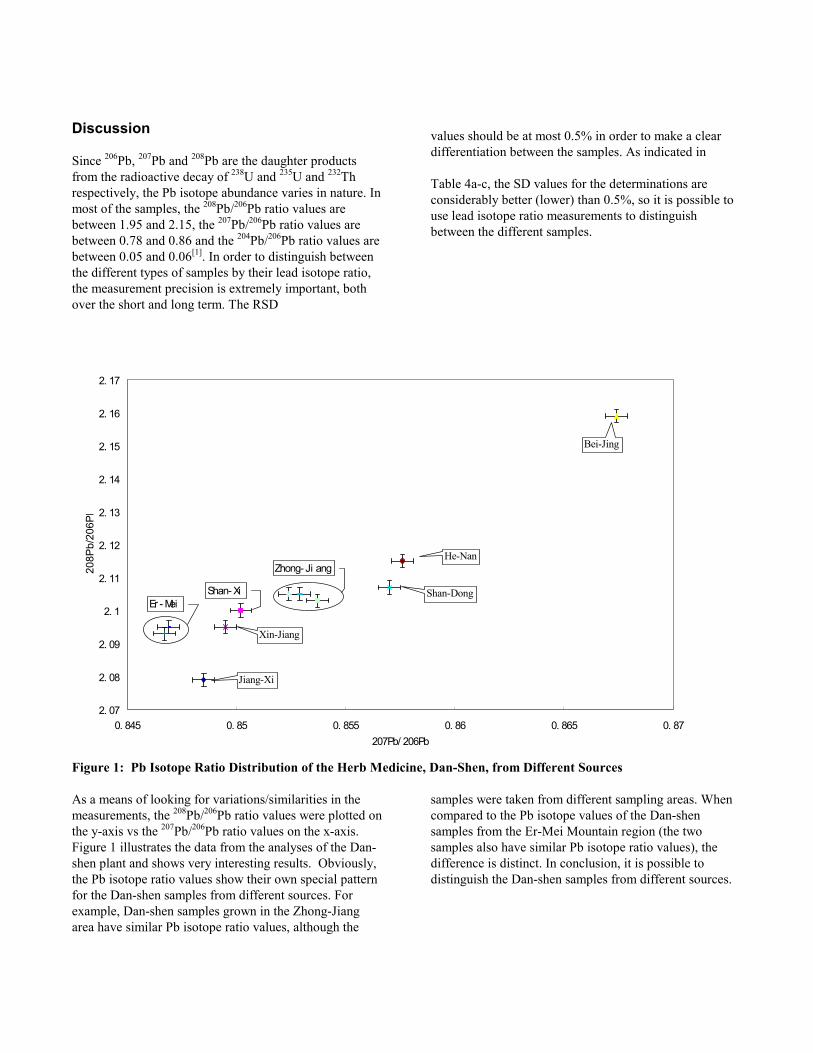
"#$%&'!()!!*+!,-./.0'!12/#.!3#-/&#+%/#.4!.5!6.#7!248!32496:'4!62;07'-!/2<'4!5&.;!3#55'&'4/!6.%&='-!
!
"#$%!&#$!'()*!'+,-*$'!./(,!0)..$/$%&!'(1/2$'!+/$!
2(%')0$/$03!)&!)'!.(1%0!&#+&!&#$!)'(&(-$!4+*1$'!(.!&#$!'()*!
'+,-*$'!./(,!0)..$/$%&!'(1/2$'!+*'(!#+4$!&#$)/!(5%!'-$2)+*!
-+&&$/%3!+'!'#(5%!)%!6)71/$89!:1&3!)%&$/$'&)%7*;3!&#$!
)'(&(-$!4+*1$'!(.!&#$!'()*'!+/$!0)..$/$%&!&(!&#$!<+%='#$%!
'+,-*$'!./(,!&#$!'+,$!-*+2$9!!>#)'!'177$'&'!&#+&!'()*!)'%?&!
&#$!(%*;!'(1/2$!(.!*$+0!5)&#)%!&#$!-*+%&9!!
!
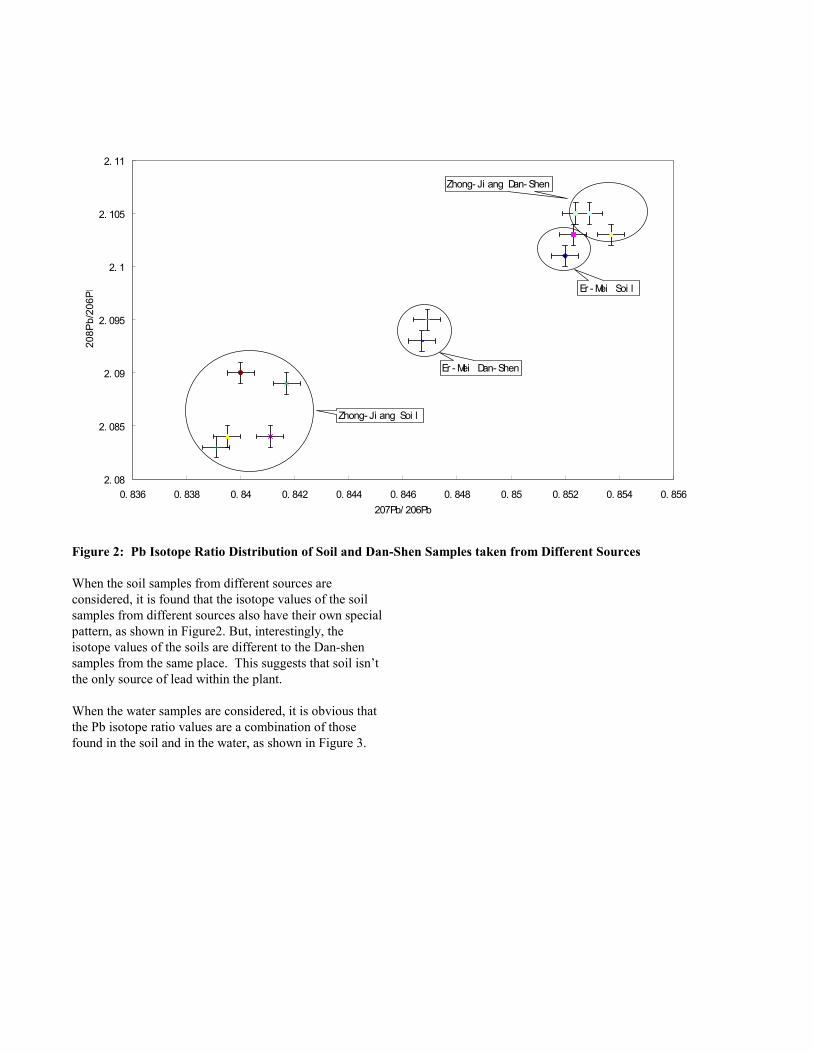
"#$%!&#$!5+&$/!'+,-*$'!+/$!2(%')0$/$03!)&!)'!(@4)(1'!&#+&!
&#$!A@!)'(&(-$!/+&)(!4+*1$'!+/$!+!2(,@)%+&)(%!(.!&#('$!
.(1%0!)%!&#$!'()*!+%0!)%!&#$!5+&$/3!+'!'#(5%!)%!6)71/$!B9!
!
!
!
!
!
!
!
!
!
!
!
!
!
!" #$
!" #%
!" #&
!" '
!" ''
!" '!
!" '(
!" ')
!" '*
#" %(* #" %) #" %)* #" %* #" %** #" %+ #" %+* #" %$ #" %$* #" %%
!#$,-. !#+,-
!#%,-.!#+,-
/01 2
3456 /785
94: 8;
!
"#$%&'!()!*+!,-./.0'!12/#.!3#-/&#+%/#.4!.5!/6'!7.#89!324:76'4!24;!<2/'&!72=08'-!>2?'4!5&.=!-#=#82&!72=08#4$!@&'2!
AB6.4$:C#24$9!7#:D6%24!*&.E#4F'G!
!
!"#$%&'("#')
!"#$%&'(#)*$+,%$-'./0$1(02$)#34('5#/$'6$7$&008$."0'.#$
10/$'60*09#$/7*'0$7)7(:6'6$6').#$'*$"76$;#/:$&008$
)#34('57*'0)$#11'.'#).:$7)8$6*73'('*:<$#69#.'7((:$2"#)$*"#$
67-9(#$7-04)*$'6$6-7((=$>#(1?769'/7*'0)$-08#$7;0'86$6-7(($
7-04)*6$01$94(67*'0)$1/0-$*"#$9#/'6*7(*'.$94-9$*"7*$.04(8$
711#.*$*"#$9/#.'6'0)$01$*"#$'60*09#$/7*'0$7)7(:6'6=$
$
%6$*"'6$87*7$64&*6<$*"#$%&'(#)*$@ABB$>#/'#6$CD+?E>$'6$
2#(($64'*#8$10/$/04*')#$'60*09#$/7*'0$7)7(:6'6=$$,4/*"#/$
'-9/0;#-#)*6$')$9/#.'6'0)$-7:$3#$03*7')#8$3:$-08'1:')&$
*"#$-#*"08$46#8$')$*"'6$6*48:$6('&"*(:=$$,0/$')6*7).#<$!($
-7:$3#$788#8$*0$*"#$67-9(#6$76$7)$')*#/)7($6*7)87/8$10/$
(#78$'60*09#$/7*'0$7)7(:6'6FAG=$C)$788'*'0)<$09*'-'57*'0)$01$
*"#$8#78?*'-#$.0//#.*'0)<$*"#$6*7)8?3:$-766$6#(#.*'0)<$-7:$
7(60$'-9/0;#$*"#$9#/10/-7).#$01$%&'(#)*$@ABB$CD+?E>$60$
*"7*$*"#$*"#0/#*'.7($-')'-4-$HI>J$01$B=BK$.7)$3#$
03*7')#8=$,4*4/#$20/L$7*$M'7-#)$N)';#/6'*:$2'(($(00L$')$
*0$*"#6#$90*#)*'7($'-9/0;#-#)*6=$
$
!"'6$9/#('-')7/:$/#6#7/."$')8'.7*#6$*"7*$'*$'6$9066'3(#$*0$
8'6*')&4'6"$J7)?6"#)$67-9(#6$1/0-$8'11#/#)*$7/#76$46')&$
+3$'60*09#$/7*'0$-#764/#-#)*6=$D0)*')4')&$*"#6#$6*48'#6$
3:$/4))')&$-0/#$*:9#6$01$67-9(#6$2'(($7((02$7$(7/&#$
87*7376#$*0$3#$6#*?49<$7)8$7$."#-0-#*/'.$-08#($*0$3#$
34'(*$*0$9/0;'8#$7$.0);#)'#)*$27:$*0$8'6*')&4'6"$"#/3$
-#8'.')#6$1/0-$8'11#/#)*$604/.#6= *+,+-+#$+')
O$ P'.5'7)$E<$Q765*'*:$%<$R7/)#6$IE<$S=$%)7(=$%*=$
>9#.*/0-=<$OTTBUAV<$WTK?KBB$
W$ J0)$+0**#/<$X(#))$D7/#:<$%&'(#)*$!#.")0(0&'#6<$
%99('.7*'0)$Y0*#$WWZ?KO@$
K$ [7)&$D"70:0)&<$J'66#/*7*'0)$10/$E76*#/$01$>.'#).#<$
M'7-#)$N)';#/6'*:<$WBBO$
\$ ]).')7/$SI<$%(0)60$SCX<$>7)5?E#8#($%<$E7')$><$
!4/)#/$+S<$S=$%)7(=$%*=$>9#.*/0-=<$WBBOUO^V<$KWW?KW^$
A$ ]).')7/$SI<$%(0)60$SCX<$>7)5?E#8#($%<$E7')$><$
!4/)#/$+S<$S=$%)7(=$%*=$>9#.*/0-=<$WBBOUO^V<$KOA?KWO
$
$
$

!
!
!
!
!
!
!
!
!
!
!
!
!
!
!
!
!
!
!
!
!
!
!
!
!
!
!
!
!
!
!
!
!"#$%&'()$"*+,-./%)0()$".+'",+.0-/)#)/'()$".+)"+
(1).+0234)/'()$"+'%-+.235-/(+($+/1'"6-+7)(1$2(+
"$()/-8+
9).)(+$2%+7-3.)(-+'(+
1((0:;7778'6)4-"(8/$&;/1-&;)/0&.+
++
<$0=%)61(+>+?@@?+
A6)4-"(+B-/1"$4$6)-.*+!"/8+
C%)"(-,+@D;?@@?+
C234)/'()$"+"2&3-%:+EFGGHDIE@+

AuthorRaimund Wahlen LGC Limited, Queens Road, Teddington, Middlesex, TW11 0LY, United Kingdom
Abstract
A high performance liquid chromatography-inductivelycoupled plasma mass spectrometry method was devel-oped for the fast and accurate analysis of arsenobetainein fish samples extracted by accelerated solvent extrac-tion. The combined extraction and analysis approach wasvalidated using certified reference materials for arseno-betaine in fish and during a European intercomparisonexercise with a blind sample. Up to six species of arseniccan be separated and quantified in the extracts within a10-minisocratic elution. The method was optimized so asto minimize time-consuming sample preparation stepsand to allow for automated extraction and analysis oflarge sample batches. A comparison of standard additionand external calibration showed no significant differencein the results obtained, which indicates that the liquid chromatography-inductively coupled plasma mass spectrometry method is not influenced by severe matrixeffects. The extraction procedure could process up to 24 samples in an automated manner while the robustnessof the developed high performance liquid chromatography-inductively coupled plasma mass spectrometry approachis highlighted by the capability to run more than 50 injec-tions per sequence which equates to a total run-time ofmore than 12 hours. The method can therefore be used torapidly and accurately assess the proportion of nontoxicarsenobetaine in fish samples with high total arsenic content during toxicological screening studies.
Fast and Accurate Determination ofArsenobetaine (AsB) in Fish Tissues UsingHPLC-ICP-MSApplication
Introduction
The element Arsenic (As) has long been thought ofas poisonous and highly toxic. However, it hassince been shown that the toxicity of As is largely dependent on the form or “species” the arsenic isin. Arsenic is ubiquitous in the environment due tonatural and anthropogenic sources, and the rela-tive contribution of these factors is estimated asroughly 60% and 40% respectively. In the environ-ment, As behaves in similar ways to the Group Velements nitrogen (N) and phosphorus (P). As aresult of these similarities, arsenic gets taken intothe biochemical pathways of N and P. This resultsin the formation of compounds such as arsenobe-taine (AsB) in fish and arseno-sugars, which arefound in marine algae. The toxicity of the inorganicAs-species (such as arsenite, As(III) and arsenate,As(V)) is far greater than the organic forms, suchas monomethylarsonic and dimethylarsinic acid(MMAA and DMA) and AsB. The InternationalAgency for Research on Cancer (IARC) has classi-fied inorganic arsenic as a human carcinogen,whereas AsB, the predominant form of As in mostmarine organisms [1], is considered nontoxic tohumans. Although AsB is the major form of As inmany marine organisms, it is not present in all fishspecies [2]; therefore, an evaluation of the propor-tion of AsB to the total As determined can give auseful and rapid estimate of the toxicological sig-nificance of a sample. In order to determine thetoxicity of seafood, the determination of the totalAs alone is of limited value, and the differentspecies of As have to be extracted, separated, anddetermined. Fast, reliable, and practical methodsare therefore required that can provide speciationinformation for the screening of large samplebatches.
Foods
2
Aims and Objectives
The aim of this study was to develop a semi-automated analytical method for the extractionand determination of As-species in fish tissues.Requirements for high sample throughput analysiswere the automation of the extraction procedure aswell as a fully automated separation and detectionmethod capable of analyzing large sample batches(up to 50 injections per run) during overnight runs.In order to streamline the analytical procedure, anattempt was made to develop a method with a min-imal number of sample preparation steps. It wasintended that the method should be establishedusing calibration by external calibration curves,rather than the lengthy alternative of standardadditions. The use of an isocratic liquid chromatog-raphy (LC) elution can be favorable in terms oftime-efficiency during the liquid chromatography-inductively coupled plasma mass spectrometry(LC-ICP-MS) analysis because it negates the needfor column re-equilibration between injections.
Calibration Standards
The following standards were obtained from Fluka(Sigma-Aldrich, Gillingham, UK): di-sodium hydro-gen arsenate heptahydrate (AsHNa2O4.7H2O) !98.5%, sodium (meta)arsenite (AsNaO2) !99.0%,and cacodylic acid (dimethylarsinic acid, DMA,C2H2AsO2) !99.0%; monomethylarsonic acid disodium salt (MMAA, CH3AsNa2O3) >98% wasobtained from Argus Chemicals (Vernio, Italy).Arsenobetaine (AsB, C5H11AsO2) was obtained fromBCR (Brussels, Belgium) as a solution of AsB inwater at 1031 ±6 (95% C.I.) mg/kg (BCR 626).
Extraction
Accelerated solvent extraction (ASE) has beenused previously for As-speciation [3, 4] and waschosen as the sample preparation method becauseit allows for the automated extraction and onlinefiltration of up to 24 samples. In addition, theextraction solution is collected in glass vials, whichnegates further sample preparation steps such asfiltration or centrifuging.
The samples were extracted using a Dionex ASE200 accelerated solvent extractor. Sample sizesfrom 0.1–0.3 g were weighed accurately into 11-mLstainless steel extraction cells fitted with filterpapers and PTFE liners. The extraction programwas set up as shown in Table 1.
HPLC-ICP-MS Methodology
The HPLC-ICP-MS instrumentation consisted of anAgilent Technologies 1100 HPLC system coupled toan Agilent Technologies 7500i ICP-MS fitted with asecond roughing pump, which enhances sensitivityby increasing ion transmission across the inter-face. The HPLC system comprised a quaternarypump module, a vacuum degasser, a temperaturecontrolled autosampler, and column compartment.The ICP-MS instrument was tuned for sensitivity,reduced oxides, and doubly charged species priorto connection to the liquid chromatograph by per-forming a standard instrument tune using a 10 ng/g solution of Li, Y, Ce, and Th in 1% HNO3.The pulse to analog (P/A) factor was adjusted on adaily basis using a solution containing ~50 ng/g Li,Mg, Mn, Cu, As, Gd, Y, Cd, Pb, and Ba. After thisoptimization, a 50 ng/g solution of As in 1% HNO3
was used to specifically optimize the sensitivity forarsenic. The ICP-MS nebulizer was then connectedto the HPLC-column using a length of PEEK tubing(yellow, 1/16-inch od, 0.007-inch id). See Table 2for the ICP-MS conditions used.
Table 1. Extraction Conditions Used for ASE
Instrument Dionex ASE 200
Preheat 2 min
Heat 5 min
Extraction steps 5 ! 2 min
Temperature 100 °C
Pressure 1500 psi
Solvent Methanol
RF Power 1430–1550 W
RF Matching 1.89–1.92 V
Sampling depth 4.0–4.8 mm
Carrier gas flow 0.89–0.93 L/ min
Make up gas flow 0.10–0.14 L/ min
Optional gas Oxygen at 5%
Spray-chamber 0 °Ctemperature
Cones Platinum
Isotopes monitored 75As103Rh77Se (40Ar37Cl) to monitor Cl interferences53Cr (40Ar13C) to monitor C interferences
Other parameters Injector diameter: 2.4 mm Nebulizer 100 µL/min PFA, Two interface pumps used
Table 2. ICP-MS Conditions Used for HPLC-ICP-MS Determination of As-Species

3
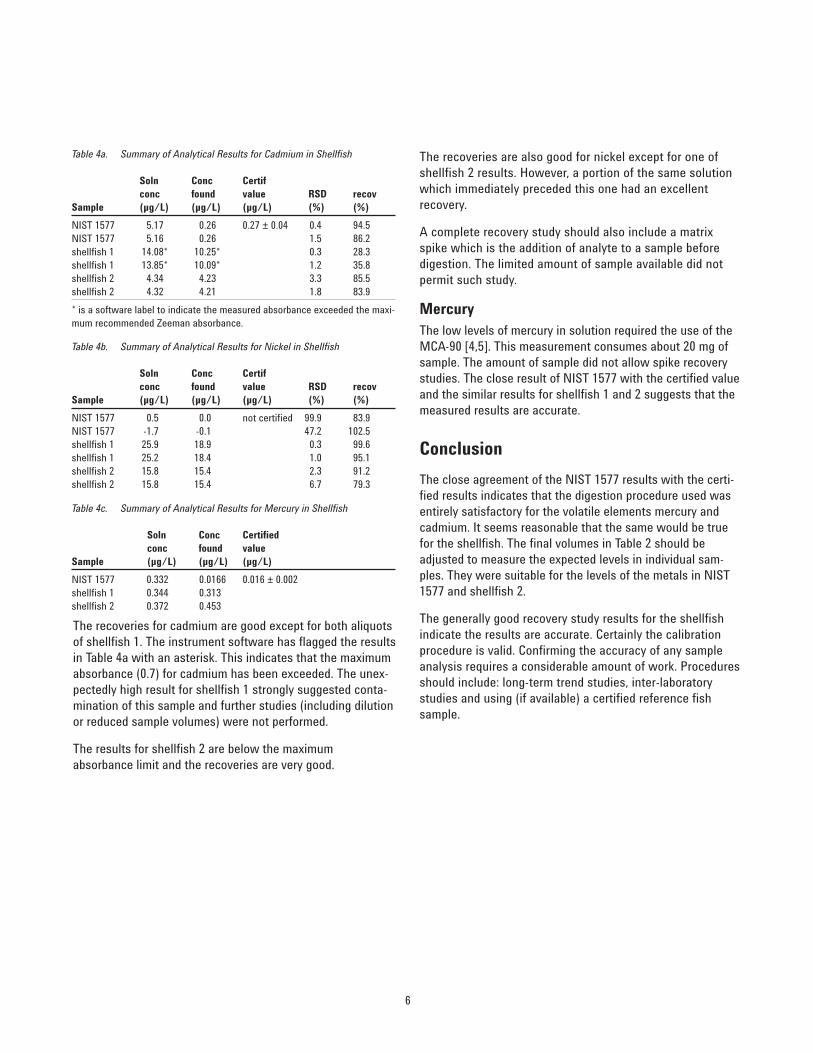
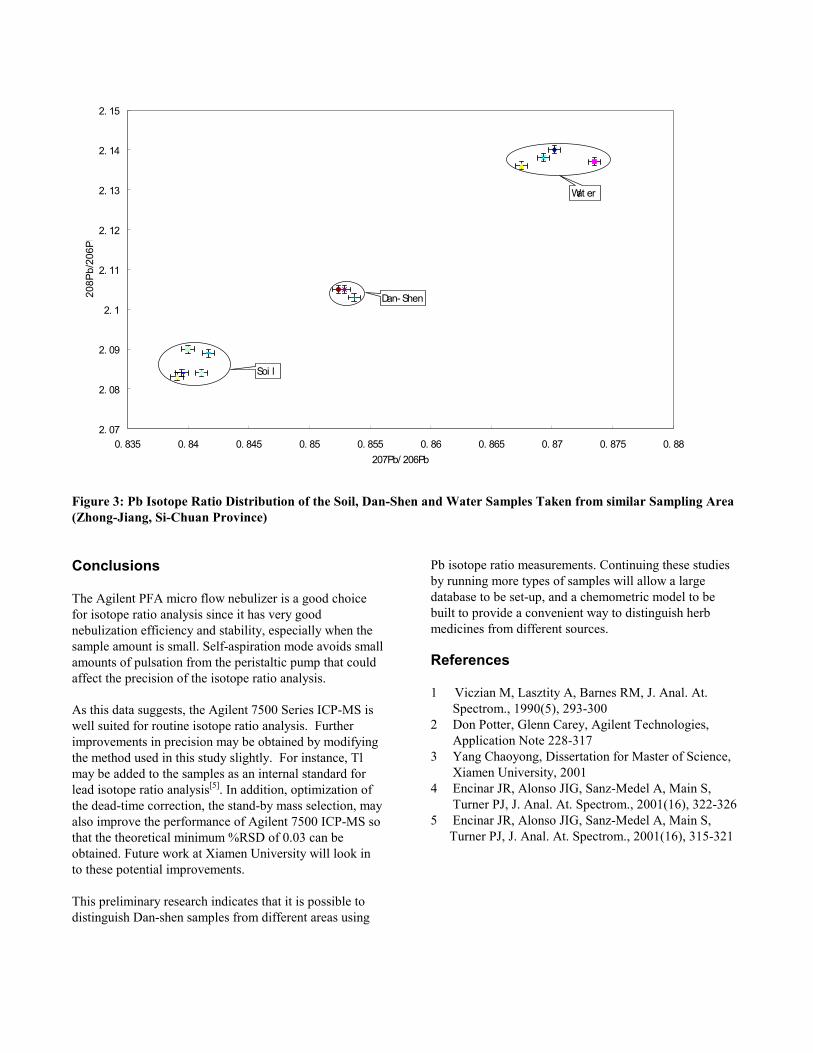
In order to develop a rapid chromatographic sepa-ration of the main As-species in fish tissues, ananion exchange column (Hamilton PRP X-100) waschosen in combination with an isocratic elutionprofile. Several mobile phases were tested and thebest separation of AsB and As(III) as well as DMAand MMAA was achieved within 10 min using 2.2-mM NH4HCO3/2.5-mM tartaric acid at pH 8.2delivered at 1 mL/min isocratic flow. This evalua-tion was carried out initially using matrix-free cali-bration standards containing the species of interestand refined using an oyster tissue extract that con-tained arsenocholine (AsC), two arsenosugars (As-sug. B and As-sug. D), TMAs+ and severalunknown species in addition [5]. The injectionvolume for samples and standards was 50 µL.
In order to enhance the ionization of the As-species[6, 7], methanol was added to the mobile phase atconcentrations ranging from 0.5% to 5% v/v. Atconcentrations above 1%, the chromatographic separation degraded significantly to the degreethat base-line resolution between AsB and As(III)was no longer achieved. However, the addition of1% MeOH to the mobile phase resulted in a signifi-cant improvement in the sensitivity (3–4-foldincrease in peak height) for all analytes. A chro-matogram for a 5-ng/g mixed calibration standardwith the final chromatography conditions is shownin Figure 1.
Variations in Signal Response for Different As-Species
The chromatogram shows that the four speciesanalyzed here have very different response factorswith this method, even when made up to containthe same concentration of As in solution. This isfurther illustrated by the calibration curves andtheir respective slopes, as shown in Figure 2. Suchdifferences in the analyte signal intensity werereported previously in the literature [7] andappear to be due to a combination of the ICP-MShardware used and the plasma conditions, whichare in turn affected by the mobile phase composi-tion. This points to possible differences in the neb-ulization, transport and/or ionization of differentspecies by such methods. In order to determinewhether this effect could be attributed to the cou-pling of the ICP-MS with a liquid chromatograph,aqueous standards of AsB and As(III) were madeup to equivalent concentrations as As and ana-lyzed by direct aspiration without chromatogra-phy. This indicated that the signal response of AsBwas ~10%–15% higher compared to the inorganicAs standard and, therefore, the difference in signalresponse does not appear to be related to the coupling with a liquid chromatograph.
Figure 1. Chromatography A: 2.2-mM NH4HCO3 2.5-mM tartaric acid, 1% MeOH, pH 8.2, Hamilton PRP X-100 column. Concentration of standard ~ 5 ng/g as As.
2.00 4.00 6.00 8.00 10.00 12.00 14.000
2000
4000
6000
8000
10000
12000
14000
Time (min)
Abu
ndan
ce (c
ount
s)
AsB
As(III)DMA
MMAA

4
AsBy = 51320x
DMAy = 42505x
MMAAy = 28061xR2 = 1
R2 = 1
As(III)y = 20235xR2 = 0.9965
R2 = 0.9996
0
500000
1000000
1500000
2000000
2500000
3000000
0 10 20 30 40 50 60
ng/g As
Peak
are
a
Figure 2. Calibration curves for AsB, DMA, MMAA and As(III) over a range of 0–50 ng/g as As.
In order to increase the signal intensity for speciessuch as As(III) and MMAA by the approachdescribed here, additional MeOH was added via aT-piece post-column so as not to impact on thechromatographic resolution. Although the relativevolume of MeOH could be increased by 50%–70% inthis way without deteriorating plasma stability, therelative signal responses of the four species werenot influenced significantly. Because the relativesignal response was stable on a day-to-day basis,no further attempts were made to equalize thesignal responses.
The instrumental detection limit for AsB by thismethod was 0.04 ng/g as As. The linearity obtained,as indicated by the correlation coefficient of thecalibration line, was 0.999–1.000 over a calibrationrange of 0–700 ng/g as As.
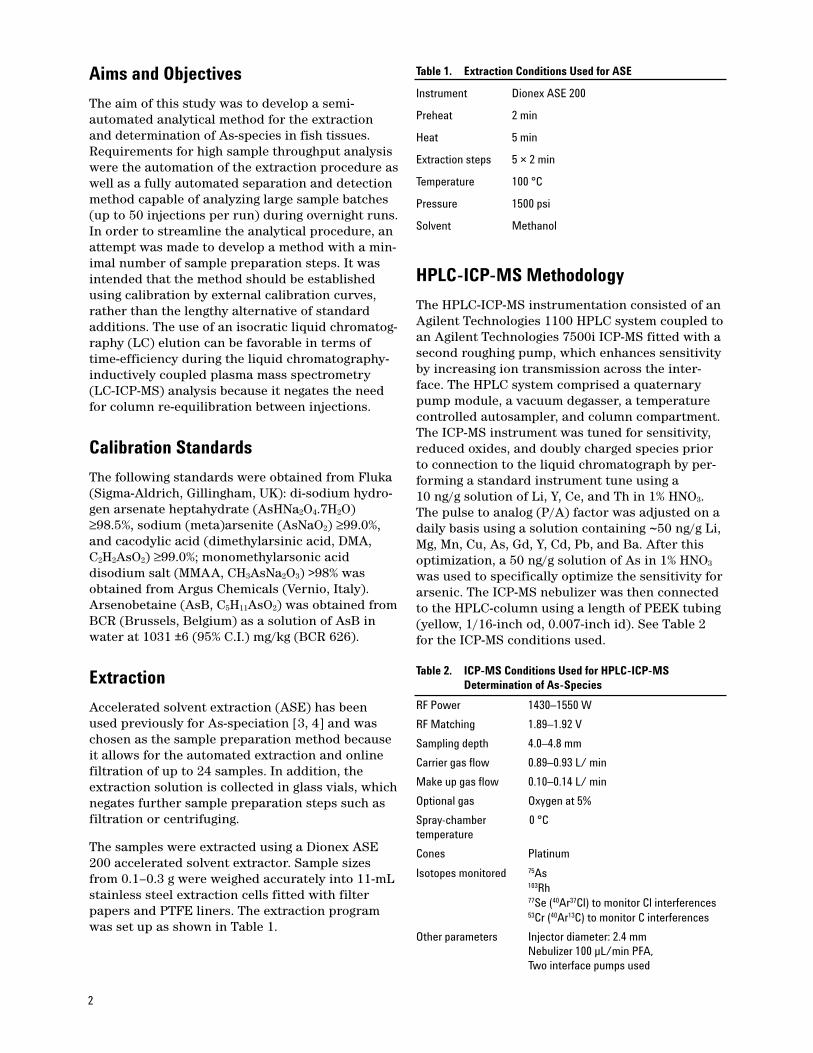
Plasma Disturbance Due to Elution ofMeOH
During the analysis of fish samples, which hadbeen extracted under the ASE conditions high-lighted in Table 1, a disturbance of the plasma wasobserved between ~2.3 to 4.3 min after injection.This affected all of the isotopes monitored and theeffect on 75As and 103Rh is highlighted in Figure 3.As can be seen from the chromatogram, the effecton these two isotopes is nonlinear. The 103Rh signaldecreases significantly during this time, whereasthe ‘shoulder’ on the tailing side of the AsB peakindicates an increase in the 75As signal.
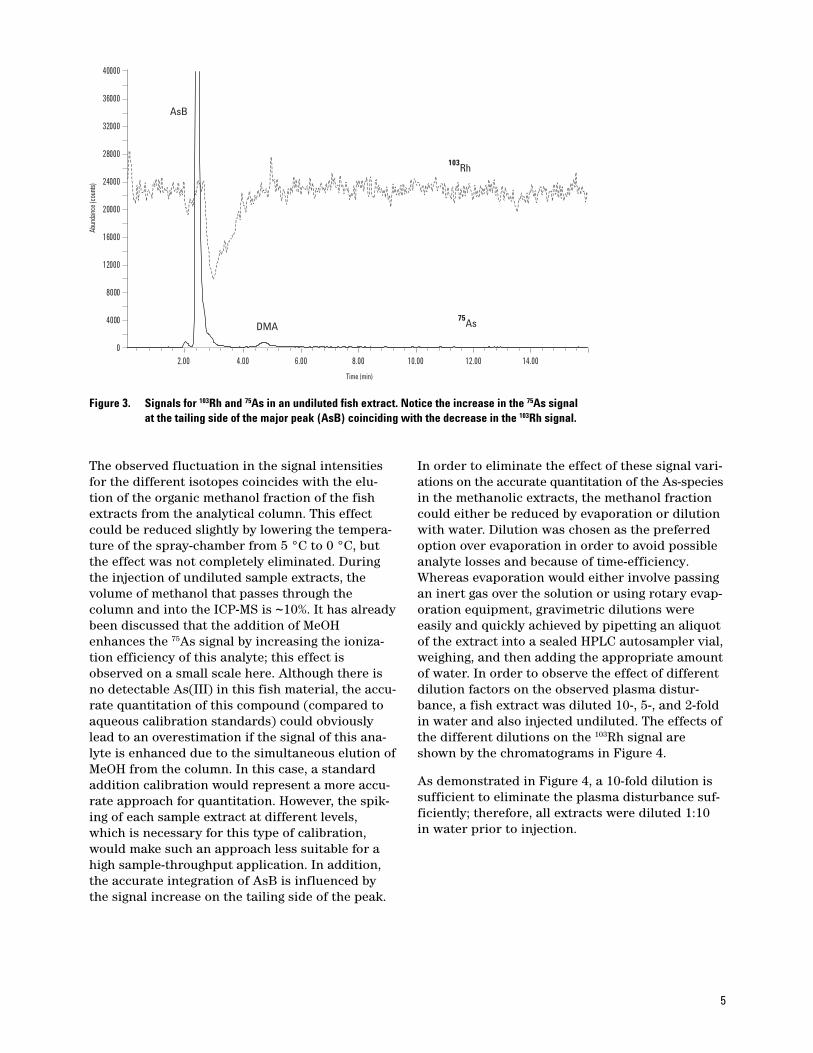
5
Figure 3. Signals for 103Rh and 75As in an undiluted fish extract. Notice the increase in the 75As signal at the tailing side of the major peak (AsB) coinciding with the decrease in the 103Rh signal.
2.00 4.00 6.00 8.00 10.00 12.00 14.000
4000
8000
12000
16000
20000
24000
28000
32000
36000
40000
Time (min)
Abun
danc
e (co
unts)
75As
103Rh
AsB
DMA
The observed fluctuation in the signal intensitiesfor the different isotopes coincides with the elu-tion of the organic methanol fraction of the fishextracts from the analytical column. This effectcould be reduced slightly by lowering the tempera-ture of the spray-chamber from 5 °C to 0 °C, butthe effect was not completely eliminated. Duringthe injection of undiluted sample extracts, thevolume of methanol that passes through thecolumn and into the ICP-MS is ~10%. It has alreadybeen discussed that the addition of MeOHenhances the 75As signal by increasing the ioniza-tion efficiency of this analyte; this effect isobserved on a small scale here. Although there isno detectable As(III) in this fish material, the accu-rate quantitation of this compound (compared toaqueous calibration standards) could obviouslylead to an overestimation if the signal of this ana-lyte is enhanced due to the simultaneous elution ofMeOH from the column. In this case, a standardaddition calibration would represent a more accu-rate approach for quantitation. However, the spik-ing of each sample extract at different levels,which is necessary for this type of calibration,would make such an approach less suitable for ahigh sample-throughput application. In addition,the accurate integration of AsB is influenced bythe signal increase on the tailing side of the peak.
In order to eliminate the effect of these signal vari-ations on the accurate quantitation of the As-speciesin the methanolic extracts, the methanol fractioncould either be reduced by evaporation or dilutionwith water. Dilution was chosen as the preferredoption over evaporation in order to avoid possibleanalyte losses and because of time-efficiency.Whereas evaporation would either involve passingan inert gas over the solution or using rotary evap-oration equipment, gravimetric dilutions wereeasily and quickly achieved by pipetting an aliquotof the extract into a sealed HPLC autosampler vial,weighing, and then adding the appropriate amountof water. In order to observe the effect of differentdilution factors on the observed plasma distur-bance, a fish extract was diluted 10-, 5-, and 2-foldin water and also injected undiluted. The effects ofthe different dilutions on the 103Rh signal areshown by the chromatograms in Figure 4.
As demonstrated in Figure 4, a 10-fold dilution issufficient to eliminate the plasma disturbance suf-ficiently; therefore, all extracts were diluted 1:10in water prior to injection.
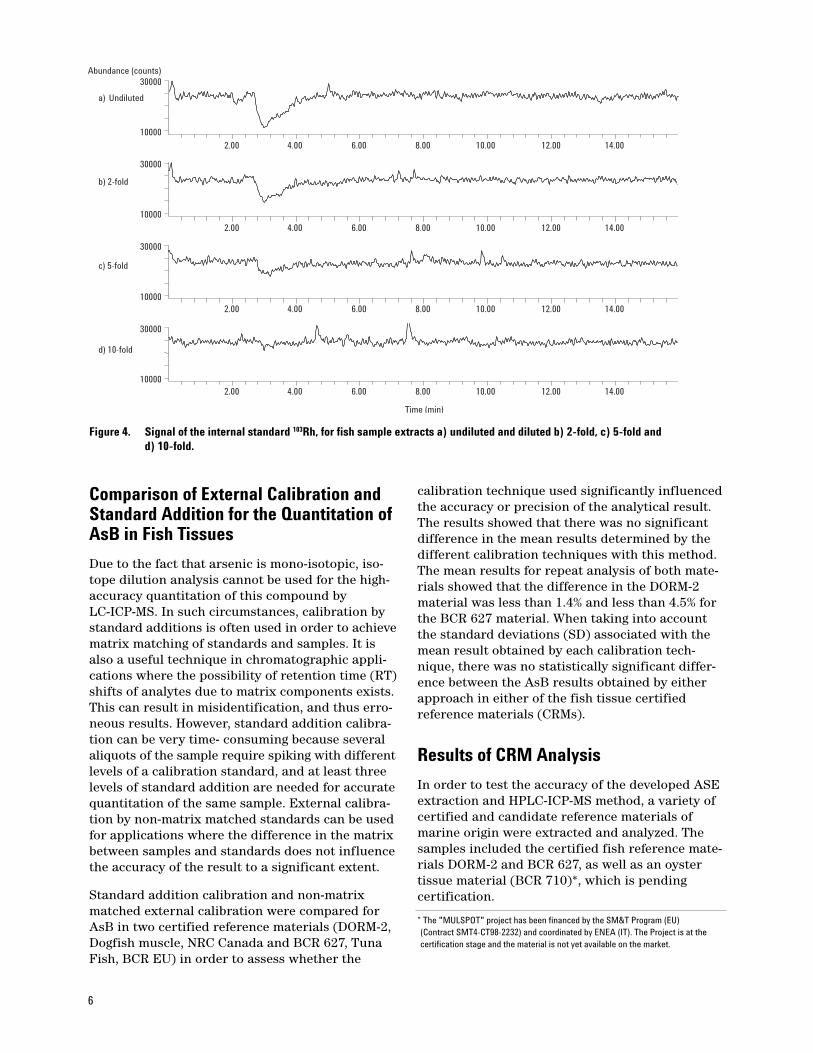
6
Abundance (counts)
10000
30000
10000
30000
10000
30000
Time (min)
2.00 4.00 6.00 8.00 10.00 12.00 14.00
2.00 4.00 6.00 8.00 10.00 12.00 14.00
2.00 4.00 6.00 8.00 10.00 12.00 14.00
2.00 4.00 6.00 8.00 10.00 12.00 14.00
10000
30000
a) Undiluted
d) 10-fold
c) 5-fold
b) 2-fold
Figure 4. Signal of the internal standard 103Rh, for fish sample extracts a) undiluted and diluted b) 2-fold, c) 5-fold and d) 10-fold.
Comparison of External Calibration andStandard Addition for the Quantitation ofAsB in Fish Tissues
Due to the fact that arsenic is mono-isotopic, iso-tope dilution analysis cannot be used for the high-accuracy quantitation of this compound byLC-ICP-MS. In such circumstances, calibration bystandard additions is often used in order to achievematrix matching of standards and samples. It isalso a useful technique in chromatographic appli-cations where the possibility of retention time (RT)shifts of analytes due to matrix components exists.This can result in misidentification, and thus erro-neous results. However, standard addition calibra-tion can be very time- consuming because severalaliquots of the sample require spiking with differentlevels of a calibration standard, and at least threelevels of standard addition are needed for accuratequantitation of the same sample. External calibra-tion by non-matrix matched standards can be usedfor applications where the difference in the matrixbetween samples and standards does not influencethe accuracy of the result to a significant extent.
Standard addition calibration and non-matrixmatched external calibration were compared forAsB in two certified reference materials (DORM-2,Dogfish muscle, NRC Canada and BCR 627, TunaFish, BCR EU) in order to assess whether the
calibration technique used significantly influencedthe accuracy or precision of the analytical result.The results showed that there was no significantdifference in the mean results determined by thedifferent calibration techniques with this method.The mean results for repeat analysis of both mate-rials showed that the difference in the DORM-2material was less than 1.4% and less than 4.5% forthe BCR 627 material. When taking into accountthe standard deviations (SD) associated with themean result obtained by each calibration tech-nique, there was no statistically significant differ-ence between the AsB results obtained by eitherapproach in either of the fish tissue certified reference materials (CRMs).
Results of CRM Analysis
In order to test the accuracy of the developed ASEextraction and HPLC-ICP-MS method, a variety ofcertified and candidate reference materials ofmarine origin were extracted and analyzed. Thesamples included the certified fish reference mate-rials DORM-2 and BCR 627, as well as an oystertissue material (BCR 710)*, which is pending certification.
* The "MULSPOT" project has been financed by the SM&T Program (EU) (Contract SMT4-CT98-2232) and coordinated by ENEA (IT). The Project is at the certification stage and the material is not yet available on the market.

7
Subsamples of the different materials (n = 4–6)were extracted, diluted in water, and analyzed asdescribed above. The data for AsB determined inthese samples is shown in Table 3. A chro-matogram of the tuna fish material BCR 627 isshown in Figure 5.
The chromatogram indicates that the majorspecies in this sample is AsB with two minorspecies, which were also extracted and detected.One peak was identified as DMA, and the peaklabelled P1 is most likely to be AsC from RT match-ing. The data in Table 3 shows that the combinedASE/HPLC-ICP-MS methodology is capable ofdelivering accurate and reproducible results forAsB in these matrices. In addition, the extractionof other minor species, such as DMA and AsC, wasachieved in the fish tissues; up to six species wereextracted and separated in the oyster material,although none of these (apart from DMA) werequantified during this study. This DMA data forBCR 710 (730 ±30 ng/g DMA) showed a good agree-ment with the consensus mean value of the certification round (820 ±200 ng/g DMA).
Expressed as mg/kg As unless otherwise stated Measured value Certified value
DORM-2 (Dogfish muscle) 16.3 ±0.9 (±1 SD) 16.4 ±1.1 (±95% C.I.)BCR 627 (Tuna fish) 3.69 ±0.21 (±1 SD) 3.90 ±0.22 (±95% C.I.)BCR 710 (Oyster tissue)† (Concentration as species) 31.8 ±1.1 (±1 SD) 32.7 ±5.1 (±1 SD)
Table 3. Data Obtained for AsB in Two CRMs and a Candidate Reference Material
† The data shown for this material is based on the consensus mean of the final certification round after the removal of statistical outliers.
2.00 4.00 6.00 8.00 10.00 12.00 14.000
1000
2000
3000
4000
5000
6000
7000
Time (min)
Abu
ndan
ce (c
ount
s)
DMA
AsB
P1
Figure 5. Chromatogram of a tuna fish extract (BCR 627) enlarged to show the detection of minor species in this material.
Evaluation of Method PerformanceDuring a CRM Feasibility Study
The method performance was assessed in compari-son to a number of European expert laboratoriesduring the “SEAS” feasibility study organized bythe The University of Plymouth Enterprise Limitedand sponsored by the European Union (BCR, EU)‡.A fish material was prepared for this intercompar-ison by the University of Plymouth and distributedto participating laboratories. Participants wereasked to determine AsB in a fish material from twodifferent bottles using a methodology of theirchoice and making their determinations, at least,in duplicate on separate days.
The developed As-speciation method was used toextract and analyze the fish samples provided. Atotal of 12 subsamples from the two bottles were
‡The “SEAS” feasibility study was co-ordinated by The University of Plymouth Enter-prise Limited (Plymouth, UK) under the EC contract: G6RD CT2001 00473 "SEAS" with the title: 'Feasibility Studies for Speciated CRMs For Arsenic in Chicken, Rice,Fish and Soil and Selenium in Yeast and Cereal'.

8
extracted and analyzed on 3 different days. Thedata were combined to provide the value labelled“LGC” in Figure 6 below. The error bars indicatethe SD of the mean of individual results. The meanof all result (excluding a statistical outlier) togetherwith 1 SD above and below the mean is indicatedby the solid and dashed horizontal lines, respec-tively. The data provided by the combined ASEextraction and developed LC-ICP-MS methodology(94.92 ±3.95 mg/kg AsB) is in very good agreementwith the mean result of all labs (95.72 ±7.79 mg/kgAsB, n = 11). The precision achieved was also satis-factory at 4.2% (RSD) for 12 subsamples from dif-ferent bottles analyzed on 3 separate days. Theperformance of the method in this internationalintercomparison is highlighted by the good agree-ment with data provided by several Europeanexpert laboratories with longstanding expertise inAs-speciation analysis. It should also be noted thatthe intercomparison was carried out with a blindsample of unknown concentration, rather thanbased on the analysis of a CRM with known certified values.
AsB in fish
40
50
60
70
80
90
100
110
120
1 2 3 4 5 6 LGC 7 8 9 10 11
Laboratory
AsB
mea
sure
d (m
g\kg
)
Solid line: Mean of means:
95.72 mg/kg
Dashed lines - 1 SD:
± 7.79 mg/kg
Conclusions
A robust and practical method has been developedbased on accelerated solvent extraction and HPLC-ICP-MS analysis for the fast and accuratedetermination of AsB in fish samples. The benefitsof the methods include automated extraction of upto 24 samples, minimal sample preparation steps(dilution only) after extraction, and rapid andautomated analysis by HPLC-ICP-MS. The separa-tion of four to six species of toxicological interestis achieved within 10 min using an isocratic elu-tion. This increases the sample throughput bynegating the column equilibration period neededwith most gradient elution profiles.
The method was validated using commerciallyavailable CRMs and during a European intercom-parison study with a fish sample of unknown con-centration. The performance of the method wasvery satisfactory in terms of both accuracy andprecision compared to several other expert laboratories.
This method can be used to rapidly determine thenontoxic proportion (AsB) in fish samples withhigh total As content and could therefore be usedto determine whether a particular sample poses atoxicological risk in the food chain.
Figure 6. Comparison of data submitted by 12 participants for the determination of AsB in fish during the“SEAS” feasibility study. The error bars associated with the individual data points represent 1 SD ofanalysis of separate subsamples.

9
Acknowledgements
The work described in this application note wassupported under contract with the Department ofTrade and Industry (UK) as part of the NationalMeasurement System Valid Analytical Measurement (VAM) program.
References 1. S. Branch, L. Ebdon, and P. O’Neill (1994)
J. Anal. At. Sprectrom., 9, 33-37.
2. J. S. Edmonds, Y. Shibata, K. A. Francesconi, R.J. Rippingale, and M. Morita (1997) Appl.Organomet. Chem., 11, 281.
3. P. A. Gallagher, S. Murray, X. Wei, C. A. Schwegel,and J. T. Creed (2002) J. Anal. At. Spectrom.,17, 581-586.
4. J. W. McKiernan, J. T. Creed, C. A. Brockhoff, J. A. Caruso, and R. M. Lorenzana (1999) J. Anal. At. Spectrom., 14, 607-613.
5. S. McSheehy, P. Pohl, R. Lobinski, and J. Szpunar, (2001) Analyst, 126, 1055-1062.
6. E. H. Larsen and S. Stürup (1994) J. Anal. At.Sprectrom., 9, 1099-1105.
7. U. Kohlmeyer, J. Kuballa, and E. Jantzen (2002)Rapid Commun. Mass Spectrom,. 16, 965-974.
For More Information
For more information on our products and services,visit our Web site at www.agilent.com/chem.

Agilent shall not be liable for errors contained herein or for incidental or consequentialdamages in connection with the furnishing, performance, or use of this material.
Information, descriptions, and specifications in this publication are subject to changewithout notice.
© Agilent Technologies, Inc. 2003
Printed in the USAOctober 14, 20035988-9893EN
www.agilent.com/chem

AuthorJohn Entwisle LGCQueens RoadTeddingtonMiddlesex TW11 0LY, UK
Abstract
The quantitative determination of mercury in foodstuffs ispresented using a 7500i ICP-MS. Microwave digests wereprepared and then analyzed by ICP-MS. To avoid memoryeffects often experienced with mercury, gold was addedoffline to all standards/samples and wash solutions toact as a cleansing agent. The instrumental setup used asecond vacuum pump, the integrated sample introductionsystem in the high sample throughput mode, and a micro-flow concentric nebulizer. This allowed the robust andrapid determination of mercury in the digests at the pptrange. Excellent agreement with the certified value wasobtained for two certified reference materials and stabil-ity of the system was demonstrated over a 36-hour analytical run.
Introduction
The determination of sub-ppb concentrations ofmercury has always been of special importance inthe field of trace metal analysis. Even at tracelevels, mercury is toxic and causes neurologicaldamage, particularly in fetuses and young children.Anthropogenic sources of mercury in the environ-
Determination of Mercury in MicrowaveDigests of Foodstuffs by ICP-MSApplication
ment include coal-fired power stations and chlor-alkali works. In the aquatic environment, bacteria convert elemental mercury Hg(0) tomethylmercury which is accumulated and passedup the food chain. It has been reported that somewhale meat contains 5000 times the Japanese legallimit of 0.4 µg/g. In addition, fish and shellfish aresignificant contributors to the human diet. Todaymercury pollution is a global problem and exten-sive monitoring of foodstuffs is required. Thereforefast efficient and robust methods are needed. Mer-cury however is recognized as a problem element.It is known to adsorb onto the walls of storage con-tainers and volatilize as mercury vapor. Addition-ally, its high first ionization potential andnumerous isotopes have limited its sensitivity inICP-MS analysis. ICP-MS allows the rapid determi-nation of ultratrace levels of metals in food digests,however, extensive washout times have beenrequired to reduce carryover for mercury analysis.Other workers have tried the addition of a numberof chemical agents in the past. One of the mosteffective washout agents is gold chloride. To avoidmemory effects and ensure stability, gold chloride(at the 5-ppm level) was added offline to all samples/standards and wash solutions. Extensivewashout times were reduced by using by the inte-grated sample introduction system (ISIS). With theuse of the high throughput pump, a large flushvolume can be pumped through in a much shortertime. By summing the responses for multiple iso-topes (199, 200, 201, and 202) and with the help ofa second interface vacuum pump and a micro-flowconcentric nebulizer, detection levels of between10 and 30 ppt were routinely achieved for thedigests.
Food Safety
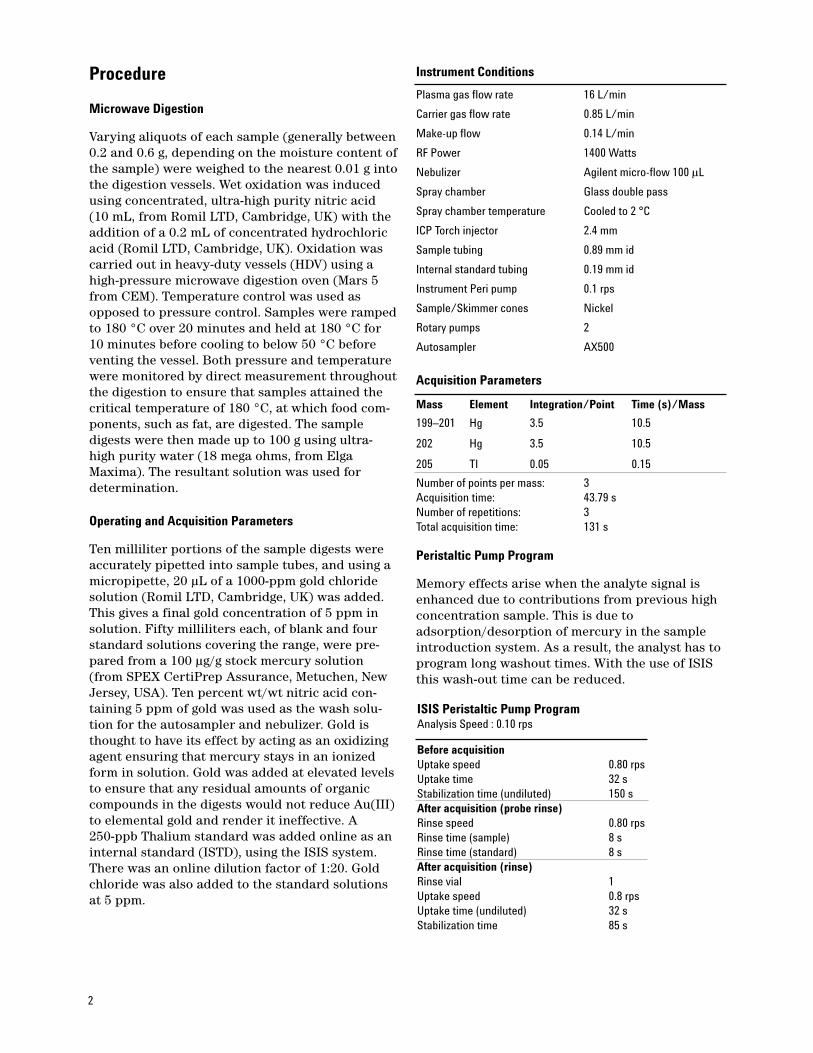
2
Procedure
Microwave Digestion
Varying aliquots of each sample (generally between0.2 and 0.6 g, depending on the moisture content ofthe sample) were weighed to the nearest 0.01 g intothe digestion vessels. Wet oxidation was inducedusing concentrated, ultra-high purity nitric acid(10 mL, from Romil LTD, Cambridge, UK) with theaddition of a 0.2 mL of concentrated hydrochloricacid (Romil LTD, Cambridge, UK). Oxidation wascarried out in heavy-duty vessels (HDV) using ahigh-pressure microwave digestion oven (Mars 5from CEM). Temperature control was used asopposed to pressure control. Samples were rampedto 180 °C over 20 minutes and held at 180 °C for10 minutes before cooling to below 50 °C beforeventing the vessel. Both pressure and temperaturewere monitored by direct measurement throughoutthe digestion to ensure that samples attained thecritical temperature of 180 °C, at which food com-ponents, such as fat, are digested. The sampledigests were then made up to 100 g using ultra-high purity water (18 mega ohms, from ElgaMaxima). The resultant solution was used fordetermination.
Operating and Acquisition Parameters
Ten milliliter portions of the sample digests wereaccurately pipetted into sample tubes, and using amicropipette, 20 µL of a 1000-ppm gold chloridesolution (Romil LTD, Cambridge, UK) was added.This gives a final gold concentration of 5 ppm insolution. Fifty milliliters each, of blank and fourstandard solutions covering the range, were pre-pared from a 100 µg/g stock mercury solution(from SPEX CertiPrep Assurance, Metuchen, NewJersey, USA). Ten percent wt/wt nitric acid con-taining 5 ppm of gold was used as the wash solu-tion for the autosampler and nebulizer. Gold isthought to have its effect by acting as an oxidizingagent ensuring that mercury stays in an ionizedform in solution. Gold was added at elevated levelsto ensure that any residual amounts of organiccompounds in the digests would not reduce Au(III)to elemental gold and render it ineffective. A 250-ppb Thalium standard was added online as aninternal standard (ISTD), using the ISIS system.There was an online dilution factor of 1:20. Goldchloride was also added to the standard solutionsat 5 ppm.
Instrument Conditions
Plasma gas flow rate 16 L/min
Carrier gas flow rate 0.85 L/min
Make-up flow 0.14 L/min
RF Power 1400 Watts
Nebulizer Agilent micro-flow 100 µL
Spray chamber Glass double pass
Spray chamber temperature Cooled to 2 °C
ICP Torch injector 2.4 mm
Sample tubing 0.89 mm id
Internal standard tubing 0.19 mm id
Instrument Peri pump 0.1 rps
Sample/Skimmer cones Nickel
Rotary pumps 2
Autosampler AX500
Acquisition Parameters
Mass Element Integration/Point Time (s)/Mass
199–201 Hg 3.5 10.5
202 Hg 3.5 10.5
205 Tl 0.05 0.15
Number of points per mass: 3Acquisition time: 43.79 sNumber of repetitions: 3Total acquisition time: 131 s
Peristaltic Pump Program
Memory effects arise when the analyte signal isenhanced due to contributions from previous highconcentration sample. This is due toadsorption/desorption of mercury in the sampleintroduction system. As a result, the analyst has toprogram long washout times. With the use of ISISthis wash-out time can be reduced.
ISIS Peristaltic Pump ProgramAnalysis Speed : 0.10 rps
Before acquisitionUptake speed 0.80 rpsUptake time 32 sStabilization time (undiluted) 150 sAfter acquisition (probe rinse)Rinse speed 0.80 rpsRinse time (sample) 8 sRinse time (standard) 8 sAfter acquisition (rinse)Rinse vial 1Uptake speed 0.8 rpsUptake time (undiluted) 32 sStabilization time 85 s

3
0
2
4
6
8
10
12
Hg/
Tl ra
tio (T
l 12
ng/g
)
0 1000 2000
Aquacheck 217 independent QC standardrecovery 106.9% ±8% (n = 10, K = 2)
R2 = 0.998
3000 4000 5000 6000Hg concentration pg/g
Figure 1. Calibrations over 36 hours continuous operation.
0.000
0.020
0.040
0.060
Conc
entr
atio
n H
g m
g/kg
0.080
0.100
0.120
0.140
0 2 4 6 8Determination number
10 12 14 16
Figure 2. NIST 1547 Peach leaves (bottom trace) and LGC 7160 Crab paste (top trace)were analyzed 14 times over a period of 1 month. Each point represents a sepa-rate digest. LGC 7160 certified value 0.096 = ±±0.108 mg/kg, NIST 1547 certifiedvalue 0.031 = ±±0.007 mg/kg.
Waste
ISTD
Autosampler AX500 Agilent 7500i
Rotary pumps
ISIS
Tee joint
The sample is split at the first Tee joint. A constantquantity of sample is introduced to the second Tee joint(by pump 2) where it is mixed with ISTD before going to the nebulizer.
When going to the next sample the ISIS pump (pump 1)turns at high speed to shorten the sample and washouttransfer times.
12
Pump 1Pump 2
Figure 3. Schematic of ISIS in high sample throughput mode.

Agilent shall not be liable for errors contained herein or for incidental or consequen-tial damages in connection with the furnishing, performance, or use of this material.
Information, descriptions, and specifications in this publication are subject to changewithout notice.
© Agilent Technologies, Inc. 2004
Printed in the USAApril 7, 20045989-0027EN
www.agilent.com/chem
Results
Five calibration plots over a 36-hour period areshown in Figure 1 demonstrating excellent stabil-ity of the system. As can be seen, excellent linear-ity was achieved over an extended calibrationrange demonstrating that memory effects had beeneffectively eliminated. Between the calibrationsover 120 various microwave foodstuff digests wereanalyzed.
Quality Control
An Aquacheck proficiency testing material solu-tion from the Water Research Council (1010 ppt)was analyzed 10 times during the run and a meanrecovery of 106.9% (±8%) was achieved (Figure 1).This material was analyzed throughout a run of120 various foodstuffs samples and acted as aquality control for the quantitation.
Two certified reference materials (CRMs) wereanalyzed throughout a survey of 500 samples.These acted as quality control materials for themicrowave digestion as well as the quantitation.The CRMs used were a crab paste—Metals LGC7160, 0.096 mg/kg—and peach leaves—NIST 1547,0.031 mg/kg. Each CRM was analyzed 14 times ondifferent runs during a survey of more that 500samples of various foodstuffs over a 1-monthperiod. The results can be seen in Figure 2.
For More Information
For more information on our products and services,visit our Web site at www.agilent.com/chem.
Conclusion
This procedure proved robust, as in excess of 500samples were analyzed in runs lasting in excess of36 hours without loss of sensitivity.
The 7500i ICP-MS has shown to be a robust andsensitive tool for the analysis of foodstuff for mer-cury. The system proved stable over an extendedtime period. The use of the ISIS enables the opera-tor to take advantage of the high sample through-put possible with this technique. The use ofAu(III), in particular, shortens washout time con-siderably, reducing the possibility of carry-over.The sensitivity of the 7500i ICP-MS gives methoddetection limits at low ppt levels in the foodstuffdigests. The extended calibration range reducesthe need for dilutions and reruns.
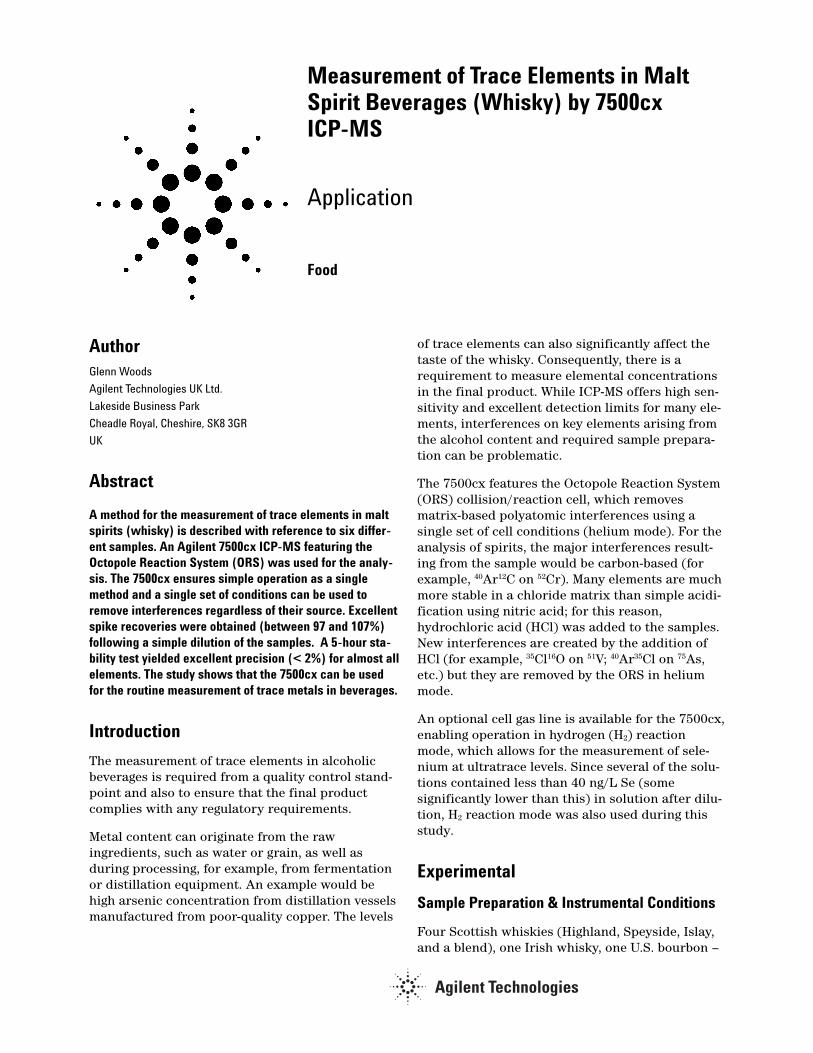
AuthorGlenn WoodsAgilent Technologies UK Ltd.Lakeside Business ParkCheadle Royal, Cheshire, SK8 3GRUK
Abstract
A method for the measurement of trace elements in maltspirits (whisky) is described with reference to six differ-ent samples. An Agilent 7500cx ICP-MS featuring theOctopole Reaction System (ORS) was used for the analy-sis. The 7500cx ensures simple operation as a singlemethod and a single set of conditions can be used toremove interferences regardless of their source. Excellentspike recoveries were obtained (between 97 and 107%)following a simple dilution of the samples. A 5-hour sta-bility test yielded excellent precision (< 2%) for almost allelements. The study shows that the 7500cx can be usedfor the routine measurement of trace metals in beverages.
Introduction
The measurement of trace elements in alcoholicbeverages is required from a quality control stand-point and also to ensure that the final productcomplies with any regulatory requirements.
Metal content can originate from the raw ingredients, such as water or grain, as well asduring processing, for example, from fermentationor distillation equipment. An example would behigh arsenic concentration from distillation vesselsmanufactured from poor-quality copper. The levels
Measurement of Trace Elements in MaltSpirit Beverages (Whisky) by 7500cx ICP-MS
Application
of trace elements can also significantly affect thetaste of the whisky. Consequently, there is arequirement to measure elemental concentrationsin the final product. While ICP-MS offers high sen-sitivity and excellent detection limits for many ele-ments, interferences on key elements arising fromthe alcohol content and required sample prepara-tion can be problematic.
The 7500cx features the Octopole Reaction System(ORS) collision/reaction cell, which removesmatrix-based polyatomic interferences using asingle set of cell conditions (helium mode). For theanalysis of spirits, the major interferences result-ing from the sample would be carbon-based (forexample, 40Ar12C on 52Cr). Many elements are muchmore stable in a chloride matrix than simple acidi-fication using nitric acid; for this reason,hydrochloric acid (HCl) was added to the samples.New interferences are created by the addition ofHCl (for example, 35Cl16O on 51V; 40Ar35Cl on 75As,etc.) but they are removed by the ORS in heliummode.
An optional cell gas line is available for the 7500cx,enabling operation in hydrogen (H2) reactionmode, which allows for the measurement of sele-nium at ultratrace levels. Since several of the solu-tions contained less than 40 ng/L Se (somesignificantly lower than this) in solution after dilu-tion, H2 reaction mode was also used during thisstudy.
Experimental
Sample Preparation & Instrumental Conditions
Four Scottish whiskies (Highland, Speyside, Islay,and a blend), one Irish whisky, one U.S. bourbon –
Food

2
as well as a further Scottish whisky and a U.S.bourbon that had been stored in lead crystaldecanters – were analyzed. The samples were pre-pared by simple 5x dilution using 1% HNO3 and0.5% HCl (v/v). Using an acid mix significantlyimproves the stability of many elements, particu-larly Hg and Sn, compared to the use of nitric acidalone. Standards were prepared from 1,000 ppmstock single-element solutions to produce finalmixed-element calibration solutions. In order tocompensate for sample transport effects and sol-vent evaporation rates, the alcohol content of thestandards was matched to that of the samples byadding 8% ethanol to all standard solutions (equiv-alent to 5x dilution of the original samples, whichcontained 40% v/v alcohol). This also compensatesfor ionization enhancement effects for As and Se inthe presence of high carbon concentrations. Gold(400 µg/L) was also added to the standards andsamples in order to further improve the stability ofHg.
Table 1 lists the instrumental conditions used forthe analysis; sample uptake rate was approxi-mately 150 µL/min and sampling was facilitated bythe Agilent ASX-520 autosampler. The solutionpump program was optimized using the preemp-tive rinse function in the ChemStation software inaddition to a multichemistry rinse regime [1]. The7500cx was operated under standard conditions,and internal standards (Ge, Rh, and Ir) were addedautomatically on line by the system’s peristalticpump. No special precautions were necessary forthese sample types.
As each collision causes energy loss, the interfer-ing species lose more energy than the analyte andare subsequently filtered from the mass spectrumby discriminating between the two different ener-gies (called energy discrimination). As this processtakes place regardless of the analyte-interferencecombination, a single set of conditions can be usedfor all analytes.
Selenium was measured in hydrogen mode as theconcentration of this element in the diluted samplewas at low ppt levels. Although selenium can bemeasured in helium mode, hydrogen moderemoves the Ar-based interference with greaterefficiency, improving the detection limit for thiselement, and is the better option for low-ppt con-centrations. Some isotopes were determined inboth helium mode and no-gas mode to providecomparative data on cell performance. For routineanalysis this would not be necessary, of course. Allcell modes were acquired within a single acquisi-tion and sample pass.
Results and Discussion
Table 2 summarizes the detection limits (DLs),background equivalent concentrations (BECs), andcalibration regression for the isotopes studied inthe different cell modes (default mode is high-lighted in bold typeface). For those elements thatsuffer from interferences in this carbon and chlo-ride matrix, BECs and DLs are severely compro-mised when operating the instrument in no-gasmode (that is, conventional ICP-MS). This can beclearly observed in the data for chromium: 52CrBEC without cell gas is 526 µg/L, and in heliummode is 0.07 µg/L. The interference is effectivelyreduced to background contamination levels as theBECs for both Cr isotopes are very similar.Improvements can also be observed for V, Fe and65Cu (63Cu does not suffer from interferences inthis relatively simple matrix), all of which wereacquired in helium mode.
Figures 1 to 3 display the calibration profiles forselected interfered elements with and without cellgas applied; Figures 4 and 5 illustrate the calibra-tion profiles for Be (low mass, difficult to ionize)and Hg (high mass, difficult to ionize, low-abun-dance isotope). The line does not pass through theorigin in the calibrations for those elements thatsuffer from an interference and this offset can beseen clearly. Be and Hg are also presented todemonstrate the excellent sensitivity for these dif-ficult-to-ionize elements. In order to obtain lowdetection limits, it is essential to maximize the ion-
Table 1. Agilent 7500cx Operating Conditions
RF power 1550 W
Sampling depth 8 mm
Carrier gas flow 0.68 L/min
Makeup gas flow 0.33 L/min
Spray chamber temperature 15 °C
Helium cell gas flow 5.5 mL/min
Hydrogen cell gas flow 4.0 mL/min
Data Acquisition
Data was acquired operating the ORS in helium[He], hydrogen [H2], and no-gas modes. Helium mode is the default mode of operation of the7500cx. The inert He cell gas conditions removeinterferences based on their ionic cross-sectionrather than relying on a reactive gas. As almost allinterferences in ICP-MS are polyatomic in nature,they possess a greater cross-section than themonatomic analyte at the same mass and thereforeundergo a greater number of collisions in the cell.

3
ization efficiency of the plasma. This is donethrough optimization of the sample introductionsystem (low solution and gas flow rates and wide-bore injector torch) and plasma generator design(27.12 MHz, solid-state fixed frequency, and high-efficiency digital drive). All of these factors com-bine to increase the effective central channeltemperature, improving ionization efficiency. Thisis allied to an ion lens system designed to improvelow-mass ion transmission efficiency, furtherimproving the DL of this important and relativelydifficult element.
The elements Ge, Rh, and Ir were used as internalstandards and were added on line.
Table 3 displays the quantitative data for all sam-ples, including a spike recovery for the Islaywhisky. Data are displayed in the preferred cell gasmode (usually helium). Although some elementswere calibrated under gas and no-gas conditions,only the most appropriate cell mode is displayed to
simplify the data set. Taking Cr as an example, thedata for both isotopes did not match in no-gasmode and were significantly higher than the dataobtained in helium mode due to the intensity ofthe C- and Cl-based interferences. The heliummode data for both Cr isotopes produced compara-ble results, which is a good indication of the accu-racy of the data.
The two samples that had been stored in lead crys-tal decanters have obviously higher Pb concentra-tion in comparison to the other samples. The meanPb concentration in the noncrystal samples wasabout 1.3 µg/L, while the Pb content of the samplesstored in the crystal decanters was almost 10xhigher. As a comparison, the UK maximum permis-sible Pb concentration in drinking water is 25 µg/L(at the tap), which means that the Pb concentra-tion is within this guideline; however, in 2013 thislevel is due to be reduced to 10 µg/L, meaningproducts stored in crystal would fail to meet drink-ing water quality standards.
Table 2. Limit of Detection, Background Equivalent Concentrations, and Regression Coefficients for the StudiedIsotopes (Data are presented as ng/L [ppt] and are corrected for dilution.)
Element Mass Mode r DL BEC
Be 9 No gas 1 0.5 0.3V 51 He 1 26.8 12.2V 51 No gas 0.9999 495 5220Cr 52 He 1 50.4 73.7Cr 52 No gas 0.985 48600 526000Cr 53 He 1 38.6 71.3Cr 53 No gas 0.9997 2020 52100Mn 55 He 1 7.8 20.8Mn 55 No gas 1 17.5 30.4Fe 56 He 0.9999 17.8 406Fe 56 No gas 1 1160 58300Co 59 He 1 0.5 3.7Co 59 No gas 1 5.6 6.7Ni 60 He 1 13 38.7Ni 60 No gas 1 15.2 73.6Cu 63 He 1 10.4 41.5Cu 63 No gas 1 16.6 59.6Cu 65 He 1 18.1 36.9Cu 65 No gas 1 58.6 230Zn 66 He 1 33.9 119Zn 66 No gas 1 22 171As 75 He 1 2.0 3.8As 75 No gas 1 46.1 382Se 78 H2 1 3.6 13Se 78 No gas 1 135 1390Cd 111 He 1 5.7 5.3Cd 111 No gas 1 3.3 6.1Sn 118 No gas 1 7.8 50.5Sb 121 No gas 1 7.1 30.8Ba 137 No gas 1 2.8 5.3Hg 201 No gas 1 1.7 10.7Pb 208 No gas 1 2.1 10.2U 238 No gas 1 0.1 0.2

4
Figure1A. Chromium calibration [He mode]. Note BEC of 0.0504 µg/L.
Figure 1B. Chromium calibration [no-gas mode]. Note BEC of 526 µg/L.
Figure 2A. Vanadium calibration [He mode]. Note BEC of 0.0122 µg/L.
Figure 2B. Vanadium calibration [no-gas mode]. Note BEC of 4.57 µg/L.
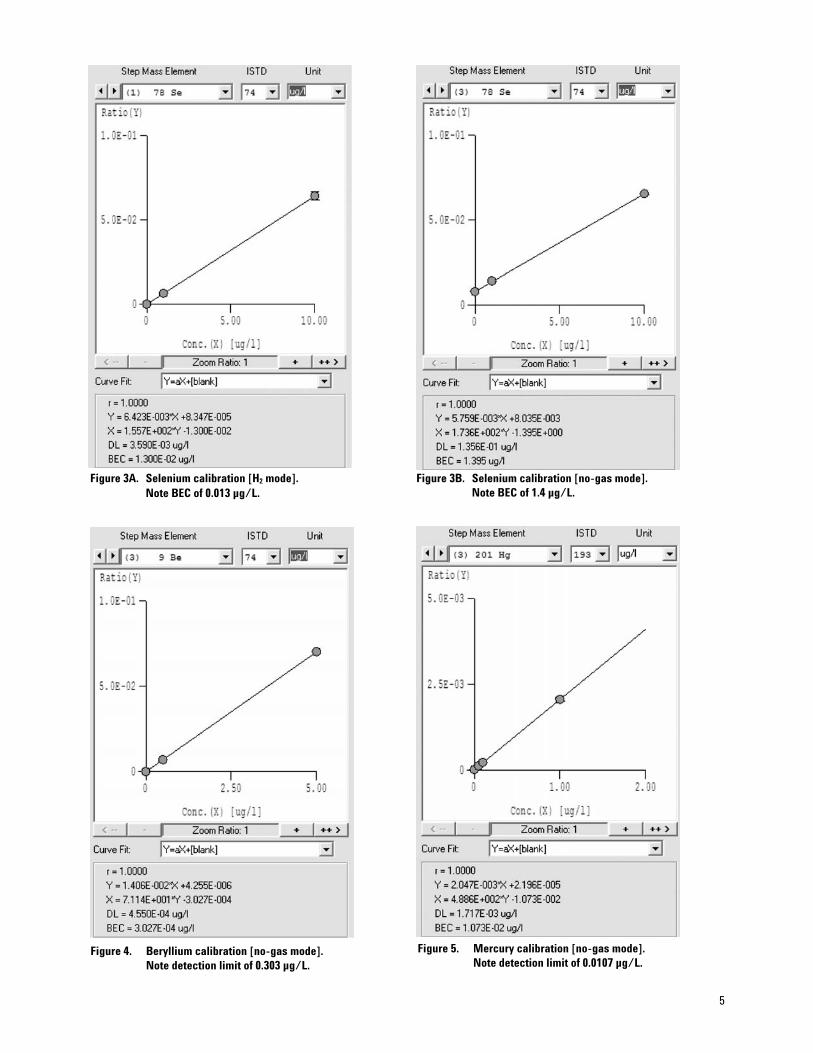
5
Figure 3A. Selenium calibration [H2 mode]. Note BEC of 0.013 µg/L.
Figure 3B. Selenium calibration [no-gas mode]. Note BEC of 1.4 µg/L.
Figure 4. Beryllium calibration [no-gas mode]. Note detection limit of 0.303 µg/L.
Figure 5. Mercury calibration [no-gas mode]. Note detection limit of 0.0107 µg/L.

6
Table 3. Quantitative Data Obtained in the Preferred Cell Mode for the Spirit Samples with Spike Recovery for the IslaySample (Recoveries were generally excellent. All results presented as dilution-corrected µg/L.)
Bourbon Whisky Islay Spike %
Sample Highland Speyside Islay Blend Irish Bourbon decanter decanter spike qty recovery
Be 9 No gas 0.140 0.052 0.037 0.008 0.035 0.015 0.042 0.048 13.09 12.5 104.4
V 51 He 1.564 0.443 0.344 0.073 0.431 6.321 1.693 0.14 25 25 98.6
Cr 52 He 27.39 14.05 4.064 12.62 22.71 4.077 31.87 4.331 30.95 25 107.5
Cr 53 He 26.15 13.7 3.955 12.57 22.61 3.661 31.52 4.114 30.81 25 107.4
Mn 55 He 54.51 31.76 13.52 12.22 26.95 9.753 90.4 30.54 38.19 25 98.7
Fe 56 He 1125 191.2 99.76 583.8 250.5 131.4 1114 67.03 232.2 125 106.0
Co 59 He 1.097 0.376 0.180 0.130 0.336 0.172 0.323 0.368 12.83 12.5 101.2
Ni 60 He 14.02 3.586 1.442 5.065 3.078 2.274 12.88 1.992 25.91 25 97.9
Cu 63 He 542.9 370.8 454.4 258 38.45 22.2 445.5 367.6 579.8 125 100.3
Cu 65 He 525.5 359.2 441.6 251.4 37.4 21.43 430.8 355.9 568.6 125 101.6
Zn 66 He 21.02 18.54 8.414 14.18 8.149 13.69 68.27 21.9 137.5 125 103.3
As 75 He 0.503 0.427 0.272 0.256 0.164 2.192 0.434 0.424 25.72 25 101.8
Se 78 H2 0.458 0.357 0.190 0.073 0.045 0.497 0.069 0.293 26.54 25 105.4
Cd 111 He 0.036 0.024 0.012 0.010 0.024 0.036 0.193 0.028 12.55 12.5 100.3
Sn 118 No gas 9.18 14.82 16.68 5.161 2.245 1.681 0.239 15.12 41.3 25 98.5
Sb 121 No gas 0.817 0.514 0.397 0.308 0.311 0.765 0.316 0.188 24.87 25 97.9
Ba 137 No gas 3.282 3.05 1.426 2.001 3.37 3.303 1.396 2.41 25.71 25 97.1
Hg 201 No gas 0.013 0.011 0.010 0.011 0.010 0.018 0.008 0.009 0.252 0.25 97.0
Pb 208 No gas 1.13 0.898 0.903 1.902 1.21 0.912 12.59 11.15 25.33 25 97.7
U 238 No gas 0.295 0.049 0.051 0.026 0.060 0.104 0.028 0.049 24.38 25 97.3
The benefit of operating the instrument in heliummode can clearly be observed for those isotopessuffering from interferences. As helium is a totallyinert gas, no side reactions or new product inter-ferences are formed – this lends itself to full massacquisition allowing interference-free qualitativeor semiquantitative analysis. The samples wereprepared in an identical way as above (although aseparate preparation on a different day) and Table4 displays the semiquantitative data obtained forthe samples analyzed under identical helium cellconditions as with the previous data set.
The full mass spectrum (Figure 6) is from the crys-tal-stored bourbon sample. The graphic includesan inset, zoomed-in region to demonstrate theexcellent isotopic fit for those elements sufferingmost from interferences. The fit for Cr is particu-larly important as all three isotopes (50, 52, and
53) demonstrate good agreement with theexpected natural ratio in this carbon-based matrix(50Cr suffers interferences from 38Ar12C, 13C37Cl,36Ar14N, and 35Cl15N; 52Cr has interferences from36Ar16O, 40Ar12C, 35Cl17O, and 37Cl15N; 53Cr has inter-ferences from 40Ar13C, 37Cl16O, 35Cl18O, and35Cl17O1H). Several other interferences are also pos-sible, but each is polyatomic in nature and so isremoved by the same process and using a singleset of helium mode conditions.
To demonstrate instrument stability (Figure 7), 54separate measurements were made of a spikedHighland malt whisky sample; total measurementtime was 5 hours 18 minutes. Stability for themajority of elements was < 2% RSD over the run,indicating applicability of the method to routineanalysis.

7
Table 4. Semiquantitative Data for Spirit Samples Using Helium Mode (Data are presented as µg/L [ppb] unless indicated and arecorrected for dilution.)
Bourbon WhiskyHighland Speyside Islay Blend Irish Bourbon decanter decanter
7 Li 0.24 0.2 0.049 0.084 0.16 0.16 0.34 0.269 Be 0.15 N/D N/D N/D N/D N/D N/D N/D11 B 46 44 42 49 62 69 75 5112 C 53000 ppm 55000 ppm 55000 ppm 55000 ppm 54000 ppm 76000 ppm 55000 ppm 57000 ppm23 Na 1400 2100 1600 1600 1000 12000 540 210024 Mg 61 48 23 30 63 120 45 4827 Al 3.9 1.8 1.8 2.3 2.4 1.9 2.5 1.629 Si 1300 1400 1300 1300 1300 2000 1500 140031 P 13 9.7 6.2 11 86 200 33 1834 S 100 190 120 240 250 520 210 25035 Cl 450 ppm 440 ppm 420 ppm 420 ppm 420 ppm 430 ppm 410 ppm 430 ppm39 K 150 150 100 130 320 470 460 16043 Ca 60 49 5.5 10 37 18 26 2247 Ti 0.51 1.6 0.77 0.51 1.5 1.7 0.99 0.851 V 0.8 0.54 0.11 0.6 0.6 6.5 1.2 0.2152 Cr 26 14 5.1 13 23 5.1 27 5.455 Mn 54 32 13 14 27 11 90 3256 Fe 1200 210 100 630 260 150 1100 7659 Co 1.1 0.47 0.16 0.18 0.36 0.24 0.4 0.460 Ni 13 3.5 1.8 5.7 3.4 2.4 13 2.363 Cu 530 380 450 260 39 22 440 38066 Zn 22 18 9 15 8.9 14 71 2569 Ga 0.65 0.45 0.27 0.39 0.66 0.52 0.3 0.5175 As 0.44 0.3 0.21 0.2 0.19 2 0.4 0.4278 Se N/D 0.48 N/D N/D N/D N/D N/D 0.4779 Br 160 150 140 130 120 150 150 15085 Rb 0.9 1.4 0.92 1 2.2 8.1 6.1 1.588 Sr 1.3 0.84 0.22 0.36 1.4 1.7 0.57 0.7889 Y 0.046 0.03 0.024 0.0084 0.1 0.034 0.0056 0.03590 Zr 0.18 0.019 0.12 0.064 0.22 0.093 0.069 0.009793 Nb 0.0024 0.0076 0.005 0.0051 0.091 0.014 0.0077 0.00595 Mo 0.7 0.31 0.37 0.41 0.33 1.5 0.76 0.13101 Ru 0.01 0.02 N/D 0.021 N/D N/D 0.01 0.02105 Pd 0.0072 N/D N/D 0.0075 N/D 0.025 N/D N/D107 Ag 0.017 0.027 0.0034 0.0035 0.014 0.0039 0.021 0.01111 Cd N/D 0.047 0.047 0.024 0.024 0.1 0.14 0.071118 Sn 10 18 20 6 3.7 2.2 0.6 17121 Sb 0.32 0.3 0.27 0.3 0.39 0.8 0.3 0.21125 Te N/D 0.38 0.38 0.19 0.19 N/D N/D 0.18127 I 0.46 0.42 0.65 0.41 0.5 0.89 0.45 0.47133 Cs 0.052 0.15 0.026 0.0092 0.063 0.24 0.045 0.15137 Ba 4.6 3.2 1.3 2.2 3.8 3.8 1.3 2.4139 La 0.16 0.07 0.063 0.086 0.28 0.15 0.035 0.087140 Ce 0.47 0.24 0.17 0.11 0.61 0.24 0.04 0.36141 Pr 0.042 0.028 0.019 0.02 0.063 0.02 0.0044 0.024146 Nd 0.21 0.12 0.045 N/D 0.3 0.14 0.022 0.14147 Sm 0.074 N/D 0.01 0.033 0.098 0.037 0.032 0.032153 Eu 0.0027 0.0083 0.0055 0.011 0.016 0.0063 0.0056 N/D157 Gd 0.071 0.04 0.048 0.016 0.11 0.056 0.016 0.024159 Tb 0.0024 0.005 0.0025 N/D 0.012 0.0029 N/D 0.0037163 Dy 0.071 0.0096 0.024 0.029 0.083 0.028 0.0049 0.029165 Ho 0.0045 0.0057 0.0057 0.0011 0.012 0.0013 0.0046 0.0034166 Er 0.1 0.081 0.081 N/D 0.046 0.0075 0.0032 0.078169 Tm 0.0059 0.003 0.004 0.001 0.0061 0.0046 0.001 0.001172 Yb 0.055 0.013 0.0043 0.0089 0.013 0.02 0.0044 0.017175 Lu 0.0018 0.00096 N/D N/D N/D N/D 0.00097 0.00096178 Hf 0.0096 0.0032 0.0032 0.0033 0.019 N/D 0.0066 0.0032181 Ta 0.0038 N/D 0.0019 N/D 0.021 0.0011 0.0019 0.00098182 W 0.11 0.065 0.11 0.13 0.07 0.31 0.07 0.077185 Re 0.012 0.0049 0.012 0.0051 0.0025 0.0058 0.0076 N/D189 Os 0.0049 N/D 0.01 0.0051 0.005 0.011 0.005 0.015195 Pt 0.021 0.026 0.0044 0.018 0.013 0.0051 0.017 0.017202 Hg 0.057 0.019 0.029 0.029 0.059 0.022 0.039 0.058205 Tl 0.1 0.084 00.064 0.04 0.041 0.039 0.038 0.052208 Pb 1.2 0.95 0.94 2 1.3 0.93 12 10232 Th 0.02 0.0088 0.012 0.0079 0.009 0.027 0.0056 0.0067238 U 0.26 0.045 0.044 0.023 0.073 0.094 0.032 0.05

8
Figure 6a. Full scan (in He mode) of lead-crystal stored bourbon sample. The "major" peaks are indicated, including spectral fit forhigher intensity peaks.

9
Figure 6b. Zoomed spectrum for those elements suffering from interferences in this matrix. Note good spectral fit, particularly forCr (suffers from ArO, ArC, and ClO interferences).

Agilent shall not be liable for errors contained herein or for incidental or consequentialdamages in connection with the furnishing, performance, or use of this material.
Information, descriptions, and specifications in this publication are subject to changewithout notice.
© Agilent Technologies, Inc. 2007
Printed in the USAAugust 30, 20075989-7214EN
www.agilent.com/chem
0
100
200
300
400
500
600
700
800
900
0 10 20 30 40 50Sample repeat
Concentration (ppb)
BeVCrCrMnFeCoNiCuCuZnAsSeCdSnSbBaPbU
318 min stability spiked whisky
Figure 7. Stability for a spiked Highland malt sample (dilution corrected) taken over 5 hours 18 minutes (54 repeat measure-ments). Measurement precision was < 2% for almost all elements.
Conclusions
The analysis of high percentage alcoholic bever-ages using the 7500cx ICP-MS is routine after asimple acidification/dilution. The use of the ORSin the appropriate gas mode efficiently removesthe plasma-based and matrix-based interferences,improving detection limits and reliability of theanalysis with a simple set of conditions. The use ofhelium mode also allows interference-free semi-quantitative analysis, permitting greater elementalcoverage and rapid screening.
References1. Achieving Optimum Throughput in ICP-MS
Analysis of Environmental Samples with theAgilent 7500ce ICP-MS, Agilent ICP-MS Journal27, page 4; May 28, 2006, 5989-5132EN
For More Information
For more information on our products and services,visit our Web site at www.agilent.com/chem.
Speciated Isotope Dilution for theDetermination of Methylmercury in Tuna Fish by GC-MS
Abstract
A GC-MS with electron impact ionization was used for the development of a specia-tion method for the determination of methylmercury in fish samples. The method isbased on isotope dilution using a spike containing 201Hg-enriched methylmercury.The spike was applied to the determination of methylmercury in tuna samples withexcellent results.
AuthorsGiuseppe Centineo and J. Ignacio García AlonsoUniversity of OviedoFaculty of ChemistryDepartment of Physical and Analytical ChemistryJulián Clavería 833006 OviedoSpain
Application Note
Environmental

2
IntroductionAmong the various mercury species, methylmercury is themost hazardous because of its accumulative and persistentcharacter in the environment. Sensitive, specific, and preciseanalytical methods are needed to perform studies at ambientlevels. Already the first step in the analysis, the isolation ofmethylmercury from the sample matrix can be troublesome.Since recovery of the analyte from some matrices is notalways quantitative, recovery factors during isolation must bedetermined. This is usually done by standard addition tech-niques or recently by using isotope dilution mass spectrome-try (IDMS).
Isotope dilution (ID) methodologies provide superior accuracyand precision compared to more common calibration strate-gies. ID for trace element speciation has been widely appliedusing ICP-MS and, recently, using GC-MS, a routine techniquein testing laboratories.
ExperimentalReagentsMonomethylmercury chloride (96%) was obtained fromAldrich (Steinheim, Germany). Stock solutions were preparedby dissolving the salt in a 3:1 mixture of acetic acid (Merck,Darmstadt, Germany) and methanol (Merck). All standardsolutions were kept in the dark at –18 °C and diluted workingsolutions were prepared by weight daily before the analysis.Acetic acid (Merck) and methanol (Merck) were used for theextraction of the organotin compounds from the solid matri-ces.
Sodium tetraethyl borate (Galab, Geesthacht, Germany) solu-tions of 2% (w/v) were prepared daily in 0.1 M sodiumhydroxide solution (Merck).
A buffer solution at pH 5.3 was prepared by mixing appropri-ate volumes of 0.2 M acetic acid (Merck) and 0.2 M sodiumacetate (Merck) solutions.
The spike solution (201Hg-enriched monomethylmercury) wasobtained from ISC-Science (Oviedo, Spain), diluted by weightwith a mixture of methanol and acetic acid (3:1), and stored inthe dark at –18 °C. Table 1 shows the isotopic composition aswell as the concentration of the butyltin species in the spikesolution.
Table 1. Isotopic Composition (Content %) and Concentration of the 201Hg-Enriched Monomethylmercury (Uncertainty Corresponds to 95%Confidence Interval)
Hg-196 Hg-198 Hg-199 Hg-200<0.01 0.043 (2) 0.109 (5) 0.890 (10)
Hg-201 Hg-202 Hg-20496.495 (29) 2.372 (22) 0.091 (5)Concentration: 5.49 ± 0.02 µg g-1 as HgAdditional information on www.isc-science.com
InstrumentationGC/MS: Chromatographic analysis was performed with anAgilent (Agilent Technologies, Santa Clara, CA) gas chromato-graph, model 6890N, fitted with a split/splitless injector andan HP-5MS capillary column (cross-linked 5% phenyl methylsiloxane, 30 m ! 0.25 mm id ! 0.25 µm coating). The gaschromatograph was equipped with an Agilent (AgilentTechnologies) mass spectrometric detector, model 5973, net-work MSD (quadrupole based).
Helium was employed as carrier gas with a constant flow of1.2 mL min-1. The column temperature was initially held at 60 °C for 1 minute, increased at 30 °C min-1 to a final temper-ature of 300 °C. Injection was performed using a split/split-less injector in splitless mode. The transfer line and ionsource temperatures were at 280 and 230 °C, respectively.Electron impact ionization was performed at an electron ener-gy of 70 eV. The measurement of isotope ratios for methyl-mercury was performed on the molecular ion using 10-msdwell-time per mass.
The solid-phase microextraction (SPME) device used for man-ual extraction, a holder assembly and several replaceabledivinylbenzene/carboxen/ polydimethylsiloxane (DVB/CAR/PDMS, 50 µm/30 µm) fibers were purchased from Supelco(Madrid, Spain).
Extraction and Derivatization of Methylmercury from TunaFish SamplesFor extraction, approximately 0.4 g of sample was spiked witha solution of the 201Hg-enriched methylmercury and mixedwith 15 mL of a saturated sodium chloride solution and 100 µL of concentrated hydrochloric acid. The mixture wasshaken mechanically at room temperature for 5 hours.
Three milliliters of extract was adjusted to pH 5.3 with 3 mLof acetic acid/sodium acetate buffer in SPME glass vials; 1 mL of sodium tetraethyl borate was added and the vial

3
Table 2. Monitored Masses and Contribution Factors for Methylmercurywas then immediately closed with a PTFE-coated silicon rub-ber septum. The SPME needle pierced the septum and thefiber was exposed to the solution headspace for 15 minutesat room temperature. The solution was intensively stirredwith a PTFE-coated magnetic stirring bar with constant veloc-ity. Finally, the fiber was withdrawn into the needle and trans-ferred to the GC injector for thermal desorption for 1 minuteat 260 °C. During headspace solid-phase microextraction (HS-SPME), the temperature was controlled by immersing thesample vials in a water bath.
Results and DiscussionIsotope Ratio Measurements by GC-MSWhile elemental isotope ratios can be easily obtained withICP-MS, in GC/MS the isotopic pattern in molecular ions isdifferent from that of the naturally occurring elements due tothe contributions from the organic groups attached to themetal because of the presence of 13C. The contribution of 13Cto the observed m+1 ions can be calculated in a fairlystraightforward way, by applying equation 1:
Im+1 = Im•nx13C (1)
where x13C is the relative abundance of 13C with respect to12C (0.0111/0.9899), n is the number of C atoms in the molec-ular ion, and I is the intensities of the ions m and m+1,respectively. The measured signal intensities were correctedby monitoring five molecular clusters, corresponding to the198Hg, 199Hg, 200Hg, 201Hg, and 202Hg isotopes, taking intoaccount the 13C contributions to m+1. The intensity (I) correc-tion equations used were:
198Hg = 198I (2)199Hg = 199I – x(198Hg) (3)200Hg = 200I – x(199Hg) (4)201Hg = 201I – x(200Hg) (5)202Hg = 202I – x(201Hg) (6)
where x is the contribution factor m+1. The selected molecu-lar clusters for the measurement of methylmercury by GC-MSand the contribution factor x are given in Table 2.
m/z selected for SIM Corresponding Hg isotopes mode (MeEtHg+)
198 242
199 243
200 244
201 245
202 246
X (m + 1) = 0.034
Analysis of Reference MaterialsMethylmercury was determined in the reference material BCR464 (tuna fish) by the proposed ID procedure. Three indepen-dent spiking experiments were made on each certified refer-ence material and each sample was injected three times inGC-MS systems. The overall results obtained for the refer-ence material by GC-MS are given in Table 3.
Table 3. Determination of Methylmercury in BCR 464 Using the 202/201Isotope Ratio for Quantitation (Data in µg g–1 as Hg)
Replicate Methylmercury
1 5.09 ± 0.06
2 5.02 ± 0.09
3 5.04 ± 0.05
Average 5.05 ± 0.04
RSD (%) 0.71
Certified value 5.12 ± 0.16
The concentration values obtained for methylmercury in thecertified reference material BCR 464 show an excellent agree-ment between the certified and found values.
ConclusionsA precise and accurate method for the determination ofmethylmercury in fish samples has been developed. A singleinjection allows the concentration of methylmercury in thesamples to be computed quickly, without the need for time-consuming calibration, standard addition, or recovery correc-tion procedures. The method corrects for all possible errors inthe speciation of methylmercury, provides low detection lim-its, and is fast and simple to apply by untrained personnel.

www.agilent.com/chem
Agilent shall not be liable for errors contained herein orfor incidental or consequential damages in connectionwith the furnishing, performance, or use of this material.
Information, descriptions, and specifications in this publi-cation are subject to change without notice.
© Agilent Technologies, Inc., 2008Published in the USASeptember 18, 20085989-9725EN
For More InformationFor more information on our products and services, visit our Web site at www.agilent.com/chem.

Analysis of Plant Materials byVaporGeneration AA
Author
Keith G. Brodie
Application Note
Atomic Absorption
Introduction
Arsenic and antimony are widely used in modern industries although they are toxicto both man and animals. Significant levels of these elements can be found through-out our environment in such diverse sources as soils, plants, fish and animals.Selenium, on the other hand, is an essential trace element but can be toxic at higherlevels. The essential role of selenium in animal nutrition was first demonstrated in1957 [1] but man’s requirements are not yet fully defined.
The concentration of these elements in foods is dependent on the soil conditionsand ultimately on the methods of preparation of the food. The levels found in animalproducts is dependent on the plant material or other animal food source.
It is of considerable interest therefore to establish the level of these elements, aswell as other toxic metals, in soils, plants and animal tissues.
Arsenic, antimony and selenium have been determined at very low levels by atomicabsorption for many years, and vapor generation atomic absorption offers the mostsensitive means by which they can be measured.
The results of extensive collaborative studies on acid digestion techniques, andhydride generation AA for the determination of arsenic and selenium in foods havebeen reported [2,3]. Several laboratories were involved in those reports.
Sample digestion procedures have ranged from ashing in a furnace with a magne-sium nitrate solution [4], to hot digestion in acids usually comprising nitric and per-chloric mixtures [5]. Agilent instruments have been used for the vapor generationmeasurement of selenium levels in plant and biological material after suitable aciddigestion [5,6].
Many laboratories are reluctant to use perchloric acid with digestions of organicmaterials because of the potential risks involved [7,8]. For this reason a number ofdigestion procedures have been devised which have eliminated perchloric acid.Sulphuric acid increases the boiling point of an acid digestion mixture and improves

2
The digested mixture was made up to 25 mL to give a finalsolution in 7 M hydrochloric acid. This stock solution was useddirectly for the determination of selenium, but was diluted 1 in10 with 7 M hydrochloric acid for the determination of arsenicand antimony.
Some quantities of powdered orchard leaves were also spikedwith known amounts of arsenic, antimony and these sampleswere taken through the same digestion procedure. A standardadditions calibration was thus established. Replicate sampleswere taken for each. Blank reagents were also prepared.
Samples were prepared in 7 M hydrochloric acid to ensurethat any SeVI formed in the digestion procedure, was reducedto the required SeIV prior to analysis. This treatment is commonly used [5,6,9,10].
The reduction of AsV (or SbV) to AsIII (or SbIII) was achieved bythe inclusion of potassium iodide in the sodium borohydridesolution [9].
Results and Discussion
Figures 1 and 2 show chart recorder traces for the standardadditions measurement of the digests for arsenic and anti-mony respectively. Approximately 40 seconds are required forthe signal to reach an equilibrium value after introduction ofthe sample. Replicate absorbance readings were taken in theplateau region. It is apparent on Figure 2 that a spike appearson completion of the signal, and this is due to a brief intro-duction of air before the next solution is pumped. Such anoccurrence is not uncommon.
Standard additions calibrations for arsenic and antimony arefeatured in Figures 3 and 4 respectively. The meanabsorbance is shown and two values are represented by theerror bars on the Figures.
That the standard additions technique was necessary, isdemonstrated by aqueous calibrations for those elements onthe same graphs. The calibration slopes are clearly different.
Table 1 shows the results obtained for arsenic and antimonyin the orchard leaves. Agreement with the certificate wasgood.
Table 1 NBS Orchard Leaves No. 1571
Element Certificate value µg/g Found* µg/g
As 10 ± 2 11 ± 2
Sb 2.9 ± 0.3 2.7 ± 0.2
* Mean of replicate determinations.
the action of the other oxidizing acids such as nitric. The onlydisadvantage of sulphuric acid is the tendency to form insolu-ble compounds but the presence of nitric acid avoids the pre-cipitation of trace metals with major components of thesample. Digestion mixtures of sulphuric, nitric and hydrogenperoxide have been used successfully for plant materials [7].
The results of the determination of arsenic, antimony andselenium in NBS orchard leaves (No 1571) by the vapor gen-eration technique are reported here. A digestion procedurewas prepared which did not contain perchloric acid.
Instrumentation
An Agilent AA-1475 with background correction and the VGA-76 were used in this study. The background signal was exam-ined for all solutions, but no background was found.Measurements were therefore reported with the backgroundcorrector off. Hollow cathode lamps were operated at the rec-ommended conditions and an Agilent 9176 strip chartrecorder displayed the traces.
For development of this analytical technique samples werepresented manually.
Absorbance mode was used and five 3-second integrationswere taken.
The printer was an HP 82905A model. The reagents used forthe VGA-76 were as follows:
Acid channel Concentrated hydrochloricacid.
Sodium borohydride channel 0.6% NaBH4in 0.5% NaOH and10% KI.
Sample Treatment
NBS orchard leaves (No. 1571) were dried at 80 °C and approxi-mately 0.5 g samples were accurately weighed and preparedfor analysis. The digestion procedure consisted of the additionof 5 mL concentrated sulphuric with swirling in a beaker. A 5mL volume of 30% v/v hydrogen peroxide was added slowlyand the reaction allowed to proceed. This addition of hydrogenperoxide was repeated, and when the reaction had subsided,the digestion mixture was heated on a hot plate.
After cooling, 2 mL of concentrated nitric acid was added andthe mixture heated for about 2 hours to remove excess nitricacid. A further addition of nitric acid with heating may berequired until the solution is a light straw color.

3
Figure 1. Chart recorder traces for the measurement of arsenic in digestedleaves.
Figure 2. Chart recorder traces for the measurement of antimony indigested leaves.
Figure 3. Calibration for the determination of arsenic.
Figure 4. Calibration for the determination of antimony.

www.agilent.com/chem
Agilent shall not be liable for errors contained herein orfor incidental or consequential damages in connectionwith the furnishing, performance, or use of this material.
Information, descriptions, and specifications in this publication are subject to change without notice.
© Agilent Technologies, Inc., 1985Printed in the USANovember 1, 2010AA050
The level of selenium in the leaves was quite low (0.08 µg/gm) and a value of 0.05 was obtained from just onemeasurement by the standard additions technique.
No further study was made on selenium here but details ofextensive work on selenium determination in agriculturalmaterials by the VGA-76 has been recently reported [10].
An alternative digestion procedure was also attempted inwhich nitric and sulphuric acids only were used. The mixturewas heated to remove excess nitric acid and the final solutionwas a light straw color. The recoveries from some samplesanalysed by this procedure were low, and this procedure wasnot pursued further.
Summary
The VGA-76 has been used to determine the amount ofarsenic and antimony in digested orchard leaves. A digestionprocedure was adopted which avoided the use of perchloricacid and it was necessary to use the standard additions cali-bration procedure.
References
1. K. Schwarz and C. Folz, J. Amer. Chem. Soc. 79 3293(1957).
2. M. lnhat and H. Miller, J. AOAC 60 1414 (1977).
3. M. lnhat and B. Thompson, J. AOAC. 63 814 (1980).
4. B. Pahlav an pour, M. Thompson and L. Thorne, Analyst106 1467 (1981).
5. O. Clinton, Analyst 102 187 (1977).
6. R. Mailer and J. Pratley, Analyst 108 1060 (1983).
7. M. Hoenig and R. de Borger, Spectrochim. Acta 38B 873(1983).
8. M. Knight, Argonne Natl. Lab., IL, U.S.A. ANL/LRP-TM-18 1980 pp 31.
9. K. Brodie, B. Frary, B. Sturman and L. Voth, VarianInstruments at Work No. AA-38, March 1984.
10. A. Gelman, Varian Instruments at Work, No. AA-44, Feb.1985.
For More Information
For more information on our products and services, visit ourWeb site at www.agilent.com/chem