solutions to address osmosis and the blistering of liquid
TRANSCRIPT
Elyse A. Henderson,1 Graham Finch,2 and Brian Hubbs1
Solutions to Address Osmosisand the Blistering of LiquidApplied WaterproofingMembranes
Citation
E. A. Henderson, G. Finch, and B. Hubbs, “Solutions to Address Osmosis and the Blistering of
Liquid Applied Waterproofing Membranes,” in Building Science and the Physics of Building
Enclosure Performance, ed. D. J. Lemieux and J. Keegan (West Conshohocken, PA: ASTM
International, 2020), 177–194. http://doi.org/10.1520/STP1617201800853
ABSTRACT
The transport of water through waterproofing membranes over concrete
substrates resulting in water-filled blisters and leaks has been demonstrated by
the authors to be caused by osmosis. Although this issue has now been studied
for more than a decade, there is currently no industry standard to test for the
risk of osmosis in waterproofing membranes. The authors have developed a
protocol to measure the osmotic flow and evaluate the risk of osmotic blistering
in waterproofing membranes including a standardized osmotic flow rate test,
ASTM E96, Standard Test Methods for Water Vapor Transmission of Materials,
inverted wet cup vapor permeance testing, and modified ASTM long-term
absorption testing. This testing protocol has measured osmotic flow rates
and ASTM E96 inverted wet cup vapor permeance for a range of different
waterproofing membrane types. The authors propose that this set of testing
protocols or another proxy test be adopted by ASTM to determine the risk for
osmosis, including thresholds above which a membrane may be deemed “high
risk.” To reduce the potential for osmotic blistering over concrete, it is
recommended that waterproofing membranes used in inverted roofing
Manuscript received October 15, 2018; accepted for publication April 11, 2019.1RDH Building Science Inc., 4333 Still Creek Dr. #400, Burnaby, British Columbia, Canada, V5C 6S6
E. A. H. https://orcid.org/0000-0002-2079-49742RDH Building Science Inc., 740 Hillside Ave. #602, Victoria, British Columbia, Canada, V8T 1Z43ASTM Symposium on Building Science and the Physics of Building Enclosure Performance on October 21–22,
2018 and December 2, 2018 in Washington, DC, USA.
Copyright VC 2020 by ASTM International, 100 Barr Harbor Drive, PO Box C700, West Conshohocken, PA 19428-2959.
BUILDING SCIENCE AND THE PHYSICS OF BUILDING ENCLOSURE PERFORMANCE 177
STP 1617, 2020 / available online at www.astm.org / doi: 10.1520/STP161720180085
assemblies should have an osmotic flow rate near 0.0 g/m2/day when tested
using the proposed protocol, an ASTM E96 inverted wet cup vapor permeance
less than that of the substrate (i.e., less than 0.1 US perms on a concrete slab),
and minimal long-term water absorption uptake. In addition to these thresholds,
the long-term aging effects of the membrane should be determined.
Keywords
waterproofing, membrane, osmosis, absorption, vapor permeance testing
procedure
Introduction
Waterproofing membrane failures due to osmotic blistering have occurred in sometypes of protected membrane/inverted concrete substrate waterproofing and roofingassemblies and have been observed in many parts of the world over the past twodecades. Water blisters have been observed between the waterproof membrane andthe concrete substrate and are often under considerable pressure. These self-contained, pressurized water blisters have no identifiable leakage path through oraround the membrane. Blisters have ranged from millimeters to an entire roof areaand contain significant quantities of water under pressure. Due to the hidden natureof a membrane within an inverted roofing assembly, the issue can go unnoticed forsome time until other, more visible problems result from the large quantities ofwater held by the blisters. For example, large blisters have displaced concretepavers, creating hazardous walking conditions, and water leaks have occurred asthe blisters expand over cracks and joints in the concrete substrate. The issue is notexclusive to horizontal surfaces; blisters have also been observed on vertical applica-tions in planter boxes and water features. Issues have not been observed with mem-branes over steel or wood substrates or in conventional roofing assemblies wherethe membrane typically is exposed or directly applied to insulation or a cover boardsubstrate.
Several years ago, the authors set out to understand the cause of this phenome-non. Hygrothermal analysis shows that vapor diffusion can transport water throughmembranes with relatively high vapor permeance such as asphalt-modified polyure-thane. Even though the membranes that were found to have the most water blistersalso typically had high vapor permeance, the quantity of water found in the blistersis orders of magnitude higher than what can be expected from vapor permeancealone. Additionally, the water vapor pressure differences on either side of the mem-brane are not great enough to explain the high hydrostatic pressure that existsinside the blisters. The hypothesis that was later confirmed with further researchwas that the physical process of osmosis was drawing water through the semiper-meable waterproofing membranes such as asphalt-modified polyurethane.1,2 Thesolute concentration under the membrane (i.e., from the concrete/substrate or fromthe membrane itself) was measured and confirmed to be high enough to generateextremely high osmotic pressure within the blisters—up to 1,500 kPa (15 bar).3
178 STP 1617 On Building Science and the Physics of Building Enclosure Performance

Not all waterproofing membranes are at risk for developing osmotic blisters.For example, blistering has not been observed for hot rubber or styrene butadienestyrene (SBS) membranes, which are very common in this application. Research bythe authors into the systematic failure of asphalt-modified polyurethane water-proofing membranes in the Pacific Northwest has led to the development of a test-ing procedure to estimate the risk for osmotic blistering of various otherwaterproofing membranes. The internally developed testing methodology has beenused to measure osmotic flow through—and risk for osmotic blistering of—dozensof different waterproofing membranes including SBS, hot rubberized asphalt,poly(methyl methacrylate) (PMMA), ethylene propylene diene monomer (EPDM),thermoplastic polyolefin (TPO), high density polyethylene (HDPE), polyurea,asphalt emulsion, asphalt-modified polyurethane, and various other two-component cold-applied membranes. There is currently no industry-wide, stan-dardized test to assess the risk of osmotic blistering of waterproofing membranes.The authors recommend that the testing methodology described in this paper beadopted by the ASTM Committees E06 and D08, including recommended targetmaximums for tested osmotic flow rate, ASTM E96, Standard Test Methods forWater Vapor Transmission of Materials,4 inverted wet cup vapor permeance, and amodified ASTM procedure for long-term water absorption.
WHAT IS OSMOSIS?
The process of osmosis can be described as the flow of a solvent, usually water,across a semipermeable membrane from a solution of low solute concentration to asolution of high solute concentration. This is possible when the membrane separat-ing the two solutions is slightly permeable to water yet impermeable to the solutes.Thus, the water flows across the membrane to balance out the solute concentrationson either side of the membrane, as shown in figure 1.
If the vessel is open such as in the diagram in figure 1, the water level on oneside rises until the hydrostatic pressure equals that of the osmotic pressure asdefined by equation (1):
p ¼ u � C � R � T (1)
where:p = osmotic pressure (bar, SI unit of pressure),
u = osmotic coefficient (unitless, value that characterizes the dissolution of the indi-
vidual salts in solution),
C = concentration of all dissociated solutes (mol/L where mol is the standard unit of
measurement for an amount of substance),
R = universal gas constant (0.083145 L�bar/mol�K), andT = temperature (Kelvin, absolute measure of SI temperature equal to �Cþ273).Osmotic pressure is a colligative property, meaning that the property depends
on the concentration of the solutes and not on their identity. In other words, theosmotic flow across a system with 1.0 M sodium chloride (NaCl) as the solute is the
HENDERSON ET AL., DOI: 10.1520/STP161720180085 179

same as an identical system with 1.0 M potassium iodide (KI) or a 1.0 M mixture ofdissolved solids that come off a concrete slab when water is trapped within a blisterbelow a waterproof membrane. Typical solutes that have been measured in osmoticblisters from inverted roof assemblies include calcium, carbonate, magnesium,potassium, sulfur, and silicon from the concrete substrate and, in many cases,organic compounds from the membranes themselves.3
Methodology
Currently, there is no industry standard to evaluate the osmotic risk of waterproof-ing membranes. The authors have shown in previous research that vapor perme-ance and water absorption are often related to the osmotic flow potential ofwaterproofing membranes.1 As such, the proposed protocol includes both ASTME96 wet cup and inverted wet cup vapor permeance testing and long-term waterabsorption testing in addition to the internally developed osmotic flow rate meth-odology. The proposed osmosis test protocol includes three parts:
1. Osmotic flow rate testing (method developed by the authors)2. Water absorption testing (method adapted from ASTM D570, Standard
Test Method for Water Absorption of Plastics,5 for a longer time frame)3. Vapor permeance testing (by wet cup and inverted wet cup per ASTM E96)
OSMOTIC FLOWRATE TEST
The test methodology to measure osmotic flow rate has been refined by the authorsover the past decade. A solution of 1.0 M NaCl (equivalent to total dissolved solids[TDS] of 58,500 ppm) is placed in a glass container; the test membrane is cut to fitthe top of the container and sealed to separate the salt water inside the container
FIG. 1 Diagram showing the process of osmosis and reverse osmosis. Water flows
across a semipermeable membrane to dilute a high concentration of solutes on
the other side (osmosis) until the hydrostatic head equals the osmotic pressure
(equilibrium). Water can be forced back across the membrane by application of
pressure (reverse osmosis).
180 STP 1617 On Building Science and the Physics of Building Enclosure Performance
from the distilled water in a water bath outside the container. The apparatus isdesigned so the osmotic flow of water from the freshwater side to the saltwater sideis easily measured by the mass increase within the container. The test containersare removed for gravimetric measurements taken at regular intervals, and theosmotic flow of water into the container (g/m2/day) is calculated after some base-line adjustments.
The following procedure was used to measure the osmotic flow rate throughwaterproofing membranes:
1. The samples of membrane are cut into circular discs to fit within a powder-coated, corrosion-resistant, screw-top lid fitting of glass containers. Eachmembrane sample is initially weighed, and the thickness is measured at aminimum of five points to determine an average thickness.
2. A known volume (approximately 80 mL in a 250-mL glass jar) of salt wateris poured into the glass containers. The salt water is typically 1.0 M NaCl,but other salts (to represent specific solute conditions at a site) and varyingconcentrations (to represent different osmotic pressures) may be tested.• Triplicate blank samples (with distilled water, 0.0 M NaCl) and triplicate
test samples (1.0 M NaCl) should be produced for each membrane typebeing tested. Triplicate samples are used as a balance between havingenough samples to see if there are outliers due to jar leaks and fewenough samples to manage in a small lab space and minimize measure-ment time.
3. Two component fast-set epoxy is applied to the perimeter of both sides ofthe cut membrane disk to create a sealed gasket between the lid and mem-brane and the glass container. Once the lid with membrane has been sealedto the container, the system is let to set for 24 h.
4. After the epoxy has cured, the container is leak tested by placing it upsidedown on an absorbent material such as shop towel for 24 h, and checkingthe absorbent material for signs of water, which may indicate a slow leakthrough the epoxy seal. Samples that show signs of leakage should berejected from the test.
5. The initial mass of the container, membrane, and salt water together is mea-sured using a scale with at least 0.01 g precision.
6. A freshwater bath is prepared using distilled water, and the samples areplaced inverted on a rack in the bath to allow for fresh water under the con-tainers where the membrane is located.• The water bath should be filled to a level so that the waterline is approxi-
mately level with the internal waterline of the inverted sample containersto eliminate the effect of hydrostatic water head on the samples.
7. At regular intervals (typically weekly), the containers and blank samples areremoved from the freshwater bath, dried thoroughly using a durable andabsorbent material such as a shop towel, and weighed using a scale with
HENDERSON ET AL., DOI: 10.1520/STP161720180085 181
0.01 g precision. This process is repeated approximately once a week for sev-eral months.
8. Throughout the experiment, the TDS levels in the water bath are monitoredregularly using a TDS meter, and water is changed when the TDS is elevatedabove 10 ppm, or approximately every two weeks, to maintain fresh wateroutside the sample containers.
9. The flow of water through the membrane is estimated by subtracting themass of the initial container from each of the measurements throughout theexperiment. There are also baseline corrections that may be carried out (i.e.,sample containers with distilled water). Pros and cons of each baseline cor-rection option are discussed later in this paper.
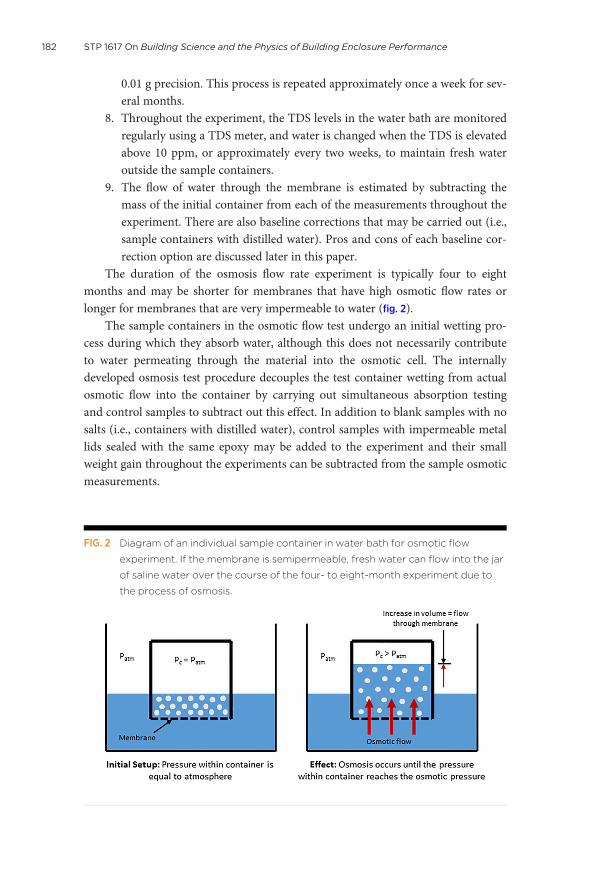
The duration of the osmosis flow rate experiment is typically four to eightmonths and may be shorter for membranes that have high osmotic flow rates orlonger for membranes that are very impermeable to water (fig. 2).
The sample containers in the osmotic flow test undergo an initial wetting pro-cess during which they absorb water, although this does not necessarily contributeto water permeating through the material into the osmotic cell. The internallydeveloped osmosis test procedure decouples the test container wetting from actualosmotic flow into the container by carrying out simultaneous absorption testingand control samples to subtract out this effect. In addition to blank samples with nosalts (i.e., containers with distilled water), control samples with impermeable metallids sealed with the same epoxy may be added to the experiment and their smallweight gain throughout the experiments can be subtracted from the sample osmoticmeasurements.
FIG. 2 Diagram of an individual sample container in water bath for osmotic flow
experiment. If the membrane is semipermeable, fresh water can flow into the jar
of saline water over the course of the four- to eight-month experiment due to
the process of osmosis.
182 STP 1617 On Building Science and the Physics of Building Enclosure Performance
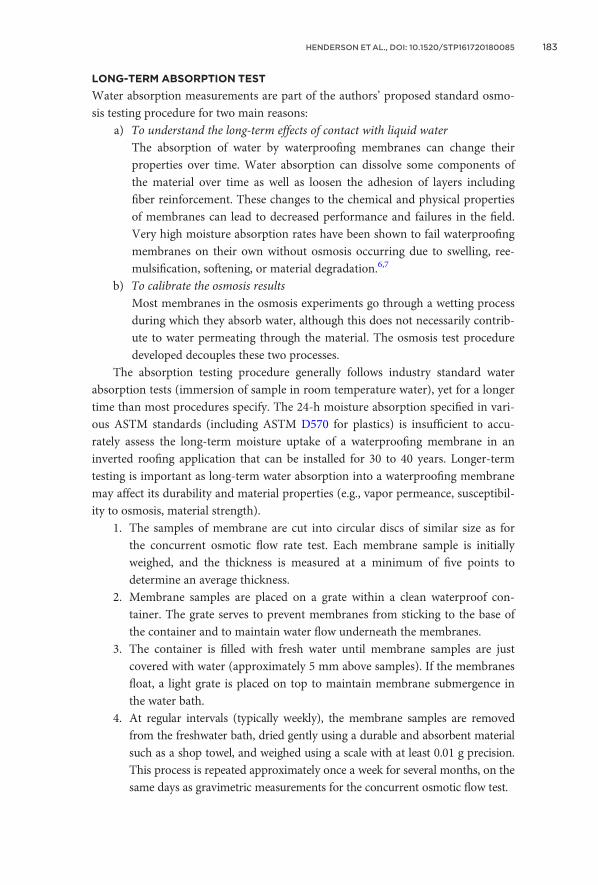
LONG-TERM ABSORPTION TEST
Water absorption measurements are part of the authors’ proposed standard osmo-sis testing procedure for two main reasons:
a) To understand the long-term effects of contact with liquid waterThe absorption of water by waterproofing membranes can change theirproperties over time. Water absorption can dissolve some components ofthe material over time as well as loosen the adhesion of layers includingfiber reinforcement. These changes to the chemical and physical propertiesof membranes can lead to decreased performance and failures in the field.Very high moisture absorption rates have been shown to fail waterproofingmembranes on their own without osmosis occurring due to swelling, ree-mulsification, softening, or material degradation.6,7
b) To calibrate the osmosis resultsMost membranes in the osmosis experiments go through a wetting processduring which they absorb water, although this does not necessarily contrib-ute to water permeating through the material. The osmosis test proceduredeveloped decouples these two processes.
The absorption testing procedure generally follows industry standard waterabsorption tests (immersion of sample in room temperature water), yet for a longertime than most procedures specify. The 24-h moisture absorption specified in vari-ous ASTM standards (including ASTM D570 for plastics) is insufficient to accu-rately assess the long-term moisture uptake of a waterproofing membrane in aninverted roofing application that can be installed for 30 to 40 years. Longer-termtesting is important as long-term water absorption into a waterproofing membranemay affect its durability and material properties (e.g., vapor permeance, susceptibil-ity to osmosis, material strength).
1. The samples of membrane are cut into circular discs of similar size as forthe concurrent osmotic flow rate test. Each membrane sample is initiallyweighed, and the thickness is measured at a minimum of five points todetermine an average thickness.
2. Membrane samples are placed on a grate within a clean waterproof con-tainer. The grate serves to prevent membranes from sticking to the base ofthe container and to maintain water flow underneath the membranes.
3. The container is filled with fresh water until membrane samples are justcovered with water (approximately 5 mm above samples). If the membranesfloat, a light grate is placed on top to maintain membrane submergence inthe water bath.
4. At regular intervals (typically weekly), the membrane samples are removedfrom the freshwater bath, dried gently using a durable and absorbent materialsuch as a shop towel, and weighed using a scale with at least 0.01 g precision.This process is repeated approximately once a week for several months, on thesame days as gravimetric measurements for the concurrent osmotic flow test.
HENDERSON ET AL., DOI: 10.1520/STP161720180085 183
As part of the proposed standard osmosis testing protocol, the water uptakeand moisture content of a membrane is measured for the duration of the concur-rent osmotic flow rate test, typically four to eight months.
VAPOR PERMEANCE TEST
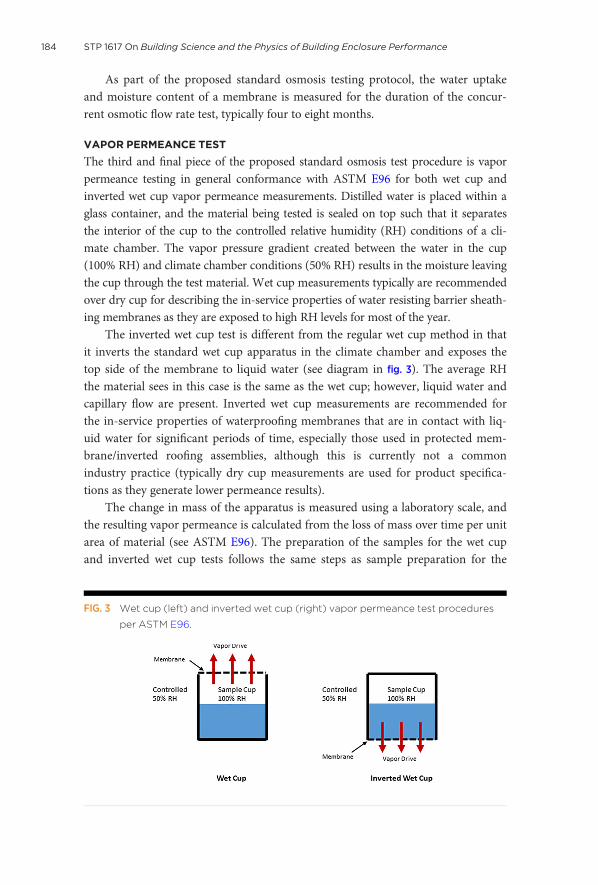
The third and final piece of the proposed standard osmosis test procedure is vaporpermeance testing in general conformance with ASTM E96 for both wet cup andinverted wet cup vapor permeance measurements. Distilled water is placed within aglass container, and the material being tested is sealed on top such that it separatesthe interior of the cup to the controlled relative humidity (RH) conditions of a cli-mate chamber. The vapor pressure gradient created between the water in the cup(100% RH) and climate chamber conditions (50% RH) results in the moisture leavingthe cup through the test material. Wet cup measurements typically are recommendedover dry cup for describing the in-service properties of water resisting barrier sheath-ing membranes as they are exposed to high RH levels for most of the year.
The inverted wet cup test is different from the regular wet cup method in thatit inverts the standard wet cup apparatus in the climate chamber and exposes thetop side of the membrane to liquid water (see diagram in fig. 3). The average RHthe material sees in this case is the same as the wet cup; however, liquid water andcapillary flow are present. Inverted wet cup measurements are recommended forthe in-service properties of waterproofing membranes that are in contact with liq-uid water for significant periods of time, especially those used in protected mem-brane/inverted roofing assemblies, although this is currently not a commonindustry practice (typically dry cup measurements are used for product specifica-tions as they generate lower permeance results).
The change in mass of the apparatus is measured using a laboratory scale, andthe resulting vapor permeance is calculated from the loss of mass over time per unitarea of material (see ASTM E96). The preparation of the samples for the wet cupand inverted wet cup tests follows the same steps as sample preparation for the
FIG. 3 Wet cup (left) and inverted wet cup (right) vapor permeance test procedures
per ASTM E96.
184 STP 1617 On Building Science and the Physics of Building Enclosure Performance
osmosis measurements, although the water inside the containers is distilled waterinstead of salt water as in the case of the osmosis test samples.
Results and Discussion
OSMOSIS PROTOCOL TESTING RESULTS
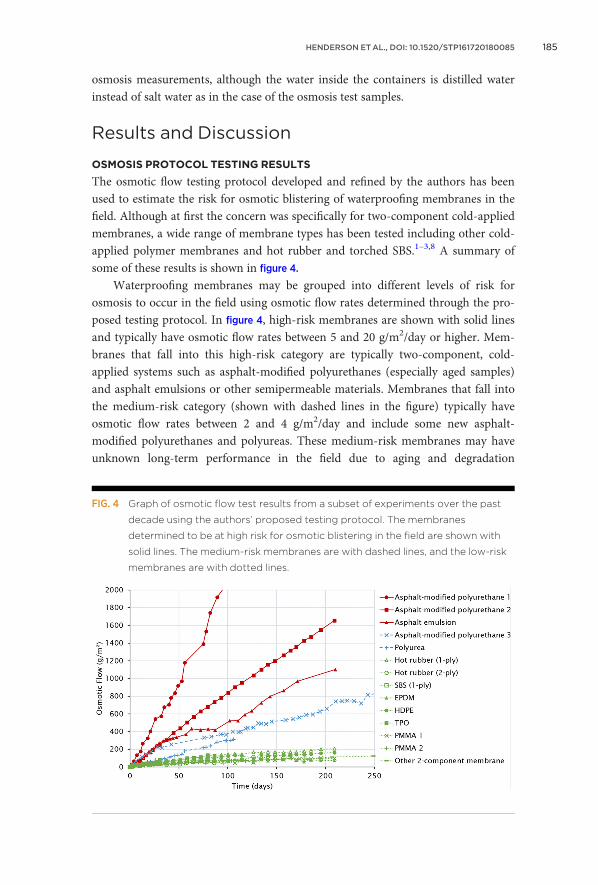
The osmotic flow testing protocol developed and refined by the authors has beenused to estimate the risk for osmotic blistering of waterproofing membranes in thefield. Although at first the concern was specifically for two-component cold-appliedmembranes, a wide range of membrane types has been tested including other cold-applied polymer membranes and hot rubber and torched SBS.1–3,8 A summary ofsome of these results is shown in figure 4.
Waterproofing membranes may be grouped into different levels of risk forosmosis to occur in the field using osmotic flow rates determined through the pro-posed testing protocol. In figure 4, high-risk membranes are shown with solid linesand typically have osmotic flow rates between 5 and 20 g/m2/day or higher. Mem-branes that fall into this high-risk category are typically two-component, cold-applied systems such as asphalt-modified polyurethanes (especially aged samples)and asphalt emulsions or other semipermeable materials. Membranes that fall intothe medium-risk category (shown with dashed lines in the figure) typically haveosmotic flow rates between 2 and 4 g/m2/day and include some new asphalt-modified polyurethanes and polyureas. These medium-risk membranes may haveunknown long-term performance in the field due to aging and degradation
FIG. 4 Graph of osmotic flow test results from a subset of experiments over the past
decade using the authors’ proposed testing protocol. The membranes
determined to be at high risk for osmotic blistering in the field are shown with
solid lines. The medium-risk membranes are with dashed lines, and the low-risk
membranes are with dotted lines.
HENDERSON ET AL., DOI: 10.1520/STP161720180085 185

(discussed later). Membranes that typically test near 0.06 1.0 g/m2/day are deemedto be low risk and have not been known to exhibit osmotic blistering in the field(shown with dotted lines in the figure). These low-risk membranes include hot rub-ber, SBS, PMMA,* EPDM, TPO, and HDPE sheet (60 mil).
To minimize the risk for osmotic blistering in the field, the authors proposethat a testing protocol such as the one presented in this paper be adopted by ASTMfor waterproofing membranes. It is recommended that an osmotic flow rate—testedusing this methodology—not exceed 0.06 1.0 g/m2/day for a membrane to be con-sidered low risk and acceptable for application in areas with high moisture andwater exposure such as inverted or protected roof assemblies.
VAPOR PERMEANCE ANDMEMBRANE AGING
The past decade of osmosis testing by the authors has revealed some trends regard-ing which membranes perform better or worse in the osmotic flow rate test. Twokey membrane characteristics have been linked to high osmotic flow rates: vaporpermeance and aging.
At first, a trend with membrane thickness was discovered, though with furtherexperiments it became clear that the correlation of membrane thickness withosmotic flow rate was in fact linked to the difference in vapor permeance. Thickermembranes generally have lower vapor permeance. Since the process of osmosishinges on the permeability of the membrane for water transport, this result furthercorroborates the findings that water-filled blisters are due to osmosis. Graphs show-ing the correlation of osmotic flow rate with both membrane thickness and mem-brane permeance are provided in figure 5 and figure 6. A more consistent correlationwith permeance (rather than with thickness) is observed.
The trend of higher osmotic flow rate for membranes with higher vapor perme-ance makes sense because the process of osmosis depends on the membrane beingsemipermeable to water yet impermeable to dissolved solids (e.g., salts, organiccompounds). The higher the permeance of the membrane, the more easily watermay be transported across it.
Another key finding from the osmosis testing by the authors is the uncertainty inperformance of aged membranes. Figure 7 shows the osmotic flow rates and vaporpermeance of three sets of asphalt-modified polyurethane membranes. As seen in fig-
ure 7, both aged membranes (shown in triangles) perform worse than the lab-curednew membrane (shown in open diamonds), which indicates membrane degradationand increase in vapor permeance of the membranes over time. These results illustratethat a new membrane may perform adequately in testing, although a membrane thathas been installed in the field for five to ten years (i.e., from Sites 1 and 2 in the figure)may have significantly different properties. Even between two sites, from whichasphalt-modified polyurethane membrane is recovered and tested, results can vary
*Although PMMA membranes are listed as low risk in these osmotic flow rate results, some PMMA membranes
have been tested to have high long-term water absorption and may have unknown long-term aging impacts.
186 STP 1617 On Building Science and the Physics of Building Enclosure Performance

FIG. 5 Osmotic flow rate determined by the testing protocol developed by the authors
versus membrane thickness. High-, medium-, and low-risk membranes are
shown with triangles, circles, and squares, respectively. The correlation between
thinner membranes and higher osmotic flow rates is further explained by the
difference in membrane permeance as shown in figure 6.
FIG. 6 Osmotic flow rate determined by the testing protocol developed by the authors
versus vapor permeance determined through inverted wet cup testing per
ASTM E96. High-, medium-, and low-risk membranes are shown with triangles,
circles, and squares, respectively.
HENDERSON ET AL., DOI: 10.1520/STP161720180085 187
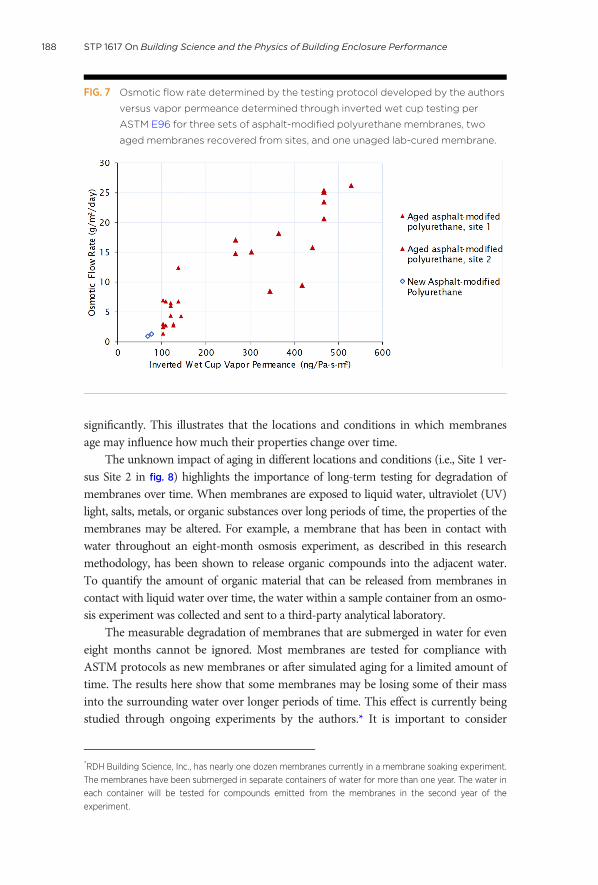
significantly. This illustrates that the locations and conditions in which membranesage may influence how much their properties change over time.
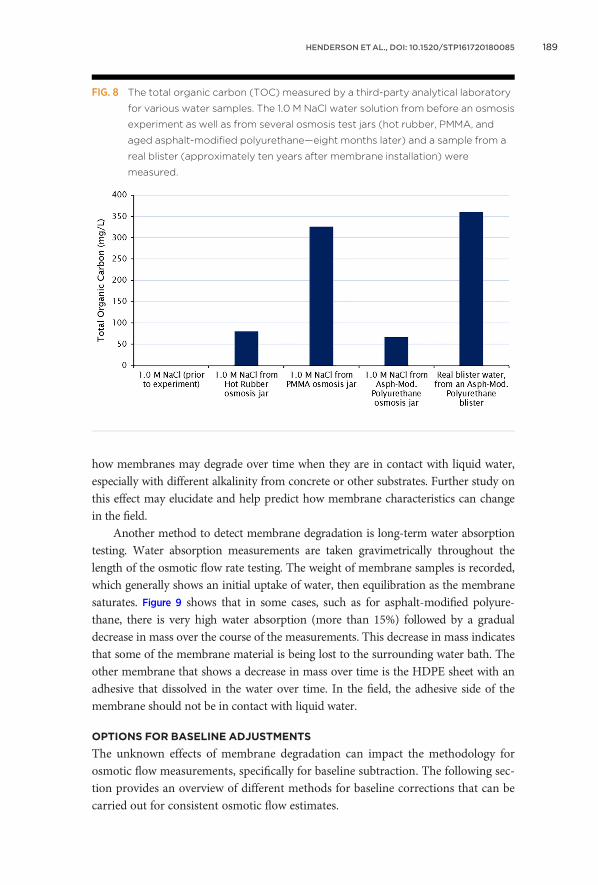
The unknown impact of aging in different locations and conditions (i.e., Site 1 ver-sus Site 2 in fig. 8) highlights the importance of long-term testing for degradation ofmembranes over time. When membranes are exposed to liquid water, ultraviolet (UV)light, salts, metals, or organic substances over long periods of time, the properties of themembranes may be altered. For example, a membrane that has been in contact withwater throughout an eight-month osmosis experiment, as described in this researchmethodology, has been shown to release organic compounds into the adjacent water.To quantify the amount of organic material that can be released from membranes incontact with liquid water over time, the water within a sample container from an osmo-sis experiment was collected and sent to a third-party analytical laboratory.
The measurable degradation of membranes that are submerged in water for eveneight months cannot be ignored. Most membranes are tested for compliance withASTM protocols as new membranes or after simulated aging for a limited amount oftime. The results here show that some membranes may be losing some of their massinto the surrounding water over longer periods of time. This effect is currently beingstudied through ongoing experiments by the authors.* It is important to consider
FIG. 7 Osmotic flow rate determined by the testing protocol developed by the authors
versus vapor permeance determined through inverted wet cup testing per
ASTM E96 for three sets of asphalt-modified polyurethane membranes, two
aged membranes recovered from sites, and one unaged lab-cured membrane.
*RDH Building Science, Inc., has nearly one dozen membranes currently in a membrane soaking experiment.
The membranes have been submerged in separate containers of water for more than one year. The water in
each container will be tested for compounds emitted from the membranes in the second year of the
experiment.
188 STP 1617 On Building Science and the Physics of Building Enclosure Performance
how membranes may degrade over time when they are in contact with liquid water,especially with different alkalinity from concrete or other substrates. Further study onthis effect may elucidate and help predict how membrane characteristics can changein the field.
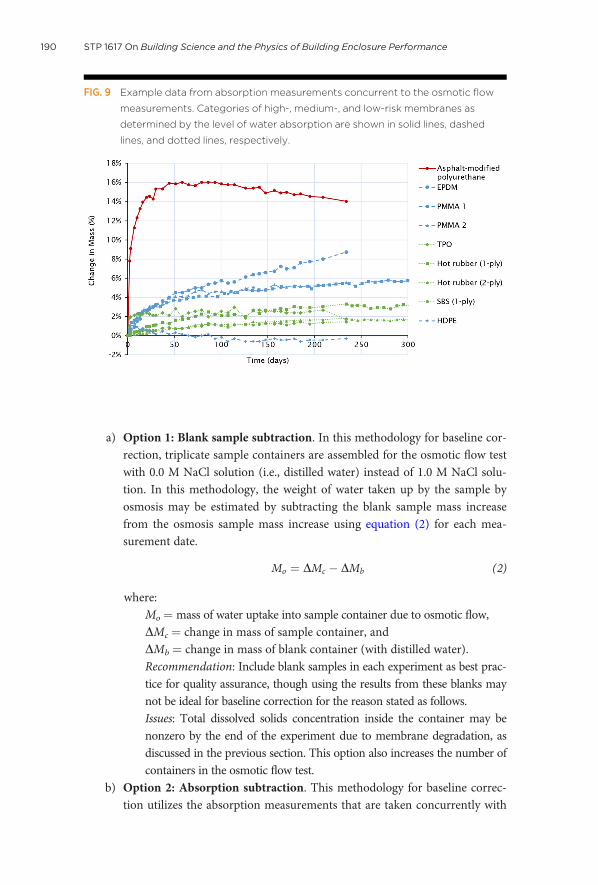
Another method to detect membrane degradation is long-term water absorptiontesting. Water absorption measurements are taken gravimetrically throughout thelength of the osmotic flow rate testing. The weight of membrane samples is recorded,which generally shows an initial uptake of water, then equilibration as the membranesaturates. Figure 9 shows that in some cases, such as for asphalt-modified polyure-thane, there is very high water absorption (more than 15%) followed by a gradualdecrease in mass over the course of the measurements. This decrease in mass indicatesthat some of the membrane material is being lost to the surrounding water bath. Theother membrane that shows a decrease in mass over time is the HDPE sheet with anadhesive that dissolved in the water over time. In the field, the adhesive side of themembrane should not be in contact with liquid water.
OPTIONS FOR BASELINE ADJUSTMENTS
The unknown effects of membrane degradation can impact the methodology forosmotic flow measurements, specifically for baseline subtraction. The following sec-tion provides an overview of different methods for baseline corrections that can becarried out for consistent osmotic flow estimates.
FIG. 8 The total organic carbon (TOC) measured by a third-party analytical laboratory
for various water samples. The 1.0 M NaCl water solution from before an osmosis
experiment as well as from several osmosis test jars (hot rubber, PMMA, and
aged asphalt-modified polyurethane—eight months later) and a sample from a
real blister (approximately ten years after membrane installation) were
measured.
HENDERSON ET AL., DOI: 10.1520/STP161720180085 189
a) Option 1: Blank sample subtraction. In this methodology for baseline cor-rection, triplicate sample containers are assembled for the osmotic flow testwith 0.0 M NaCl solution (i.e., distilled water) instead of 1.0 M NaCl solu-tion. In this methodology, the weight of water taken up by the sample byosmosis may be estimated by subtracting the blank sample mass increasefrom the osmosis sample mass increase using equation (2) for each mea-surement date.
Mo ¼ DMc � DMb (2)
where:Mo¼ mass of water uptake into sample container due to osmotic flow,DMc ¼ change in mass of sample container, andDMb ¼ change in mass of blank container (with distilled water).Recommendation: Include blank samples in each experiment as best prac-tice for quality assurance, though using the results from these blanks maynot be ideal for baseline correction for the reason stated as follows.Issues: Total dissolved solids concentration inside the container may benonzero by the end of the experiment due to membrane degradation, asdiscussed in the previous section. This option also increases the number ofcontainers in the osmotic flow test.
b) Option 2: Absorption subtraction. This methodology for baseline correc-tion utilizes the absorption measurements that are taken concurrently with
FIG. 9 Example data from absorption measurements concurrent to the osmotic flow
measurements. Categories of high-, medium-, and low-risk membranes as
determined by the level of water absorption are shown in solid lines, dashed
lines, and dotted lines, respectively.
190 STP 1617 On Building Science and the Physics of Building Enclosure Performance
the osmotic flow rate testing. If absorption measurements are not taken onthe same days as the gravimetric analysis for osmosis, the absorption meas-urements may be used to create a best-fit curve and estimate absorption atother dates to match the osmosis analysis. The amount of water absorptionmay be subtracted from the gravimetric measurements of the osmosis sam-ple jars using equation (3) for each measurement date.
Mo ¼ DMc � %H2O �Mm � fð Þ (3)
where:Mo¼ mass of water uptake into sample container due to osmotic flow,DMc¼ change in mass of sample container,%H2O ¼ percent of change in mass determined by water absorptionmeasurements,Mm ¼ mass of membrane sample, andf ¼ a factor, typically near 0.25, to account for less water absorption bythe membrane once it is sealed in the sample container compared towhat it experiences in the water bath for absorption measurements(because water absorption from only one side and not the edges willimpact the weight of the sample container).Recommendation: This baseline correction is adequate for membranesthat exhibit high osmotic flow (i.e., 5 to 20 g/m2/day or higher). In allcases, absorption measurements should be used to gauge when waterabsorption has equilibrated, at which point the osmotic flow can be deter-mined from the slope of the gravimetric analysis from the osmosis test.Issues: Membranes with very low or no osmotic flow have lower signal-to-noise ratios, which reveals a need for further baseline correction toremove the initial wetting impact of the sample container and epoxy(see Option 3).
c) Option 3: Epoxy blank subtraction. This baseline correction methodologyuses triplicate control samples with impermeable lids in place of the mem-branes being tested. Gravimetric measurements of these controls reveal aslight weight increase over time of the sample containers even when nomembrane is present, indicating that the epoxy had a minor water absorp-tion that needs to be accounted for in cases of low signal-to-noise ratios.The amount of weight increase from water absorption of the epoxy blankmay be subtracted from the gravimetric measurements of the osmosis sam-ples using equation (4) for each measurement date.
Mo ¼ DMc � DMe (4)
And, optionally, with additional membrane absorption subtraction, usingequation (5):
Mo ¼ DMc � DMe � %H2O �Mm � fð Þ (5)
HENDERSON ET AL., DOI: 10.1520/STP161720180085 191
where:Mo ¼ mass of water uptake into sample container due to osmotic flow,DMc ¼ change in mass of sample container,DMe ¼ change in mass of epoxy blank container,%H2O ¼ percent change in mass determined by water absorptionmeasurements,Mm ¼ mass of membrane sample, andf ¼ a factor, typically near 0.25, to account for less water absorption bythe membrane once it is sealed in the sample container compared towhat it experiences in the water bath for absorption measurements(because water absorption from only one side and not the edges willimpact the weight of the sample container).Recommendation: This baseline correction is adequate for most mem-brane types, though the additional samples and analysis may not be nec-essary for membranes with high osmotic flow rates (i.e., 5 to 20 g/m2/dayor higher).Issues: This option increases the number of sample containers that areincluded in the methodology. Care must be taken to not overcorrectwith compounding the epoxy blank and the membrane absorptionsubtraction—a low f factor may be used in the absorption subtractionto minimize this.
Each of these baseline adjustment options has its pros and cons. Having an esti-mate for how high the expected osmotic flow rate will be can help in choosing anappropriate baseline correction option. Because the database of osmotic flow risk fordifferent membrane types is currently being developed, it may not always be possibleto estimate a risk for osmosis prior to conducting the osmotic flow test. As such, it maybe useful to develop a simpler proxy to estimate osmotic risk prior to a long experi-ment, such as using vapor permeance as an indicator of approximate osmotic risk.
USING A PROXY FOR OSMOTIC RISK
One recommendation for estimating the risk level for osmosis is to consider theinverted wet cup vapor permeance of a membrane. As discussed in this paper, thereis a correlation between vapor permeance and osmotic flow rate due to the depen-dence of osmosis on membrane permeability to water and not solutes.
For vapor permeance to be used as a proxy metric for osmotic risk, the authorsrecommend that inverted wet cup testing be required for waterproofing materials.It is currently common industry practice to report vapor permeance testing usingthe dry cup protocol and—at times—the wet cup protocol; yet, the inverted wet cupprotocol in ASTM E96 is very rarely used. This inverted wet cup methodologyreports measurably higher vapor permeance than dry cup testing because it includesconditions for capillary flow and is more representative of the environment inwhich waterproofing membranes are installed in situations such as protected/inverted roof assemblies.
192 STP 1617 On Building Science and the Physics of Building Enclosure Performance
Conclusion
Currently, there is no industry standard to test for the risk of osmosis in water-proofing membranes. The authors have developed a protocol to measure theosmotic flow and evaluate the risk of osmotic blistering in waterproofing mem-branes including an osmotic flow rate test, inverted wet cup vapor permeance test-ing, and long-term absorption testing.
This paper summarizes the results from a decade of osmosis testing for variouswaterproofing membranes. It is recommended that the osmotic testing protocoldeveloped by the authors be adopted by ASTM as a standardized approach to esti-mate osmotic risk.
Ongoing osmotic testing is continuing to help develop a database of test resultsfor different membrane types. The authors are also further investigating the degra-dation of membranes after long-term exposure to liquid water. Nearly one dozenmembranes are currently in a membrane soaking experiment. These membraneshave been submerged in separate containers of water for more than year. The waterin each container will be tested for compounds emitted from the membranes in thesecond year of the experiment to better understand how the membrane propertiesmay be changing over time.
It is also recommended that accelerated aging testing be considered to betterunderstand how membranes perform after years on sites. Additional analysis ofmembranes after soaking in water with different alkalinity (or in contact with con-crete) is important to understand membrane characteristics in the field, includingrisk for osmosis. Further testing should be carried out on aged versions of mem-branes as a comparison to the new, lab-cured samples to identify potential changesin properties such as vapor permeance or osmotic flow rate.
DEVELOPING A STANDARDIZED APPROACH
The testing protocol described herein has been used to measure osmotic flow ratesranging from near zero to more than 20 g/m2/day for more than a dozen differentwaterproofing membrane types. In addition to recommending that this protocol beadopted by ASTM, the authors propose to establish thresholds above which a mem-brane may be deemed high risk. To reduce the potential for osmotic blistering overconcrete, the authors recommend that a low-risk waterproofing membrane for usein inverted roofing assemblies should have an osmotic flow rate near 0.0 g/m2/daywhen tested using the proposed protocol (6 1.0 to account for experimental error).Additionally, the inverted wet cup vapor permeance should be less than that of thesubstrate (i.e., less than 0.1 US perms on a concrete slab), and the long-term waterabsorption should plateau around 5% or less.
In addition to the standardization of this osmotic testing protocol, the authorsrecommend that inverted wet cup vapor permeance testing be required for water-proofing membranes that are used in inverted roof assemblies. This test is morerepresentative of the conditions that these membranes experience in the field.
HENDERSON ET AL., DOI: 10.1520/STP161720180085 193
The results from this test may also be used as an interim proxy to estimate the riskof osmosis because it has been determined that the inverted wet cup vapor perme-ance and osmotic flow rate are correlated.
References
1. B. Hubbs, G. Finch, and R. Bombino, “Osmosis and the Blistering of Polyurethane Water-
proofing Membranes” (paper presentation, Twelfth Conference on Building Science and
Technology, Montreal, Quebec, Canada, May 6–8, 2009).
2. G. Finch, B. Hubbs, and R. Bombino, “Moisture Transport by Osmotic Flow through
Waterproofing Membranes—Toward the Development of Osmosis-Resistant Mem-
branes,” in Proceedings of the ASHRAE Conference on Buildings XI (Atlanta, GA: ASH-
RAE, 2010).
3. E. Henderson, G. Finch, and B. Hubbs, “Solutions to Address Osmosis and the Blistering
of Liquid Applied Waterproofing Membranes” (paper presentation, Fifteenth Canadian
Conference on Building Science and Technology, Vancouver, British Columbia, Canada,
November 6–8, 2017).
4. Standard Test Methods for Water Vapor Transmission of Materials, ASTM E96/E96M-16
(West Conshohocken, PA: ASTM International, approved March 1, 2016), http://doi.org/
10.1520/E0096_E0096M-16
5. Standard Test Method for Water Absorption of Plastics, ASTM D570-98(2018) (West
Conshohocken, PA: ASTM International, approved August 1, 2018), http://doi.org/
10.1520/D0570-98R18
6. X. F. Yang, C. Vang, D. E. Tallman, G. P. Bierwagen, S. G. Croll, and S. Rohlik, “Weathering
Degradation of Polyurethane Coating,” Polymer Degradation and Stability 74, no. 2
(2001): 341–351.
7. G. T. Howard, “Biodegradation of Polyurethane: A Review,” International Biodeteriora-
tion and Biodegradation 49, no. 4 (2002): 245–252.
8. G. Finch, “Osmosis: The Bane of Liquid Applied Waterproofing Membranes” (slide pre-
sentation, Westford Symposium Summer Camp 2014, Westford, MA, August 6, 2014).
194 STP 1617 On Building Science and the Physics of Building Enclosure Performance
Copyright by ASTM Int’l (all rights reserved); Mon Jun 8Downloaded/printed byElyse A. Henderson (RDH Building Science Inc., British Columbia, Canada)Pursuant to License Agreement. No further reproduction authorized.