solvency and financial condition report - scor… · solvency and financial condition report scor...
TRANSCRIPT
2016
SOLVENCY AND FINANCIAL CONDITION REPORTSCOR GROUP, SCOR SE, SGP&C SE AND SGL SE
CONTENTS
#EXECUTIVE SUMMARY
page 2
#ABUSINESS AND PERFORMANCE
page 9
A.1. Business 10
A.2. Underwriting performance 20
A.3. Investment performance 27
A.4. Performance of other activities 35
A.5. Any other information 35
#BSYSTEM OF GOVERNANCE
page 36
B.1. General information on the system of governance 38
B.2. Fit and proper requirements 54
B.3. Risk management system including the Own Risk and Solvency Assessment (ORSA) 57
B.4. Internal control system 63
B.5. Internal Audit 66
B.6. Actuarial function 67
B.7. Outsourcing 68
B.8. Other material information regarding the system of governance 71
#CRISK PROFILE
page 72
C.1. Introduction 74
C.2. Underwriting risks 75
C.3. Market risks 86
C.4. Credit risk 90
C.5. Liquidity risks 93
C.6. Operational risks 95
C.7. Other material risks 98
C.8. Any other information 105
#DVALUATION FOR
SOLVENCY PURPOSES page 106
D.1. Assets 109
D.2. Technical provisions 129
D.3. Other liabilities 146
D.4. Alternative methods for valuation 158
D.5. Any other information 159
#ECAPITAL MANAGEMENT
page 160
E.1. SCOR Group 162
E.2. SCOR SE 171
E.3. SGP&C SE 174
E.4. SGL SE 178
#APPENDICES
page 182
APPENDIX A SCOR Group Public disclosure QRTS 182
APPENDIX B SCOR SE public disclosure QRTS 202
APPENDIX C SGP&C SE public disclosure QRTS 218
APPENDIX D SGL SE public disclosure QRTS 231
SOLVENCY AND FINANCIAL
CONDITION REPORTSCOR GROUP, SCOR SE, SGP&C SE AND SGL SE
A European Company with share capital of EUR 1,516,589,466.80Registered Office: 5 avenue Kléber - 75016 Paris
Trade and Company register (RCS) Paris No. 562 033 357
1
2016
2016 / Solvency and financial condition report – SCOR Group, SCOR SE, SGP&C SE and SGL SE /
2 / Solvency and financial condition report – SCOR Group, SCOR SE, SGP&C SE and SGL SE / 2016
EXECUTIVE SUMMARY#
EXECUTIVE SUMMARY
INTRODUCTION
This document, the Solvency and Financial Condition Report (SFCR) for SCOR Group, SCOR SE, SCOR Global Life SE and SCOR Global P&C SE, presents information on SCOR and its solvency position as at December 31, 2016 and has been prepared in accordance with Solvency II regulations (Solvency II Directive 2009/138/EC of the European Parliament of November 25, 2009, the Delegated Regulations of the European Commission of October 10, 2014 supplementing the Directive and the EIOPA Guidelines on Reporting and Public Disclosure EIOPA-BoS-15/109). SFCR appendices include key financial information in the standard format of Solvency II public Quantitative Reporting Templates.
This report covers the consolidated SCOR Group as a whole (SCOR SE and all its branches and subsidiaries), as well as additional information specific to each of the following regulated reinsurance undertakings based in France (further referred to as regulated entities):
●● SCOR SE;
●● SCOR Global Life SE (further referred to as SGL SE);
●● SCOR Global P&C SE (further referred to as SGP&C SE).
The following two subsidiaries of SCOR SE, which are also European Economic Area (EEA) regulated reinsurance undertakings, have published separate Solvency and Financial Condition Reports:
●● SCOR Global Life Reinsurance Ireland Limited (further referred to as SGLRI);
●● SCOR UK Company Limited (further referred to as SCOR UK).
The SFCRs of SCOR Group and its EEA regulated entities are available at www.scor.com and have also been submitted to the relevant supervisory authorities.
The Solvency and Financial Condition Report includes the following chapters, which are summarized below:
A. Business and performance
B. System of governance
C. Risk profile
D. Valuation for solvency purposes
E. Capital management
Within the narratives and the tables of the executive summary and the narratives of the rest of this report, the figures have been presented in millions of currency units to improve readability. Tables containing figures in the rest of this report are presented in thousands of currency units in accordance with the Delegated Regulations. This report is available in English and French.
References to additional details included in the following publicly available documents have been made throughout the report:
●● 2016 Document de Référence – the Registration Document of SCOR SE, including the consolidated financial statements of SCOR Group and unconsolidated corporate financial statements of SCOR SE (États financiers non consolidés de SCOR SE), filed with the French financial markets authority (Autorité des marchés financiers – AMF) and available on SCOR’s website scor.com/Investors/Financial Reporting/Annual&Interim Reports (further referred to as the 2016 Registration Document);
●● Comptes annuels de SCOR Global Life SE 31 décembre 2016 – further referred to as the 2016 Financial Statements of SGL SE available on the website www.infogreffe.fr;
●● Comptes annuels de SCOR Global P&C SE 31 décembre 2016 – further referred to as the 2016 Financial Statements of SGP&C SE and available on the website www.infogreffe.fr;
●● SCOR’s three-year strategic plan, “Vision in Action“ covering the period mid-2016 to mid-2019 available at www.scor.com/en/the-group/strategy/vision-in-action.html.
SCOR GROUP
Business and Performance
SCOR SE and its consolidated subsidiaries (“SCOR“ or the “Group“), form the world’s fourth largest reinsurer(1) serving more than 4,000 clients from its four organizational Hubs (the “Hubs“) located in Paris/London and Zurich/Cologne for Europe, Singapore for Asia and New York/Charlotte/Kansas City for the Americas.
The Group is a three engine group driven by SCOR Global Life, SCOR Global P&C and SCOR Global Investments. The Group’s organizational choices were guided by the principles of mobilization of skills and expertise, operating efficiency, structural simplicity, clear reporting lines and balance amongst teams from the Group’s different entities.
SCOR Global P&C, the Group’s Non-Life division, operates worldwide through the branches of two main global reinsurance companies (SCOR Global P&C SE and SCOR SE) and the branches of a global insurance company (SCOR UK Limited) as well as insurance and reinsurance subsidiaries.
SCOR Global Life, the Group’s Life division, operates worldwide through the branches of two main global reinsurance companies (SCOR Global Life SE and SCOR SE) as well as insurance, reinsurance, distribution and distribution solutions subsidiaries.
(1) By net reinsurance premiums written, source: “AM Best Special Report Global Reinsurance 2016“.
EXECUTIVE SUMMARY
32016 / Solvency and financial condition report – SCOR Group, SCOR SE, SGP&C SE and SGL SE /
EXECUTIVE SUMMARY #
SCOR Global Investments, the third division of the Group, manages the investment portfolio of the Group’s legal entities.
SCOR Group is regulated by the “Solvency II“ European Directive which applies since January 1, 2016, having been transposed into French law on April 2, 2015 through the ordinance No. 2015-378 and related decree (No. 2015-513, May 7, 2015) and order (of May 7, 2015).
SCOR Group is subject to supervision by the French insurance regulator (Autorité de Contrôle Prudentiel et de Résolution – ACPR), which has extensive oversight authority, including to review the Group’s solvency capital requirements as well as the solvency capital requirement of each French insurance or reinsurance company. Since January 1, 2016, the regulatory solvency position of the Group has been assessed using SCOR’s internal model, which was approved in November 2015 by the relevant supervisory authorities.
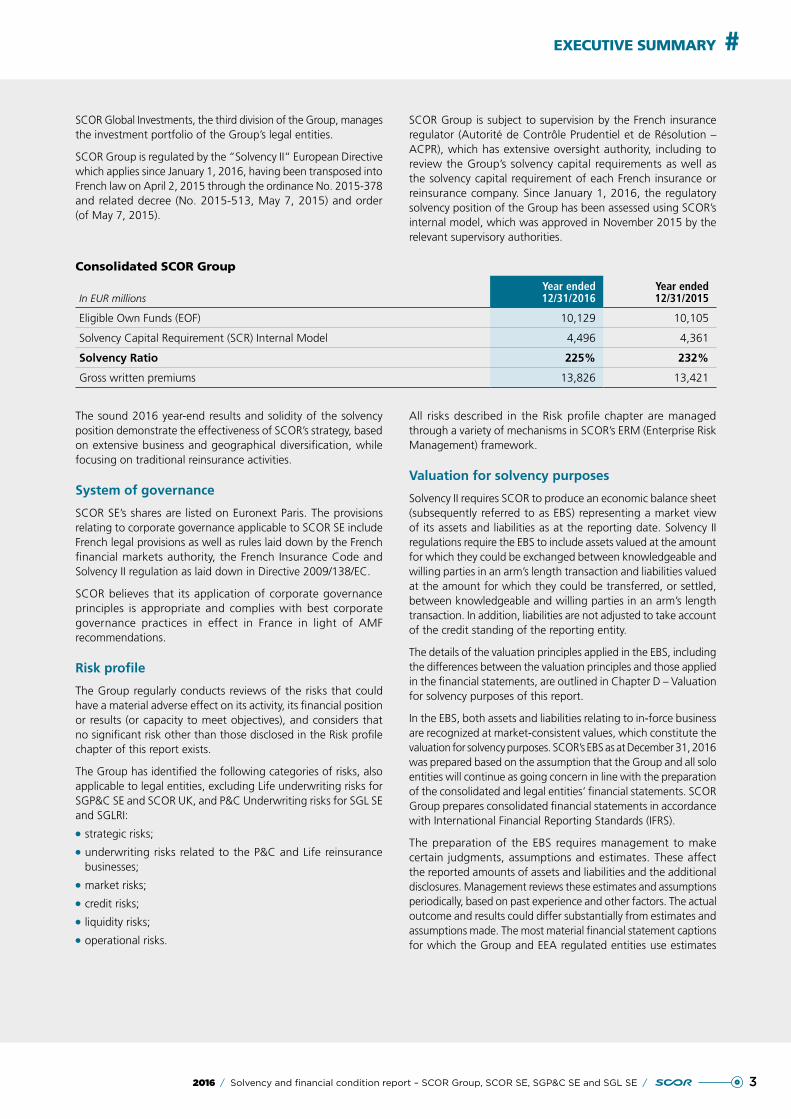
Consolidated SCOR Group
In EUR millionsYear ended12/31/2016
Year ended12/31/2015
Eligible Own Funds (EOF) 10,129 10,105
Solvency Capital Requirement (SCR) Internal Model 4,496 4,361
Solvency Ratio 225% 232%
Gross written premiums 13,826 13,421
The sound 2016 year-end results and solidity of the solvency position demonstrate the effectiveness of SCOR’s strategy, based on extensive business and geographical diversification, while focusing on traditional reinsurance activities.
System of governance
SCOR SE’s shares are listed on Euronext Paris. The provisions relating to corporate governance applicable to SCOR SE include French legal provisions as well as rules laid down by the French financial markets authority, the French Insurance Code and Solvency II regulation as laid down in Directive 2009/138/EC.
SCOR believes that its application of corporate governance principles is appropriate and complies with best corporate governance practices in effect in France in light of AMF recommendations.
Risk profile
The Group regularly conducts reviews of the risks that could have a material adverse effect on its activity, its financial position or results (or capacity to meet objectives), and considers that no significant risk other than those disclosed in the Risk profile chapter of this report exists.
The Group has identified the following categories of risks, also applicable to legal entities, excluding Life underwriting risks for SGP&C SE and SCOR UK, and P&C Underwriting risks for SGL SE and SGLRI:
●● strategic risks;
●● underwriting risks related to the P&C and Life reinsurance businesses;
●● market risks;
●● credit risks;
●● liquidity risks;
●● operational risks.
All risks described in the Risk profile chapter are managed through a variety of mechanisms in SCOR’s ERM (Enterprise Risk Management) framework.
Valuation for solvency purposes
Solvency II requires SCOR to produce an economic balance sheet (subsequently referred to as EBS) representing a market view of its assets and liabilities as at the reporting date. Solvency II regulations require the EBS to include assets valued at the amount for which they could be exchanged between knowledgeable and willing parties in an arm’s length transaction and liabilities valued at the amount for which they could be transferred, or settled, between knowledgeable and willing parties in an arm’s length transaction. In addition, liabilities are not adjusted to take account of the credit standing of the reporting entity.
The details of the valuation principles applied in the EBS, including the differences between the valuation principles and those applied in the financial statements, are outlined in Chapter D – Valuation for solvency purposes of this report.
In the EBS, both assets and liabilities relating to in-force business are recognized at market-consistent values, which constitute the valuation for solvency purposes. SCOR’s EBS as at December 31, 2016 was prepared based on the assumption that the Group and all solo entities will continue as going concern in line with the preparation of the consolidated and legal entities’ financial statements. SCOR Group prepares consolidated financial statements in accordance with International Financial Reporting Standards (IFRS).
The preparation of the EBS requires management to make certain judgments, assumptions and estimates. These affect the reported amounts of assets and liabilities and the additional disclosures. Management reviews these estimates and assumptions periodically, based on past experience and other factors. The actual outcome and results could differ substantially from estimates and assumptions made. The most material financial statement captions for which the Group and EEA regulated entities use estimates
4 / Solvency and financial condition report – SCOR Group, SCOR SE, SGP&C SE and SGL SE / 2016
EXECUTIVE SUMMARY#
and assumptions are technical provisions (best estimate liabilities and risk margin), insurance and reinsurance receivables/payables, intangible assets and deferred taxes.
The consolidated economic balance sheet of SCOR Group is prepared using the same principles applied to its consolidated financial statements (as described in Section D.1.3 – Participations). All material intragroup balances and transactions including the result of inter-company transactions are eliminated.
The principles for the valuation for solvency purposes of assets, technical provisions and other liabilities as presented in this chapter have been applied consistently by SCOR Group and its subsidiaries, including third-country undertakings.
Capital management
Capital management is at the core of SCOR’s strategy. SCOR’s goal is to manage its capital in order to maximize its profitability while maintaining solvency within its “optimal“ target range of between 185% and 220% in line with its risk/return strategy as defined in SCOR’s strategic plan “Vision in Action“.
SCOR has had strong capital management governance and processes in place with integrated supervision of regulatory constraints at Group level for many years, ensuring an optimized use of capital and full fungibility of capital within the Group.
On a quarterly basis, SCOR monitors and updates all Group and legal entity capital and regulatory solvency positions to anticipate the necessary actions to maintain adequate solvency. This detailed capital planning exercise is based on the Group’s bi-annual financial operating plan and is broken down at legal entity level. SCOR also performs three-year capital projections, including IFRS, regulatory capital, and rating capital projections, in the context of its three-year strategic planning exercise.
SCOR Group considers that there is no significant restriction affecting fungibility and transferability of its basic own funds for covering the Group SCR.
SCOR developed its internal model to ensure that its solvency is properly measured: the model is part of a comprehensive solvency framework which seeks to ensure that SCOR is solvent now and will continue to be solvent in the future. Based on a deep understanding of the risks SCOR faces, the internal model uses state-of-the-art techniques to measure solvency and assess capital requirements, including SCR. Since January 1, 2016, the regulatory solvency position of the Group has been assessed using SCOR’s internal model, which was approved in November 2015 by the relevant supervisory authorities.
SCOR’s internal model is central to SCOR’s decision making and is widely used to support the Group’s business initiatives and to provide input to management decisions.
SCOR SE
Business and performance
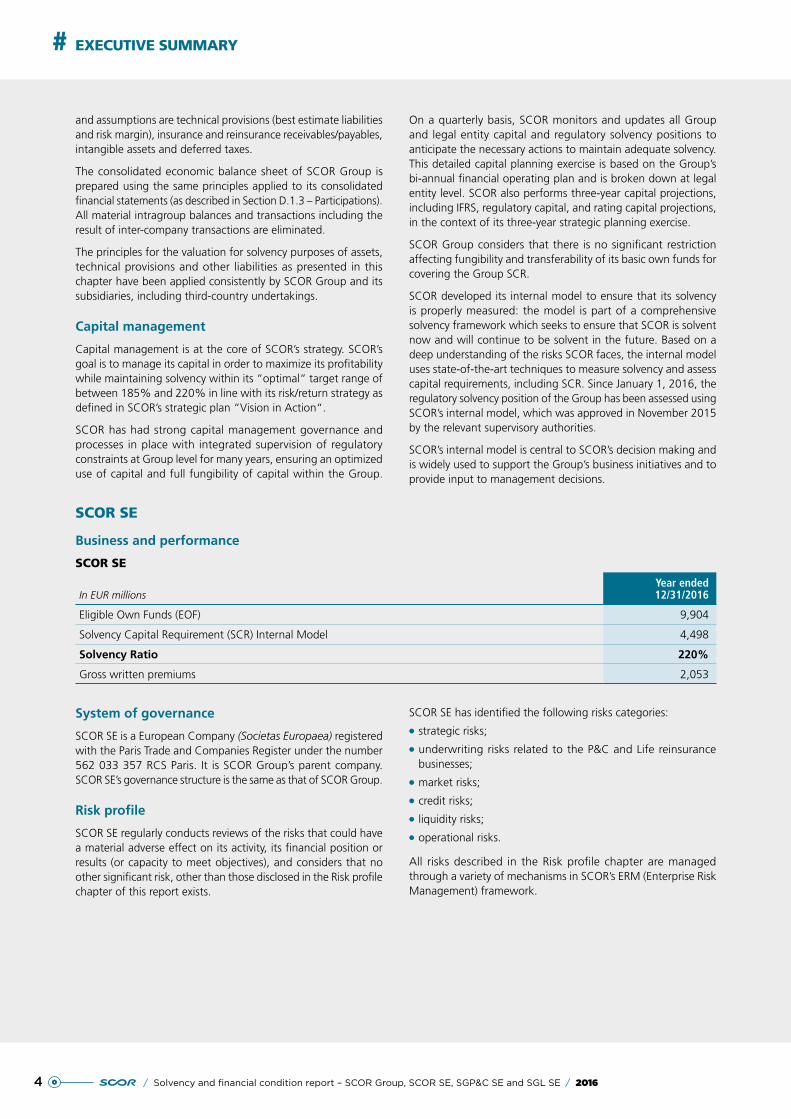
SCOR SE
In EUR millionsYear ended12/31/2016
Eligible Own Funds (EOF) 9,904
Solvency Capital Requirement (SCR) Internal Model 4,498
Solvency Ratio 220%
Gross written premiums 2,053
System of governance
SCOR SE is a European Company (Societas Europaea) registered with the Paris Trade and Companies Register under the number 562 033 357 RCS Paris. It is SCOR Group’s parent company. SCOR SE’s governance structure is the same as that of SCOR Group.
Risk profile
SCOR SE regularly conducts reviews of the risks that could have a material adverse effect on its activity, its financial position or results (or capacity to meet objectives), and considers that no other significant risk, other than those disclosed in the Risk profile chapter of this report exists.
SCOR SE has identified the following risks categories:
●● strategic risks;
●● underwriting risks related to the P&C and Life reinsurance businesses;
●● market risks;
●● credit risks;
●● liquidity risks;
●● operational risks.
All risks described in the Risk profile chapter are managed through a variety of mechanisms in SCOR’s ERM (Enterprise Risk Management) framework.
52016 / Solvency and financial condition report – SCOR Group, SCOR SE, SGP&C SE and SGL SE /
EXECUTIVE SUMMARY #
Valuation for solvency purposes
Solvency II requires SCOR SE to produce an economic balance sheet (subsequently referred to as EBS) representing a market view of its assets and liabilities as at the reporting date. Solvency II regulations require the EBS to include assets valued at the amount for which they could be exchanged between knowledgeable willing parties in an arm’s length transaction and liabilities valued at the amount for which they could be transferred, or settled, between knowledgeable willing parties in an arm’s length transaction. In addition, liabilities are not adjusted to take account of the credit standing of the reporting entity.
The details of the valuation principles applied in the EBS, including the differences between the valuation principles and those applied in the financial statements, are outlined in this chapter.
In the EBS, both assets and liabilities relating to in-force business are recognized at market-consistent values, which constitute the valuation for solvency purposes. SCOR SE’s EBS as at December 31, 2016 was prepared based on the assumption that SCOR Group, SCOR SE and all solo entities will continue as going concern in line with the preparation of the consolidated and legal entities’ financial statements. SCOR SE prepares its financial statements under French GAAP.
The preparation of the EBS requires management to make certain judgments, assumptions and estimates. These affect the reported amounts of assets and liabilities and the additional disclosures. Management reviews these estimates and assumptions periodically, based on past experience and other factors. The actual outcome and results could differ substantially from estimates and assumptions made. The most material financial statement captions for which the Group and EEA regulated entities use estimates and assumptions are technical provisions (best estimate liabilities and risk margin), insurance and reinsurance receivables/payables and deferred taxes.
Capital management
As the parent company of SCOR Group, SCOR SE’s capital management governance and processes, and capital planning are the same as those of SCOR Group.
SCOR SE’s own funds structure is similar to that of the Group. SCOR SE considers all its basic own funds, identified in line with Solvency II rules and resulting from economic adjustments made to SCOR SE’s equity under French GAAP, as available and eligible to cover the SCR.
SCOR applies the same internal model across the Group including SCOR SE. Since January 1, 2016, the regulatory solvency position of SCOR SE has been assessed using SCOR’s internal model, which was approved in November 2015 by the relevant supervisory authorities.
SCOR’s internal model is central to decision making and is widely used to support the Group’s business initiatives and to provide input to management decisions.
SCOR GLOBAL P&C SE
Business and performance
SCOR Global P&C SE (SGP&C SE) is a leading P&C reinsurer with a worldwide footprint. The business comprises traditional reinsurance transactions: Treaty, Business Solutions, and Specialty Lines reinsurance. SGP&C SE capitalizes on a long standing franchise, experience, and an extensive data base comprising multi-line expertise.
The January 2016 renewals were characterized by a market environment that shows some signs of levelling out for certain types of contracts and exposures, but where competition has regained some momentum since late 2015. SGP&C SE continued to find pockets of profitable new business, counterbalancing the premium reductions caused by increased selectivity and heightened portfolio management, thereby maintaining overall expected profitability. This has been made possible by a combination of several factors, such as the successful deployment of the client-focused initiative in the US, and having developed the right culture and the right tools to manage global client relationships and steer business in real time.
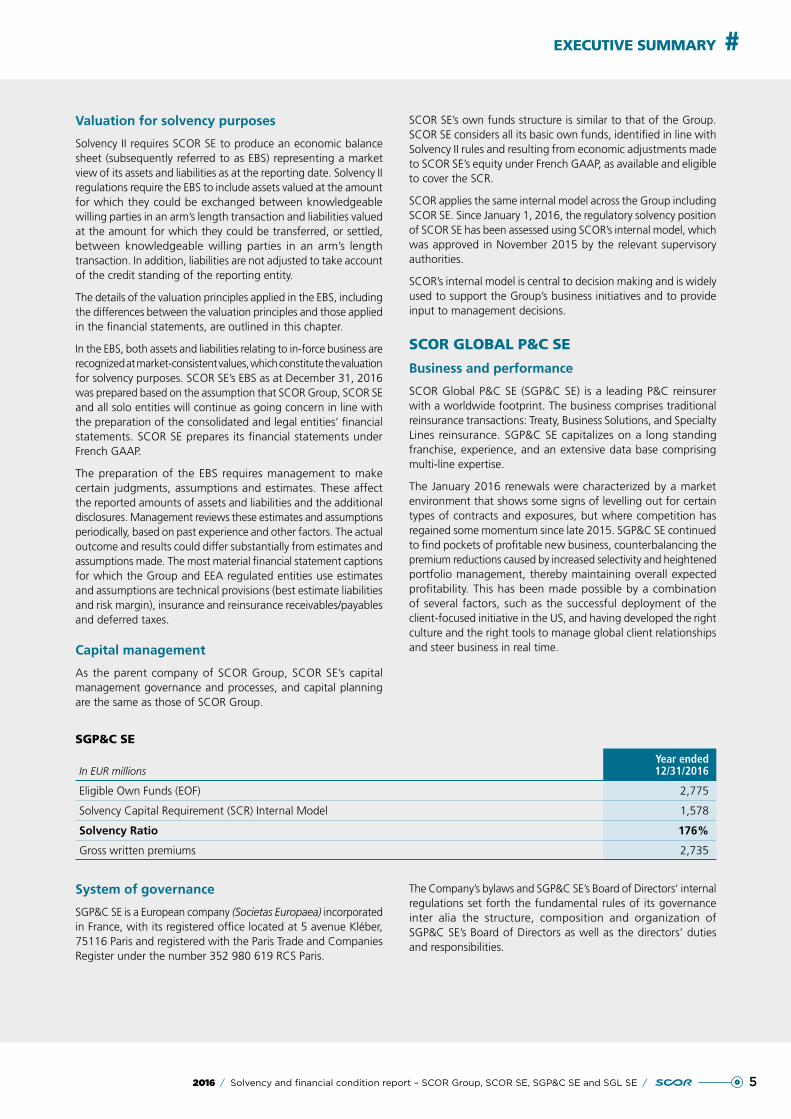
SGP&C SE
In EUR millionsYear ended12/31/2016
Eligible Own Funds (EOF) 2,775
Solvency Capital Requirement (SCR) Internal Model 1,578
Solvency Ratio 176%
Gross written premiums 2,735
System of governance
SGP&C SE is a European company (Societas Europaea) incorporated in France, with its registered office located at 5 avenue Kléber, 75116 Paris and registered with the Paris Trade and Companies Register under the number 352 980 619 RCS Paris.
The Company’s bylaws and SGP&C SE’s Board of Directors’ internal regulations set forth the fundamental rules of its governance inter alia the structure, composition and organization of SGP&C SE’s Board of Directors as well as the directors’ duties and responsibilities.
6 / Solvency and financial condition report – SCOR Group, SCOR SE, SGP&C SE and SGL SE / 2016
EXECUTIVE SUMMARY#
Risk profile
SGP&C SE regularly conducts reviews of the risks that could have a material adverse effect on its activity, its financial position or results (or capacity to meet objectives), and considers that no significant risk, other than those disclosed in the Risk profile chapter of this report exists.
SGP&C SE has identified the following risk categories:
●● strategic risks;
●● underwriting risks related to the P&C reinsurance businesses;
●● market risks;
●● credit risks;
●● liquidity risks;
●● operational risks.
All risks described in the Risk profile chapter are managed through a variety of mechanisms in SCOR’s ERM (Enterprise Risk Management) framework.
Valuation for solvency purposes
Solvency II requires SGP&C SE to produce an economic balance sheet (subsequently referred to as EBS) representing a market view of its assets and liabilities as at the reporting date. Solvency II regulations require the EBS to include assets valued at the amount for which they could be exchanged between knowledgeable willing parties in an arm’s length transaction and liabilities valued at the amount for which they could be transferred, or settled, between knowledgeable willing parties in an arm’s length transaction. In addition, liabilities are not adjusted to take account of the credit standing of the reporting entity.
The details of the valuation principles applied in the EBS, including the differences between the valuation principles and those applied in the financial statements, are outlined in this chapter.
In the EBS, both assets and liabilities relating to in-force business are recognized at market-consistent values which constitute the valuation for solvency purposes. SGP&C SE’s EBS as at December 31, 2016 was prepared based on the assumption that SCOR Group, SGP&C SE and all solo entities will continue as going concern in line with the preparation of the consolidated and legal entities’ financial statements. SGP&C SE prepares its financial statements under French GAAP.
The preparation of the EBS requires management to make certain judgments, assumptions and estimates. These affect the reported amounts of assets and liabilities and the additional disclosures. Management reviews these estimates and assumptions periodically, based on past experience and other factors. The actual outcome and results could differ substantially from estimates and assumptions made. The most material financial statement captions for which the Group and EEA regulated entities use estimates and assumptions are technical provisions (best estimate liabilities and risk margin), insurance and reinsurance receivables/payables, intangible assets and deferred taxes.
Capital management
As a wholly-owned subsidiary of SCOR Group, SGP&C SE’s capital management governance and processes, and capital planning are the same as those of SCOR Group.
SGP&C SE considers all its basic own funds, identified in line with Solvency II rules and resulting from economic adjustments made to SGP&C SE’s equity under French GAAP, as available and eligible to cover the SCR.
SCOR applies the same internal model across the Group including SGP&C SE. Since January 1, 2016, the regulatory solvency position of SGP&C SE has been assessed using SCOR’s internal model, which was approved in November 2015 by the relevant supervisory authorities.
SCOR’s internal model is central to decision making and is widely used to support the Group’s business initiatives and to provide input to management decisions.
SCOR GLOBAL LIFE SE
Business and performance
SCOR Global Life SE (SGL SE) operates through its unified global organization with a specialized market approach in three regions: Americas, EMEA (Europe, Middle East and Africa) and Asia-Pacific. It underwrites Life reinsurance business in the following product lines:
●● Protection;
●● Financial solutions;
●● Longevity.
Protection encompasses the traditional Life reinsurance business for living and death benefits. The main risks undertaken are mortality, morbidity and behavioral risks for individuals and groups of individuals. Financial solutions typically combine traditional Life reinsurance with financing components providing liquidity, balance sheet, solvency and/or income improvements to the client. Longevity products cover the risk of negative deviation from expected results due to the insured or annuitant living longer than assumed in the pricing of insurance cover provided by insurers or pension funds.
In 2016, SGL SE continued to grow profitably in a competitive Life reinsurance market. SGL SE’s solid operating profitability was maintained thanks to a robust technical performance across key regions and product lines.
72016 / Solvency and financial condition report – SCOR Group, SCOR SE, SGP&C SE and SGL SE /
EXECUTIVE SUMMARY #
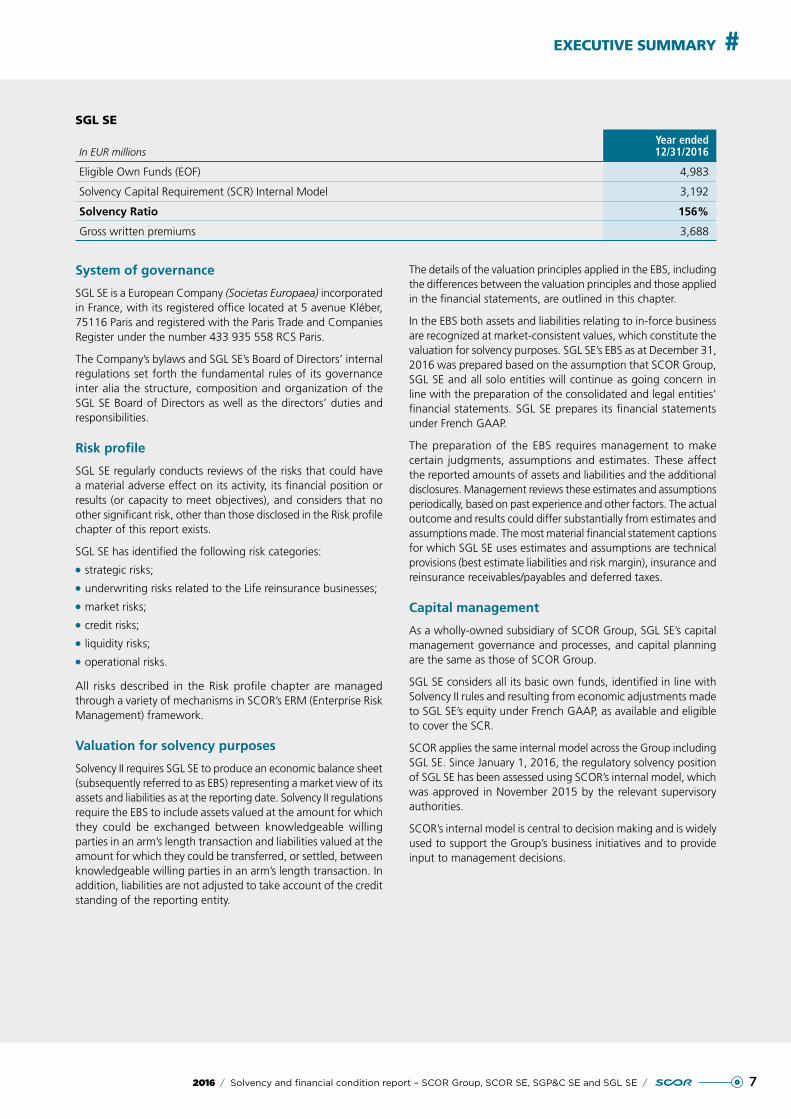
SGL SE
In EUR millionsYear ended12/31/2016
Eligible Own Funds (EOF) 4,983
Solvency Capital Requirement (SCR) Internal Model 3,192
Solvency Ratio 156%
Gross written premiums 3,688
System of governance
SGL SE is a European Company (Societas Europaea) incorporated in France, with its registered office located at 5 avenue Kléber, 75116 Paris and registered with the Paris Trade and Companies Register under the number 433 935 558 RCS Paris.
The Company’s bylaws and SGL SE’s Board of Directors’ internal regulations set forth the fundamental rules of its governance inter alia the structure, composition and organization of the SGL SE Board of Directors as well as the directors’ duties and responsibilities.
Risk profile
SGL SE regularly conducts reviews of the risks that could have a material adverse effect on its activity, its financial position or results (or capacity to meet objectives), and considers that no other significant risk, other than those disclosed in the Risk profile chapter of this report exists.
SGL SE has identified the following risk categories:
●● strategic risks;
●● underwriting risks related to the Life reinsurance businesses;
●● market risks;
●● credit risks;
●● liquidity risks;
●● operational risks.
All risks described in the Risk profile chapter are managed through a variety of mechanisms in SCOR’s ERM (Enterprise Risk Management) framework.
Valuation for solvency purposes
Solvency II requires SGL SE to produce an economic balance sheet (subsequently referred to as EBS) representing a market view of its assets and liabilities as at the reporting date. Solvency II regulations require the EBS to include assets valued at the amount for which they could be exchanged between knowledgeable willing parties in an arm’s length transaction and liabilities valued at the amount for which they could be transferred, or settled, between knowledgeable willing parties in an arm’s length transaction. In addition, liabilities are not adjusted to take account of the credit standing of the reporting entity.
The details of the valuation principles applied in the EBS, including the differences between the valuation principles and those applied in the financial statements, are outlined in this chapter.
In the EBS both assets and liabilities relating to in-force business are recognized at market-consistent values, which constitute the valuation for solvency purposes. SGL SE’s EBS as at December 31, 2016 was prepared based on the assumption that SCOR Group, SGL SE and all solo entities will continue as going concern in line with the preparation of the consolidated and legal entities’ financial statements. SGL SE prepares its financial statements under French GAAP.
The preparation of the EBS requires management to make certain judgments, assumptions and estimates. These affect the reported amounts of assets and liabilities and the additional disclosures. Management reviews these estimates and assumptions periodically, based on past experience and other factors. The actual outcome and results could differ substantially from estimates and assumptions made. The most material financial statement captions for which SGL SE uses estimates and assumptions are technical provisions (best estimate liabilities and risk margin), insurance and reinsurance receivables/payables and deferred taxes.
Capital management
As a wholly-owned subsidiary of SCOR Group, SGL SE’s capital management governance and processes, and capital planning are the same as those of SCOR Group.
SGL SE considers all its basic own funds, identified in line with Solvency II rules and resulting from economic adjustments made to SGL SE’s equity under French GAAP, as available and eligible to cover the SCR.
SCOR applies the same internal model across the Group including SGL SE. Since January 1, 2016, the regulatory solvency position of SGL SE has been assessed using SCOR’s internal model, which was approved in November 2015 by the relevant supervisory authorities.
SCOR’s internal model is central to decision making and is widely used to support the Group’s business initiatives and to provide input to management decisions.

8 / Solvency and financial condition report – SCOR Group, SCOR SE, SGP&C SE and SGL SE / 2016
92016 / Solvency and financial condition report – SCOR Group, SCOR SE, SGP&C SE and SGL SE /
BUSINESS AND PERFORMANCE
#A
A.1. BUSINESS 10
A.1.1. Overview of the SCOR Group, SCOR SE, SGP&C SE and SGL SE 10
A.1.2. Business description 15
A.2. UNDERWRITING PERFORMANCE 20
A.2.1. SCOR Group 20
A.2.2. SCOR SE 24
A.2.3. SGP&C SE 25
A.2.4. SGL SE 26
A.3. INVESTMENT PERFORMANCE 27
A.3.1. SCOR Group 27
A.3.2. SCOR SE 31
A.3.3. SGP&C SE 32
A.3.4. SGL SE 33
A.4. PERFORMANCE OF OTHER ACTIVITIES 35
A.5. ANY OTHER INFORMATION 35
10 / Solvency and financial condition report – SCOR Group, SCOR SE, SGP&C SE and SGL SE / 2016
> Business#A BUSINESS AND PERFORMANCE
A.1. BUSINESS
A.1.1. OVERVIEW OF THE SCOR GROUP, SCOR SE, SGP&C SE AND SGL SE
A.1.1.1. NAME AND LEGAL FORM OF SCOR GROUP, SCOR SE, SCOR GLOBAL P&C SE AND SCOR GLOBAL LIFE SE
SCOR SE is the parent company of SCOR Group. SCOR Global P&C SE and SCOR Global Life SE are fully owned by SCOR SE. SCOR SE, SCOR Global P&C SE and SCOR Global Life SE are European Companies (Societas Europaea).
Registered office of SCOR SE and contact information
SCOR SE5, avenue Kléber75116 PARISFrance
Tel.: +33 (0) 1 58 44 70 00Fax: +33 (0) 1 58 44 85 00
www.scor.comE-mail: [email protected]
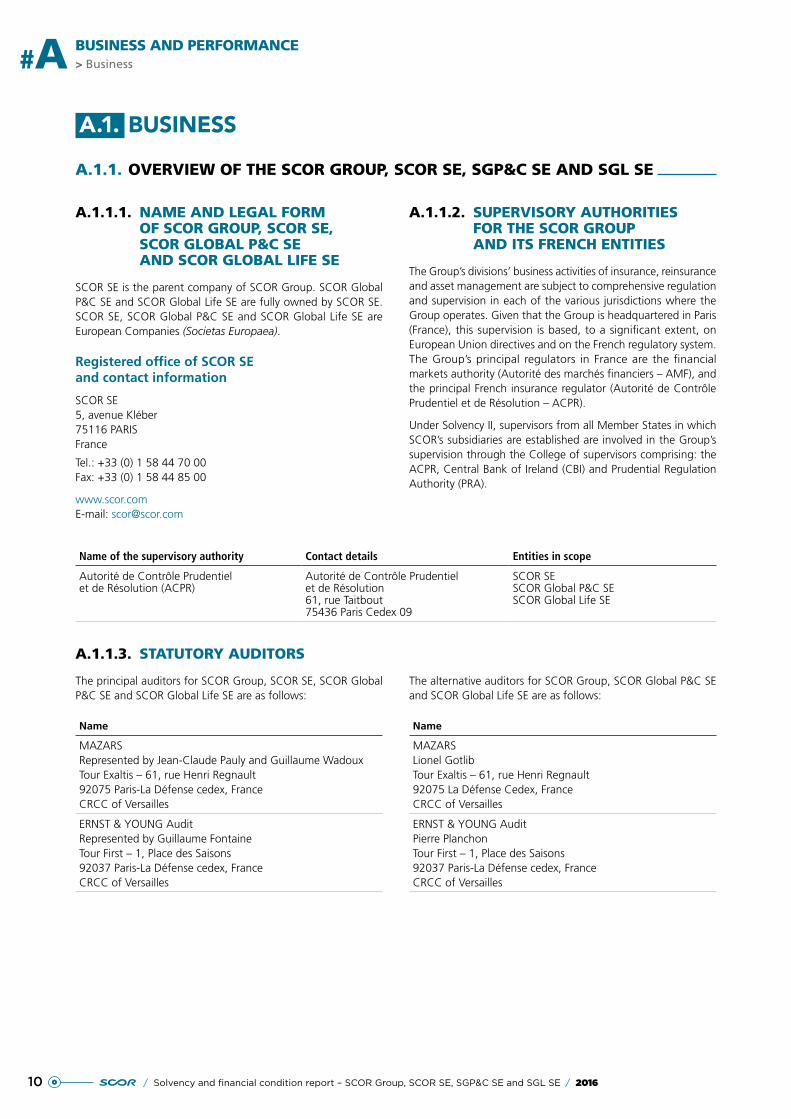
A.1.1.2. SUPERVISORY AUTHORITIES FOR THE SCOR GROUP AND ITS FRENCH ENTITIES
The Group’s divisions’ business activities of insurance, reinsurance and asset management are subject to comprehensive regulation and supervision in each of the various jurisdictions where the Group operates. Given that the Group is headquartered in Paris (France), this supervision is based, to a significant extent, on European Union directives and on the French regulatory system. The Group’s principal regulators in France are the financial markets authority (Autorité des marchés financiers – AMF), and the principal French insurance regulator (Autorité de Contrôle Prudentiel et de Résolution – ACPR).
Under Solvency II, supervisors from all Member States in which SCOR’s subsidiaries are established are involved in the Group’s supervision through the College of supervisors comprising: the ACPR, Central Bank of Ireland (CBI) and Prudential Regulation Authority (PRA).
Name of the supervisory authority Contact details Entities in scope
Autorité de Contrôle Prudentiel et de Résolution (ACPR)
Autorité de Contrôle Prudentiel et de Résolution61, rue Taitbout75436 Paris Cedex 09
SCOR SESCOR Global P&C SESCOR Global Life SE
A.1.1.3. STATUTORY AUDITORS
The principal auditors for SCOR Group, SCOR SE, SCOR Global P&C SE and SCOR Global Life SE are as follows:
Name
MAZARSRepresented by Jean-Claude Pauly and Guillaume WadouxTour Exaltis – 61, rue Henri Regnault92075 Paris-La Défense cedex, FranceCRCC of Versailles
ERNST & YOUNG AuditRepresented by Guillaume FontaineTour First – 1, Place des Saisons92037 Paris-La Défense cedex, FranceCRCC of Versailles
The alternative auditors for SCOR Group, SCOR Global P&C SE and SCOR Global Life SE are as follows:
Name
MAZARSLionel GotlibTour Exaltis – 61, rue Henri Regnault92075 La Défense Cedex, FranceCRCC of Versailles
ERNST & YOUNG AuditPierre PlanchonTour First – 1, Place des Saisons92037 Paris-La Défense cedex, FranceCRCC of Versailles
112016 / Solvency and financial condition report – SCOR Group, SCOR SE, SGP&C SE and SGL SE /
BUSINESS AND PERFORMANCEBusiness < #A
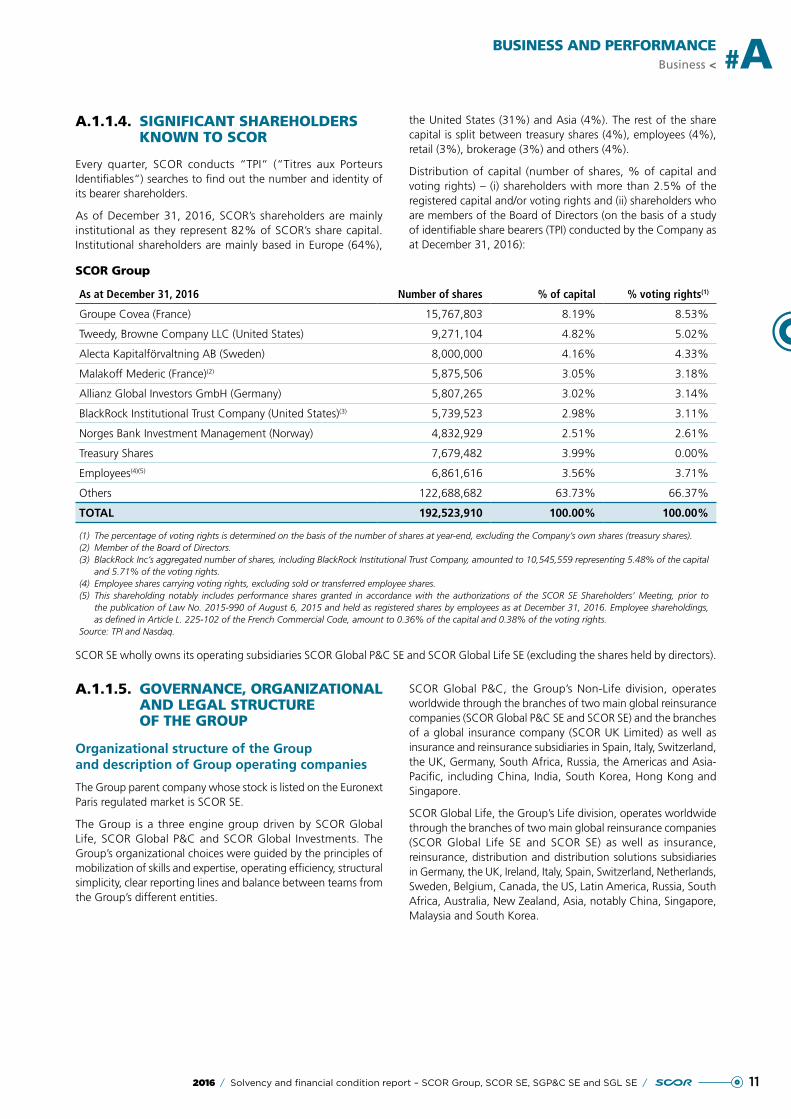
A.1.1.4. SIGNIFICANT SHAREHOLDERS KNOWN TO SCOR
Every quarter, SCOR conducts “TPI“ (“Titres aux Porteurs Identifiables“) searches to find out the number and identity of its bearer shareholders.
As of December 31, 2016, SCOR’s shareholders are mainly institutional as they represent 82% of SCOR’s share capital. Institutional shareholders are mainly based in Europe (64%),
the United States (31%) and Asia (4%). The rest of the share capital is split between treasury shares (4%), employees (4%), retail (3%), brokerage (3%) and others (4%).
Distribution of capital (number of shares, % of capital and voting rights) – (i) shareholders with more than 2.5% of the registered capital and/or voting rights and (ii) shareholders who are members of the Board of Directors (on the basis of a study of identifiable share bearers (TPI) conducted by the Company as at December 31, 2016):
SCOR Group
As at December 31, 2016 Number of shares % of capital % voting rights(1)
Groupe Covea (France) 15,767,803 8.19% 8.53%
Tweedy, Browne Company LLC (United States) 9,271,104 4.82% 5.02%
Alecta Kapitalförvaltning AB (Sweden) 8,000,000 4.16% 4.33%
Malakoff Mederic (France)(2) 5,875,506 3.05% 3.18%
Allianz Global Investors GmbH (Germany) 5,807,265 3.02% 3.14%
BlackRock Institutional Trust Company (United States)(3) 5,739,523 2.98% 3.11%
Norges Bank Investment Management (Norway) 4,832,929 2.51% 2.61%
Treasury Shares 7,679,482 3.99% 0.00%
Employees(4)(5) 6,861,616 3.56% 3.71%
Others 122,688,682 63.73% 66.37%
TOTAL 192,523,910 100.00% 100.00%
(1) The percentage of voting rights is determined on the basis of the number of shares at year-end, excluding the Company’s own shares (treasury shares).(2) Member of the Board of Directors.(3) BlackRock Inc’s aggregated number of shares, including BlackRock Institutional Trust Company, amounted to 10,545,559 representing 5.48% of the capital
and 5.71% of the voting rights.(4) Employee shares carrying voting rights, excluding sold or transferred employee shares.(5) This shareholding notably includes performance shares granted in accordance with the authorizations of the SCOR SE Shareholders’ Meeting, prior to
the publication of Law No. 2015-990 of August 6, 2015 and held as registered shares by employees as at December 31, 2016. Employee shareholdings, as defined in Article L. 225-102 of the French Commercial Code, amount to 0.36% of the capital and 0.38% of the voting rights.
Source: TPI and Nasdaq.
SCOR SE wholly owns its operating subsidiaries SCOR Global P&C SE and SCOR Global Life SE (excluding the shares held by directors).
A.1.1.5. GOVERNANCE, ORGANIZATIONAL AND LEGAL STRUCTURE OF THE GROUP
Organizational structure of the Group and description of Group operating companies
The Group parent company whose stock is listed on the Euronext Paris regulated market is SCOR SE.
The Group is a three engine group driven by SCOR Global Life, SCOR Global P&C and SCOR Global Investments. The Group’s organizational choices were guided by the principles of mobilization of skills and expertise, operating efficiency, structural simplicity, clear reporting lines and balance between teams from the Group’s different entities.
SCOR Global P&C, the Group’s Non-Life division, operates worldwide through the branches of two main global reinsurance companies (SCOR Global P&C SE and SCOR SE) and the branches of a global insurance company (SCOR UK Limited) as well as insurance and reinsurance subsidiaries in Spain, Italy, Switzerland, the UK, Germany, South Africa, Russia, the Americas and Asia-Pacific, including China, India, South Korea, Hong Kong and Singapore.
SCOR Global Life, the Group’s Life division, operates worldwide through the branches of two main global reinsurance companies (SCOR Global Life SE and SCOR SE) as well as insurance, reinsurance, distribution and distribution solutions subsidiaries in Germany, the UK, Ireland, Italy, Spain, Switzerland, Netherlands, Sweden, Belgium, Canada, the US, Latin America, Russia, South Africa, Australia, New Zealand, Asia, notably China, Singapore, Malaysia and South Korea.
12 / Solvency and financial condition report – SCOR Group, SCOR SE, SGP&C SE and SGL SE / 2016
> Business#A BUSINESS AND PERFORMANCE
SCOR Global Investments, the third division of the Group, manages the investment portfolio of the Group’s legal entities. It is composed of the Group Investment Office and SCOR Investment Partners SE, a portfolio management company, approved by the AMF. The Group Investment Office manages the interaction between the SCOR Group and SCOR Investment Partners in managing the risk appetite, monitoring investment risks and setting investment guidelines. SCOR Investment Partners manages directly the assets of many SCOR Group subsidiaries and manages also the funds on behalf of the Group and third party clients.
The Group’s subsidiaries, branches and offices are connected through a central network of applications and data exchange platforms, which allow local access to centralized risk analysis, underwriting or pricing databases and also gives access to information on local market conditions, to be shared among the Group’s subsidiaries, branches and offices. In addition, by regularly rotating personnel between the Group’s head offices in Paris and its non-French subsidiaries and branch offices, the
Group encourages its underwriters, actuaries, modelers, claims experts and risk controllers to share and exchange experience across its various geographic markets and business lines.
SCOR SE wholly owns its operating subsidiaries (excluding the loaned securities held by directors).
SCOR SE also makes loans to its subsidiaries and issues them guarantees so that they can underwrite under favorable conditions, letting them benefit from its credit ratings. SCOR SE provides actuarial, accounting, legal, administrative, systems, internal audit, investment, and human resources support to Group subsidiaries. Finally, SCOR SE acts, as needed, as retrocessionaire for its two operational subsidiaries through proportional treaties which are renewed annually and form the basis for internal control within the Group through the annual allocation of capital to the operating subsidiaries based on the profitability expected from their underwriting activity.
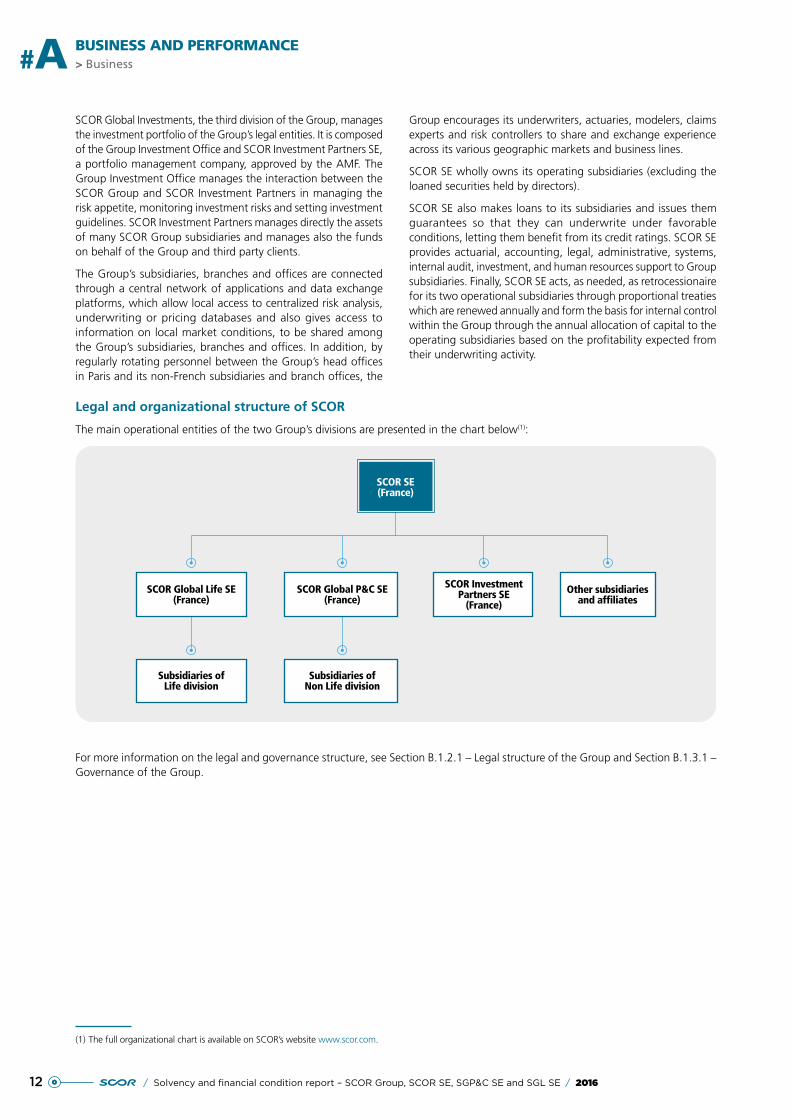
Legal and organizational structure of SCOR
The main operational entities of the two Group’s divisions are presented in the chart below(1):
SCOR Global Life SE(France)
SCOR Global P&C SE(France)
Subsidiaries ofLife division
Subsidiaries ofNon Life division
SCOR InvestmentPartners SE
(France)Other subsidiaries
and affiliates
SCOR SE(France)
For more information on the legal and governance structure, see Section B.1.2.1 – Legal structure of the Group and Section B.1.3.1 – Governance of the Group.
(1) The full organizational chart is available on SCOR’s website www.scor.com.
132016 / Solvency and financial condition report – SCOR Group, SCOR SE, SGP&C SE and SGL SE /
BUSINESS AND PERFORMANCEBusiness < #A
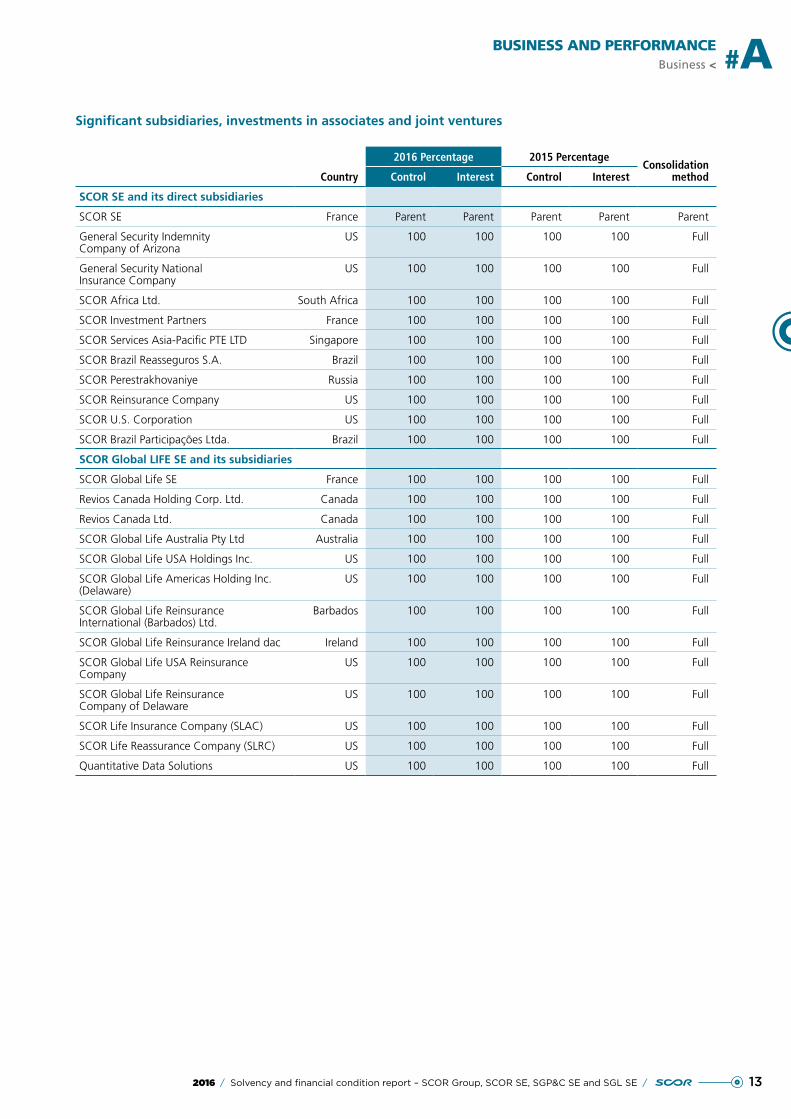
Significant subsidiaries, investments in associates and joint ventures
2016 Percentage 2015 PercentageConsolidation
methodCountry Control Interest Control Interest
SCOR SE and its direct subsidiaries
SCOR SE France Parent Parent Parent Parent Parent
General Security Indemnity Company of Arizona
US 100 100 100 100 Full
General Security National Insurance Company
US 100 100 100 100 Full
SCOR Africa Ltd. South Africa 100 100 100 100 Full
SCOR Investment Partners France 100 100 100 100 Full
SCOR Services Asia-Pacific PTE LTD Singapore 100 100 100 100 Full
SCOR Brazil Reasseguros S.A. Brazil 100 100 100 100 Full
SCOR Perestrakhovaniye Russia 100 100 100 100 Full
SCOR Reinsurance Company US 100 100 100 100 Full
SCOR U.S. Corporation US 100 100 100 100 Full
SCOR Brazil Participações Ltda. Brazil 100 100 100 100 Full
SCOR Global LIFE SE and its subsidiaries
SCOR Global Life SE France 100 100 100 100 Full
Revios Canada Holding Corp. Ltd. Canada 100 100 100 100 Full
Revios Canada Ltd. Canada 100 100 100 100 Full
SCOR Global Life Australia Pty Ltd Australia 100 100 100 100 Full
SCOR Global Life USA Holdings Inc. US 100 100 100 100 Full
SCOR Global Life Americas Holding Inc. (Delaware)
US 100 100 100 100 Full
SCOR Global Life Reinsurance International (Barbados) Ltd.
Barbados 100 100 100 100 Full
SCOR Global Life Reinsurance Ireland dac Ireland 100 100 100 100 Full
SCOR Global Life USA Reinsurance Company
US 100 100 100 100 Full
SCOR Global Life Reinsurance Company of Delaware
US 100 100 100 100 Full
SCOR Life Insurance Company (SLAC) US 100 100 100 100 Full
SCOR Life Reassurance Company (SLRC) US 100 100 100 100 Full
Quantitative Data Solutions US 100 100 100 100 Full
14 / Solvency and financial condition report – SCOR Group, SCOR SE, SGP&C SE and SGL SE / 2016
> Business#A BUSINESS AND PERFORMANCE
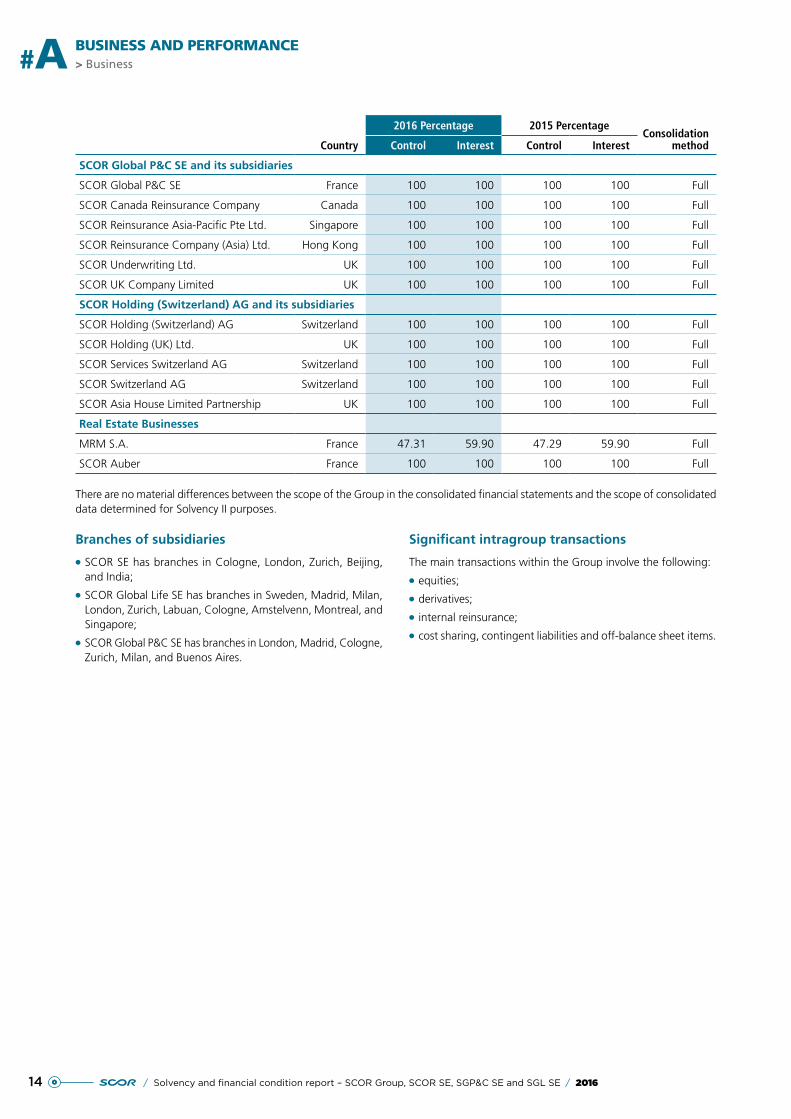
2016 Percentage 2015 PercentageConsolidation
methodCountry Control Interest Control Interest
SCOR Global P&C SE and its subsidiaries
SCOR Global P&C SE France 100 100 100 100 Full
SCOR Canada Reinsurance Company Canada 100 100 100 100 Full
SCOR Reinsurance Asia-Pacific Pte Ltd. Singapore 100 100 100 100 Full
SCOR Reinsurance Company (Asia) Ltd. Hong Kong 100 100 100 100 Full
SCOR Underwriting Ltd. UK 100 100 100 100 Full
SCOR UK Company Limited UK 100 100 100 100 Full
SCOR Holding (Switzerland) AG and its subsidiaries
SCOR Holding (Switzerland) AG Switzerland 100 100 100 100 Full
SCOR Holding (UK) Ltd. UK 100 100 100 100 Full
SCOR Services Switzerland AG Switzerland 100 100 100 100 Full
SCOR Switzerland AG Switzerland 100 100 100 100 Full
SCOR Asia House Limited Partnership UK 100 100 100 100 Full
Real Estate Businesses
MRM S.A. France 47.31 59.90 47.29 59.90 Full
SCOR Auber France 100 100 100 100 Full
There are no material differences between the scope of the Group in the consolidated financial statements and the scope of consolidated data determined for Solvency II purposes.
Branches of subsidiaries
●● SCOR SE has branches in Cologne, London, Zurich, Beijing, and India;
●● SCOR Global Life SE has branches in Sweden, Madrid, Milan, London, Zurich, Labuan, Cologne, Amstelvenn, Montreal, and Singapore;
●● SCOR Global P&C SE has branches in London, Madrid, Cologne, Zurich, Milan, and Buenos Aires.
Significant intragroup transactions
The main transactions within the Group involve the following:
●● equities;
●● derivatives;
●● internal reinsurance;
●● cost sharing, contingent liabilities and off-balance sheet items.
152016 / Solvency and financial condition report – SCOR Group, SCOR SE, SGP&C SE and SGL SE /
BUSINESS AND PERFORMANCEBusiness < #A
A.1.2. BUSINESS DESCRIPTION
A.1.2.1. LINES OF BUSINESS AND GEOGRAPHICAL AREAS
SCOR SE and its consolidated subsidiaries (“SCOR“ or the “Group“), form the world’s fourth largest reinsurer(1) serving more than 4,000 clients from its four organizational Hubs located in Paris/London and Zurich/Cologne for Europe, Singapore for Asia and New York/Charlotte/Kansas City for the Americas.
The sound 2016 year-end results and strength of the balance sheet demonstrate the effectiveness of SCOR’s strategy, based on extensive business and geographical diversification, while focusing on traditional reinsurance activities.
Breakdown of the Group’s business
The Group is organized into three divisions, of which two are operating segments, and one corporate cost center referred to as “Group Functions“. The operating segments are: the SCOR Global P&C business, with responsibility for property and casualty insurance and reinsurance (also referred to as “Non-Life“); and the SCOR Global Life business, with responsibility for life reinsurance (also referred to as “Life“). Each operating segment underwrites different types of risks and offers different products and services, which are marketed via separate channels; responsibilities and reporting within the Group are established on the basis of this structure. SCOR Global Investments is the asset management division of the Group. Its role is complementary to the two operating segments as it manages SCOR Global P&C’s and SCOR Global Life’s investment assets associated with the contract liabilities. SCOR Global Investments also manages third party assets; however, these activities are not currently considered material.
The SCOR Global P&C segment operates in four business areas: Property and Casualty Treaties; Specialty Treaties (including Credit and Surety, Decennial Insurance, Aviation, Space, Marine, Engineering, Agriculture risks and Alternative Solutions); Business Solutions (large corporate accounts underwritten through facultative insurance and reinsurance contracts and occasionally as direct insurance); and Business Ventures and Partnerships. In addition, SCOR Global P&C writes direct insurance, primarily on a business-to-business basis to cover certain large industrial P&C risks through the Business Solutions area of SCOR Global P&C and through the participation in Lloyd’s syndicates among which Channel 2015 for which SCOR is the sole capital provider.
The SCOR Global Life segment underwrites Life reinsurance in the following product lines: Protection (which provides protection for Mortality, Disability, Long-Term Care, Critical Illness, Medical and Personal Accident), Financial Solutions (which enables cedents to fund growth, stabilize earnings and optimize solvency) and Longevity (which alleviates the risk of insured clients living longer).
Global operations
The Group organizes its operations around four regional management platforms, or Hubs named Paris/London and Zurich/Cologne for Europe, Singapore for Asia and New York/Charlotte/Kansas City for the Americas. Each of the Hubs has local, regional and Group responsibilities, with the heads of each Hub reporting to the Group Chief Operations Department. Each Hub includes the following functions: a Legal and Compliance Officer, a Head of Information Technology, a Head of Finance, a Head of Human Resources and a Risk Manager. Hub shared service costs are allocated to the segments based on allocation keys.
The SCOR Global P&C segment carries out its global operations through the subsidiaries and branches of its two main global reinsurance entities (SCOR Global P&C SE and SCOR SE) and through an operating insurance entity (SCOR UK Limited). Through those entities, their subsidiaries and branches, SCOR Global P&C is represented in three business regions EMEA, the Americas and Asia-Pacific.
The SCOR Global Life segment operates worldwide through the subsidiaries and branches of the global reinsurance companies SCOR Global Life SE and SCOR SE. Via this network SCOR Global Life is represented in its three business regions Americas, EMEA and Asia-Pacific reinsuring Life and Health insurance risks along the three product lines Protection, Longevity and Financial Solutions with a strong focus on biometric risks.
SCOR Global P&C and SCOR Global Life, through their respective legal entities, are leading global reinsurers, executing an underwriting policy focused on profitability, developing value-added services and adhering to a cautious financial policy. As at December 31, 2016, the Group served more than 4,000 clients throughout the world. SCOR’s strategy of offering both P&C and Life products provides it with the benefits of balanced diversification (in terms of risks, geography and markets), which is a cornerstone of its strategy.
Non-life reinsurance
SCOR’s Non-Life segment is divided into four business areas:
●● Property and Casualty Treaties;
●● Specialty Treaties;
●● Business Solutions (underwriting of large corporate accounts); and
●● Business Ventures and Partnerships.
Property and Casualty Treaties
SCOR’s Property and Casualty Treaties business area underwrites proportional and non-proportional reinsurance treaties.
(1) By net reinsurance premiums written, source: “AM Best Special Report Global Reinsurance 2016“.
16 / Solvency and financial condition report – SCOR Group, SCOR SE, SGP&C SE and SGL SE / 2016
> Business#A BUSINESS AND PERFORMANCE
Property
SCOR’s property treaties typically cover damage to the underlying assets (automobiles, commercial premises or industrial sites) and direct or contingent business interruption losses caused by fire or other perils, including natural catastrophes.
Casualty
SCOR’s casualty treaties typically cover original risks of general liability, product liability or professional indemnity. Accordingly, they include treaties covering motor liability and general third-party liability. Motor liability reinsurance covers property damage, bodily injuries and other risks arising from the coverage of both drivers and passengers in private vehicles and commercial fleets.
Specialty Treaties
The Group’s main Specialty reinsurance activities include Credit and Surety, Decennial Insurance, Aviation, Space, Marine, Engineering, Agricultural Risks and Alternative Solutions. SCOR underwrites these risks through proportional and non-proportional treaties as well as facultative reinsurance.
Credit and Surety
Under credit insurance, the insurer covers the risk of losses from the non-payment of commercial debts. Surety insurance is a contract under which a guarantor makes a commitment to a beneficiary to perform or pay the obligation of the secured debtor. Political risk insurance covers the risk of losses due to measures taken by a government or similar entity which endangers the existence of a sales contract or commitment made by a public or private company of the country in which the covered operations are performed.
Decennial Insurance
According to laws in France, Italy and Spain, as well as in other jurisdictions, or by contractual obligation, decennial insurance must be purchased to cover major structural defects and collapse for a certain period, typically ten years after completion of construction.
Aviation
Aviation insurance covers damage caused to aircraft, injuries to persons transported and damage to third parties caused by aircraft or air navigation, as well as losses resulting from products manufactured by companies in the aerospace sector.
Space
Insurance for the space sector covers the launch preparation, launch, and the in-orbit operation of satellites, primarily commercial telecommunication and earth observation satellites.
Marine
Marine Insurance includes insurance for hull and cargo as well as shipbuilding insurance. It also includes insurance for fixed and mobile offshore oil and gas units in construction and in operation.
Engineering
Engineering insurance, which is divided into Construction All Risks and Erection All Risks insurance, includes basic property and casualty coverage and may be extended to the financial consequences of a delay in start-up (advanced loss of profits) caused by losses indemnifiable under property and casualty coverage.
Agricultural Risks
SCOR Global P&C provides insurance/reinsurance solutions in the field of multiple peril crop, aquaculture, forestry and livestock insurance.
Alternative Solutions
To cope with the broader needs of reinsurance buyers in transferring risk, and to benefit from these changes by broadening its services to clients, the Group has developed within the SCOR Global P&C division a dedicated center of expertise that provides insurance and corporate clients with a wider range of hybrid reinsurance solutions for the transformation, financing or transfer of risks. Consequently, the Group is able to assist clients in their active and effective capital management. This business unit combines the division’s expertise in terms of Structured Risk Transfer (SRT), Alternative Risk Financing (ARF) and Insurance Linked Securities (ILS).
Business Solutions
The Group’s activity in the Business Solutions area covers all insurable risks of industrial groups and services companies (large corporate accounts). These risks are underwritten through facultative insurance and reinsurance contracts, and occasionally as direct insurance, in an international network around two main business departments: “Natural Resources“ and “Industrial & Commercial Risks“.
Natural Resources
Natural Resources insurance covers midstream and downstream business (mainly the oil and gas, refining, petrochemicals, liquefaction, gasification, power generation and distribution, new energy sources and mining sectors), and upstream business (oil and gas exploration and production, offshore construction), shipbuilding groups and oil services companies.
Industrial & Commercial Risks
Industrial & Commercial Risks insurance covers manufacturing and heavy industries (automotive, pulp and paper, aeronautics/defense, high tech) and finance and services (infrastructures, intellectual services, general contractors, distribution and trading).
Business Solutions is aimed at risk managed enterprises and professional buyers seeking global risk financing solutions. The risks shared with the ceding and/or captive insurance companies are high-value industrial or technically complex risks. In property and casualty lines, such as Property Damage & Business Interruption, Construction All Risks, Erection All Risks, Comprehensive General Liability, Product Liability or Professional Indemnity, the risks involve insured amounts which typically are beyond the ceding companies’ own means.
172016 / Solvency and financial condition report – SCOR Group, SCOR SE, SGP&C SE and SGL SE /
BUSINESS AND PERFORMANCEBusiness < #A
Business Ventures and Partnerships
SCOR’s Business Ventures and Partnerships business area historically included the provision of capital to third-party businesses, including Lloyd’s syndicates. SCOR contributes to several Lloyd’s syndicate, including Channel 2015, for which SCOR is the sole capital provider.
SCOR has an ongoing partnership agreement with GAUM (Global Aerospace Underwriting Managers).
The Group also participates in insurance and reinsurance pools, mainly Assuratome and Assurpol.
Life reinsurance
SCOR’s Global Life segment underwrites Life reinsurance business in the following product lines:
●● Protection;
●● Financial Solutions;
●● Longevity.
Protection
Protection encompasses traditional Life reinsurance business on living and death benefits. The main risks undertaken are mortality, morbidity and behavioral risks for individuals and groups of individuals. Protection is predominantly underwritten in the form of proportional treaties (quota share, surplus basis or a combination of both). Quota share treaties include structures whereby SCOR Global Life’s exposure is identical to those of its clients, and risk-based premium structures whereby treaty conditions differ from those of the underlying policies. A minority of the portfolio is underwritten in the form of non-proportional contracts: excess of loss per person, catastrophe excess of loss or stop loss.
The Protection reinsurance market, as well as SCOR Global Life’s Protection portfolio, is characterized by the dominance of long-term contractual relationships. SCOR Global Life also writes short-term Protection business in markets and product lines in which this is common practice.
Protection covers the following products and risks in reinsurance arrangements:
Mortality
Mortality protection represents more than 60% of the SCOR Global Life portfolio based on gross written premiums for the year ended December 31, 2016. SCOR Global Life actively underwrites mortality risk in all the geographical markets in which it operates.
Disability
Disability insurance mitigates the loss of income when the insured is totally or partially unable to continue his or her professional occupation or any occupation for which he or she is suited due to sickness or accident.
Long-Term Care
Long-Term Care (LTC) insurance covers the inability of the insured to perform predefined activities of daily living, resulting in the insured needing constant assistance from another person.
Critical Illness
Critical Illness (CI) insurance typically pays a lump sum benefit, to be used at the policyholder’s discretion, if the insured suffers from a serious condition and survives a defined period.
Medical
Medical insurance covers medical and surgical expenses incurred by the insured person.
Personal Accident
Personal Accident insurance pays a lump sum benefit if the insured person dies or is seriously injured as a result of an accident.
Financial Solutions
Financial Solutions combines traditional Life reinsurance with financial components providing liquidity, balance sheet, solvency and/or income improvements to the client. This type of reinsurance treaty is typically used by cedents to fund growth, stabilize earnings or optimize their solvency position (capital relief).
Longevity
Longevity products cover the risk of negative deviation from expected results due to the insured or annuitant living longer than assumed in the pricing of the cover provided by insurers or pension funds.
In order to reconcile with the Solvency II lines of business (Life and Health), Longevity is purely Life Reinsurance, while the Financial Solutions and Protection businesses include both Life and Health Reinsurance business, depending on the underlying insurance contract and the nature of the insurance risk covered. The figures are reconciled based on totals.
Solvency II lines of business
Under Solvency II, insurance and reinsurance obligations are analyzed by specifically defined lines of business.
The material lines of SCOR’s Non-Life business are as follows:
●● Motor vehicle liability insurance;
●● Marine, aviation and transport insurance;
●● Fire and other damage to property insurance;
●● General liability insurance;
●● Credit and suretyship insurance;
●● Non-proportional casualty reinsurance;
●● Non-proportional property reinsurance.
The material lines of SCOR’s Life business are as follows:
●● Health reinsurance;
●● Life reinsurance.
For further information on SCOR’s underwriting and performance by Solvency II line of business, see Section A.2 – Underwriting performance.
18 / Solvency and financial condition report – SCOR Group, SCOR SE, SGP&C SE and SGL SE / 2016
> Business#A BUSINESS AND PERFORMANCE
A.1.2.2. SCOR SE – ADDITIONAL INFORMATION ON BUSINESS
The reinsurance activity of SCOR SE comprises four internal quota share retrocession treaties, one with SCOR Global P&C SE, another with SCOR Global Life SE, a third with SCOR South Africa and a fourth with SCOR Perestrakhovaniye, tnon-proportional retrocession from the Argentinian branch of SCOR Global P&C SE and from SCOR Switzerland AG, and the business underwritten by the Beijing branch.
A.1.2.3. SGP&C SE – ADDITIONAL INFORMATION ON BUSINESS
SGP&C SE plays a key role in the P&C division in respect of external retrocession as the entity centralizes purchases of external retrocession and then redistributes the protection to the other P&C entities through internal retrocession.
A.1.2.4. SGL SE – ADDITIONAL INFORMATION ON BUSINESS
SGL SE carries out its operations directly and through its network of branches. SGL SE also accepts business underwritten by subsidiaries through internal retrocession agreements. Furthermore, SGL SE holds the majority of the Life participations, namely SGLRI and SCOR Global Life Americas Holding.
SGL SE cedes 50% of the business assumed in the French head office and its branches in Italy and Spain to SCOR SE through a quota share agreement.
On a gross look-through basis, before the 50% quota share is ceded between SGL SE and SCOR SE, SGL SE encompasses the majority of the Group’s Life business.
A.1.2.5. SIGNIFICANT BUSINESS AND OTHER EVENTS IN THE PERIOD
On December 27, 2016, the Insurance Regulatory and Development Authority of India granted SCOR “R3 authorization“, after having granted it “R2 authorization“ on November 8, 2016, allowing the Group to open a Composite Branch office in India to conduct Life and P&C reinsurance business.
On December 15, 2016, SCOR announced the launch of a new 3-year contingent capital facility. This takes the form of a contingent equity line, providing the Group with EUR 300 million of coverage in case of extreme natural catastrophes or life events impacting mortality.
On July 28 and August 2, 2016 respectively, SCOR completed the calls of the entire balance of its EUR 350 million and CHF 650 million perpetual subordinated note lines.
On May 24, 2016, SCOR successfully placed a dated subordinated notes issue on the Euro market in the amount of EUR 500 million. The coupon was set at 3.625% (until May 27, 2028), and is reset every 10 years at the prevailing 10 year EUR mid-swap rate +3.90%. The notes mature on May 27, 2048. It is currently SCOR’s intention to use the proceeds for general corporate purposes. The proceeds from the notes are expected to be eligible for inclusion in SCOR’s regulatory capital, in accordance with applicable rules and regulatory standards, and as equity credit in the rating agency capital models.
On January 13, 2016, as part of its policy of diversifying its capital protection tools, SCOR sponsored a new catastrophe bond, Atlas IX Series 2016-1, which provides the Group with multi-year risk transfer capacity of USD 300 million to protect itself against named storms in the US and earthquakes in the US and Canada. The risk period for Atlas IX 2016-1 runs from January 13, 2016 to December 31, 2019.
A.1.2.6. SCOR SE – ADDITIONAL INFORMATION ON SIGNIFICANT EVENTS
In addition to the above mentioned significant events affecting SCOR Group, in 2016 SCOR SE carried out the following significant transactions:
Dividends received
During 2016, SCOR SE received EUR 550 million in dividends: EUR 277 million from SCOR Global P&C SE, EUR 200 million from SCOR Global Life SE, EUR 13 million from SCOR Auber SAS, EUR 21 million from SCOR Holding Switzerland AG, EUR 3 million from MRM SA, EUR 2 million from SCOR Investment Partners SE and USD 36 million from SCOR US (EUR 33 million).
Dividend payment
On May 2, 2016, SCOR SE paid a EUR 278 million dividend to its shareholders.
Issuance of EUR 500 million in dated subordinated notes
On May 27, 2016, SCOR SE issued EUR 500 million in dated subordinated notes, redeemable as at interest payment dates from May 27, 2028. The coupon was set at 3.625% (until May 27, 2028), and will be reset every 10 years at the prevailing 10-year EUR mid-swap rate +3.90%.
Redemption of the outstanding amount of the EUR 350 million subordinated bonds
On July 28, 2016, SCOR SE fully redeemed the remaining balance of EUR 257 million of the subordinated bonds that were issued on July 2006 for an initial amount of EUR 350 million.
192016 / Solvency and financial condition report – SCOR Group, SCOR SE, SGP&C SE and SGL SE /
BUSINESS AND PERFORMANCEBusiness < #A
Redemption of the outstanding amount of the CHF 650 million undated subordinated notes
On August 2, 2016, SCOR SE completed the call of the entire balance of its CHF 650 million perpetual subordinated notes placed in February and June 2011 in two tranches of CHF 400 million and CHF 250 million, respectively.
The redemption of this debt was prefunded thanks to the issuance of dated subordinated notes on the Euro market in the amount of EUR 600 million in December 2015.
Loan granted to SCOR Reinsurance Company for USD 125 million
On April 28, 2016, SCOR SE granted a USD 125 million loan to SCOR Reinsurance Company. The interest rate of 5.156% is fixed until its term on April 28, 2036.
Subordinated loan granted to SCOR Reinsurance Asia-Pacific Pte Ltd for USD 40 million
On July 29, 2016, SCOR SE granted a USD 40 million subordinated loan to SCOR Reinsurance Asia-Pacific Pte Ltd. The interest rate of 4.65% is fixed until its term on July 29, 2031.
Sale of 20% of ASEFA
On September 27, 2016, SCOR SE reduced its share in Asefa from 39.97% to 19.97% and holds options to sell the remaining share to the buyer.
A.1.2.7. SGP&C SE – ADDITIONAL INFORMATION ON SIGNIFICANT EVENTS
In addition to the above-mentioned significant events affecting SCOR Group, SCOR Global P&C SE carried out the following operations:
Equity securities
On December, 22 2016, SCOR Global P&C SE acquired 9.99% of CFDP Assurances for a value of EUR 4.3 million.
Distribution of reserves
In November 2016, SCOR Global P&C SE proceeded with an exceptional distribution of reserves for an amount of EUR 151 million to SCOR SE.
Subordinated debt
The subordinated debt of EUR 65 million with SCOR Holding Switzerland AS was fully reimbursed in July 2016.
New Cat bond
In January 2016, SCOR sponsored a new catastrophe bond, Atlas IX Series 2016-1, which provides the Group with multi-year risk transfer capacity of USD 300 million to protect itself against US Named Storm and US and Canada Earthquake events. The risk period for Atlas IX 2016-1 runs from January 13, 2016 to December 31, 2019.
A.1.2.8. SGL SE – ADDITIONAL INFORMATION ON SIGNIFICANT EVENTS
In addition to the above-mentioned significant events affecting SCOR Group, in 2016 SGL SE carried out the following significant transactions:
Capital increase in subsidiaries
SGL SE carried out a share capital increase of AUD 26 million (EUR 18 million) at its subsidiary SCOR Global Life Australia.
Distribution of reserves
SGL SE distributed reserves for an amount of EUR 100 million to SCOR SE.
Movements in subordinated debt
SGL SE replaced the subordinated loan of EUR 530 million granted by SCOR SE at a fixed interest rate of 6.96% with a subordinated debt of the same amount at a fixed interest rate of 3.0%.
20 / Solvency and financial condition report – SCOR Group, SCOR SE, SGP&C SE and SGL SE / 2016
> Underwriting performance#A BUSINESS AND PERFORMANCE
A.2. UNDERWRITING PERFORMANCE
A.2.1. SCOR GROUP
A.2.1.1. OVERALL UNDERWRITING PERFORMANCE
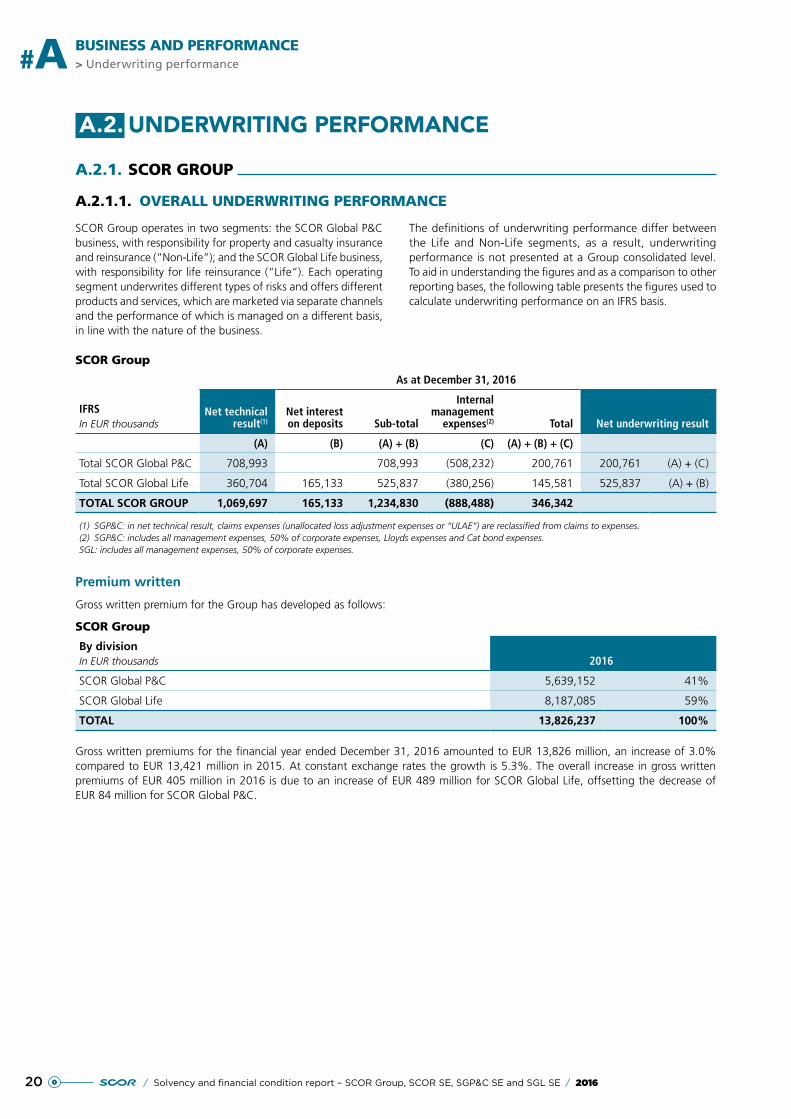
SCOR Group operates in two segments: the SCOR Global P&C business, with responsibility for property and casualty insurance and reinsurance (“Non-Life“); and the SCOR Global Life business, with responsibility for life reinsurance (“Life“). Each operating segment underwrites different types of risks and offers different products and services, which are marketed via separate channels and the performance of which is managed on a different basis, in line with the nature of the business.
The definitions of underwriting performance differ between the Life and Non-Life segments, as a result, underwriting performance is not presented at a Group consolidated level. To aid in understanding the figures and as a comparison to other reporting bases, the following table presents the figures used to calculate underwriting performance on an IFRS basis.
SCOR Group
IFRSIn EUR thousands
As at December 31, 2016
Net technical result(1)
Net interest on deposits Sub-total
Internal management
expenses(2) Total Net underwriting result
(A) (B) (A) + (B) (C) (A) + (B) + (C)
Total SCOR Global P&C 708,993 708,993 (508,232) 200,761 200,761 (A) + (C)
Total SCOR Global Life 360,704 165,133 525,837 (380,256) 145,581 525,837 (A) + (B)
TOTAL SCOR GROUP 1,069,697 165,133 1,234,830 (888,488) 346,342
(1) SGP&C: in net technical result, claims expenses (unallocated loss adjustment expenses or “ULAE“) are reclassified from claims to expenses.(2) SGP&C: includes all management expenses, 50% of corporate expenses, Lloyds expenses and Cat bond expenses.SGL: includes all management expenses, 50% of corporate expenses.
Premium written
Gross written premium for the Group has developed as follows:
SCOR Group
By divisionIn EUR thousands 2016
SCOR Global P&C 5,639,152 41%
SCOR Global Life 8,187,085 59%
TOTAL 13,826,237 100%
Gross written premiums for the financial year ended December 31, 2016 amounted to EUR 13,826 million, an increase of 3.0% compared to EUR 13,421 million in 2015. At constant exchange rates the growth is 5.3%. The overall increase in gross written premiums of EUR 405 million in 2016 is due to an increase of EUR 489 million for SCOR Global Life, offsetting the decrease of EUR 84 million for SCOR Global P&C.
212016 / Solvency and financial condition report – SCOR Group, SCOR SE, SGP&C SE and SGL SE /
BUSINESS AND PERFORMANCEUnderwriting performance < #A
A.2.1.2. UNDERWRITING RESULTS BY LINE OF BUSINESS
Non-Life business
SCOR’s Non-Life segment is divided into four business areas:
●● Property and Casualty Treaties;
●● Specialty Treaties;
●● Business Solutions (underwriting of large corporate accounts); and
●● Business Ventures and Partnerships.
SCOR is a leading P&C reinsurer with a worldwide footprint. SCOR Global P&C capitalizes on a long-standing franchise, experience, and an extensive database comprising multi-line expertise.
The January 2016 renewals were characterized by a market environment that showed some signs of levelling out for certain
types of contracts and exposures, but where competition regained some momentum since the very end of 2015. SCOR Global P&C continued to find pockets of profitable new business, counterbalancing the premium reductions caused by increased selectivity and heightened portfolio management, thereby maintaining overall expected profitability. This has been made possible by a combination of several factors, such as the successful deployment of the client-focused initiative in the US, and having developed the right culture and the right tools to manage global client relationships and steer business in real time.
The 2016 gross written premium benefited from the progressive strengthening of SCOR’s positions in the US, which is fully consistent with “Vision in Action“.
The technical profitability remains very strong in 2016. This was achieved while maintaining the technical reserves above the best estimate. The margin above the best estimate stands at a similar level to that of 2015, despite the reserves released in Q2 2016.
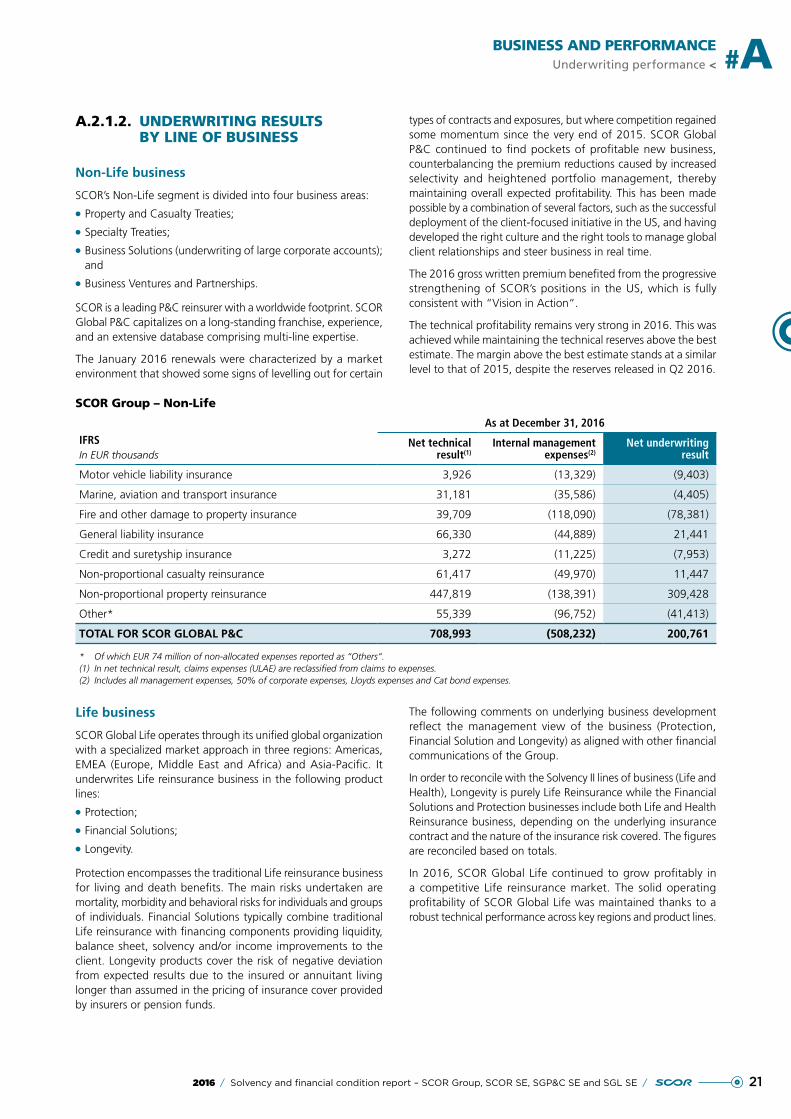
SCOR Group – Non-Life
IFRSIn EUR thousands
As at December 31, 2016
Net technical result(1)
Internal management expenses(2)
Net underwriting result
Motor vehicle liability insurance 3,926 (13,329) (9,403)
Marine, aviation and transport insurance 31,181 (35,586) (4,405)
Fire and other damage to property insurance 39,709 (118,090) (78,381)
General liability insurance 66,330 (44,889) 21,441
Credit and suretyship insurance 3,272 (11,225) (7,953)
Non-proportional casualty reinsurance 61,417 (49,970) 11,447
Non-proportional property reinsurance 447,819 (138,391) 309,428
Other* 55,339 (96,752) (41,413)
TOTAL FOR SCOR GLOBAL P&C 708,993 (508,232) 200,761
* Of which EUR 74 million of non-allocated expenses reported as “Others“.(1) In net technical result, claims expenses (ULAE) are reclassified from claims to expenses.(2) Includes all management expenses, 50% of corporate expenses, Lloyds expenses and Cat bond expenses.
Life business
SCOR Global Life operates through its unified global organization with a specialized market approach in three regions: Americas, EMEA (Europe, Middle East and Africa) and Asia-Pacific. It underwrites Life reinsurance business in the following product lines:
●● Protection;
●● Financial Solutions;
●● Longevity.
Protection encompasses the traditional Life reinsurance business for living and death benefits. The main risks undertaken are mortality, morbidity and behavioral risks for individuals and groups of individuals. Financial Solutions typically combine traditional Life reinsurance with financing components providing liquidity, balance sheet, solvency and/or income improvements to the client. Longevity products cover the risk of negative deviation from expected results due to the insured or annuitant living longer than assumed in the pricing of insurance cover provided by insurers or pension funds.
The following comments on underlying business development reflect the management view of the business (Protection, Financial Solution and Longevity) as aligned with other financial communications of the Group.
In order to reconcile with the Solvency II lines of business (Life and Health), Longevity is purely Life Reinsurance while the Financial Solutions and Protection businesses include both Life and Health Reinsurance business, depending on the underlying insurance contract and the nature of the insurance risk covered. The figures are reconciled based on totals.
In 2016, SCOR Global Life continued to grow profitably in a competitive Life reinsurance market. The solid operating profitability of SCOR Global Life was maintained thanks to a robust technical performance across key regions and product lines.
22 / Solvency and financial condition report – SCOR Group, SCOR SE, SGP&C SE and SGL SE / 2016
> Underwriting performance#A BUSINESS AND PERFORMANCE
Life gross written premiums by product line
SCOR Global Life ranks among the top five life reinsurers worldwide(1) and has grown by 6.4% in gross written premiums to EUR 8,187 million in 2016 (8.3% increase at constant exchange rates(2)). SCOR Global Life has increased its new business premiums from new clients and with existing clients in all three regions and across all three product lines. Growth was recognized in the Protection product line in the Americas, in the Financial Solutions product line in Asia-Pacific and in the Longevity product line in Europe.
Protection
The Protection business accounts for 79% of total gross written premiums in 2016 and remains the main driver for premium growth (5.3% growth in gross written premiums in 2016).
SCOR Global Life has maintained its leadership in the US life reinsurance market(3), the largest life reinsurance market in the world. After the successful integration of Generali US’s life reinsurance activities, SCOR Global Life created a common operations platform in North America across multiple sites (Charlotte, Kansas City, Montreal and Toronto). Leveraging this new underwriting platform allowed SCOR to gain new clients, particularly in Canada.
In the EMEA region, SCOR Global Life reinforced its franchises in key European markets such as France, the UK, and Nordic countries. SCOR Global Life is also expanding into the large South African market.
Asia-Pacific remains a region with significant growth opportunities both in terms of premium and profitability. Premiums development in Asia-Pacific was driven by higher Protection business volumes in Australia, China and South Korea.
Within the Protection product line, mortality was the main risk underwritten and the main growth driver in 2016:
●● Mortality: more than 60% of SCOR Global Life’s portfolio is traditional mortality reinsurance business, based on 2016 gross written premiums. SCOR Global Life developed a strong position in Mortality in the US, as well as in the major European markets;
●● Long-Term Care: SCOR Global Life has been pioneering LTC reinsurance solutions in the French market for twenty years and has acquired a sound practical experience in the underwriting and the management of LTC risks. SCOR Global Life has also expanded its geographical scope by introducing its LTC reinsurance coverage to several markets;
●● Disability: SCOR Global Life has established strong market positions in disability in many continental Europe markets and Canada. It has recently selectively entered into the Australian disability market in line with SCOR’s risk appetite, at pricing levels in line with its profitability target, thanks to toughening market conditions;
●● Critical Illness: SCOR Global Life is a market leader in the UK. It also leverages its experience and expertise from the UK to expand into selected Asian markets and South Africa;
●● Medical represents a small proportion of SCOR Global Life’s portfolio. It is a major product line in the markets of the Middle East and is written selectively in Asia, Continental Europe and the Americas;
●● Personal Accident also represents a small proportion of SCOR Global Life’s portfolio. A main source of Personal Accident business for SCOR Global Life is obtained through its distribution services company, ReMark, which provides direct marketing of life insurance products to insurers, financial institutions and affinity partners.
Through its Global Distribution Solutions (GDS), SCOR Global Life has successfully deployed a number of innovative and tailored client services which aim to help insurers expand and develop their own client bases (ReMark, Velogica, SCOR Telemed and Rehalto). SCOR Global Life has leadership positions in many markets in the EMEA and Asia-Pacific regions and achieved strong growth in 2016.
Financial Solutions
In the Financial Solutions product line, accounting for 13% of 2016 gross written premiums, SCOR Global Life has built a recognized position in providing capital and solvency solutions. Since 2013 SCOR Global Life has signed landmark transactions in Southern Europe, the US, Asia and Latin America. Regulatory environments have been in flux since late 2014, with the implementation of Solvency II in Europe and equivalent systems elsewhere (China, the US). These changes have led to a slowdown in concluding new business, in particular in the EMEA region. Insurers are expected to deploy new solutions as these new regulations become more established.
Longevity
SCOR Global Life has established itself as a recognized provider for longevity reinsurance, focusing on longevity risk transfer transactions for large in-payment pension portfolios, creating a new business pipeline with growth opportunities. The Longevity product line accounts for 8% of SCOR Global Life’s gross written premiums in 2016 and is one of the main drivers of premium growth (23.3% increase in gross written premiums in 2016). The main active market to date for SCOR Global Life is the UK with a portfolio from recent years and new business signed in 2016. SCOR Global Life is also exploring business opportunities in other markets such as Canada, where SCOR Global Life entered into a longevity transaction in 2015.
Life technical margin
Overall, the Life technical margin was 7.0% in 2016.
(1) Based on 2016 gross written premiums.(2) At December 31, 2016 exchange rates.(3) Source: 2016 SOA/Munich Re survey of US life reinsurance, published in June 2016.
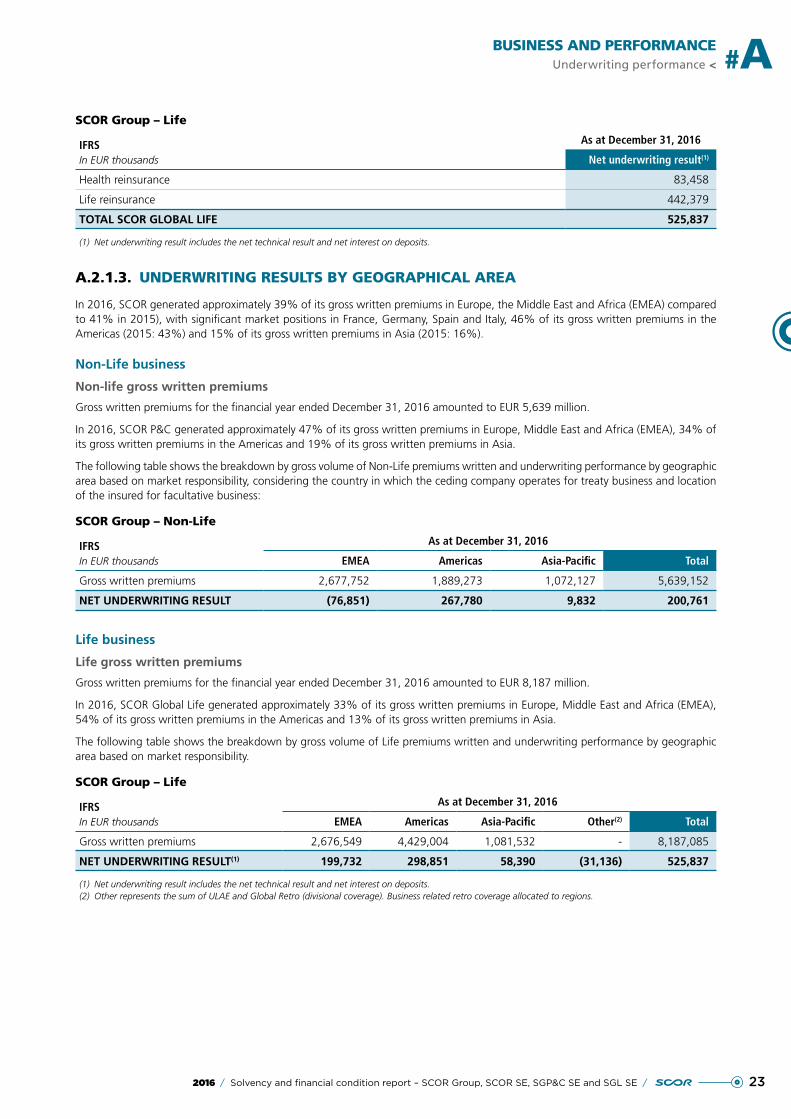
232016 / Solvency and financial condition report – SCOR Group, SCOR SE, SGP&C SE and SGL SE /
BUSINESS AND PERFORMANCEUnderwriting performance < #A
SCOR Group – Life
IFRSIn EUR thousands
As at December 31, 2016
Net underwriting result(1)
Health reinsurance 83,458
Life reinsurance 442,379
TOTAL SCOR GLOBAL LIFE 525,837
(1) Net underwriting result includes the net technical result and net interest on deposits.
A.2.1.3. UNDERWRITING RESULTS BY GEOGRAPHICAL AREA
In 2016, SCOR generated approximately 39% of its gross written premiums in Europe, the Middle East and Africa (EMEA) compared to 41% in 2015), with significant market positions in France, Germany, Spain and Italy, 46% of its gross written premiums in the Americas (2015: 43%) and 15% of its gross written premiums in Asia (2015: 16%).
Non-Life business
Non-life gross written premiums
Gross written premiums for the financial year ended December 31, 2016 amounted to EUR 5,639 million.
In 2016, SCOR P&C generated approximately 47% of its gross written premiums in Europe, Middle East and Africa (EMEA), 34% of its gross written premiums in the Americas and 19% of its gross written premiums in Asia.
The following table shows the breakdown by gross volume of Non-Life premiums written and underwriting performance by geographic area based on market responsibility, considering the country in which the ceding company operates for treaty business and location of the insured for facultative business:
SCOR Group – Non-Life
IFRSIn EUR thousands
As at December 31, 2016
EMEA Americas Asia-Pacific Total
Gross written premiums 2,677,752 1,889,273 1,072,127 5,639,152
NET UNDERWRITING RESULT (76,851) 267,780 9,832 200,761
Life business
Life gross written premiums
Gross written premiums for the financial year ended December 31, 2016 amounted to EUR 8,187 million.
In 2016, SCOR Global Life generated approximately 33% of its gross written premiums in Europe, Middle East and Africa (EMEA), 54% of its gross written premiums in the Americas and 13% of its gross written premiums in Asia.
The following table shows the breakdown by gross volume of Life premiums written and underwriting performance by geographic area based on market responsibility.
SCOR Group – Life
IFRSIn EUR thousands
As at December 31, 2016
EMEA Americas Asia-Pacific Other(2) Total
Gross written premiums 2,676,549 4,429,004 1,081,532 - 8,187,085
NET UNDERWRITING RESULT(1) 199,732 298,851 58,390 (31,136) 525,837
(1) Net underwriting result includes the net technical result and net interest on deposits.(2) Other represents the sum of ULAE and Global Retro (divisional coverage). Business related retro coverage allocated to regions.
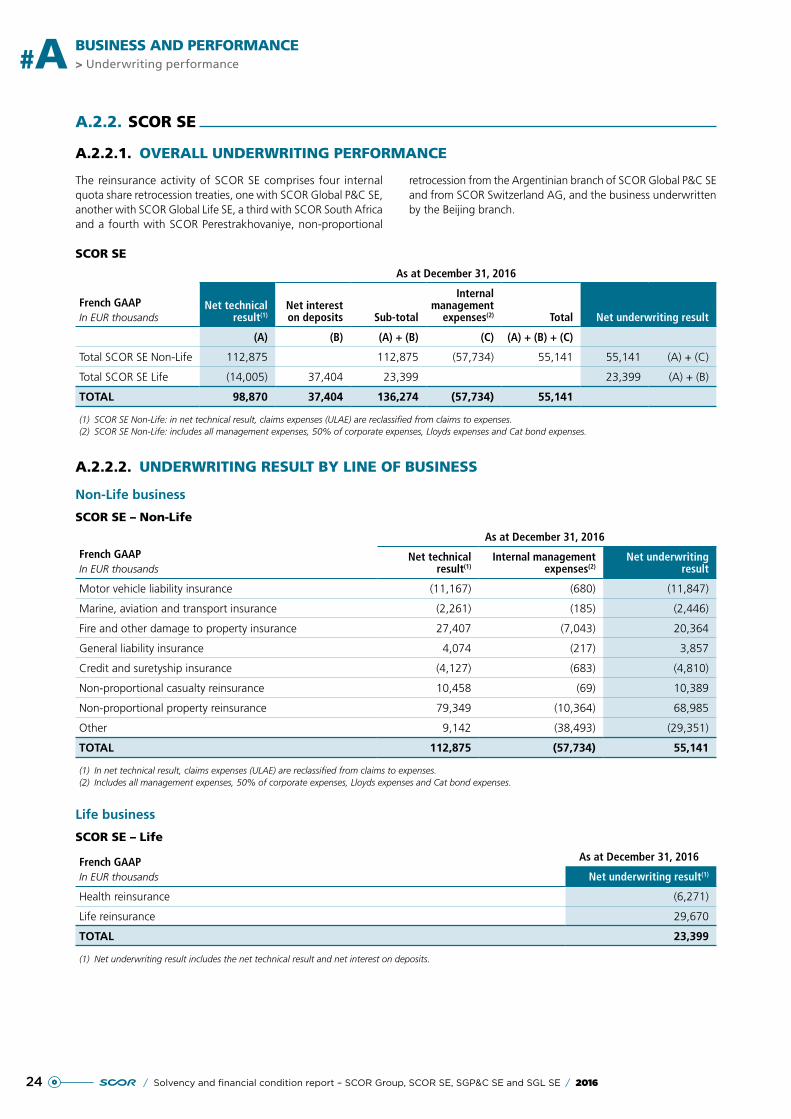
24 / Solvency and financial condition report – SCOR Group, SCOR SE, SGP&C SE and SGL SE / 2016
> Underwriting performance#A BUSINESS AND PERFORMANCE
A.2.2. SCOR SE
A.2.2.1. OVERALL UNDERWRITING PERFORMANCE
The reinsurance activity of SCOR SE comprises four internal quota share retrocession treaties, one with SCOR Global P&C SE, another with SCOR Global Life SE, a third with SCOR South Africa and a fourth with SCOR Perestrakhovaniye, non-proportional
retrocession from the Argentinian branch of SCOR Global P&C SE and from SCOR Switzerland AG, and the business underwritten by the Beijing branch.
SCOR SE
French GAAPIn EUR thousands
As at December 31, 2016
Net technical result(1)
Net interest on deposits Sub-total
Internal management
expenses(2) Total Net underwriting result
(A) (B) (A) + (B) (C) (A) + (B) + (C)
Total SCOR SE Non-Life 112,875 112,875 (57,734) 55,141 55,141 (A) + (C)
Total SCOR SE Life (14,005) 37,404 23,399 23,399 (A) + (B)
TOTAL 98,870 37,404 136,274 (57,734) 55,141
(1) SCOR SE Non-Life: in net technical result, claims expenses (ULAE) are reclassified from claims to expenses.(2) SCOR SE Non-Life: includes all management expenses, 50% of corporate expenses, Lloyds expenses and Cat bond expenses.
A.2.2.2. UNDERWRITING RESULT BY LINE OF BUSINESS
Non-Life business
SCOR SE – Non-Life
French GAAPIn EUR thousands
As at December 31, 2016
Net technical result(1)
Internal management expenses(2)
Net underwriting result
Motor vehicle liability insurance (11,167) (680) (11,847)
Marine, aviation and transport insurance (2,261) (185) (2,446)
Fire and other damage to property insurance 27,407 (7,043) 20,364
General liability insurance 4,074 (217) 3,857
Credit and suretyship insurance (4,127) (683) (4,810)
Non-proportional casualty reinsurance 10,458 (69) 10,389
Non-proportional property reinsurance 79,349 (10,364) 68,985
Other 9,142 (38,493) (29,351)
TOTAL 112,875 (57,734) 55,141
(1) In net technical result, claims expenses (ULAE) are reclassified from claims to expenses.(2) Includes all management expenses, 50% of corporate expenses, Lloyds expenses and Cat bond expenses.
Life business
SCOR SE – Life
French GAAPIn EUR thousands
As at December 31, 2016
Net underwriting result(1)
Health reinsurance (6,271)
Life reinsurance 29,670
TOTAL 23,399
(1) Net underwriting result includes the net technical result and net interest on deposits.
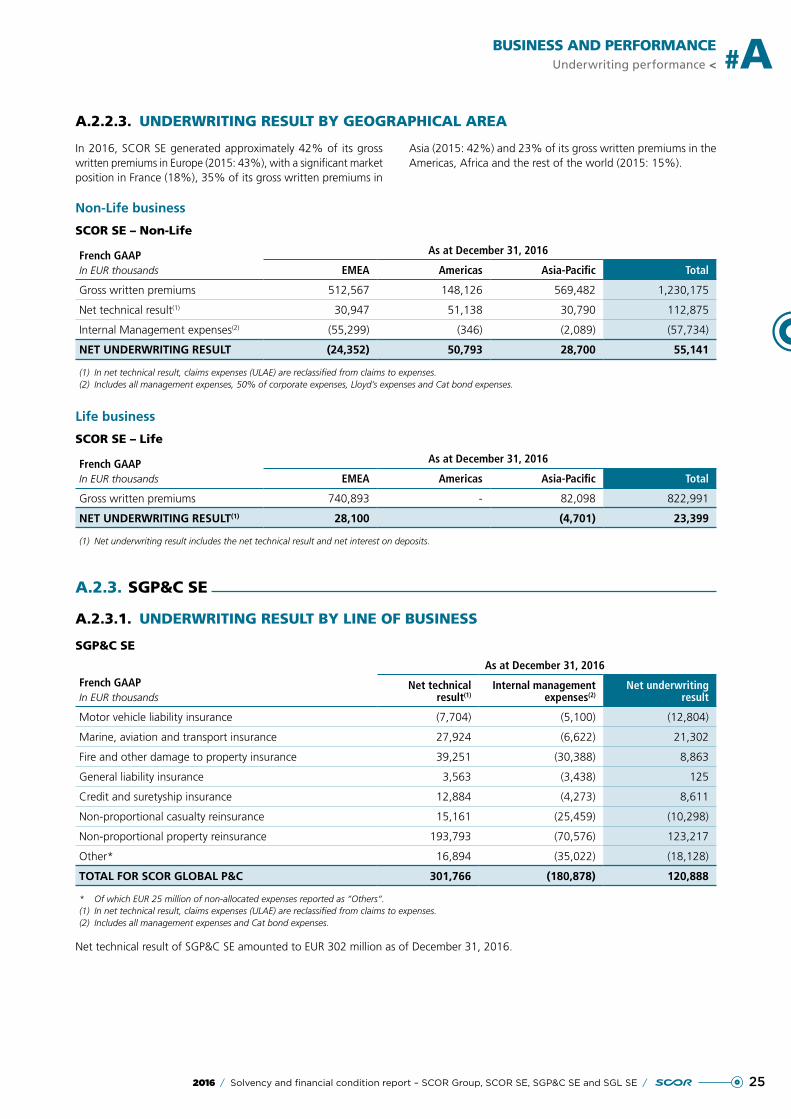
252016 / Solvency and financial condition report – SCOR Group, SCOR SE, SGP&C SE and SGL SE /
BUSINESS AND PERFORMANCEUnderwriting performance < #A
A.2.2.3. UNDERWRITING RESULT BY GEOGRAPHICAL AREA
In 2016, SCOR SE generated approximately 42% of its gross written premiums in Europe (2015: 43%), with a significant market position in France (18%), 35% of its gross written premiums in
Asia (2015: 42%) and 23% of its gross written premiums in the Americas, Africa and the rest of the world (2015: 15%).
Non-Life business
SCOR SE – Non-Life
French GAAPIn EUR thousands
As at December 31, 2016
EMEA Americas Asia-Pacific Total
Gross written premiums 512,567 148,126 569,482 1,230,175
Net technical result(1) 30,947 51,138 30,790 112,875
Internal Management expenses(2) (55,299) (346) (2,089) (57,734)
NET UNDERWRITING RESULT (24,352) 50,793 28,700 55,141
(1) In net technical result, claims expenses (ULAE) are reclassified from claims to expenses.(2) Includes all management expenses, 50% of corporate expenses, Lloyd’s expenses and Cat bond expenses.
Life business
SCOR SE – Life
French GAAPIn EUR thousands
As at December 31, 2016
EMEA Americas Asia-Pacific Total
Gross written premiums 740,893 - 82,098 822,991
NET UNDERWRITING RESULT(1) 28,100 (4,701) 23,399
(1) Net underwriting result includes the net technical result and net interest on deposits.
A.2.3. SGP&C SE
A.2.3.1. UNDERWRITING RESULT BY LINE OF BUSINESS
SGP&C SE
French GAAPIn EUR thousands
As at December 31, 2016
Net technical result(1)
Internal management expenses(2)
Net underwriting result
Motor vehicle liability insurance (7,704) (5,100) (12,804)
Marine, aviation and transport insurance 27,924 (6,622) 21,302
Fire and other damage to property insurance 39,251 (30,388) 8,863
General liability insurance 3,563 (3,438) 125
Credit and suretyship insurance 12,884 (4,273) 8,611
Non-proportional casualty reinsurance 15,161 (25,459) (10,298)
Non-proportional property reinsurance 193,793 (70,576) 123,217
Other* 16,894 (35,022) (18,128)
TOTAL FOR SCOR GLOBAL P&C 301,766 (180,878) 120,888
* Of which EUR 25 million of non-allocated expenses reported as “Others“.(1) In net technical result, claims expenses (ULAE) are reclassified from claims to expenses.(2) Includes all management expenses and Cat bond expenses.
Net technical result of SGP&C SE amounted to EUR 302 million as of December 31, 2016.
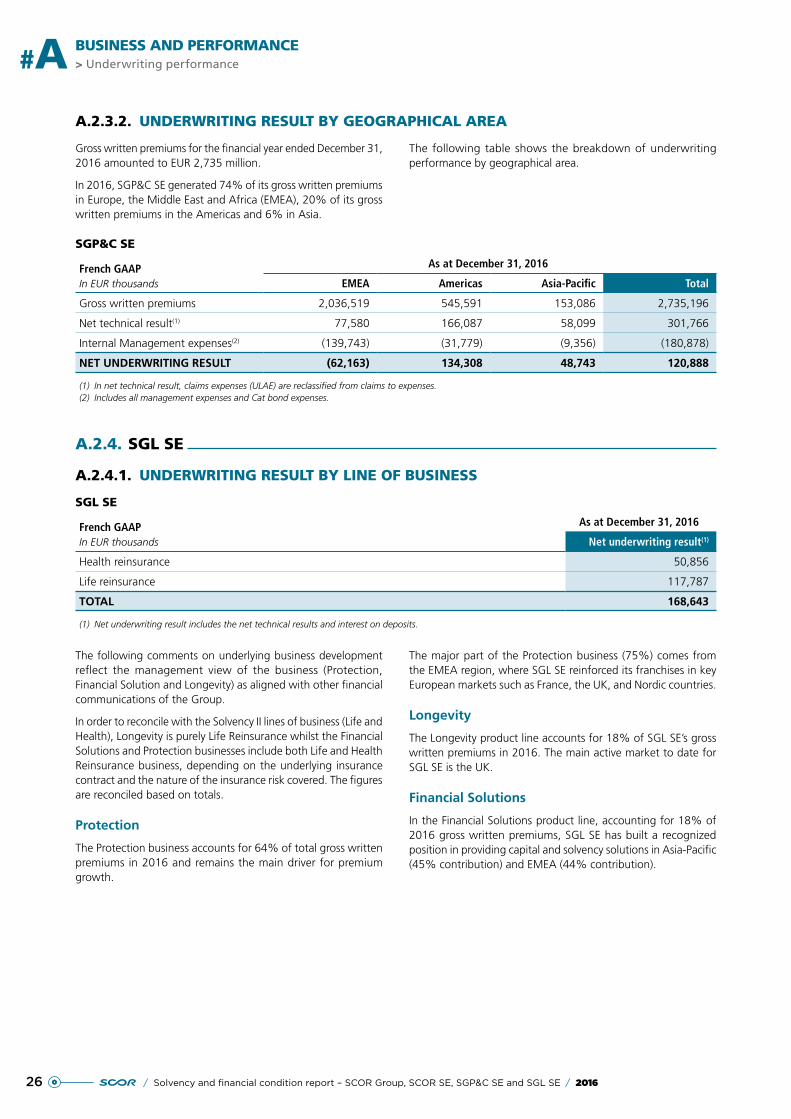
26 / Solvency and financial condition report – SCOR Group, SCOR SE, SGP&C SE and SGL SE / 2016
> Underwriting performance#A BUSINESS AND PERFORMANCE
A.2.3.2. UNDERWRITING RESULT BY GEOGRAPHICAL AREA
Gross written premiums for the financial year ended December 31, 2016 amounted to EUR 2,735 million.
In 2016, SGP&C SE generated 74% of its gross written premiums in Europe, the Middle East and Africa (EMEA), 20% of its gross written premiums in the Americas and 6% in Asia.
The following table shows the breakdown of underwriting performance by geographical area.
SGP&C SE
French GAAPIn EUR thousands
As at December 31, 2016
EMEA Americas Asia-Pacific Total
Gross written premiums 2,036,519 545,591 153,086 2,735,196
Net technical result(1) 77,580 166,087 58,099 301,766
Internal Management expenses(2) (139,743) (31,779) (9,356) (180,878)
NET UNDERWRITING RESULT (62,163) 134,308 48,743 120,888
(1) In net technical result, claims expenses (ULAE) are reclassified from claims to expenses.(2) Includes all management expenses and Cat bond expenses.
A.2.4. SGL SE
A.2.4.1. UNDERWRITING RESULT BY LINE OF BUSINESS
SGL SE
French GAAPIn EUR thousands
As at December 31, 2016
Net underwriting result(1)
Health reinsurance 50,856
Life reinsurance 117,787
TOTAL 168,643
(1) Net underwriting result includes the net technical results and interest on deposits.
The following comments on underlying business development reflect the management view of the business (Protection, Financial Solution and Longevity) as aligned with other financial communications of the Group.
In order to reconcile with the Solvency II lines of business (Life and Health), Longevity is purely Life Reinsurance whilst the Financial Solutions and Protection businesses include both Life and Health Reinsurance business, depending on the underlying insurance contract and the nature of the insurance risk covered. The figures are reconciled based on totals.
Protection
The Protection business accounts for 64% of total gross written premiums in 2016 and remains the main driver for premium growth.
The major part of the Protection business (75%) comes from the EMEA region, where SGL SE reinforced its franchises in key European markets such as France, the UK, and Nordic countries.
Longevity
The Longevity product line accounts for 18% of SGL SE’s gross written premiums in 2016. The main active market to date for SGL SE is the UK.
Financial Solutions
In the Financial Solutions product line, accounting for 18% of 2016 gross written premiums, SGL SE has built a recognized position in providing capital and solvency solutions in Asia-Pacific (45% contribution) and EMEA (44% contribution).
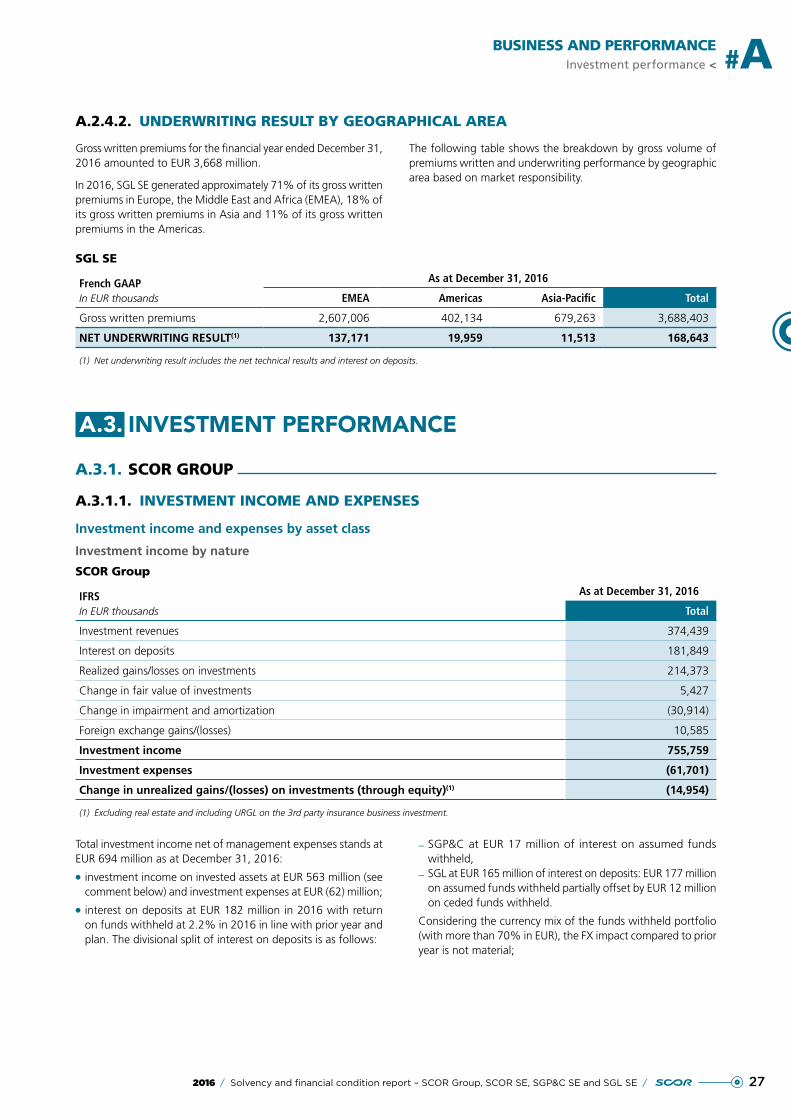
272016 / Solvency and financial condition report – SCOR Group, SCOR SE, SGP&C SE and SGL SE /
BUSINESS AND PERFORMANCEInvestment performance < #A
A.2.4.2. UNDERWRITING RESULT BY GEOGRAPHICAL AREA
Gross written premiums for the financial year ended December 31, 2016 amounted to EUR 3,668 million.
In 2016, SGL SE generated approximately 71% of its gross written premiums in Europe, the Middle East and Africa (EMEA), 18% of its gross written premiums in Asia and 11% of its gross written premiums in the Americas.
The following table shows the breakdown by gross volume of premiums written and underwriting performance by geographic area based on market responsibility.
SGL SE
French GAAPIn EUR thousands
As at December 31, 2016
EMEA Americas Asia-Pacific Total
Gross written premiums 2,607,006 402,134 679,263 3,688,403
NET UNDERWRITING RESULT(1) 137,171 19,959 11,513 168,643
(1) Net underwriting result includes the net technical results and interest on deposits.
A.3. INVESTMENT PERFORMANCE
A.3.1. SCOR GROUP
A.3.1.1. INVESTMENT INCOME AND EXPENSES
Investment income and expenses by asset class
Investment income by nature
SCOR Group
IFRSIn EUR thousands
As at December 31, 2016
Total
Investment revenues 374,439
Interest on deposits 181,849
Realized gains/losses on investments 214,373
Change in fair value of investments 5,427
Change in impairment and amortization (30,914)
Foreign exchange gains/(losses) 10,585
Investment income 755,759
Investment expenses (61,701)
Change in unrealized gains/(losses) on investments (through equity)(1) (14,954)
(1) Excluding real estate and including URGL on the 3rd party insurance business investment.
Total investment income net of management expenses stands at EUR 694 million as at December 31, 2016:
●● investment income on invested assets at EUR 563 million (see comment below) and investment expenses at EUR (62) million;
●● interest on deposits at EUR 182 million in 2016 with return on funds withheld at 2.2% in 2016 in line with prior year and plan. The divisional split of interest on deposits is as follows:
– SGP&C at EUR 17 million of interest on assumed funds withheld,
– SGL at EUR 165 million of interest on deposits: EUR 177 million on assumed funds withheld partially offset by EUR 12 million on ceded funds withheld.
Considering the currency mix of the funds withheld portfolio (with more than 70% in EUR), the FX impact compared to prior year is not material;
28 / Solvency and financial condition report – SCOR Group, SCOR SE, SGP&C SE and SGL SE / 2016
> Investment performance#A BUSINESS AND PERFORMANCE
●● the foreign exchange impact for the year is at EUR 11 million (gain). Despite significant rate fluctuations, SCOR has successfully minimized the volatility in its results arising from foreign exchange. The vast majority of the EUR 11 million comes from an accumulation of smaller hedging differences across all geographies, and also differences in bank valuations. These vary quarter by quarter and, given the size of the Group balance sheet (EUR 43.3 billion), are well within expected levels of volatility.
The change in unrealized gains/losses on investment amounts to EUR (15) million and is recognized through equity. It relates to the asset revaluation reserves on bonds and equities classified as available for sale.
Investment income on invested assets
Compared to total investment income, as shown in the income statement, investment income on invested assets excludes interest on deposits and foreign exchange gains/losses and includes the cost of real estate debt.
2016 was a year of rising political uncertainty for invested assets
The occurrence of unexpected events, such as Britain’s decision to leave the European Union and the surprise US election results, as well as the downturn in commodity prices, have significantly contributed to the change in the economic paradigm, where fears of extended low growth/low inflation have given way to the return of inflation and changes to free trade.
Consequently, the bond markets, after having reached record low interest rate levels in July with -0.20% for German ten-year bonds and 1.35% for US ten-year bonds, have seen negative performances. At the end of 2016, the ten-year German rate is positive once again at 0.2% and the ten-year US yield stands at 2.45%.
Higher inflation expectations are accompanied by better growth prospects, with risk markets such as credit and equity posting strong performances. Thus, the performance of the US high-yield market stands at 17.4% and that of the European market at 9%, the difference emanating mainly from the US high-yield market’s preference for the energy sector. With regard to equities, the US administrations’ pro-cyclical and protectionist program has added significant value to US businesses. Thus, over the year, the Dow Jones posted a performance of 16.5%, the S&P of 11.95% and the Russell 2000 of 21.28%, outperforming the European indices such as the Euro Stoxx 50 (+4.83%) and the CAC 40 (+8.81%).
The energy and finance sectors recorded the best performances, thanks to the rise in oil prices in the first instance and the steepening of yield curves plus deregulation hopes in the second. Thus, over the year, the performance of the MSCI World Energy index stands at 27.6%, and that of the MSCI World Financial index stands at 13.3%. Conversely, the health sector posted a negative performance, for example with the MSCI World Health Care index down by 6.32%.
Income and expenses
Net investment income for the year ended December 31, 2016 amounted to EUR 670 million.
The return on invested assets in 2016 was 2.9%. Trends in investment income were driven essentially by the active portfolio management strategy implemented by SCOR Global Investments, which translated into substantial realized capital gains of EUR 207 million, mostly achieved on real estate and fixed income portfolios and, to a lesser extent, on the other investments portfolio.
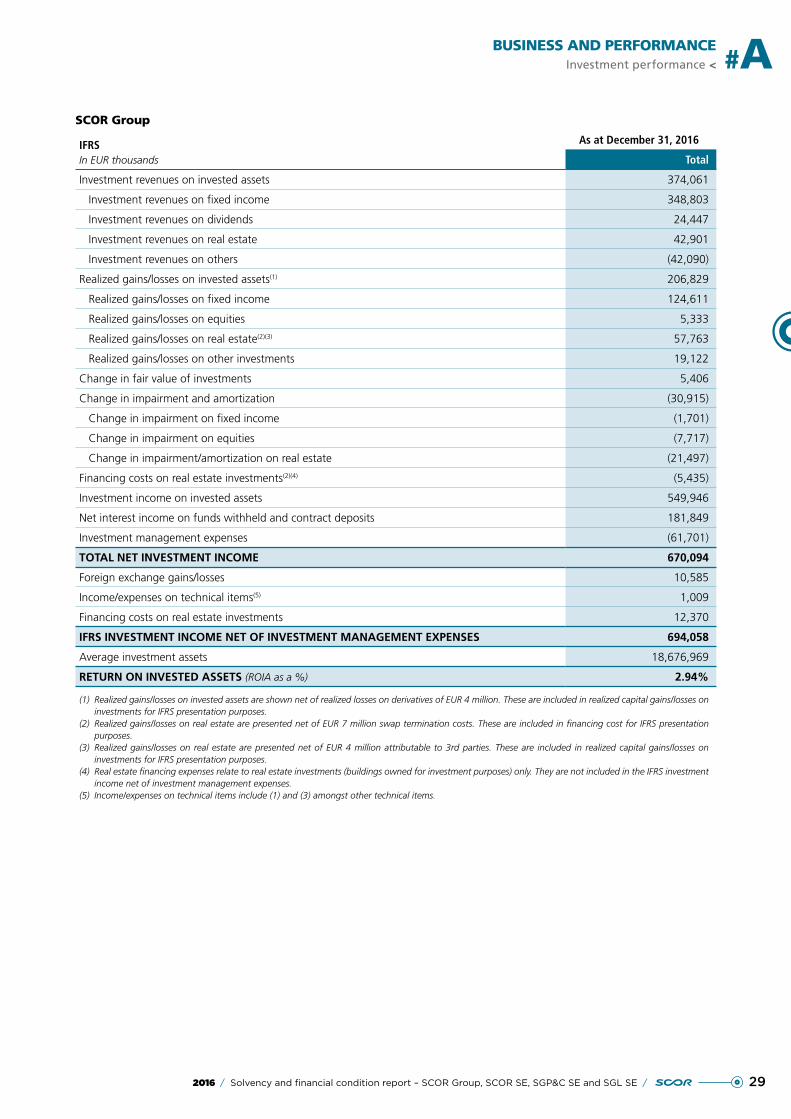
292016 / Solvency and financial condition report – SCOR Group, SCOR SE, SGP&C SE and SGL SE /
BUSINESS AND PERFORMANCEInvestment performance < #A
SCOR Group
IFRSIn EUR thousands
As at December 31, 2016
Total
Investment revenues on invested assets 374,061
Investment revenues on fixed income 348,803
Investment revenues on dividends 24,447
Investment revenues on real estate 42,901
Investment revenues on others (42,090)
Realized gains/losses on invested assets(1) 206,829
Realized gains/losses on fixed income 124,611
Realized gains/losses on equities 5,333
Realized gains/losses on real estate(2)(3) 57,763
Realized gains/losses on other investments 19,122
Change in fair value of investments 5,406
Change in impairment and amortization (30,915)
Change in impairment on fixed income (1,701)
Change in impairment on equities (7,717)
Change in impairment/amortization on real estate (21,497)
Financing costs on real estate investments(2)(4) (5,435)
Investment income on invested assets 549,946
Net interest income on funds withheld and contract deposits 181,849
Investment management expenses (61,701)
TOTAL NET INVESTMENT INCOME 670,094
Foreign exchange gains/losses 10,585
Income/expenses on technical items(5) 1,009
Financing costs on real estate investments 12,370
IFRS INVESTMENT INCOME NET OF INVESTMENT MANAGEMENT EXPENSES 694,058
Average investment assets 18,676,969
RETURN ON INVESTED ASSETS (ROIA as a %) 2.94%
(1) Realized gains/losses on invested assets are shown net of realized losses on derivatives of EUR 4 million. These are included in realized capital gains/losses on investments for IFRS presentation purposes.
(2) Realized gains/losses on real estate are presented net of EUR 7 million swap termination costs. These are included in financing cost for IFRS presentation purposes.
(3) Realized gains/losses on real estate are presented net of EUR 4 million attributable to 3rd parties. These are included in realized capital gains/losses on investments for IFRS presentation purposes.
(4) Real estate financing expenses relate to real estate investments (buildings owned for investment purposes) only. They are not included in the IFRS investment income net of investment management expenses.
(5) Income/expenses on technical items include (1) and (3) amongst other technical items.
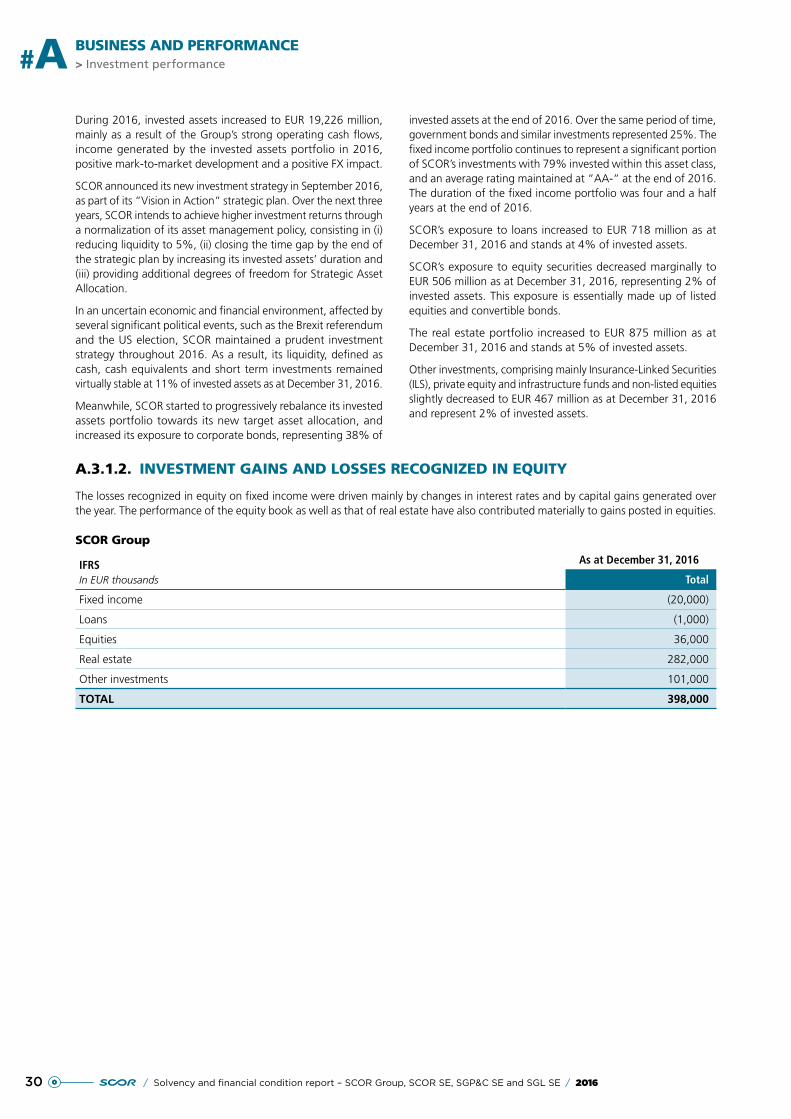
30 / Solvency and financial condition report – SCOR Group, SCOR SE, SGP&C SE and SGL SE / 2016
> Investment performance#A BUSINESS AND PERFORMANCE
During 2016, invested assets increased to EUR 19,226 million, mainly as a result of the Group’s strong operating cash flows, income generated by the invested assets portfolio in 2016, positive mark-to-market development and a positive FX impact.
SCOR announced its new investment strategy in September 2016, as part of its “Vision in Action“ strategic plan. Over the next three years, SCOR intends to achieve higher investment returns through a normalization of its asset management policy, consisting in (i) reducing liquidity to 5%, (ii) closing the time gap by the end of the strategic plan by increasing its invested assets’ duration and (iii) providing additional degrees of freedom for Strategic Asset Allocation.
In an uncertain economic and financial environment, affected by several significant political events, such as the Brexit referendum and the US election, SCOR maintained a prudent investment strategy throughout 2016. As a result, its liquidity, defined as cash, cash equivalents and short term investments remained virtually stable at 11% of invested assets as at December 31, 2016.
Meanwhile, SCOR started to progressively rebalance its invested assets portfolio towards its new target asset allocation, and increased its exposure to corporate bonds, representing 38% of
invested assets at the end of 2016. Over the same period of time, government bonds and similar investments represented 25%. The fixed income portfolio continues to represent a significant portion of SCOR’s investments with 79% invested within this asset class, and an average rating maintained at “AA-“ at the end of 2016. The duration of the fixed income portfolio was four and a half years at the end of 2016.
SCOR’s exposure to loans increased to EUR 718 million as at December 31, 2016 and stands at 4% of invested assets.
SCOR’s exposure to equity securities decreased marginally to EUR 506 million as at December 31, 2016, representing 2% of invested assets. This exposure is essentially made up of listed equities and convertible bonds.
The real estate portfolio increased to EUR 875 million as at December 31, 2016 and stands at 5% of invested assets.
Other investments, comprising mainly Insurance-Linked Securities (ILS), private equity and infrastructure funds and non-listed equities slightly decreased to EUR 467 million as at December 31, 2016 and represent 2% of invested assets.
A.3.1.2. INVESTMENT GAINS AND LOSSES RECOGNIZED IN EQUITY
The losses recognized in equity on fixed income were driven mainly by changes in interest rates and by capital gains generated over the year. The performance of the equity book as well as that of real estate have also contributed materially to gains posted in equities.
SCOR Group
IFRSIn EUR thousands
As at December 31, 2016
Total
Fixed income (20,000)
Loans (1,000)
Equities 36,000
Real estate 282,000
Other investments 101,000
TOTAL 398,000
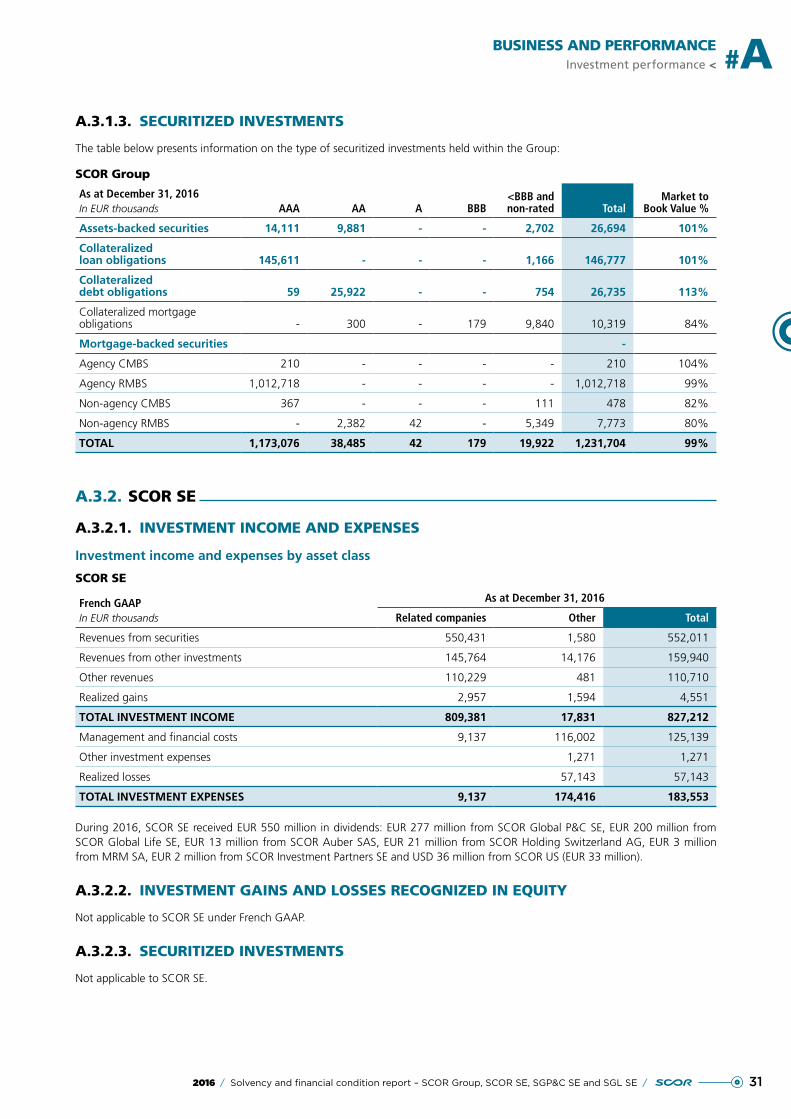
312016 / Solvency and financial condition report – SCOR Group, SCOR SE, SGP&C SE and SGL SE /
BUSINESS AND PERFORMANCEInvestment performance < #A
A.3.1.3. SECURITIZED INVESTMENTS
The table below presents information on the type of securitized investments held within the Group:
SCOR Group
As at December 31, 2016In EUR thousands AAA AA A BBB
<BBB and non-rated Total
Market to Book Value %
Assets-backed securities 14,111 9,881 - - 2,702 26,694 101%
Collateralized loan obligations 145,611 - - - 1,166 146,777 101%
Collateralized debt obligations 59 25,922 - - 754 26,735 113%
Collateralized mortgage obligations - 300 - 179 9,840 10,319 84%
Mortgage-backed securities -
Agency CMBS 210 - - - - 210 104%
Agency RMBS 1,012,718 - - - - 1,012,718 99%
Non-agency CMBS 367 - - - 111 478 82%
Non-agency RMBS - 2,382 42 - 5,349 7,773 80%
TOTAL 1,173,076 38,485 42 179 19,922 1,231,704 99%
A.3.2. SCOR SE
A.3.2.1. INVESTMENT INCOME AND EXPENSES
Investment income and expenses by asset class
SCOR SE
French GAAPIn EUR thousands
As at December 31, 2016
Related companies Other Total
Revenues from securities 550,431 1,580 552,011
Revenues from other investments 145,764 14,176 159,940
Other revenues 110,229 481 110,710
Realized gains 2,957 1,594 4,551
TOTAL INVESTMENT INCOME 809,381 17,831 827,212
Management and financial costs 9,137 116,002 125,139
Other investment expenses 1,271 1,271
Realized losses 57,143 57,143
TOTAL INVESTMENT EXPENSES 9,137 174,416 183,553
During 2016, SCOR SE received EUR 550 million in dividends: EUR 277 million from SCOR Global P&C SE, EUR 200 million from SCOR Global Life SE, EUR 13 million from SCOR Auber SAS, EUR 21 million from SCOR Holding Switzerland AG, EUR 3 million from MRM SA, EUR 2 million from SCOR Investment Partners SE and USD 36 million from SCOR US (EUR 33 million).
A.3.2.2. INVESTMENT GAINS AND LOSSES RECOGNIZED IN EQUITY
Not applicable to SCOR SE under French GAAP.
A.3.2.3. SECURITIZED INVESTMENTS
Not applicable to SCOR SE.
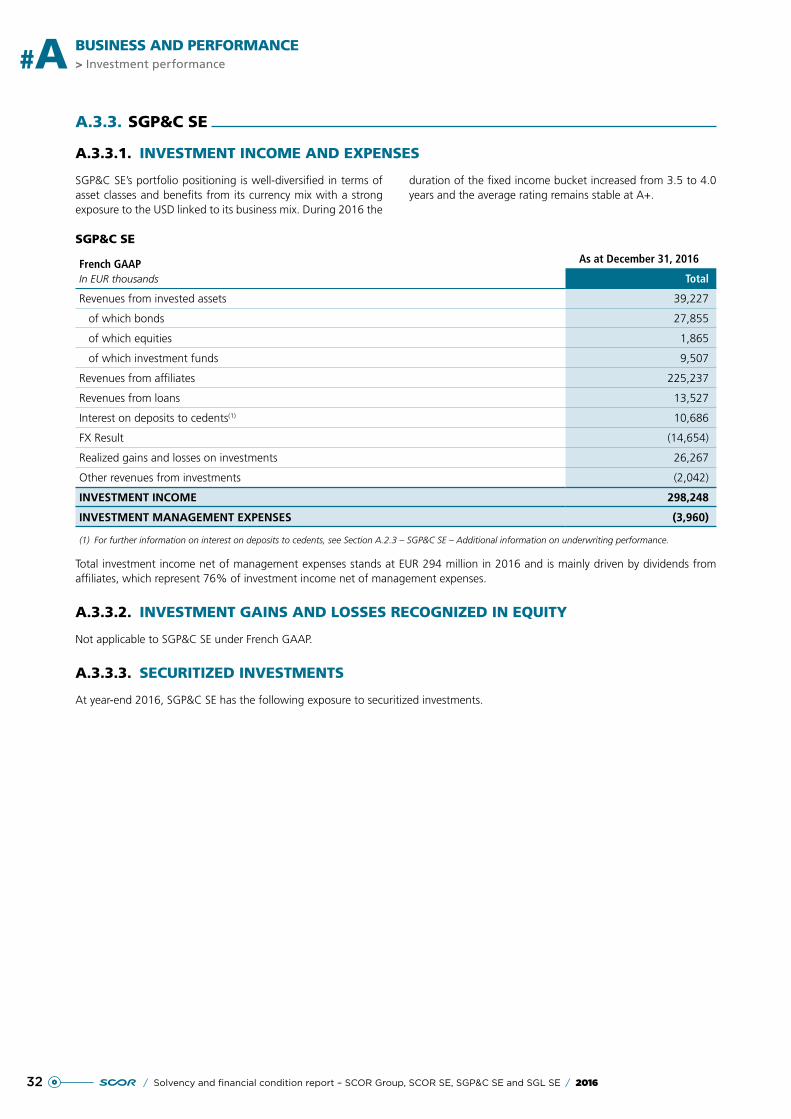
32 / Solvency and financial condition report – SCOR Group, SCOR SE, SGP&C SE and SGL SE / 2016
> Investment performance#A BUSINESS AND PERFORMANCE
A.3.3. SGP&C SE
A.3.3.1. INVESTMENT INCOME AND EXPENSES
SGP&C SE’s portfolio positioning is well-diversified in terms of asset classes and benefits from its currency mix with a strong exposure to the USD linked to its business mix. During 2016 the
duration of the fixed income bucket increased from 3.5 to 4.0 years and the average rating remains stable at A+.
SGP&C SE
French GAAPIn EUR thousands
As at December 31, 2016
Total
Revenues from invested assets 39,227
of which bonds 27,855
of which equities 1,865
of which investment funds 9,507
Revenues from affiliates 225,237
Revenues from loans 13,527
Interest on deposits to cedents(1) 10,686
FX Result (14,654)
Realized gains and losses on investments 26,267
Other revenues from investments (2,042)
INVESTMENT INCOME 298,248
INVESTMENT MANAGEMENT EXPENSES (3,960)
(1) For further information on interest on deposits to cedents, see Section A.2.3 – SGP&C SE – Additional information on underwriting performance.
Total investment income net of management expenses stands at EUR 294 million in 2016 and is mainly driven by dividends from affiliates, which represent 76% of investment income net of management expenses.
A.3.3.2. INVESTMENT GAINS AND LOSSES RECOGNIZED IN EQUITY
Not applicable to SGP&C SE under French GAAP.
A.3.3.3. SECURITIZED INVESTMENTS
At year-end 2016, SGP&C SE has the following exposure to securitized investments.
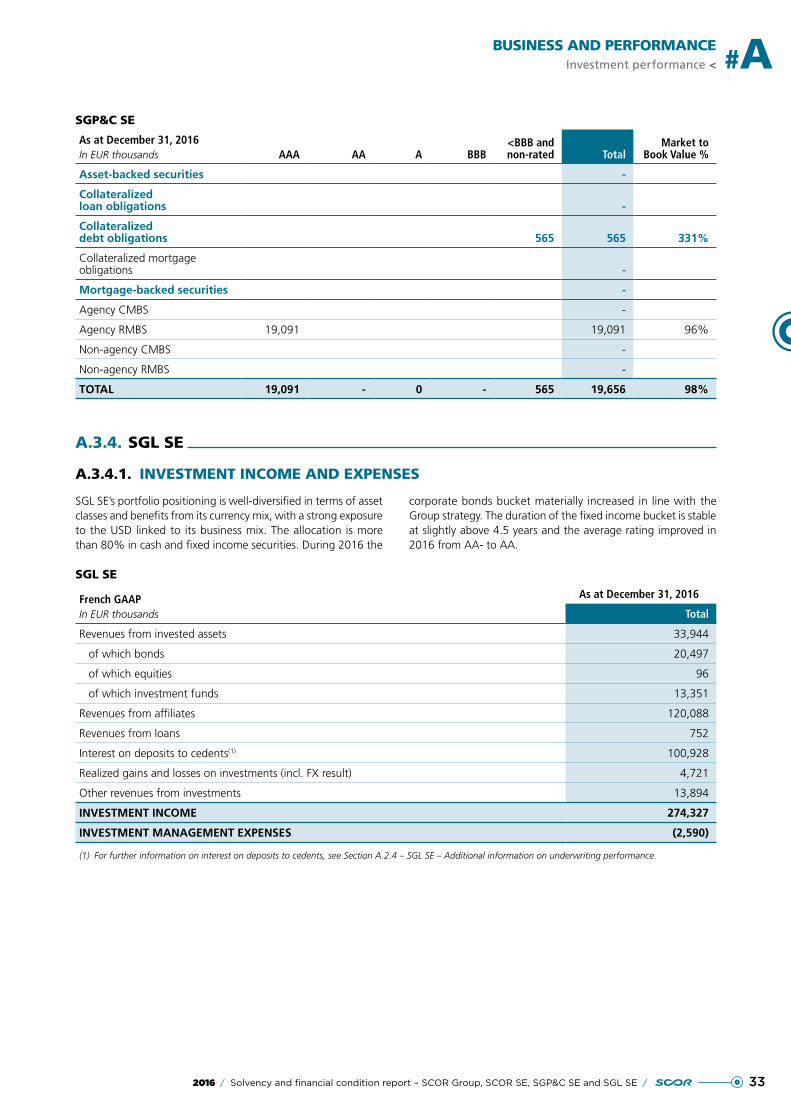
332016 / Solvency and financial condition report – SCOR Group, SCOR SE, SGP&C SE and SGL SE /
BUSINESS AND PERFORMANCEInvestment performance < #A
SGP&C SE
As at December 31, 2016In EUR thousands AAA AA A BBB
<BBB and non-rated Total
Market to Book Value %
Asset-backed securities -
Collateralized loan obligations -
Collateralized debt obligations 565 565 331%
Collateralized mortgage obligations -
Mortgage-backed securities -
Agency CMBS -
Agency RMBS 19,091 19,091 96%
Non-agency CMBS -
Non-agency RMBS -
TOTAL 19,091 - 0 - 565 19,656 98%
A.3.4. SGL SE
A.3.4.1. INVESTMENT INCOME AND EXPENSES
SGL SE’s portfolio positioning is well-diversified in terms of asset classes and benefits from its currency mix, with a strong exposure to the USD linked to its business mix. The allocation is more than 80% in cash and fixed income securities. During 2016 the
corporate bonds bucket materially increased in line with the Group strategy. The duration of the fixed income bucket is stable at slightly above 4.5 years and the average rating improved in 2016 from AA- to AA.
SGL SE
French GAAPIn EUR thousands
As at December 31, 2016
Total
Revenues from invested assets 33,944
of which bonds 20,497
of which equities 96
of which investment funds 13,351
Revenues from affiliates 120,088
Revenues from loans 752
Interest on deposits to cedents(1) 100,928
Realized gains and losses on investments (incl. FX result) 4,721
Other revenues from investments 13,894
INVESTMENT INCOME 274,327
INVESTMENT MANAGEMENT EXPENSES (2,590)
(1) For further information on interest on deposits to cedents, see Section A.2.4 – SGL SE – Additional information on underwriting performance.
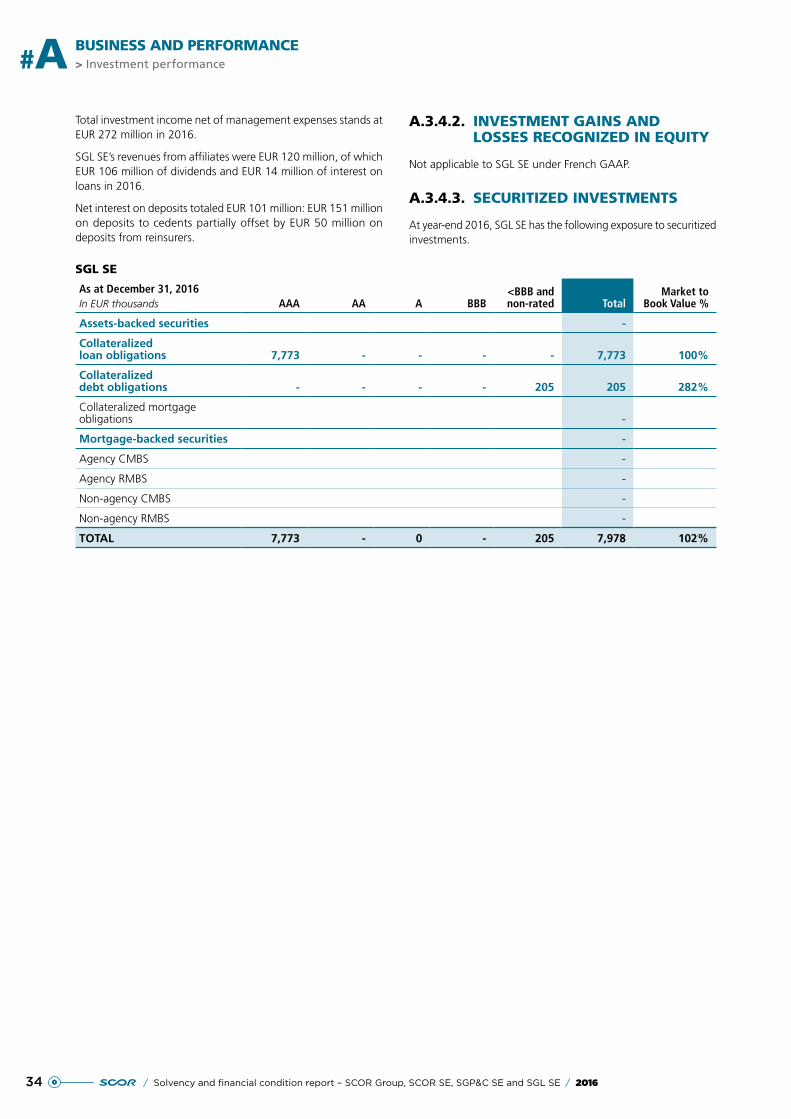
34 / Solvency and financial condition report – SCOR Group, SCOR SE, SGP&C SE and SGL SE / 2016
> Investment performance#A BUSINESS AND PERFORMANCE
Total investment income net of management expenses stands at EUR 272 million in 2016.
SGL SE’s revenues from affiliates were EUR 120 million, of which EUR 106 million of dividends and EUR 14 million of interest on loans in 2016.
Net interest on deposits totaled EUR 101 million: EUR 151 million on deposits to cedents partially offset by EUR 50 million on deposits from reinsurers.
A.3.4.2. INVESTMENT GAINS AND LOSSES RECOGNIZED IN EQUITY
Not applicable to SGL SE under French GAAP.
A.3.4.3. SECURITIZED INVESTMENTS
At year-end 2016, SGL SE has the following exposure to securitized investments.
SGL SE
As at December 31, 2016In EUR thousands AAA AA A BBB
<BBB and non-rated Total
Market to Book Value %
Assets-backed securities -
Collateralized loan obligations 7,773 - - - - 7,773 100%
Collateralized debt obligations - - - - 205 205 282%
Collateralized mortgage obligations -
Mortgage-backed securities -
Agency CMBS -
Agency RMBS -
Non-agency CMBS -
Non-agency RMBS -
TOTAL 7,773 - 0 - 205 7,978 102%
352016 / Solvency and financial condition report – SCOR Group, SCOR SE, SGP&C SE and SGL SE /
BUSINESS AND PERFORMANCEAny other information < #A
A.4. PERFORMANCE OF OTHER ACTIVITIES
OPERATING LEASE CONTRACTS
Payments for operating leases relate primarily to rental payments for offices and business premises of the Group. They include extension options as well as restrictions regarding subleases. The main lease contracts are for the US and Zurich offices. See
Chapter D – Valuation for solvency purposes, Sections D.1.2 – Property, plant and equipment and D.3.5 – Other liabilities of this report for further information.
FINANCE LEASE CONTRACTS
No material finance lease contracts were utilized by SCOR over the reporting period.
OTHER ACTIVITIES
No material income and expense was incurred by SCOR over the reporting period other than the income and expense presented above in Sections A.2 – Underwriting performance and A.3 – Investment performance.
A.5. ANY OTHER INFORMATION
No material information is reported regarding SCOR’s business and performance, other than presented above in Sections A.1 – Business, A.2 – Underwriting performance and A.3 – Investment performance.
36 / Solvency and financial condition report – SCOR Group, SCOR SE, SGP&C SE and SGL SE / 2016
SYSTEM OF GOVERNANCE
#B
B.1. GENERAL INFORMATION ON THE SYSTEM OF GOVERNANCE 38
B.1.1. General governance principles 38
B.1.2. Legal structure and functional organization of SCOR Group 38
B.1.3. Governance structure at Group and legal entity level 40
B.1.4. Material changes in governance in 2016 49
B.1.5. Material transactions with shareholders, persons who exercise significant influence or members of the AMSB 50
B.1.6. Compensation policy and practices regarding the members of the administrative, management or supervisory bodies and employees 51
B.2. FIT AND PROPER REQUIREMENTS 54
B.2.1. Objectives and general principles 54
B.2.2. Scope of SCOR’s fit and proper principles 54
B.2.3. Fitness criteria 54
B.2.4. Propriety criteria 56
B.2.5. Fit and proper assessment process 56
B.2.6. SCOR SE – Information on fit and proper requirements 57
B.2.7. SGP&C SE – Information on fit and proper requirements 57
B.2.8. SGL SE – Information on fit and proper requirements 57
372016 / Solvency and financial condition report – SCOR Group, SCOR SE, SGP&C SE and SGL SE /
B.3. RISK MANAGEMENT SYSTEM INCLUDING THE OWN RISK AND SOLVENCY ASSESSMENT (ORSA) 57
B.3.1. Risk appetite framework 57
B.3.2. ERM framework 58
B.3.3. Internal model contribution to the ERM framework 62
B.3.4. ORSA contribution to the risk management system 63
B.3.5. SCOR SE – Information on the risk management system 63
B.3.6. SGP&C SE – Information on the risk management system 63
B.3.7. SGL SE – Information on the risk management system 63
B.4. INTERNAL CONTROL SYSTEM 63
B.4.1. Description of the internal control system 63
B.4.2. Compliance function 64
B.4.3. SCOR SE – Information on the ICS and the compliance function 65
B.4.4. SGP&C SE – Information on the ICS and compliance function 65
B.4.5. SGL SE – Information on the ICS and compliance function 66
B.5. INTERNAL AUDIT 66
B.5.1. Internal audit organization at Group level 66
B.5.2. SCOR SE – Information on the internal audit function 67
B.5.3. SGP&C SE – Information on the internal audit function 67
B.5.4. SGL SE – Information on the internal audit function 67
B.6. ACTUARIAL FUNCTION 67
B.6.1. Implementation of the actuarial function 67
B.6.2. SCOR SE – Information on the actuarial function 68
B.6.3. SGP&C SE – Information on the actuarial function 68
B.6.4. SGL SE – Information on the actuarial function 68
B.7. OUTSOURCING 68
B.7.1. Outsourcing principles and organization 68
B.7.2. Main activities outsourced to external service providers 69
B.7.3. Main intragroup outsourcing arrangements 69
B.7.4. SCOR SE – Information on outsourcing 70
B.7.5. SGP&C SE – Information on outsourcing 70
B.7.6. SGL SE – Information on outsourcing 70
B.8. OTHER MATERIAL INFORMATION REGARDING THE SYSTEM OF GOVERNANCE 71
38 / Solvency and financial condition report – SCOR Group, SCOR SE, SGP&C SE and SGL SE / 2016
> General information on the system of governance#B SYSTEM OF GOVERNANCE
B.1. GENERAL INFORMATION ON THE SYSTEM OF GOVERNANCE
B.1.1. GENERAL GOVERNANCE PRINCIPLES
SCOR has an objective of adopting best practices with regards to governance as it contributes to meeting its strategic objectives and ensuring an appropriate management of risks. The governance of SCOR SE and of SCOR Group derives from the following objectives:
●● compliance with applicable laws in the countries where it operates, and in particular, for SCOR SE, with the French Commercial Code, the French Monetary and Financial Code, the AMF’s General Regulation and the French Insurance Code;
●● pragmatism, simplicity and operating efficiency, allowing for timely and effective decision-making and cost effectiveness;
●● clear allocation of roles and responsibilities, including clear reporting lines and accountability;
●● checks and balances;
●● fostering of cooperation, internal reporting and communication of information at all relevant levels of the Group;
●● robust management and internal control leveraging on the consistent application of policies, guidelines, procedures and tools such as IT systems;
●● mobilization of skills and expertise;
●● balance between strong governance at Group level involving a global vision and global steering of the business and of risk management, and empowerment of local Boards and management teams, allowing for local specificities to be taken into account;
●● multicentricity, with Group functions being carried out in other geographical locations than Paris in order to benefit fully from the competencies within different locations;
●● efficient flow of information bottom-up and top-down.
B.1.2. LEGAL STRUCTURE AND FUNCTIONAL ORGANIZATION OF SCOR GROUP
B.1.2.1. LEGAL STRUCTURE OF THE GROUP
SCOR operates through a number of legal entities, branches and representative offices all around the world. Its legal structure is outlined on the Company’s website at the following address:
https://www.scor.com/eng/the-group/organisation/legal-documents.html
In addition to the objectives outlined above, the legal structure of the Group is guided by the following principles:
●● support the strategic objectives (solvency and profitability) and operations of the Group;
●● reduce the number of entities and simplify the organization;
●● deliver cost effectiveness;
●● optimize capital management by maximizing capital fungibility;
●● achieve high financial flexibility;
●● comply with local regulations and requirements;
●● access local business and be close to clients’ needs.
Among the legal entities of the SCOR Group, a number of key subsidiaries around the world have external Board members with a view to meeting high corporate governance standards.
B.1.2.2. FUNCTIONAL ORGANIZATION OF THE GROUP
SCOR operates all around the world through several legal entities, branches or representative offices. In order to ensure an appropriate consolidated vision and management of risks and business issues at Group level, and in line with the other objectives outlined in Section B.1.1 – General governance principles, SCOR has put in place a strong functional organization based on divisions and Group functions, as well as on regional Hubs.
B.1.2.3. DIVISIONS AND GROUP FUNCTIONS
The Group is organized around two reinsurance divisions, SCOR Global P&C (property and casualty reinsurance) and SCOR Global Life (Life reinsurance), plus an asset management division, SCOR Global Investments:
●● property and casualty reinsurance operating activities are managed by SCOR’s P&C division, SCOR Global P&C (SGP&C). These activities include the following business areas: Property and Casualty Treaties, Specialty lines, Business Solutions (facultative), Joint-ventures and Partnerships as well as some direct insurance activities based in the United Kingdom and the United States;
392016 / Solvency and financial condition report – SCOR Group, SCOR SE, SGP&C SE and SGL SE /
SYSTEM OF GOVERNANCEGeneral information on the system of governance < #B
●● Life reinsurance operating activities are managed by SCOR’s Life division, SCOR Global Life (SGL). These activities include the following product lines: Protection, Longevity and Financial Solutions and Global Distribution Solutions. Through its Global Distribution Solutions (GDS), SCOR Global Life has successfully deployed a number of innovative and tailored client services which aim to help insurers expand and develop their own client bases (ReMark, Velogica, SCOR Telemed and Rehalto);
●● Asset Management activities are managed by SCOR’s asset management division, SCOR Global Investments (SGI).
SCOR Global P&C, the Group’s Non-Life division, operates worldwide through the branches of two main global reinsurance companies (SCOR Global P&C SE and SCOR SE) and the branches of a global insurance company (SCOR UK Limited) as well as insurance and reinsurance subsidiaries in Spain, Italy, Switzerland, the UK, Germany, South Africa, Russia, the Americas and Asia-Pacific, including China, India, South Korea, Hong Kong and Singapore. The role and organization of SCOR Global P&C SE and of the P&C division are further described in Section B.1.3.3 – Governance of SCOR Global P&C Division and SGP&C SE.
SCOR Global Life, the Group’s Life division, operates worldwide through the branches of two main global reinsurance companies (SCOR Global Life SE and SCOR SE) as well as insurance, reinsurance, distribution and distribution solutions subsidiaries in Germany, the UK, Ireland, Italy, Spain, Switzerland, the Netherlands, Sweden, Belgium, Russia, South Africa, Canada, the United States, Latin America, Australia, New Zealand, China, Singapore, Malaysia and South Korea. The role and organization of SCOR Global Life SE and of the Life division are further described in Section B.1.3.4 – Governance of SGL Division and SGL SE.
SCOR Global Investments, the third division of the Group, manages the investment portfolio of the Group’s legal entities. It is composed of the Group Investment Office and SCOR Investment Partners SE, a portfolio management company, approved by the AMF. The Group Investment Office manages the interaction between the SCOR Group and SCOR Investment Partners in managing risk appetite, monitoring investment risks and setting investment guidelines. SCOR Investment Partners manages the assets of many SCOR Group subsidiaries directly and also manages funds on the behalf of the Group and third party clients.
In addition to the three divisions, three Group functions fulfill duties for the benefit of the whole Group: Finance (including Tax, Accounting, Consolidation and Reporting, Corporate Finance, Treasury and Capital Management), Operations (including Legal and Compliance, Human Resources, IT, Project Office, Communication, Cost Controlling and Budgeting) and Risk (including Actuarial, Risk Management, Prudential Affairs and Internal Model).
Each SCOR employee, whatever the legal entity, is attached to a division or to a Group function.
Beyond legal entity structures and due to the existence of divisions and Group functions, the Group’s subsidiaries, branches and offices are connected through a central network of applications and data exchange platforms, which allow local access to centralized expertise and tools and also give the Group a good overview of local operations and risks.
B.1.2.4. HUB STRUCTURE
SCOR has structured its operations around several regional management platforms, or Hubs: the Paris/London Hub (effective April 15, 2015), the Zurich/Cologne Hub (effective October 1, 2014), the Americas Hub and the Singapore Hub.
Each Hub has local, regional(1) and Group responsibilities, with the heads of each Hub reporting to the Group Chief Operating Officer. Each Hub typically includes the following functions: a director of legal and compliance, a director of Information technology support, a director of finance and a director of human resources. This organization enables:
●● SCOR’s operational structures and support functions to be optimized by creating service entities in charge of managing pooled resources, including information technology, human resources, legal and others in the Group’s main locations;
●● several Group functions to be carried out and managed in geographical locations other than Paris in order to benefit fully from the competencies within different Hubs. The Hubs are not responsible for generating revenues or for underwriting or claims management. The local underwriting and claims management teams have direct reporting lines within the respective P&C and Life divisions. Hub shared service costs are then allocated to the divisions; and
●● the Group to develop a global culture while keeping local specificities.
Management reviews the operating results of the Non-Life and Life operating segments individually to assess the operational performance of the business and to allocate resources.
The Hub structure is designed to facilitate access to local markets through a network of local subsidiaries, branches and representative offices, to better identify profit centers in each major reinsurance market, obtain a deeper understanding of the specific features of local risks and develop local management and underwriting expertise, and thereby improve customer service and maintain relationships with ceding companies. Since the acquisition of the mortality reinsurance business, including the operational assets and personnel, of Transamerica Re, and the acquisition of Generali U.S. Holding Inc., Charlotte, North Carolina, and Kansas City, Missouri have become key locations for the Life division. As part of these integrations, Charlotte and Kansas City have joined New York as key competence centers for the Americas Hub.
(1) Paris/London Hub: South Africa, Europe including Russia and other than Germany, Austria, and Switzerland; Zurich/Cologne Hub: Switzerland, Germany, Austria and Israel and one subsidiary in Argentina; Singapore Hub: Asia and Australia; Americas Hub: North America and Latin America.
40 / Solvency and financial condition report – SCOR Group, SCOR SE, SGP&C SE and SGL SE / 2016
> General information on the system of governance#B SYSTEM OF GOVERNANCE
B.1.3. GOVERNANCE STRUCTURE AT GROUP AND LEGAL ENTITY LEVEL
B.1.3.1. GOVERNANCE OF THE GROUP
The parent company of the Group is SCOR SE. The governance of SCOR SE is presented in Section B.1.3.2 – Governance of SCOR SE.
More generally, the governance bodies of SCOR SE play a key role in the governance of the Group. In particular, the Board of SCOR SE:
●● approves the consolidated accounts;
●● designates the persons effectively running the Group;
●● approves certain Group policies;
●● directly or via its committees, hears the key function holders for the Group at least annually and receives their reports;
●● approves the Group-wide ORSA report.
Directors of SCOR SE may serve as Directors of certain subsidiaries to help ensure the consistency of the governance of the Group. In addition, and to serve the same purpose, the Audit Committee of the Board of SCOR SE receives annually a report on the activities of local audit committees.
Group Executive Committee
The Group Executive Committee is the highest management committee of the SCOR Group.
It is responsible for implementing the strategy defined by the Board of Directors, under the Chief Executive Officer’s authority.
The Group Executive Committee is composed of executives of SCOR SE and its subsidiaries. It enables in particular:
●● bottom-up reporting (from divisions, Group functions and Hubs) to the most senior executives of the Group, including the Chairman and CEO of SCOR SE, through regular reviews or ad hoc presentations of the operations, thereby facilitating the supervision of the Group’s activities;
●● the coordination of all major functional entities of the SCOR Group (divisions, Group functions, Hubs and legal entities);
●● the involvement of the most senior executives of the Group in significant decisions concerning the Group (as well as its three main legal entities SCOR SE, SCOR Global P&C SE and SCOR Global Life SE), prior to these decisions being taken. Pursuant to Article L. 322-3-2 of the French Insurance Code, insurance and reinsurance companies must apply, since January 1, 2016, the “Four Eyes Principle“, which specifies that they must be effectively run by at least two separate persons. The persons effectively running SCOR SE and the Group were designated by SCOR SE’s Board of Directors on November 3, 2015. In addition to Denis Kessler, Chairman and Chief Executive Officer of SCOR SE, they include Victor Peignet, Chief Executive Officer of SCOR Global P&C, and Paolo De Martin, Chief Executive Officer of SCOR Global Life;
●● the preparation of the work of SCOR SE’s Board of Directors, in particular with respect to strategic decisions, and the implementation of its decisions.
The Group Executive Committee regularly gives its sign-off for significant decisions prior to being taken and implemented, should they relate to strategy, business, investments, finance, risks or operations.
On December 31, 2016 the composition of the Group Executive Committee was as follows:
●● the Chairman and CEO of SCOR SE, who chairs it;
●● the CEO of SCOR Global P&C and his deputy;
●● the CEO of SCOR Global Life and his deputy;
●● the CEO of SCOR Global Investments;
●● the Group CFO;
●● the Group COO;
●● the Group CRO.
In addition to the Group Executive Committee, specialized management committees have been put in place in order to review certain topics in more detail, prepare the work of the Group Executive Committee or perform a similar role on specific issues.
Key functions
Key function holders are designated at SCOR SE and Group level.
The French Insurance Code defines four key governance functions as part of a company’s system of governance. These governance functions contribute to the implementation of an effective system of governance that provides for sound and prudent management.
These functions are the following:
●● Risk Management;
●● Compliance;
●● Internal Audit;
●● Actuarial.
The missions, tasks, roles and responsibilities related to these key functions are addressed in the related Group policies, mainly:
●● the Group Policy on Risk Management;
●● the Group Compliance Policy;
●● the Group Internal audit charter;
●● the Group Reserving Policy.
The content of Section B.1.3.2 – Governance of SCOR SE below on SCOR SE’s key function holders (roles and responsibilities, freedom from influence, access to the Board, designation, fit and proper and notification requirements, access to information and records, interactions with the other key functions) also apply to them as Group key function holders.
412016 / Solvency and financial condition report – SCOR Group, SCOR SE, SGP&C SE and SGL SE /
SYSTEM OF GOVERNANCEGeneral information on the system of governance < #B
B.1.3.2. GOVERNANCE OF SCOR SE
Legal form and fundamental rules of governance
SCOR SE is a European company (Societas Europaea) incorporated in France, registered with the Paris Trade and Companies Register. It is the parent company of the SCOR Group.
It is governed by the provisions of Council Regulation (EC) No. 2157/2001, dated October 8, 2001 on the Statute for a European Company (the “SE Regulation“), and by that of the European Council Directive 2001/86/EC of October 8, 2001 supplementing the Statute for a European Company with regard to the involvement of employees, and by the provisions of French law relating to European Companies, as well as for all other matters partially covered or not covered by the SE Regulation, by the French corporate law provisions applicable to sociétés anonymes, where not contrary to the specific provisions applicable to European Companies.
The bylaws of SCOR SE (available on www.scor.com) set forth its corporate purpose and the fundamental rules of its governance.
SCOR SE is listed on NYSE Euronext Paris. SCOR SE shares are also listed on the Six Swiss Exchange (SWX) in Zurich.
SCOR SE is subject to applicable French laws and regulations (including, but not limited to, the French Commercial Code, the AMF Regulation, the French Monetary and Financial Code and the French Insurance Code) and is supervised notably by the AMF and the Autorité de Contrôle Prudentiel et de Résolution (“ACPR“). In application of the July 3, 2008 Act implementing the European Union Directive 2006/46/CE of June 14, 2006, SCOR SE refers to the AFEP-MEDEF corporate governance code for listed companies.
SCOR SE is licensed to carry out reinsurance activities in several countries. It operates through a number of subsidiaries, branches and representative offices. Pursuant to a decision of the Comité des Entreprises d’Assurance dated July 15, 2008, the Company holds a license to operate in Non-Life and Life reinsurance in France. The Company is also authorized to operate:
●● within the European Union pursuant to the European passporting regulation;
●● in other countries where the Company has obtained licenses to write reinsurance business or where operating in reinsurance is not subject to a license.
Board of Directors
Mission of the Board of Directors
In accordance with European law governing European Companies and applicable French law, the principal responsibility of the Board of Directors is to determine the guiding principles of the Company’s business plan and strategy and to monitor their application. With the exception of powers explicitly reserved to shareholders in Shareholders’ Meetings and within the limits of the corporate purpose, the Board addresses all matters related to the Company’s performance and takes decisions regarding business issues concerning the Company. It designates the CEO and the other persons effectively running the Company. It meets with the key function holders for SCOR SE at least annually. It takes part in the sound and prudent management of the Company. It is informed each quarter by management of the financial position,
cash position and commitments of the Company. In accordance with legal provisions, it approves the financial statements, proposes dividends, and makes investment and financial policy decisions. It is informed about market developments, the competitive environment and the most important issues at hand, including in the field of corporate social and environmental responsibility. It approves the Own Risk and Solvency Assessment (“ORSA“) report and takes it into account when making a decisions likely to have a significant impact on the Company. It approves certain policies as well as the SFCR and RSR reports. The Board also carries out the verifications and controls it deems necessary.
Composition of the Board of Directors
SCOR SE’s bylaws provide that the Board of Directors shall comprise no fewer than nine and no more than eighteen members. The actual number of directors may be modified by the shareholders at Shareholders’ Meetings. The Board of Directors cannot by itself increase the number of its members.
Under French law, a director may be an individual or a legal entity for which an individual is appointed as permanent representative, except for the Chairman, who must be an individual. Pursuant to Article L. 225-20 of the French Commercial Code, the permanent representative of a legal entity is subject to the same conditions, obligations and civil and criminal liabilities as if he or she was director in his or her own name, without prejudice to the joint and several liability of the legal entity he or she represents.
The term of office of the directors appointed or renewed, as set forth in SCOR SE’s bylaws, shall not exceed four years. Under SCOR SE’s bylaws, directors may hold office until the age of 77. A director who reaches the age of 77 while in office has to retire at the expiration of his or her term of office, as determined at the Shareholders’ Meeting. Directors are elected by the shareholders and serve until the expiration of their respective term, or until their resignation, death or removal, with or without cause, by the shareholders. Vacancies on the Board of Directors may, under certain conditions, be filled by the Board of Directors, pending the next Shareholders’ Meeting.
The Board of Directors’ composition is guided by the following principles:
●● application of best in class corporate governance practices;
●● appropriate number of Board members in order to allow meaningful individual participation;
●● majority of independent directors, pursuant to criteria adopted by the Board of Directors;
●● diversity of expertise;
●● international experience and diversity of nationalities;
●● high proportion of female Board members.
As of December 31, 2016, the membership of the Board of Directors was as follows:
●● 75% are independent directors (83.3% as at December 31, 2015) and 81.8% excluding the employee director. The Audit Committee is fully composed of independent directors and the Risk Committee is composed of 83.3% of independent directors and 66.7% (80% excluding the employee director) of independent directors for the Compensation and Nomination Committee;
42 / Solvency and financial condition report – SCOR Group, SCOR SE, SGP&C SE and SGL SE / 2016
> General information on the system of governance#B SYSTEM OF GOVERNANCE
●● 58.3% are directors with past experience in the insurance or reinsurance industry, which is the same as at December 31, 2015. The other directors work in the financial sector, banking, legal advisory services and other services;
●● 33.3% are non-French directors (41.6% as at December 31, 2015) with directors who are American, Belgian, British and Swiss;
●● 41.6% are women (33.3% as at December 31, 2015). The composition of the Board of Directors is therefore compliant with the applicable law.
Directors’ duties
Directors are required to comply with applicable law and SCOR SE’s bylaws. Under French law, directors are liable for violations of French legal or regulatory requirements applicable to European Companies, violation of a company’s bylaws or mismanagement (“faute de gestion“). Directors may be held liable for such actions both individually and jointly with other directors.
Each director has a loyalty obligation towards the Company. He or she shall not act in his or her own interest, against SCOR’s interests, and must avoid any situation with risks of conflict of interests.
Pursuant to the Board Internal Charter, each director undertakes not to seek or accept any function, benefit or situation from the Company or from the Group, directly or indirectly, that could jeopardize his or her independence of analysis, judgment or action, during the performance of his or her duties as director. He or she will also dismiss any direct or indirect pressure from other directors, specific groups of shareholders, creditors, suppliers or other third parties.
The Board of Directors of SCOR SE decided, in order to protect the Company’s interests, to implement an internal control program to prevent risks of conflict of interest through:
●● a review by the Audit Committee of related party transactions;
●● an annual review of each director’s situation, in order to analyze his or her independent status and the existence of any potential existing conflicts of interests;
●● its Board Internal Charter, according to which any director in a situation involving a risk of conflict of interest undertakes to resign from his or her position if the conflict situation is not solved;
●● the adoption of a Code of Conduct communicated to all employees. This Code establishes reinforced requirements regarding the prevention of situations with risks of conflict of interests. It is completed by a policy defining the alert procedures (“whistleblowing“) available for employees and which are reported to the Audit Committee.
Functioning of the Board of Directors
The Board of Directors’ meeting held on March 31, 2004 adopted a Board Internal Charter (the “Board Internal Charter“) in order to enhance or specify the rules governing the Board. This Board Internal Charter was amended by successive decisions of the Board of Directors including a decision dated October 26, 2016. It is available on the website of the Company (www.scor.com).
The Board meets at least four times a year. It has set up five Committees in order to examine specific topics, prepare the Board’s proceedings and make recommendations to the Board. Moreover, the non-executive directors’ session is composed of all voting directors, with the exception of the Chairman and Chief Executive Officer and the employee director.
The Strategy Committee
The Strategy Committee’s mission is to examine the Group’s development strategy, including investments in organic growth and major internal restructuring operations, plus any significant operation falling outside of the strategy announced by the Group and to examine any acquisition, merger, asset contribution or disposal in an amount in excess of EUR 100 million.
The Audit Committee
The Audit Committee has two main missions:
●● accounting and financial responsibilities, including the analysis of periodic financial statements, the review of the relevance of choices and correct application of accounting standards, the review of the accounting treatment of any material transaction, the review of the scope of consolidation, the review of significant off-balance sheet commitments, the control of the selection of Statutory Auditors, the review of any accounting and financial reporting documents before they are made public. The Group audit fees for services rendered during the year are subject to a quarterly review and approval by the Audit Committee, with a specific review for non-audit services. The Audit Committee approves the non-core audit fees to ensure that the auditors’ independence is not impaired;
●● ethical, internal control and compliance responsibilities: the Audit Committee is responsible for ensuring that internal procedures relating to the collection and auditing of data guarantee the quality and reliability of the Group’s financial statements. The Audit Committee is also in charge of reviewing agreements with related parties (“conventions réglementées“), analyzing and responding to questions from employees with regard to internal controls, the preparation of financial statements and the treatment of internal accounting books and records. It gives its opinion on the organization of Internal Audit, examines its annual work program, receives internal audit reports and stays informed regarding the implementation of recommendations. Finally, it examines the annual compliance plan and stays informed regarding the Company’s compliance activities.
432016 / Solvency and financial condition report – SCOR Group, SCOR SE, SGP&C SE and SGL SE /
SYSTEM OF GOVERNANCEGeneral information on the system of governance < #B
The Committee may consult the Chief Financial Officer, the Head of Internal Audit, the Heads of the actuarial and compliance functions and the Statutory Auditors on these issues, including when SCOR’s executives are not present. It may also call upon outside experts. During the 2016 financial year, and for each meeting, it met with the Statutory Auditors, the Group Chief Financial Officer (during the review of the financial statements) and the Head of Internal Audit. The review of the financial statements was completed by a presentation made by the Statutory Auditors highlighting the main results of their work and the accounting methods used, as well as by a presentation by the Group Chief Financial Officer describing risk exposure and material off-balance sheet liabilities.
The Risk Committee
The Risk Committee is responsible for examining, notably based on the Own Risk and Solvency Assessment (ORSA), the major risks with which the Company is confronted, both on the assets and liabilities side, and for ensuring that tools for monitoring and controlling these risks are in place. It examines SCOR’s risks and its Enterprise Risk Management (ERM) policy. It studies the Group’s strategic risks (including emerging risks) as well as the Group’s main technical and financial commitments (underwriting, reserving, market, concentration, counterparty, asset-liability management, liquidity and operational risks as well as relating to changes in prudential regulations).
The Compensation and Nomination Committee
The Compensation and Nomination Committee submits recommendations concerning compensation packages for the executive corporate officer, pensions, share allocation plans and stock option plans or stock subscription plans to the Board of Directors and examines proposals related to the composition, organization and functioning of the Board of Directors and its Committees. Its missions are described in the Board Internal Charter.
The Chairman and Chief Executive Officer attends to the tasks in Compensation and Nomination Committee meetings relating to appointments.
The Crisis Management Committee
The Crisis Management Committee meets only when necessary and as many times as it deems necessary.
It is charged with assisting and advising the Board of Directors and proposing to them any necessary measures and decisions in the event of a crisis affecting the Company, the Group or one of its members, as well as following up on such measures and decisions.
The Chairman and Chief Executive Officer must be disqualified from such discussions if the crisis is linked to a subject that relates to him personally.
Non-executive directors’ session
The non-executive directors’ session involves all the directors, with the exception of the employee director and the executive corporate officer of the Company.
This session brings together the non-executive directors so that they can exchange ideas outside the context of Board of Directors’ meetings. It may be called in case of a conflict of interest between the Board and the management team, a non-adherence to the corporate governance code, an inability of the corporate officer
to carry out his duties as a result of an accident or his death, or a proven breach of the code of ethics on the part of the corporate officer.
Lead Independent Director
The Internal Regulations of the Board of SCOR SE provide for the appointment of a Lead Independent Director, from amongst the independent Directors by the Board of Directors upon a proposal by the Compensation and Nomination Committee. He assists the Chairman and CEO in his duties, notably for the organization and functioning of the Board and its Committees and the monitoring of corporate governance and internal control.
He is also in charge of assisting the Board concerning the efficiency of the Company’s corporate governance and advising the Board on the operations in respect of which Board meetings are convened to deliberate. He convenes meetings of the independent directors as often as needed and at least once a year, and he chairs the non-executive directors session.
He advises the directors when they are suspected of being in a situation of conflict of interest.
Chairman and Chief Executive Officer
At its meeting on April 18, 2002 and in compliance with Article L. 225-51-1 of the French Commercial Code and Article 16 of SCOR’s bylaws (“Executive Management“), the Board of Directors of the Company decided that the management of the Company would be carried out under its responsibility by the Chairman of the Board of Directors, with the title of Chairman and Chief Executive Officer, who may be assisted by a Deputy Chief Executive Officer.
Denis Kessler joined the Group on November 4, 2002, with the objective of turning the Company around in the face of a very difficult financial situation. The Board of Directors considered that, in order to achieve this, it was preferable to entrust him with the powers of Chairman of the Board of Directors and of Chief Executive Officer. When his term was renewed in May 2011, the Board of Directors considered that Denis Kessler had demonstrated the benefits of combining the offices of Chairman of the Board of Directors and Chief Executive Officer during the turnaround period experienced by SCOR between 2003 and 2007, and then during the economic crisis between 2007 and 2011. The Board of Directors thus felt it was in the best interests of SCOR, its shareholders and all its employees, for Denis Kessler to be re-appointed as Chairman and Chief Executive Officer and to continue the development of the Group. By combining the roles of Chairman and Chief Executive Officer, the Company benefits from a faster decision-making process and strategic alignment in terms of its governance bodies. Since 2011, SCOR’s results have demonstrated the success of this form of governance and on September 7, 2016 the Board of Directors announced publicly that it had decided unanimously to propose to the Shareholders’ Meeting the extension of Denis Kessler’s directorship for a four-year period, in order for him to be re-appointed by the Board as the Group’s Chairman and Chief Executive Officer.
The Chairman and Chief Executive Officer has executive authority to manage SCOR’s business, subject to the prior authorization of the Board of Directors or the shareholders for certain decisions as required by law and by the Company’s bylaws, and subject to compliance with the French Insurance Code according to which the actual management of SCOR must be carried out by at least
44 / Solvency and financial condition report – SCOR Group, SCOR SE, SGP&C SE and SGL SE / 2016
> General information on the system of governance#B SYSTEM OF GOVERNANCE
two people. The Chairman and Chief Executive Officer has the authority to act on behalf of and in the name of SCOR and to represent SCOR in dealings with third parties, subject only to those powers expressly reserved by law to the Board of Directors or the shareholders. The Chairman and Chief Executive Officer determines, and is responsible for, the implementation of SCOR’s goals, strategies and budgets, which are reviewed and monitored by the Board of Directors.
The Board of Directors has the power to appoint and remove, at any time and with or without cause, the Chairman and Chief Executive Officer, as well as to appoint separate persons to hold the positions of Chairman of the Board (Président du Conseil d’administration) and Chief Executive Officer (Directeur Général). Upon a proposal made by the Chairman and Chief Executive Officer, the Board of Directors may also appoint a Deputy Chief Executive Officer (Directeur Général Délégué) to assist the Chief Executive Officer in managing the business.
During its meeting held on March 4, 2015, the Board of Directors of the Company limited the powers of the Chairman and Chief Executive Officer by stipulating in the Board’s Internal Charter the need for prior Board approval for the following operations:
●● organic growth investments and major internal structuring operations;
●● any significant operation falling outside of the scope of the strategy announced by the Group;
●● any project regarding a sale or acquisition, merger or asset contribution higher than one hundred million euros. In addition, any project regarding a sale, in one or more transactions, concerning at least half of the Company’s assets must be submitted to the Shareholders’ Meeting, as recommended by the AFEP-MEDEF corporate governance code.
Furthermore, in addition to the Chairman and Chief Executive Officer of SCOR SE, two other persons effectively running SCOR SE and the Group have been appointed. Since January 1, 2016, the effective management of the Company and the Group has been overseen by at least two persons, pursuant to the requirements of the French Insurance Code (Code des assurances) (see Section B.1.3.1 – Governance of the Group).
Key functions
The French Insurance Code defines four key governance functions as part of a company’s system of governance. These governance functions contribute to the implementation of an effective system of governance that provides for sound and prudent management.
These functions are the following:
●● Risk Management;
●● Compliance;
●● Internal Audit;
●● Actuarial.
Key functions may be outsourced (if only partially) to other entities, in accordance with the rules laid out in the Group Outsourcing Policy. See Section B.7 – Outsourcing for further details.
Roles and responsibilities
For further information on roles and responsibilities of key functions, please refer to the sections below dedicated to this subject, in particular Section B.3 – Risk management system, Section B.4 – Internal control system and compliance function, Section B.5 – Internal audit and Section B.6 – Actuarial function.
Freedom from influence
The key function holders carry out their duties in an objective, fair and independent manner. They shall be free from any influence that could impair the performance of their duties.
They operate under the ultimate responsibility of the Chief Executive Officer, through the different levels of management.
Each key function holder has a sufficiently high rank in the organization and is in a position to conduct his/her activities in an independent manner. The standing and authority of the key function holders in the main management governing bodies that are relevant with respect to their role allow them to execute their tasks with the level of independence required as set forth by the French Insurance Code. In addition, key function holders interact regularly with the Board members and with the persons effectively running the company.
Access to the Board
The key function holders meet, at least once a year, with the Board of Directors of SCOR SE, or one of its specialized Committees.
Besides, the Board of Directors of SCOR SE and its specialized Committees may contact the key function holders at their discretion, upon request from their respective Chairmen.
Moreover, the key function holders have a direct access to SCOR SE’s Board of Directors in conformance with article L. 322-3-2 of the French Insurance Code. This procedure involves the key function holder, the Chairman of the Board of Directors and if the matter requires it the Chairman of the relevant Board Committee, and ultimately the Board of Directors. This procedure was approved by SCOR SE’s Board of Directors on November 3, 2015.
Designation, fit and proper requirements and notification requirement
SCOR SE’s key function holders are designated by the CEO of SCOR SE. They are subject to specific Fit and Proper requirements which are set out in the Group Fit and Proper Policy (see Section B.2 – Fit and proper requirements). Upon designation, key function holders are notified to the ACPR.
Access to information and records
Key function holders are able to communicate on their own initiative with any staff member and to obtain access to any relevant information to carry out their responsibilities. In the event Group key function holders face difficulties in accessing relevant information, they shall refer the issue to the CEO of SCOR SE for arbitration.
Interaction with other key function holders
The key function holders shall interact with one another, especially in order to exchange information relevant to each other’s areas of competence.
For further information on these interactions, refer to the respective dedicated below sections, in particular Section B.3 – Risk management system including the Own Risk and Solvency Assessment (ORSA), Section B.4 – Internal control system, Section B.5 – Internal Audit and Section B.6 – Actuarial function.
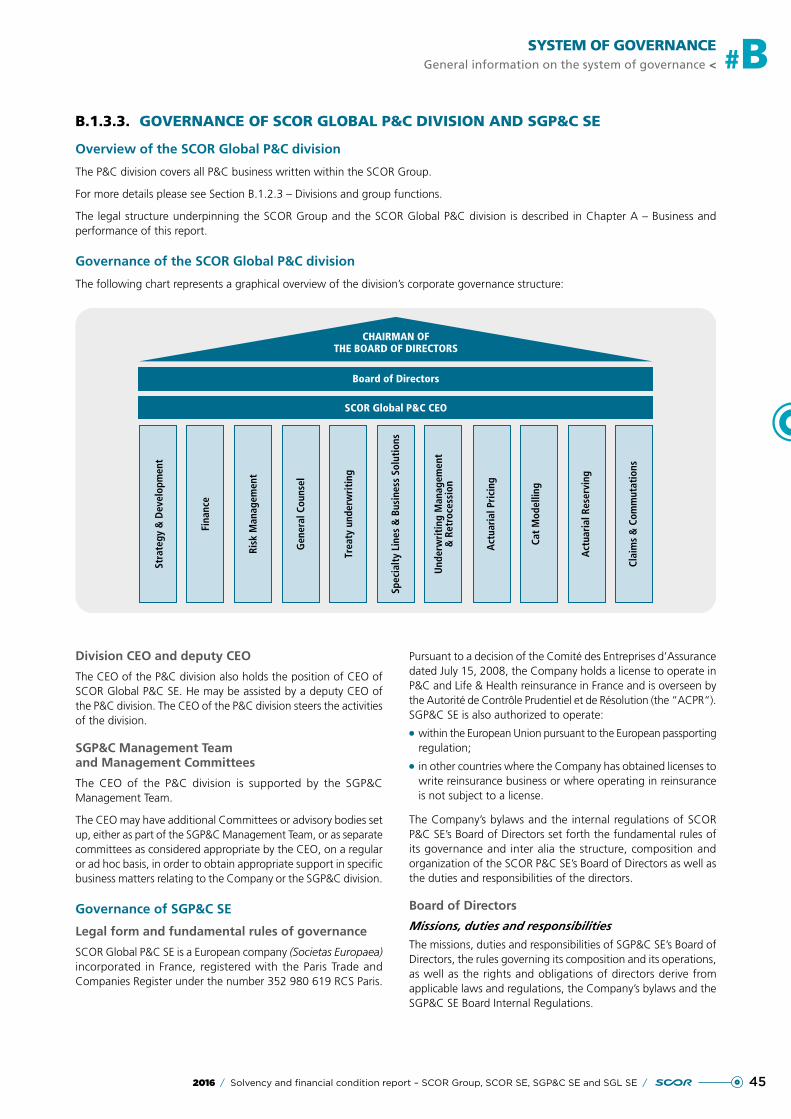
452016 / Solvency and financial condition report – SCOR Group, SCOR SE, SGP&C SE and SGL SE /
SYSTEM OF GOVERNANCEGeneral information on the system of governance < #B
B.1.3.3. GOVERNANCE OF SCOR GLOBAL P&C DIVISION AND SGP&C SE
Overview of the SCOR Global P&C division
The P&C division covers all P&C business written within the SCOR Group.
For more details please see Section B.1.2.3 – Divisions and group functions.
The legal structure underpinning the SCOR Group and the SCOR Global P&C division is described in Chapter A – Business and performance of this report.
Governance of the SCOR Global P&C division
The following chart represents a graphical overview of the division’s corporate governance structure:
Board of Directors
SCOR Global P&C CEO
Stra
tegy
& D
evel
opm
ent
Fina
nce
Risk
Man
agem
ent
Gen
eral
Cou
nsel
Trea
ty u
nder
wri
ting
Spec
ialt
y Li
nes
& B
usin
ess
Solu
tion
s
Und
erw
riti
ng M
anag
emen
t&
Ret
roce
ssio
n
Act
uari
al P
rici
ng
Cat
Mod
ellin
g
Act
uari
al R
eser
ving
Clai
ms
& C
omm
utat
ions
CHAIRMAN OFTHE BOARD OF DIRECTORS
Division CEO and deputy CEO
The CEO of the P&C division also holds the position of CEO of SCOR Global P&C SE. He may be assisted by a deputy CEO of the P&C division. The CEO of the P&C division steers the activities of the division.
SGP&C Management Team and Management Committees
The CEO of the P&C division is supported by the SGP&C Management Team.
The CEO may have additional Committees or advisory bodies set up, either as part of the SGP&C Management Team, or as separate committees as considered appropriate by the CEO, on a regular or ad hoc basis, in order to obtain appropriate support in specific business matters relating to the Company or the SGP&C division.
Governance of SGP&C SE
Legal form and fundamental rules of governance
SCOR Global P&C SE is a European company (Societas Europaea) incorporated in France, registered with the Paris Trade and Companies Register under the number 352 980 619 RCS Paris.
Pursuant to a decision of the Comité des Entreprises d’Assurance dated July 15, 2008, the Company holds a license to operate in P&C and Life & Health reinsurance in France and is overseen by the Autorité de Contrôle Prudentiel et de Résolution (the “ACPR“). SGP&C SE is also authorized to operate:
●● within the European Union pursuant to the European passporting regulation;
●● in other countries where the Company has obtained licenses to write reinsurance business or where operating in reinsurance is not subject to a license.
The Company’s bylaws and the internal regulations of SCOR P&C SE’s Board of Directors set forth the fundamental rules of its governance and inter alia the structure, composition and organization of the SCOR P&C SE’s Board of Directors as well as the duties and responsibilities of the directors.
Board of Directors
Missions, duties and responsibilities
The missions, duties and responsibilities of SGP&C SE’s Board of Directors, the rules governing its composition and its operations, as well as the rights and obligations of directors derive from applicable laws and regulations, the Company’s bylaws and the SGP&C SE Board Internal Regulations.
46 / Solvency and financial condition report – SCOR Group, SCOR SE, SGP&C SE and SGL SE / 2016
> General information on the system of governance#B SYSTEM OF GOVERNANCE
In accordance with European law governing European Companies and applicable French law, the main responsibility of the Board of Directors is to determine the guiding principles of the Company’s business plan and strategy and to monitor their application. With the exception of powers explicitly reserved to shareholders in Shareholders’ Meetings and within the limits of the corporate purpose, SGP&C SE’s Board addresses any matters related to the Company’s performance. It presents the year-end accounts of the Company to the shareholders, proposes the dividends and convenes the shareholders’ meetings of the Company. It designates the CEO and the other persons effectively running the Company. It meets with the key function holders for SGP&C SE at least annually. It takes part in the sound and prudent management of the Company. It approves the Own Risk and Solvency Assessment (“ORSA“) report and takes it into account when it makes any decision likely to have a significant impact on the Company. It approves certain policies as well as the SFCR and RSR reports. The Board also carries out the verifications and controls it deems necessary.
Directors are required to comply with applicable law and SCOR Global P&C SE’s bylaws.
Under French laws and regulations, directors are liable for violations of French legal or regulatory requirements applicable to Societas Europaea, violation of a company’s bylaws or mismanagement (faute de gestion). Directors may be held liable for such actions both individually and jointly with the other directors.
Composition of the Board of Directors
Members of SGP&C SE’s Board of Directors are appointed or dismissed by a decision of the General Meeting of the shareholders.
SCOR Global P&C SE’s bylaws provide that SGP&C SE’s Board of Directors is composed of no fewer than three (3) and no more than eighteen (18) members.
Directors are subject to Fit and Proper requirements as detailed in Section B.2 – Fit and proper requirements.
Operations of the Board of Directors
The convening procedures, the holding of meetings and other details of SGP&C SE’s Board of Directors operations are set by the applicable laws and regulations, by the bylaws of SCOR Global P&C SE and by its internal regulations.
Chairman of the Board
The Board members elect a Chairman of the Board.
The Chairman is responsible for organizing and directing the work of SGP&C SE’s Board of Directors, and reports thereon to the Annual Ordinary Shareholders’ Meeting.
Chief Executive Officer (“CEO“)
Responsibility for the general management of the Company lies with the CEO, who according to SCOR Global P&C SE’s bylaws may be the Chairman of the Board of Directors or another individual elected by the Board of Directors and bearing the title of Chief Executive Officer (CEO).
According to French law, the CEO is vested with the most extensive powers to act on behalf of the company in all circumstances. He is granted with all necessary responsibilities by the Board of Directors to fulfil the functions and tasks in conjunction with the general management of the Company and represents SCOR Global P&C SE at all times towards third parties. His exercise of such powers and responsibilities is limited to the corporate purpose of the Company and is subject to the powers specifically conferred to the Board of Directors or the Shareholders’ Meeting as per legal or regulatory provisions or the bylaws of the Company.
The CEO is responsible for defining and implementing the global strategy and objectives of the Company, in line with the Group strategy and objectives, and exercises the general management of the entire business of the Company, branches and representative offices. He has overall management responsibility for the organizational, operational and financial performance of the Company.
Executive Management committees
A number of Executive Management committees have been put in place which facilitate bottom-up reporting and the coordination of the action of all major functional entities of the P&C division.
The scope of these committees includes SCOR Global P&C SE.
Four-eyes principle
Pursuant to Article L. 322-3-2 of the French Insurance Code, the Company must apply the “Four Eyes Principle“, which specifies that it must be effectively run by at least two persons.
The “persons effectively running“ SGP&C SE are subject to Fit and Proper requirements as set out by the Group Fit & Proper policy (see Section B.2 – Fit and proper requirements).
The Chairman of the Board of SGP&C SE was designated by the Board of SGP&C SE as a person effectively running SGP&C SE in addition to the CEO of SGP&C SE on December 15, 2015.The Group Executive Committee regularly gives its sign-off for significant decisions prior to being taken and implemented, should they relate to strategy, business, investments, finance, risks or operations. Since all persons effectively running SGP&C SE belong to the Group Executive Committee, this ensures compliance with the “Four Eyes Principle“.
Key functions
Key functions are conducted at SGP&C SE level under the responsibility of SGP&C SE’s key function holders.
Key functions for SCOR Global P&C SE may be (if only partially) outsourced to other entities, in accordance with the rules set in the Group Outsourcing Policy which also applies to SGP&C SE. See Section B.7 – Outsourcing for further details.
Roles and responsibilities
For further information on the roles and responsibilities of the key function holders, see the dedicated sections below, in particular Section B.3 – Risk management system including the Own Risk and Solvency Assessment (ORSA), Section B.4 – Internal control system, Section B.5 – Internal Audit and Section B.6 – Actuarial function.
472016 / Solvency and financial condition report – SCOR Group, SCOR SE, SGP&C SE and SGL SE /
SYSTEM OF GOVERNANCEGeneral information on the system of governance < #B
Freedom from influence
SCOR Global P&C SE’s key function holders carry out their duties in an objective, fair and independent manner. They shall be free from any influence that could impair the performance of their duties.
They operate under the ultimate responsibility of the Chief Executive Officer, through their management lines.
Each of the key function holders designated for SGP&C SE has a sufficiently high rank in the organization and is in a position to conduct his/her activities in an independent manner. The standing and the authority of the key function holders in the main management governing bodies of relevance in their role allow them to execute their mission with the required level of independence set forth by the French Insurance Code. In addition, the key function holders interact with Board members and with the persons effectively running the company on a regular basis.
Access to the Board
The key function holders meet, at least once a year, with the Board of Directors of SCOR Global P&C SE.
The Board of Directors may contact the key function holders at its discretion.
Moreover, the key function holders have a direct access to SGP&C SE’s Board of Directors in accordance with Article L. 322-3-2 of the French Insurance Code. This procedure involves the key function holders and the Chairman of the Board of Directors. This procedure was approved by SGP&C SE’s Board of Directors on December 15, 2015.
Designation, fit and proper requirements and notification requirement
SCOR Global P&C SE’s key function holders are designated by the CEO. They are subject to specific Fit and Proper requirements which are set out in the Group Fit and Proper Policy (see Section B.2 – Fit and proper requirements). Upon designation, key function holders are notified to the ACPR.
Access to information and records
Key function holders are able to communicate upon their own initiative with any staff member and to obtain access to any relevant information to carry out their responsibilities. In the event that key function holders face difficulties in accessing relevant information, they shall refer the issue to the CEO of SCOR Global P&C SE for arbitration.
Interaction with other key function holders
Key function holders shall interact with one another, especially in order to exchange information relevant to each other’s areas of competence.
In order to facilitate and formalize these interactions, quarterly meetings are held by the key function holders.
For further information on such interactions, see the respective dedicated sections below, in particular Section B.3 – Risk management system including the Own Risk and Solvency Assessment (ORSA), Section B.4 – Internal control system, Section B.5 – Internal Audit and Section B.6 – Actuarial function.
B.1.3.4. GOVERNANCE OF SCOR GLOBAL LIFE DIVISION AND SGL SE
Overview of the SCOR Global Life division
The Life division covers all Life business within the SCOR Group. This includes mortality, morbidity, longevity, financial solutions, accident and health.
For further details, see Section B.1.2.3 – Divisions and group functions.
The legal structure underpinning the SCOR Group and the SCOR Global Life division is described in Chapter A – Business and performance of this report.
Governance of the SCOR Global Life division
Division CEO and deputy CEO
The CEO of the Life division also holds the position of CEO of SGL SE. He may be assisted by a deputy CEO.
SGL Senior Management Team and Management Committees
The CEO of the Life division is supported by the SGL Senior Management Team.
The CEO may have additional Committees or advisory bodies set up as deemed appropriate which facilitate bottom-up reporting, the coordination of the action of all major functional entities of the Life division and the preparation of the work of the division. These Committees include:
●● SGL Risk committee;
●● SGL Investment committee;
●● SGL Reserving committee.
Governance of SGL SE
Legal form and fundamental rules of governance
SGL SE is a European Company (Societas Europaea) incorporated in France, registered with Paris Commercial Register under the number 433 935 558 RCS Paris. Pursuant to a decision of the Comité des Entreprises d’Assurance dated July 15, 2008, the Company holds a license to operate in Life & Health and P&C reinsurance in France and is overseen by the Autorité de Contrôle Prudentiel et de Résolution (the “ACPR“). The Company is also authorized to operate:
●● within the European Union pursuant to the European passporting regulation;
●● in other countries where the Company has obtained local licenses to write reinsurance business or where operating in reinsurance is not subject to license.
The Company’s bylaws and the internal regulations of SGL SE’s Board of Directors set forth the fundamental rules of its governance inter alia the structure, composition and organization of the SGL SE Board of Directors as well as the duties and responsibilities of the directors.
48 / Solvency and financial condition report – SCOR Group, SCOR SE, SGP&C SE and SGL SE / 2016
> General information on the system of governance#B SYSTEM OF GOVERNANCE
Board of Directors
Missions, duties and responsibilities
The missions, duties and responsibilities of SGL SE’s Board of Directors (the “Board of Directors“), the rules governing its composition and its operation, as well as the rights and obligations of directors derive from applicable laws and regulations, the Company’s bylaws of the legal entity and the SGL SE Board Internal Regulations.
In accordance with European law governing European Companies and applicable French law, the main responsibility of the Board of Directors is to determine the guiding principles of the Company’s business plan and strategy and to monitor their application. With the exception of powers explicitly reserved to shareholders in Shareholders’ Meetings and within the limits of the corporate purpose, SGL SE’s Board addresses any matters related to the legal entity’s performance. It presents the year-end accounts of the Company to the shareholders, proposes the dividends and convenes the Shareholders’ Meetings of the Company. It designates the CEO and the persons effectively running the Company. It meets with the key function holders of SGL SE at least annually. It takes part in the sound and prudent management of the Company. It approves the Own Risk and Solvency Assessment (“ORSA“) report and takes it into account when it makes any decision likely to have a significant impact on the Company. It approves certain policies as well as the SFCR and RSR reports. The Board also carries out the verifications and controls it deems necessary.
Directors are required to comply with applicable law and SCOR Global Life SE’s bylaws.
Under French laws and regulations, directors are liable for violations of French legal or regulatory requirements applicable to Societas Europaea, violation of a company’s bylaws or mismanagement (faute de gestion). Directors may be held liable for such actions both individually and jointly with the other directors.
Composition of the Board of Directors
Members of SGL SE’s Board of Directors are appointed or dismissed by decision of the General Meeting of the shareholders.
SGL SE’s bylaws provide that SGL SE’s Board of Directors is composed of no fewer than three (3) and no more than eighteen (18) members.
Directors are subject to Fit and Proper requirements as detailed in Section B.2 – Fit and proper requirements.
Operations of the Board
The convening procedures, the holding of meetings and other details of SGL SE’s Board of Directors operations are set by the applicable laws and regulations, by the bylaws of SGL SE and by its internal regulations.
Chairman of the Board
The Board members elect a Chairman of SGL SE’s Board.
The Chairman is responsible for organizing and directing the work of SGL SE’s Board of Directors, and reports thereon to the Annual Ordinary Shareholders’ Meeting.
Chief Executive Officer (“CEO“)
Duties and responsibilities of the CEO
Responsibility for the general management of SGL SE lies with the CEO, who according to SGL SE’s bylaws may be the Chairman of the Board of Directors or another individual elected by the Board of Directors and bearing the title of Chief Executive Officer (CEO).
According to French law, the CEO is vested with the most extensive powers to act on behalf of the company in all circumstances. He is granted with all necessary responsibilities by the Board of Directors to fulfil the functions and tasks in conjunction with the general management of the Company and represents SGL SE at all times towards third parties. His exercise of such powers and responsibilities is limited to the corporate purpose of the Company and is subject to the powers specifically conferred to the Board of Directors or the Shareholders’ Meeting as per legal or regulatory provisions or the bylaws of the Company.
The CEO is responsible for defining and implementing the global strategy and objectives of the legal entity, in line with the Group strategy and objectives, and exercises the general management of the entire business of SGL SE, branches and representative offices. He has overall management responsibility for the organizational, operational and financial performance of the Company.
Executive Management committees
A number of Executive Management committees have been put in place which facilitate bottom-up reporting and the coordination of the action of all major functional entities of the Life division.
The scope of these committees includes SGL SE.
Four-eyes principle
Pursuant to Article L. 322-3-2 of the French Insurance Code, the legal entity must apply the “Four Eyes Principle“, which specifies that it must be effectively run by at least two persons.
The “persons effectively running“ SGL SE are subject to Fit and Proper requirements as set out by the Group Fit & Proper policy (see Section B.2 – Fit and proper requirements).
The Chairman of the Board of SGL SE was designated by the Board of SGL SE as a person effectively running SGL SE in addition to the CEO of SGL SE on September 23, 2015. The Group Executive Committee regularly gives its sign-off for significant decisions prior to being taken and implemented, should they relate to strategy, business, investments, finance, risks or operations. Since all persons effectively running SGL SE belong to the Group Executive Committee, this ensures compliance with the “Four Eyes Principle“.
Key functions
Key functions are conducted at SGL SE level under the responsibility of SGL SE’s key function holders.
Key functions for SGL SE may be (if only partially) outsourced to other entities, in accordance with the rules set in the Group Outsourcing Policy which also applies to SGL SE. See Section B.7 – Outsourcing for further details.
492016 / Solvency and financial condition report – SCOR Group, SCOR SE, SGP&C SE and SGL SE /
SYSTEM OF GOVERNANCEGeneral information on the system of governance < #B
Roles and responsibilities
For further information on the roles and responsibilities of the key function holders, please refer to the dedicated sections below, in particular Section B.3 – Risk management system including the Own Risk and Solvency Assessment (ORSA), Section B.4 – Internal control system, Section B.5 – Internal Audit and Section B.6 – Actuarial function.
Freedom from influence
SGL SE’s key function holders carry out their duties in an objective, fair and independent manner. They shall be free from any influence that could impair the exercise of their mission.
They operate under the ultimate responsibility of the Chief Executive Officer, through their management lines.
Each of the key function holders designated for SGL SE has a sufficiently high rank in the organization and is in a position to conduct his/her activities in an independent manner. The standing and the authority of the key function holders in the main management governing bodies of relevance in their role allow them to execute their mission with the required level of independence set forth by the French Insurance Code. In addition, the key function holders interact with Board members and with the persons effectively running SGL SE on a regular basis.
Access to the Board
The key function holders meet, at least once a year, with the Board of Directors of SGL SE.
The Board of Directors may also contact the key function holders at its discretion.
Moreover, the key function holders have direct access to SGL SE’s Board of Directors in accordance with Article L. 322-3-2 of
the French Insurance Code. This procedure involves the key function holder and the Chairman of the Board of Directors. This procedure was approved by SGL SE’s Board of Directors on December 15, 2015.
Designation, fit and proper requirements and notification requirement
SGL SE’s key function holders are designated by the CEO. They are subject to specific Fit and Proper requirements which are set out in the Group Fit and Proper Policy (see Section B.2 – Fit and proper requirements). Upon designation, key function holders are notified to the ACPR.
Access to information and records
Key function holders are able to communicate on their own initiative with any staff member and to obtain access to any relevant information to carry out their responsibilities. In the event that key function holders face difficulties in accessing relevant information, they shall refer the issue to the CEO of SGL SE for arbitration.
Interactions with other key function holders
Key function holders shall interact with one another, especially in order to exchange information relevant to each other’s areas of competence. In order to facilitate and formalize these interactions, quarterly meetings are held by the key function holders.
For further information on such interactions, see the respective dedicated sections below, in particular Section B.3 – Risk management system including the Own Risk and Solvency Assessment (ORSA), Section B.4 – Internal control system, Section B.5 – Internal Audit and Section B.6 – Actuarial function.
B.1.4. MATERIAL CHANGES IN GOVERNANCE IN 2016
B.1.4.1. MATERIAL CHANGES AT GROUP AND SCOR SE LEVEL
With effect from January 1, 2016, SCOR SE and the SCOR Group introduced a few material changes to their corporate governance system in light of several Solvency II related requirements, in particular with respect to:
●● the designation of additional persons effectively running SCOR SE and the Group in accordance with Article L. 356-18 of the French Insurance Code;
●● the designation of key function holders for SCOR SE and the Group in accordance with Article L. 356-18 of the French Insurance Code;
●● the set-up of a procedure allowing the key function holders to have access to the Board of Directors in accordance with Article L. 322-3-2 of the French Insurance Code;
●● the modification of the internal regulations of the Board of Directors, notably through the addition of Solvency II related missions.
For information on changes to key functions, see the dedicated sections, in particular Section B.3 – Risk management system including the Own Risk Solvency Assessment (ORSA), Section B.4 – Internal Control System, Section B.5 – Internal audit and Section B.6 – Actuarial function.
B.1.4.2. MATERIAL CHANGES AT SGP&C SE LEVEL
With effect from January 1, 2016, SCOR Global P&C SE introduced a few material changes to its corporate governance system in light of several Solvency II related requirements, in particular with respect to:
●● the designation of the Chairman of the Board as an additional person effectively running the company in accordance with Article L. 322-3-2 of the French Insurance Code;
●● the designation and appointment of key function holders in accordance with Article L. 322-3-2 of the French Insurance Code;
●● the set-up of a procedure allowing the key function holders to have access to the Board of Directors in accordance with Article L. 322-3-2 of the French Insurance Code.
50 / Solvency and financial condition report – SCOR Group, SCOR SE, SGP&C SE and SGL SE / 2016
> General information on the system of governance#B SYSTEM OF GOVERNANCE
For information on changes to key functions, see the dedicated sections below, in particular Section B.3 – Risk management system including the Own Risk Solvency Assessment (ORSA), Section B.4 – Internal control system, Section B.5 – Internal Audit and Section B.6 – Actuarial function.
B.1.4.3. MATERIAL CHANGES AT SGL SE LEVEL
With effect from January 1, 2016, SGL SE introduced a few material changes to its corporate governance system in light of several Solvency II related requirements, in particular with respect to:
●● the designation of the Chairman of the Board as an additional person effectively running the company in accordance with Article L. 322-3-2 of the French Insurance Code;
●● the designation and appointment of key function holders in accordance with Article L. 322-3-2 of the French Insurance Code;
●● the set-up of a procedure allowing the key function holders to have access to the Board of Directors in accordance with Article L. 322-3-2 of the French Insurance Code.
For information on changes to key functions, see the dedicated sections below, in particular Section B.3 – Risk management system including the Own Risk Solvency Assessment (ORSA), Section B.4 – Internal Control System, Section B.5 – Internal Audit and Section B.6 – Actuarial function.
B.1.5. MATERIAL TRANSACTIONS WITH SHAREHOLDERS, PERSONS WHO EXERCISE SIGNIFICANT INFLUENCE OR MEMBERS OF THE AMSB
B.1.5.1. MATERIAL TRANSACTIONS AT GROUP LEVEL
The transactions below have been entered into by the entity SCOR SE as the ultimate parent of SCOR Group. They apply to SCOR as a Group – i.e. involving other entities of the Group – and/or to SCOR SE.
Material transactions with shareholders
For the purpose of this section, SCOR SE takes into account shareholders who are submitted to the obligation to declare their shareholding to the Company pursuant to SCOR SE’s bylaws, i.e. shareholders holding 2.5% or more of the share capital of SCOR SE.
On the basis of this criterion, SCOR SE has had no material transactions with shareholders during the reporting period.
Material transactions with persons who exercise a significant influence
Related party transactions (“Transaction avec les parties liées“) according to the IFRS accounting standard IAS 24
Parties are considered to be related if one party has the ability to directly or indirectly control the other party or exercises significant influence over the other party in making financial or operational decisions.
The Group’s related parties include:
●● key management personnel, close family members of key management personnel, and all entities which are controlled, significantly influenced by, or for which significant voting power is held by key management personnel or their close family members;
●● associates.
The Group has several business relationships with related parties. Transactions with such parties are made in the ordinary course of business and on substantially the same terms and conditions including interest rates and collateral as those prevailing at the same time for comparable transactions with other parties.
SCOR SE is the ultimate parent of the Group.
Transactions with associates for the financial year ended December 31, 2016 were realized on an arm’s length basis and their volume is not material.
Transactions with key management personnel
Key management personnel are those individuals having responsibility and authority for planning, directing and controlling the activities of the Group. The Group considers that the members of the Executive Committee and the Board constitute key management personnel for the purposes of IAS 24.
See the above paragraph on related party transactions for further information.
Agreements and commitments related to the remuneration entitlements of SCOR’s Chairman and CEO
The following agreements and commitments which were approved in prior years by the General Meeting remained current during the year, either with respect to the duration of the Convention or by the effect of an extension.
●● commitment of indemnity in case of forced departure for the benefit of Denis Kessler;
●● Additional Retirement Plan.
512016 / Solvency and financial condition report – SCOR Group, SCOR SE, SGP&C SE and SGL SE /
SYSTEM OF GOVERNANCEGeneral information on the system of governance < #B
See Section B.1.6.3 – Main components of the compensation policy by staff category – Performance criteria.
For more information, see Section 2.3.3 – Special report of the statutory auditors on related party agreements and commitments of the 2016 Registration Document.
Material transactions with members of the AMSB (Administrative Management Supervisory Board)
See Section B.1.6.3 – Main components of the compensation policy by staff category.
B.1.5.2. MATERIAL TRANSACTIONS AT SCOR SE LEVEL
All material transactions with shareholders reported at Group level are concluded by SCOR SE, as the ultimate parent of the Group. See Section B.1.5.1 – Material transactions at Group level for further information on such transactions.
B.1.5.3. MATERIAL TRANSACTIONS AT SGP&C SE LEVEL
Material transactions with shareholders
Under the 50% quota share internal retrocession agreement with SCOR SE, SGP&C SE Paris retrocedes 50% and SGP&C SE Zurich retrocedes 25% of their net retained business portfolios to SCOR SE.
This is a one-year agreement and is renewed automatically if not terminated.
B.1.5.4. MATERIAL TRANSACTIONS AT SGL SE LEVEL
Material transactions with shareholders
Under the 50% quota share internal retrocession agreement with SCOR SE, SGL SE retrocedes 50% of its net retained business from the Madrid, Milan and Paris portfolios to SCOR SE. All reserves are retroceded to SCOR SE on a funds withheld basis.
This is a one-year agreement and is renewed automatically if not terminated.
B.1.6. COMPENSATION POLICY AND PRACTICES REGARDING THE MEMBERS OF THE ADMINISTRATIVE, MANAGEMENT OR SUPERVISORY BODIES AND EMPLOYEES
B.1.6.2. COMPENSATION POLICY OF THE MEMBERS OF THE BOARD OF DIRECTORS
Within SCOR SE, directors’ fees are allocated partly in one fixed sum of EUR 28,000 annually in four equal instalments at the end of each quarter and partly based on the effective presence of the directors at the meetings of the Board of Directors and of its Committees, in an amount equal to EUR 3,000 per Board or per Committee meeting they attend, except for the Chairmen of the Audit Committee, Risk Committee and Compensation and Nomination Committee who receive an amount equal to EUR 6,000 for each meeting of the committee that they chair. Moreover, the individual members of the Board of Directors, with the exception of the Chairman and Chief Executive Officer and the employee director, received EUR 10,000 in SCOR shares on September 8, 2016.
With the exception of the Chairman of the Board of Directors and the employee director, the members of the Board of Directors are not entitled to stock option plans for the subscription or the purchase of shares nor to stock allotment plans from the Company.
No retirement contribution or commitment has been paid or made for the benefit of the directors.
B.1.6.2. GENERAL PRINCIPLES OF THE GROUP COMPENSATION POLICY
SCOR pursues a human capital policy that is in line with the Group’s corporate values, three-year plan and risk appetite. SCOR is committed to:
●● maintaining a compensation policy that is fully in line with its controlled risk appetite and discourages taking excessive risks;
●● aligning management incentives with shareholder value objectives;
●● having an innovative compensation policy which meets the long-term objectives that are part of SCOR’s internal model;
●● motivating and retaining its pool of talent and having a compensation policy aligned with human capital development;
●● fully complying with the regulations and guidelines defined by regulators as regards the compensation policy.
In order to achieve such objectives, SCOR has established a very structured and transparent compensation policy, within an overall framework. It is reviewed and submitted to the Compensation and Nomination Committee and then to the Board of Directors for approval at least once annually. It was last updated in April 2016.
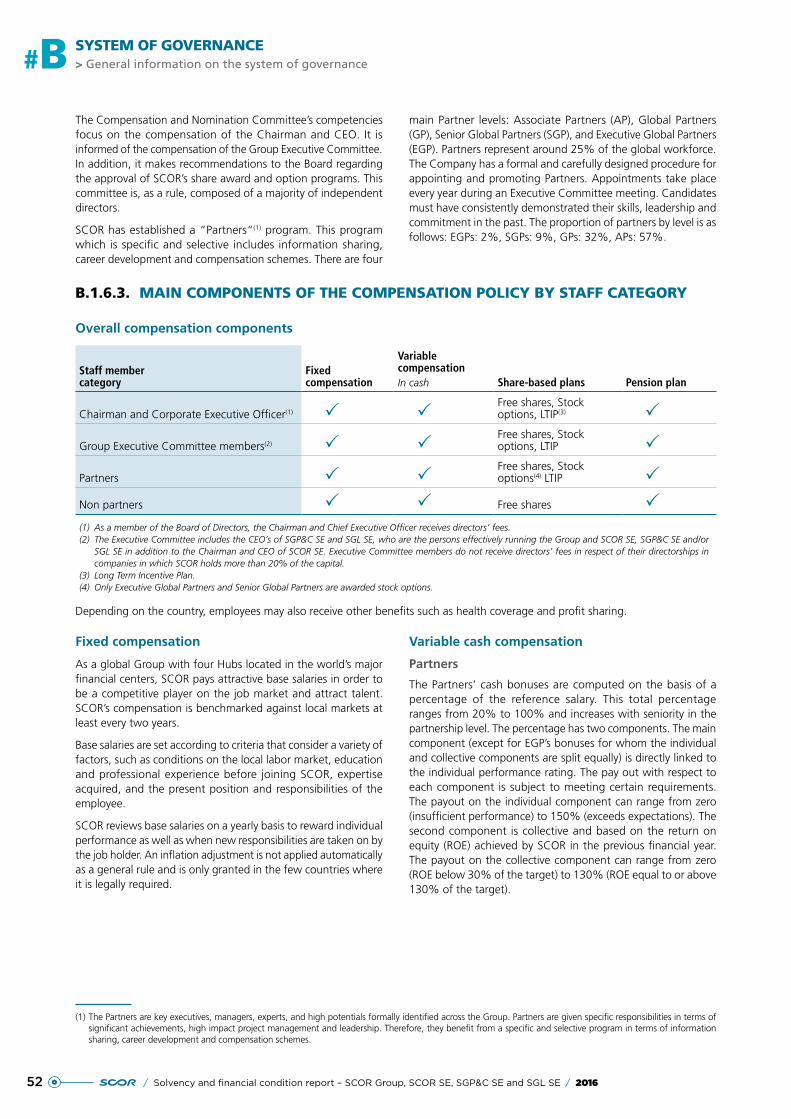
52 / Solvency and financial condition report – SCOR Group, SCOR SE, SGP&C SE and SGL SE / 2016
> General information on the system of governance#B SYSTEM OF GOVERNANCE
The Compensation and Nomination Committee’s competencies focus on the compensation of the Chairman and CEO. It is informed of the compensation of the Group Executive Committee. In addition, it makes recommendations to the Board regarding the approval of SCOR’s share award and option programs. This committee is, as a rule, composed of a majority of independent directors.
SCOR has established a “Partners“(1) program. This program which is specific and selective includes information sharing, career development and compensation schemes. There are four
main Partner levels: Associate Partners (AP), Global Partners (GP), Senior Global Partners (SGP), and Executive Global Partners (EGP). Partners represent around 25% of the global workforce. The Company has a formal and carefully designed procedure for appointing and promoting Partners. Appointments take place every year during an Executive Committee meeting. Candidates must have consistently demonstrated their skills, leadership and commitment in the past. The proportion of partners by level is as follows: EGPs: 2%, SGPs: 9%, GPs: 32%, APs: 57%.
B.1.6.3. MAIN COMPONENTS OF THE COMPENSATION POLICY BY STAFF CATEGORY
Overall compensation components
Staff member category
Fixed compensation
Variable compensationIn cash Share-based plans Pension plan
Chairman and Corporate Executive Officer(1) P PFree shares, Stock options, LTIP(3) P
Group Executive Committee members(2) P PFree shares, Stock options, LTIP P
Partners P PFree shares, Stock options(4) LTIP P
Non partners P P Free shares P(1) As a member of the Board of Directors, the Chairman and Chief Executive Officer receives directors’ fees.(2) The Executive Committee includes the CEO’s of SGP&C SE and SGL SE, who are the persons effectively running the Group and SCOR SE, SGP&C SE and/or
SGL SE in addition to the Chairman and CEO of SCOR SE. Executive Committee members do not receive directors’ fees in respect of their directorships in companies in which SCOR holds more than 20% of the capital.
(3) Long Term Incentive Plan.(4) Only Executive Global Partners and Senior Global Partners are awarded stock options.
Depending on the country, employees may also receive other benefits such as health coverage and profit sharing.
Fixed compensation
As a global Group with four Hubs located in the world’s major financial centers, SCOR pays attractive base salaries in order to be a competitive player on the job market and attract talent. SCOR’s compensation is benchmarked against local markets at least every two years.
Base salaries are set according to criteria that consider a variety of factors, such as conditions on the local labor market, education and professional experience before joining SCOR, expertise acquired, and the present position and responsibilities of the employee.
SCOR reviews base salaries on a yearly basis to reward individual performance as well as when new responsibilities are taken on by the job holder. An inflation adjustment is not applied automatically as a general rule and is only granted in the few countries where it is legally required.
Variable cash compensation
Partners
The Partners’ cash bonuses are computed on the basis of a percentage of the reference salary. This total percentage ranges from 20% to 100% and increases with seniority in the partnership level. The percentage has two components. The main component (except for EGP’s bonuses for whom the individual and collective components are split equally) is directly linked to the individual performance rating. The pay out with respect to each component is subject to meeting certain requirements. The payout on the individual component can range from zero (insufficient performance) to 150% (exceeds expectations). The second component is collective and based on the return on equity (ROE) achieved by SCOR in the previous financial year. The payout on the collective component can range from zero (ROE below 30% of the target) to 130% (ROE equal to or above 130% of the target).
(1) The Partners are key executives, managers, experts, and high potentials formally identified across the Group. Partners are given specific responsibilities in terms of significant achievements, high impact project management and leadership. Therefore, they benefit from a specific and selective program in terms of information sharing, career development and compensation schemes.
532016 / Solvency and financial condition report – SCOR Group, SCOR SE, SGP&C SE and SGL SE /
SYSTEM OF GOVERNANCEGeneral information on the system of governance < #B
The weighting of the individual and collective components is set to better reward the achievement of individual goals at Associate, Global and Senior Global Partner level. Partners can also benefit from an exceptional contribution bonus (ECB) ranging from 0% to 50% of the individual portion of the bonus awarded as a result of a strong contribution to the success of strategic projects or to key strategic achievements.
Other employees
For employees who are not Partners, the SCOR cash bonus rewards individual performance over the previous year. The bonus varies from between 0% to 6% of the annual base salary depending on the rating received in the individual appraisal by the employee’s direct superior. This scale is increased by a multiplier (2 or 3) in some Hubs in order to take into account specific local labor markets.
Non Partners are also eligible for the exceptional contribution bonus, ranging from 0% to 6% of the annual reference salary (the multiplier of two or three mentioned above does not apply to the ECB).
Share-based compensation
SCOR launched the free share and stock option program in 2004 as a means to encourage the retention of, and to strengthen the bond with, executives, managers and talented employees.
Shares and options can only be granted if the Annual General Meeting of Shareholders approves the resolutions to this effect presented by the Board of Directors.
By delegation of the Annual General Meeting of Shareholders, the Board of Directors determines how shares and stock options will be allocated to key personnel within SCOR.
In 2011, the Board of Directors decided to implement a new compensation scheme (Long-term Incentive Plan, “LTIP“) for selected managers and executives of the Group in order to:
●● ensure retention of its key employees while extending the performance measurement period;
●● involve SCOR’s key employees in the Group’s long-term development.
Partners
The allocation of free shares and stock options to Partners depends on their individual performance among other criteria such as strategic project management, commitment, etc. Therefore, an allocation will not necessarily occur every year and not every Partner is guaranteed an allocation.
The vesting of shares and options is subject to satisfying the condition of presence (three to six years depending on the nature of the plan) and performance conditions fully aligned with the objectives of the strategic plan (ROE and Solvency ratio). Moreover, beneficiaries must fully comply with the Group’s Code of Conduct (clawback policy). For more information on the performance conditions of 2016 plans, see Section 2.2.3.4 – Plans providing employee profit sharing of SCOR’s 2016 Registration Document.
Other employees
Free shares may be granted to employees who are not Partners under collective plans that do not include any performance conditions. In addition, under specific circumstances, performance shares can also be granted individually to certain employees who are not Partners.
Pension plans
While respecting national differences, SCOR offers attractive pension plans to its employees that also cover accident and disability in certain countries.
Although SCOR pension plans are not aligned globally, they are set up to meet local needs and legal requirements. They are calibrated in such a way as to allow for attractive total com pensation packages.
Generally, SCOR uses defined contribution pension plans.
Senior executives and members of the Executive Committee who joined SCOR before June 30, 2008 and are employed in France, are entitled to a guaranteed capped pension plan conditional upon a minimum of five years of service with the Group, the payment of which is based on their average compensation over the last five years.
Executive Committee members who are not employed in France benefit from the collective pension schemes in place in their entity. They do not have access to any specific plans with the exception of members with Swiss contracts who benefit from a specific guaranteed pension plan similar to the one granted to Executive Committee members employed in France and hired before June 30, 2008.
For Executive Committee members under French contracts and hired before June 30, 2008 or under Swiss contracts, the amount of the additional pension guaranteed by the Group varies from 5% to 50% of the average compensation over the last five years, depending on seniority acquired in the Group at retirement. The additional pension guaranteed by the Group is calculated after deduction of the pensions paid out through the compulsory schemes and thus shall in no case exceed 45% of the benchmark compensation.
B.1.6.4. COMPENSATION POLICY AND PRACTICES AT SCOR SE LEVEL
SCOR SE conforms strictly to Group policies with possible local adaptation in accordance with local regulations at branch level.
B.1.6.5. COMPENSATION POLICY AND PRACTICES AT SGP&C SE LEVEL
SGP&C SE conforms strictly to Group policies with possible local adaptation in accordance with local regulations at branch level.
B.1.6.6. COMPENSATION POLICY AND PRACTICES AT SGL SE LEVEL
SGL SE conforms strictly to Group policies with possible local adaptation in accordance with local regulations at branch level.
54 / Solvency and financial condition report – SCOR Group, SCOR SE, SGP&C SE and SGL SE / 2016
> Fit and proper requirements#B SYSTEM OF GOVERNANCE
B.2. FIT AND PROPER REQUIREMENTS
The Fit and Proper standards of the SCOR Group are embedded in the SCOR Group Fit and Proper policy. These standards consist of Fit and Proper principles, and criteria to be used to assess
whether a person could be considered as Fit and Proper. The policy also includes an assessment process to be complied with. These elements are further detailed below.
B.2.1. OBJECTIVES AND GENERAL PRINCIPLES
SCOR commits to high “Fit and Proper“ standards.
Standards are adapted to the category of work performed by each individual.
A person is considered as Fit and Proper when he or she fulfils the following requirements at all times:
●● his or her educational background, qualifications and professional experience are adequate to enable sound and prudent management (fitness); and
●● he or she is of good repute and integrity (propriety). SCOR assumes that an individual is proper if there is no obvious evidence suggesting otherwise. Some criminal, civil or disciplinary sanctions are antagonistic with meeting propriety requirements, with no possible remediation. Such sanctions can occur both in an individual’s private life and professional activities.
Fit and Proper standards must be met at all times. Triggering events may require interim reassessments between annual evaluations.
B.2.2. SCOPE OF SCOR’S FIT AND PROPER PRINCIPLES
Standards are adapted to the work performed by each individual. Fit and Proper standards are defined hereinafter for the following categories:
●● category A: Board members (hereafter directors) and Chief Executive Officers of legal entities subject to the Solvency II Directive or where the Board includes external Board members. This category also includes “persons effectively running the company“ under the Solvency II Directive;
●● category B: key function holders (actuarial, internal audit, risk management and compliance) under the Solvency II Directive;
●● category C: other staff.
Fit and Proper standards apply to each individual for the tasks assigned to them.
Fitness standards for Board members are assessed collectively: in particular, the SCOR SE Board is deemed to be fit if, for each subject matter, at least one member is individually fit.
B.2.3. FITNESS CRITERIA
SCOR considers that fitness is an appropriate mix of:
●● relevant educational background and qualifications;
●● relevant knowledge and professional experience.
B.2.3.1. EDUCATIONAL BACKGROUND AND QUALIFICATIONS
Although a high quality educational background is desired, professional experience may in some cases compensate for education gained in fields irrelevant to SCOR’s activities. However, specific requirements may apply for selected individuals (e.g. Chief actuary).
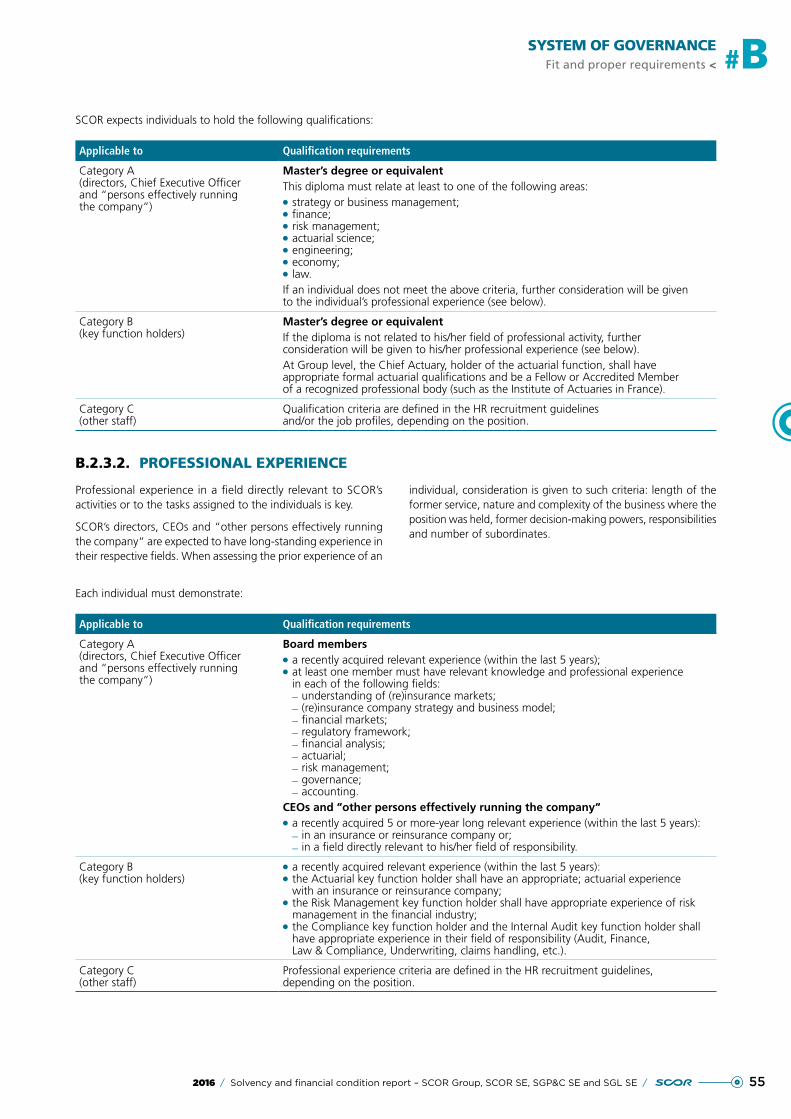
552016 / Solvency and financial condition report – SCOR Group, SCOR SE, SGP&C SE and SGL SE /
SYSTEM OF GOVERNANCEFit and proper requirements < #B
SCOR expects individuals to hold the following qualifications:
Applicable to Qualification requirements
Category A (directors, Chief Executive Officer and “persons effectively running the company“)
Master’s degree or equivalentThis diploma must relate at least to one of the following areas:●● strategy or business management;●● finance;●● risk management;●● actuarial science;●● engineering;●● economy;●● law.
If an individual does not meet the above criteria, further consideration will be given to the individual’s professional experience (see below).
Category B (key function holders)
Master’s degree or equivalentIf the diploma is not related to his/her field of professional activity, further consideration will be given to his/her professional experience (see below).At Group level, the Chief Actuary, holder of the actuarial function, shall have appropriate formal actuarial qualifications and be a Fellow or Accredited Member of a recognized professional body (such as the Institute of Actuaries in France).
Category C (other staff)
Qualification criteria are defined in the HR recruitment guidelines and/or the job profiles, depending on the position.
B.2.3.2. PROFESSIONAL EXPERIENCE
Professional experience in a field directly relevant to SCOR’s activities or to the tasks assigned to the individuals is key.
SCOR’s directors, CEOs and “other persons effectively running the company“ are expected to have long-standing experience in their respective fields. When assessing the prior experience of an
individual, consideration is given to such criteria: length of the former service, nature and complexity of the business where the position was held, former decision-making powers, responsibilities and number of subordinates.
Each individual must demonstrate:
Applicable to Qualification requirements
Category A (directors, Chief Executive Officer and “persons effectively running the company“)
Board members●● a recently acquired relevant experience (within the last 5 years);●● at least one member must have relevant knowledge and professional experience in each of the following fields: – understanding of (re)insurance markets; – (re)insurance company strategy and business model; – financial markets; – regulatory framework; – financial analysis; – actuarial; – risk management; – governance; – accounting.
CEOs and “other persons effectively running the company“●● a recently acquired 5 or more-year long relevant experience (within the last 5 years):
– in an insurance or reinsurance company or; – in a field directly relevant to his/her field of responsibility.
Category B (key function holders)
●● a recently acquired relevant experience (within the last 5 years):●● the Actuarial key function holder shall have an appropriate; actuarial experience with an insurance or reinsurance company;
●● the Risk Management key function holder shall have appropriate experience of risk management in the financial industry;
●● the Compliance key function holder and the Internal Audit key function holder shall have appropriate experience in their field of responsibility (Audit, Finance, Law & Compliance, Underwriting, claims handling, etc.).
Category C (other staff)
Professional experience criteria are defined in the HR recruitment guidelines, depending on the position.
56 / Solvency and financial condition report – SCOR Group, SCOR SE, SGP&C SE and SGL SE / 2016
> Fit and proper requirements#B SYSTEM OF GOVERNANCE
B.2.4. PROPRIETY CRITERIA
B.2.4.1. PROPRIETY ASSUMPTION
An individual may be considered as of good repute and integrity if there is no obvious evidence to suggest otherwise.
SCOR ensures, using the tools described in Section B.2.5 – Fit and proper assessment process, that there is no evidence of offences that can adversely affect the good repute and integrity of this person. If evidence is gained of past behaviors casting doubt on an individual’s good repute and integrity, remediation actions shall be taken as appropriate.
SCOR also takes actions to prevent conflicts of interest.
Proper considerations are relevant for all employees of an undertaking. However, any assessment needs to take into account their level of responsibility within the undertaking and will differ proportionately, according to whether or not, for example, they are “persons effectively running the company“ or have other key functions.
B.2.4.2. REMEDIATION
Some criminal, civil or disciplinary sanctions will preclude an individual from meeting propriety requirements (e.g. disciplinary penalties by supervisory authorities, non-petty criminal or civil penalties related to gross misconduct in the management of a company, commercial or professional activities, or related to his/her personal management such as money laundering, market
manipulation, insider dealing and usury, any offences of dishonesty such as fraud or financial crime). Others may not.
If an individual is subject to pending legal proceedings that may eventually lead to such penalties, he must inform the company concerned.
Other circumstances than court decisions and ongoing judicial proceedings, which may cast doubt on the repute and integrity of the person, may also be considered (current investigations or enforcement actions, imposition of administrative sanctions for non-compliance with provisions governing banking, financial, securities or insurance activity, securities markets, securities or payment instruments).
The following factors are taken into account to waive an impropriety ban: the seriousness of, and circumstances surrounding the offence, the explanation presented by the individual, the relevance of the offence to the proposed role, the passage of time since the offence was committed and evidence of the individual’s rehabilitation, the level of appeal (definitive vs. non-definitive convictions) and the person’s subsequent conduct.
B.2.4.3. TIME AVAILABILITY
Time availability must also be ensured: individuals holding concurrently several responsibilities/roles must have appropriate time to dedicate to the functions under the scope of SCOR’s Fit and Proper policy.
B.2.5. FIT AND PROPER ASSESSMENT PROCESS
The assessment process shall allow SCOR to ensure that persons/bodies subject to Fit and Proper requirements fulfil the above criteria both before and after their appointment to the position under the scope of the Fit & Proper policy.
The main stakeholders of the initial assessment process are listed below:
Applicant to Assessor
Board/Chief Executive Officer/Other “persons effectively running the company“
●● Board(1);●● Corporate Secretary with the support of Human Resources for applicants who are also SCOR employees.
Key function holders ●● Chief Executive Officer;●● Human Resources.
(1) With prior analysis by the Compensation and Nomination Committee when it exists.
According to the applicant level, the identified assessors are in charge of:
●● collecting supporting documents about the applicant (e.g. CV), including the Fit and Proper assessment form;
●● deciding if the applicant complies with the “Fit & Proper“ requirements.
Each year, the Corporate Secretary/HR department update their information with the annual fit and proper questionnaire collected from directors, CEOs and other “persons effectively running the company“ and key function holders.
572016 / Solvency and financial condition report – SCOR Group, SCOR SE, SGP&C SE and SGL SE /
SYSTEM OF GOVERNANCERisk management system including the Own Risk and Solvency Assessment (ORSA) < #B
Furthermore, when the Corporate Secretary/HR department receives notification of any changes affecting an individual’s propriety, it updates the latest assessment.
Some specific situations trigger a re-assessment of the fitness and propriety of a person: reasons to believe that a person will impede the undertaking from pursuing the business in a way
that is consistent with applicable legislation, reasons to believe that a person will increase the risk of financial crime, e.g. money laundering or financing of terrorism, reasons to believe that sound and prudent management of the business of the undertaking is at risk.
B.2.6. SCOR SE – INFORMATION ON FIT AND PROPER REQUIREMENTS
SCOR SE complies strictly with the Group’s Fit and Proper policy, as described in the section above, with possible local adaptation in accordance with local regulations at branch level.
B.2.7. SGP&C SE – INFORMATION ON FIT AND PROPER REQUIREMENTS
SGP&C SE complies strictly with the Group’s Fit & Proper policy, as described in the Section above, with possible local adaptation in accordance with local regulations at branch level. In particular, please refer to the SCOR UK Solvency and Financial Condition
Report for further information on specific Fit and Proper requirements applying to the relevant employees of the branch of SGP&C SE located in the UK.
B.2.8. SGL SE – INFORMATION ON FIT AND PROPER REQUIREMENTS
SGL SE complies strictly with the Group’s Fit and Proper policy, as described in the above section, with possible local adaptation in accordance with local regulations at branch level.
B.3. RISK MANAGEMENT SYSTEM INCLUDING THE OWN RISK AND SOLVENCY ASSESSMENT (ORSA)
The risk management principles, mechanisms and processes, described hereafter, are defined at Group level and applied consistently across the Group, in line with the proportionality principle, without prejudice of further and/or more stringent requirements from local applicable laws or regulations or policies.
SCOR’s risk management system is composed of two interconnected parts:
●● the risk appetite framework, including risk appetite, risk preferences and risk tolerances;
●● the Enterprise Risk Management (ERM) framework composed of various risk management mechanisms which help to ensure that the risk profile is dynamically optimized while remaining aligned with the risk appetite framework.
B.3.1. RISK APPETITE FRAMEWORK
SCOR’s risk appetite framework is an integral part of the Group’s strategic plan. It is approved by the Board of Directors upon the review of new strategic plans, based on recommendations from the Group’s Executive Committee and the Risk Committee of the Board of Directors. The Board of Directors may vary the amount and the composition of risk that the Group is prepared to take.
SCOR’s risk appetite framework encompasses the concepts of risk appetite, risk preferences and risk tolerances.
This framework is defined for the Group as a whole. Where appropriate (i.e. for material entities or where regulations require), legal entities have their own Board approved risk appetites, preferences and tolerances with which to comply.
58 / Solvency and financial condition report – SCOR Group, SCOR SE, SGP&C SE and SGL SE / 2016
> Risk management system including the Own Risk and Solvency Assessment (ORSA) #B SYSTEM OF GOVERNANCE
B.3.1.1. RISK APPETITE
Risk appetite defines the quantity of risk that SCOR wishes to accept to achieve a desired level of profitability. This determines where the Group wishes to position itself on the assumed risk-expected return spectrum, between extremely risk averse (low risk-low return) and extreme risk taker (high risk-high return). SCOR uses a target solvency ratio as well as a target expected profitability. These two components provide a comprehensive definition of its risk appetite. The Group’s solvency ratio and the profitability profile are reported on a regular basis to the Board of Directors via the Risk Committee.
B.3.1.2. RISK PREFERENCES
Risk preferences are qualitative descriptions of the risks, which SCOR is willing to accept. Based on the risk appetite defined for the “Vision in Action“ strategy launched in 2016, SCOR Group pursues an approach of thorough risk selection to optimize its risk profile and aims:
●● to actively seek risks related to reinsurance and selected primary insurance;
●● to assume a moderate level of interest rate risk, credit risk, FX and other market risks;
●● to minimize its own operational and reputational risks;
●● to minimize underwriting of cedent’s asset-related risks.
B.3.1.3. RISK TOLERANCES
The risk tolerances define the limits set out in order to ensure that the Group’s risk profile remains aligned with the Group’s risk appetite framework.
The Board of Directors defines and approves risk tolerance limits for the Group by risk driver, extreme scenario and investment limit in order to ensure that the Group’s risk profile remains aligned with its risk appetite framework. SCOR uses various risk assessment measures to verify that its exposures remain within these limits. These measures can take several forms depending on the technical constraints or the level of information available and are based on either internal model outputs, scenarios or expert opinions.
For further information on specific risk management strategies, processes and reporting on each risk category, see Chapter C – Risk Profile.
B.3.2. ERM FRAMEWORK
The Risk Management function relies on an ERM framework composed of various risk management mechanisms as described in the following sections. These mechanisms are adapted to divisions and legal entities when appropriate. Some mechanisms are only relevant at Group or division level and are not implemented specifically at the legal entity level, in line with materiality principles.
B.3.2.1. INTERNAL ENVIRONMENT
The main tasks of the Group Risk Management Department (GRM) are to further develop the Enterprise Risk Management framework and promote an ERM culture within the Group so that risks are managed consistently within each department.
The Group Risk Management Department is supported in these tasks by the departments in charge of risk management at SCOR Global P&C, SCOR Global Life and SCOR Global Investments. In addition, the Hub risk managers are involved in promoting a risk aware culture and implementing the appropriate measures at a local level. Compliance with local regulations and constraints is ensured by Hub General Counsels.
Group business standards and practices are governed by Group policies and underlying guidelines established in a common format, by the three divisions and the central functions such as the Group Internal Audit Department and the functions managed by the Group Chief Financial Officer, the Group Chief Operating Officer
and the Group Chief Risk Officer. Group policies are approved by the Group Executive Committee and for relevant topics are submitted on a regular basis to the relevant committees of the Board and, ultimately, to the Board of Directors of the Company. These Group policies are not intended to enumerate all the rules governing SCOR’s activities in the different countries in which the Group operates, but rather to establish certain principles intended to ensure that SCOR Group companies and employees share a common understanding of the Group’s standards and that they work in compliance with these standards. When approved, these documents are made available to employees on the SCOR intranet on a dedicated page.
See Section B.1 – General information on the system of governance for further details on SCOR’s organization and governance structure.
B.3.2.2. SETTING OF OBJECTIVES
For several years, SCOR has implemented and formalized three-year strategic plans. SCOR launched its three-year strategic plan (2016 to 2019), “Vision in Action“ in September 2016. “Vision in Action“ is largely a continuation of SCOR’s previous strategic plan, “Optimal Dynamics“’, and although some adjustments have been made, it builds on the success achieved by leveraging its proven principles and cornerstones.
592016 / Solvency and financial condition report – SCOR Group, SCOR SE, SGP&C SE and SGL SE /
SYSTEM OF GOVERNANCERisk management system including the Own Risk and Solvency Assessment (ORSA) < #B
Similar to the previous strategic plan, the new plan has two equally weighted objectives:
●● a return on equity (ROE) equal to or greater than 800 basis points above the five-year risk-free rate over the cycle(1); and
●● a solvency ratio in the optimal 185%-220% range(2).
The strategic plans set the Group risk appetite framework from which the Group’s strategy stems.
The Executive Committee defines the procedures for implementing the strategy and reviews the consistency of the operational plans or policies (e.g. underwriting, finance, retrocession, information technology) with the strategic plan. The Executive Committee also ensures that there is an optimal risk-based allocation of capital and diversification. Under the responsibility of the Group Chief Risk Officer, the Capital Shield Strategy sets risk limits to ensure a protection of the Group’s capital in line with the strategic plan’s objectives. The Capital Shield Strategy is approved and monitored by the Group Risk Committee and the Board Risk Committee.
The clarity and detailed description of strategic objectives and their implementation within the Group facilitate the identification, evaluation and control of risks, whatever their nature (e.g. underwriting risk, market risk, and operational risk), possibly caused by these objectives.
B.3.2.3. IDENTIFICATION AND ASSESSMENT OF RISKS
Several processes and tools for identifying and assessing risks have been implemented to approach risk from different angles and to deal with them in an exhaustive manner. These include:
●● a risk information process: regular and comprehensive risk reporting is provided to the Group Risk Committee and the Board of Directors. This includes a quarterly “Group Risk Dashboard“ which describes and assesses the major risks the Group is exposed to and assembles various risk assessments from different identification and assessment processes for all risk categories;
●● a process for the monitoring of risk exposures compared to risk tolerances, i.e. the limits established in order to ensure that the Group’s risk profile remains aligned with the risk level validated by SCOR SE’s Board of Directors. The Group uses various risk measures to define these exposures, which are measured based on either model outputs and/or expert opinions, depending on the technical constraints and the level of information available. This includes:
– the “risk driver“ system that enables the Group to manage the annual aggregate exposure to each major risk. The objective is to avoid overconcentration of risk and hence maximize diversification benefits. For the majority of SCOR’s risk drivers, the amount of post-tax retained annual exposure per main
risk driver (with a probability of 1 in 200 years) is limited to a percentage of the Group’s available capital. Other risk drivers have limits expressed in terms of reducing the Group’s solvency ratio or duration for invested assets,
– an “extreme scenario” system designed to prevent the Group’s over-exposure to a single event. The amount of post-tax retained exposure to each defined extreme scenario (with a probability of 1 in 200 years) is limited to 10% of available capital,
– sub-limits for invested assets, – limits per risk which are set in the underwriting and investment guidelines;
●● a “footprint scenarios“ process: this process aims to review and assess the potential impact of selected deterministic scenarios on the Group. This process provides an alternative perspective on the Group’s exposures. Working groups dedicated to specific subjects are composed of experts across the Group, and coordinated by the Group Risk Management Department with the support of the divisional Chief Risk Officers. These groups perform quantitative studies which are summarized in specific reports;
●● an Emerging Risks process: This process is part of SCOR’s ERM Framework and is linked to other risk management processes such as the “footprint scenarios“ process. The process, governance, roles and responsibilities are set out in dedicated guidelines and reviewed on an annual basis. Emerging risks within SCOR are overseen by an ad hoc Committee composed of the CROs of the operating divisions and the Head of the Group Risk Management Department. The individual risk assessments are carried out by a dedicated team of experts from SCOR Global P&C, SCOR Global Life and the Group functions. Critical emerging risks are reported to SCOR’s Executive Management. SCOR, as a member of the CRO Forum, also actively participates and contributes to the CRO Forum Emerging Risks Initiative alongside other major insurers and reinsurers;
●● the ORSA (Own Risk Solvency Assessment), which provides the Group’s Board and those of the legal entities, the Group Executive Committee and senior management of legal entities with forward-looking information on SCOR’s risks and capital position;
●● the Group internal model, which is deeply embedded in SCOR’s risk management system and contributes to the assessment of risks. SCOR uses its internal model for determining economic capital. Its results are used to implement SCOR’s underwriting and asset management policies and guidelines.
Where relevant, the analyses from these processes are reported to the Group Risk Committee and to the Risk Committee of SCOR SE’s Board of Directors (the “Board Risk Committee“) and to the Board of Directors on a regular basis.
(1) Based on a five-year rolling average of five-year risk-free rates.(2) This solvency target is unchanged from that under the previous strategic plan, Optimal Dynamics.
60 / Solvency and financial condition report – SCOR Group, SCOR SE, SGP&C SE and SGL SE / 2016
> Risk management system including the Own Risk and Solvency Assessment (ORSA) #B SYSTEM OF GOVERNANCE
B.3.2.4. MAIN CONTROL ACTIVITIES
Because of its activities, SCOR is exposed to many risks: reinsurance related risks, market risks and other risks (e.g. liquidity, rating). These risks are detailed in chapter C – Risk profile. These activities rely on the control mechanisms including adequate reporting mechanisms to the main governance bodies throughout the Group.
This section summarizes the principal activities and participants of risk control for the following important areas:
●● Group functions;
●● activities related to reinsurance;
●● asset management;
●● accounting management.
The control activities described below are considered as the principal activities for controlling risks specific to those areas. In accordance with SCOR’s internal control system approach, these control activities are performed on Group or Company level, on core business and investment process level, or on support process level.
Group functions
The Group’s functions are organized in three departments led by the Chief Operating Officer, Chief Financial Officer and Chief Risk Officers respectively. The operations area comprises information technology, human resources and other general service functions at Group level such as strategy and internal or corporate communications. The finance area comprises Treasury, Budget and Forecasting and other functions relating to controlling, consolidation, reporting, accounting, financial communications and tax issues. The risk management area comprises the actuarial function, the risk management function, various risk and actuarial modeling teams, and is responsible for the Group’s Prudential and Regulatory Affairs Department.
Further information is presented below regarding the risk function:
●● the Group Risk Management Department’s primary focus is to develop and manage ERM mechanisms, promote ERM concepts throughout the Group and perform a second-level control over reinsurance underwriting as mentioned above;
●● the Prudential and Regulatory Affairs Department monitors the prudential regulations and advises the Group. It ensures the Group actively positions itself vis-a-vis the different jurisdictions and requirements to which it is exposed or could be exposed, notably by coordinating SCOR’s actions to comply with regulatory requirements for the supervision of (re)insurance companies and Groups in France, and SCOR’s interactions with the Autorité de Contrôle Prudentiel et de Résolution (ACPR), and by monitoring SCOR’s interactions with (re)insurance supervisors worldwide through regular contacts with the SCOR teams in charge locally. It also coordinates the Group’s efforts to adapt to new major prudential regulations, such as Solvency II or ComFrame;
●● the Financial Analysis and Risk Modeling department manages and operates SCOR’s Internal Model and provides a detailed quantitative analysis on the modeled range of movements in economic value. It provides reports and input to management on risk assessment and actively assists the company in its various uses of the Internal Model;
●● the Group Chief Actuary and his team report to the Chief Risk Officer. See Section B.6 – Actuarial function for further information on the role and responsibilities of the Actuarial key function.
Activities related to reinsurance
The operating and control procedures concerning underwriting, pricing, administration of reinsurance contracts and claims management are validated by SCOR Global P&C and SCOR Global Life and are applied to all underwriting segments of the company in question, regardless of location.
For further information on how the main underwriting risks related to the P&C and Life reinsurance business are managed, please see Section C.2 – Underwriting risks.
Asset management
The Prudent Person Principle requires that the security, quality, liquidity and profitability of the portfolio as a whole be considered. This is enabled through the investment governance, strategy, operational framework and reporting and monitoring processes that SCOR implements.
The Group invests in assets through its SCOR Global Investments division composed of an asset management company regulated by the French Autorité des marchés financiers (SCOR Investment Partners SE) and a Group Investment Office (GIO).
Governance and principles
The Group has harmonized the principles governing the management of its assets: the Group Policy on Invested Assets defines the Group’s governance in terms of asset management and the Manual of Group Investment Guidelines determines the limits for concentration risk as well as limits of exposure to different asset classes. The Manual of Group Investment Guidelines thus determines the conditions under which SCOR Global Investments will implement the Group investment policy as defined by the Group Investment Committee. These two documents are rolled out across all SCOR entities to ensure consistency across the Group. Local investment guidelines complement the Group guidelines and set the rules to be applied by all internal and external asset managers on behalf of the legal entities. The Group Investment Committee meets at least once every quarter. Its role is to define the investment strategy on a Group level and to supervise the implementation of this strategy with regard to the regulatory and contractual constraints. At local level, local investment committees supervise the implementation of the investment strategy relating to their legal entities as well as the compliance of the portfolios’ positioning with the local investment guidelines.
For more information on liquidity see Section C.5 – Liquidity risks.
612016 / Solvency and financial condition report – SCOR Group, SCOR SE, SGP&C SE and SGL SE /
SYSTEM OF GOVERNANCERisk management system including the Own Risk and Solvency Assessment (ORSA) < #B
Investment strategy
The investment strategy at SCOR is risk-based and the portfolio’s positioning is derived from the risk appetite allocated by the Group to invested assets, as well as the Group’s risk tolerance.
The primary investment objective of SCOR is to generate recurring financial income in accordance with the risk appetite framework of the Group, and to ensure that the Group:
●● is able to meet its claims and expense payment obligations at all times; and
●● creates value for its shareholders in line with the objectives set out in the strategic plan;
while,
●● preserving the Group liquidity and level of solvency;
●● protecting the capital;
●● allowing the Group to operate on a day-to-day basis as well as over the long-term;
●● in compliance with the legal entities’ investment regulations, risk appetites and regulatory capital requirements (level of capital and type of admissible assets), and Group and local investment guidelines.
Operational framework
As a general rule, and in compliance with local regulations, the SCOR legal entities appoint the Group to supervise and implement the investment and reinvestment of all of their invested assets. This relationship is put in place through an Investment Management Agreement (“IMA“) which includes local investment guidelines. SCOR delegates to SCOR Investment Partners the implementation of the investment strategy for its invested assets, as determined by the Group Investment Committee. This relationship is put in place through a Master Investment Management Agreement (“MIMA“) which includes the list of invested asset portfolios and legal entities and their respective investment guidelines. In case of local regulatory restrictions or due to the size of some investment portfolios, some legal entities may not be included in this framework. In this case, they may delegate the management of their invested assets to external asset managers through a rigorous selection process. When possible, SCOR Investment Partners acts as an investment advisor to these legal entities.
Reporting and risk monitoring
The Group Investment Office monitors, on an ex-ante and ex-post basis, the compliance of the portfolio positioning with regard to the Group risk appetite and investment guidelines. The GIO is also in charge of reporting processes related to invested assets. The GIO provides SCOR with regular reports used for the monitoring of the asset portfolios. Breaches are escalated to the Group Investment Committee as well as to the Group and Board Risk Committees. Investments falling outside of the scope of Group Investment Guidelines are subject to special referral procedures managed by the Group Risk Management Department.
Accounting management
The Solvency II reporting process is built upon the Group-wide IFRS reporting process and ensures quality and consistency of legal entity and Group solvency reporting. It therefore benefits from controls over the accounting and consolidation process, as presented in the Registration Document, and their extension to solvency reporting.
B.3.2.5. INFORMATION AND COMMUNICATION
The Registration Document is produced via a specific process that ensures the contribution of all relevant departments and the consistency of the information provided. A final review is performed by members of the Executive Committee.
Similarly, for the Solvency and Financial Condition Report and other Solvency II reporting, a specific process has been implemented to coordinate the contribution of all relevant departments and the consistency of the information provided. A final review is performed by Senior Management, members of the Executive Committee(s) and the Board(s).
B.3.2.6. MONITORING OF THE INTERNAL CONTROL AND RISK MANAGEMENT SYSTEM
The monitoring of the internal control and risk management systems is ensured by a number of complementary mechanisms with the support of several departments across the Group.
SCOR implements dedicated processes and tools to identify, assess and monitor its risk exposure on a regular basis and has dedicated risk management mechanisms in both the Life and P&C divisions in order to evaluate the appropriateness and effectiveness of controls and propose risk management and mitigation measures. See Section B.3.2.3 – Identification and assessment of risks.
SCOR operates an Internal Control System Competence Center (“ICS-CC“) which reports to the Group Risk Management Department. For more information on the Internal Control System, see Section B.4.1 – Description of the internal control system.
In addition, and in accordance with its risk-based audit plan and through its periodic assignment, Group Internal Audit provides independent and objective assessments on the adequacy, effectiveness and efficiency of the internal control system. Any findings and risks lead to recommendations and management remediation actions, which are followed up by Group Internal Audit. When Group Internal Audit concludes that management has accepted a level of risk that may be unacceptable to the organization, it must discuss the matter with the Executive Committee. If the Head of Group Internal Audit determines that the matter has not been resolved, he/she must communicate the matter to the Audit Committee.
62 / Solvency and financial condition report – SCOR Group, SCOR SE, SGP&C SE and SGL SE / 2016
> Risk management system including the Own Risk and Solvency Assessment (ORSA) #B SYSTEM OF GOVERNANCE
For more information, see Section B.5 – Internal Audit.
Furthermore, the Finance Department manages the “internal management representation letters“ process, which also
incorporates certain points related to the internal control of accounting and financial reporting.
B.3.3. INTERNAL MODEL CONTRIBUTION TO THE ERM FRAMEWORK
Subject to regulatory approval, an internal model can be used to determine the SCR. SCOR has used its experience and knowledge to develop an internal model which accurately reflects SCOR`s risk profile as a global reinsurer. For more details on the internal model and how it differs from the standard formula, see Section E.1.4.6.
The risk categories reported out of the internal model include P&C underwriting and reserving risk, Life & Health underwriting and reserving risk, Market risk, Currency risk, Credit risk, Interest rate risk and Operational risk.
For further information on risks included in SCOR’s internal model, see Chapter E – Capital Management.
SCOR is exposed to other risks not modeled within the internal model, including Strategic, Liquidity and Emerging risks. These risks are not expected to have an immediate impact on the Solvency Ratio over a one-year time horizon and are monitored and managed through specific processes.
B.3.3.1. ROLE OF THE INTERNAL MODEL IN THE RISK MANAGEMENT SYSTEM
SCOR’s internal model is a key feature of SCOR`s risk management; see Sections E.1.4.1 – Overview of the internal model and E.1.4.3 – Uses of the internal model for a description of the internal model and some of its uses.
B.3.3.2. INTERNAL MODEL GOVERNANCE
The internal model governance framework forms an important component of the risk governance at SCOR and seeks to ensure the appropriate management and supervision of the internal model and its outputs.
The governance framework includes in its scope the operational run of the model, Model Changes and Independent Validation as outlined in their own respective policies. The Internal Model Management Committee is responsible for ensuring that the internal model operates properly on a continuous basis. It approves internal model results and provides recommendations to the Group Executive Committee on model changes.
The development and use of SCOR’s internal model are managed through the following three key policies:
●● Group Internal Model Policy;
●● Group Policy on Model Change;
●● Group Internal Model Validation Policy.
The Group Internal Model Policy sets out the overarching principles and governance of the internal model. The Group Policy on Model Change sets out the principles and governance for managing the development of the model and the Group Policy on Internal Model Validation sets out the corresponding independent validation of both the use and development of the internal model.
There were no material changes in the internal model governance during the reporting period.
B.3.3.3. INTERNAL MODEL VALIDATION PRINCIPLES AND TOOLS
SCOR implemented a robust process for the validation of its internal model. This process applies to the Group and the European legal entities regulated by the Solvency II Directive, and where the solvency capital requirement is calculated by means of the internal model. It is performed based on the principles stated in the validation policy and fully complies with Solvency II internal model validation standards.
General principles
The validation of the internal model aims to review the reasonableness and accuracy of the internal modeling, and the results thereof, on an independent and proportionate basis as performed by competent professionals.
The main principles governing the validation process are:
●● independence and Expertise: the validation is performed by highly qualified experts who are independent from the design, implementation and run of the model;
●● proportionality: the validation work on the various components of the model is proportionate to the materiality of their impact on the results assessed using various quantitative and qualitative criteria.
Frequency of validation
The internal model is validated on an annual basing taking into account all the changes occurred since the previously validated model.
Governance integrated with the operational run
The Internal Model Independent Validation governance follows the overall internal model governance described above in Section B.3.3.1 – Role of the internal model in the risk management system.
632016 / Solvency and financial condition report – SCOR Group, SCOR SE, SGP&C SE and SGL SE /
SYSTEM OF GOVERNANCEInternal control system < #B
B.3.4. ORSA CONTRIBUTION TO THE RISK MANAGEMENT SYSTEM
The ORSA process is a key mechanism of SCOR’s ERM framework and is an integral part of the Risk Management System. It leverages the capital management and strategic planning processes.
The ORSA provides forward-looking information on the respective risk and capital positions, of the Group and legal entities, taking into account SCOR’s strategy and risk appetite and includes:
●● descriptions of the risk profiles and the main risk drivers;
●● overviews of expected changes in the risk profiles over the ORSA time horizon; and
●● prospective assessments of overall capital needs, based on the internal model, over the ORSA time horizon, taking into account SCOR’s strategy and risk profile, including an analysis of any excess or shortfall in the Eligible Own Funds.
For further information on capital management processes, see Section E.1.1 – Own funds.
SCOR performs the Group-wide ORSA for the Group and its legal entities subject to Solvency II based on clearly defined principles and objectives, close cooperation between Group and legal entity teams and regular involvement of Group and legal entity senior management, as well as involvement of the Board of SCOR SE and these legal entities.
It is performed at least annually or more frequently when material changes in the risk profile occur and the ORSA results are approved by the relevant Boards (see Section B.1.3 – Governance structure at Group and legal entity level).
B.3.5. SCOR SE – INFORMATION ON THE RISK MANAGEMENT SYSTEM
The risk management principles, mechanisms and processes, described above, are defined at Group level and applied consistently at SCOR SE level, in line with the proportionality
principle, without prejudice to further and/or more stringent requirements from local applicable laws or regulations.
B.3.6. SGP&C SE – INFORMATION ON THE RISK MANAGEMENT SYSTEM
The risk management principles, mechanisms and processes, described above, are defined at Group level and applied consistently at SGP&C SE level, in line with the proportionality
principle, without prejudice to further and/or more stringent requirements from local applicable laws or regulations.
B.3.7. SGL SE – INFORMATION ON THE RISK MANAGEMENT SYSTEM
The risk management principles, mechanisms and processes, described above, are defined at Group level and applied consistently at SGL SE level, in line with the proportionality
principle, without prejudice to further and/or more stringent requirements from local applicable laws or regulations.
B.4. INTERNAL CONTROL SYSTEM
B.4.1. DESCRIPTION OF THE INTERNAL CONTROL SYSTEM
The Internal Control System (ICS) standards are embedded in the Group Policy on ICS. The ICS is defined at Group level and applied consistently across the Group, in line with the proportionality principle, without prejudice of further and/or more stringent requirements from local applicable laws or regulations or policies.
SCOR operates an “Internal Control System Competence Center“ (ICS-CC) which reports to the Group Risk Management Department. The core objective of this competence center is to pool ICS expertise in order to foster a consistent ICS approach and
application of ICS standards across the Group. The ICS-CC consists of experts who are dedicated to coordinating the internal control formalization activities within the Group, its divisions and entities, and supporting the business process owners where necessary. The ICS standards are applied based on the proportionality principle. ICS processes have been documented accordingly, focusing on those considered to be the most critical. The ICS documentation is being progressively deployed across the Group and is reviewed regularly for continuous improvement.
64 / Solvency and financial condition report – SCOR Group, SCOR SE, SGP&C SE and SGL SE / 2016
> Internal control system#B SYSTEM OF GOVERNANCE
The approach used to develop and maintain the internal control system is specified in the ICS Group Policy. The policy sets out the reference framework and details the Group principles, the responsibilities of the different participants in internal control and the quality requirements. The principal characteristics of the internal control system are as follows:
●● a risk-based approach, i.e. addressing critical operational risks that, if not controlled, could significantly impact SCOR’s franchise, balance sheet or statement of income and indirectly its solvency. The optimal risk response is obtained through appropriately designed key controls at Group level, process level and IT level;
●● on a process level, appointment of global process owners (GPO) at Group, SCOR Global P&C, SCOR Global Life and SCOR Global Investments levels and local process owners (LPO). The GPOs’ responsibility is to document the processes, identify the related critical risks, define the appropriate key controls and ensure their deployment and application in the various entities of the Group. The LPOs’ main responsibilities are to assess processes, risks and key controls on a local level based on the defined global process and ensure application of risk-based control activities;
●● monitoring, upon completion of the initial documentation, through a self-assessment procedure on the maturity (quality) of control processes based on pre-defined criteria set by their owners.
The monitoring of the internal control and risk management systems is ensured by a number of complementary mechanisms with the support of several departments across the Group.
SCOR implements dedicated processes and tools to identify, assess and monitor its risk exposures on a regular basis. In addition, SCOR implements dedicated risk management mechanisms in both the Life and P&C divisions in order to evaluate the appropriateness and effectiveness of controls and propose risk-management and mitigation measures.
In addition, and in accordance with its risk-based audit plan and through its periodic assignment, Group Internal Audit provides independent and objective assessments on the adequacy, effectiveness and efficiency of the internal control system.
B.4.2. COMPLIANCE FUNCTION
B.2.4.1. ORGANIZATION OF THE COMPLIANCE FUNCTION
It is SCOR’s policy to ensure compliance with all applicable laws and regulations and the SCOR Group Code of Conduct wherever it conducts business. SCOR holds itself to high standards when carrying on its business and at all times strives to observe the spirit as well as the letter of the law by continuously seeking to improve the effectiveness of its compliance management framework.
Compliance activities are mostly performed by the compliance function, which is composed of the legal and compliance teams (Group General Secretariat including the Group Compliance team and the Group Legal Department, Divisional Chief Legal Counsels, Hub legal and compliance teams, and local compliance officers). There are also other departments responsible for specific areas (e.g. Prudential and Regulatory Affairs, Finance – including Tax, and Human Resources), in line with the organizational structure of SCOR.
At Group level and for Solvency II-related legal entities, compliance function holders are responsible for the compliance key function.
It is also the responsibility of all employees to abide by the laws and regulations relevant to their day-to-day activities and the SCOR policies and guidelines applicable to them.
B.4.2.2. POSITION AND INDEPENDENCE PRINCIPLES
At SCOR, the compliance function both at Group and local level must operate free of any influences that may compromise its ability to perform its duties in an objective, fair and independent manner.
At the Group level, the Group Compliance key function holder has direct access to the Chairman and Chief Executive Officer and the Group Compliance key function holder reports at least annually to the Audit Committee and the Board of Directors regarding material compliance breaches that may impact the Group’s operations.
The compliance function must have free and unfettered access to any records or staff member, as necessary to carry out its responsibilities.
B.4.2.3. COMPLIANCE FRAMEWORK
SCOR follows a risk-based approach to compliance in accordance with the SCOR Group Policy on Risk Management. This involves identifying areas of high risk within SCOR and prioritizing dedicated efforts and resources around these risks according to severity and probability, and establishing ongoing procedures aimed at Prevention, Detection and Response.
652016 / Solvency and financial condition report – SCOR Group, SCOR SE, SGP&C SE and SGL SE /
SYSTEM OF GOVERNANCEInternal control system < #B
Prevention
Preventing compliance breaches includes:
●● monitoring compliance-related regulatory developments, assessing their impact on SCOR and disseminating this information to the relevant governing bodies and employees;
●● identifying, assessing and monitoring compliance risks;
●● issuing compliance-related policies and guidelines;
●● providing training to employees;
●● providing advice to employees regarding specific compliance matters;
●● implementing and maintaining compliance tools;
●● maintaining a Code of Conduct awareness and confirmation process;
●● introducing controls as part of SCOR’s internal control system (ICS);
●● providing reports on compliance matters.
Detection
Detecting compliance breaches often relies on the following sources and processes:
●● employee reporting process: all employees are responsible for ensuring compliance with applicable laws, regulations and policies in their daily duties as well as for escalating any actual or suspected compliance breach;
●● controls as part of ICS procedures;
●● cross-reviews, whereby an operational team operating in a different region from the entity subject to the review performs, checks and reviews compliance-related topics;
●● audits conducted by Group Internal Audit;
●● audits by external auditors (e.g. accounting and tax);
●● operational loss events;
●● complaints or litigation initiated by third-parties against SCOR.
Response
In response to compliance breaches, SCOR must take appropriate corrective actions to mitigate the consequences of the breach, and to prevent further reoccurrences of similar breaches in the future.
Employees who are found in breach of, or fail to comply with, applicable laws or regulations or the principles of this policy may be subject to disciplinary action in compliance with the laws applicable in the country of employment and/or may be subject to criminal/regulatory proceedings.
In addition, the Group Remuneration Policy includes a reference to compliance with the Code of Conduct as a performance condition to be satisfied.
B.4.3. SCOR SE – INFORMATION ON THE ICS AND THE COMPLIANCE FUNCTION
B.4.3.1. INTERNAL CONTROL SYSTEM
SCOR SE applies the Internal Control System (ICS) principles as defined at Group level and leverages processes implemented across the Group. Where deemed appropriate, SCOR SE has adapted the processes defined at Group or division level, or implemented own local processes in order to reflect specific local requirements.
B.4.3.2. COMPLIANCE FUNCTION
The compliance function and framework, as defined and implemented at Group level, similarly apply to SCOR SE, both as a legal entity and as the parent company of the SCOR Group.
B.4.4. SGP&C SE – INFORMATION ON THE ICS AND COMPLIANCE FUNCTION
B.4.4.1. INTERNAL CONTROL SYSTEM
SGP&C SE applies the Internal Control System (ICS) principles as defined at Group level and leverages processes implemented across the Group. Where deemed appropriate, SGP&C SE has adapted the processes defined at Group or division level, or implemented own local processes in order to reflect specific local requirements.
B.4.4.2. COMPLIANCE FUNCTION
The compliance framework, as defined and implemented at Group level, similarly applies to SGP&C SE. The compliance function for SGP&C SE is organized along the lines of the Group’s compliance function.
66 / Solvency and financial condition report – SCOR Group, SCOR SE, SGP&C SE and SGL SE / 2016
> Internal Audit#B SYSTEM OF GOVERNANCE
B.4.5. SGL SE – INFORMATION ON THE ICS AND COMPLIANCE FUNCTION
B.4.5.1. INTERNAL CONTROL SYSTEM
SGL SE applies the Internal Control System (ICS) principles as defined at Group level and leverages processes implemented across the Group. Where deemed appropriate, SGL SE has adapted the processes defined at Group or division level, or implemented own local processes in order to reflect specific local requirements.
B.4.5.2. COMPLIANCE FUNCTION
The compliance framework, as defined and implemented at Group level, similarly applies to SGL SE. The compliance function for SGL SE is organized along the lines of the Group’s compliance function.
B.5. INTERNAL AUDIT
B.5.1. INTERNAL AUDIT ORGANIZATION AT GROUP LEVEL
B.5.1.1. GENERAL PRINCIPLES
The Group Internal Audit’s audit universe of potential areas within its scope includes all functions and operations carried out by SCOR. Group Internal Audit has no direct operational responsibility or authority over any of the activities it can review. Accordingly, Group Internal Audit does not develop or install systems or procedures, prepare records, take the place of management who owns and makes decisions to manage its respective risks, or engage in any other activity which it can review.
Group Internal Audit assists the Board of Directors in providing independent, objective assurance and consulting services designed to assess the adequacy, effectiveness and efficiency of SCOR governance, policies and guidelines, risk management and internal control systems, as well as the compliance of operations with applicable policies and guidelines, in order to ensure the safeguarding and integrity of SCOR’s assets (e.g. financial assets, human resources, systems and data), to ensure the effective use of resources and identify opportunities for process improvement.
Vis-a-vis SCOR subsidiaries and legal entities, Group Internal Audit is the outsourced provider of the internal audit function of legal entities in the scope of the Group Internal Audit Charter, to the extent it is compliant with local laws and regulations. If local obligations related to internal audit matters are not covered by the Group Internal Audit Charter, the Head of Group Internal Audit and legal entity’s representatives must act in a timely manner when implementing complements or adjustments as deemed adequate by the appropriate departments and described in an Internal Audit Charter Addendum.
B.5.1.2. ORGANIZATION WITHIN THE GROUP
Group Internal Audit is composed of Regional and specialized Internal Audit Units, managed by Deputy Heads who report directly to the Head of Group Internal Audit. There is no reporting line to the regional or other management.
Planning, Auditing and Monitoring: Regional/legal entities’ Internal Audit Plans are integrated in the Group Internal Audit Plan. The Head of Group Internal Audit leads the internal audit department activities globally in order to avoid silo effects and ensure that (1) the same audit framework and methodologies are applied group-wide for each audit engagement and recommendations monitoring, (2) the auditors’ assignments are based on skills in line with the audit objectives, benefiting from Group Internal Audit’s resources and comply with rotating principles.
Reporting: The Head of Group Internal Audit can delegate to Regional Deputies the duties related to the internal audit reporting to pre-defined affiliates’ Audit Committees and Supervisory Bodies. The Head of Group Internal Audit ensures that the reported information is aligned and consistent across the Group.
Exceptions: In specific cases where the general principles above are not applied, the case must be submitted for approval to the relevant Audit Committee, CEO & Chairman of the Board of SCOR SE, and the Chairman of the Audit Committee of the Board of SCOR SE and other bodies as deemed necessary.
The Head of Group Internal Audit or a delegate (Deputy Head) is invited to, attends and reports during the regular Audit Committees meetings on the internal audit activities and performance and meets privately with the Chairperson of the relevant Audit Committee (at least annually). For entities having no specific Audit Committee, the Head of Group Internal Audit is invited to, attends and reports during the Board meeting. The Head of Group Internal Audit issues an annual report when asked to by the Audit Committee or required by laws or regulations.
672016 / Solvency and financial condition report – SCOR Group, SCOR SE, SGP&C SE and SGL SE /
SYSTEM OF GOVERNANCEActuarial function < #B
B.5.1.3. INDEPENDENCE PRINCIPLES
Within SCOR, the Head of Group Internal Audit reports directly to the CEO & Chairman of the Board of SCOR SE, to provide the necessary independence, and allow it the greatest possible freedom of investigation, while at the same time ensuring the effective and timely implementation of its recommendations and management actions. The Head of Group Internal Audit also reports functionally to the Chairman of the Audit Committee of the Board of SCOR SE, who approves decisions regarding his/her appointment and removal and makes appropriate inquiries to ensure that audits are performed within an appropriate scope with adequate resources, and may steer Group Internal Audit’s activities in a specific direction.
The Head of Group Internal Audit submits a written report to the Board Audit Committee at least annually on the organizational independence of the Group Internal Audit function. If independence or objectivity is impaired in fact or appearance, the details of the impairment must be disclosed to appropriate parties. The nature of the disclosure should depend upon the impairment. This principle is applied in the same manner for SCOR Group entities.
Group Internal Audit must and does have unrestricted access to all information, people, relevant systems and data regarding audit assignments and consulting projects, including easy access to and open communication with the audited department and management.
B.5.2. SCOR SE – INFORMATION ON THE INTERNAL AUDIT FUNCTION
The principles and organization as defined and implemented at Group level apply similarly to SCOR SE’s Internal Audit function. Similarly, the scope of internal audit engagements issued during
the reporting period and audit plan defined at SCOR SE level are the same as the ones issued and defined at Group level.
B.5.3. SGP&C SE – INFORMATION ON THE INTERNAL AUDIT FUNCTION
The principles and organization defined and implemented at Group level apply similarly to SGP&C SE’s Internal Audit function.
B.5.4. SGL SE – INFORMATION ON THE INTERNAL AUDIT FUNCTION
The principles and organization as defined and implemented at Group level apply similarly to SGL SE’s Internal Audit function.
B.6. ACTUARIAL FUNCTION
B.6.1. IMPLEMENTATION OF THE ACTUARIAL FUNCTION
An actuarial key function has been defined for the Group and all legal entities subject to the Solvency II Directive. These key functions are conducted under the responsibility of a key function holder.
The role of the actuarial key function is to:
●● coordinate the calculation of technical provisions;
●● ensure the appropriateness of the methodologies and underlying models used as well as the assumptions made in the calculation of technical provisions;
●● assess the sufficiency and quality of the data used in the calculation of technical provisions;
●● compare best estimates against experience;
●● inform the AMSB of the reliability and adequacy of technical provisions;
●● oversee the calculation of technical provisions in case of insufficient data of appropriate quality inducing the use of appropriate approximations, including case-by-case approaches, in the calculation of best-estimates;
●● express an opinion on the overall underwriting policy;
●● express an opinion on the adequacy of reinsurance arrangements;
●● contribute to the effective implementation of the risk-management system, in particular with respect to the risk modeling underlying the calculation of the capital requirements, and to the own risk and solvency assessment; and
68 / Solvency and financial condition report – SCOR Group, SCOR SE, SGP&C SE and SGL SE / 2016
> Outsourcing#B SYSTEM OF GOVERNANCE
●● produce an annual written Actuarial Function Report submitted to the management, the Board and/or related committees on actuarial matters of the Group and the corresponding legal entities. The report includes a description of tasks undertaken by the actuarial key function, an opinion on the technical provision, overall underwriting policy and the adequacy of reinsurance arrangements, a description of any deficiency and recommendations on how such deficiencies can be remedied.
This role is undertaken by the Actuarial Function Holder (AFH) and the so-called Actuarial Function Community, composed of members of the reserving teams, with the support of other teams
within SCOR (Underwriting teams, Retrocession teams, Financial Modeling, Capital Management Department).
The Actuarial key function holder for the Group is in charge of coordinating the implementation of Solvency II standards related to the actuarial key function throughout SCOR.
The cooperation with the three other key functions (risk management key function, internal audit key function and compliance key function) is ensured via regular interactions with the teams performing the tasks in the scope of these functions.
B.6.2. SCOR SE – INFORMATION ON THE ACTUARIAL FUNCTION
SCOR SE’s actuarial key function is organized along the lines of the actuarial key function of the Group.
B.6.3. SGP&C SE – INFORMATION ON THE ACTUARIAL FUNCTION
SGP&C SE’s actuarial key function is organized along the lines of the actuarial key function of the Group.
B.6.4. SGL SE – INFORMATION ON THE ACTUARIAL FUNCTION
SGL SE’s actuarial function is organized along the same lines as the actuarial function of the Group.
B.7. OUTSOURCING
B.7.1. OUTSOURCING PRINCIPLES AND ORGANIZATION
SCOR has put in place a SCOR Group Policy on Outsourcing which sets forth the principles, framework and rules to be followed by SCOR employees considering the outsourcing of critical or important functions by any SCOR entity to another entity, within or outside the SCOR Group.
When outsourcing a critical or important function, a SCOR entity shall use appropriate and proportionate systems, resources and procedures in line with the risks involved in order to select a specific service provider. In particular, prior to entering into any such outsourcing relationship, a SCOR entity shall conduct a due diligence that is adequate and commensurate with the risks involved.
A SCOR entity shall monitor and review the quality of the service provided and shall maintain internally the competence and ability to assess whether the service provider delivers the service according to the outsourcing agreement.
Pursuant to Solvency II requirements, specific rules apply to the outsourcing of critical or important functions by SCOR EU entities. A SCOR EU entity is an insurance or reinsurance undertaking incorporated in and supervised by a regulator with jurisdiction in a country located in the European Union. As of the date of this report, SCOR SE, SCOR Global Life SE, SCOR Global P&C SE, SCOR Global Life Reinsurance Ireland, and SCOR UK Limited fall into the definition of SCOR EU entities.
A critical or important function is defined in the Group Policy as a function essential to the operation of the relevant SCOR entity, i.e. a function the interruption of which would be considered as likely to have a significant impact on:
●● the activity of such an entity;
●● the entity’s ability to effectively manage risks; or
●● the entity’s regulatory authorization.
In view of the following:
●● the cost of the outsourced activity;
●● the financial and operational impact as well as the impact on the reputation of the SCOR entity as to the inability of the service provider to fulfill its obligations on time;
●● the difficulty of finding another service provider or resuming live activity;
●● the ability of the SCOR entity to meet regulatory requirements in case of problems with the service provider; and
●● the potential losses for insured parties, policyholders or recipients under contracts or reinsured businesses in case of default by the service provider.
692016 / Solvency and financial condition report – SCOR Group, SCOR SE, SGP&C SE and SGL SE /
SYSTEM OF GOVERNANCEOutsourcing < #B
The outsourcing of a critical or important function by a SCOR entity that is a SCOR EU entity shall be subject to the following process:
●● a cost/benefit analysis of the possible outsourcing will be conducted and the business case associated with such possible outsourcing will be reviewed by the appropriate governing body of the relevant SCOR entity;
●● the outsourcing of a critical or important function will be supervised by a process owner for the entire duration of the outsourcing;
●● the process owner will carry out adequate financial, technical and compliance and regulatory due diligences in accordance with the guidelines;
●● a specific review of existing or potential sub-outsourcing relationships will be carried out;
●● a review of the adequacy of the service provider contingency plan will be conducted;
●● an outsourcing agreement will be executed including specific provisions allowing the SCOR entity to adequately control and monitor the quality of the critical or important functions outsourced.
B.7.2. MAIN ACTIVITIES OUTSOURCED TO EXTERNAL SERVICE PROVIDERS
As of the date of this report, critical or important functions outsourced by SCOR EU entities to external service providers include the following:
●● certain IT systems and services are outsourced by SCOR’s GIE Informatique (which pools and manages the IT needs of SCOR entities worldwide) to large IT companies in France and various other jurisdictions. Each outsourced relationship is closely monitored by the SCOR IT Department, with a specific focus on service quality, IT security and business continuity;
●● underwriting and claims handling of certain space and aviation risks by SCOR Global P&C SE and SCOR UK Limited have been outsourced to companies located in France and the UK that are specialized in managing general agents partially owned by SCOR. A SCOR underwriting manager specialized in the review of these risks monitors these outsourced relationships closely, through attendance of regular technical meetings, frequent reporting and underwriting audits;
●● underwriting data capture services are provided by a key industry player located in the UK to SCOR Global P&C SE. This outsourced service is closely monitored by the Underwriting Department;
●● a central settlement facility is provided to SCOR UK by one of the UK’s leading providers of services to the insurance industry. The Claims Handling Department closely monitors the relationship, through accounts reviews, regular meetings and files audits;
●● the asset management function relating to specific jurisdictions, especially in Asia-Pacific and North America, is outsourced to large expert asset managers, which include well known and reputable asset managers located in Singapore, Canada, China, Hong Kong and France;
●● certain asset management middle and back office services have been outsourced by SCOR SE or SCOR Investment Partners SE to subsidiaries of banking institutions specialized in such services. These relationships are closely monitored by the relevant SCOR staff. The main middle/back office service provider for that purpose is located in France.
B.7.3. MAIN INTRAGROUP OUTSOURCING ARRANGEMENTS
The SCOR Group operates through a Hub structure, whereby certain Hub employees provide services to SCOR Group entities operating in the relevant Hub jurisdictions. In addition, the SCOR Group has developed centers of expertise for certain services, located in some Hubs, which provide expertise to all SCOR Group entities.
As a result, parts of certain critical or important functions may be outsourced to the SCOR staff responsible for carrying out tasks in support of the execution of the critical or important function, in the Hubs in which the relevant SCOR EU entity operates.
These outsourcing relationships are documented through adequate outsourcing agreements and closely monitored by (i) the key function holder of the relevant SCOR EU entity for the specific key function, or (ii) the duly designated person of the relevant SCOR EU entity in charge of monitoring.
The risk management function, including structuring and validation of the internal model, when relevant, is outsourced by each SCOR EU entity to the Group Financial Modeling & Risk Analysis team of SCOR Switzerland Services AG and/or to the Group Actuarial Modeling team of SCOR SE. Other SCOR EU entities may provide services in support of the execution of this key function, when necessary. These outsourcing relationships are documented through adequate outsourcing agreements and are closely monitored by the risk management key function holder of the relevant SCOR EU entity.
The compliance function is partly outsourced by each SCOR EU entity to the relevant legal and compliance teams based in the jurisdictions and regions where it operates, notably the Hub legal and compliance teams managed by Hub General Counsels. These outsourcing relationships are documented through adequate outsourcing agreements and are closely monitored by the compliance key function holder of the relevant SCOR EU entity.
70 / Solvency and financial condition report – SCOR Group, SCOR SE, SGP&C SE and SGL SE / 2016
> Outsourcing#B SYSTEM OF GOVERNANCE
The internal audit function of each SCOR EU entity (other than SCOR SE and SCOR UK) is outsourced to the Group Internal Audit team hosted by SCOR SE. In the execution of its mission, the Group Internal Audit team of SCOR SE relies on all its staff employed in various SCOR entities. These outsourcing relationships are documented through adequate outsourcing agreements and are closely monitored by the internal audit key function holder of the relevant SCOR EU entity. The internal audit function of SCOR UK is outsourced to Channel Managing Agency Limited.
The actuarial function is partly outsourced by each SCOR EU entity to the Group Financial Modeling & Risk Analysis team of SCOR Switzerland Services AG and/or to the Life Economic Valuation team of SCOR SE. Other SCOR EU entities may provide services in support of the execution of this key function, when necessary. These outsourcing relationships are documented through adequate outsourcing agreements and are closely monitored by the actuarial key function holder of the relevant SCOR EU entity.
Certain underwriting and claims activities are partly outsourced by SCOR UK to SGP&C SE. Claims handling activities are outsourced by SCOR Global Life Reinsurance Ireland to some extent and when relevant to various SCOR entities. These outsourcing relationships are documented through adequate outsourcing agreements and are closely monitored by the designated person of the relevant SCOR EU entity.
The asset management activities are partly outsourced by SCOR SE to SCOR Investment Partners SE. Each other SCOR EU entity outsources its asset management activities to SCOR SE. These outsourcing relationships are documented through adequate outsourcing agreements and are closely monitored by the designated person of the relevant SCOR EU entity.
IT is partly outsourced by each SCOR EU entity (except for SCOR SE) to SCOR SE. This outsourcing relationship is documented through adequate outsourcing agreements and is closely monitored by the designated person of the relevant SCOR EU entity.
B.7.4. SCOR SE – INFORMATION ON OUTSOURCING
SCOR SE’s outsourcing principles and organization are defined along the same lines as those of the Group. See Section B.7.1 – Outsourcing principles and organization for further information.
The main activities outsourced to external service providers at SCOR SE’s level relate to certain IT systems and services, the asset management activity relating to China and certain middle and
back office services. See Section B.7.2 – Main activities outsourced to external service providers for further information.
Within the Group, SCOR SE outsources its key functions to some extent. See Section B.7.3 – Main intragroup outsourcing arrangements for further information.
B.7.5. SGP&C SE – INFORMATION ON OUTSOURCING
SGP&C SE’s outsourcing principles and organization are defined along the same lines as those of the Group. See Section B.7.1 – Outsourcing principles and organization for further information.
The main activities outsourced to external service providers at SGP&C SE’s level relate to certain IT systems and services, underwriting and claims handling of certain space and aviation
risks and underwriting data capture services. See Section B.7.2 – Main activities outsourced to external service providers for further information.
Within the Group, SGP&C SE outsources its key functions to some extent. See Section B.7.3 – Main intragroup outsourcing arrangements for further information.
B.7.6. SGL SE – INFORMATION ON OUTSOURCING
SGL SE’s outsourcing principles and organization are defined along the same lines as those of the Group. See Section B.7.1 – Outsourcing principles and organization for further information.
Within the Group, SGL SE outsources its key functions to some extent. See Section B.7.3 – Main intragroup outsourcing arrangements for further information. SGL SE does not outsource any material activities to external providers.
712016 / Solvency and financial condition report – SCOR Group, SCOR SE, SGP&C SE and SGL SE /
SYSTEM OF GOVERNANCEOther material information regarding the system of governance < #B
B.8. OTHER MATERIAL INFORMATION REGARDING THE SYSTEM OF GOVERNANCE
No other material information is reported regarding SCOR’s system of governance, other than that presented in Sections B.1 – General information on the system of governance to B.7 – Outsourcing.
72 / Solvency and financial condition report – SCOR Group, SCOR SE, SGP&C SE and SGL SE / 2016
RISK PROFILE
#C
C.1. INTRODUCTION 74
C.1.1. General introduction 74
C.1.2. Sensitivity analysis 75
C.2. UNDERWRITING RISKS 75
C.2.1. P&C reinsurance 76
C.2.2. Life reinsurance 79
C.2.3. Risks related to reserves 82
C.2.4. Retrocession and other risk mitigation techniques 84
C.2.5. Special purpose vehicles 85
C.2.6. Underwriting risks at SCOR SE level 85
C.2.7. Underwriting risks at SGP&C SE level 85
C.2.8. Underwriting risks at SGL SE level 86
C.3. MARKET RISKS 86
C.3.1. Overview of market risk 86
C.3.2. Management of market risk 88
C.3.3. Market risks at SCOR SE level 89
C.3.4. Market risks at SGP&C SE level 89
C.3.5. Market risks at SGL SE level 89
C.4. CREDIT RISK 90
C.4.1. Overview of credit risk 90
C.4.2. Management of credit risk 91
C.4.3. Credit risks at SCOR SE level 92
C.4.4. Credit risk at SGP&C SE level 92
C.4.5. Credit risks at SGL SE level 92
732016 / Solvency and financial condition report – SCOR Group, SCOR SE, SGP&C SE and SGL SE /
C.5. LIQUIDITY RISKS 93
C.5.1. Overview of liquidity risks 93
C.5.2. Management of liquidity risks 94
C.5.3. Expected profits included in future premiums 94
C.5.4. Liquidity risks at SCOR SE level 94
C.5.5. Liquidity risks at SGP&C SE level 94
C.5.6. Liquidity risks at SGL SE level 95
C.6. OPERATIONAL RISKS 95
C.6.1. Overview of operational risks 95
C.6.2. Management of operational risks 97
C.6.3. Operational risks at SCOR SE level 97
C.6.4. Operational risks at SGP&C SE level 97
C.6.5. Operational risks at SGL SE level 97
C.7. OTHER MATERIAL RISKS 98
C.7.1. Strategic risk 98
C.7.2. Risks related to the competitive environment 99
C.7.3. Significant risk concentrations at the level of the Group 104
C.7.4. Other material risks at SCOR SE level 104
C.7.5. Other material risks at SGP&C SE level 104
C.7.6. Other material risks at SGL SE level 105
C.8. ANY OTHER INFORMATION 105
74 / Solvency and financial condition report – SCOR Group, SCOR SE, SGP&C SE and SGL SE / 2016
> Introduction#C RISK PROFILE
C.1. INTRODUCTION
C.1.1. GENERAL INTRODUCTION
The Group regularly conducts reviews of the risks that could have a material adverse effect on its activity, its financial position or results (or capacity to meet objectives), and considers that no other significant risk than those disclosed in the section below exists. This section outlines management’s current view of SCOR’s main risks and main risk management mechanisms currently in place at the level of the Group as well as at the level of all three French legal entities, SCOR SE, the parent company, SGP&C SE and SGL SE.
The Group has identified the following categories of risks, also applicable to legal entities, excluding Life underwriting risks for SGP&C SE and SCOR UK, and P&C Underwriting risks for SGL SE and SGLRI:
●● underwriting risks related to the P&C and Life reinsurance businesses;
●● market risks;
●● credit risks;
●● liquidity risks;
●● operational risks;
●● strategic risks (see Section C.7 – Other material risks).
All these risks, further described in this chapter, are managed through a variety of mechanisms in SCOR’s ERM (Enterprise Risk Management) framework.
SCOR’s ERM framework is further described in:
●● section B.3 – Risk management system including the ORSA for a wider description of the Group risk management system as well as the role of the main stakeholders involved in risk management and relevant procedures and control activities;
●● section B.1 – General information on the system of governance for a description of the role of the administrative and management bodies involved in the risk management system and related control functions.
Although risk management mechanisms have been designed and rolled out across the Group in order to prevent all risk from having a significant impact, there is no guarantee that these mechanisms achieve their intended objective. Many of SCOR’s methods for managing risk and exposures are based on observed historical market behavior, statistics based on historical models, or expert judgment. As a result, these methods may not fully predict future exposures, which may be significantly greater than estimated, particularly in unstable or volatile markets and environments. Other risk management methods depend upon the evaluation of information regarding markets, clients, natural catastrophes or other matters that is publicly available or otherwise accessible to SCOR. This information may not always be accurate, complete, up-to-date or properly evaluated.
SCOR may also be exposed to emerging risks, which include new threats or constantly changing current risks with a high degree of uncertainty. They may arise from the numerous changes to the environment in which the Group operates, such as changes in professional practices or in legal, jurisdictional, regulatory, social, political, economic, financial and/or environmental conditions.
Emerging risks may adversely affect SCOR’s reinsurance business due to either a change in interpretation of the contracts leading to extensions of cover beyond what policyholders had expected (e.g. due to the inapplicability or interpretation of certain clauses) or by increasing the frequency and/or severity of claims. Such risks may also lead to higher fluctuations than expected in macroeconomic indicators such as interest rates and price level, or disruptions in financial markets, further impacting SCOR’s business. In addition, emerging risks may also have a direct impact on SCOR’s operations, for instance by generating unexpected additional expenses. Examples of emerging risks include: cyber-attacks, antimicrobial resistance, non-controlled bio-experiments, climate change, electromagnetic fields, extreme social unrest and Eurozone break-up.
Therefore, the Group cannot exclude the possibility of exceeding SCOR’s risk tolerance limits due to an incorrect estimation of its risks and exposures. If the risks disclosed in this section were to occur, they could potentially have a significant effect on SCOR’s present and future business, cash flows, eligible own funds and solvency position.
As mentioned in Section B.3.3 – Internal model contribution to the ERM framework, the risk categories reported in the internal model include P&C underwriting and reserving risk for the Group and P&C related legal entities, Life underwriting and reserving risk for the Group and Life related legal entities, Market risk including interest rate risk and currency risk, credit risk, and operational risk.
For further information on risks included in SCOR’s internal model, at both SCOR Group and French legal entity level, see Chapter E – Capital Management.
SCOR is exposed to other risks not modeled within the internal model including strategic, liquidity and emerging risks. These risks are not expected to have an immediate impact on the Solvency Ratio over a one-year time horizon and are monitored and managed through specific processes.
For quantitative information on all risk categories, including changes over the reporting period, see Section E.1.2.1 – SCR by risk category.
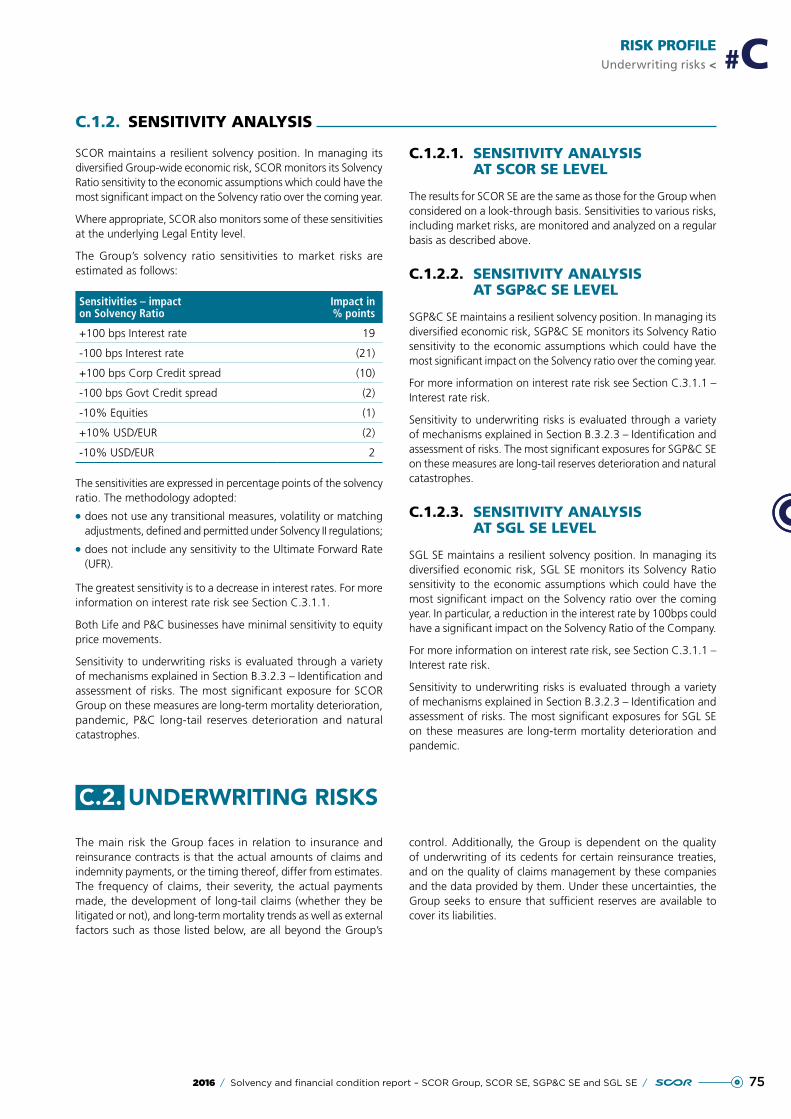
752016 / Solvency and financial condition report – SCOR Group, SCOR SE, SGP&C SE and SGL SE /
RISK PROFILE Underwriting risks < #C
C.1.2. SENSITIVITY ANALYSIS
SCOR maintains a resilient solvency position. In managing its diversified Group-wide economic risk, SCOR monitors its Solvency Ratio sensitivity to the economic assumptions which could have the most significant impact on the Solvency ratio over the coming year.
Where appropriate, SCOR also monitors some of these sensitivities at the underlying Legal Entity level.
The Group’s solvency ratio sensitivities to market risks are estimated as follows:
Sensitivities – impact on Solvency Ratio
Impact in % points
+100 bps Interest rate 19
-100 bps Interest rate (21)
+100 bps Corp Credit spread (10)
-100 bps Govt Credit spread (2)
-10% Equities (1)
+10% USD/EUR (2)
-10% USD/EUR 2
The sensitivities are expressed in percentage points of the solvency ratio. The methodology adopted:
●● does not use any transitional measures, volatility or matching adjustments, defined and permitted under Solvency II regulations;
●● does not include any sensitivity to the Ultimate Forward Rate (UFR).
The greatest sensitivity is to a decrease in interest rates. For more information on interest rate risk see Section C.3.1.1.
Both Life and P&C businesses have minimal sensitivity to equity price movements.
Sensitivity to underwriting risks is evaluated through a variety of mechanisms explained in Section B.3.2.3 – Identification and assessment of risks. The most significant exposure for SCOR Group on these measures are long-term mortality deterioration, pandemic, P&C long-tail reserves deterioration and natural catastrophes.
C.1.2.1. SENSITIVITY ANALYSIS AT SCOR SE LEVEL
The results for SCOR SE are the same as those for the Group when considered on a look-through basis. Sensitivities to various risks, including market risks, are monitored and analyzed on a regular basis as described above.
C.1.2.2. SENSITIVITY ANALYSIS AT SGP&C SE LEVEL
SGP&C SE maintains a resilient solvency position. In managing its diversified economic risk, SGP&C SE monitors its Solvency Ratio sensitivity to the economic assumptions which could have the most significant impact on the Solvency ratio over the coming year.
For more information on interest rate risk see Section C.3.1.1 – Interest rate risk.
Sensitivity to underwriting risks is evaluated through a variety of mechanisms explained in Section B.3.2.3 – Identification and assessment of risks. The most significant exposures for SGP&C SE on these measures are long-tail reserves deterioration and natural catastrophes.
C.1.2.3. SENSITIVITY ANALYSIS AT SGL SE LEVEL
SGL SE maintains a resilient solvency position. In managing its diversified economic risk, SGL SE monitors its Solvency Ratio sensitivity to the economic assumptions which could have the most significant impact on the Solvency ratio over the coming year. In particular, a reduction in the interest rate by 100bps could have a significant impact on the Solvency Ratio of the Company.
For more information on interest rate risk, see Section C.3.1.1 – Interest rate risk.
Sensitivity to underwriting risks is evaluated through a variety of mechanisms explained in Section B.3.2.3 – Identification and assessment of risks. The most significant exposures for SGL SE on these measures are long-term mortality deterioration and pandemic.
C.2. UNDERWRITING RISKS
The main risk the Group faces in relation to insurance and reinsurance contracts is that the actual amounts of claims and indemnity payments, or the timing thereof, differ from estimates. The frequency of claims, their severity, the actual payments made, the development of long-tail claims (whether they be litigated or not), and long-term mortality trends as well as external factors such as those listed below, are all beyond the Group’s
control. Additionally, the Group is dependent on the quality of underwriting of its cedents for certain reinsurance treaties, and on the quality of claims management by these companies and the data provided by them. Under these uncertainties, the Group seeks to ensure that sufficient reserves are available to cover its liabilities.
76 / Solvency and financial condition report – SCOR Group, SCOR SE, SGP&C SE and SGL SE / 2016
> Underwriting risks#C RISK PROFILE
Generally, SCOR’s ability to increase or maintain its portfolios of insurance and reinsurance risks in the P&C and Life divisions may depend on external factors such as professional practices, legal, jurisdictional, regulatory, social, political, economic, financial and environmental conditions. These factors create uncertainties and may adversely affect SCOR’s business due to either an interpretation of the contracts leading to an extension of coverage (e.g. through inapplicability or interpretation or overriding of treaty clauses) or by increasing the frequency and/or severity of claims beyond what was anticipated at the time of the underwriting.
SCOR mitigates its underwriting risks related to the P&C and Life reinsurance businesses through the purchase of risk mitigation covers, both on the traditional retrocession market and on the capital markets via alternative risk transfer solutions (e.g. the multi-year securitization of catastrophic and pandemic risk in the form of Insurance-Linked Securities («ILS») and the issuance of contingent capital facilities). However, there is a risk that SCOR may not be able to transfer its liabilities through the purchase of such instruments on economically viable terms and conditions in the future. For further details on retrocession and other risk mitigation techniques within SCOR, see Section C.2.4 – Retrocession and other risk mitigation techniques.
Consistent with the Group’s strategy of selective market and business division development, SCOR seeks to maintain a portfolio of business risks that is strategically diversified geographically, by line and class of business and over time (short and long-tail). The Group’s insurance risk exposure is mitigated by diversification across a large portfolio of reinsurance contracts. The volatility of risks is reduced by careful business selection, implementation of underwriting guidelines, the use of retrocession and other risk transfer arrangements and proactive claims handling as well as underwriting, claims and administration audits at ceding companies.
SCOR underwrites reinsurance covers in P&C and Life and occasionally in direct P&C insurance.
SCOR writes direct insurance, primarily on a business-to-business basis to cover large corporate risks through the Business Solutions domain of SCOR Global P&C and through the participation in Lloyd’s syndicates including Channel 2015, for which SCOR is the sole capital provider, as well as through some participations in Business Ventures and Partnerships.
C.2.1. P&C REINSURANCE
The main risks linked with the P&C reinsurance business (and direct insurance activity) underwritten by SCOR’s P&C division are P&C long-tail reserves deterioration, natural and man-made catastrophes, including terrorism, and other risks beyond its direct control such as systematic crisis or the cyclicality of the business.
For quantitative information on P&C underwriting risks, see Section C.1 – Introduction and Section E.1.2 – Solvency Capital Requirement.
C.2.1.1. P&C LONG-TAIL RESERVE DETERIORATION
This is the risk that the P&C claims inflation is higher than assumed in the calculation of the Best Estimate Liabilities (BEL) and mostly affects the long-tail lines of business, such as all casualty, professional liability and financial lines, inherent defect and construction warranty, medical malpractice, motor (first and third-party liability) and workers’ compensation. Claims inflation is influenced by, but not directly linked to general inflation.
For SCOR’s casualty business, the frequency and severity of claims and the related amounts of indemnity paid can be affected by several factors. The most significant factors are the changing legal and regulatory environment, including changes in civil liability law and jurisprudence.
For further information on risks related to reserves, please see Section C.2.3 – Risks related to reserves.
C.2.1.2. NATURAL AND MAN-MADE CATASTROPHES
SCOR’s property business underwritten by SCOR Global P&C is exposed to multiple insured losses arising from single or multiple events, which can be catastrophic, being either caused by nature (e.g. hurricane, typhoon, windstorm, flood, hail, severe winter storm, earthquake) or man-made (e.g. explosion, fire at a major industrial facility, act of terrorism). Any such catastrophic event can generate insured losses in one or several of SCOR’s lines of business.
Natural Catastrophes
The most material catastrophes in SCOR’s risk profile are related to natural events, mainly tropical cyclones, windstorms, earthquakes and floods arising in North America and Europe and affecting property, engineering and possibly other lines of business.
SCOR manages its gross exposure to catastrophes through a comprehensive risk transfer and capital protection program which combines traditional retrocession and non-traditional solutions, including Catastrophe bonds and a contingent capital equity line.
772016 / Solvency and financial condition report – SCOR Group, SCOR SE, SGP&C SE and SGL SE /
RISK PROFILE Underwriting risks < #C
Man-Made Catastrophes
SCOR is exposed to insured losses, arising from single or multiple events, which can be catastrophic, caused by the occurrence of a man-made event. The lines of business mostly exposed to man-made catastrophe are property (other than natural catastrophe), marine, motor, casualty, credit and surety, aviation and space.
Property
Man-made catastrophes refer to negligent or deliberate human actions, e.g. conflagration, a large explosion and fire at a major industrial site, and terrorism. These events can cause great damage to property and lives. Malicious man-made events often target large cities and key landmarks such as international airports and governmental facilities.
In particular, SCOR is exposed to single or multiple terrorist attacks through some P&C treaties and national terrorism pools. Terrorism exposures are monitored on a worldwide basis as a fully integrated part of the Underwriting Management Framework. Underwriting guidelines stipulate the rules and procedures for terrorism risk for Treaty P&C, Specialty lines and SCOR Business Solutions (SBS). SCOR monitors this risk using a very conservative approach.
SCOR’s exposure to terrorism arises from participation in the protection of existing national terrorism pools and exposure from some markets that do not permit the exclusion of terrorism from insurance policies due to local regulation, such as in the US, or due to market practice. Furthermore, the US insurance market is exposed to significant risks due to the insurance obligation created by the law. However federal aid is also provided by the Terrorism Risk Insurance Program Reauthorization Act (“TRIPRA”).
A terror event could also have an impact on SCOR’s life portfolio. Although in past events the life claims incurred have been comparatively small compared to the non-life claims, a terrorist act might claim a large number of insured lives.
Casualty
SCOR is also exposed to man-made casualty catastrophes whose underlying nature and key specificities can vary widely, from commonly used products (with Asbestos as a typical example), or massive product liability losses emanating from items produced by a single manufacturer, to a single disastrous event (e.g. Deepwater Horizon oil rig explosion).
The amount of information available on casualty catastrophes is limited. In contrast to property catastrophes, which are short term in nature (limited number of days between insured event and loss emergence), at which point reasonable estimates of the size of the loss can be calculated, most casualty catastrophes emerge gradually and the full extent of the losses is often not known for decades.
SCOR is engaged in the development of advanced liability catastrophe analytics, and data mining and modeling techniques for improving its prediction capabilities for man-made casualty event losses.
Property and Casualty
The extent of the loss event and the affected lines of business will vary depending on the man-made event. SCOR can be affected from a man-made event simultaneously in the property and the casualty lines of business, e.g. if the explosion at a large industrial site destroys the industrial facility, but also pollutes the environment, given its proximity to vulnerable landscape (e.g. river, lake), and causes property damages and bodily injuries affecting the population.
C.2.1.3. OTHER RISK CONSIDERATIONS
In addition to the two main underwriting risks of SCOR P&C reinsurance as listed above, other factors could have an adverse impact, such as systemic crisis, cyclicality of the business and concentration risks related to its broker business.
Systemic Crisis
Historically, reinsurers have experienced significant fluctuations in operating income due to volatile and unpredictable developments, many of which are beyond the control of the reinsurer including general economic conditions, levels of capacity offered by the market, and the level of competition with regards to pricing. In particular, some SCOR’s lines of business which are directly linked to financial activities are more exposed to global economic recessions (e.g. systemic crisis post Lehman Brothers): for example, specialty lines such as Credit and Surety or liability risk such as Errors & Omissions and Directors & Officers Liability.
Cyclicality of the business
P&C insurance and reinsurance businesses are cyclical. The primary consequences of the market softening are a reduction in the volume of P&C reinsurance premiums on the market, an increase in competition within the reinsurance market, and also a preference for those operators who are most attentive to the specific needs of the cedents and the most capable of meeting them. This could lead potentially to a loss of competitive advantage for SCOR.
Beyond the general trends, the premium rate cycle affects certain geographic markets and/or certain lines of business in different ways and to different extents, independently of each other.
78 / Solvency and financial condition report – SCOR Group, SCOR SE, SGP&C SE and SGL SE / 2016
> Underwriting risks#C RISK PROFILE
Risk Concentrations
The accumulation of risks may produce concentrations of risk, such as exposure to certain regions or catastrophes. The largest single event to which the P&C business is exposed is a North American hurricane followed by an EU windstorm.
Concentration risk related to its broker business
SCOR carries out its P&C business both through brokers and through direct relationships with insurance company clients. For the year ended December 31, 2016, P&C wrote approximately 61% of gross written premiums through brokers and 39% through direct business, while Life wrote approximately 6% through brokers and approximately 94% through direct businesses.
C.2.1.4. MANAGEMENT OF UNDERWRITING RISKS RELATED TO THE P&C BUSINESS
The P&C division is organized in order to enable it to assess and control its risks at each level of its business:
●● most of the business underwritten is renewed on agreed dates. This enables SCOR to establish annual underwriting plans, both qualitative (description of the environment) and quantitative (activity budget). These plans are approved by the Executive Committee;
●● the Property and Casualty Treaty underwriters manage client relationships and offer reinsurance support after a careful review and assessment of the cedents’ underwriting policies, portfolio profiles, exposures and management procedures. They are responsible for writing treaty business as well as associated support on small and medium size facultative risks in their respective territories within the limits of their individually delegated underwriting authority and the scope of underwriting guidelines;
●● most of SCOR’s facultative underwriters work in the Business Solutions domain of SCOR Global P&C, which operates worldwide. This business area is dedicated to large corporate businesses and is geared to provide the clients of SCOR Global P&C with solutions for coverage of large conventional risks;
●● underwriting and pricing guidelines, defined by SCOR Global P&C, specify the underwriting capacities delegated to each underwriter in each entity, as well as the underwriting rules and principles to be complied with. These guidelines are subject to a regular review and approval process. SCOR’s underwriting guidelines are more restrictive regarding certain areas with difficult or uncertain legal environments:
– underwriting guidelines in place within SCOR Global P&C specify (i) the underwriting rules and principles with which the Group must comply; (ii) the underwriting capacities individually delegated to the underwriters in each of the markets and lines of business in which the Group operates as well as (iii) the relevant maximum acceptable commitments per risk and per event. They are reviewed and updated annually by the Underwriting Management function and approved by the Chief Executive Officer and Chief Risk Officer of SCOR Global P&C,
– pricing guidelines and parameters apply to all treaties priced within SCOR Global P&C. There are additional guidelines related to Natural Catastrophes and others specific to certain products which include Agriculture and Credit & Surety. These guidelines seek to ensure that the analyses provide: (i) a best estimate of the costs and profitability of a treaty as well as the uncertainty surrounding estimates; (ii) assistance with underwriting decisions; and (iii) the suitable outputs needed for the risk management process, in particular the internal model, such as probability distributions for losses/NPV, cash flow patterns for premium/losses, etc. They are set to provide consistency and continuity across the organization but also to take into account differences between markets and lines of business as well as the geographical location of the client and the risks insured. Parameters are revised at least once a year to consider, as the case may be, changing market conditions and environment. Contracts that meet certain risk thresholds are subject to mandatory peer reviews that have to be performed and documented before pricing is completed. SCOR Global P&C uses a data system that allows management to monitor and review the results from pricing tools;
●● the underwriting teams are supported by the SCOR Global P&C Underwriting Management function located in Paris and represented in the four Hubs. This function provides worldwide treaty and facultative underwriting guidelines, policies regarding the delegation of capacity, underwriting support to specific lines of business or individual risks when required, ceding company portfolio analysis and risk surveys and is responsible for the monitoring and referral of non-standard business and for authorizing exceptions to the underwriting guidelines;
●● business opportunities going beyond the stipulations of the guidelines thus defined are subject to special referral procedures at two levels: (1) by the Underwriting Management function and, where applicable, by the Legal Department and/or the Finance department; (2) and for cases which may have a significant impact on the balance sheet (thresholds and/or conditions defined in a procedure or specific guidelines) by the Group Risk Management Department and the Chief Executive Officer of SCOR Global P&C;
●● SCOR Global P&C Actuarial Pricing Department is responsible for the pricing of the reinsurance business, which is done by individual treaty. Guidelines, methods and tools are set and maintained at the global level and used by the pricing teams across the SCOR offices. Delegation authorities specify criteria under which the underwriters may price certain contracts still subject to the use of the Pricing Guidelines and tools. Pricing results quantify expected underwriting statistics (such as loss and expense ratios), volatility measures, and profitability measures (such as NPV, RORAC, and Profit Excess Targets). The results are also used as criteria for referrals within Underwriting Departments. Pricing actuaries team up with underwriters and modelers by market or by line of business;
792016 / Solvency and financial condition report – SCOR Group, SCOR SE, SGP&C SE and SGL SE /
RISK PROFILE Underwriting risks < #C
●● the Risk Modeling & Global Natural Hazards Department is in charge of monitoring accumulations. A “CAT” sub-group of the P&C Risk and Capital Committee meets regularly to review accumulations and decide on or arbitrate the allocation of CAT capacities by country. Earthquake and storm risks gross exposures are measured using proprietary external models from industry-leading catastrophe model suppliers, including Risk Management Solutions RiskLink® (“RMS”) and AIR Worldwide Catrader® (“AIR”). These tools enable the Group to quantify its exposure in terms of a probable maximum loss (“PML”) at various levels of probability for each peril and geographic location. The overall aggregate annual PML per peril, allowing for potential multiple events, provides the information required to determine the level of retrocession and other alternative risk transfer solutions (e.g. catastrophe bonds) that are needed to ensure that the net aggregate exposure is optimized for the Group’s risk appetite and remains within predefined tolerance limits;
●● in order to mitigate its property exposure, the Group retrocedes a portion of the risks it underwrites. See Section C.2.4 – Retrocession and other risk mitigation techniques for further information on how these instruments are managed;
●● the claims handling function is performed by the claims teams, which review, process and monitor reported claims. SCOR Global P&C’s Claims & Commutations Department is in charge of the implementation and overview of the overall claims handling and commutation management policy for the P&C division, implementing worldwide control and reporting procedures and managing commutation of portfolios and commitments. It supports and controls the day-to-day activity and takes over the direct management of large, litigious, serial
and latent claims. In addition, periodic audits are conducted on specific claims and lines of business, and claims processing and procedures are examined at the ceding companies’ offices with the aim of evaluating their claims adjustment process, valuation of case reserves and overall performance. When needed, recommendations are given to underwriters and local management;
●● the adequacy of SCOR Global P&C’s reserves are controlled based on specific procedures. For further information on how risks related to reserves are managed, see Section C.2.3 – Risks related to reserves;
●● risks specific to the administration of contracts are subject to checks performed at the subsidiary and branch level. SCOR’s Group Information System includes multiple automatic checks and additional tools;
●● a quarterly review of technical results is performed by business area (Property and Casualty Treaties, Specialty Lines, Business Solutions (Facultative), Business Ventures and Partnerships) and region. The review enables the analysis of technical results by underwriting year, by nature and by line of business;
●● SCOR Global P&C’s Risk Management organizes the quarterly P&C Risk and Capital Committee meeting, which is responsible for highlighting the main risks to which the P&C division is exposed, regarding both assets and liabilities;
●● cross reviews are conducted by SCOR Global P&C’s Risk Department to assess the quality of underwriting, pricing and claims handling of particular business units or certain lines of business, to identify and assess risks, to evaluate the appropriateness and effectiveness of controls and to propose risk management measures, including mitigating actions.
C.2.2. LIFE REINSURANCE
The main underwriting risks for SCOR’s Life division are described below. For quantitative information on Life underwriting risks, see Section C.1 – Introduction and Section E.1.2 – Solvency Capital Requirement.
C.2.2.1. LONG-TERM MORTALITY DETERIORATION
Long-term mortality deterioration risk refers to potential negative deviations in future mortality patterns from current best-estimate assumptions due to a higher than anticipated number of deaths (i.e. increased mortality rates) among the portfolio lives reinsured by SCOR. This could result from inherent volatility, initial mispricing (level risk) or an adverse long-term trend. The latter could potentially be influenced by various emerging risks.
SCOR’s long-term mortality reserves are based on a number of assumptions and information provided by third parties, which, if incorrect and/or incomplete, could have an adverse effect on the Group.
C.2.2.2. PANDEMIC
In Life reinsurance, a severe pandemic is a major risk. In the past century, three major outbreaks of influenza occurred and claimed millions of lives. The occurrence of a similar event could cause large losses to SCOR due to an increased mortality far beyond the usual volatility. A lethal virus strain not only of influenza but of any other communicable disease could lead to a heavy increase in mortality rates and increased medical costs which could significantly affect SCOR’s results.
80 / Solvency and financial condition report – SCOR Group, SCOR SE, SGP&C SE and SGL SE / 2016
> Underwriting risks#C RISK PROFILE
C.2.2.3. LONGEVITY
Longevity risk refers to the risk of a negative deviation from expected results due to the insured or annuitant living longer than assumed in the pricing or reserves. This risk could have an impact on longevity swaps, annuity and long-term care covers and on other longevity protection products.
C.2.2.4. POLICYHOLDER BEHAVIOR RISK
SCOR Global Life is also exposed to risks related to policyholder behavior, such as lapsation and anti-selection at policy issue.
Lapses refer to either non-payment of premiums by the policyholder, or to policies which are terminated by the policyholder before the maturity date of the policy. Depending on product design, higher or lower policyholder lapses than assumed in the pricing or reserving may reduce SCOR Global Life’s expected future income.
Anti-selection refers to the problem of asymmetry of information between the insured and the insurer. An individual applying for Life or Health insurance cover usually has better knowledge about his or her own state of health than the insurer. The risk to the (re)insurer is of policyholders deliberately deciding among other things to:
●● take out a policy in the knowledge that either their chances of claiming is high or higher than average;
●● terminate a policy in the knowledge that their chances of claiming are low or lower than average, or;
●● choose and exercise a policy option which increases their expected benefit.
This might lead to a portfolio composition which differs from the one assumed during pricing and might imply lower than expected profits for both the direct insurer and the reinsurer.
C.2.2.5. MORBIDITY RISKS
Products such as critical illness, short-term and long-term disability and long-term care, which all contain morbidity risk, are subject to the risk of negative trends in health, as well as to the consequences of improved medical diagnosis capabilities which increase the number of claims due to conditions that otherwise would possibly have remained undetected. Medical progress may in the future enable better treatment, resulting in higher claims, since certain diseases would have otherwise led to a much shorter life expectancy of the insured. Products providing cover for medical expenses are in particular subject to the risk of higher than expected incidence and inflation of medical costs.
C.2.2.6. OTHER RISKS
Risk concentrations
The accumulation of risks may produce concentrations of risk, such as exposure to certain regions or events. The largest risks are to which the Life business is exposed are mortality trends and shocks (i.e. pandemics).
Other
In addition to the main underwriting risks of SCOR Global Life as listed above, other factors could have an adverse impact, whether related to policyholder behavior such as resale or purchase of policies by third parties with no insurable interest, or other risk factors such as risks related to product guarantees.
C.2.2.7. MANAGEMENT OF UNDERWRITING RISKS RELATED TO THE LIFE REINSURANCE BUSINESS
In addition to the transversal risk management mechanisms described in the introduction to this section, SCOR Global Life also implements mechanisms to mitigate certain risks specific to the division:
●● claims deterioration risks are mitigated through yearly renewable terms for parts of the mortality business, and through premium adjustments for some products;
●● lapse risks are mitigated through appropriate reinsurance treaty clauses, as well as product, client and market diversification;
●● anti-selection risks are mitigated through careful product design and a well-defined medical and financial underwriting selection process.
The Life division is organized in order to be able to assess and control its risks at each level of its business:
●● generally, the Life reinsurance business is underwritten throughout the year. The Life business underwritten is monitored on a quarterly basis against prior year development as well as the business plan and regular updates are provided to the Executive Committee;
●● the underwriting of Life business within the Group is under the worldwide responsibility of SCOR Global Life. Clients are Life, Pension or Accident and Health insurance companies worldwide. They are served by SCOR’s specialized underwriters and actuaries who are familiar with the specific features of the markets in which they operate, in particular with local lines of business and policy conditions, as well as the technical specifics such as mortality tables, morbidity incidence rates and persistency rates. In the Life underwriting process, consideration is typically given to the quality of the client’s medical and financial underwriting standards, the target clientele of the ceding company, as well as past experience to the extent that credible data is available;
812016 / Solvency and financial condition report – SCOR Group, SCOR SE, SGP&C SE and SGL SE /
RISK PROFILE Underwriting risks < #C
●● Life reinsurance treaties are underwritten by Life reinsurance experts familiar with the specific features of their markets. The Life business is underwritten in accordance with internal underwriting and pricing guidelines. Mandates for underwriting Life reinsurance business are assigned to teams on a mutually exclusive basis;
●● in order to ensure that SCOR Global Life is continually up-to-date with biometric trends and scientific developments, SCOR Global Life uses the expertise of seven dedicated Research & Development centers to analyze and assess the key factors underlying mortality, longevity, long-term care & disability, critical illness, medical, policyholder behavior and medical underwriting & claims. These Research & Development Centers provide recommendations for the implementation of the research results into the pricing, underwriting and determination of exposure limits;
●● guidelines and other documents defined by SCOR Global Life specify the underwriting rules and principles to be complied with, underwriting capacities delegated to the underwriters and pricing actuaries in each of the markets in which the Group operates, as well as maximum acceptable commitments per risk and per event. These guidelines outline contract type and terms and conditions of acceptance. Furthermore, they set out the level of retention of SCOR Global Life for various risks and types of cover. Revisions and updates follow a formalized approval process
Business opportunities going beyond the stipulations of these guidelines and documents are subject to a special referral process in order to ensure that the business complies with established risk-adjusted return criteria and risk tolerance limits. These cases are examined at the SCOR Global Life level by the Regional and Global Pricing and Risk Management Department and, where applicable, the Finance Department. Cases which may have a significant impact on the balance sheet of the Group are additionally reviewed by the Group Risk Management Department. Thresholds or conditions for a referral to the Group Risk Management Department are outlined in specific guidelines;
●● accumulations of risk particularly exposed to catastrophes in the Life business are regularly assessed in “footprint” scenarios and local CAT scenarios. Specific tools are used to monitor known Group cover accumulation in selected geographical areas. Specifically designed retrocession programs aim at protecting the Life reinsurance business. One program protects assumed catastrophe excess of loss acceptances; another one protects the net retained lines in respect of proportional and per risk acceptances. SCOR is making use of the RMS model for infectious diseases in order to assess the potential exposure to risk arising from global pandemics;
●● maximum underwriting capacities are established to limit SCOR Global Life’s exposure on various types of treaties underwritten, proportional and non-proportional, covering individual or Group policies. These capacities are reviewed each year, taking into account the capacities obtained by the retrocession coverage. These limits include: maximum commitment per life accumulated for all SCOR exposures, maximum annual commitments for non-proportional cover per life or per event, maximum commitment per country for non-proportional exposures by event. Aggregate portfolio exposures are continually monitored. Specialized software allows an accumulation control of insured lives and is fed with single risk information as received by the client companies. Based on this system, risks under which the accumulated exposure exceeds SCOR Global Life’s retention are identified and retroceded. The retention limits are reviewed regularly. The exposure is monitored throughout the year against SCOR’s defined risk limits and used for decisions on mitigating measures. Monitoring of peak exposures is included in Life regular risk reporting. See Section C.2.4 – Retrocession and other risk mitigation techniques for further information on how these instruments are managed;
●● the Life division’s claims handling is performed by local claims teams that handle and monitor claims. Claims exceeding a predefined threshold are reviewed by CREDISS, SCOR Global Life’s medical underwriting and claims research & development center. In addition, where deemed appropriate, audits are conducted on claims or specific lines of business at the ceding companies’ offices;
●● the adequacy of SGL reserves is monitored based on specific procedures. For further information on how risks related to reserves are managed, please see Section C.2.3 – Risks related to reserves;
●● risks specific to the management of contracts are mitigated by specific controls supported by SCOR’s IT Systems which include numerous automatic controls and additional tools;
●● a quarterly review of technical results is performed by region and by business area;
●● SCOR Global Life’s Risk Management Department organizes quarterly meetings of the Life Risk Committee, which is responsible for reviewing the main risks to which the Life division is exposed;
●● in addition, cross reviews are commissioned by SCOR Global Life’s Chief Executive Officer to evaluate, on the one hand, the quality of underwriting, pricing, medical underwriting and claims handling of particular market areas or lines of business and, on the other hand, to identify and assess risks, to evaluate the appropriateness and effectiveness of controls and to propose risk management actions.

82 / Solvency and financial condition report – SCOR Group, SCOR SE, SGP&C SE and SGL SE / 2016
> Underwriting risks#C RISK PROFILE
C.2.3. RISKS RELATED TO RESERVES
C.2.3.1. SCOR’S RISKS RELATED TO RESERVES
The SCOR Group is required to maintain reserves to cover its estimated ultimate liability for losses and loss adjustment expenses with respect to reported and unreported claims, incurred as at the end of each accounting period, net of estimated related recoveries. Its reserves are established based on the information it receives from its cedent insurance companies, including their own reserving levels, as well as on the basis of its knowledge of the risks, the studies it conducts and the trends it observes on a regular basis. As part of the reserving process SCOR reviews available historical data and tries to anticipate the impact of various factors such as changes in laws and regulations, judicial decisions, social and political attitudes, trends in mortality and morbidity, and changes in general economic conditions.
If some information were to be incorrect and/or incomplete, this could have an adverse effect on the Group. Despite the audits it carries out on the companies with which it does business, the Group is still dependent on their reserves assessment.
As is the case for all other reinsurers, the inherent uncertainties in estimating reserves are compounded by the significant periods of time that often elapse between the occurrence of an insured loss, the reporting of the loss to the primary insurer and ultimately to SCOR.
Another factor of uncertainty resides in the fact that some of SCOR’s activities are long-tail in nature such as long-term care, whole Life products, longevity, workers’ compensation, general liability, or medical malpractice, etc. It has, in the past, been necessary for SCOR to revise estimated potential loss exposure on such lines of business.
C.2.3.2. MANAGEMENT OF RESERVING RISK
With regards to reserving risk, SCOR seeks high confidence in reserving adequacy based on the implementation of generally accepted reserving methodologies, fit for purpose reserving tools and robust reserving processes, controls and reconciliation validated by extensive risk management actions, in particular on assumptions, expert judgment, model, data quality and results. This also includes independent internal and external reviews.
The adequacy of P&C and Life reserves is checked on a quarterly basis by internal actuaries at division level as well as at the Group level by the Group Chief Actuary who signs off on the adequacy of reserves and reports to the Executive Committee and the Audit Committee.
External consulting firms can also be mandated to review the P&C reserves. Life reserving assumptions have been reviewed by an external firm as part of the embedded value calculation. If necessary, internal audits of its portfolios are performed.
The Chief Reserving Actuaries of the divisions are responsible for overseeing the reserves of their respective divisions, to assure appropriateness in the reserving methods and parameters used and to enhance reserving governance. The Group Chief Actuary is in charge of the independent validation and testing of reserving tools, workflows, assumptions and processes.
A centrally defined and tightly controlled reserving process, strong portfolio diversification, prudent reserving, sound reserving tools and, actuarial methods used by highly skilled professionals and a high level of transparency, both internally and externally, all tend to minimize the risk of inadequate reserves.
P&C business
Within SCOR Global P&C, in order to ensure an adequate and efficient monitoring of the reserves, a report is established on a yearly basis by the Group Actuarial Department, where the Group Chief Actuary, reporting to the Group Chief Risk Officer, gives his opinion on the year-end booked reserves’ adequacy. The main objective of this report is to provide SCOR’s Executive Committee and Audit Committee with an overall opinion on the adequacy of the P&C division’s reserves but also to highlight the inherent uncertainties surrounding this assessment. The monitoring of the reserves by the divisions and the Group’s Actuarial Department is centered on three mechanisms:
●● a quarterly follow-up of the claims activity and review of reserves for each segment through adequate reporting procedures;
●● an annual internal actuarial analysis, including a review of all segments together with a full analysis of the segments that may have a substantial impact on SCOR’s balance sheet. This analysis is performed by the SCOR Global P&C reserving actuaries and reviewed by the Group Actuarial Department which also performs its own full analysis. These analyses are recorded in an annual actuarial report;
●● regular external reviews of the adequacy of SCOR Global P&C division’s reserves are performed, including those required by local regulators (Canada, Australia, Hong Kong, South Africa, China and SCOR Lloyd’s syndicate).
SCOR regularly reviews its methods for determining outstanding claims reserves and IBNR reserves. However, it is difficult to accurately value the amount of reserves required, especially in view of changes in the legal environment, which could have an impact on reserve development.
832016 / Solvency and financial condition report – SCOR Group, SCOR SE, SGP&C SE and SGL SE /
RISK PROFILE Underwriting risks < #C
When a claim is reported to the ceding company, its claims department establishes a reserve corresponding to the estimated amount of the ultimate settlement for the claim. The estimate is based on the cedent’s own evaluation methods. The ceding company reports the claim and its suggested reserve amount to the Group entity with which it concluded its reinsurance contract. The Group records the ceding company’s suggested reserve and is free to establish greater or smaller reserves based on the review and analysis by SGP&C’s claims team. Greater or smaller potential reserves are based upon the consideration of many factors, including the level of the commitments, seriousness of the claims and SGP&C’s assessment of the ceding company’s claims management.
In compliance with applicable regulatory requirements and in accordance with industry practices, the Group maintains IBNR reserves in addition to outstanding claims reserves. These reserves represent:
●● the estimated final amount that may be paid by the Group on losses or events that have occurred, but are not yet reported to the ceding company or to the SCOR entity concerned; and
●● the estimated cost variation on claims already reported to the Group.
In determining the amount of its reserves, the Group generally uses actuarial techniques that take into account quantitative loss experience data, together with qualitative factors, where appropriate. The reserves are also adjusted to reflect reinsurance treaty terms and conditions, and any changes in claims processing that may potentially affect the Group’s commitment over time.
The Group continues to pursue the active commutations policy of its portfolios initiated in 2003, the main goals being to reduce the volatility of claims reserves and administrative costs, particularly of the oldest reserves, and to allow the reallocation of capital. This policy will be continued by focusing efforts on the US run-off activities and on some treaties written by the former Converium company acquired by SCOR in 2007.
Life business
Within SCOR Global Life, in order to ensure an adequate and efficient monitoring of the reserves, a report is established on a yearly basis by the Group Actuarial Department where the Group Chief Actuary gives his opinion on the year-end booked reserves’ adequacy. The main objective of this report is to provide SCOR’s Executive Committee and Audit Committee with an overall opinion on the adequacy of the Life division’s reserves but also to highlight the inherent uncertainties surrounding this assessment.
The monitoring of the reserves by the division’s and the Group’s Actuarial Department is centered on three mechanisms:
●● a quarterly follow-up of the claims activity and review of reserves for each segment through adequate reporting procedures;
●● an annual internal actuarial analysis, including a review of all segments together with a full analysis of the segments that may have a substantial impact on SCOR’s balance sheet.
This analysis is performed by the SCOR Global Life reserving actuaries and reviewed by the Group Actuarial Department which also performs its own full analysis. These analyses are recorded in an annual actuarial report;
●● regular external reviews of the adequacy of the SCOR Global Life division’s reserves are performed including those required by local regulators.
The Group Actuarial Department does not intend to provide an alternative best estimate but verifies the adequacy of the assumptions and methods and processes used by the teams of SCOR Global Life to determine the Life reserves. In some cases, the Group Actuarial Department applies a global approach and calculates a confidence range in order to check that the reserves booked are within said confidence range.
For its Life business, SCOR is required to maintain adequate reserves to reflect the liability for future claims and benefit payments resulting from life reinsurance treaties, mainly mathematical reserves and claim reserves.
The mathematical reserves are generally calculated as the present value of projected future payments to cedents less the present value of projected premiums still payable by cedents. The calculation includes assumptions relating to mortality, morbidity, disability, lapses and expected future interest rates.
The mathematical reserves are established on initial recognition of a contract on the basis of best estimate assumptions and allow for an adequate safety margin for the risks of change, error and random fluctuation. They are subject to a liability adequacy test.
In determining its best estimates, the Group takes into consideration its past experience, current internal data, external market indices and benchmarks and other relevant information. The contracts’ liabilities established by the Group with respect to individual risks or classes of business may be greater or less than those established by ceding companies due to the use of different mortality tables or other assumptions.
Claim reserves for losses are recognized for payment obligations from reinsurance losses that have occurred but have not yet been settled. They are recognized under reserves for reinsurance losses reported before the reporting date and IBNR. SCOR regularly reviews and updates its methods for determining outstanding claims reserves and IBNR Reserves.
Solvency II Technical Provisions
The Solvency II Technical Provisions, are composed of Best Estimate Liabilities (BEL) and the Risk Margin. The Group Actuarial Function coordinates the calculation of Technical Provisions across the Group. It relies upon the existing processes and controls described above and remains independent of the production of Technical Provisions. In addition, the Actuarial Function provides an assessment on the reliability and adequacy of the calculation of the BEL for P&C and Life business.
84 / Solvency and financial condition report – SCOR Group, SCOR SE, SGP&C SE and SGL SE / 2016
> Underwriting risks#C RISK PROFILE
For further information on how technical provisions are valued, see Chapter D – Valuation for solvency purposes, Section D.2 – Technical provisions.
The contribution of the actuarial function to the management of the risk on technical provisions includes additional specific controls:
●● for P&C business, externally audited IFRS reserves (loss reserves and undiscounted IBNR) are the starting point for calculating the Solvency II Technical Provisions (before discounting). Thereafter, the adjustments made to move from IFRS reserves to the Solvency II Technical Provisions are reviewed internally and across functions according to the area of expertise of the appropriate stakeholders (P&C division, Finance function, Actuarial Function Holder, etc.);
●● for Life business, the BEL is computed centrally based on projected Best Estimate cash flows. Consistency checks on projected cash flows are carried as well as analyses changes in the BEL compared to previous periods;
●● the risk margin is calculated in the Group internal model, which is subject to an independent validation (for further information on the IM related governance, see Section B.3.3 – Internal model contribution to the ERM framework). The methodology used is aligned with Solvency II requirements and reviewed by the Group Actuarial Function Holder.
For further information on how the Actuarial Function contributes to the effective implementation of the risk management system, see Section B.6 – Actuarial function.
C.2.4. RETROCESSION AND OTHER RISK MITIGATION TECHNIQUES
Reinsurers typically purchase reinsurance to cover their own risk exposures. Reinsurance of a reinsurer’s business is called retrocession. SCOR remains primarily liable to the direct insurer on all risks reinsured although the retrocessionaire is liable to the Group to the extent of the cover limits purchased.
The level of retrocession is selected each year to ensure that SCOR’s retained risk profile respects the specific Group risk appetite framework and to help the Group achieve its return on capital and solvency objectives.
SCOR aims at diversifying its retrocession and risk mitigation instruments as well as counterparties in order to take advantage of all different sources of capacities on the market. This enables the retrocession and risk mitigation program to be constructed with complementary mitigation effects offering optimal efficiency and also to avoid overdependence on a reduced number of counterparties for future placements.
Beyond traditional retrocession, purchased for all main lines of business, SCOR has implemented a “Capital Shield Strategy”, which combines the following solutions:
●● traditional retrocession (proportional or non-proportional);
●● capital markets solutions and alternative risk transfer solutions (collateralized retrocession, Insurance-Linked Securities including catastrophe and extreme mortality bonds, sidecars);
●● solvency buffer: SCOR has set out a solvency scale with clear and well defined buffers safeguarding the Group’s franchise;
●● contingent capital facilities to partially replenish the Group’s capital base in case of very remote pre-defined events. The current contingent capital guaranteed equity line is providing the Group with EUR 300 million coverage. It is innovative in that it protects the Group against both natural catastrophes and extreme mortality events.
Retrocession procedures are centralized in the retrocession teams of the P&C and Life divisions:
●● within the P&C division, the SCOR Global P&C Underwriting Management and Retrocession Department establishes and implements the external retrocession plan for the P&C business. This department is responsible for proper application of the plan, for monitoring the solvency of the retrocessionaires, the related counterparty risks and, when necessary, recovery of balances due;
●● within the Life division, scenarios are established in conjunction with the Actuarial & Risk Department of SCOR Global Life in order to define the need for retrocession coverage. The retention and the retrocession structure are revised every year.
The availability and efficiency of SCOR’s retrocession and risk mitigation program is monitored at Group level on a regular basis in order to ensure that the Group’s overall exposure remains within pre-defined risk tolerances.
For further information on how counterparty default risk related to retrocessionaires is managed, see Section C.4.1.2 – Credit risk related to retroceded liabilities.
In addition to externally placed retrocession, SCOR uses intragroup reinsurance/retrocession mainly in order to:
●● manage legal entities’ net risk profiles, required solvency capital and volatility of results;
●● preserve its ability to offer SCOR’s clients access to the Group underwriting capacity in each legal entity;
●● organize an internal pooling of risks to transfer to the external retrocession covers.
852016 / Solvency and financial condition report – SCOR Group, SCOR SE, SGP&C SE and SGL SE /
RISK PROFILE Underwriting risks < #C
C.2.5. SPECIAL PURPOSE VEHICLES
The Group sponsors a number of special purpose and alternative risk transfer vehicles designed to reduce SCOR’s exposure to catastrophe losses and to extreme mortality events.
For further information see the SCOR 2016 Registration Document, Note 2.3 – Information related to unconsolidated structured entities.
C.2.6. UNDERWRITING RISKS AT SCOR SE LEVEL
SCOR SE’s underwriting risks are the same as those of the Group. They arise primarily through its interest in other SCOR Group entities, as well as through its direct exposure (direct P&C insurance, reinsurance business underwritten). It relies on the organization defined within the Group. See Sections C.2.1 – P&C reinsurance, C.2.2 – Life reinsurance, C.2.3 – Risks related to
reserves and C.2.4 – Retrocession and other risk mitigation techniques for further details.
SPECIAL PURPOSE VEHICLES
Not applicable at SCOR SE level.
C.2.7. UNDERWRITING RISKS AT SGP&C SE LEVEL
C.2.7.1. P&C REINSURANCE
SGP&C SE faces the same risks as those of the P&C division and leverages on processes and controls in place within the division to manage its exposure. See Section C.2.1 – P&C reinsurance for further details.
C.2.7.2. RISKS RELATED TO RESERVES
SGP&C SE faces the same risks related to reserves as those of the P&C division and leverages on the processes and controls in place within the division to manage its exposure. See Section C.2.3 – Risks related to reserves for further details.
C.2.7.3. RETROCESSION AND OTHER RISK MITIGATION TECHNIQUES
SG P&C SE relies on the same techniques and processes as the Group in order to manage its risk exposure and to monitor the effectiveness of the mitigation techniques in place.
In line with SCOR Group’s Capital Shield Strategy, SGP&C SE aims to diversify its retrocession and risk mitigation instruments as well as counterparties in order to take advantage of all different sources of capacities on the market.
See Section C.2.4 – Retrocession and other risk mitigation techniques.
C.2.7.4. SPECIAL PURPOSE VEHICLES
In February 2015, SCOR sponsored Atlas IX Series 2015-1 which provides the Group with multi-year risk cover capacity of USD 150 million for US Named Storm and US and Canada Earthquake events. The risk period for Atlas IX 2015-1 extends from February 11, 2015 to December 31, 2018.
In January 2016, SCOR sponsored a new catastrophe bond, Atlas IX Series 2016-1, which provides the Group with multi-year risk transfer capacity of USD 300 million to protect itself against US Named Storm and US and Canada Earthquake events. The risk period for Atlas IX 2016-1 runs from January 13, 2016 to December 31, 2019.
All these vehicles use a market index, which means that losses are calculated using pay-out factors applied to market loss. The vehicles are fully funded at the inception of the risk period, ensuring full collateralization of the covers throughout the risk period.
On January 6, 2014, SCOR issued a fully collateralized sidecar, Atlas X Reinsurance Limited (“Atlas X”). It provides the Group with an additional three-year capacity of USD 55.5 million from a new panel of investors.
Atlas X is an Irish-domiciled special purpose reinsurance vehicle. Atlas X and SCOR Global P&C SE have entered into a quota share retrocession agreement, effective January 1, 2014, under which Atlas X reinsures a proportionate share of SCOR’s diversified catastrophe portfolios in specific countries. This agreement is accounted for as a reinsurance contract.
86 / Solvency and financial condition report – SCOR Group, SCOR SE, SGP&C SE and SGL SE / 2016
> Market risks#C RISK PROFILE
C.2.8. UNDERWRITING RISKS AT SGL SE LEVEL
C.2.8.1. LIFE REINSURANCE
SGL SE faces the same risks as those of the Life division and leverages processes and controls in place within the division to manage its exposure. See Section C.2.2 – Life reinsurance for further details.
C.2.8.2. RISKS RELATED TO RESERVES
SGL SE faces the same risks related to reserves as those of the Life division and leverages the processes and controls in place within the division to manage its exposure. See Section C.2.3 – Risks related to reserves for further details.
C.2.8.3. RETROCESSION AND OTHER RISK MITIGATION TECHNIQUES
SGL SE relies on the same techniques and processes as the Group in order to manage its risk exposure and to monitor the effectiveness of the mitigation techniques in place.
In line with SCOR Group’s Capital Shield Strategy, SGL SE aims to diversify its retrocession and risk mitigation instruments as well as counterparties in order to take advantage of all different sources of capacities on the market.
For further information, see Section C.2.4 – Retrocession and other risk mitigation techniques.
C.2.8.4. SPECIAL PURPOSE VEHICLES
In September 2013, SCOR Global Life entered into a risk transfer contract with Atlas IX Capital Limited, providing the Group with protection of up to USD 180 million against extreme mortality events in the US, such as pandemics, natural catastrophes and terrorist attacks. The risk period of Atlas IX runs from January 1, 2013 until December 2018. The trigger mechanics of the transaction are based on US population mortality weighted towards SCOR Global Life’s portfolio composition with regard to age and gender distribution. The risk transfer contract was fully collateralized at inception.
The Atlas IX mortality risk transfer contract transaction is recorded as a derivative asset and a payable for the value of the interest payments. For further information, see the SCOR 2016 Registration Document, Note 2.3 – Information related to unconsolidated structured entities.
C.3. MARKET RISKS
C.3.1. OVERVIEW OF MARKET RISK
Market risk is the risk that the fair value of future cash flows of a financial instrument fluctuates because of changes in market prices or macroeconomic variables. This includes interest rate risk and currency risk, further described below, as well as equity risk and real estate risk, to which SCOR is exposed through its investments. It also includes credit spread risk on these invested assets exposed to changes in spread due to general changes in market conditions as well as default risk arising from insolvency of an issuer or a counterparty. For further information on credit risk, see Section C.4 – Credit risk.
For further information on how other macroeconomic changes (such as changes in the general price level from its current trend) may impact SCOR’s assets, see Section C.7.1.1 – Risks related to the macroeconomic environment affecting SCOR’s strategy.
For quantitative information on market risk on invested assets, see Section C.1 – Introduction and Section E.1.2 – Solvency Capital Requirement. The presentation of SCOR’s assets giving rise to market and credit risks is provided in Section D.1 – Assets. For quantitative information on interest rate risk on liabilities and currency risk, see Section C.1 – Introduction.
C.3.1.1. INTEREST RATE RISK
Interest rates are very sensitive to a number of external factors, including monetary and budgetary policies, the national and international economic and political environment, and the risk aversion of economic actors.
Interest rate risk is the risk that the fair value of future cash flows of a financial instrument fluctuates because of changes in interest rates. Interest rate fluctuations have direct consequences on both the market value and the return on SCOR’s investments as the level of unrealized capital gains or losses and the return on securities held in its portfolio both depend on the level of interest rates. Floating-rate instruments expose the Group to cash flow interest rate risk, whereas fixed interest rate instruments expose the Group to fair value interest rate risk.
During periods of declining interest rates, income from investments is likely to fall due to investment of net cash flows and reinvestments of redemptions at rates lower than those of the existing portfolio (dilutive effect of new investments). During such periods, there is therefore a risk that SCOR’s return on equity objectives are not met. For callable bonds for which the issuer has an option to redeem earlier than the ultimate maturity, the probability of having to reinvest the early proceeds at lower interest rates is increased.
872016 / Solvency and financial condition report – SCOR Group, SCOR SE, SGP&C SE and SGL SE /
RISK PROFILE Market risks < #C
On the other hand, an increase in interest rates could lead to a fall in the market value of fixed income securities that SCOR holds. In the case of a need for cash, SCOR may be obliged to sell fixed income securities, possibly resulting in capital losses.
SCOR’s reinsurance business may also be exposed to interest rate risk. The Group has certain life insurance contracts which are sensitive to fluctuations in interest rates. Long-term P&C liabilities, the risk margin and deposits with cedents are also subject to discounting. The discounting impact from a change in interest rates on assets and liabilities will offset to some extent. For more information on sensitivities see Section C.1.2 – Sensitivity analysis.
Finally, the interest rate risk depends on the duration mismatch between assets and liabilities. As such, changes in interest rates can affect the shareholders’ equity and the solvency ratio of the Group.
C.3.1.2. CURRENCY RISK
Currency risk is the risk of loss arising due to adverse changes in or volatility of foreign exchange rates. This would impact the value of SCOR’s assets (e.g. through direct investments in assets denominated in various currencies) and liabilities (e.g. reinsurance treaties with liabilities denominated in specific currencies).
The following types of foreign exchange risk have been identified by SCOR:
Transaction risk
Fluctuations in exchange rates can have consequences on SCOR’s reported net income because of the conversion results of transactions expressed in foreign currencies, the settlement of balances denominated in foreign currencies and the lack of perfect matching between monetary assets and liabilities in foreign currencies. In this case, and to reduce the impact of imperfect matching, SCOR uses derivative financial instruments in order to hedge against currency fluctuations on sensitive currencies, particularly in times of greater volatility on the capital markets. Nevertheless, a perfect matching of monetary assets and liabilities can never be achieved and a potential profit or loss impact due to fluctuations in exchanges rates can arise.
Translation risk
SCOR publishes its consolidated financial statements in euros, but a significant part of its income and expenses, as well as of its assets and liabilities, are denominated in currencies other than the Euro. Consequently, fluctuations in the exchange rates used to convert these currencies into euros may have a significant impact on its reported net income and net equity from year to year.
SCOR’s main non-French legal entities are located in Ireland, Switzerland, North America, the UK and Asia. The shareholders’ equity of these entities is denominated mainly in Euros, US dollars, British pounds and Canadian dollars.
As a result, changes in the exchange rates used to convert foreign currencies into Euros, particularly the fluctuation of the US dollar against the Euro, have had and may have in the future, an adverse effect on the Group’s consolidated shareholders’ equity. SCOR does not fully hedge its exposure to this risk. From a solvency perspective, the depreciation of the dollar against the euro would lead to a decrease in eligible own funds, partially offset by a decrease in Solvency Capital Requirement, and hence result in an overall decrease in the solvency ratio.
SCOR has issued debt instruments in currencies other than the Euro, currently Swiss Francs, and to the extent that these are not used as a hedge against foreign currency investments, it may be similarly exposed to fluctuations in exchange rates. Most debts are fully hedged.
Some events, such as catastrophes, can have an impact on the matching of assets and liabilities in a currency, which can generate a temporary unmatched position which is not covered by currency contracts or hedges.
C.3.1.3. EQUITY RISKS
Equity prices are likely to be affected by risks which affect the market as a whole (uncertainty on economic conditions in general, such as anticipated changes in growth, inflation, interest rate fluctuations, sovereign risk, etc.) and/or by risks which influence a single asset or a small number of assets (specific or idiosyncratic risk). This may lead to a decrease in prices of the equity held by SCOR and may impact its unrealized gains and losses. A material or long-lasting decline in the prices of SCOR’s equity holdings may also result in the impairment of its equity portfolio which would affect its net income.
The Group’s exposure to the equity market results from direct purchases of stocks or investments in equity funds and in convex equity strategies such as convertible bonds.
C.3.1.4. REAL ESTATE RISK
Real estate risk, either for properties owned directly or through funds, is the risk arising from a variation in the real estate market valuation or a change in rental market conditions, the two being closely linked.
Rental income from the property portfolio is exposed to the variation in the indices on which the rents are indexed (for instance in France, the Construction Cost Index) as well as risks related to the rental market (changes in supply and demand, changes in vacancy rates, impact on market rental values or rent renewals) and lessee default. On the other hand, the indexation may provide an attractive hedge against inflation.
88 / Solvency and financial condition report – SCOR Group, SCOR SE, SGP&C SE and SGL SE / 2016
> Market risks#C RISK PROFILE
The value of property assets is exposed to the risk of regulatory obsolescence of properties (regulatory developments related to the accessibility of buildings for people with a disability, the reduction of energy consumption and the production of carbon dioxide, etc.) which would lead to losses of value in the event of a sale of the assets or to additional expenditure to restore the value of the property.
C.3.1.5. CREDIT SPREAD RISK
Credit spreads reflect the market’s assessment of the credit quality of a financial instrument (e.g. a bond) and are derived from the market value of the instrument. Credit spread risk is the risk that the credit spread increases, i.e. the market value deteriorates leading potentially to a loss on the financial instrument.
C.3.2. MANAGEMENT OF MARKET RISK
C.3.2.1. RISK MANAGEMENT OF ASSETS – AN OVERVIEW
The investment strategy is prudent with the majority of assets held in cash and fixed income securities. It is defined in line with the risk appetite and risk tolerance limits and considers the economic and market environment and the ALM process.
Investment Guidelines at Group and local levels outline the investment universe and limits, including concentration limits, in line with the objectives of the strategic plan. They are approved by the Group Board/local Board or Executive Management.
SCOR has outsourced the implementation of its investment strategy to its asset management company “SCOR Investment Partners SE” and to external asset managers. They are provided with the Investment Guidelines.
Exposure to major risks is monitored on a weekly basis and sensitivities measure the impact on the invested assets portfolio. Analyzing portfolio sensitivity to major risks is an important management tool which is used when making portfolio reallocation or hedging decisions.
In currency and geographic terms, SCOR is mainly exposed to the US and especially to US government or government assimilated bonds. The Group is particularly exposed to the financial services sector given the nature of its activities. For more information regarding the principles applied to invest the assets in a prudent manner see Section B.3.2.4 – Main control activities – Asset Management.
C.3.2.2. MANAGEMENT OF INTEREST RATE RISK
Interest rate risk is managed from a holistic point of view. The Group monitors the interest rate sensitivity in the Economic Balance Sheet (EBS). Stress tests and regular monitoring enable the exposures to be compared with risk tolerance limits set by the Group or by local entities.
The Group’s aim is to maintain an appropriate mix of fixed and variable rate instruments. It also manages the maturities of interest bearing financial assets.
Interest rate risk is managed within the Group primarily at two levels. At the level of each entity, the Group takes into account the regulatory and accounting constraints. At the Group level, SCOR reviews its consolidated investment portfolios in order to identify the overall level of risk and return. It uses analytical tools which guide both its strategic allocation and local distribution of assets. Sensitivity to changes in interest rates is analyzed on a weekly basis.
In addition, SCOR has entered into interest rates swaps to cover its exposure to financial debt with variable interest rates.
C.3.2.3. MANAGEMENT OF CURRENCY RISK
From an economic perspective, SCOR does not hedge the Group Available Capital. However, on an economic basis an appreciation (depreciation) of the Euro against other currencies to which the Group is exposed would result in a reduction (an increase) in both SCR and Eligible Own Funds, as the currency split of the Group Eligible Own Funds is broadly in line with the currency split of the Group SCR. These concurrent variations would be relatively aligned, leading to a relatively stable solvency ratio.
From an IFRS perspective, SCOR has a balance sheet hedging approach whereby there is an objective to match monetary assets and liabilities in each foreign currency so that the fluctuation in the exchange rate has no material impact on the reported net income. The policy is to closely monitor the net monetary currency positions and, where appropriate, execute either cash arbitrages or forward hedges.
892016 / Solvency and financial condition report – SCOR Group, SCOR SE, SGP&C SE and SGL SE /
RISK PROFILE Market risks < #C
C.3.2.4. MANAGEMENT OF EQUITY RISK
With regards to equity, the Group’s objective is to develop and manage a high-quality diversified portfolio.
The Group’s equity selection is predominantly based on a bottom-up fundamental analysis with the goal to develop a diversified portfolio of stocks, and convertible bonds directly or through mutual funds. Due to the inherent volatility of equities, this asset class (direct positions and mutual funds) is monitored on a daily basis, facilitating quick arbitrage or portfolio re-allocation decisions. On a Group level, the equity exposure is set and reviewed at least quarterly by the Group Investment Committee. The equity risk is also monitored by establishing maximum exposures per stock or mutual fund and is reviewed regularly (e.g. exposure to large-cap stocks will generally be greater than exposure to mid-cap stocks). The holding’s ratios on mutual funds are also reviewed regularly, based on the mutual fund’s portfolio.
C.3.2.5. MANAGEMENT OF REAL ESTATE RISK
SCOR has adopted an active strategy to select core buildings and focuses on high environmental quality.
C.3.2.6. MANAGEMENT OF CREDIT SPREAD RISK
SCOR applies strict limits in terms of asset concentration by asset class but also within a single asset class and actively diversifies its portfolio (by type of investment, by issuer, by country and by sector). These limits also enable it to limit counterparty default risk arising from investments.
C.3.3. MARKET RISKS AT SCOR SE LEVEL
SCOR SE’s market risks are the same as those of the Group, as described in Section C.3.1 – Market risks – risk overview. They arise primarily through its participation in other SCOR Group
entities, as well as through its own investment portfolio. It relies on the risk management mechanisms defined by the Group, as detailed in Section C.3.2 – Management of market risk.
C.3.4. MARKET RISKS AT SGP&C SE LEVEL
SGP&C SE is exposed to similar types of market risks as those of the Group, as described in Section C.3.1 – Market risks – risk overview, and is aligned with the strategy of the Group in order to manage its exposures, as detailed in Section C.3.2 – Management of market risk. The Section below describes specificities at SGP&C SE level.
Investments Guidelines at local level define the investment universe and limits, including concentration limits, in line with the agreed strategy. They are approved by the SGP&C SE Board or Executive Management.
SGP&C SE has delegated the management of its assets to SCOR SE through a Master Investment Management Agreement. SCOR SE has outsourced the implementation of its investment strategy to SCOR Investment Partners or external asset managers.
They are provided with the Investment Guidelines presented in Section B.3.2.4 – Main control activities – Asset Management.
CURRENCY RISK
SGP&C SE holds interests in legal entities which are located in Switzerland, Canada, the UK and Asia. The Net Asset Values of these entities are denominated mainly in Euros, US dollars, British pounds and Canadian dollars.
As a result, fluctuations in the exchange rates used to convert foreign currencies into Euros, particularly the fluctuation of the US dollar against the Euro, have had and may have in the future, an adverse effect on SGP&C SE’s reported net equity and eligible own funds from year to year.
C.3.5. MARKET RISKS AT SGL SE LEVEL
SLG SE is exposed to the same types of market risks as the Group, as described in Section C.3.1 – Market risks – risk overview, and is aligned with the strategy of the Group in order to manage its exposures, as detailed in Section C.3.2 – Management of market risk. The section below describes specificities at SGL SE level.
Investments Guidelines at local level define the investment universe and limits, including concentration limits, in line with the agreed strategy. They are approved by the SGL SE Board or Executive Management.
90 / Solvency and financial condition report – SCOR Group, SCOR SE, SGP&C SE and SGL SE / 2016
> Credit risk#C RISK PROFILE
SGL SE has delegated the management of its assets to SCOR SE through a Master Investment Management Agreement. SCOR SE has outsourced the implementation of its investment strategy to SCOR Investment Partners or external asset managers. They are provided with the Investment Guidelines presented in Section B.3.2.4 – Main control activities – asset management.
CURRENCY RISK
SGL SE holds interests in legal entities which are located in Ireland and the Americas. The Net Asset Value of these entities is denominated in US dollars.
As a result, fluctuations in the exchange rates used to convert foreign currencies into Euros, particularly the fluctuation of the US dollar against the Euro, have had and may have in the future, an adverse effect on SGL SE’s shareholders’ equity and eligible own funds from year to year.
C.4. CREDIT RISK
For quantitative information on credit risk, see Section C.1 – Introduction and Section E.1.2 – Solvency Capital Requirement. The presentation of SCOR’s assets giving rise to market and credit risks is provided in Section D.1 – Assets.
C.4.1. OVERVIEW OF CREDIT RISK
Credit risk is the risk of incurring a loss as a result of a change in the financial situation of a counterparty.
This includes counterparty default risk which is the risk that one party to a financial instrument or other asset will cause a financial loss to the other party by failing to discharge an obligation. Credit risk also includes migration risk, which is the risk of a potential loss in the value of assets due to changes in the credit quality of our counterparties.
SCOR is mainly exposed to the following credit risks or the accumulation of such risks in a single counterparty, in the same sector of activity or the same country: from bond and loan portfolios, liabilities retroceded also called share of retrocessionaires in contract liabilities, deposits with cedents, future cash flows from Life reinsurance treaties, cash deposits at banks and default of members of pools which SCOR is a member of. SCOR may also be exposed to credit risk through its Credit and Surety reinsurance portfolio.
Credit risk is actively monitored and managed. The processes for managing the respective credit risks and the methods used to measure these risks are further described below. For further information on risk concentrations, see Section C.7.2 – Significant risk concentrations at the level of the Group.
C.4.1.1. CREDIT RISK RELATED TO BOND AND LOAN PORTFOLIOS
A deterioration in the financial situation of an issuer (sovereign, public or private) or borrower can, for example, lead to its insolvency and to the partial or total loss of coupons and of the principal invested or lead to a loss in value.
This risk applies also to loan transactions in which the Group invests. The borrower’s solvency deterioration may lead to a partial or total loss of the coupons and the nominal invested by SCOR.
C.4.1.2. CREDIT RISK RELATED TO RETROCEDED LIABILITIES
SCOR transfers part of its risks to retrocessionaires via retrocession programs in exchange for the payment of premiums. The retrocessionaires then assume the losses related to claims covered by the retrocession contracts. If a retrocessionaire defaulted, or its financial situation deteriorated, SCOR could lose part or all of the coverage provided by its retrocessionaire whereas it would retain its liability towards the cedent for the payment of all claims covered under the reinsurance contract.
SCOR could also lose receivables from the defaulting retrocessionaire (receivables are due to a timing difference between statement accounts received and real payment due for positive balances of retrocessionaire accounts).
C.4.1.3. CREDIT RISK RELATED TO DEPOSITS WITH CEDENTS
SCOR may be exposed to credit risk in relation to amounts deposited with ceding companies in respect of reinsurance reserves which cover its liabilities. However, depositing these amounts does not a priori discharge the Group of its liability towards the cedent in cases where it is not able to recover all or part of these amounts in the event of a cedent default or a deterioration in the financial situation of that cedent. Hence, it is, at least in principle, possible that the Group may remain liable for paying claims due under the reinsurance treaty without being able to offset all or part of the corresponding deposits.
C.4.1.4. CREDIT RISK RELATED TO FUTURE CASH FLOWS OF LIFE REINSURANCE TREATIES
Under most of its Life reinsurance contracts, SCOR expects to receive premiums from its cedents over several years. These often exceed expected future payments for claims, commissions, etc., meaning that SCOR expects to receive future positive cash flows.
912016 / Solvency and financial condition report – SCOR Group, SCOR SE, SGP&C SE and SGL SE /
RISK PROFILE Credit risk < #C
Credit risk on future cash flows from Life reinsurance policies arises from two risk factors:
●● the payment of future cash flows expected under Life reinsurance contracts requires that the cedent is financially sound. Therefore, SCOR risks a reduction in the value of its portfolio of Life contracts in the event of a deterioration in the financial strength of the cedent;
●● a reduction in the value of future cash flows could arise from material unexpected lapsation of policies following a deterioration of the cedent’s credit rating or standing or an event which has a negative effect on the cedent’s reputation.
C.4.1.5. CREDIT RISK RELATED TO CASH DEPOSITS AT BANKS
SCOR is exposed to the risk of losing all or part of any cash deposited with a retail bank in the event such a bank is no longer
able, due to insolvency, to honor its commitments (e.g. following liquidation). The current main risk for the Group is the significant concentration of deposits in a small number of banks. This risk is a direct result of the selection of the most stable banks.
C.4.1.6. OTHER CREDIT RISKS
Default of pool members
For special highly technical risk categories such as Terrorism, Nuclear, Aviation or Pollution, SCOR chooses to participate in various market dedicated groups of insurers and reinsurers (“pools”) aimed at pooling the relevant risks among the members of each group and which offer best available expertise and risk sharing at market level. In the event of a total or partial default by one of the members of a group, it could be required to assume, in the event of joint liability of the members, all or part of the liabilities of the defaulting member.
C.4.2. MANAGEMENT OF CREDIT RISK
MANAGEMENT OF CREDIT RISK RELATED TO BOND AND LOAN PORTFOLIOS
SCOR mitigates the credit risk related to bond and loan portfolios by careful analysis and selection of issuers, and by a policy of geographic sector diversification. SCOR maintains its investment policy in high-quality assets and in countries with the lowest sovereign risk.
Exposure analyses are performed on a regular basis (sector, geographical area, counterparty and rating) and enables critical risks to be identified and evaluated in order to take appropriate actions.
MANAGEMENT OF CREDIT RISK RELATED TO RETROCEDED LIABILITIES
SCOR selects retrocessionaires carefully, taking into account their financial strength, and regularly monitors the Group’s exposure to retrocessionaires taking into account all relevant accounting balances (estimated and actual claims, premiums, reserves, deposits and pledges) and provides summary reports to the divisional and Group Risk Committees on a regular basis. SCOR typically requires that unrated retrocessionaires pledge assets or provide other forms of collateral (cash deposits or letters of credit) to the value of their maximum potential contract liability, even though the actual retrocessionaire liability to SCOR in the balance sheet is lower.
MANAGEMENT OF CREDIT RISK RELATED TO DEPOSITS WITH CEDENTS
SCOR favors deposit arrangements with the ability to offset liabilities against deposits with high legal certainty.
Deposits with cedents are monitored through a quarterly analysis of exposure and associated risks. Actions aiming at reducing or limiting the exposure (e.g. ad hoc legal opinions, introduction of offset clauses) can be implemented where needed.
MANAGEMENT OF CREDIT RISK RELATED TO FUTURE CASH FLOWS FROM LIFE REINSURANCE TREATIES
SCOR monitors the development of its cedents’ financial situation through regular contact, which enables SCOR to take appropriate action when deemed necessary. In addition, credit risk on future cash flows from Life reinsurance policies is mitigated by industry-wide protection solutions in several countries, such as “Protektor” in Germany.
92 / Solvency and financial condition report – SCOR Group, SCOR SE, SGP&C SE and SGL SE / 2016
> Credit risk#C RISK PROFILE
MANAGEMENT OF CREDIT RISK RELATED TO CASH DEPOSITS AT BANKS
SCOR selects bank counterparties according to their rating and credit quality. Concentration risk from cash deposits at banks is mitigated by setting counterparty exposure limits. SCOR takes into consideration the public assistance (e.g., loans, guarantees of deposits, nationalizations) which certain banks may benefit from during a financial crisis, as they are important in the economy of their respective country.
For further information on how risks related to invested assets are managed, see Section C.3 – Market risks.
MANAGEMENT OF OTHER CREDIT RISKS
In the event of joint liability of the members in pools in which SCOR participates, the risk of default of other pool members is carefully monitored by SCOR:
●● through its appointment as director and via the participation of its senior management in dedicated committees such as Audit and Risk Committees and Technical Committees, for the pools in which SCOR’s participation is the most significant; and
●● via the careful consideration of the financial situation of other pool members. This contributes to the application of sound and robust governance.
C.4.3. CREDIT RISKS AT SCOR SE LEVEL
SCOR SE’s credit risks are the same as those for the Group. They arise primarily through its interests in other SCOR Group entities, as well as through its direct exposures (P&C direct insurance, reinsurance business directly underwritten or own investment
portfolio). It relies on the organization defined within the Group, detailed in Sections C.4.1 – Credit risk and C.4.2 – Management of credit risk, in order to be able to assess and control its risks.
C.4.4. CREDIT RISK AT SGP&C SE LEVEL
C.4.4.1. CREDIT SPREAD RISK
SGP&C SE is exposed to the same type of credit spread risk as the Group. In line with the Group, SGP&C SE applies strict rules in terms of asset concentration by asset class but also within a single asset class and actively diversifies its portfolio (by type of investment, by issuer, by country and by sector). See Section C.3.1.5 – Credit spread risk for further details.
C.4.4.2. COUNTERPARTY DEFAULT RISKS
SGP&C SE is mainly exposed to the same type of counterparty default risk as the Group. The entity may also be exposed to credit risk through its Credit & Surety reinsurance portfolio. Credit risk is actively monitored and managed.
The processes for managing the respective risks and methods used to measure the risks are aligned with those of the Group. See Section C.4.2 – Management of credit risk.
C.4.5. CREDIT RISKS AT SGL SE LEVEL
C.4.5.1. CREDIT SPREAD RISK
SGL SE is exposed to the same type of credit spread risk as the Group. In line with the Group, SGL SE applies strict rules in terms of asset concentration by asset class but also within a single asset class and actively diversifies its portfolio (by type of investment, by issuer, by country and by sector). See Section C.3.1.5 – Credit spread risk for further details.
C.4.5.2. COUNTERPARTY DEFAULT RISKS
SGL SE is exposed to the same type of counterparty default risk as the Group.
The processes for managing the respective risks and methods used to measure the risks are aligned with those of the Group. See Section C.4.2 – Management of credit risk.
932016 / Solvency and financial condition report – SCOR Group, SCOR SE, SGP&C SE and SGL SE /
RISK PROFILE Liquidity risks < #C
C.5. LIQUIDITY RISKS
C.5.1. OVERVIEW OF LIQUIDITY RISKS
Liquidity risk arises when available liquidity is not sufficient to meet liquidity needs. This liquidity shortfall can result either from:
●● a deviation from planned liquidity needs over either the short term, or the medium/long-term;
●● a deviation from estimated liquidity capacities, e.g. due to adverse business conditions.
C.5.1.1. LIQUIDITY NEEDS
SCOR needs liquidity to pay claims, operating expenses, interest payments and redemptions on its debts and declared dividends on its share capital. Without sufficient liquidity, the Group may be forced to curtail its operations, and business will suffer. In the case of catastrophe claims, in particular, it may need to settle amounts which exceed the amount of available liquidity in a reduced timeframe. SCOR’s liquidity needs to cover catastrophe exposures are calibrated using the Group’s gross (before retrocession) Nat Cat annual loss distributions, on top of other regular liquidity needs as listed above.
Liquidity needs may also arise from increased collateral requirements. Some facilities SCOR uses to grant letters of credit to cedents require 100% collateral in case of non-compliance with financial covenants or in case of a decrease in the Group’s financial strength rating, which would result in a deterioration of the Group’s liquidity level. Collateral arrangements are also used by SCOR when the jurisdictions in which SCOR operates demand collateral or when clients demand collateral for risk mitigation purposes. This is especially the case in the US for business falling under the NAIC Model Regulation XXX or Valuation of Life Insurance Policies Model Regulation, commonly referred to as Regulation XXX (or Triple X). Letters of Credit carry the risk of a duration mismatch, i.e. that short-term Letters of Credit are covering long term business and might have to be renewed at less favorable conditions, creating additional cost.
C.5.1.2. SOURCES OF LIQUIDITY
The principal internal sources of the Group’s liquidity are reinsurance premiums, cash flows from its investment portfolio and other assets, consisting mainly of cash or assets that are readily convertible into cash.
External sources of liquidity in normal markets include a variety of short and long-term instruments, such as repurchase agreements, commercial paper, medium- and long-term debt, junior subordinated debt securities, capital securities and raising additional funds in the equity markets.
SCOR’s ability to access external sources of liquidity may be subject to adverse capital and credit market conditions.
Liquidity risks are increased when capital and credit markets experience extreme volatility or disruption, as SCOR may need to sell a significant portion of its assets quickly and on unfavorable terms, particularly if current internal resources do not satisfy its liquidity needs.
This risk may be increased due to the characteristics of certain assets held by SCOR, whose liquidity may be limited due to contractual or regulatory constraints (e.g. investments in corporate, real estate or infrastructure loans).
The availability of additional financing will depend on a variety of factors. These notably include market conditions, the general availability of credit, the volume of trading activities, the overall availability of credit to the financial services industry, SCOR’s credit ratings and credit capacity, as well as the possibility that customers or lenders could develop a negative perception of SCOR’s long- or short-term financial prospects if the Group incurs large investment losses or if the level of SCOR’s business activity decreases due to a market downturn. Similarly, access to funds may be impaired if regulatory authorities or rating agencies take negative action that could penalize SCOR. The liquidity of several asset classes owned by SCOR may also be negatively impacted by changes to regulations or by non-conventional monetary policies. If so, these factors could prevent SCOR from successfully obtaining additional financing on favorable terms.
94 / Solvency and financial condition report – SCOR Group, SCOR SE, SGP&C SE and SGL SE / 2016
> Liquidity risks#C RISK PROFILE
C.5.2. MANAGEMENT OF LIQUIDITY RISKS
SCOR’s liquidity position is closely monitored from two points of view: timing and transferability.
TIMING
SCOR assesses liquidity risks arising from both short-term and long-term liquidity needs. SCOR manages these risks via different mechanisms which consider:
●● actions to be taken by the insurance or reinsurance business areas to take into account both short-term and long-term liquidity risk; and
●● the appropriateness of the composition of the assets in terms of their nature, duration and liquidity in order to meet the obligations as they fall due.
Short-term liquidity, or cash management, includes the day-to-day cash requirements under normal business conditions.
Liquidity considerations over the long-term are assessed in a way which takes into consideration the possibility of various unexpected and potentially adverse business conditions where
assets may not be sold for current market values. SCOR estimates the level of its liquid free assets (i.e. non-pledged assets) which could be sold within a reasonable timeframe.
TRANSFERABILITY
In addition, SCOR monitors the level of transferability of liquid free assets between entities, depending on local and regulatory constraints.
The Group has also been granted credit facilities from several banks to support the reinsurance activities of various subsidiaries. The Group regularly adapts and renews these facilities to support its business needs.
Additional information on the timing of obligations and liquidity risk is included in the DDR – Section 3.6.3 – Maturity profiles. Quantitative information on liquid assets of SCOR Group is provided in the DDR – Section 4.6 – Notes to the consolidated financial statements, Note 7 – Insurance business investments.
C.5.3. EXPECTED PROFITS INCLUDED IN FUTURE PREMIUMS
SCOR Group’s expected profit included in future premiums (EPIFP) as at year-end 2016 amounts to EUR 4,189 million. EPIFP results are produced by SCOR for the purposes of QRT reporting. They are
not used for internal processes regarding capital management, the details of which are provided in chapter E – Capital Management.
C.5.4. LIQUIDITY RISKS AT SCOR SE LEVEL
C.5.4.1. LIQUIDITY RISKS AND RISK MANAGEMENT MECHANISMS
SCOR SE’s liquidity risks are the same as those for the Group, as described in Section C.5.1 – Overview of liquidity risks. It relies on the organization defined within the Group, as described in Section C.5.2 – Management of liquidity risks, in order to be able to assess and control its risks.
C.5.4.2. EXPECTED PROFITS INCLUDED IN FUTURE PREMIUMS
SCOR SE’s EPIFP as at year-end 2016 amounts to EUR 48 million. EPIFP results are produced by SCOR for the purposes of QRT reporting. They are not used for internal processes regarding capital management, the details of which are provided in chapter E – Capital Management.
C.5.5. LIQUIDITY RISKS AT SGP&C SE LEVEL
C.5.5.1. LIQUIDITY RISKS AND RISK MANAGEMENT MECHANISMS
SGP&C SE’s liquidity risks are aligned with those of the Group, as described in Section C.5.1 – Overview of liquidity risks. It relies on the organization defined within the Group, as described in Section C.5.2 – Management of liquidity risks.
C.5.5.2. EXPECTED PROFITS INCLUDED IN FUTURE PREMIUMS
SGP&C SE’s EPIFP as at year-end 2016 amounts to EUR 54 million. EPIFP results are produced by SCOR for the purposes of QRT reporting. They are not used for internal processes regarding capital management, the details of which are provided in chapter E – Capital Management.
952016 / Solvency and financial condition report – SCOR Group, SCOR SE, SGP&C SE and SGL SE /
RISK PROFILE Operational risks < #C
C.5.6. LIQUIDITY RISKS AT SGL SE LEVEL
C.5.6.1. LIQUIDITY RISKS AND RISK MANAGEMENT MECHANISMS
SGL SE’s liquidity risks are aligned with those of the Group, as described in Section C.5.1 – Overview of liquidity risks. It relies on the organization defined within the Group, as described in Section C.5.2 – Management of liquidity risks.
C.5.6.2. EXPECTED PROFITS INCLUDED IN FUTURE PREMIUMS
SGL SE’s EPIFP as at year-end 2016 amounts to EUR 732 million. EPIFP results are produced by SCOR for the purposes of QRT reporting. They are not used for internal processes regarding capital management, the details of which are provided in chapter E – Capital Management.
C.6. OPERATIONAL RISKS
C.6.1. OVERVIEW OF OPERATIONAL RISKS
For quantitative information on operational risk, see Section C.1 – Introduction and Chapter E – Section 1.2 – Solvency Capital Requirement.
Operational risks are inherent to all businesses, including SCOR’s. Operational risks may be split into four broad categories further described below: risks related to staff, systems or facilities, processes or external events.
C.6.1.1. RISKS RELATED TO STAFF
Risks related to staff can arise as follows:
●● the failure to attract or retain key personnel or the loss of crucial information/skills concentrated in a single person, or of a whole team;
●● incidents due to mistakes or non-compliance with instructions, guidelines or policies;
●● internal staff mandated by SCOR having authorized access to SCOR’s offices or systems, or taking advantage of SCOR’s assets for personal gain, e.g. through the misappropriation of assets, tax evasion, intentional mismarking of positions or bribery;
●● intentional damage to assets (including data) required by SCOR to perform its operations by internal or external staff could lead to significant additional remediation costs (to rebuild databases or systems).
C.6.1.2. RISKS RELATED TO SYSTEMS OR FACILITIES
Risks related to systems can arise as follows:
●● a malfunction or a major breakdown in SCOR’s IT systems, outages, disruptions due to viruses, attacks by hackers and thefts or data breaches. This can occur within SCOR’s own environment or to a third party providing services or data to SCOR;
●● interruption of any of SCOR’s IT systems leading to loss of data, delays in service or in a loss of efficiency of teams, which could lead to remediation costs, loss of contracts or damage to the Group’s reputation. In addition, these incidents could increase other operational risks such as external fraud or human error (e.g. delay in the recognition of adverse business development). The interruption of these systems could damage commercial activities including underwriting, pricing, reserving, premium and claims payment, commercial support, and asset management;
●● in addition, the facilities in which SCOR operates might be impacted by natural or man-made perils. The offices might need to be closed for a period of time potentially resulting in a loss of productivity and business opportunity, as well as remediation costs.
C.6.1.3. RISKS RELATED TO PROCESSES
SCOR’s risk management policies, procedures and controls may not be appropriate or sufficient. In particular, any additional workload to the planned activities could reduce the efficiency of some processes and controls. For example, the creation of a new entity or development of a new line of business may lead to an accumulation of operational risks.
Since SCOR remains responsible for commitments or services contracted, including for outsourced activities, inappropriate client relationship management or an inadequate level of service and/or product quality provided by SCOR to its clients or a breach of contract may lead to a loss of profitable business relationships.
In addition, SCOR may be involved in legal and arbitration proceedings due to non-protective terms of a contract, denounced either by third parties or internally which could lead to an unfavorable outcome. There are no governmental, judicial or arbitration proceedings, including any proceedings SCOR would be aware of, pending or which SCOR could be threatened with, likely to have or having a significant impact on SCOR’s financial situation or profitability over the last 12 months.
96 / Solvency and financial condition report – SCOR Group, SCOR SE, SGP&C SE and SGL SE / 2016
> Operational risks#C RISK PROFILE
Some of SCOR’s and SCOR’s subsidiaries’ processes are partially or fully outsourced. The failure of outsourced processes could lead to direct losses and other operational incidents.
For further details on the main current regulatory developments which may have an impact on SCOR, please see Section C.7.1.3 – Risks related to legal and regulatory developments.
C.6.1.4. RISKS RELATED TO EXTERNAL EVENTS
SCOR may be exposed to an unfavorable business environment such as evolving or additional regulatory constraints potentially hindering its business model.
Legal and regulatory risk
As an international group, SCOR must comply with national and international laws, regulations and accounting standards. This includes all applicable economic sanctions, anti-bribery as well as anti-terrorism laws and regulations applicable to its operations, such as the economic trade sanctions laws and regulations administered by the United States Department of the Treasury’s Office of Foreign Assets Control (OFAC) as well as certain laws administered by the United States Department of State, the Foreign Corrupt Practices Act (FCPA) and other anti-bribery laws such as the UK Bribery Act that generally bar corrupt payments or unreasonable gifts to foreign governments or officials. The level of legal, regulatory, tax or accounting requirements depends on several factors including the type of business (e.g. primary insurance or reinsurance business), the location and the legal structure of the entity. The large number of regulatory environments, as well as changes in regulations increase the complexity of the related processes. Any violation of laws, regulations or accounting requirements could expose SCOR to fines, class actions with compensation payments, accounts restatements or business restrictions.
Other risks related to external events
SCOR is also exposed to external fraud which is characterized by the fraudulent misappropriation of certain of SCOR’s assets by third parties. External frauds may be perpetrated by various means including cyber-attacks and usually target cash, or data. Should they succeed in bypassing the controls, or protection measures in place, this could generate a direct loss for the Group.
SCOR is exposed to cyber-attacks which can be very diverse in their sophistication and execution. The main targets are system functions, data and cash management. Immediate repercussions include:
●● systems could be slowed down, corrupted or stopped, potentially resulting in loss of productivity, corrupted data and remediation costs;
●● data could be stolen, deleted or corrupted, or made public in contradiction with SCOR’s regulatory or contractual obligations.
Any of these could generate a reputational risk, give rise to a breach of SCOR’s legal responsibility, and may result in regulatory sanctions depending on the level of sensitivity of the data or system that is successfully attacked. The cyber attack could also assist external fraudsters resulting in a financial loss.
C.6.1.5. INSURANCE OF SPECIFIC OPERATIONAL RISKS
Some of the above operational risks are transferred in whole or in part to direct insurers(1) as follows:
●● the properties and other assets of SCOR and its subsidiaries are covered locally through property and fire damage as well as IT risk policies;
●● liability risks are mostly covered at Group level and include civil liability risks related to the operation of the company caused by employees and real estate, professional liability risks, civil liability risks of directors and officers, and cyber risks.
Nevertheless, these insurance covers could prove to be insufficient. In case of a loss, the insurance companies could also possibly contest their liability towards SCOR.
(1) Generally speaking, the insurance covers mentioned in this section illustrate the Group’s policy of transferring some of its own risks. However, these insurance covers remain subject to the provisions of corresponding contracts, specifically those regarding possible sub-limits of cover, particular deductibles and the geographic scope of cover and/or particular exclusions.
972016 / Solvency and financial condition report – SCOR Group, SCOR SE, SGP&C SE and SGL SE /
RISK PROFILE Operational risks < #C
C.6.2. MANAGEMENT OF OPERATIONAL RISKS
The two main principles driving the operational risk management approach are:
●● exhaustiveness: ensure that a complete and exhaustive identification of all risks within the Group is carried out to the extent possible;
●● proportionality: once operational risks are identified, management uses appropriate and proportionate responses, resources and procedures, focusing on key risks.
The process owners are responsible for managing operational risks within the processes. To meet high quality standards, the Group relies on a highly qualified staff to manage processes and the risks within these processes.
In order to support the staff, SCOR has developed Internal Control System (ICS) standards. According to the ICS standards, process owners should be in a position to identify the critical operational risks within the processes assigned to their area of responsibility. The process owners design, implement and operate appropriate key controls and maintain the net risk exposure at or below an acceptable level of possible damage.
At Group level, experienced staff members collect relevant information and analyses on operational risks, on a qualitative
and quantitative basis. When relevant, they develop key indicators, with support from the Group Risk Management Department. The Group has also implemented regular risk reporting mechanisms in order to provide for an overview of risks across the Group, as well as mitigate and monitor risks identified.
At legal entity level, depending on local requirements, specific operational risk management processes are implemented, where relevant.
In addition, through its assignments, Group Internal Audit (GIA) contributes to the oversight of operational risk management.
Outsourcing some activities or processes may improve or streamline some aspects of a process, but SCOR is still expected to deliver the same level of service. Principles to properly manage potential operational risks stemming from outsourcing of certain functions are set out in dedicated policies and guidelines.
On risks which may develop rapidly, such as external fraud, SCOR frequently adapts its risk management, for example by organizing specific training programs and sending regular warnings and detailed instructions to its employees.
C.6.3. OPERATIONAL RISKS AT SCOR SE LEVEL
SCOR SE’s operational risks are the same as those for the Group, as described in Section C.6.1 – Overview of operational risks. It relies on the organization defined within the Group, as detailed in Section C.6.2 – Management of operational risks.
C.6.4. OPERATIONAL RISKS AT SGP&C SE LEVEL
SGP&C SE’s operational risks are aligned with those of the Group, as described in Section C.6.1 – Overview of operational risks. It relies on the organization defined within the Group, as detailed in Section C.6.2 – Management of operational risks.
C.6.5. OPERATIONAL RISKS AT SGL SE LEVEL
SGL SE’s operational risks are aligned with those of the Group, as described in Section C.6.1 – Overview of operational risks. It relies on the organization defined within the Group, as detailed in Section C.6.2 – Management of operational risks.
98 / Solvency and financial condition report – SCOR Group, SCOR SE, SGP&C SE and SGL SE / 2016
> Other material risks#C RISK PROFILE
C.7. OTHER MATERIAL RISKS
C.7.1. STRATEGIC RISK
Strategic risk can arise either from the strategy itself (such as the accumulation of risks or development in lines of business or less known markets), from external risks (such as an adverse economic environment), or from internal risks (such as certain causes of operational risk). Therefore, many of the risks discussed throughout chapter C – Risk profile, including emerging risks, could also impact the success of the strategy.
The main strategic risks to which SCOR is exposed are described below.
C.7.1.1. RISKS RELATED TO THE MACROECONOMIC ENVIRONMENT AFFECTING SCOR’S STRATEGY
The main risks are the uncertain economic recovery that may affect SCOR’s growth in both emerging and advanced economies, and the poor returns on financial markets exacerbating the adverse competitive environment.
Difficult conditions in the global capital markets and difficult economic conditions may have a material adverse effect on SCOR’s business and operating results
The Group’s operating result could be materially affected by the economic and financial situation in France and other countries in continental Europe, the United Kingdom, the United States of America and elsewhere around the world, particularly in Latin America and Asia-Pacific. Any continued deterioration in macroeconomic trends could have an adverse effect on SCOR’s business and operating result, even more so as the global economy is still in convalescence since the 2008 financial crisis and remains vulnerable to negative economic, financial and geo-political shocks fueled by on-going tensions or open conflicts in several global regions. In particular, the growing debt of governments in advanced economies and of private companies in emerging countries could generate significant adjustments if the main central banks were to raise interest rates. As a result, financial markets could enter a period of high volatility, which could lead to adverse consequences such as waves of company defaults, or a major liquidity crisis. The financial situation in many Eurozone countries remains unstable and some states’ financial ratings have been downgraded. SCOR cannot predict whether any of the other government securities that it holds in its investment portfolio will be adversely affected in the future by ratings downgrades, the continuing debt crisis or other developments.
The global economy may suffer from a sharp shift in American monetary policy, which could spur a rise in interest rates along the entire yield curve. Financing conditions could thus deteriorate across sectors and economies. In particular emerging and developing economies may suffer from capital outflows in the wake of any US monetary normalization.
This difficult environment and the continuing market upheavals may have an adverse effect on SCOR, from both an investment and reinsurance business viewpoint. Furthermore, the economic uncertainty might be compounded by recent political changes such as the result of the Brexit referendum, and the outcome of the elections in the USA, Germany and France.
Impact on SCOR’s Investment activities
SCOR has a large investment portfolio. In the event of extreme prolonged market events, such as global credit crises, SCOR could incur significant losses in its investment portfolio.
Even in the absence of a market downturn, SCOR remains exposed to a substantial risk of losses due to market volatility.
Impact on SCOR’s reinsurance business
SCOR is also dependent on customer behavior and premium growth. The Group’s premiums are likely to decline in such circumstances and its profit margins could erode. In an economic downturn characterized by higher unemployment, lower household income, lower corporate earnings, lower business investment and lower consumer spending, the demand for SCOR’s and its clients’ products could be adversely affected. Factors such as government and consumer spending, corporate investment, the volatility and strength of both debt and equity markets, and inflation, all affect the business and economic environment and ultimately, the size and profitability of SCOR’s business.
In addition, the Group may experience an elevated incidence of claims or be impacted by a decrease in demand for reinsurance and increased surrenders of policies from the cedents (see paragraph on lapse risk in Section C.2.2.4 – Policyholder behavior risk) that could affect the current and future profitability of its business. Although written premiums have seen steady growth in prior years, a prolonged economic crisis could result in lower written premiums in the future.
992016 / Solvency and financial condition report – SCOR Group, SCOR SE, SGP&C SE and SGL SE /
RISK PROFILE Other material risks < #C
SCOR is exposed to significant and protracted deviations of the general price level from its trend
The Group’s liabilities are exposed to a significant increase in the rate of general inflation (prices and salaries) which would require an increase in the value of reserves, in particular in respect of P&C long-tail business, general liability (medical among others) and motor bodily injury claims. In addition, SCOR is exposed to claims inflation over and above general inflation and in particular to the inflation of court awards in respect of general liability and bodily injury claims. For further information on P&C long-tail reserve deterioration, see Section C.2.1.1 – P&C long-tail reserve deterioration.
SCOR’s assets are also exposed to increased inflation or inflationary expectations, accompanied by a rise in the yield curve with a subsequent reduction in the market value of its fixed income portfolios. Increased inflation could also have a negative impact on the solvency of bond issuers; a widening of credit spreads would lead to a loss of value for the issuers’ bonds. Finally, depending on the macroeconomic environment, an increase in inflation could also reduce the value of SCOR’s equity portfolio. Any negative fluctuations in equity values would lead to a similar decrease in shareholders’ equity.
Conversely, the Group’s liabilities could be exposed to a protracted period of deflation which could exert a negative pressure on reinsurance prices and decrease the value of new premiums.
A protracted period of deflation would also induce a decrease in interest rates all along the yield curve and may therefore negatively impact the returns on SCOR’s fixed income assets. In addition, the value of SCOR’s equity portfolio might decline as deflation could reduce the future cash flows of the companies whose stocks are part of the Group’s portfolio.
In conclusion, both high inflation and a protracted episode of deflation could have a material adverse effect on SCOR.
Management of risks related to the macroeconomic environment
These risks are monitored via a robust strategic planning approach and regular risk reporting mechanisms throughout the Group, including complementary risk analyses on ad hoc topics, where deemed necessary. Potential impacts on SCOR’s risk profile are managed through a variety of dedicated and transversal risk management mechanisms.
C.7.2. RISKS RELATED TO THE COMPETITIVE ENVIRONMENT
SCOR operates in a highly competitive sector and would be adversely affected by losing competitive advantage or if adverse events had an impact on the reinsurance industry
Reinsurance is a highly competitive sector. As is the case for all other reinsurers, SCOR’s position in the reinsurance market is based on several factors, such as its financial strength as perceived by the rating agencies, its underwriting expertise, reputation and experience in the lines written, the countries in which it operates, the premiums charged, as well as the quality of the proposed reinsurance products and services offered, particularly in terms of claims payment. The Group competes for business in the European, American, Asian and other international markets with numerous international and domestic reinsurance companies, some of which have a larger market share than SCOR, greater financial resources, state backing, and, in certain cases, higher ratings from the rating agencies.
Therefore, SCOR remains exposed to the risk of losing its competitive advantage. In particular, when available reinsurance capacity, via traditional reinsurers or capital markets, is greater than the demand from ceding companies. Its competitors, in particular (re)insurers benefiting from higher ratings than SCOR’s or other competitors in alternative capital markets, may be better positioned to enter new contracts and gain market shares at SCOR’s expense.
Furthermore, the Group’s reputation is sensitive to reinsurance sector information. It can be affected by adverse events concerning competitors but also by its own business activity, such as financial difficulties following a major market event. Loss of reputation due to internal risks would also weaken SCOR’s competitive position.
100 / Solvency and financial condition report – SCOR Group, SCOR SE, SGP&C SE and SGL SE / 2016
> Other material risks#C RISK PROFILE
Consolidation in the insurance and reinsurance industries could adversely impact SCOR
After a very active 2015 in terms of M&A, the first half of 2016 was very calm. However, in September 2016 M&A activity in the insurance and reinsurance sector picked up again.
Within the insurance industry, these consolidated entities may use their enhanced market power and broader capital base to negotiate price reductions for SCOR’s products and services, and reduce their use of reinsurance, and as such, the Group may experience price declines and possibly write less business.
Within the reinsurance industry, such external growth activity could potentially enhance these players’ competitive position, e.g. in terms of being able to offer greater capacity or broader product offerings, which could permit them to gain market shares at SCOR’s expense.
Management of risks related to the competitive environment
As for risks related to the macroeconomic environment, risks related to the competitive environment are monitored via a robust strategic planning approach and regular risk reporting mechanisms throughout the Group to its main governance bodies, including complementary risk analyses on ad hoc topics, where deemed necessary. For further information on risk reporting mechanisms and SCOR’s main governance bodies, see Section B.3 – Risk management system including the ORSA and Section B.1.3 – Governance structure at Group and legal entity level.
C.7.2.1. RISK RELATED TO LEGAL AND REGULATORY DEVELOPMENTS
Main risks related to legal and regulatory developments
SCOR is subject to comprehensive and detailed regulations and to the supervision of insurance and reinsurance regulatory authorities in all of the countries in which it operates. Some of these authorities, especially in non-European countries, are considering or may in the future consider enhanced or new regulatory requirements intended to prevent future crises or otherwise assure the stability of institutions under their supervision and submit them to reinforced measures of control and higher capital requirements. These changes could affect the calculation of the local solvency position and have a material adverse impact on the Group. Insurance and reinsurance supervisory authorities have broad administrative powers over many aspects of the reinsurance industry and SCOR cannot predict the timing or form of any future regulatory initiatives.
The Solvency II regime came into force on January 1, 2016 in the European Union. It was transposed into French law in 2015. Actual implementation by supervisory and regulatory authorities could vary between these jurisdictions, which could place SCOR at a competitive disadvantage with regard to other European financial services groups.
Furthermore, the supervisory and regulatory authorities could decide that the protection of policyholders and financial stability prevails over shareholders or creditors of a reinsurer when designing new regulations especially in developing countries. These new regulations may then increase solvency margin obligations, thereby restricting SCOR’s underwriting capacity.
In November 2016, the Financial Stability Board (“FSB”) published the updated list of systemic direct insurers (“G-SIIs”) based on a recommendation by the International Association of Insurance Supervisors (IAIS). As the IAIS is continuing to work on its methodology for assessing systemic (re)insurers, there is a risk that SCOR will receive such a designation in subsequent updates. The impact of receiving such a designation is a risk of a higher capital requirement, a Higher Loss Absorbency (HLA), and greater regulatory burdens such as the establishment of resolution plans. On the other hand, there is a possibility that G-SIIs could benefit from a market perception of an implicit state guarantee. Were SCOR’s competitors to receive such a designation and SCOR were not, there could be a risk of SCOR’s market perception weakening relative to these peers.
In the meantime, the IAIS has been developing a common framework for internationally active insurance groups (IAIGs), the ComFrame. It is the IAIS’s intention to develop Insurance Capital Standards (ICSs) to be applied by all IAIGs with implementation in 2020. This development could jeopardize the extent of recognition of diversification effects or the use of internal models, and could have an impact on capital management. Moreover, these standards involve risks in terms of competition on a level playing field if they are not implemented simultaneously and consistently across jurisdictions.
Similarly, changes in tax legislation and regulations, or in their interpretation may have a negative impact on SCOR’s results, for instance due to the inability to recognize deferred tax assets in the future.
Other legal and regulatory developments
The reinsurance sector has been exposed in the past, and may be exposed in the future, to involvement in legal proceedings, regulatory inquiries and actions by various administrative and regulatory authorities, as well as to regulation concerning certain practices used in the insurance sector.
1012016 / Solvency and financial condition report – SCOR Group, SCOR SE, SGP&C SE and SGL SE /
RISK PROFILE Other material risks < #C
More generally, adverse changes in laws or regulations or an adverse outcome of any legal proceeding could have an adverse impact on SCOR. For further information on risks related to current legislation and regulations and their impact on SCOR’s operations, see Section C.6.1.4 – Risks related to external events.
Management of risks related to legal and regulatory developments
SCOR monitors the legal and regulatory developments which could have an impact on the Group and its entities, ensuring in particular that it takes an active position vis-à-vis the requirements to which it is exposed or could be exposed in the different jurisdictions where it operates and that it prepares in due time for their implementation.
In particular, developments in prudential regulations (such as Solvency II, ComFrame or systemic risk regulations) are monitored at Group level by the Prudential and Regulatory Affairs department. Regulations relating to corporate law and business compliance are monitored by the General Secretariat and, within it, the Legal department.
C.7.2.2. DOWNGRADE RISK
Overview of SCOR’s downgrade risk
Credit ratings are very important to all reinsurance companies, including SCOR, as ceding companies wish to reinsure their risks with companies having a satisfactory financial position. For further details on the current rating of the Group, see SCOR 2016 Registration Document, Section 1.2.4 – Ratings information. Due to parental support, the rating of SCOR’s main subsidiaries, including SCOR SE, SGP&C SE, SGL SE, SGLRI and SUK is aligned with that of the Group. Therefore, the downgrade risk of SCOR’s main subsidiaries is equivalent to the downgrade risk of SCOR Group. The impact of a downgrade on SCOR’s subsidiaries is also quite similar.
Impact on SCOR’s reinsurance business
Some of SCOR’s cedents’ credit models or reinsurance guidelines face regulatory capital requirements or depend on their reinsurers’ credit rating. If SCOR’s rating deteriorates, cedents could be forced to increase their capital requirements in respect of their counterparty risk on SCOR. This could lead to a loss of competitive advantage for SCOR.
The Group’s Life reinsurance activities and the Business Solutions (large corporate accounts underwritten essentially on a facultative basis and occasionally as direct insurance) business area in P&C reinsurance are particularly sensitive to the way its existing and prospective clients perceive its financial strength, notably through its ratings.
Many of SCOR’s reinsurance treaties, notably in the US and in Asia, and also increasingly in Europe, contain clauses concerning the financial strength of the Company and/or its operating subsidiaries, and provide for the possibility of early termination for its cedents if the rating of the Company and/or its subsidiaries is downgraded. Early termination may also occur when the net financial position of the Company falls below a certain threshold, or if it carries out a reduction in share capital.
Impact on the Group’s letters of credit
Many of the Group’s reinsurance treaties contain a requirement to put in place letters of credit (“LOC”) as a general requirement or when triggered by a downgrade of SCOR or one of its subsidiaries. In certain circumstances, the cedent has the right to draw down on a LOC issued by a bank in SCOR’s name.
Some LOCs issued by banks providing such facilities may be collateralized with securities. The value of the collateral can be different from the amount of the LOC. For some facilities, initial collateral requirements may be increased following a downgrade of SCOR’s rating, impacting the Group’s liquidity level. In the case of a LOC being drawn by a cedent, the bank has the right to request a cash payment from this collateral, up to the amount drawn by the cedent.
In the case of a large number of LOCs being drawn simultaneously, SCOR could encounter difficulties in providing the total amount of required cash or fungible assets, i.e. exposing itself to a liquidity risk.
Moreover, some of SCOR’s facilities contain conditions about its financial situation which, if not met, constitute a default and might result in the suspension of the use of current credit facilities and/or a prohibition on obtaining new lines of credit or result in the need to negotiate new LOC facilities under adverse conditions.
For more details on liquidity risks, see Section C.5 – Liquidity risks.
Impact on Capital resources
A significant multiple-notch downgrade of the Group could negatively impact the ability of entities in the Group to generate new business or retain in-force business (potentially leading to a reduction in Eligible Own Funds due to a reduction in expected future cash flows under existing reinsurance treaties (e.g. Life business)).
102 / Solvency and financial condition report – SCOR Group, SCOR SE, SGP&C SE and SGL SE / 2016
> Other material risks#C RISK PROFILE
Management of downgrade risk
SCOR’s current ratings are at the highest levels within the reinsurance sector after Standard & Poor’s and Fitch upgraded the Group’s ratings to “AA-” from “A+” in 2015, followed by a Moody’s upgrade to Aa3/Stable and an AM Best confirmation of positive outlook in September 2016. Therefore, a downgrade by one notch would not endanger its future business development, its liquidity position nor its capacity to raise funds. For further information on SCOR’s current rating, see SCOR 2016 Registration Document – Section 1.2.4 – Ratings information.
SCOR monitors its ratings assigned by the top four rating agencies via a dedicated team placed under the supervision of the Group CFO.
This team analyses rating agencies’ methodologies, reports published on the reinsurance market, on SCOR and on its main competitors, in order to anticipate any potential rating actions. It also monitors specific qualitative and quantitative Key Performance Indicators developed by the four main rating agencies, and performs analyses of selected deterministic scenarios. It also monitors the capital adequacy level as measured by the capital models developed by rating agencies.
C.7.2.3. OTHER STRATEGIC RISKS
SCOR may be exposed to other less significant strategic risks described below.
Risks related to capital
Overview of risks related to capital
Capital may not be completely fungible between different regulated legal entities, which may have negative consequences
SCOR’s regulated legal entities must satisfy local regulatory capital requirements. There could potentially be some local regulatory constraints, which in certain circumstances could affect SCOR’s ability to transfer capital from one legal entity to another, and in particular from one subsidiary or branch to another, or to the parent legal entity. This may have negative consequences for the legal entity concerned and could have a material adverse impact on SCOR.
In addition, ongoing regulatory developments and discussions on global standards may impact SCOR in the future.
Adverse capital and credit market conditions may significantly affect SCOR’s ability to access capital and/or liquidity or increase the cost of capital
Disruptions, uncertainty or volatility in the capital and credit markets may also limit the Group’s access to capital required to operate its business, most significantly its insurance operations. Such market conditions may limit its ability to:
●● replace, in a timely manner, maturing debts;
●● access the capital needed to grow its business;
●● satisfy statutory capital requirements and maintain a solvency ratio in line with its risk appetite framework.
As such, SCOR may be forced to delay raising capital, issue shorter term securities than it prefers, or bear an unattractive cost of capital which could decrease its profitability and significantly reduce its financial flexibility.
Disruptions of financial markets, and more particularly credit market conditions, could also affect SCOR’s ability to access liquidity.
For further information on Risks related to the macroeconomic environment that could impact SCOR, see Section C.7.1.1.
Management of risks related to capital
Risks related to capital are managed via specific principles and processes throughout the Group. SCOR ensures maximum capital fungibility within the Group through:
●● a reduced number of subsidiaries enhancing fungibility while supporting local business presence. It is facilitated by the “Societas Europaea” (“SE”) structure that facilitates an efficient branch set-up in Europe, enabling integrated supervision at Group parent company level through SCOR SE, focusing on communication with a limited number of supervisors with whom SCOR can share its global strategy, while taking advantage of diversification benefits;
●● an integrated supervision of regulatory constraints at Group level and an optimal capital allocation.
SCOR efficiently manages its capital allocation and fungibility between subsidiaries within the legal and regulatory constraints. SCOR is continuously leveraging, in its day-to-day activity, on various tools that are core to the reinsurance activity (such as intragroup reinsurance, intragroup financing, portfolio transfer, capital transfer or collateral posting).
For further information on capital management, see Chapter E – Capital Management.
1032016 / Solvency and financial condition report – SCOR Group, SCOR SE, SGP&C SE and SGL SE /
RISK PROFILE Other material risks < #C
Risks related to acquisitions
Overview of risks related to SCOR’s acquisitions
SCOR has made a number of acquisitions around the world. Acquisitions involve risks that could adversely affect its operating results, including the substantial amount of management time that may be diverted from operations to pursue and complete acquisitions. Acquisitions could also result in additional indebtedness, costs, contingent liabilities, impairment and amortization expenses related to intangible assets recognized on an accounting basis. In addition, acquisitions may expose SCOR to operational challenges and various risks.
A failure to successfully manage such operational challenges could adversely affect the Group.
Specific risks relating to the acquired businesses are as follows:
The integration of the acquired activities may prove to be more difficult than expected
Integrations may take longer, be more expensive or more difficult than expected. The success of integrations may depend on operational and commercial planning, execution of systems and procedures, and on the retention of key employees. Difficulties could result in higher integration costs or fewer synergies than expected.
Retaining client relationships and related business volumes
It may be outside the control and influence of SCOR to retain certain client relationships and business volumes related to acquired businesses. Related earnings and efficiencies may be lower than expected, which may dilute the return on such acquisition related investments.
AEGON’s insolvency might impair the value of future cash-flows of SCOR Global Life reinsurance treaties
Since August 2011, the majority of the mortality reinsurance business in the US related to the former Transamerica Reinsurance Co. flows into SCOR via retrocession from AEGON companies. Not all underlying reinsurance agreements between cedents and AEGON have been novated; an AEGON insolvency might reduce or terminate cedent premiums passed on to SCOR, impair future cash flows and have a material adverse effect on SCOR.
Certain risks relating to acquired companies may not yet be known
Due notably to the size and complexities of acquisitions, and despite carrying out pre-acquisition due diligence work there is a risk that not all financial elements (including litigation related to prior periods) may have been fully and/or correctly evaluated. Unknown or unexpected financial risks could emerge, which may have significant consequences on the initially estimated impact of the relevant acquisition on the combined Group.
Management of risks related to acquisitions
SCOR adheres to high internal standards for acquisition processes, governance and integration, based on an approach approved by its Executive Committee.
SCOR retains outside legal, accounting, tax, actuarial, regulatory and financial counsel for its due diligence, valuation and integration assessments and execution, led by experienced employees in various multi-jurisdictional disciplines, including but not limited to underwriting, structuring, valuation, accounting, tax, actuarial, risk management, legal, audit, strategy, claims management, regulators, rating agencies, and asset management. SCOR’s governance is overseen by a Group Steering Committee, chaired by its Chief Executive Officer and including various members of SCOR’s Executive Committee. All progress, assessments and any offers made to third parties are generally presented and approved by the Strategy Committee of SCOR’s Board of Directors.
All planned acquisition projects that may have an impact on SCOR’s risk profile are reviewed in collaboration with SCOR’s risk management teams. Integration of acquired businesses typically begins during the due diligence phase and is carefully planned between SCOR and the personnel of the acquired companies. SCOR integration plans typically take into account all systems, procedures, commitments and constraints, as well as employees, clients, suppliers and contractual third parties, and focuses on pre-closing, closing day and post-closing objectives. While SCOR has experience in managing acquisitions and takes care in planning and executing such operations, the outcomes may not always meet expectations.
Risks related to the valuation of SCOR’s deferred tax assets
Changes in the valuation of its deferred tax assets may have a material adverse impact on SCOR
The recognition of deferred tax assets, i.e., the likelihood of recognizing sufficient profits in the future to offset losses, depends on the performance of each entity concerned as well as applicable tax laws, regulatory requirements and accounting methods. The occurrence of events, such as operational earnings lower than currently projected or losses continuing over a longer period than originally planned or changes in tax legislation, regulatory requirements, or accounting methods could lead to the de-recognition of part of the deferred tax assets for accounting and/or regulatory purposes.
Management of risks related to the valuation of SCOR’s deferred tax assets
Valuation risks including those related to SCOR’s deferred tax assets are managed through robust processes and controls throughout the Group. For further information on how valuation risks are managed, see Section C.6 – Operational risks, Section B.4.1 – Description of the internal control system, and Section D.1 – Assets.
104 / Solvency and financial condition report – SCOR Group, SCOR SE, SGP&C SE and SGL SE / 2016
> Other material risks#C RISK PROFILE
C.7.3. SIGNIFICANT RISK CONCENTRATIONS AT THE LEVEL OF THE GROUP
Risk concentrations mainly impact three categories of risk, individually or collectively:
●● underwriting risks, in particular through catastrophes and other accumulation risks across lines of business or within certain geographical areas. For further information on SCOR’s exposure to catastrophes and how these risks are managed, see Section C.2.1 – P&C reinsurance and C.2.2 – Life reinsurance;
●● market risks, in particular in case of major events impacting specific types of assets to which SCOR is exposed. For further information on market risks and how they are managed, see Section C.3 – Market risks;
●● credit risks, in case of major events impacting certain types of counterparties or certain individual counterparties to which SCOR is exposed. For further information on credit risks and how they are managed, see Section C.4 – Credit risk.
For further information on the accumulation of risks within SCOR and how these risks are managed, see Section B.3.2.3 – Identification and assessment of risks.
C.7.3.1. OVERVIEW OF CURRENT RISK CONCENTRATIONS AT GROUP LEVEL
SCOR aims to preserve a high level of diversification throughout its activities, while controlling exposure concentrations to a single counterparty, type of asset, geographical area or industry sector. The US government is the most significant counterparty SCOR is exposed to through its investments in government or government assimilated bonds. The exposure to the US government is less than 10% of total assets and is highly liquid.
Risk concentrations are monitored to ensure they remain in line with risk tolerances, i.e. below the limits set out in order to ensure that the Group’s risk profile remains aligned with the Group’s risk appetite framework. The definition of the risk appetite framework aims to strike an appropriate balance between risk, capital adequacy and return, while respecting SCOR’s key stakeholders’ expectations. For further information on the risk appetite framework and risk tolerances, see Section B.3.1 – Risk appetite framework. Losses arising from such risk concentrations may also significantly increase SCOR’s liquidity needs. SCOR assesses liquidity risks arising from a deviation from its liquidity needs over the short-, medium- or long-term. For further information on these risks and how they are managed, see Section C.5 – Liquidity risks.
C.7.4. OTHER MATERIAL RISKS AT SCOR SE LEVEL
SCOR SE’s strategic risks are the same as those for the Group. It relies upon the organization defined within the Group, detailed above, in order to be able to assess and control its risks. See Section C.7.1 – Strategic risk for further details.
On an economic basis, SCOR SE is exposed to the same types of risk exposure and concentrations as the Group.
C.7.5. OTHER MATERIAL RISKS AT SGP&C SE LEVEL
C.7.5.1. STRATEGIC RISKS
SGP&C SE is exposed to similar strategic risks as SCOR Group. It relies upon the organization defined within the Group, detailed above, in order to be able to assess and control its risks. See Section C.7.1 – Strategic risk for further details.
C.7.5.2. OTHER STRATEGIC RISKS
Risks related to capital
SGP&C SE’s ability to access capital is guaranteed through the Group. As a legal entity it may be exposed to the risk of increased local regulatory constraints, which in certain circumstances could affect its ability to repatriate capital from its subsidiaries or branches.
The management of risks related to capital is ensured via specific processes at Group level. See Section C.7.1.5 – Other strategic risks, in the paragraph on risks related to capital for further details.
Risks related to acquisitions
Acquisitions are managed at Group level, in coordination with each division depending on the size of the operation or the lines of business concerned. SCOR Group’s acquisitions may impact SGP&C SE, either directly, by participating in the financing of the acquisition or taking on all or parts of the acquired business, or indirectly, by entering into risk-sharing or retrocession agreements with other SCOR affiliates directly impacted by the acquisition. See Section C.7.1.5 – Other strategic risks, in the paragraph on risks related to acquisitions for further details.
1052016 / Solvency and financial condition report – SCOR Group, SCOR SE, SGP&C SE and SGL SE /
RISK PROFILE Any other information < #C
C.7.6. OTHER MATERIAL RISKS AT SGL SE LEVEL
C.7.6.1. STRATEGIC RISKS
SGL SE’s strategic risks are aligned with those of the Group. It relies upon the organization defined within the Group, detailed above, in order to be able to assess and control its risks. See Section C.7.1 – Strategic risk for further details.
C.7.6.2. OTHER STRATEGIC RISKS
Risks related to capital
SGL SE’s ability to access capital is guaranteed through the Group. As a legal entity it may be exposed to the risk of increased local regulatory constraints, which in certain circumstances could affect its ability to repatriate capital from its subsidiaries or branches.
The management of risks related to capital is ensured via specific processes at Group level. See Section C.7.1.5 – Other strategic risks, in the paragraph on risks related to capital for further details.
Risks related to acquisitions
Acquisitions are managed at Group level, in coordination with each division depending on the size of the operation or the lines of business concerned. SCOR Group’s acquisitions may impact SGL SE, either directly, by participating in the financing of the acquisition or taking on all or parts of the acquired business, or indirectly, by entering into risk-sharing or retrocession agreements with other SCOR affiliates directly impacted by the acquisition. See Section C.7.1.5 – Other strategic risks, in the paragraph on risks related to acquisitions for further details.
C.8. ANY OTHER INFORMATION
No other material information is reported regarding SCOR’s risk profile other than that presented above in Sections C.1 – Introduction to C.7 – Other material risks.
106 / Solvency and financial condition report – SCOR Group, SCOR SE, SGP&C SE and SGL SE / 2016
D.1. ASSETS 109
D.1.1. Goodwill and other intangible assets 110
D.1.2. Property, plant and equipment 111
D.1.3. Participations 111
D.1.4. Cash and investments, other than property and participations 112
D.1.5. Insurance technical assets 114
D.1.6. Deferred tax assets 115
D.1.7. Pension benefit surplus 116
D.1.8. Own shares 117
D.1.9. Other assets, including loans receivables and trade receivables 117
D.1.10. SCOR SE – Additional information on the valuation of assets 118
D.1.11. SGP&C SE – Additional information on the valuation of assets 122
D.1.12. SGL SE – Additional information on the valuation of assets 126
D.2. TECHNICAL PROVISIONS 129
D.2.1. Non-life technical provisions 129
D.2.2. Life technical provisions 133
D.2.3. SCOR SE – Additional information on the valuation of technical provisions 137
D.2.4. SGP&C SE – Additional information on the valuation of technical provisions 141
D.2.5. SGL SE – Additional information on the valuation of technical provisions 144
VALUATION FOR SOLVENCY PURPOSES
#D
1072016 / Solvency and financial condition report – SCOR Group, SCOR SE, SGP&C SE and SGL SE /
D.3. OTHER LIABILITIES 146
D.3.1. Pension benefit obligations 146
D.3.2. Insurance technical liabilities 147
D.3.3. Deferred tax liabilities 148
D.3.4. Financial liabilities, including subordinated liabilities 148
D.3.5. Other liabilities 149
D.3.6. SCOR SE – Additional information on the valuation of other liabilities 150
D.3.7. SGP&C SE – Additional information on the valuation of other liabilities 153
D.3.8. SGL SE – Additional information on the valuation of other liabilities 155
D.4. ALTERNATIVE METHODS FOR VALUATION 158
D.4.1. SCOR Group 158
D.4.2. SCOR SE – Additional information on alternative methods of valuation 158
D.4.3. SGP&C SE – Additional information on alternative methods of valuation 158
D.4.4. SGL SE – Additional information on alternative methods of valuation 158
D.5. ANY OTHER INFORMATION 159
108 / Solvency and financial condition report – SCOR Group, SCOR SE, SGP&C SE and SGL SE / 2016
#D VALUATION FOR SOLVENCY PURPOSES
Solvency II requires SCOR to produce an economic balance sheet (EBS) representing a market view of its assets and liabilities as at the reporting date. The Solvency II regulations require the EBS to include assets valued at the amount for which they could be exchanged between knowledgeable willing parties in an arm’s length transaction and liabilities valued at the amount for which they could be transferred, or settled, between knowledgeable willing parties in an arm’s length transaction. In addition, liabilities are not adjusted to take account of the credit standing of the reporting entity.
The details of the valuation principles applied in the EBS, including the differences between the valuation principles and those applied in the financial statements, are outlined in this chapter.
In the EBS both assets and liabilities relating to in-force business are recognized at market-consistent values which constitutes the valuation for solvency purposes. SCOR’s EBS as at December 31, 2016 has been prepared based on the assumption that the Group and all solo entities will continue as a going concern, in line with the preparation of the consolidated and legal entities’ financial statements. SCOR Group prepares consolidated financial statements in accordance with International Financial Reporting Standards (IFRS). SCOR SE, SGP&C SE and SGL SE prepare their financial statements under French GAAP.
The preparation of the EBS requires management to make certain judgments, assumptions and estimates. These affect the reported amounts of assets and liabilities and the additional disclosures. Management reviews these estimates and assumptions periodically, based on past experience and other factors. The actual
outcome and results could differ substantially from estimates and assumptions made. The most material financial statement captions for which the Group and EEA regulated entities use estimates and assumptions are reinsurance reserves, receivables and liabilities relating to reinsurance operations, the fair value and impairment of financial instruments, intangible assets, retirement and other defined benefit plans and deferred taxes.
The consolidated economic balance sheet of SCOR Group is prepared using the same principles applied to its consolidated financial statements (as described in Section D.1.3 – Participations). All material intragroup balances and transactions including the result of inter-company transactions are eliminated.
The EBSs for the Group, SCOR SE, SGP&C SE and SGL SE are presented in Quantitative Reporting Templates S.02.01 (see Appendices A to D). The relevant extracts of the EBS are included at the beginning of each section, together with a clear reference to the relevant sections within this chapter explaining the valuation bases and methods used for Solvency II purposes.
The principles for the valuation for solvency purposes of assets, technical provisions and other liabilities as presented in this chapter have been applied consistently by SCOR Group and its subsidiaries, including third-country undertakings. The specific information related to SCOR SE, SGL SE and SGP&C SE is included in the relevant sub-sections (D.1.10 to D.1.12, D.2.3 to D.2.5, D.3.6 to D.3.8 and D.4.2 to D.4.4), as well as in Appendices B, C and D, and should be read in conjunction with the group-wide information.
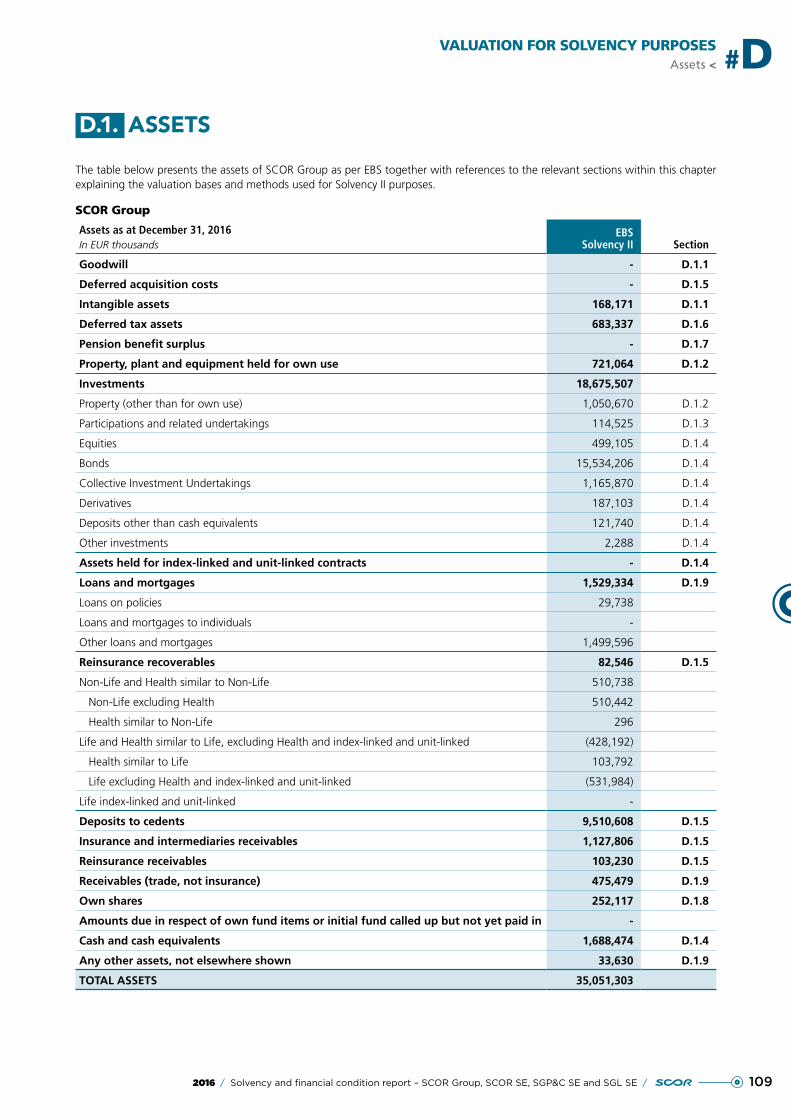
1092016 / Solvency and financial condition report – SCOR Group, SCOR SE, SGP&C SE and SGL SE /
VALUATION FOR SOLVENCY PURPOSESAssets < #D
D.1. ASSETS
The table below presents the assets of SCOR Group as per EBS together with references to the relevant sections within this chapter explaining the valuation bases and methods used for Solvency II purposes.
SCOR Group
Assets as at December 31, 2016In EUR thousands
EBSSolvency II Section
Goodwill - D.1.1
Deferred acquisition costs - D.1.5
Intangible assets 168,171 D.1.1
Deferred tax assets 683,337 D.1.6
Pension benefit surplus - D.1.7
Property, plant and equipment held for own use 721,064 D.1.2
Investments 18,675,507
Property (other than for own use) 1,050,670 D.1.2
Participations and related undertakings 114,525 D.1.3
Equities 499,105 D.1.4
Bonds 15,534,206 D.1.4
Collective Investment Undertakings 1,165,870 D.1.4
Derivatives 187,103 D.1.4
Deposits other than cash equivalents 121,740 D.1.4
Other investments 2,288 D.1.4
Assets held for index-linked and unit-linked contracts - D.1.4
Loans and mortgages 1,529,334 D.1.9
Loans on policies 29,738
Loans and mortgages to individuals -
Other loans and mortgages 1,499,596
Reinsurance recoverables 82,546 D.1.5
Non-Life and Health similar to Non-Life 510,738
Non-Life excluding Health 510,442
Health similar to Non-Life 296
Life and Health similar to Life, excluding Health and index-linked and unit-linked (428,192)
Health similar to Life 103,792
Life excluding Health and index-linked and unit-linked (531,984)
Life index-linked and unit-linked -
Deposits to cedents 9,510,608 D.1.5
Insurance and intermediaries receivables 1,127,806 D.1.5
Reinsurance receivables 103,230 D.1.5
Receivables (trade, not insurance) 475,479 D.1.9
Own shares 252,117 D.1.8
Amounts due in respect of own fund items or initial fund called up but not yet paid in -
Cash and cash equivalents 1,688,474 D.1.4
Any other assets, not elsewhere shown 33,630 D.1.9
TOTAL ASSETS 35,051,303
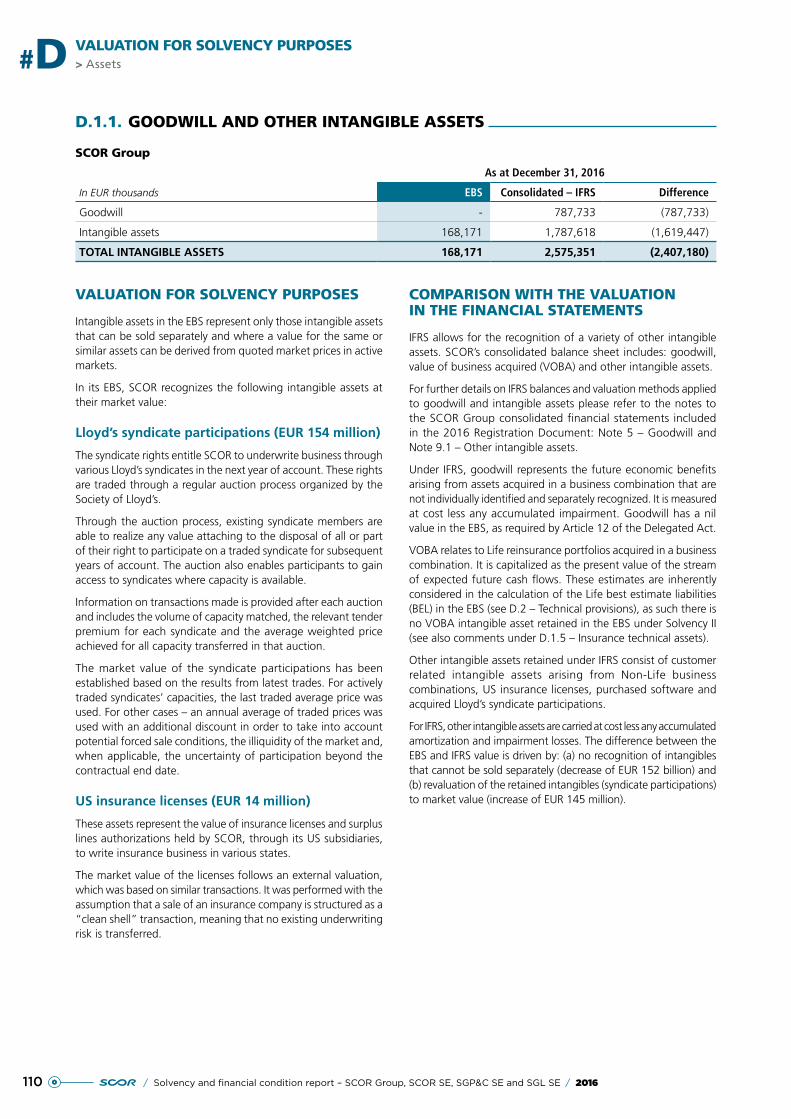
110 / Solvency and financial condition report – SCOR Group, SCOR SE, SGP&C SE and SGL SE / 2016
> Assets#D VALUATION FOR SOLVENCY PURPOSES
D.1.1. GOODWILL AND OTHER INTANGIBLE ASSETS
SCOR Group
In EUR thousands
As at December 31, 2016
EBS Consolidated – IFRS Difference
Goodwill - 787,733 (787,733)
Intangible assets 168,171 1,787,618 (1,619,447)
TOTAL INTANGIBLE ASSETS 168,171 2,575,351 (2,407,180)
VALUATION FOR SOLVENCY PURPOSES
Intangible assets in the EBS represent only those intangible assets that can be sold separately and where a value for the same or similar assets can be derived from quoted market prices in active markets.
In its EBS, SCOR recognizes the following intangible assets at their market value:
Lloyd’s syndicate participations (EUR 154 million)
The syndicate rights entitle SCOR to underwrite business through various Lloyd’s syndicates in the next year of account. These rights are traded through a regular auction process organized by the Society of Lloyd’s.
Through the auction process, existing syndicate members are able to realize any value attaching to the disposal of all or part of their right to participate on a traded syndicate for subsequent years of account. The auction also enables participants to gain access to syndicates where capacity is available.
Information on transactions made is provided after each auction and includes the volume of capacity matched, the relevant tender premium for each syndicate and the average weighted price achieved for all capacity transferred in that auction.
The market value of the syndicate participations has been established based on the results from latest trades. For actively traded syndicates’ capacities, the last traded average price was used. For other cases – an annual average of traded prices was used with an additional discount in order to take into account potential forced sale conditions, the illiquidity of the market and, when applicable, the uncertainty of participation beyond the contractual end date.
US insurance licenses (EUR 14 million)
These assets represent the value of insurance licenses and surplus lines authorizations held by SCOR, through its US subsidiaries, to write insurance business in various states.
The market value of the licenses follows an external valuation, which was based on similar transactions. It was performed with the assumption that a sale of an insurance company is structured as a “clean shell” transaction, meaning that no existing underwriting risk is transferred.
COMPARISON WITH THE VALUATION IN THE FINANCIAL STATEMENTS
IFRS allows for the recognition of a variety of other intangible assets. SCOR’s consolidated balance sheet includes: goodwill, value of business acquired (VOBA) and other intangible assets.
For further details on IFRS balances and valuation methods applied to goodwill and intangible assets please refer to the notes to the SCOR Group consolidated financial statements included in the 2016 Registration Document: Note 5 – Goodwill and Note 9.1 – Other intangible assets.
Under IFRS, goodwill represents the future economic benefits arising from assets acquired in a business combination that are not individually identified and separately recognized. It is measured at cost less any accumulated impairment. Goodwill has a nil value in the EBS, as required by Article 12 of the Delegated Act.
VOBA relates to Life reinsurance portfolios acquired in a business combination. It is capitalized as the present value of the stream of expected future cash flows. These estimates are inherently considered in the calculation of the Life best estimate liabilities (BEL) in the EBS (see D.2 – Technical provisions), as such there is no VOBA intangible asset retained in the EBS under Solvency II (see also comments under D.1.5 – Insurance technical assets).
Other intangible assets retained under IFRS consist of customer related intangible assets arising from Non-Life business combinations, US insurance licenses, purchased software and acquired Lloyd’s syndicate participations.
For IFRS, other intangible assets are carried at cost less any accumulated amortization and impairment losses. The difference between the EBS and IFRS value is driven by: (a) no recognition of intangibles that cannot be sold separately (decrease of EUR 152 billion) and (b) revaluation of the retained intangibles (syndicate participations) to market value (increase of EUR 145 million).
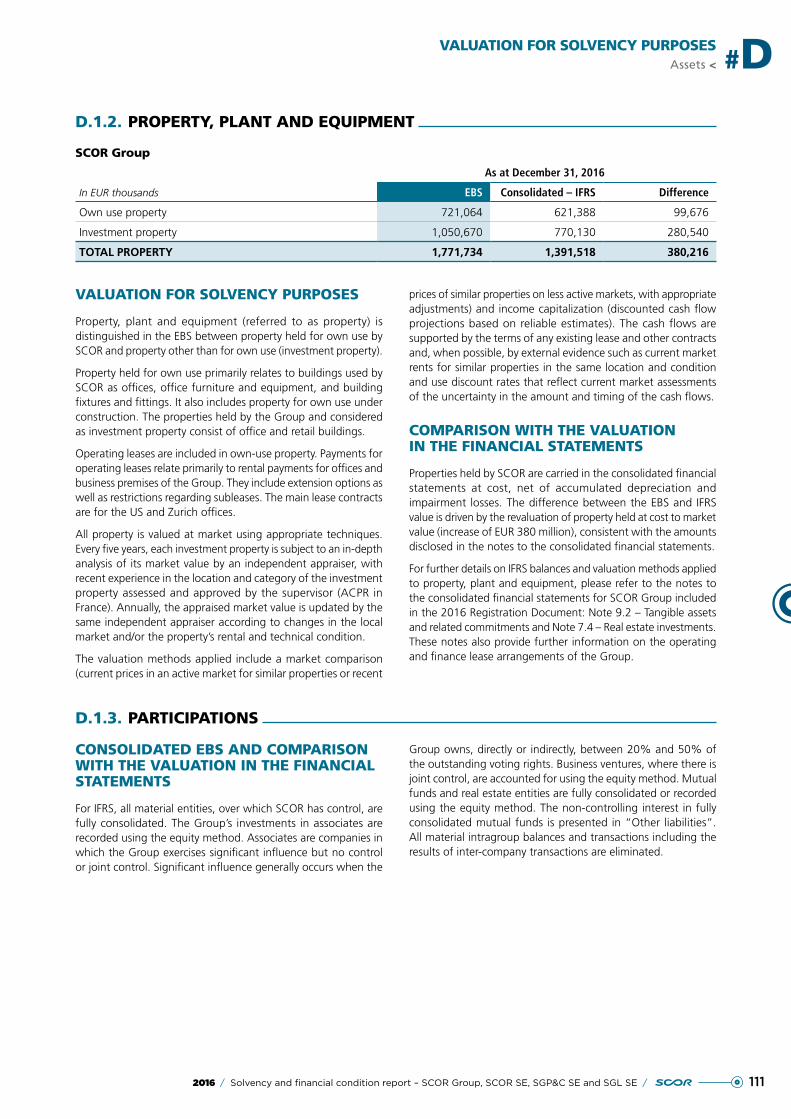
1112016 / Solvency and financial condition report – SCOR Group, SCOR SE, SGP&C SE and SGL SE /
VALUATION FOR SOLVENCY PURPOSESAssets < #D
D.1.2. PROPERTY, PLANT AND EQUIPMENT
SCOR Group
In EUR thousands
As at December 31, 2016
EBS Consolidated – IFRS Difference
Own use property 721,064 621,388 99,676
Investment property 1,050,670 770,130 280,540
TOTAL PROPERTY 1,771,734 1,391,518 380,216
VALUATION FOR SOLVENCY PURPOSES
Property, plant and equipment (referred to as property) is distinguished in the EBS between property held for own use by SCOR and property other than for own use (investment property).
Property held for own use primarily relates to buildings used by SCOR as offices, office furniture and equipment, and building fixtures and fittings. It also includes property for own use under construction. The properties held by the Group and considered as investment property consist of office and retail buildings.
Operating leases are included in own-use property. Payments for operating leases relate primarily to rental payments for offices and business premises of the Group. They include extension options as well as restrictions regarding subleases. The main lease contracts are for the US and Zurich offices.
All property is valued at market using appropriate techniques. Every five years, each investment property is subject to an in-depth analysis of its market value by an independent appraiser, with recent experience in the location and category of the investment property assessed and approved by the supervisor (ACPR in France). Annually, the appraised market value is updated by the same independent appraiser according to changes in the local market and/or the property’s rental and technical condition.
The valuation methods applied include a market comparison (current prices in an active market for similar properties or recent
prices of similar properties on less active markets, with appropriate adjustments) and income capitalization (discounted cash flow projections based on reliable estimates). The cash flows are supported by the terms of any existing lease and other contracts and, when possible, by external evidence such as current market rents for similar properties in the same location and condition and use discount rates that reflect current market assessments of the uncertainty in the amount and timing of the cash flows.
COMPARISON WITH THE VALUATION IN THE FINANCIAL STATEMENTS
Properties held by SCOR are carried in the consolidated financial statements at cost, net of accumulated depreciation and impairment losses. The difference between the EBS and IFRS value is driven by the revaluation of property held at cost to market value (increase of EUR 380 million), consistent with the amounts disclosed in the notes to the consolidated financial statements.
For further details on IFRS balances and valuation methods applied to property, plant and equipment, please refer to the notes to the consolidated financial statements for SCOR Group included in the 2016 Registration Document: Note 9.2 – Tangible assets and related commitments and Note 7.4 – Real estate investments. These notes also provide further information on the operating and finance lease arrangements of the Group.
D.1.3. PARTICIPATIONS
CONSOLIDATED EBS AND COMPARISON WITH THE VALUATION IN THE FINANCIAL STATEMENTS
For IFRS, all material entities, over which SCOR has control, are fully consolidated. The Group’s investments in associates are recorded using the equity method. Associates are companies in which the Group exercises significant influence but no control or joint control. Significant influence generally occurs when the
Group owns, directly or indirectly, between 20% and 50% of the outstanding voting rights. Business ventures, where there is joint control, are accounted for using the equity method. Mutual funds and real estate entities are fully consolidated or recorded using the equity method. The non-controlling interest in fully consolidated mutual funds is presented in “Other liabilities”. All material intragroup balances and transactions including the results of inter-company transactions are eliminated.
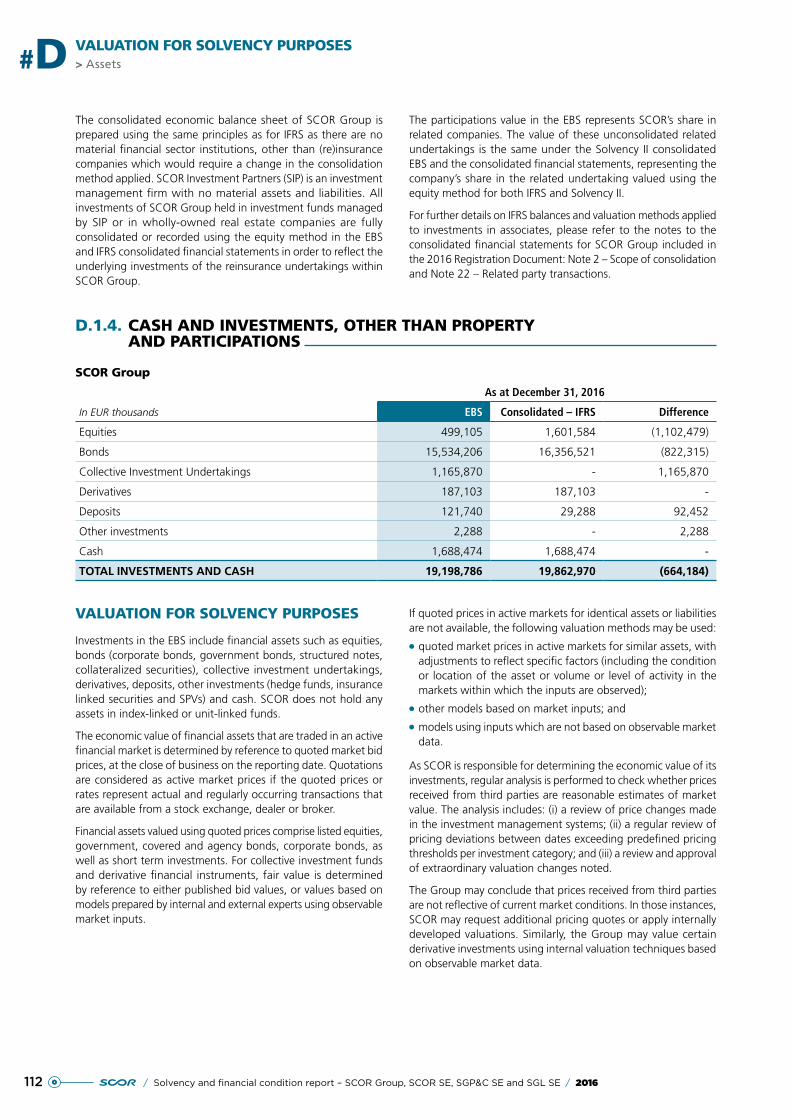
112 / Solvency and financial condition report – SCOR Group, SCOR SE, SGP&C SE and SGL SE / 2016
> Assets#D VALUATION FOR SOLVENCY PURPOSES
The consolidated economic balance sheet of SCOR Group is prepared using the same principles as for IFRS as there are no material financial sector institutions, other than (re)insurance companies which would require a change in the consolidation method applied. SCOR Investment Partners (SIP) is an investment management firm with no material assets and liabilities. All investments of SCOR Group held in investment funds managed by SIP or in wholly-owned real estate companies are fully consolidated or recorded using the equity method in the EBS and IFRS consolidated financial statements in order to reflect the underlying investments of the reinsurance undertakings within SCOR Group.
The participations value in the EBS represents SCOR’s share in related companies. The value of these unconsolidated related undertakings is the same under the Solvency II consolidated EBS and the consolidated financial statements, representing the company’s share in the related undertaking valued using the equity method for both IFRS and Solvency II.
For further details on IFRS balances and valuation methods applied to investments in associates, please refer to the notes to the consolidated financial statements for SCOR Group included in the 2016 Registration Document: Note 2 – Scope of consolidation and Note 22 – Related party transactions.
D.1.4. CASH AND INVESTMENTS, OTHER THAN PROPERTY AND PARTICIPATIONS
SCOR Group
In EUR thousands
As at December 31, 2016
EBS Consolidated – IFRS Difference
Equities 499,105 1,601,584 (1,102,479)
Bonds 15,534,206 16,356,521 (822,315)
Collective Investment Undertakings 1,165,870 - 1,165,870
Derivatives 187,103 187,103 -
Deposits 121,740 29,288 92,452
Other investments 2,288 - 2,288
Cash 1,688,474 1,688,474 -
TOTAL INVESTMENTS AND CASH 19,198,786 19,862,970 (664,184)
VALUATION FOR SOLVENCY PURPOSES
Investments in the EBS include financial assets such as equities, bonds (corporate bonds, government bonds, structured notes, collateralized securities), collective investment undertakings, derivatives, deposits, other investments (hedge funds, insurance linked securities and SPVs) and cash. SCOR does not hold any assets in index-linked or unit-linked funds.
The economic value of financial assets that are traded in an active financial market is determined by reference to quoted market bid prices, at the close of business on the reporting date. Quotations are considered as active market prices if the quoted prices or rates represent actual and regularly occurring transactions that are available from a stock exchange, dealer or broker.
Financial assets valued using quoted prices comprise listed equities, government, covered and agency bonds, corporate bonds, as well as short term investments. For collective investment funds and derivative financial instruments, fair value is determined by reference to either published bid values, or values based on models prepared by internal and external experts using observable market inputs.
If quoted prices in active markets for identical assets or liabilities are not available, the following valuation methods may be used:
●● quoted market prices in active markets for similar assets, with adjustments to reflect specific factors (including the condition or location of the asset or volume or level of activity in the markets within which the inputs are observed);
●● other models based on market inputs; and
●● models using inputs which are not based on observable market data.
As SCOR is responsible for determining the economic value of its investments, regular analysis is performed to check whether prices received from third parties are reasonable estimates of market value. The analysis includes: (i) a review of price changes made in the investment management systems; (ii) a regular review of pricing deviations between dates exceeding predefined pricing thresholds per investment category; and (iii) a review and approval of extraordinary valuation changes noted.
The Group may conclude that prices received from third parties are not reflective of current market conditions. In those instances, SCOR may request additional pricing quotes or apply internally developed valuations. Similarly, the Group may value certain derivative investments using internal valuation techniques based on observable market data.
1132016 / Solvency and financial condition report – SCOR Group, SCOR SE, SGP&C SE and SGL SE /
VALUATION FOR SOLVENCY PURPOSESAssets < #D
Equities
For unlisted equity instruments, the economic value is determined according to commonly used valuation techniques.
Bonds (government, corporate, structured notes, collateralized securities)
Structured products other than securities issued by government agencies for which the market is considered active, hybrid and tier 1 and tier 2 corporate debt, private placements, inflation linked government assimilated bonds, and specific alternative investments are valued based on models prepared by internal and external experts using observable market inputs.
Collective investment undertakings
For some collective investment funds (unlisted) the economic value is determined by reference to values based on models prepared by internal and external experts using observable market inputs. The economic value of hedge funds managed by third parties is based on their net asset value (NAV) as issued by external asset managers. This NAV is regularly audited, at least annually.
Derivatives (assets and liabilities)
All derivative instruments are carried as assets when the economic values are positive and as liabilities when the economic values are negative.
The Group uses the following derivative instruments to reduce its exposure to various risks: swaps based on interest rates, mortality indices and real estate indices, foreign currency forward purchase and sale contracts, caps and floors, and puts and calls on insurance linked securities (ILS).
For some derivative financial instruments primarily relating to the Atlas catastrophe bonds, the economic value is determined based on models prepared by internal and external experts using observable market inputs.
Catastrophe bonds
Atlas IX catastrophe bonds are valued using a cumulated expected loss model that is based on a combination of market inputs to the extent that trades in these instruments are active and catastrophe modeling tools developed by third-party companies (AIR/RMS). The significant unobservable inputs in the valuation model are as follows:
Unobservable inputsAtlas IX
Series 2015-1Atlas IX
Series 2016-1
Expected loss US Named Storm based on AIR model 4.45% 5.10%
Expected loss US and Canadian Earthquake based on AIR model 3.25% 3.85%
A significant catastrophic event (US or Canadian Earthquake or a US Named Storm) covered by the Atlas IX Series 2015-1 or Atlas IX Series 2016-1 and occurring during the coverage period of this bond, would lead to an increase in the economic value of the respective portion of the derivative instrument recorded.
Mortality bonds
The Atlas IX mortality risk transfer contract transaction is recorded as a derivative asset recognized at fair value through income and a payable for the value of interest payments. SCOR values the derivative asset using a model that is based on an indicative secondary market interest rate, considering both the probability of trigger and alternative investment opportunities to the extent that trades in these instruments are active.
The average indicative secondary market interest rate is calculated based on third-party sources, which provide regular overviews on the current indicative secondary market. The average indicative secondary market interest rate used as at December 31, 2016 was 2.41%.
Extreme mortality events in the US (such as pandemics, natural catastrophes and terrorist attacks) covered by the Atlas extreme mortality bond and occurring during the coverage period of this bond, would increase the fair value of the derivative instrument.
Interest rate swaps and cross-currency swaps
SCOR has entered into interest rates swaps to cover its exposure to financial liabilities with variable interest rates relating to real estate investments. In order to hedge the foreign exchange risk associated with certain debts issued in Swiss francs, SCOR entered into cross-currency swaps which exchange the principals and the coupons on the notes into euros. The economic value of the swaps is obtained from the banking counterparty and is based on market inputs. As part of the usual accounts analysis processes these third-party valuations are checked for reasonableness against internal models.
Forward currency contracts
SCOR purchases and sells forward currency contracts to reduce its overall exposure to foreign exchange balances held in currencies other than the functional currencies of its subsidiaries. The contracts are recorded at their net fair value from valuations provided by banking counterparties using market inputs.
114 / Solvency and financial condition report – SCOR Group, SCOR SE, SGP&C SE and SGL SE / 2016
> Assets#D VALUATION FOR SOLVENCY PURPOSES
Cash and cash equivalents
SCOR applies the same definition of cash for both IFRS and Solvency II reporting purposes, which means that cash includes cash, net bank balances and short-term deposits or investments which have a maturity of less than three months at the reporting date. Accordingly, deposits include amounts due from credit institutions that have a maturity date of more than three months. The carrying value of deposits approximates their market value.
COMPARISON WITH THE VALUATION IN THE FINANCIAL STATEMENTS
The method of valuation applied to financial assets in the Solvency II EBS does not differ from IFRS. The reclassifications
between investment categories result from the difference between the Solvency II definitions and those used in the consolidated financial statements. The reclassification does not result in any valuation changes. The total difference included in the table above is net of the loans and mortgages category due to presentation changes – see Section D.1.9 – Other assets, including loans receivables and trade receivables.
For further details on IFRS balances, classification and valuation methods applied to investments, please refer to the notes to the SCOR Group consolidated financial statements included in the 2016 Registration Document: Note 7.2 – Accounting principles for valuation and impairment of financial assets, Note 7.9 – Derivative instruments and Note 11 – Cash and cash equivalents.
D.1.5. INSURANCE TECHNICAL ASSETS
SCOR Group
In EUR thousands
As at December 31, 2016
EBS Consolidated – IFRS Difference
Deferred acquisition costs (DAC) - 1,376,206 (1,376,206)
Reinsurance recoverables 82,546 1,096,622 (1,014,076)
Non-Life 510,738 826,287 (315,549)
Life (428,192) 270,335 (698,527)
Deposits to cedents 9,510,608 8,327,563 1,183,045
Insurance and intermediaries receivables 1,127,806 3,542,386 (2,414,580)
Reinsurance receivables 103,230 103,230 -
TOTAL INSURANCE TECHNICAL ASSETS 10,824,190 14,446,007 (3,621,817)
VALUATION FOR SOLVENCY PURPOSES
Insurance technical assets are balances that relate to reinsurance and direct insurance contracts.
In the EBS assumed and ceded technical provisions are recognized in line with Solvency II methodology (see Section D.2 – Technical provisions). The calculation of the Solvency II best estimate liabilities and risk margin takes into account all cash flow projections related to existing insurance and reinsurance contracts, including premium, benefit and expenses payments. As a result, some balances that exist in the IFRS balance sheet are either cancelled or adjusted on transition to the EBS, as follows:
DAC
DAC which represents the deferral of costs directly associated with the acquisition of new contracts (mainly commission) is not recognized in the EBS. Reimbursements of initial incurred acquisition costs are included in future premiums and thus included in the calculation of technical provisions.
Reinsurance recoverables
Reinsurance recoverables (ceded technical provisions) reflect the estimated amounts which are recoverable under reinsurance contracts (retrocession) in respect of SCOR’s reinsurance treaties.
Reinsurance recoverables in the EBS are calculated using essentially the same methodology, systems and processes as the best estimate liabilities (see Section D.2 – Technical provisions). Assumptions are set based on the type of business retroceded and the valuation takes into consideration the recoverability of the balance, where appropriate.
Deposits to cedents
These balances represent deposits made at the request of ceding companies as collateral for SCOR’s reinsurance commitments. SCOR measures its deposits to cedents (or funds held) at fair value by discounting the future cash flows of the funds where IFRS does not already represents market values. In order to achieve a full economic valuation of the contracts, all cash flows in respect of the contracts are considered, including the cash flows in respect of assets deposited with the cedent. The calculation of these cash flows is based on the characteristics of the underlying contracts, in particular the reimbursement of interest thereon.
1152016 / Solvency and financial condition report – SCOR Group, SCOR SE, SGP&C SE and SGL SE /
VALUATION FOR SOLVENCY PURPOSESAssets < #D
Insurance, intermediaries and reinsurance receivables
Insurance and intermediaries receivable balances included separately in the EBS represent amounts linked to insurance business that are due (and overdue) from policyholders, intermediaries and other insurers, but that are not included in the projected cash flows used for the calculation of technical provisions.
Reinsurance receivables are amounts linked to reinsurance (retrocession) due (and overdue) from reinsurers which are not included in reinsurance recoverables. The receivables include amounts due from reinsurers relating to settled claims. Receivables are carried at cost (with allowance for recoverability) as it is a good approximation of their market value.
Value of business acquired (VOBA)
As per Solvency II regulations, VOBA is included in technical provisions. For further details, see Section D.1.1 – Goodwill and other intangible assets.
COMPARISON WITH THE VALUATION IN THE FINANCIAL STATEMENTS
As explained above, technical cash flows are taken into account within the Solvency II best estimate liabilities. As a result, acquisition costs and insurance receivables that are included in the projected cash flows used for the calculation of technical provisions are not recognized separately in the EBS. Adjustments to the value of deposits to cedents are calculated consistently with the adjustments to best estimate liabilities. Insurance and intermediaries receivables include a reclassification of assumed outstanding claims estimates from IFRS Life contract liabilities, as these are not included in Solvency II Technical Provisions. For the remaining insurance technical assets, the method of valuation applied in the Solvency II EBS does not differ from IFRS.
For further details on IFRS balances and valuation methods applied to insurance technical assets, please refer to the notes to the SCOR Group consolidated financial statements included in the 2016 Registration Document: Note 8 – Accounts receivable from and payable on assumed and ceded insurance and reinsurance transactions, Note 10 – Deferred acquisition costs and Note 15 – Net contract liabilities.
D.1.6. DEFERRED TAX ASSETS
SCOR Group
In EUR thousands
As at December 31, 2016
EBS Consolidated – IFRS Difference
Deferred tax assets 683,337 683,337 -
Deferred tax liabilities (859,444) (354,420) (505,024)
NET DEFERRED TAX (LIABILITIES)/ASSETS (176,107) 328,917 (505,024)
VALUATION FOR SOLVENCY PURPOSES
Deferred taxes in the EBS are recognized using the balance sheet liability method for all temporary differences at the reporting date between the tax base of assets and liabilities and their carrying amount in the EBS.
The main temporary differences arise from tax losses carried forward and the revaluation of certain financial assets and liabilities including derivative contracts, certain insurance contract liabilities, provisions for pensions and other post-retirement benefits. In addition, temporary differences arise on acquisitions due to the difference between the fair values of the net assets acquired and their tax base.
Deferred tax assets are recognized on net operating losses carried forward to the extent that it is probable that future taxable income will be available against which they can be offset. Management
makes assumptions and estimates related to income projections to determine the availability of sufficient future taxable income. SCOR uses a discounted cash flow model comprised of an earnings model, which considers forecast earnings, and other financial ratios of legal entities based on Board-approved business plans, which incorporate key drivers of the underwriting results. Business plans include assessments of gross and net premium expectations, expected loss ratios and expected general expense ratios, together with actuarial assumptions. To the extent that net operating losses carried forward cannot be utilized or expire, deferred income tax expenses may be recorded in the future.
Deferred tax assets and liabilities are assessed at the tax rate applicable in the fiscal year in which the asset will be realized or the liability settled, based on the tax rates (and tax regulations) that have been enacted or substantially enacted at the reporting date.
116 / Solvency and financial condition report – SCOR Group, SCOR SE, SGP&C SE and SGL SE / 2016
> Assets#D VALUATION FOR SOLVENCY PURPOSES
As at December 31, 2016, the operating tax losses available for carryforward expire as follows:
SCOR Group
In EUR thousands
As at December 31, 2016
Available tax losses carried
forward
Tax losses carried forward for which no
DTA is recognizedDeferred tax
assets recognized
2017 4,870 1,726
2018 10,800 3,780
2019 1,538 326
2020 70,037 18,015
2021 33,009 8,252
Thereafter 385,732 (6,763) 131,005
Indefinite 1,255,929 (65,894) 341,854
TOTAL 1,761,915 (72,657) 504,958
Recognition of deferred tax assets on tax loss carryforwards is assessed based on the availability of sufficient future taxable income and local tax rules, e.g. unlimited carryforward in France and a 20-year carryforward period in the United States. Under French Tax Law on tax loss carryforwards, the utilization of tax losses is capped to EUR 1 million plus 50% of the remaining current year’s taxable result. Taxable income is forecast based on the main assumptions described in the accounting principles of this note. SCOR expects to utilize all recognized tax loss carryforwards before expiry.
Operating losses which have not been recognized as deferred tax assets relate primarily to the French Tax Group.
The impact of Solvency II adjustments to bring IFRS figures to EBS market value is an overall increase in net assets, therefore all deferred tax impacts arising from the recording of economic adjustments are reflected in the deferred tax liability. Deferred taxes retained on the EBS are recorded in accordance with IAS 12 Income Taxes.
COMPARISON WITH THE VALUATION IN THE FINANCIAL STATEMENTS
Measurement of deferred taxes for the Solvency II EBS is generally consistent with IFRS, the difference being the fact that the deferred tax asset or liability is established based on the difference between the values ascribed to assets and liabilities recognized in the EBS and their values recognized for tax purposes (instead of the differences between the asset or liability carrying amount in the IFRS balance sheet and its tax base).
For the purpose of the EBS, the appropriate deferred tax effect of all adjustments between the IFRS balance sheet and the EBS is recognized using the applicable local tax rates. Deferred tax balances are adjusted for the impacts of the differences between the IFRS and Solvency II valuation bases – the main difference being driven by revaluation of technical provisions, but also for other differences like property at amortized cost restated to fair value.
For further details on IFRS balances and the valuation method applied to deferred taxes, please refer to the notes to the SCOR Group consolidated financial statements included in the 2016 Registration Document: Note 17 – Income taxes.
D.1.7. PENSION BENEFIT SURPLUS
VALUATION FOR SOLVENCY PURPOSES AND COMPARISON WITH THE VALUATION IN THE FINANCIAL STATEMENTS
On December 31, 2016 SCOR, did not recognize any pension benefit surplus related to employee pension schemes. See Section D.3.1 – Pension benefit obligations.
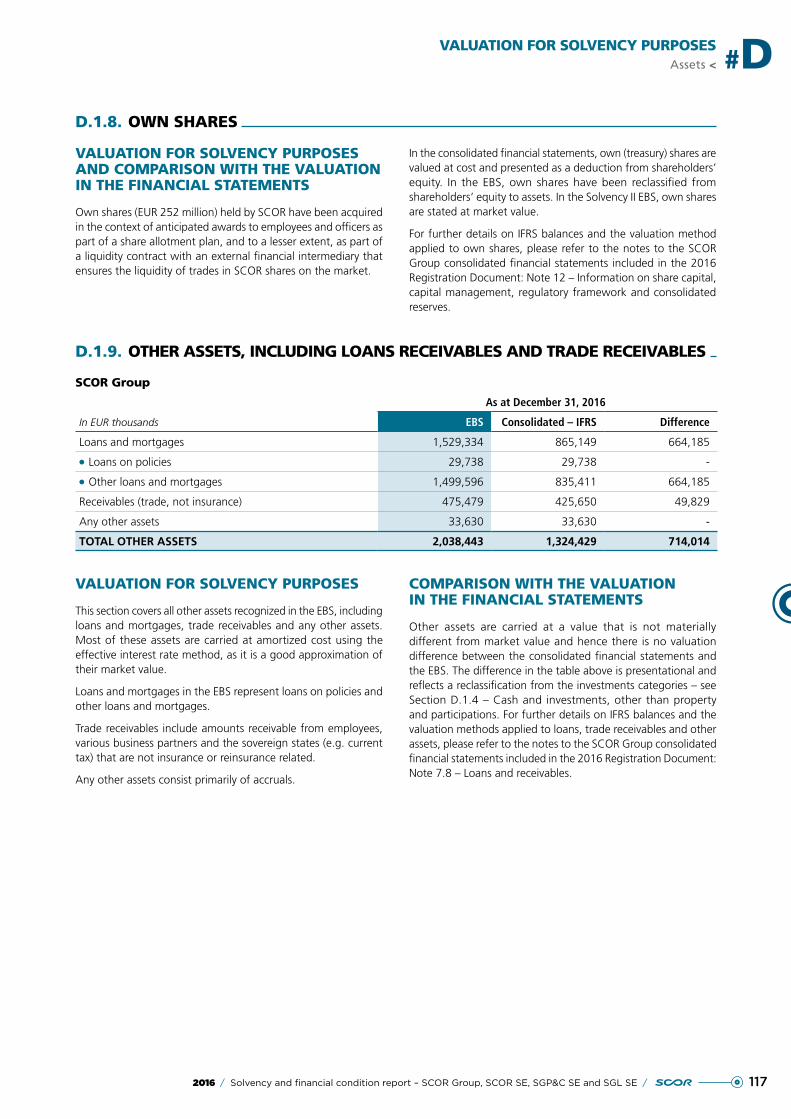
1172016 / Solvency and financial condition report – SCOR Group, SCOR SE, SGP&C SE and SGL SE /
VALUATION FOR SOLVENCY PURPOSESAssets < #D
D.1.8. OWN SHARES
VALUATION FOR SOLVENCY PURPOSES AND COMPARISON WITH THE VALUATION IN THE FINANCIAL STATEMENTS
Own shares (EUR 252 million) held by SCOR have been acquired in the context of anticipated awards to employees and officers as part of a share allotment plan, and to a lesser extent, as part of a liquidity contract with an external financial intermediary that ensures the liquidity of trades in SCOR shares on the market.
In the consolidated financial statements, own (treasury) shares are valued at cost and presented as a deduction from shareholders’ equity. In the EBS, own shares have been reclassified from shareholders’ equity to assets. In the Solvency II EBS, own shares are stated at market value.
For further details on IFRS balances and the valuation method applied to own shares, please refer to the notes to the SCOR Group consolidated financial statements included in the 2016 Registration Document: Note 12 – Information on share capital, capital management, regulatory framework and consolidated reserves.
D.1.9. OTHER ASSETS, INCLUDING LOANS RECEIVABLES AND TRADE RECEIVABLES
SCOR Group
In EUR thousands
As at December 31, 2016
EBS Consolidated – IFRS Difference
Loans and mortgages 1,529,334 865,149 664,185
●● Loans on policies 29,738 29,738 -
●● Other loans and mortgages 1,499,596 835,411 664,185
Receivables (trade, not insurance) 475,479 425,650 49,829
Any other assets 33,630 33,630 -
TOTAL OTHER ASSETS 2,038,443 1,324,429 714,014
VALUATION FOR SOLVENCY PURPOSES
This section covers all other assets recognized in the EBS, including loans and mortgages, trade receivables and any other assets. Most of these assets are carried at amortized cost using the effective interest rate method, as it is a good approximation of their market value.
Loans and mortgages in the EBS represent loans on policies and other loans and mortgages.
Trade receivables include amounts receivable from employees, various business partners and the sovereign states (e.g. current tax) that are not insurance or reinsurance related.
Any other assets consist primarily of accruals.
COMPARISON WITH THE VALUATION IN THE FINANCIAL STATEMENTS
Other assets are carried at a value that is not materially different from market value and hence there is no valuation difference between the consolidated financial statements and the EBS. The difference in the table above is presentational and reflects a reclassification from the investments categories – see Section D.1.4 – Cash and investments, other than property and participations. For further details on IFRS balances and the valuation methods applied to loans, trade receivables and other assets, please refer to the notes to the SCOR Group consolidated financial statements included in the 2016 Registration Document: Note 7.8 – Loans and receivables.
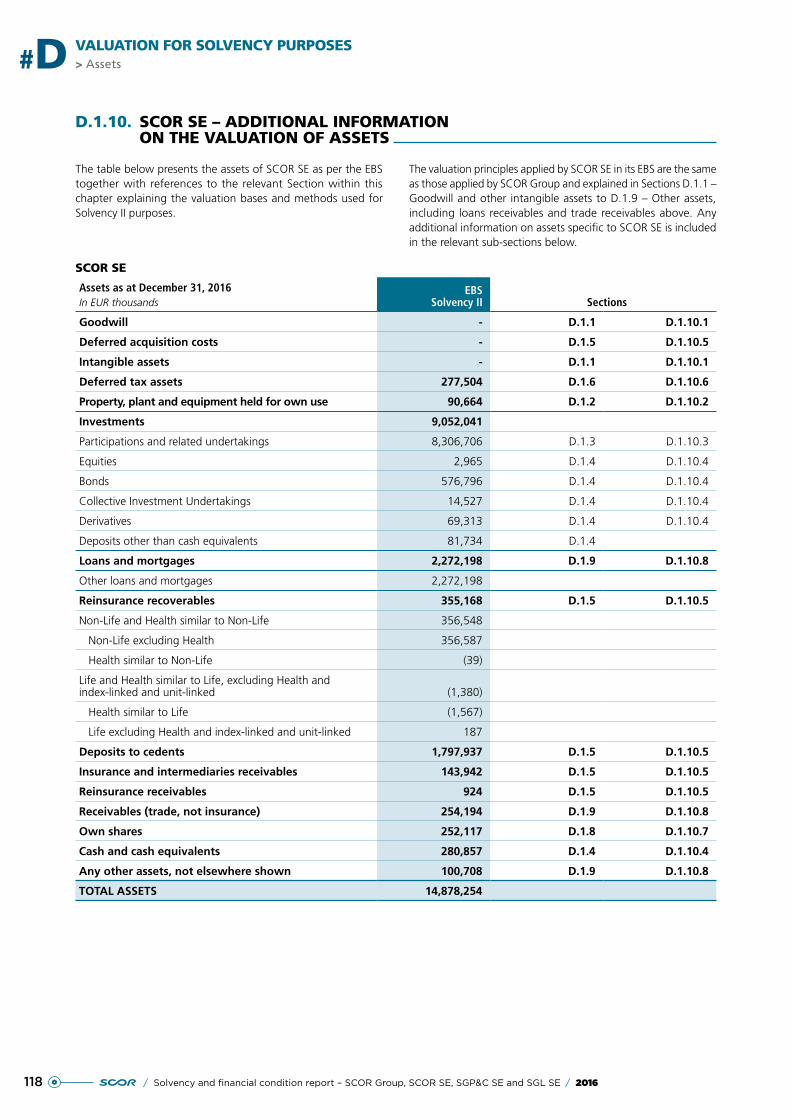
118 / Solvency and financial condition report – SCOR Group, SCOR SE, SGP&C SE and SGL SE / 2016
> Assets#D VALUATION FOR SOLVENCY PURPOSES
D.1.10. SCOR SE – ADDITIONAL INFORMATION ON THE VALUATION OF ASSETS
The table below presents the assets of SCOR SE as per the EBS together with references to the relevant Section within this chapter explaining the valuation bases and methods used for Solvency II purposes.
The valuation principles applied by SCOR SE in its EBS are the same as those applied by SCOR Group and explained in Sections D.1.1 – Goodwill and other intangible assets to D.1.9 – Other assets, including loans receivables and trade receivables above. Any additional information on assets specific to SCOR SE is included in the relevant sub-sections below.
SCOR SE
Assets as at December 31, 2016In EUR thousands
EBSSolvency II Sections
Goodwill - D.1.1 D.1.10.1
Deferred acquisition costs - D.1.5 D.1.10.5
Intangible assets - D.1.1 D.1.10.1
Deferred tax assets 277,504 D.1.6 D.1.10.6
Property, plant and equipment held for own use 90,664 D.1.2 D.1.10.2
Investments 9,052,041
Participations and related undertakings 8,306,706 D.1.3 D.1.10.3
Equities 2,965 D.1.4 D.1.10.4
Bonds 576,796 D.1.4 D.1.10.4
Collective Investment Undertakings 14,527 D.1.4 D.1.10.4
Derivatives 69,313 D.1.4 D.1.10.4
Deposits other than cash equivalents 81,734 D.1.4
Loans and mortgages 2,272,198 D.1.9 D.1.10.8
Other loans and mortgages 2,272,198
Reinsurance recoverables 355,168 D.1.5 D.1.10.5
Non-Life and Health similar to Non-Life 356,548
Non-Life excluding Health 356,587
Health similar to Non-Life (39)
Life and Health similar to Life, excluding Health and index-linked and unit-linked (1,380)
Health similar to Life (1,567)
Life excluding Health and index-linked and unit-linked 187
Deposits to cedents 1,797,937 D.1.5 D.1.10.5
Insurance and intermediaries receivables 143,942 D.1.5 D.1.10.5
Reinsurance receivables 924 D.1.5 D.1.10.5
Receivables (trade, not insurance) 254,194 D.1.9 D.1.10.8
Own shares 252,117 D.1.8 D.1.10.7
Cash and cash equivalents 280,857 D.1.4 D.1.10.4
Any other assets, not elsewhere shown 100,708 D.1.9 D.1.10.8
TOTAL ASSETS 14,878,254
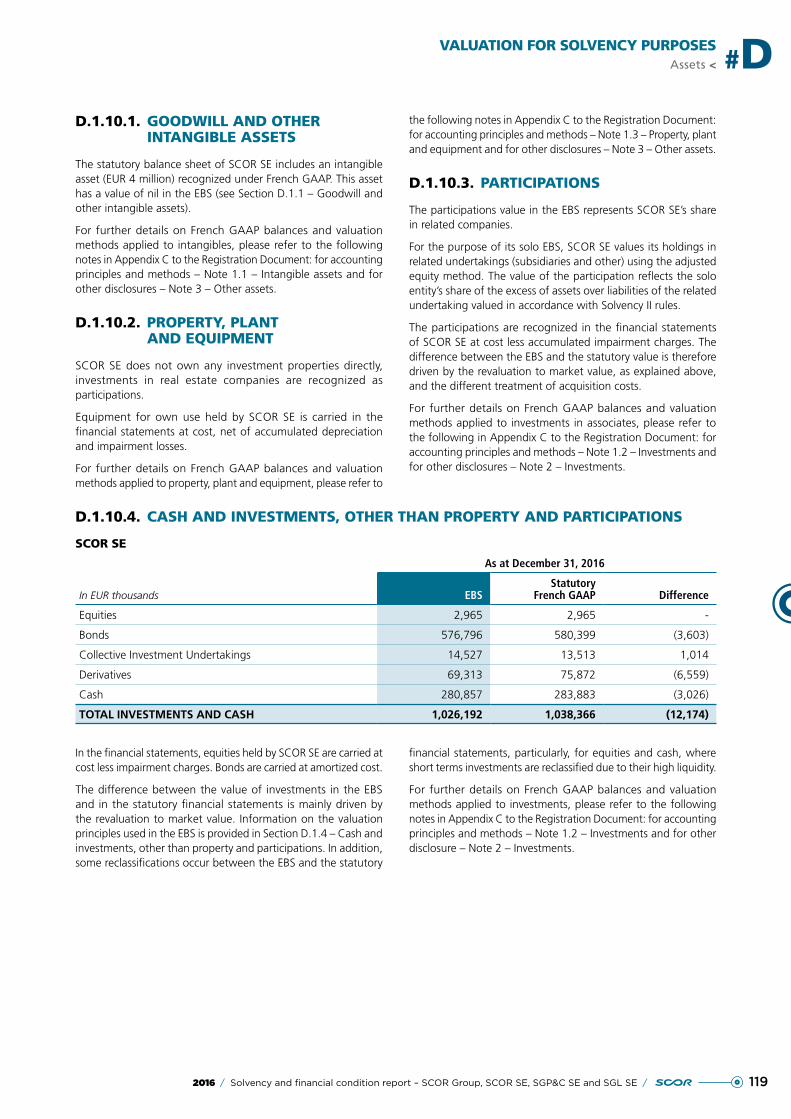
1192016 / Solvency and financial condition report – SCOR Group, SCOR SE, SGP&C SE and SGL SE /
VALUATION FOR SOLVENCY PURPOSESAssets < #D
D.1.10.1. GOODWILL AND OTHER INTANGIBLE ASSETS
The statutory balance sheet of SCOR SE includes an intangible asset (EUR 4 million) recognized under French GAAP. This asset has a value of nil in the EBS (see Section D.1.1 – Goodwill and other intangible assets).
For further details on French GAAP balances and valuation methods applied to intangibles, please refer to the following notes in Appendix C to the Registration Document: for accounting principles and methods – Note 1.1 – Intangible assets and for other disclosures – Note 3 – Other assets.
D.1.10.2. PROPERTY, PLANT AND EQUIPMENT
SCOR SE does not own any investment properties directly, investments in real estate companies are recognized as participations.
Equipment for own use held by SCOR SE is carried in the financial statements at cost, net of accumulated depreciation and impairment losses.
For further details on French GAAP balances and valuation methods applied to property, plant and equipment, please refer to
the following notes in Appendix C to the Registration Document: for accounting principles and methods – Note 1.3 – Property, plant and equipment and for other disclosures – Note 3 – Other assets.
D.1.10.3. PARTICIPATIONS
The participations value in the EBS represents SCOR SE’s share in related companies.
For the purpose of its solo EBS, SCOR SE values its holdings in related undertakings (subsidiaries and other) using the adjusted equity method. The value of the participation reflects the solo entity’s share of the excess of assets over liabilities of the related undertaking valued in accordance with Solvency II rules.
The participations are recognized in the financial statements of SCOR SE at cost less accumulated impairment charges. The difference between the EBS and the statutory value is therefore driven by the revaluation to market value, as explained above, and the different treatment of acquisition costs.
For further details on French GAAP balances and valuation methods applied to investments in associates, please refer to the following in Appendix C to the Registration Document: for accounting principles and methods – Note 1.2 – Investments and for other disclosures – Note 2 – Investments.
D.1.10.4. CASH AND INVESTMENTS, OTHER THAN PROPERTY AND PARTICIPATIONS
SCOR SE
In EUR thousands
As at December 31, 2016
EBSStatutory
French GAAP Difference
Equities 2,965 2,965 -
Bonds 576,796 580,399 (3,603)
Collective Investment Undertakings 14,527 13,513 1,014
Derivatives 69,313 75,872 (6,559)
Cash 280,857 283,883 (3,026)
TOTAL INVESTMENTS AND CASH 1,026,192 1,038,366 (12,174)
In the financial statements, equities held by SCOR SE are carried at cost less impairment charges. Bonds are carried at amortized cost.
The difference between the value of investments in the EBS and in the statutory financial statements is mainly driven by the revaluation to market value. Information on the valuation principles used in the EBS is provided in Section D.1.4 – Cash and investments, other than property and participations. In addition, some reclassifications occur between the EBS and the statutory
financial statements, particularly, for equities and cash, where short terms investments are reclassified due to their high liquidity.
For further details on French GAAP balances and valuation methods applied to investments, please refer to the following notes in Appendix C to the Registration Document: for accounting principles and methods – Note 1.2 – Investments and for other disclosure – Note 2 – Investments.
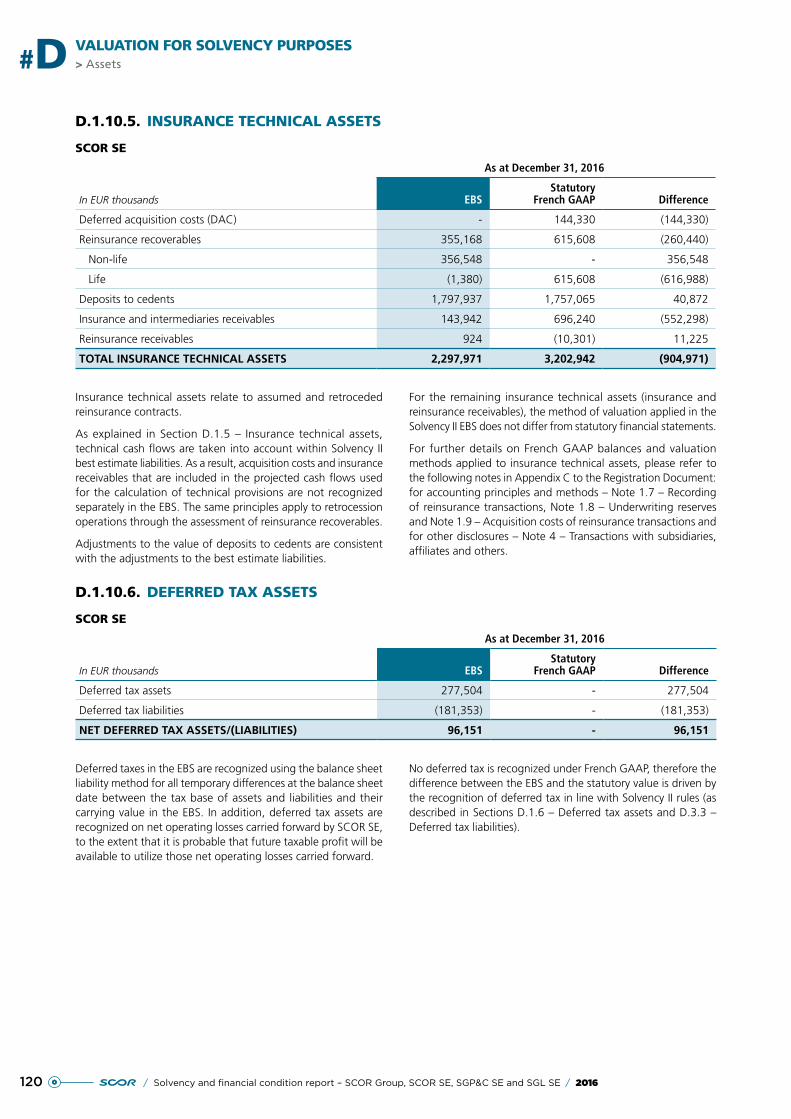
120 / Solvency and financial condition report – SCOR Group, SCOR SE, SGP&C SE and SGL SE / 2016
> Assets#D VALUATION FOR SOLVENCY PURPOSES
D.1.10.5. INSURANCE TECHNICAL ASSETS
SCOR SE
In EUR thousands
As at December 31, 2016
EBSStatutory
French GAAP Difference
Deferred acquisition costs (DAC) - 144,330 (144,330)
Reinsurance recoverables 355,168 615,608 (260,440)
Non-life 356,548 - 356,548
Life (1,380) 615,608 (616,988)
Deposits to cedents 1,797,937 1,757,065 40,872
Insurance and intermediaries receivables 143,942 696,240 (552,298)
Reinsurance receivables 924 (10,301) 11,225
TOTAL INSURANCE TECHNICAL ASSETS 2,297,971 3,202,942 (904,971)
Insurance technical assets relate to assumed and retroceded reinsurance contracts.
As explained in Section D.1.5 – Insurance technical assets, technical cash flows are taken into account within Solvency II best estimate liabilities. As a result, acquisition costs and insurance receivables that are included in the projected cash flows used for the calculation of technical provisions are not recognized separately in the EBS. The same principles apply to retrocession operations through the assessment of reinsurance recoverables.
Adjustments to the value of deposits to cedents are consistent with the adjustments to the best estimate liabilities.
For the remaining insurance technical assets (insurance and reinsurance receivables), the method of valuation applied in the Solvency II EBS does not differ from statutory financial statements.
For further details on French GAAP balances and valuation methods applied to insurance technical assets, please refer to the following notes in Appendix C to the Registration Document: for accounting principles and methods – Note 1.7 – Recording of reinsurance transactions, Note 1.8 – Underwriting reserves and Note 1.9 – Acquisition costs of reinsurance transactions and for other disclosures – Note 4 – Transactions with subsidiaries, affiliates and others.
D.1.10.6. DEFERRED TAX ASSETS
SCOR SE
In EUR thousands
As at December 31, 2016
EBSStatutory
French GAAP Difference
Deferred tax assets 277,504 - 277,504
Deferred tax liabilities (181,353) - (181,353)
NET DEFERRED TAX ASSETS/(LIABILITIES) 96,151 - 96,151
Deferred taxes in the EBS are recognized using the balance sheet liability method for all temporary differences at the balance sheet date between the tax base of assets and liabilities and their carrying value in the EBS. In addition, deferred tax assets are recognized on net operating losses carried forward by SCOR SE, to the extent that it is probable that future taxable profit will be available to utilize those net operating losses carried forward.
No deferred tax is recognized under French GAAP, therefore the difference between the EBS and the statutory value is driven by the recognition of deferred tax in line with Solvency II rules (as described in Sections D.1.6 – Deferred tax assets and D.3.3 – Deferred tax liabilities).
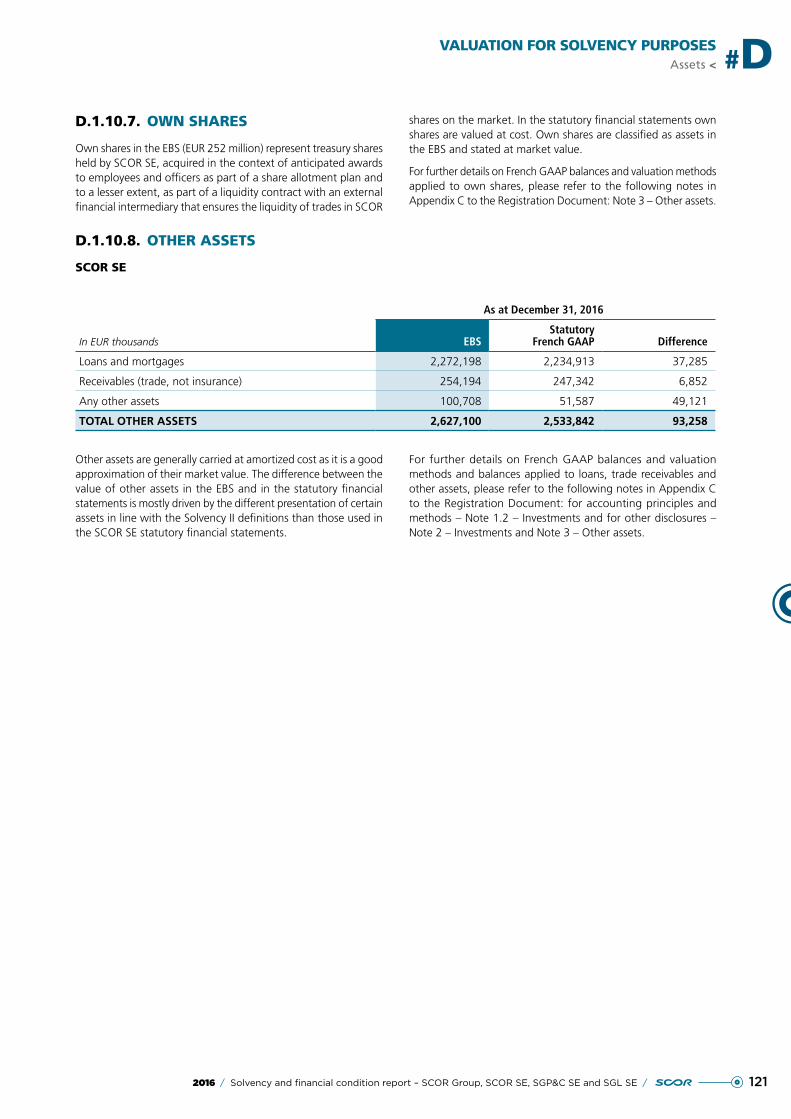
1212016 / Solvency and financial condition report – SCOR Group, SCOR SE, SGP&C SE and SGL SE /
VALUATION FOR SOLVENCY PURPOSESAssets < #D
D.1.10.7. OWN SHARES
Own shares in the EBS (EUR 252 million) represent treasury shares held by SCOR SE, acquired in the context of anticipated awards to employees and officers as part of a share allotment plan and to a lesser extent, as part of a liquidity contract with an external financial intermediary that ensures the liquidity of trades in SCOR
shares on the market. In the statutory financial statements own shares are valued at cost. Own shares are classified as assets in the EBS and stated at market value.
For further details on French GAAP balances and valuation methods applied to own shares, please refer to the following notes in Appendix C to the Registration Document: Note 3 – Other assets.
D.1.10.8. OTHER ASSETS
SCOR SE
In EUR thousands
As at December 31, 2016
EBSStatutory
French GAAP Difference
Loans and mortgages 2,272,198 2,234,913 37,285
Receivables (trade, not insurance) 254,194 247,342 6,852
Any other assets 100,708 51,587 49,121
TOTAL OTHER ASSETS 2,627,100 2,533,842 93,258
Other assets are generally carried at amortized cost as it is a good approximation of their market value. The difference between the value of other assets in the EBS and in the statutory financial statements is mostly driven by the different presentation of certain assets in line with the Solvency II definitions than those used in the SCOR SE statutory financial statements.
For further details on French GAAP balances and valuation methods and balances applied to loans, trade receivables and other assets, please refer to the following notes in Appendix C to the Registration Document: for accounting principles and methods – Note 1.2 – Investments and for other disclosures – Note 2 – Investments and Note 3 – Other assets.
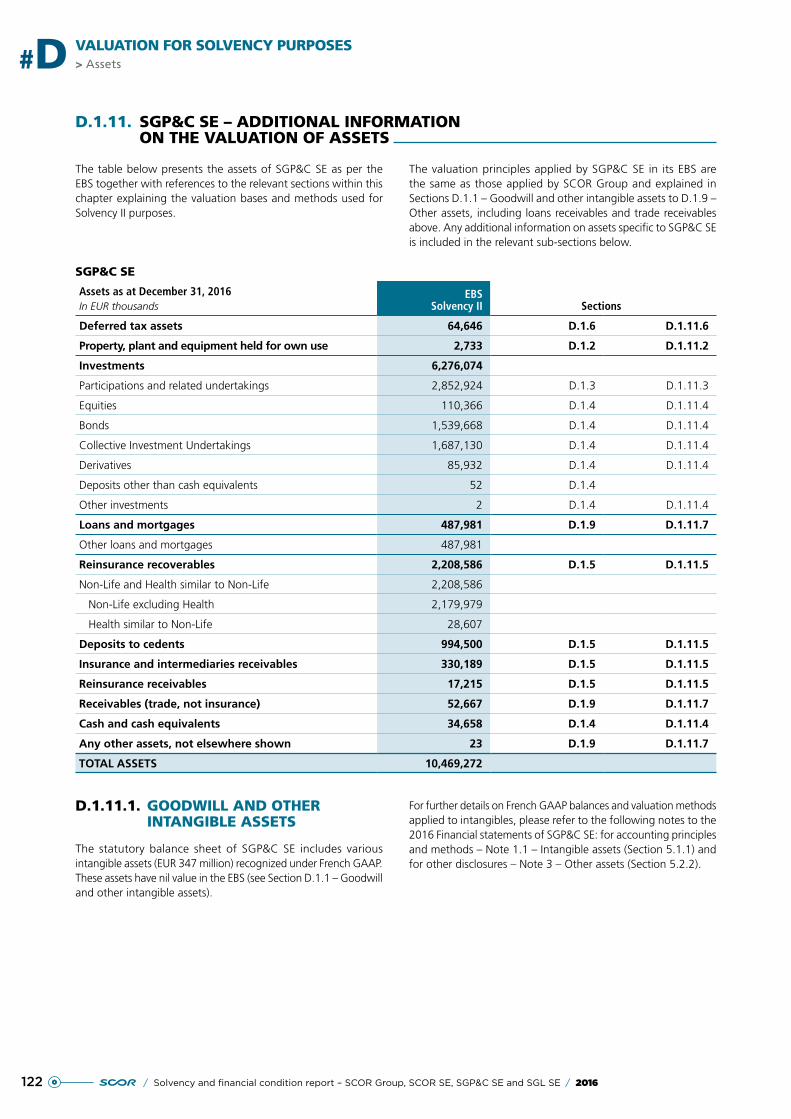
122 / Solvency and financial condition report – SCOR Group, SCOR SE, SGP&C SE and SGL SE / 2016
> Assets#D VALUATION FOR SOLVENCY PURPOSES
D.1.11. SGP&C SE – ADDITIONAL INFORMATION ON THE VALUATION OF ASSETS
The table below presents the assets of SGP&C SE as per the EBS together with references to the relevant sections within this chapter explaining the valuation bases and methods used for Solvency II purposes.
The valuation principles applied by SGP&C SE in its EBS are the same as those applied by SCOR Group and explained in Sections D.1.1 – Goodwill and other intangible assets to D.1.9 – Other assets, including loans receivables and trade receivables above. Any additional information on assets specific to SGP&C SE is included in the relevant sub-sections below.
SGP&C SE
Assets as at December 31, 2016In EUR thousands
EBSSolvency II Sections
Deferred tax assets 64,646 D.1.6 D.1.11.6
Property, plant and equipment held for own use 2,733 D.1.2 D.1.11.2
Investments 6,276,074
Participations and related undertakings 2,852,924 D.1.3 D.1.11.3
Equities 110,366 D.1.4 D.1.11.4
Bonds 1,539,668 D.1.4 D.1.11.4
Collective Investment Undertakings 1,687,130 D.1.4 D.1.11.4
Derivatives 85,932 D.1.4 D.1.11.4
Deposits other than cash equivalents 52 D.1.4
Other investments 2 D.1.4 D.1.11.4
Loans and mortgages 487,981 D.1.9 D.1.11.7
Other loans and mortgages 487,981
Reinsurance recoverables 2,208,586 D.1.5 D.1.11.5
Non-Life and Health similar to Non-Life 2,208,586
Non-Life excluding Health 2,179,979
Health similar to Non-Life 28,607
Deposits to cedents 994,500 D.1.5 D.1.11.5
Insurance and intermediaries receivables 330,189 D.1.5 D.1.11.5
Reinsurance receivables 17,215 D.1.5 D.1.11.5
Receivables (trade, not insurance) 52,667 D.1.9 D.1.11.7
Cash and cash equivalents 34,658 D.1.4 D.1.11.4
Any other assets, not elsewhere shown 23 D.1.9 D.1.11.7
TOTAL ASSETS 10,469,272
D.1.11.1. GOODWILL AND OTHER INTANGIBLE ASSETS
The statutory balance sheet of SGP&C SE includes various intangible assets (EUR 347 million) recognized under French GAAP. These assets have nil value in the EBS (see Section D.1.1 – Goodwill and other intangible assets).
For further details on French GAAP balances and valuation methods applied to intangibles, please refer to the following notes to the 2016 Financial statements of SGP&C SE: for accounting principles and methods – Note 1.1 – Intangible assets (Section 5.1.1) and for other disclosures – Note 3 – Other assets (Section 5.2.2).
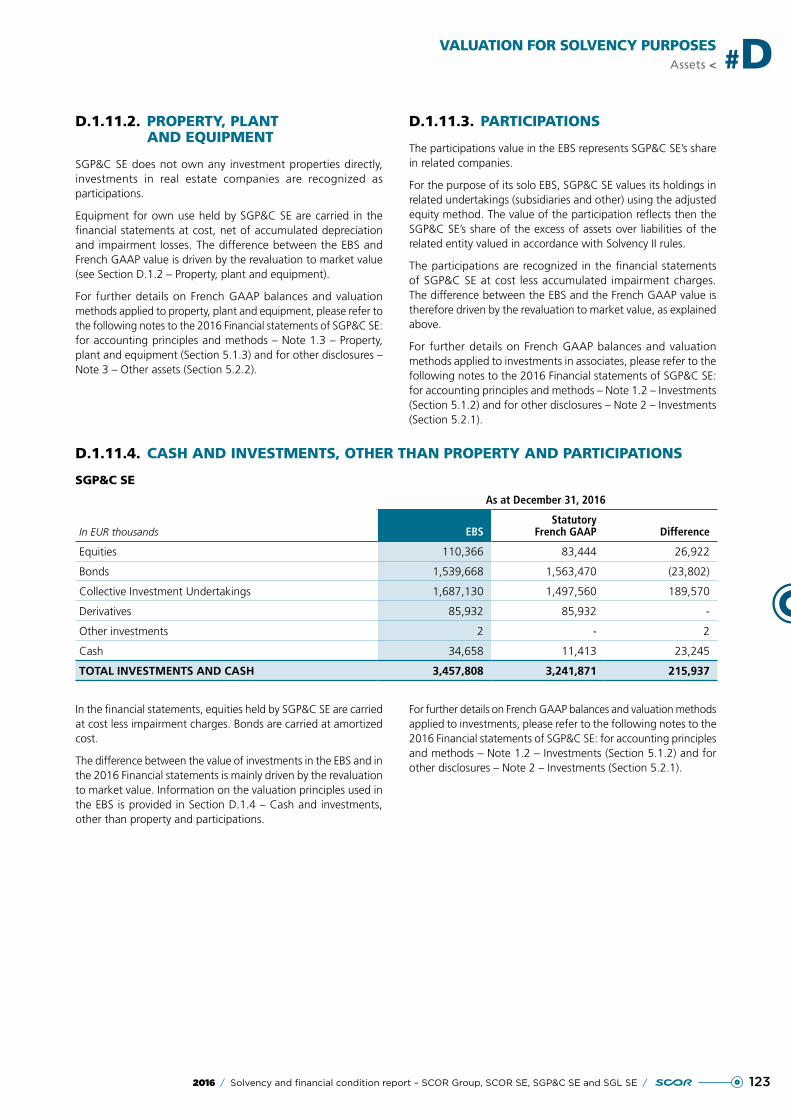
1232016 / Solvency and financial condition report – SCOR Group, SCOR SE, SGP&C SE and SGL SE /
VALUATION FOR SOLVENCY PURPOSESAssets < #D
D.1.11.2. PROPERTY, PLANT AND EQUIPMENT
SGP&C SE does not own any investment properties directly, investments in real estate companies are recognized as participations.
Equipment for own use held by SGP&C SE are carried in the financial statements at cost, net of accumulated depreciation and impairment losses. The difference between the EBS and French GAAP value is driven by the revaluation to market value (see Section D.1.2 – Property, plant and equipment).
For further details on French GAAP balances and valuation methods applied to property, plant and equipment, please refer to the following notes to the 2016 Financial statements of SGP&C SE: for accounting principles and methods – Note 1.3 – Property, plant and equipment (Section 5.1.3) and for other disclosures – Note 3 – Other assets (Section 5.2.2).
D.1.11.3. PARTICIPATIONS
The participations value in the EBS represents SGP&C SE’s share in related companies.
For the purpose of its solo EBS, SGP&C SE values its holdings in related undertakings (subsidiaries and other) using the adjusted equity method. The value of the participation reflects then the SGP&C SE’s share of the excess of assets over liabilities of the related entity valued in accordance with Solvency II rules.
The participations are recognized in the financial statements of SGP&C SE at cost less accumulated impairment charges. The difference between the EBS and the French GAAP value is therefore driven by the revaluation to market value, as explained above.
For further details on French GAAP balances and valuation methods applied to investments in associates, please refer to the following notes to the 2016 Financial statements of SGP&C SE: for accounting principles and methods – Note 1.2 – Investments (Section 5.1.2) and for other disclosures – Note 2 – Investments (Section 5.2.1).
D.1.11.4. CASH AND INVESTMENTS, OTHER THAN PROPERTY AND PARTICIPATIONS
SGP&C SE
In EUR thousands
As at December 31, 2016
EBSStatutory
French GAAP Difference
Equities 110,366 83,444 26,922
Bonds 1,539,668 1,563,470 (23,802)
Collective Investment Undertakings 1,687,130 1,497,560 189,570
Derivatives 85,932 85,932 -
Other investments 2 - 2
Cash 34,658 11,413 23,245
TOTAL INVESTMENTS AND CASH 3,457,808 3,241,871 215,937
In the financial statements, equities held by SGP&C SE are carried at cost less impairment charges. Bonds are carried at amortized cost.
The difference between the value of investments in the EBS and in the 2016 Financial statements is mainly driven by the revaluation to market value. Information on the valuation principles used in the EBS is provided in Section D.1.4 – Cash and investments, other than property and participations.
For further details on French GAAP balances and valuation methods applied to investments, please refer to the following notes to the 2016 Financial statements of SGP&C SE: for accounting principles and methods – Note 1.2 – Investments (Section 5.1.2) and for other disclosures – Note 2 – Investments (Section 5.2.1).
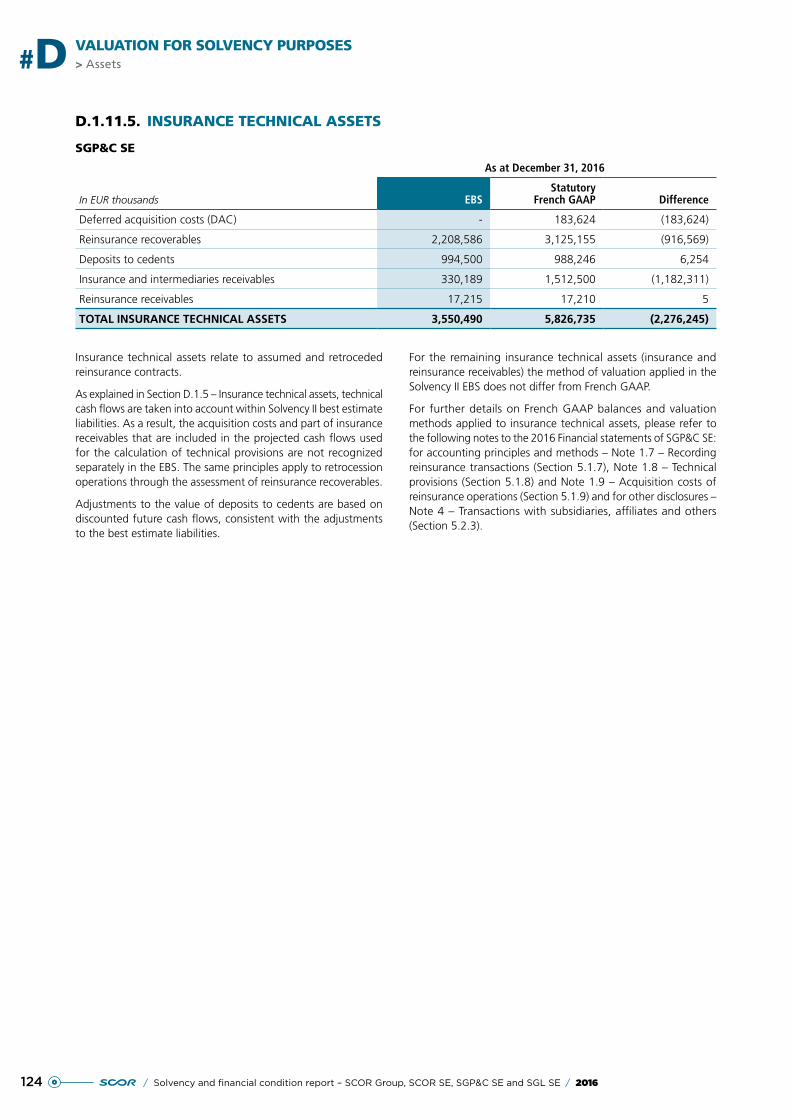
124 / Solvency and financial condition report – SCOR Group, SCOR SE, SGP&C SE and SGL SE / 2016
> Assets#D VALUATION FOR SOLVENCY PURPOSES
D.1.11.5. INSURANCE TECHNICAL ASSETS
SGP&C SE
In EUR thousands
As at December 31, 2016
EBSStatutory
French GAAP Difference
Deferred acquisition costs (DAC) - 183,624 (183,624)
Reinsurance recoverables 2,208,586 3,125,155 (916,569)
Deposits to cedents 994,500 988,246 6,254
Insurance and intermediaries receivables 330,189 1,512,500 (1,182,311)
Reinsurance receivables 17,215 17,210 5
TOTAL INSURANCE TECHNICAL ASSETS 3,550,490 5,826,735 (2,276,245)
Insurance technical assets relate to assumed and retroceded reinsurance contracts.
As explained in Section D.1.5 – Insurance technical assets, technical cash flows are taken into account within Solvency II best estimate liabilities. As a result, the acquisition costs and part of insurance receivables that are included in the projected cash flows used for the calculation of technical provisions are not recognized separately in the EBS. The same principles apply to retrocession operations through the assessment of reinsurance recoverables.
Adjustments to the value of deposits to cedents are based on discounted future cash flows, consistent with the adjustments to the best estimate liabilities.
For the remaining insurance technical assets (insurance and reinsurance receivables) the method of valuation applied in the Solvency II EBS does not differ from French GAAP.
For further details on French GAAP balances and valuation methods applied to insurance technical assets, please refer to the following notes to the 2016 Financial statements of SGP&C SE: for accounting principles and methods – Note 1.7 – Recording reinsurance transactions (Section 5.1.7), Note 1.8 – Technical provisions (Section 5.1.8) and Note 1.9 – Acquisition costs of reinsurance operations (Section 5.1.9) and for other disclosures – Note 4 – Transactions with subsidiaries, affiliates and others (Section 5.2.3).
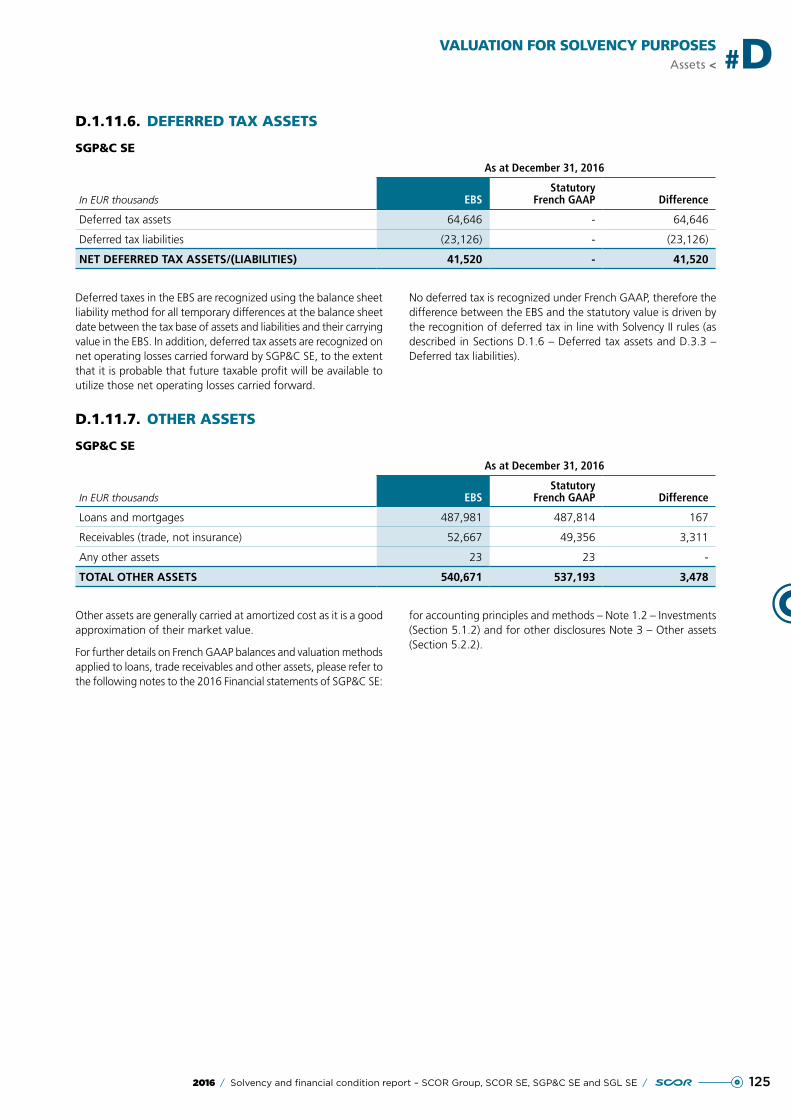
1252016 / Solvency and financial condition report – SCOR Group, SCOR SE, SGP&C SE and SGL SE /
VALUATION FOR SOLVENCY PURPOSESAssets < #D
D.1.11.6. DEFERRED TAX ASSETS
SGP&C SE
In EUR thousands
As at December 31, 2016
EBSStatutory
French GAAP Difference
Deferred tax assets 64,646 - 64,646
Deferred tax liabilities (23,126) - (23,126)
NET DEFERRED TAX ASSETS/(LIABILITIES) 41,520 - 41,520
Deferred taxes in the EBS are recognized using the balance sheet liability method for all temporary differences at the balance sheet date between the tax base of assets and liabilities and their carrying value in the EBS. In addition, deferred tax assets are recognized on net operating losses carried forward by SGP&C SE, to the extent that it is probable that future taxable profit will be available to utilize those net operating losses carried forward.
No deferred tax is recognized under French GAAP, therefore the difference between the EBS and the statutory value is driven by the recognition of deferred tax in line with Solvency II rules (as described in Sections D.1.6 – Deferred tax assets and D.3.3 – Deferred tax liabilities).
D.1.11.7. OTHER ASSETS
SGP&C SE
In EUR thousands
As at December 31, 2016
EBSStatutory
French GAAP Difference
Loans and mortgages 487,981 487,814 167
Receivables (trade, not insurance) 52,667 49,356 3,311
Any other assets 23 23 -
TOTAL OTHER ASSETS 540,671 537,193 3,478
Other assets are generally carried at amortized cost as it is a good approximation of their market value.
For further details on French GAAP balances and valuation methods applied to loans, trade receivables and other assets, please refer to the following notes to the 2016 Financial statements of SGP&C SE:
for accounting principles and methods – Note 1.2 – Investments (Section 5.1.2) and for other disclosures Note 3 – Other assets (Section 5.2.2).
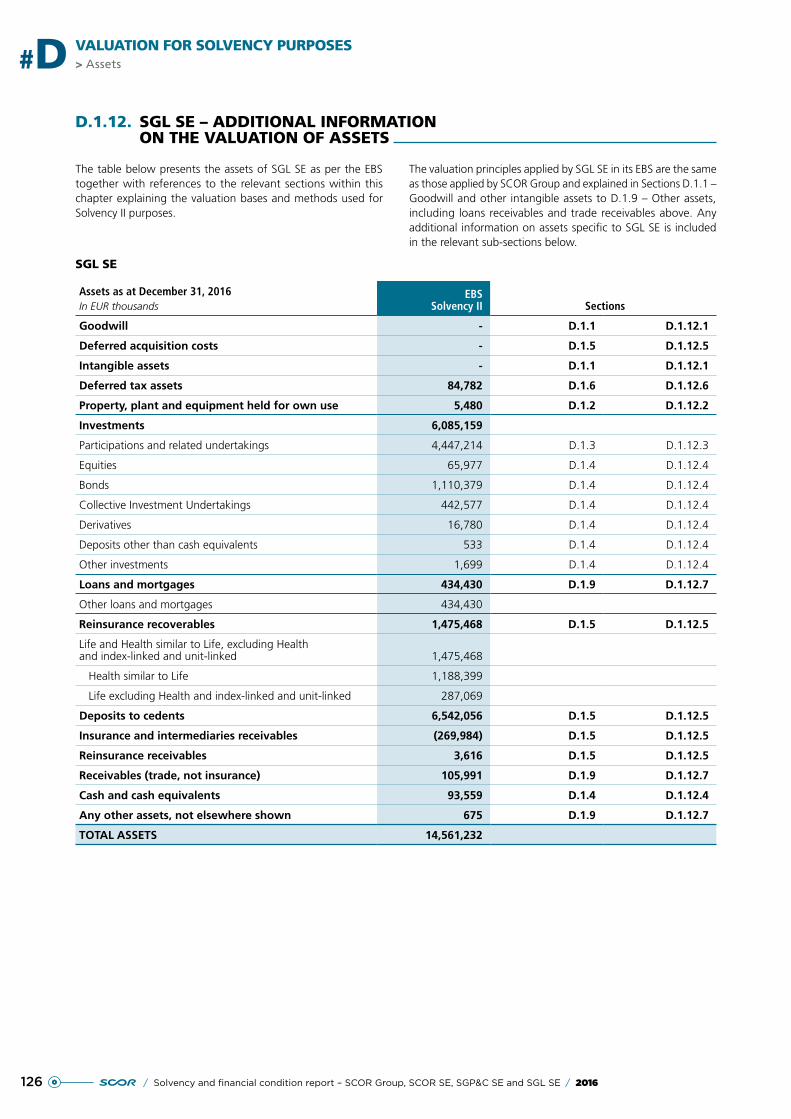
126 / Solvency and financial condition report – SCOR Group, SCOR SE, SGP&C SE and SGL SE / 2016
> Assets#D VALUATION FOR SOLVENCY PURPOSES
D.1.12. SGL SE – ADDITIONAL INFORMATION ON THE VALUATION OF ASSETS
The table below presents the assets of SGL SE as per the EBS together with references to the relevant sections within this chapter explaining the valuation bases and methods used for Solvency II purposes.
The valuation principles applied by SGL SE in its EBS are the same as those applied by SCOR Group and explained in Sections D.1.1 – Goodwill and other intangible assets to D.1.9 – Other assets, including loans receivables and trade receivables above. Any additional information on assets specific to SGL SE is included in the relevant sub-sections below.
SGL SE
Assets as at December 31, 2016In EUR thousands
EBSSolvency II Sections
Goodwill - D.1.1 D.1.12.1
Deferred acquisition costs - D.1.5 D.1.12.5
Intangible assets - D.1.1 D.1.12.1
Deferred tax assets 84,782 D.1.6 D.1.12.6
Property, plant and equipment held for own use 5,480 D.1.2 D.1.12.2
Investments 6,085,159
Participations and related undertakings 4,447,214 D.1.3 D.1.12.3
Equities 65,977 D.1.4 D.1.12.4
Bonds 1,110,379 D.1.4 D.1.12.4
Collective Investment Undertakings 442,577 D.1.4 D.1.12.4
Derivatives 16,780 D.1.4 D.1.12.4
Deposits other than cash equivalents 533 D.1.4 D.1.12.4
Other investments 1,699 D.1.4 D.1.12.4
Loans and mortgages 434,430 D.1.9 D.1.12.7
Other loans and mortgages 434,430
Reinsurance recoverables 1,475,468 D.1.5 D.1.12.5
Life and Health similar to Life, excluding Health and index-linked and unit-linked 1,475,468
Health similar to Life 1,188,399
Life excluding Health and index-linked and unit-linked 287,069
Deposits to cedents 6,542,056 D.1.5 D.1.12.5
Insurance and intermediaries receivables (269,984) D.1.5 D.1.12.5
Reinsurance receivables 3,616 D.1.5 D.1.12.5
Receivables (trade, not insurance) 105,991 D.1.9 D.1.12.7
Cash and cash equivalents 93,559 D.1.4 D.1.12.4
Any other assets, not elsewhere shown 675 D.1.9 D.1.12.7
TOTAL ASSETS 14,561,232
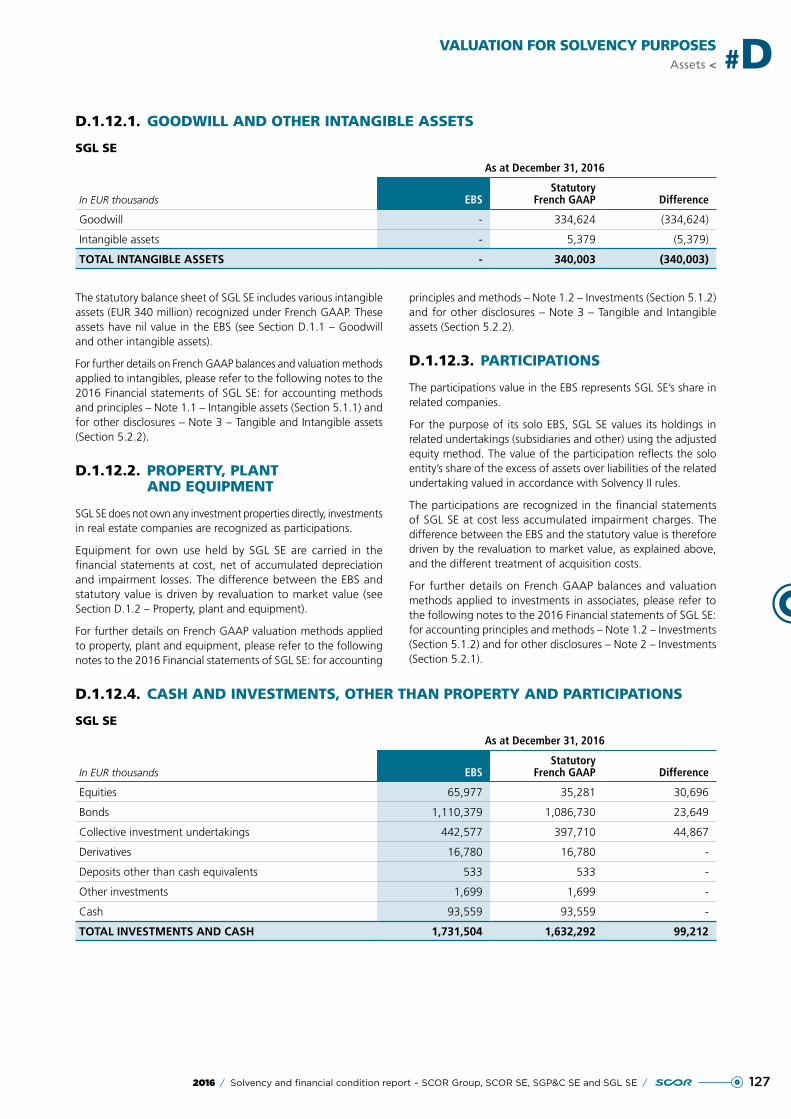
1272016 / Solvency and financial condition report – SCOR Group, SCOR SE, SGP&C SE and SGL SE /
VALUATION FOR SOLVENCY PURPOSESAssets < #D
D.1.12.1. GOODWILL AND OTHER INTANGIBLE ASSETS
SGL SE
In EUR thousands
As at December 31, 2016
EBSStatutory
French GAAP Difference
Goodwill - 334,624 (334,624)
Intangible assets - 5,379 (5,379)
TOTAL INTANGIBLE ASSETS - 340,003 (340,003)
The statutory balance sheet of SGL SE includes various intangible assets (EUR 340 million) recognized under French GAAP. These assets have nil value in the EBS (see Section D.1.1 – Goodwill and other intangible assets).
For further details on French GAAP balances and valuation methods applied to intangibles, please refer to the following notes to the 2016 Financial statements of SGL SE: for accounting methods and principles – Note 1.1 – Intangible assets (Section 5.1.1) and for other disclosures – Note 3 – Tangible and Intangible assets (Section 5.2.2).
D.1.12.2. PROPERTY, PLANT AND EQUIPMENT
SGL SE does not own any investment properties directly, investments in real estate companies are recognized as participations.
Equipment for own use held by SGL SE are carried in the financial statements at cost, net of accumulated depreciation and impairment losses. The difference between the EBS and statutory value is driven by revaluation to market value (see Section D.1.2 – Property, plant and equipment).
For further details on French GAAP valuation methods applied to property, plant and equipment, please refer to the following notes to the 2016 Financial statements of SGL SE: for accounting
principles and methods – Note 1.2 – Investments (Section 5.1.2) and for other disclosures – Note 3 – Tangible and Intangible assets (Section 5.2.2).
D.1.12.3. PARTICIPATIONS
The participations value in the EBS represents SGL SE’s share in related companies.
For the purpose of its solo EBS, SGL SE values its holdings in related undertakings (subsidiaries and other) using the adjusted equity method. The value of the participation reflects the solo entity’s share of the excess of assets over liabilities of the related undertaking valued in accordance with Solvency II rules.
The participations are recognized in the financial statements of SGL SE at cost less accumulated impairment charges. The difference between the EBS and the statutory value is therefore driven by the revaluation to market value, as explained above, and the different treatment of acquisition costs.
For further details on French GAAP balances and valuation methods applied to investments in associates, please refer to the following notes to the 2016 Financial statements of SGL SE: for accounting principles and methods – Note 1.2 – Investments (Section 5.1.2) and for other disclosures – Note 2 – Investments (Section 5.2.1).
D.1.12.4. CASH AND INVESTMENTS, OTHER THAN PROPERTY AND PARTICIPATIONS
SGL SE
In EUR thousands
As at December 31, 2016
EBSStatutory
French GAAP Difference
Equities 65,977 35,281 30,696
Bonds 1,110,379 1,086,730 23,649
Collective investment undertakings 442,577 397,710 44,867
Derivatives 16,780 16,780 -
Deposits other than cash equivalents 533 533 -
Other investments 1,699 1,699 -
Cash 93,559 93,559 -
TOTAL INVESTMENTS AND CASH 1,731,504 1,632,292 99,212
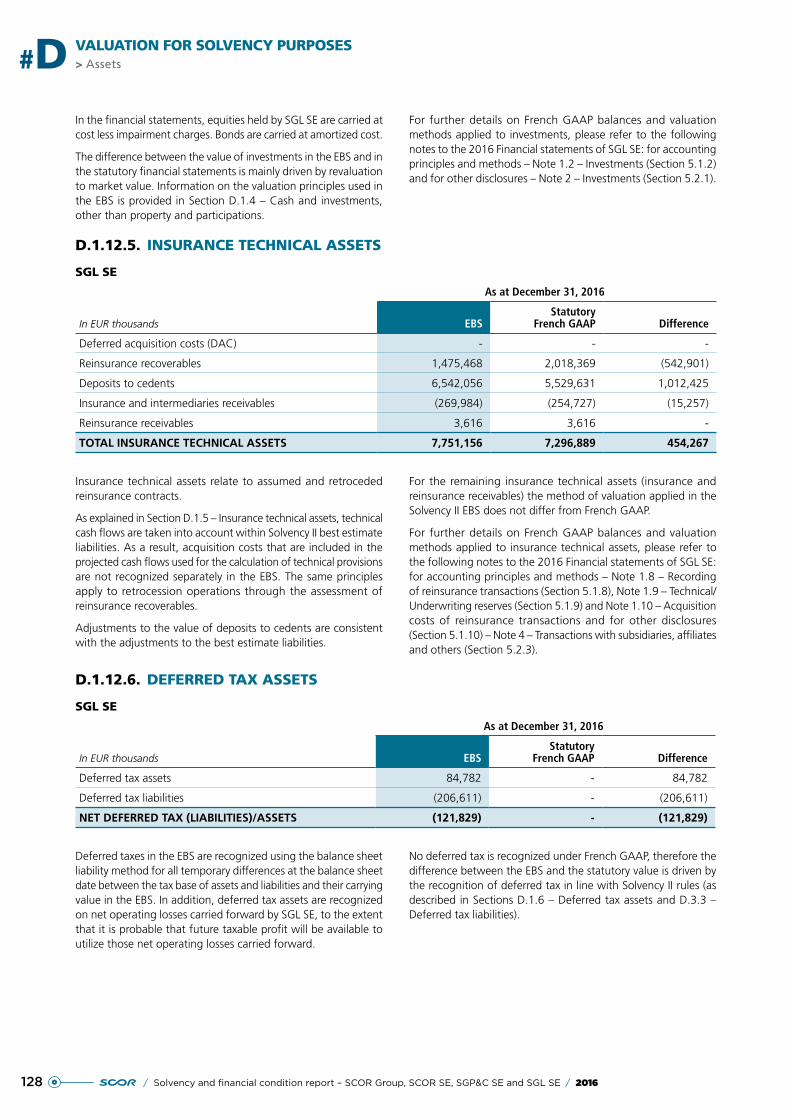
128 / Solvency and financial condition report – SCOR Group, SCOR SE, SGP&C SE and SGL SE / 2016
> Assets#D VALUATION FOR SOLVENCY PURPOSES
In the financial statements, equities held by SGL SE are carried at cost less impairment charges. Bonds are carried at amortized cost.
The difference between the value of investments in the EBS and in the statutory financial statements is mainly driven by revaluation to market value. Information on the valuation principles used in the EBS is provided in Section D.1.4 – Cash and investments, other than property and participations.
For further details on French GAAP balances and valuation methods applied to investments, please refer to the following notes to the 2016 Financial statements of SGL SE: for accounting principles and methods – Note 1.2 – Investments (Section 5.1.2) and for other disclosures – Note 2 – Investments (Section 5.2.1).
D.1.12.5. INSURANCE TECHNICAL ASSETS
SGL SE
In EUR thousands
As at December 31, 2016
EBSStatutory
French GAAP Difference
Deferred acquisition costs (DAC) - - -
Reinsurance recoverables 1,475,468 2,018,369 (542,901)
Deposits to cedents 6,542,056 5,529,631 1,012,425
Insurance and intermediaries receivables (269,984) (254,727) (15,257)
Reinsurance receivables 3,616 3,616 -
TOTAL INSURANCE TECHNICAL ASSETS 7,751,156 7,296,889 454,267
Insurance technical assets relate to assumed and retroceded reinsurance contracts.
As explained in Section D.1.5 – Insurance technical assets, technical cash flows are taken into account within Solvency II best estimate liabilities. As a result, acquisition costs that are included in the projected cash flows used for the calculation of technical provisions are not recognized separately in the EBS. The same principles apply to retrocession operations through the assessment of reinsurance recoverables.
Adjustments to the value of deposits to cedents are consistent with the adjustments to the best estimate liabilities.
For the remaining insurance technical assets (insurance and reinsurance receivables) the method of valuation applied in the Solvency II EBS does not differ from French GAAP.
For further details on French GAAP balances and valuation methods applied to insurance technical assets, please refer to the following notes to the 2016 Financial statements of SGL SE: for accounting principles and methods – Note 1.8 – Recording of reinsurance transactions (Section 5.1.8), Note 1.9 – Technical/Underwriting reserves (Section 5.1.9) and Note 1.10 – Acquisition costs of reinsurance transactions and for other disclosures (Section 5.1.10) – Note 4 – Transactions with subsidiaries, affiliates and others (Section 5.2.3).
D.1.12.6. DEFERRED TAX ASSETS
SGL SE
In EUR thousands
As at December 31, 2016
EBSStatutory
French GAAP Difference
Deferred tax assets 84,782 - 84,782
Deferred tax liabilities (206,611) - (206,611)
NET DEFERRED TAX (LIABILITIES)/ASSETS (121,829) - (121,829)
Deferred taxes in the EBS are recognized using the balance sheet liability method for all temporary differences at the balance sheet date between the tax base of assets and liabilities and their carrying value in the EBS. In addition, deferred tax assets are recognized on net operating losses carried forward by SGL SE, to the extent that it is probable that future taxable profit will be available to utilize those net operating losses carried forward.
No deferred tax is recognized under French GAAP, therefore the difference between the EBS and the statutory value is driven by the recognition of deferred tax in line with Solvency II rules (as described in Sections D.1.6 – Deferred tax assets and D.3.3 – Deferred tax liabilities).
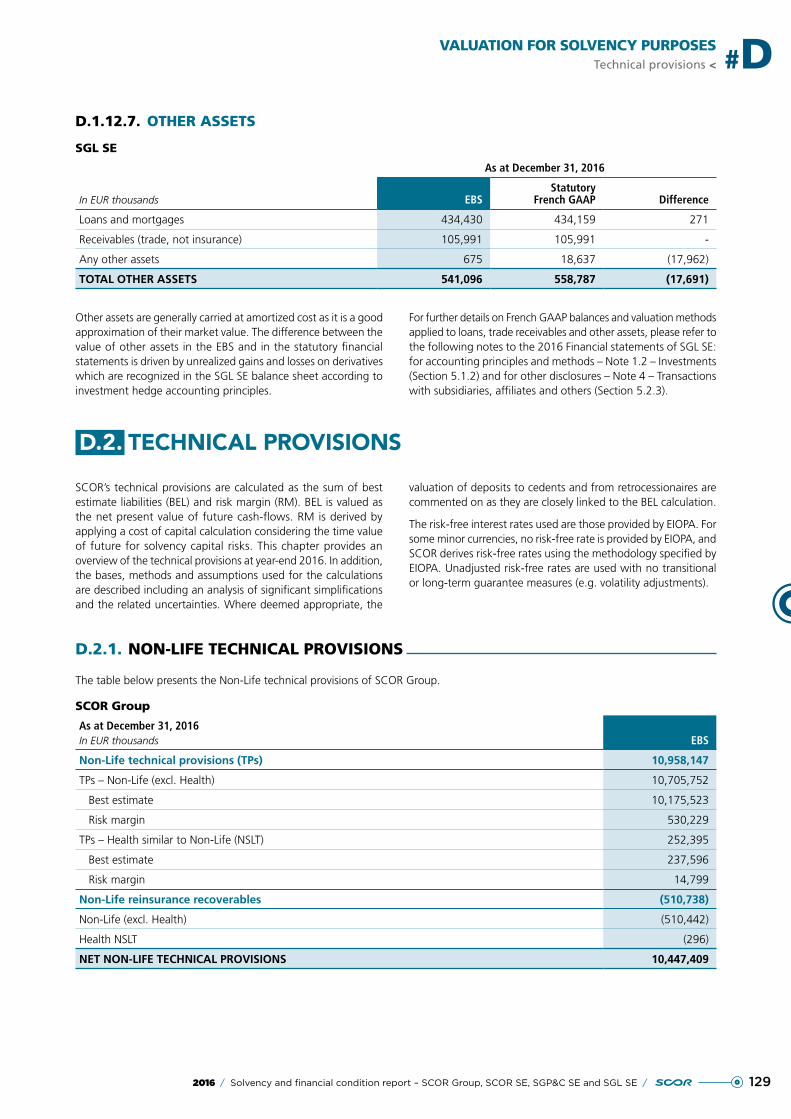
1292016 / Solvency and financial condition report – SCOR Group, SCOR SE, SGP&C SE and SGL SE /
VALUATION FOR SOLVENCY PURPOSESTechnical provisions < #D
D.1.12.7. OTHER ASSETS
SGL SE
In EUR thousands
As at December 31, 2016
EBSStatutory
French GAAP Difference
Loans and mortgages 434,430 434,159 271
Receivables (trade, not insurance) 105,991 105,991 -
Any other assets 675 18,637 (17,962)
TOTAL OTHER ASSETS 541,096 558,787 (17,691)
Other assets are generally carried at amortized cost as it is a good approximation of their market value. The difference between the value of other assets in the EBS and in the statutory financial statements is driven by unrealized gains and losses on derivatives which are recognized in the SGL SE balance sheet according to investment hedge accounting principles.
For further details on French GAAP balances and valuation methods applied to loans, trade receivables and other assets, please refer to the following notes to the 2016 Financial statements of SGL SE: for accounting principles and methods – Note 1.2 – Investments (Section 5.1.2) and for other disclosures – Note 4 – Transactions with subsidiaries, affiliates and others (Section 5.2.3).
D.2. TECHNICAL PROVISIONS
SCOR’s technical provisions are calculated as the sum of best estimate liabilities (BEL) and risk margin (RM). BEL is valued as the net present value of future cash-flows. RM is derived by applying a cost of capital calculation considering the time value of future for solvency capital risks. This chapter provides an overview of the technical provisions at year-end 2016. In addition, the bases, methods and assumptions used for the calculations are described including an analysis of significant simplifications and the related uncertainties. Where deemed appropriate, the
valuation of deposits to cedents and from retrocessionaires are commented on as they are closely linked to the BEL calculation.
The risk-free interest rates used are those provided by EIOPA. For some minor currencies, no risk-free rate is provided by EIOPA, and SCOR derives risk-free rates using the methodology specified by EIOPA. Unadjusted risk-free rates are used with no transitional or long-term guarantee measures (e.g. volatility adjustments).
D.2.1. NON-LIFE TECHNICAL PROVISIONS
The table below presents the Non-Life technical provisions of SCOR Group.
SCOR Group
As at December 31, 2016In EUR thousands EBS
Non-Life technical provisions (TPs) 10,958,147
TPs – Non-Life (excl. Health) 10,705,752
Best estimate 10,175,523
Risk margin 530,229
TPs – Health similar to Non-Life (NSLT) 252,395
Best estimate 237,596
Risk margin 14,799
Non-Life reinsurance recoverables (510,738)
Non-Life (excl. Health) (510,442)
Health NSLT (296)
NET NON-LIFE TECHNICAL PROVISIONS 10,447,409
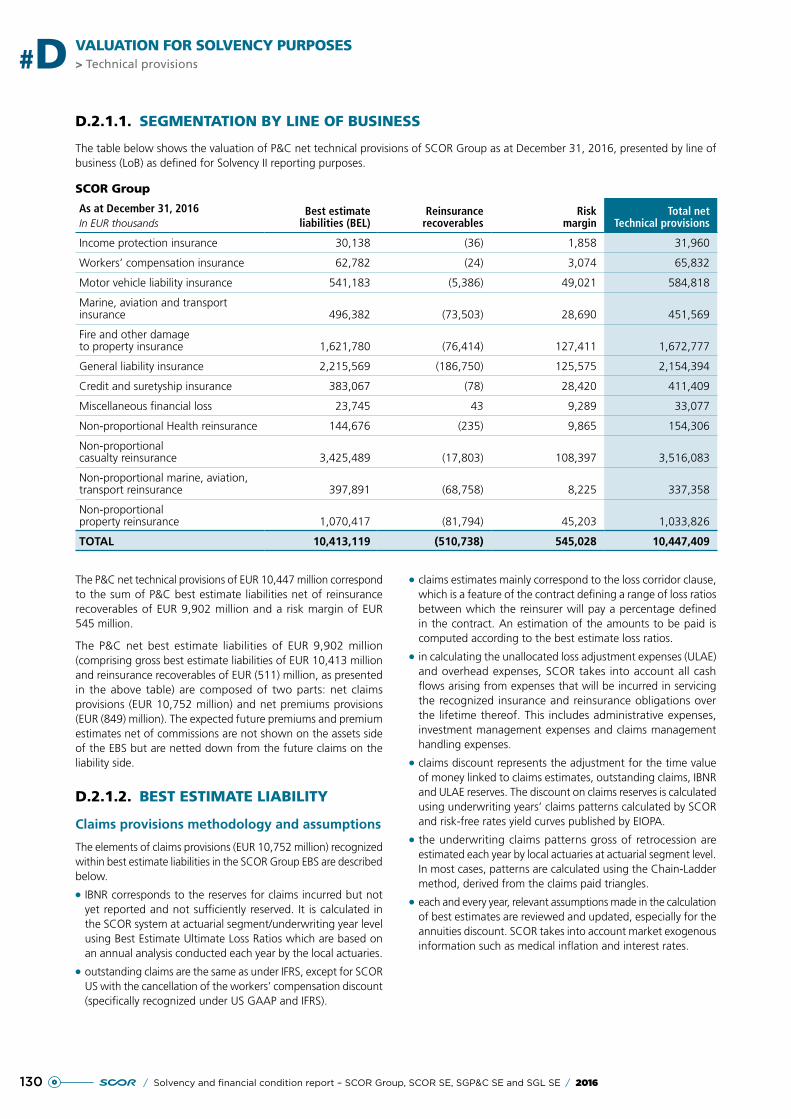
130 / Solvency and financial condition report – SCOR Group, SCOR SE, SGP&C SE and SGL SE / 2016
> Technical provisions#D VALUATION FOR SOLVENCY PURPOSES
D.2.1.1. SEGMENTATION BY LINE OF BUSINESS
The table below shows the valuation of P&C net technical provisions of SCOR Group as at December 31, 2016, presented by line of business (LoB) as defined for Solvency II reporting purposes.
SCOR Group
As at December 31, 2016In EUR thousands
Best estimate liabilities (BEL)
Reinsurance recoverables
Risk margin
Total net Technical provisions
Income protection insurance 30,138 (36) 1,858 31,960
Workers’ compensation insurance 62,782 (24) 3,074 65,832
Motor vehicle liability insurance 541,183 (5,386) 49,021 584,818
Marine, aviation and transport insurance 496,382 (73,503) 28,690 451,569
Fire and other damage to property insurance 1,621,780 (76,414) 127,411 1,672,777
General liability insurance 2,215,569 (186,750) 125,575 2,154,394
Credit and suretyship insurance 383,067 (78) 28,420 411,409
Miscellaneous financial loss 23,745 43 9,289 33,077
Non-proportional Health reinsurance 144,676 (235) 9,865 154,306
Non-proportional casualty reinsurance 3,425,489 (17,803) 108,397 3,516,083
Non-proportional marine, aviation, transport reinsurance 397,891 (68,758) 8,225 337,358
Non-proportional property reinsurance 1,070,417 (81,794) 45,203 1,033,826
TOTAL 10,413,119 (510,738) 545,028 10,447,409
The P&C net technical provisions of EUR 10,447 million correspond to the sum of P&C best estimate liabilities net of reinsurance recoverables of EUR 9,902 million and a risk margin of EUR 545 million.
The P&C net best estimate liabilities of EUR 9,902 million (comprising gross best estimate liabilities of EUR 10,413 million and reinsurance recoverables of EUR (511) million, as presented in the above table) are composed of two parts: net claims provisions (EUR 10,752 million) and net premiums provisions (EUR (849) million). The expected future premiums and premium estimates net of commissions are not shown on the assets side of the EBS but are netted down from the future claims on the liability side.
D.2.1.2. BEST ESTIMATE LIABILITY
Claims provisions methodology and assumptions
The elements of claims provisions (EUR 10,752 million) recognized within best estimate liabilities in the SCOR Group EBS are described below.
●● IBNR corresponds to the reserves for claims incurred but not yet reported and not sufficiently reserved. It is calculated in the SCOR system at actuarial segment/underwriting year level using Best Estimate Ultimate Loss Ratios which are based on an annual analysis conducted each year by the local actuaries.
●● outstanding claims are the same as under IFRS, except for SCOR US with the cancellation of the workers’ compensation discount (specifically recognized under US GAAP and IFRS).
●● claims estimates mainly correspond to the loss corridor clause, which is a feature of the contract defining a range of loss ratios between which the reinsurer will pay a percentage defined in the contract. An estimation of the amounts to be paid is computed according to the best estimate loss ratios.
●● in calculating the unallocated loss adjustment expenses (ULAE) and overhead expenses, SCOR takes into account all cash flows arising from expenses that will be incurred in servicing the recognized insurance and reinsurance obligations over the lifetime thereof. This includes administrative expenses, investment management expenses and claims management handling expenses.
●● claims discount represents the adjustment for the time value of money linked to claims estimates, outstanding claims, IBNR and ULAE reserves. The discount on claims reserves is calculated using underwriting years’ claims patterns calculated by SCOR and risk-free rates yield curves published by EIOPA.
●● the underwriting claims patterns gross of retrocession are estimated each year by local actuaries at actuarial segment level. In most cases, patterns are calculated using the Chain-Ladder method, derived from the claims paid triangles.
●● each and every year, relevant assumptions made in the calculation of best estimates are reviewed and updated, especially for the annuities discount. SCOR takes into account market exogenous information such as medical inflation and interest rates.
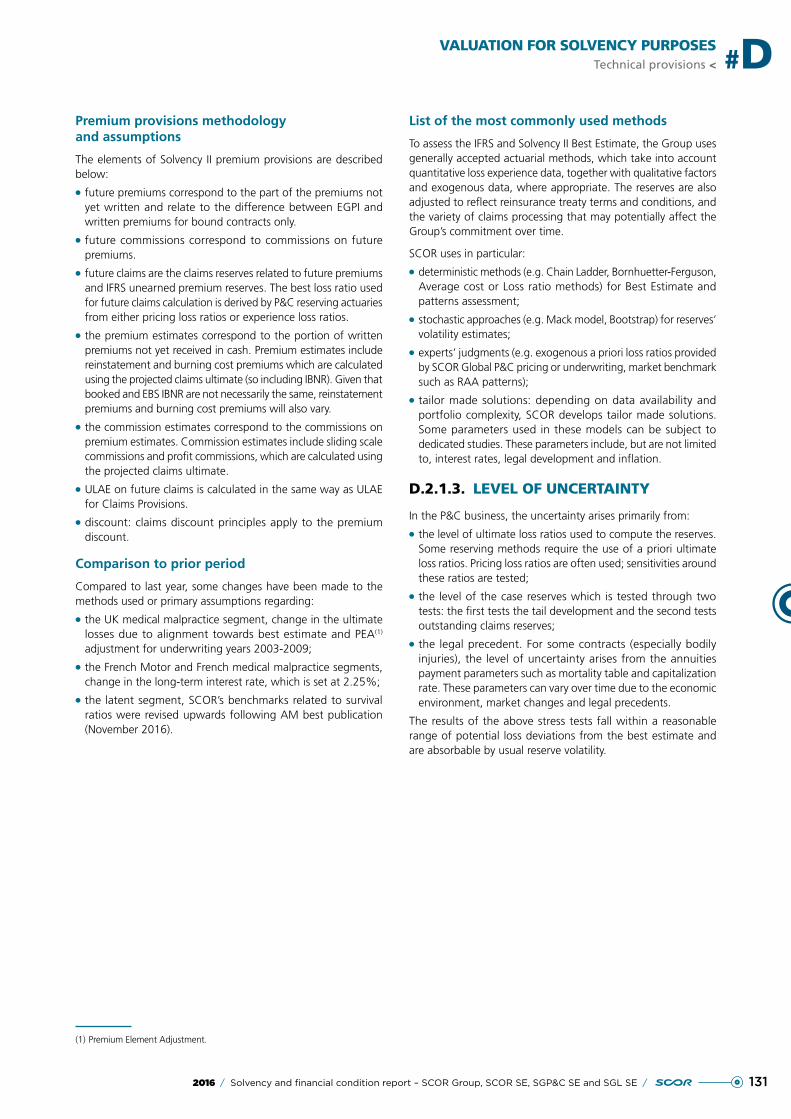
1312016 / Solvency and financial condition report – SCOR Group, SCOR SE, SGP&C SE and SGL SE /
VALUATION FOR SOLVENCY PURPOSESTechnical provisions < #D
Premium provisions methodology and assumptions
The elements of Solvency II premium provisions are described below:
●● future premiums correspond to the part of the premiums not yet written and relate to the difference between EGPI and written premiums for bound contracts only.
●● future commissions correspond to commissions on future premiums.
●● future claims are the claims reserves related to future premiums and IFRS unearned premium reserves. The best loss ratio used for future claims calculation is derived by P&C reserving actuaries from either pricing loss ratios or experience loss ratios.
●● the premium estimates correspond to the portion of written premiums not yet received in cash. Premium estimates include reinstatement and burning cost premiums which are calculated using the projected claims ultimate (so including IBNR). Given that booked and EBS IBNR are not necessarily the same, reinstatement premiums and burning cost premiums will also vary.
●● the commission estimates correspond to the commissions on premium estimates. Commission estimates include sliding scale commissions and profit commissions, which are calculated using the projected claims ultimate.
●● ULAE on future claims is calculated in the same way as ULAE for Claims Provisions.
●● discount: claims discount principles apply to the premium discount.
Comparison to prior period
Compared to last year, some changes have been made to the methods used or primary assumptions regarding:
●● the UK medical malpractice segment, change in the ultimate losses due to alignment towards best estimate and PEA(1) adjustment for underwriting years 2003-2009;
●● the French Motor and French medical malpractice segments, change in the long-term interest rate, which is set at 2.25%;
●● the latent segment, SCOR’s benchmarks related to survival ratios were revised upwards following AM best publication (November 2016).
List of the most commonly used methods
To assess the IFRS and Solvency II Best Estimate, the Group uses generally accepted actuarial methods, which take into account quantitative loss experience data, together with qualitative factors and exogenous data, where appropriate. The reserves are also adjusted to reflect reinsurance treaty terms and conditions, and the variety of claims processing that may potentially affect the Group’s commitment over time.
SCOR uses in particular:
●● deterministic methods (e.g. Chain Ladder, Bornhuetter-Ferguson, Average cost or Loss ratio methods) for Best Estimate and patterns assessment;
●● stochastic approaches (e.g. Mack model, Bootstrap) for reserves’ volatility estimates;
●● experts’ judgments (e.g. exogenous a priori loss ratios provided by SCOR Global P&C pricing or underwriting, market benchmark such as RAA patterns);
●● tailor made solutions: depending on data availability and portfolio complexity, SCOR develops tailor made solutions. Some parameters used in these models can be subject to dedicated studies. These parameters include, but are not limited to, interest rates, legal development and inflation.
D.2.1.3. LEVEL OF UNCERTAINTY
In the P&C business, the uncertainty arises primarily from:
●● the level of ultimate loss ratios used to compute the reserves. Some reserving methods require the use of a priori ultimate loss ratios. Pricing loss ratios are often used; sensitivities around these ratios are tested;
●● the level of the case reserves which is tested through two tests: the first tests the tail development and the second tests outstanding claims reserves;
●● the legal precedent. For some contracts (especially bodily injuries), the level of uncertainty arises from the annuities payment parameters such as mortality table and capitalization rate. These parameters can vary over time due to the economic environment, market changes and legal precedents.
The results of the above stress tests fall within a reasonable range of potential loss deviations from the best estimate and are absorbable by usual reserve volatility.
(1) Premium Element Adjustment.
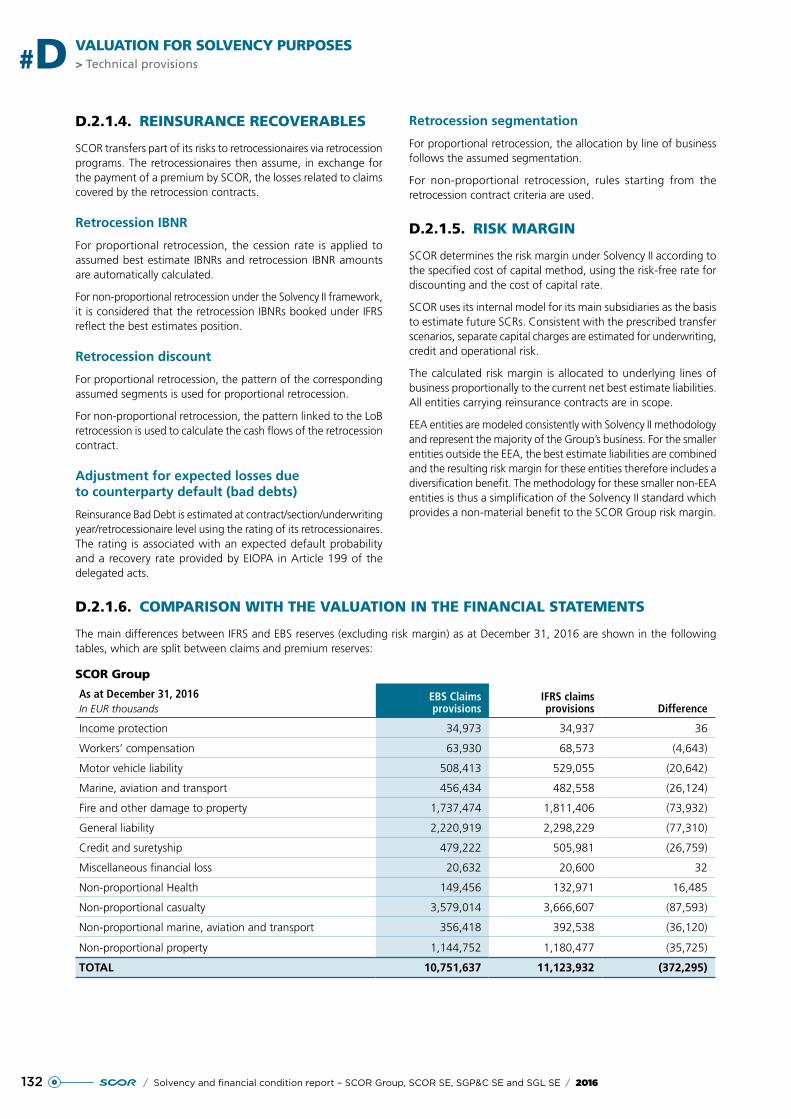
132 / Solvency and financial condition report – SCOR Group, SCOR SE, SGP&C SE and SGL SE / 2016
> Technical provisions#D VALUATION FOR SOLVENCY PURPOSES
D.2.1.4. REINSURANCE RECOVERABLES
SCOR transfers part of its risks to retrocessionaires via retrocession programs. The retrocessionaires then assume, in exchange for the payment of a premium by SCOR, the losses related to claims covered by the retrocession contracts.
Retrocession IBNR
For proportional retrocession, the cession rate is applied to assumed best estimate IBNRs and retrocession IBNR amounts are automatically calculated.
For non-proportional retrocession under the Solvency II framework, it is considered that the retrocession IBNRs booked under IFRS reflect the best estimates position.
Retrocession discount
For proportional retrocession, the pattern of the corresponding assumed segments is used for proportional retrocession.
For non-proportional retrocession, the pattern linked to the LoB retrocession is used to calculate the cash flows of the retrocession contract.
Adjustment for expected losses due to counterparty default (bad debts)
Reinsurance Bad Debt is estimated at contract/section/underwriting year/retrocessionaire level using the rating of its retrocessionaires. The rating is associated with an expected default probability and a recovery rate provided by EIOPA in Article 199 of the delegated acts.
Retrocession segmentation
For proportional retrocession, the allocation by line of business follows the assumed segmentation.
For non-proportional retrocession, rules starting from the retrocession contract criteria are used.
D.2.1.5. RISK MARGIN
SCOR determines the risk margin under Solvency II according to the specified cost of capital method, using the risk-free rate for discounting and the cost of capital rate.
SCOR uses its internal model for its main subsidiaries as the basis to estimate future SCRs. Consistent with the prescribed transfer scenarios, separate capital charges are estimated for underwriting, credit and operational risk.
The calculated risk margin is allocated to underlying lines of business proportionally to the current net best estimate liabilities. All entities carrying reinsurance contracts are in scope.
EEA entities are modeled consistently with Solvency II methodology and represent the majority of the Group’s business. For the smaller entities outside the EEA, the best estimate liabilities are combined and the resulting risk margin for these entities therefore includes a diversification benefit. The methodology for these smaller non-EEA entities is thus a simplification of the Solvency II standard which provides a non-material benefit to the SCOR Group risk margin.
D.2.1.6. COMPARISON WITH THE VALUATION IN THE FINANCIAL STATEMENTS
The main differences between IFRS and EBS reserves (excluding risk margin) as at December 31, 2016 are shown in the following tables, which are split between claims and premium reserves:
SCOR Group
As at December 31, 2016In EUR thousands
EBS Claims provisions
IFRS claims provisions Difference
Income protection 34,973 34,937 36
Workers’ compensation 63,930 68,573 (4,643)
Motor vehicle liability 508,413 529,055 (20,642)
Marine, aviation and transport 456,434 482,558 (26,124)
Fire and other damage to property 1,737,474 1,811,406 (73,932)
General liability 2,220,919 2,298,229 (77,310)
Credit and suretyship 479,222 505,981 (26,759)
Miscellaneous financial loss 20,632 20,600 32
Non-proportional Health 149,456 132,971 16,485
Non-proportional casualty 3,579,014 3,666,607 (87,593)
Non-proportional marine, aviation and transport 356,418 392,538 (36,120)
Non-proportional property 1,144,752 1,180,477 (35,725)
TOTAL 10,751,637 11,123,932 (372,295)
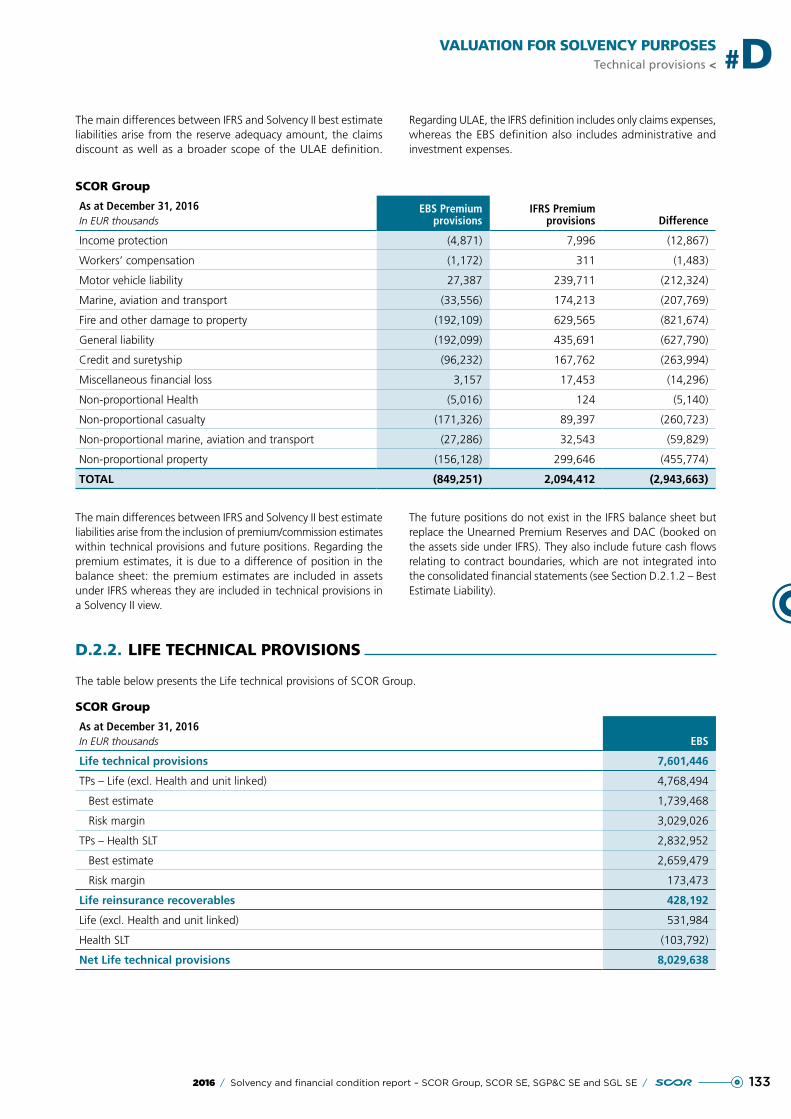
1332016 / Solvency and financial condition report – SCOR Group, SCOR SE, SGP&C SE and SGL SE /
VALUATION FOR SOLVENCY PURPOSESTechnical provisions < #D
The main differences between IFRS and Solvency II best estimate liabilities arise from the reserve adequacy amount, the claims discount as well as a broader scope of the ULAE definition.
Regarding ULAE, the IFRS definition includes only claims expenses, whereas the EBS definition also includes administrative and investment expenses.
SCOR Group
As at December 31, 2016In EUR thousands
EBS Premium provisions
IFRS Premium provisions Difference
Income protection (4,871) 7,996 (12,867)
Workers’ compensation (1,172) 311 (1,483)
Motor vehicle liability 27,387 239,711 (212,324)
Marine, aviation and transport (33,556) 174,213 (207,769)
Fire and other damage to property (192,109) 629,565 (821,674)
General liability (192,099) 435,691 (627,790)
Credit and suretyship (96,232) 167,762 (263,994)
Miscellaneous financial loss 3,157 17,453 (14,296)
Non-proportional Health (5,016) 124 (5,140)
Non-proportional casualty (171,326) 89,397 (260,723)
Non-proportional marine, aviation and transport (27,286) 32,543 (59,829)
Non-proportional property (156,128) 299,646 (455,774)
TOTAL (849,251) 2,094,412 (2,943,663)
The main differences between IFRS and Solvency II best estimate liabilities arise from the inclusion of premium/commission estimates within technical provisions and future positions. Regarding the premium estimates, it is due to a difference of position in the balance sheet: the premium estimates are included in assets under IFRS whereas they are included in technical provisions in a Solvency II view.
The future positions do not exist in the IFRS balance sheet but replace the Unearned Premium Reserves and DAC (booked on the assets side under IFRS). They also include future cash flows relating to contract boundaries, which are not integrated into the consolidated financial statements (see Section D.2.1.2 – Best Estimate Liability).
D.2.2. LIFE TECHNICAL PROVISIONS
The table below presents the Life technical provisions of SCOR Group.
SCOR Group
As at December 31, 2016In EUR thousands EBS
Life technical provisions 7,601,446
TPs – Life (excl. Health and unit linked) 4,768,494
Best estimate 1,739,468
Risk margin 3,029,026
TPs – Health SLT 2,832,952
Best estimate 2,659,479
Risk margin 173,473
Life reinsurance recoverables 428,192
Life (excl. Health and unit linked) 531,984
Health SLT (103,792)
Net Life technical provisions 8,029,638
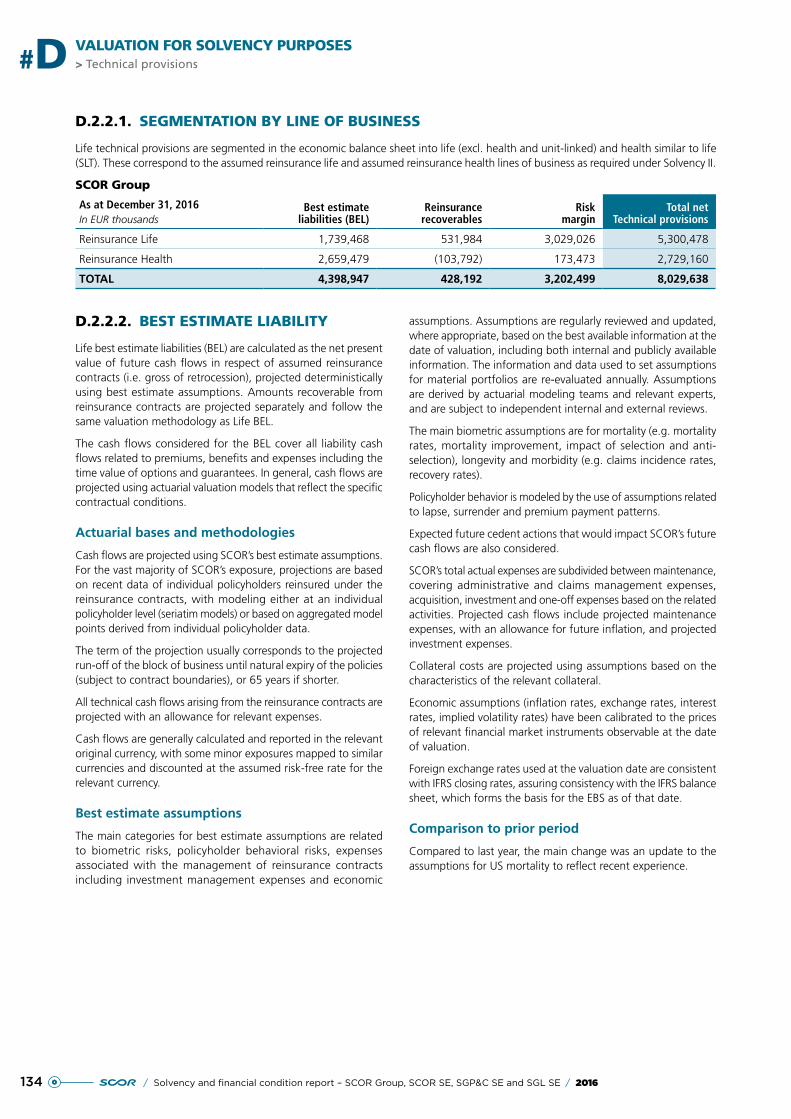
134 / Solvency and financial condition report – SCOR Group, SCOR SE, SGP&C SE and SGL SE / 2016
> Technical provisions#D VALUATION FOR SOLVENCY PURPOSES
D.2.2.1. SEGMENTATION BY LINE OF BUSINESS
Life technical provisions are segmented in the economic balance sheet into life (excl. health and unit-linked) and health similar to life (SLT). These correspond to the assumed reinsurance life and assumed reinsurance health lines of business as required under Solvency II.
SCOR Group
As at December 31, 2016In EUR thousands
Best estimate liabilities (BEL)
Reinsurance recoverables
Risk margin
Total net Technical provisions
Reinsurance Life 1,739,468 531,984 3,029,026 5,300,478
Reinsurance Health 2,659,479 (103,792) 173,473 2,729,160
TOTAL 4,398,947 428,192 3,202,499 8,029,638
D.2.2.2. BEST ESTIMATE LIABILITY
Life best estimate liabilities (BEL) are calculated as the net present value of future cash flows in respect of assumed reinsurance contracts (i.e. gross of retrocession), projected deterministically using best estimate assumptions. Amounts recoverable from reinsurance contracts are projected separately and follow the same valuation methodology as Life BEL.
The cash flows considered for the BEL cover all liability cash flows related to premiums, benefits and expenses including the time value of options and guarantees. In general, cash flows are projected using actuarial valuation models that reflect the specific contractual conditions.
Actuarial bases and methodologies
Cash flows are projected using SCOR’s best estimate assumptions. For the vast majority of SCOR’s exposure, projections are based on recent data of individual policyholders reinsured under the reinsurance contracts, with modeling either at an individual policyholder level (seriatim models) or based on aggregated model points derived from individual policyholder data.
The term of the projection usually corresponds to the projected run-off of the block of business until natural expiry of the policies (subject to contract boundaries), or 65 years if shorter.
All technical cash flows arising from the reinsurance contracts are projected with an allowance for relevant expenses.
Cash flows are generally calculated and reported in the relevant original currency, with some minor exposures mapped to similar currencies and discounted at the assumed risk-free rate for the relevant currency.
Best estimate assumptions
The main categories for best estimate assumptions are related to biometric risks, policyholder behavioral risks, expenses associated with the management of reinsurance contracts including investment management expenses and economic
assumptions. Assumptions are regularly reviewed and updated, where appropriate, based on the best available information at the date of valuation, including both internal and publicly available information. The information and data used to set assumptions for material portfolios are re-evaluated annually. Assumptions are derived by actuarial modeling teams and relevant experts, and are subject to independent internal and external reviews.
The main biometric assumptions are for mortality (e.g. mortality rates, mortality improvement, impact of selection and anti-selection), longevity and morbidity (e.g. claims incidence rates, recovery rates).
Policyholder behavior is modeled by the use of assumptions related to lapse, surrender and premium payment patterns.
Expected future cedent actions that would impact SCOR’s future cash flows are also considered.
SCOR’s total actual expenses are subdivided between maintenance, covering administrative and claims management expenses, acquisition, investment and one-off expenses based on the related activities. Projected cash flows include projected maintenance expenses, with an allowance for future inflation, and projected investment expenses.
Collateral costs are projected using assumptions based on the characteristics of the relevant collateral.
Economic assumptions (inflation rates, exchange rates, interest rates, implied volatility rates) have been calibrated to the prices of relevant financial market instruments observable at the date of valuation.
Foreign exchange rates used at the valuation date are consistent with IFRS closing rates, assuring consistency with the IFRS balance sheet, which forms the basis for the EBS as of that date.
Comparison to prior period
Compared to last year, the main change was an update to the assumptions for US mortality to reflect recent experience.
1352016 / Solvency and financial condition report – SCOR Group, SCOR SE, SGP&C SE and SGL SE /
VALUATION FOR SOLVENCY PURPOSESTechnical provisions < #D
D.2.2.3. SIGNIFICANT SIMPLIFIED METHODS USED
SCOR uses simplified methods to value about 3% of its Life and health portfolio, measured in terms of the present value of projected future claims. These simplified methods either rely on model polices which are not derived from recent seriatim policy data; or are purely based on the historic aggregate accounting data of a treaty, extrapolating existing accounting data history under a duration and run-off assumption; or are models with other simplifications. Adjustments may be made to better reflect treaty conditions.
D.2.2.4. LEVEL OF UNCERTAINTY – SENSITIVITIES
The key area of uncertainty associated with the value of the technical provisions arises from the setting of best estimate assumptions. Assumptions are therefore reviewed on a regular basis, updated based on the best available information and are subject to independent reviews. In particular, while some assumptions can be reliably observed from market information or derived from recent experience data, other assumptions must be set for periods far in the future and so must allow for the development of trends and external influences, or for exposures for which less experience data are available. In these cases, SCOR applies expert judgment to enrich data, derive parameters for the forecast, and reduce uncertainty in estimations. SCOR applies expert judgment within a framework to make sure that its application is proportionate to the quantity and quality of data available, and to its potential impact.
The sensitivity of the BEL to the best estimate assumptions is analyzed through sensitivity tests. Their impacts are described below.
Mortality sensitivity
The most significant set of parameters in determining SCOR’s Life portfolio technical provisions are those for the projection of current and future mortality rates. A deterioration of expected mortality would cause a significant increase in Life technical provisions, as mortality risk is a core element of SCOR’s Life risk appetite.
Some reduction in technical provisions would be observable on the annuity business in the case of a mortality increase. However, this is less material compared to the potential impact from the mortality business for the comparable scenario.
Morbidity sensitivity
A deterioration of expected mortality would increase Life and Health technical provisions. The impact would be far lower than a comparable change to expected mortality, as the exposure of the Life division portfolio to morbidity risk is lower.
Lapse sensitivity
Technical provisions for Life business would increase and the market value of deposits would decrease with an increase in assumed future lapse rates. Lapse rates can change due to the influence of external factors.
Interest rate sensitivity
A parallel upward shift in the yield curve would reduce the Life division technical provisions. This would be partly offset by a decrease in the market value of deposits.
A parallel downward shift would have the opposite impact.
D.2.2.5. REINSURANCE RECOVERABLES
SCOR transfers part of its risks to retrocessionaires via retrocession programs. The reinsurance recoverables associated with these programs are calculated using the same methodology, systems and processes as the underlying BEL of assumed reinsurance treaties. Special purpose vehicles are not in place for SCOR’s life portfolio retroceded. The exposure to default risk on the retrocession recoverables is minor, as in most Life retrocessions, positive cash flows are expected to be ceded.
D.2.2.6. RISK MARGIN
SCOR determines the risk margin under Solvency II according to the specified cost of capital method, using the risk-free rate for discounting and the cost of capital rate.
SCOR’s uses its internal model for its main subsidiaries as the basis to estimate future SCRs. Consistent with the specified transfer scenarios, separate capital charges are estimated for underwriting, credit and operational risk.
The underwriting risk capital charge calculation applies an estimated run-off pattern to homogenous lines of business, or in some cases more granularly on individual perils.
From these profiles, the specified VaR threshold defines future capital requirements. Credit and operational risk capital charges are presumed to run-off in proportion to the projected underwriting risk capital charge. SCOR thereby derives the estimated future total risk of the prescribed reference undertaking.
The calculated risk margin is allocated to underlying lines of business. The Life division allocates the calculated risk margin to the underlying lines of business in proportion to their contribution to SCR.
All entities carrying re-insurance contracts are in scope.
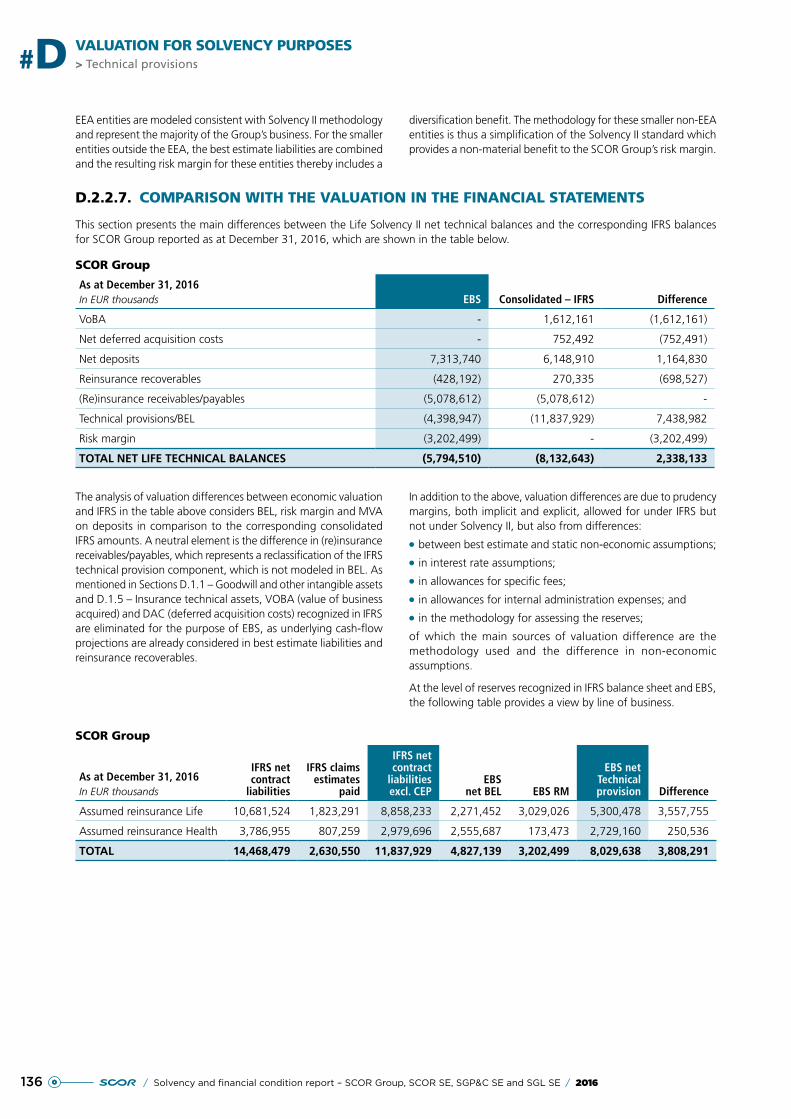
136 / Solvency and financial condition report – SCOR Group, SCOR SE, SGP&C SE and SGL SE / 2016
> Technical provisions#D VALUATION FOR SOLVENCY PURPOSES
EEA entities are modeled consistent with Solvency II methodology and represent the majority of the Group’s business. For the smaller entities outside the EEA, the best estimate liabilities are combined and the resulting risk margin for these entities thereby includes a
diversification benefit. The methodology for these smaller non-EEA entities is thus a simplification of the Solvency II standard which provides a non-material benefit to the SCOR Group’s risk margin.
D.2.2.7. COMPARISON WITH THE VALUATION IN THE FINANCIAL STATEMENTS
This section presents the main differences between the Life Solvency II net technical balances and the corresponding IFRS balances for SCOR Group reported as at December 31, 2016, which are shown in the table below.
SCOR Group
As at December 31, 2016In EUR thousands EBS Consolidated – IFRS Difference
VoBA - 1,612,161 (1,612,161)
Net deferred acquisition costs - 752,492 (752,491)
Net deposits 7,313,740 6,148,910 1,164,830
Reinsurance recoverables (428,192) 270,335 (698,527)
(Re)insurance receivables/payables (5,078,612) (5,078,612) -
Technical provisions/BEL (4,398,947) (11,837,929) 7,438,982
Risk margin (3,202,499) - (3,202,499)
TOTAL NET LIFE TECHNICAL BALANCES (5,794,510) (8,132,643) 2,338,133
The analysis of valuation differences between economic valuation and IFRS in the table above considers BEL, risk margin and MVA on deposits in comparison to the corresponding consolidated IFRS amounts. A neutral element is the difference in (re)insurance receivables/payables, which represents a reclassification of the IFRS technical provision component, which is not modeled in BEL. As mentioned in Sections D.1.1 – Goodwill and other intangible assets and D.1.5 – Insurance technical assets, VOBA (value of business acquired) and DAC (deferred acquisition costs) recognized in IFRS are eliminated for the purpose of EBS, as underlying cash-flow projections are already considered in best estimate liabilities and reinsurance recoverables.
In addition to the above, valuation differences are due to prudency margins, both implicit and explicit, allowed for under IFRS but not under Solvency II, but also from differences:
●● between best estimate and static non-economic assumptions;
●● in interest rate assumptions;
●● in allowances for specific fees;
●● in allowances for internal administration expenses; and
●● in the methodology for assessing the reserves;
of which the main sources of valuation difference are the methodology used and the difference in non-economic assumptions.
At the level of reserves recognized in IFRS balance sheet and EBS, the following table provides a view by line of business.
SCOR Group
As at December 31, 2016In EUR thousands
IFRS net contract
liabilities
IFRS claims estimates
paid
IFRS net contract
liabilities excl. CEP
EBSnet BEL EBS RM
EBS net Technical provision Difference
Assumed reinsurance Life 10,681,524 1,823,291 8,858,233 2,271,452 3,029,026 5,300,478 3,557,755
Assumed reinsurance Health 3,786,955 807,259 2,979,696 2,555,687 173,473 2,729,160 250,536
TOTAL 14,468,479 2,630,550 11,837,929 4,827,139 3,202,499 8,029,638 3,808,291
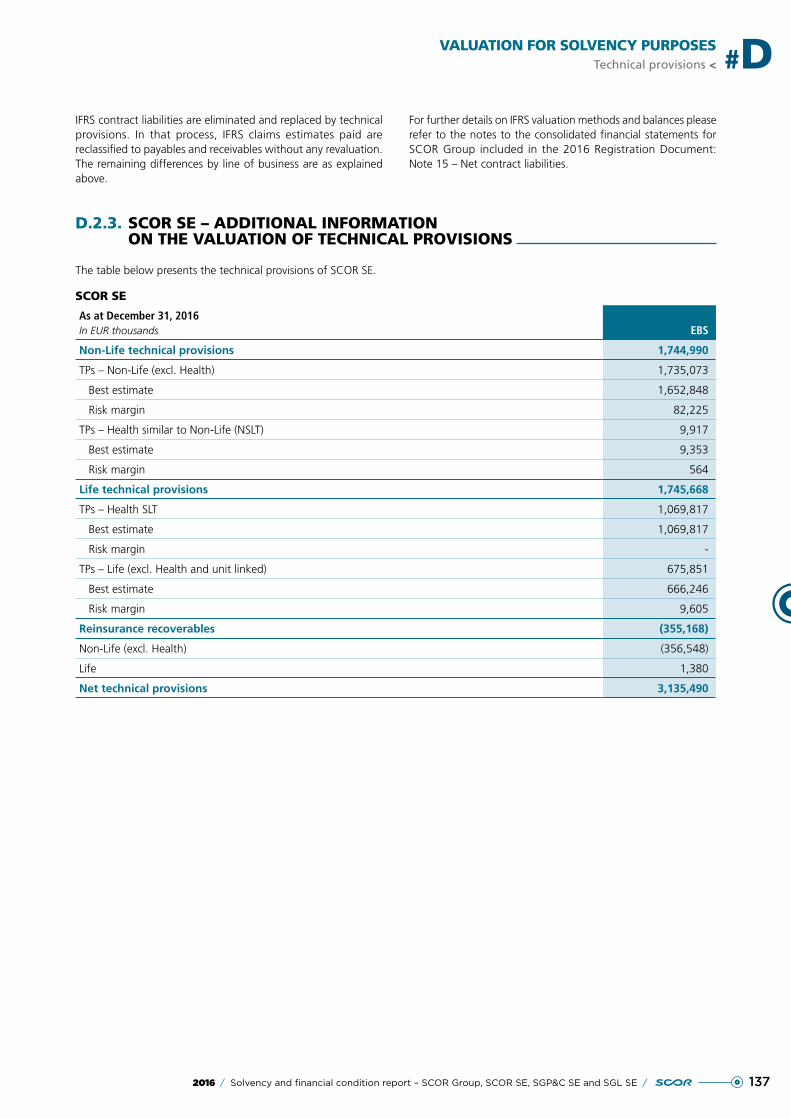
1372016 / Solvency and financial condition report – SCOR Group, SCOR SE, SGP&C SE and SGL SE /
VALUATION FOR SOLVENCY PURPOSESTechnical provisions < #D
IFRS contract liabilities are eliminated and replaced by technical provisions. In that process, IFRS claims estimates paid are reclassified to payables and receivables without any revaluation. The remaining differences by line of business are as explained above.
For further details on IFRS valuation methods and balances please refer to the notes to the consolidated financial statements for SCOR Group included in the 2016 Registration Document: Note 15 – Net contract liabilities.
D.2.3. SCOR SE – ADDITIONAL INFORMATION ON THE VALUATION OF TECHNICAL PROVISIONS
The table below presents the technical provisions of SCOR SE.
SCOR SE
As at December 31, 2016In EUR thousands EBS
Non-Life technical provisions 1,744,990
TPs – Non-Life (excl. Health) 1,735,073
Best estimate 1,652,848
Risk margin 82,225
TPs – Health similar to Non-Life (NSLT) 9,917
Best estimate 9,353
Risk margin 564
Life technical provisions 1,745,668
TPs – Health SLT 1,069,817
Best estimate 1,069,817
Risk margin -
TPs – Life (excl. Health and unit linked) 675,851
Best estimate 666,246
Risk margin 9,605
Reinsurance recoverables (355,168)
Non-Life (excl. Health) (356,548)
Life 1,380
Net technical provisions 3,135,490
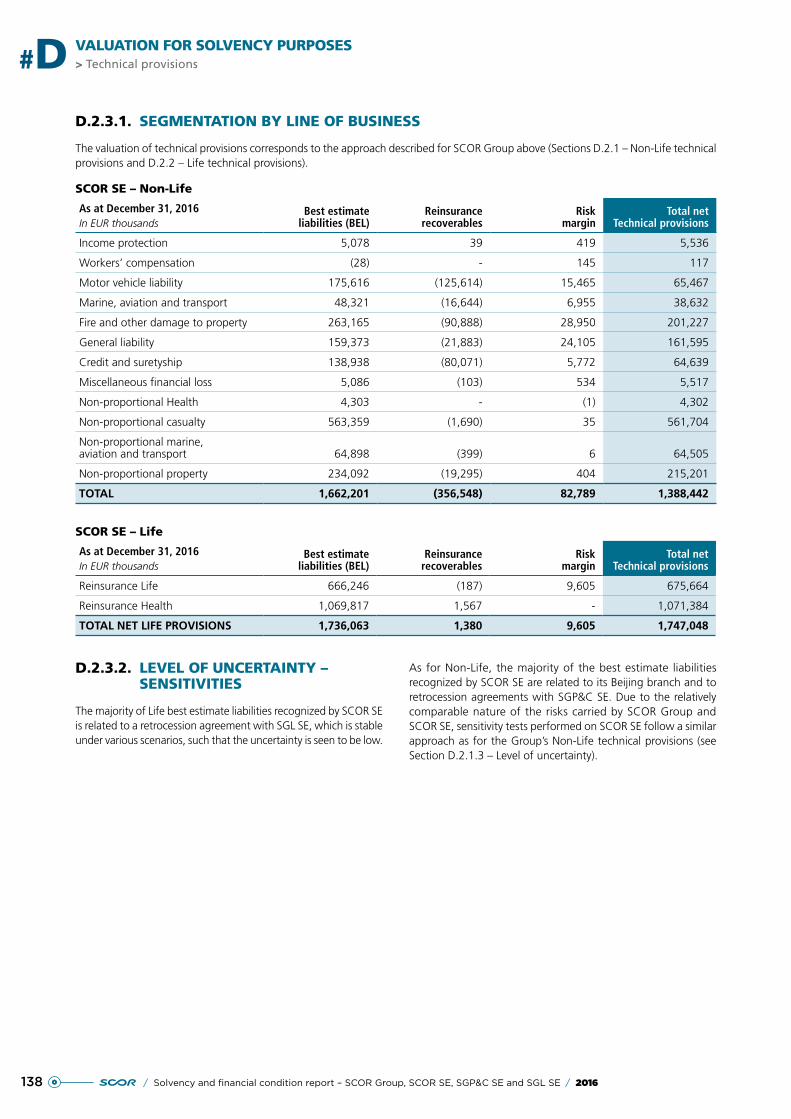
138 / Solvency and financial condition report – SCOR Group, SCOR SE, SGP&C SE and SGL SE / 2016
> Technical provisions#D VALUATION FOR SOLVENCY PURPOSES
D.2.3.1. SEGMENTATION BY LINE OF BUSINESS
The valuation of technical provisions corresponds to the approach described for SCOR Group above (Sections D.2.1 – Non-Life technical provisions and D.2.2 – Life technical provisions).
SCOR SE – Non-Life
As at December 31, 2016In EUR thousands
Best estimate liabilities (BEL)
Reinsurance recoverables
Risk margin
Total net Technical provisions
Income protection 5,078 39 419 5,536
Workers’ compensation (28) - 145 117
Motor vehicle liability 175,616 (125,614) 15,465 65,467
Marine, aviation and transport 48,321 (16,644) 6,955 38,632
Fire and other damage to property 263,165 (90,888) 28,950 201,227
General liability 159,373 (21,883) 24,105 161,595
Credit and suretyship 138,938 (80,071) 5,772 64,639
Miscellaneous financial loss 5,086 (103) 534 5,517
Non-proportional Health 4,303 - (1) 4,302
Non-proportional casualty 563,359 (1,690) 35 561,704
Non-proportional marine, aviation and transport 64,898 (399) 6 64,505
Non-proportional property 234,092 (19,295) 404 215,201
TOTAL 1,662,201 (356,548) 82,789 1,388,442
SCOR SE – Life
As at December 31, 2016In EUR thousands
Best estimate liabilities (BEL)
Reinsurance recoverables
Risk margin
Total net Technical provisions
Reinsurance Life 666,246 (187) 9,605 675,664
Reinsurance Health 1,069,817 1,567 - 1,071,384
TOTAL NET LIFE PROVISIONS 1,736,063 1,380 9,605 1,747,048
D.2.3.2. LEVEL OF UNCERTAINTY – SENSITIVITIES
The majority of Life best estimate liabilities recognized by SCOR SE is related to a retrocession agreement with SGL SE, which is stable under various scenarios, such that the uncertainty is seen to be low.
As for Non-Life, the majority of the best estimate liabilities recognized by SCOR SE are related to its Beijing branch and to retrocession agreements with SGP&C SE. Due to the relatively comparable nature of the risks carried by SCOR Group and SCOR SE, sensitivity tests performed on SCOR SE follow a similar approach as for the Group’s Non-Life technical provisions (see Section D.2.1.3 – Level of uncertainty).
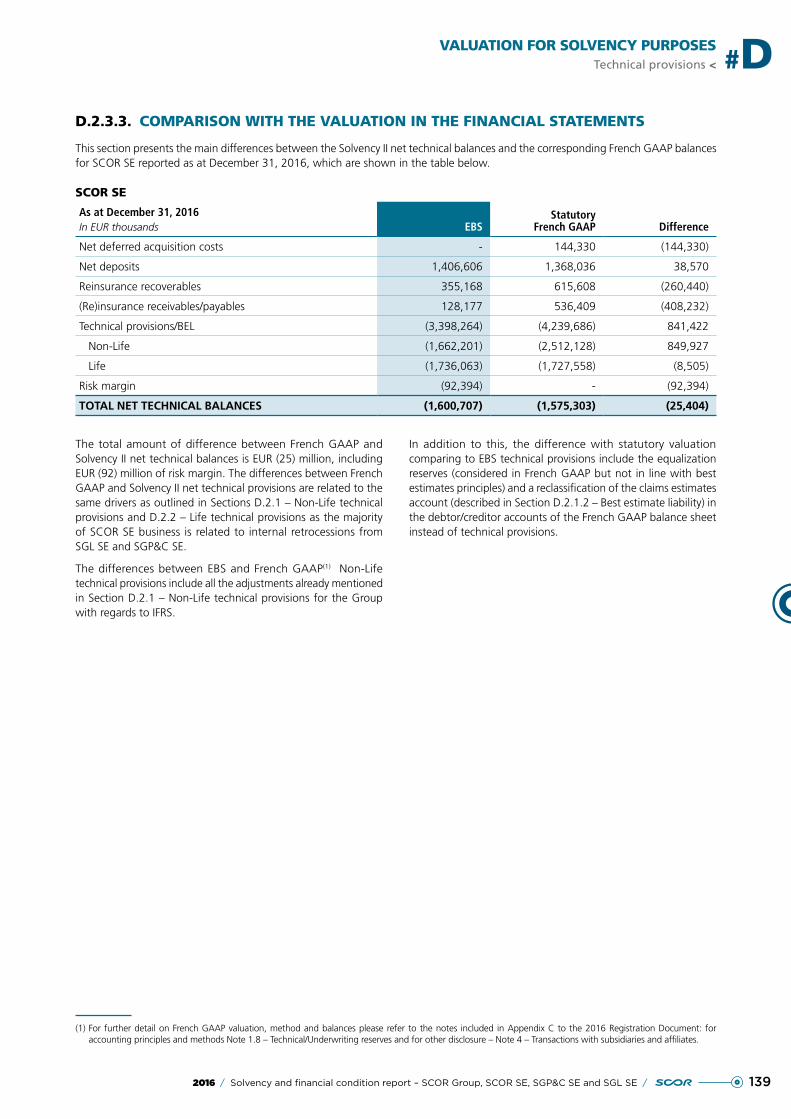
1392016 / Solvency and financial condition report – SCOR Group, SCOR SE, SGP&C SE and SGL SE /
VALUATION FOR SOLVENCY PURPOSESTechnical provisions < #D
D.2.3.3. COMPARISON WITH THE VALUATION IN THE FINANCIAL STATEMENTS
This section presents the main differences between the Solvency II net technical balances and the corresponding French GAAP balances for SCOR SE reported as at December 31, 2016, which are shown in the table below.
SCOR SE
As at December 31, 2016In EUR thousands EBS
StatutoryFrench GAAP Difference
Net deferred acquisition costs - 144,330 (144,330)
Net deposits 1,406,606 1,368,036 38,570
Reinsurance recoverables 355,168 615,608 (260,440)
(Re)insurance receivables/payables 128,177 536,409 (408,232)
Technical provisions/BEL (3,398,264) (4,239,686) 841,422
Non-Life (1,662,201) (2,512,128) 849,927
Life (1,736,063) (1,727,558) (8,505)
Risk margin (92,394) - (92,394)
TOTAL NET TECHNICAL BALANCES (1,600,707) (1,575,303) (25,404)
The total amount of difference between French GAAP and Solvency II net technical balances is EUR (25) million, including EUR (92) million of risk margin. The differences between French GAAP and Solvency II net technical provisions are related to the same drivers as outlined in Sections D.2.1 – Non-Life technical provisions and D.2.2 – Life technical provisions as the majority of SCOR SE business is related to internal retrocessions from SGL SE and SGP&C SE.
The differences between EBS and French GAAP(1) Non-Life technical provisions include all the adjustments already mentioned in Section D.2.1 – Non-Life technical provisions for the Group with regards to IFRS.
In addition to this, the difference with statutory valuation comparing to EBS technical provisions include the equalization reserves (considered in French GAAP but not in line with best estimates principles) and a reclassification of the claims estimates account (described in Section D.2.1.2 – Best estimate liability) in the debtor/creditor accounts of the French GAAP balance sheet instead of technical provisions.
(1) For further detail on French GAAP valuation, method and balances please refer to the notes included in Appendix C to the 2016 Registration Document: for accounting principles and methods Note 1.8 – Technical/Underwriting reserves and for other disclosure – Note 4 – Transactions with subsidiaries and affiliates.
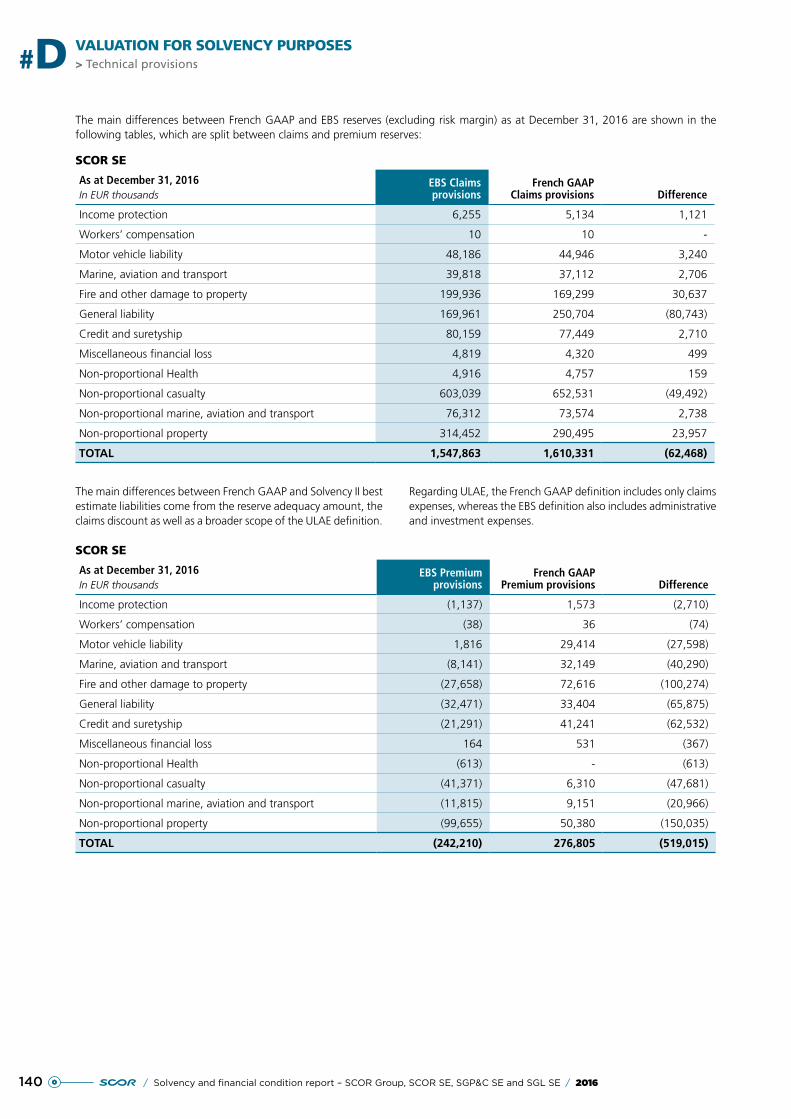
140 / Solvency and financial condition report – SCOR Group, SCOR SE, SGP&C SE and SGL SE / 2016
> Technical provisions#D VALUATION FOR SOLVENCY PURPOSES
The main differences between French GAAP and EBS reserves (excluding risk margin) as at December 31, 2016 are shown in the following tables, which are split between claims and premium reserves:
SCOR SE
As at December 31, 2016In EUR thousands
EBS Claims provisions
French GAAP Claims provisions Difference
Income protection 6,255 5,134 1,121
Workers’ compensation 10 10 -
Motor vehicle liability 48,186 44,946 3,240
Marine, aviation and transport 39,818 37,112 2,706
Fire and other damage to property 199,936 169,299 30,637
General liability 169,961 250,704 (80,743)
Credit and suretyship 80,159 77,449 2,710
Miscellaneous financial loss 4,819 4,320 499
Non-proportional Health 4,916 4,757 159
Non-proportional casualty 603,039 652,531 (49,492)
Non-proportional marine, aviation and transport 76,312 73,574 2,738
Non-proportional property 314,452 290,495 23,957
TOTAL 1,547,863 1,610,331 (62,468)
The main differences between French GAAP and Solvency II best estimate liabilities come from the reserve adequacy amount, the claims discount as well as a broader scope of the ULAE definition.
Regarding ULAE, the French GAAP definition includes only claims expenses, whereas the EBS definition also includes administrative and investment expenses.
SCOR SE
As at December 31, 2016In EUR thousands
EBS Premium provisions
French GAAP Premium provisions Difference
Income protection (1,137) 1,573 (2,710)
Workers’ compensation (38) 36 (74)
Motor vehicle liability 1,816 29,414 (27,598)
Marine, aviation and transport (8,141) 32,149 (40,290)
Fire and other damage to property (27,658) 72,616 (100,274)
General liability (32,471) 33,404 (65,875)
Credit and suretyship (21,291) 41,241 (62,532)
Miscellaneous financial loss 164 531 (367)
Non-proportional Health (613) - (613)
Non-proportional casualty (41,371) 6,310 (47,681)
Non-proportional marine, aviation and transport (11,815) 9,151 (20,966)
Non-proportional property (99,655) 50,380 (150,035)
TOTAL (242,210) 276,805 (519,015)
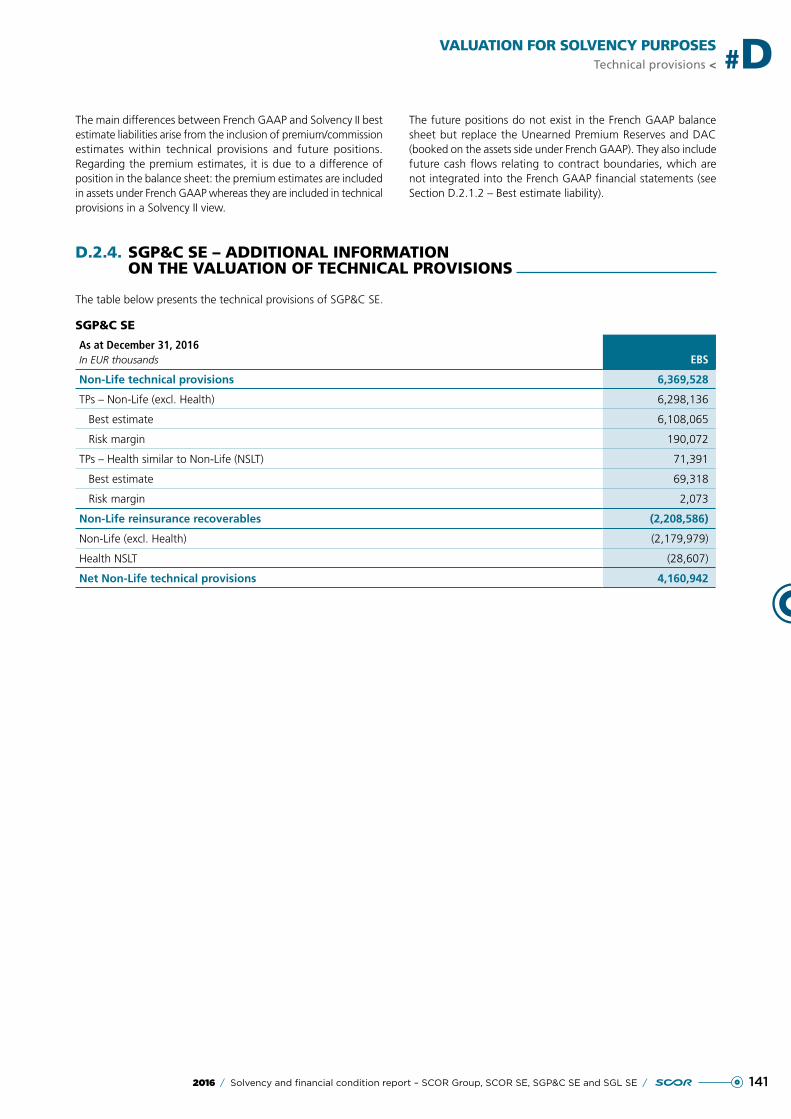
1412016 / Solvency and financial condition report – SCOR Group, SCOR SE, SGP&C SE and SGL SE /
VALUATION FOR SOLVENCY PURPOSESTechnical provisions < #D
The main differences between French GAAP and Solvency II best estimate liabilities arise from the inclusion of premium/commission estimates within technical provisions and future positions. Regarding the premium estimates, it is due to a difference of position in the balance sheet: the premium estimates are included in assets under French GAAP whereas they are included in technical provisions in a Solvency II view.
The future positions do not exist in the French GAAP balance sheet but replace the Unearned Premium Reserves and DAC (booked on the assets side under French GAAP). They also include future cash flows relating to contract boundaries, which are not integrated into the French GAAP financial statements (see Section D.2.1.2 – Best estimate liability).
D.2.4. SGP&C SE – ADDITIONAL INFORMATION ON THE VALUATION OF TECHNICAL PROVISIONS
The table below presents the technical provisions of SGP&C SE.
SGP&C SE
As at December 31, 2016In EUR thousands EBS
Non-Life technical provisions 6,369,528
TPs – Non-Life (excl. Health) 6,298,136
Best estimate 6,108,065
Risk margin 190,072
TPs – Health similar to Non-Life (NSLT) 71,391
Best estimate 69,318
Risk margin 2,073
Non-Life reinsurance recoverables (2,208,586)
Non-Life (excl. Health) (2,179,979)
Health NSLT (28,607)
Net Non-Life technical provisions 4,160,942
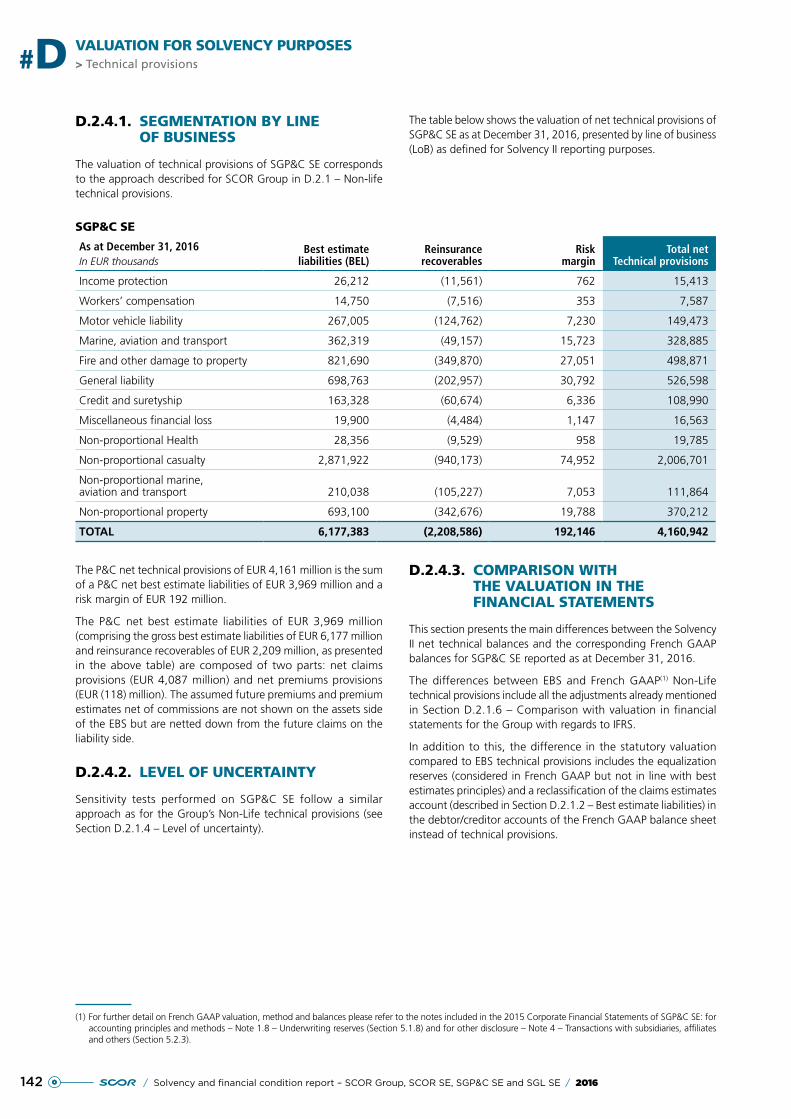
142 / Solvency and financial condition report – SCOR Group, SCOR SE, SGP&C SE and SGL SE / 2016
> Technical provisions#D VALUATION FOR SOLVENCY PURPOSES
D.2.4.1. SEGMENTATION BY LINE OF BUSINESS
The valuation of technical provisions of SGP&C SE corresponds to the approach described for SCOR Group in D.2.1 – Non-life technical provisions.
The table below shows the valuation of net technical provisions of SGP&C SE as at December 31, 2016, presented by line of business (LoB) as defined for Solvency II reporting purposes.
SGP&C SE
As at December 31, 2016In EUR thousands
Best estimate liabilities (BEL)
Reinsurance recoverables
Risk margin
Total net Technical provisions
Income protection 26,212 (11,561) 762 15,413
Workers’ compensation 14,750 (7,516) 353 7,587
Motor vehicle liability 267,005 (124,762) 7,230 149,473
Marine, aviation and transport 362,319 (49,157) 15,723 328,885
Fire and other damage to property 821,690 (349,870) 27,051 498,871
General liability 698,763 (202,957) 30,792 526,598
Credit and suretyship 163,328 (60,674) 6,336 108,990
Miscellaneous financial loss 19,900 (4,484) 1,147 16,563
Non-proportional Health 28,356 (9,529) 958 19,785
Non-proportional casualty 2,871,922 (940,173) 74,952 2,006,701
Non-proportional marine, aviation and transport 210,038 (105,227) 7,053 111,864
Non-proportional property 693,100 (342,676) 19,788 370,212
TOTAL 6,177,383 (2,208,586) 192,146 4,160,942
The P&C net technical provisions of EUR 4,161 million is the sum of a P&C net best estimate liabilities of EUR 3,969 million and a risk margin of EUR 192 million.
The P&C net best estimate liabilities of EUR 3,969 million (comprising the gross best estimate liabilities of EUR 6,177 million and reinsurance recoverables of EUR 2,209 million, as presented in the above table) are composed of two parts: net claims provisions (EUR 4,087 million) and net premiums provisions (EUR (118) million). The assumed future premiums and premium estimates net of commissions are not shown on the assets side of the EBS but are netted down from the future claims on the liability side.
D.2.4.2. LEVEL OF UNCERTAINTY
Sensitivity tests performed on SGP&C SE follow a similar approach as for the Group’s Non-Life technical provisions (see Section D.2.1.4 – Level of uncertainty).
D.2.4.3. COMPARISON WITH THE VALUATION IN THE FINANCIAL STATEMENTS
This section presents the main differences between the Solvency II net technical balances and the corresponding French GAAP balances for SGP&C SE reported as at December 31, 2016.
The differences between EBS and French GAAP(1) Non-Life technical provisions include all the adjustments already mentioned in Section D.2.1.6 – Comparison with valuation in financial statements for the Group with regards to IFRS.
In addition to this, the difference in the statutory valuation compared to EBS technical provisions includes the equalization reserves (considered in French GAAP but not in line with best estimates principles) and a reclassification of the claims estimates account (described in Section D.2.1.2 – Best estimate liabilities) in the debtor/creditor accounts of the French GAAP balance sheet instead of technical provisions.
(1) For further detail on French GAAP valuation, method and balances please refer to the notes included in the 2015 Corporate Financial Statements of SGP&C SE: for accounting principles and methods – Note 1.8 – Underwriting reserves (Section 5.1.8) and for other disclosure – Note 4 – Transactions with subsidiaries, affiliates and others (Section 5.2.3).
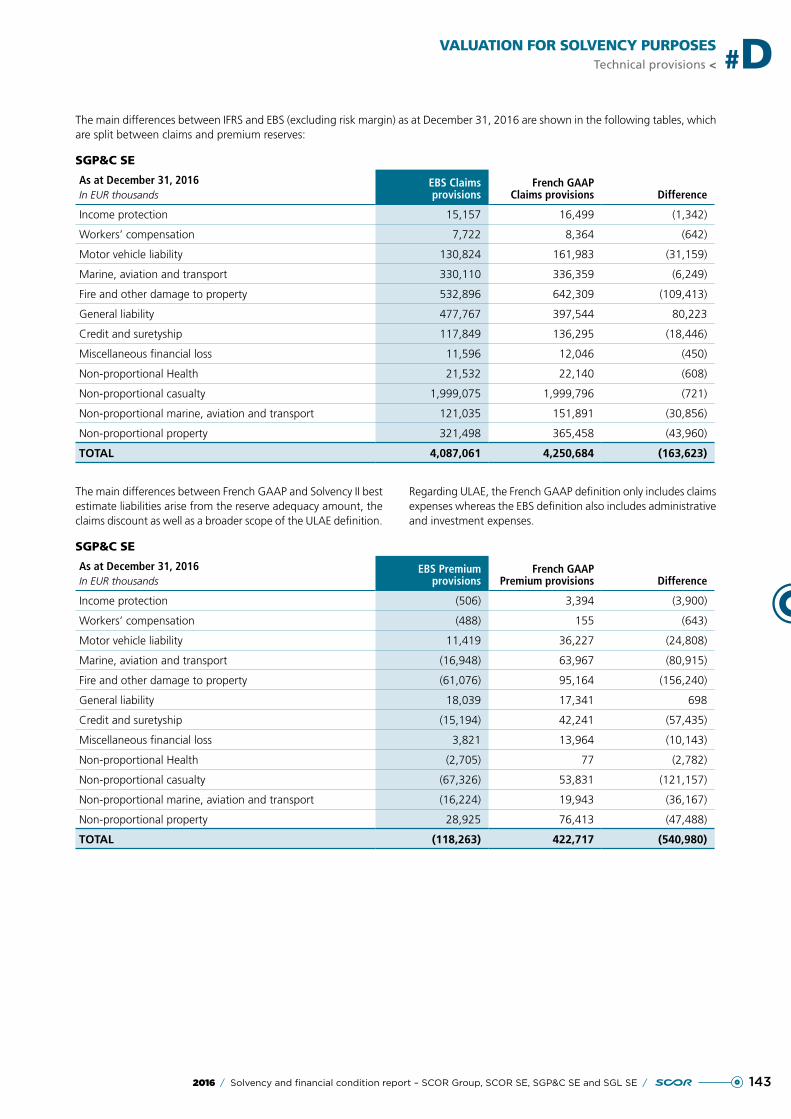
1432016 / Solvency and financial condition report – SCOR Group, SCOR SE, SGP&C SE and SGL SE /
VALUATION FOR SOLVENCY PURPOSESTechnical provisions < #D
The main differences between IFRS and EBS (excluding risk margin) as at December 31, 2016 are shown in the following tables, which are split between claims and premium reserves:
SGP&C SE
As at December 31, 2016In EUR thousands
EBS Claims provisions
French GAAP Claims provisions Difference
Income protection 15,157 16,499 (1,342)
Workers’ compensation 7,722 8,364 (642)
Motor vehicle liability 130,824 161,983 (31,159)
Marine, aviation and transport 330,110 336,359 (6,249)
Fire and other damage to property 532,896 642,309 (109,413)
General liability 477,767 397,544 80,223
Credit and suretyship 117,849 136,295 (18,446)
Miscellaneous financial loss 11,596 12,046 (450)
Non-proportional Health 21,532 22,140 (608)
Non-proportional casualty 1,999,075 1,999,796 (721)
Non-proportional marine, aviation and transport 121,035 151,891 (30,856)
Non-proportional property 321,498 365,458 (43,960)
TOTAL 4,087,061 4,250,684 (163,623)
The main differences between French GAAP and Solvency II best estimate liabilities arise from the reserve adequacy amount, the claims discount as well as a broader scope of the ULAE definition.
Regarding ULAE, the French GAAP definition only includes claims expenses whereas the EBS definition also includes administrative and investment expenses.
SGP&C SE
As at December 31, 2016In EUR thousands
EBS Premium provisions
French GAAP Premium provisions Difference
Income protection (506) 3,394 (3,900)
Workers’ compensation (488) 155 (643)
Motor vehicle liability 11,419 36,227 (24,808)
Marine, aviation and transport (16,948) 63,967 (80,915)
Fire and other damage to property (61,076) 95,164 (156,240)
General liability 18,039 17,341 698
Credit and suretyship (15,194) 42,241 (57,435)
Miscellaneous financial loss 3,821 13,964 (10,143)
Non-proportional Health (2,705) 77 (2,782)
Non-proportional casualty (67,326) 53,831 (121,157)
Non-proportional marine, aviation and transport (16,224) 19,943 (36,167)
Non-proportional property 28,925 76,413 (47,488)
TOTAL (118,263) 422,717 (540,980)
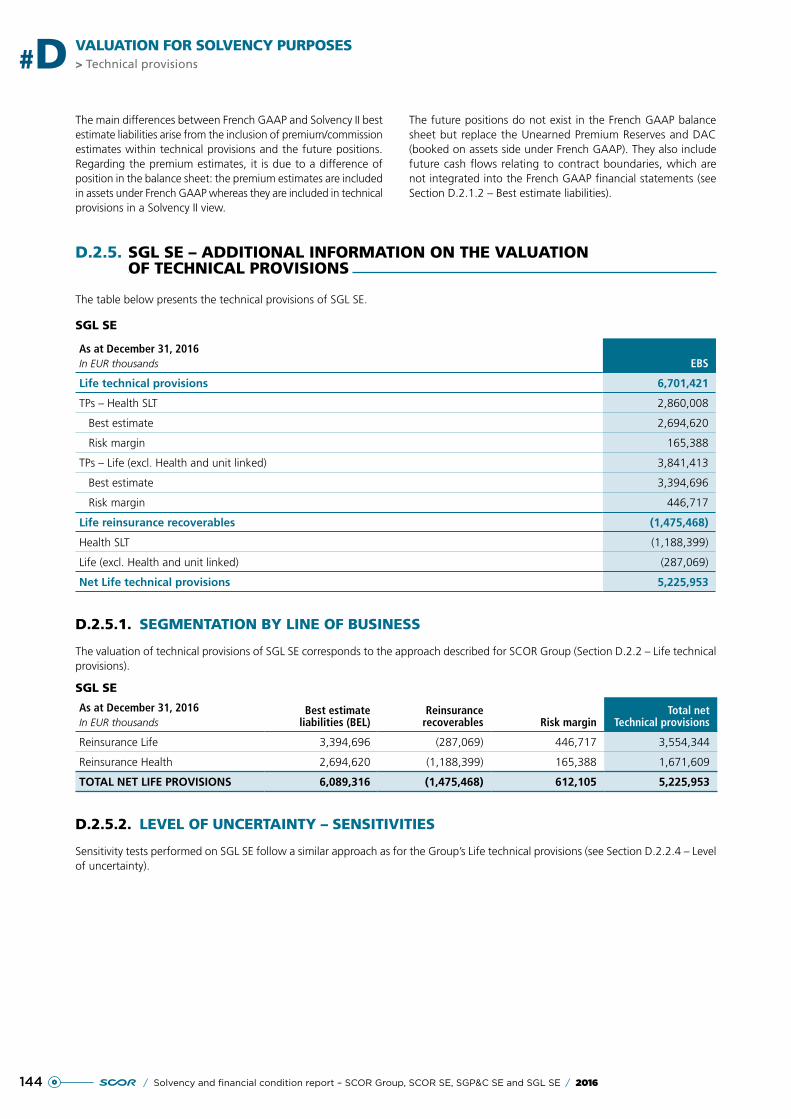
144 / Solvency and financial condition report – SCOR Group, SCOR SE, SGP&C SE and SGL SE / 2016
> Technical provisions#D VALUATION FOR SOLVENCY PURPOSES
The main differences between French GAAP and Solvency II best estimate liabilities arise from the inclusion of premium/commission estimates within technical provisions and the future positions. Regarding the premium estimates, it is due to a difference of position in the balance sheet: the premium estimates are included in assets under French GAAP whereas they are included in technical provisions in a Solvency II view.
The future positions do not exist in the French GAAP balance sheet but replace the Unearned Premium Reserves and DAC (booked on assets side under French GAAP). They also include future cash flows relating to contract boundaries, which are not integrated into the French GAAP financial statements (see Section D.2.1.2 – Best estimate liabilities).
D.2.5. SGL SE – ADDITIONAL INFORMATION ON THE VALUATION OF TECHNICAL PROVISIONS
The table below presents the technical provisions of SGL SE.
SGL SE
As at December 31, 2016In EUR thousands EBS
Life technical provisions 6,701,421
TPs – Health SLT 2,860,008
Best estimate 2,694,620
Risk margin 165,388
TPs – Life (excl. Health and unit linked) 3,841,413
Best estimate 3,394,696
Risk margin 446,717
Life reinsurance recoverables (1,475,468)
Health SLT (1,188,399)
Life (excl. Health and unit linked) (287,069)
Net Life technical provisions 5,225,953
D.2.5.1. SEGMENTATION BY LINE OF BUSINESS
The valuation of technical provisions of SGL SE corresponds to the approach described for SCOR Group (Section D.2.2 – Life technical provisions).
SGL SE
As at December 31, 2016In EUR thousands
Best estimate liabilities (BEL)
Reinsurance recoverables Risk margin
Total net Technical provisions
Reinsurance Life 3,394,696 (287,069) 446,717 3,554,344
Reinsurance Health 2,694,620 (1,188,399) 165,388 1,671,609
TOTAL NET LIFE PROVISIONS 6,089,316 (1,475,468) 612,105 5,225,953
D.2.5.2. LEVEL OF UNCERTAINTY – SENSITIVITIES
Sensitivity tests performed on SGL SE follow a similar approach as for the Group’s Life technical provisions (see Section D.2.2.4 – Level of uncertainty).
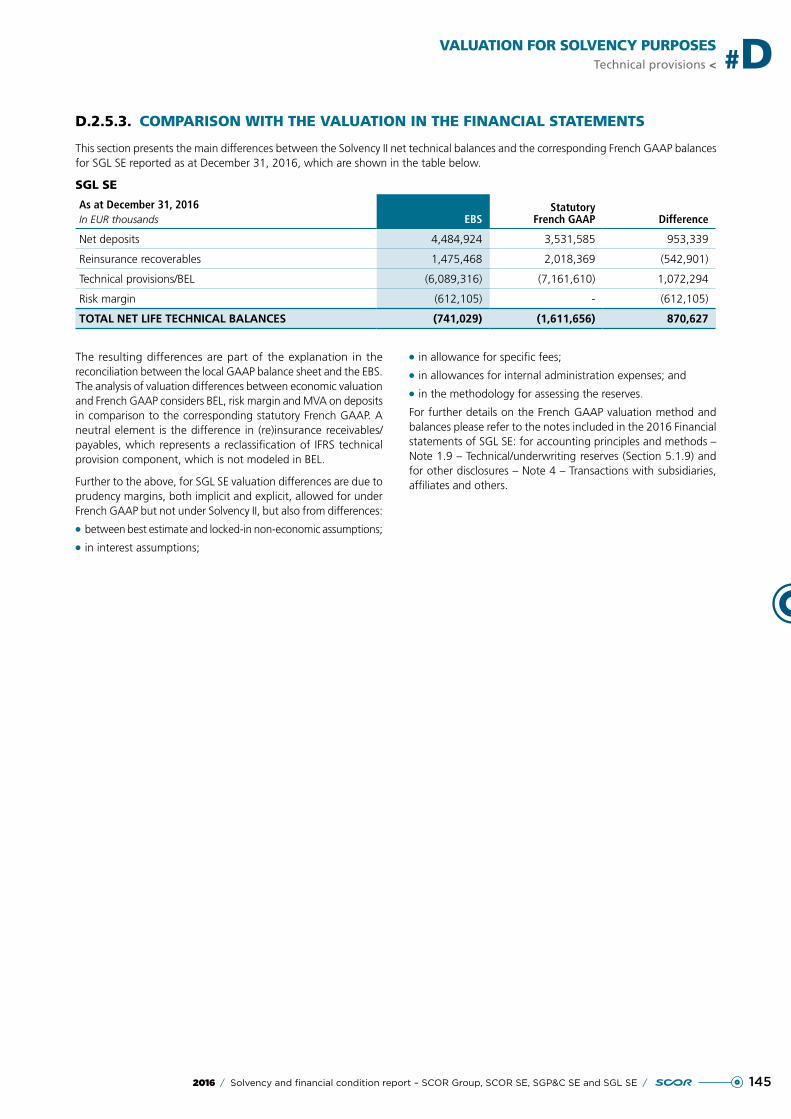
1452016 / Solvency and financial condition report – SCOR Group, SCOR SE, SGP&C SE and SGL SE /
VALUATION FOR SOLVENCY PURPOSESTechnical provisions < #D
D.2.5.3. COMPARISON WITH THE VALUATION IN THE FINANCIAL STATEMENTS
This section presents the main differences between the Solvency II net technical balances and the corresponding French GAAP balances for SGL SE reported as at December 31, 2016, which are shown in the table below.
SGL SE
As at December 31, 2016In EUR thousands EBS
StatutoryFrench GAAP Difference
Net deposits 4,484,924 3,531,585 953,339
Reinsurance recoverables 1,475,468 2,018,369 (542,901)
Technical provisions/BEL (6,089,316) (7,161,610) 1,072,294
Risk margin (612,105) - (612,105)
TOTAL NET LIFE TECHNICAL BALANCES (741,029) (1,611,656) 870,627
The resulting differences are part of the explanation in the reconciliation between the local GAAP balance sheet and the EBS. The analysis of valuation differences between economic valuation and French GAAP considers BEL, risk margin and MVA on deposits in comparison to the corresponding statutory French GAAP. A neutral element is the difference in (re)insurance receivables/payables, which represents a reclassification of IFRS technical provision component, which is not modeled in BEL.
Further to the above, for SGL SE valuation differences are due to prudency margins, both implicit and explicit, allowed for under French GAAP but not under Solvency II, but also from differences:
●● between best estimate and locked-in non-economic assumptions;
●● in interest assumptions;
●● in allowance for specific fees;
●● in allowances for internal administration expenses; and
●● in the methodology for assessing the reserves.
For further details on the French GAAP valuation method and balances please refer to the notes included in the 2016 Financial statements of SGL SE: for accounting principles and methods – Note 1.9 – Technical/underwriting reserves (Section 5.1.9) and for other disclosures – Note 4 – Transactions with subsidiaries, affiliates and others.
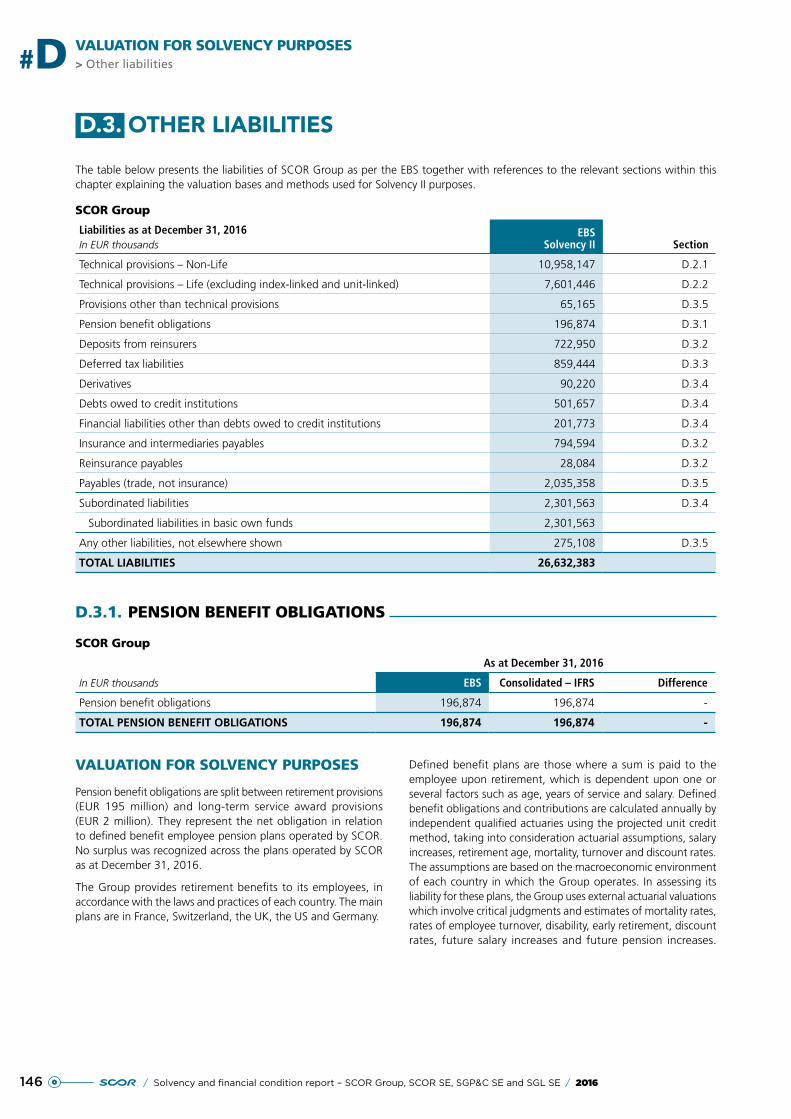
146 / Solvency and financial condition report – SCOR Group, SCOR SE, SGP&C SE and SGL SE / 2016
> Other liabilities#D VALUATION FOR SOLVENCY PURPOSES
D.3. OTHER LIABILITIES
The table below presents the liabilities of SCOR Group as per the EBS together with references to the relevant sections within this chapter explaining the valuation bases and methods used for Solvency II purposes.
SCOR Group
Liabilities as at December 31, 2016In EUR thousands
EBSSolvency II Section
Technical provisions – Non-Life 10,958,147 D.2.1
Technical provisions – Life (excluding index-linked and unit-linked) 7,601,446 D.2.2
Provisions other than technical provisions 65,165 D.3.5
Pension benefit obligations 196,874 D.3.1
Deposits from reinsurers 722,950 D.3.2
Deferred tax liabilities 859,444 D.3.3
Derivatives 90,220 D.3.4
Debts owed to credit institutions 501,657 D.3.4
Financial liabilities other than debts owed to credit institutions 201,773 D.3.4
Insurance and intermediaries payables 794,594 D.3.2
Reinsurance payables 28,084 D.3.2
Payables (trade, not insurance) 2,035,358 D.3.5
Subordinated liabilities 2,301,563 D.3.4
Subordinated liabilities in basic own funds 2,301,563
Any other liabilities, not elsewhere shown 275,108 D.3.5
TOTAL LIABILITIES 26,632,383
D.3.1. PENSION BENEFIT OBLIGATIONS
SCOR Group
In EUR thousands
As at December 31, 2016
EBS Consolidated – IFRS Difference
Pension benefit obligations 196,874 196,874 -
TOTAL PENSION BENEFIT OBLIGATIONS 196,874 196,874 -
VALUATION FOR SOLVENCY PURPOSES
Pension benefit obligations are split between retirement provisions (EUR 195 million) and long-term service award provisions (EUR 2 million). They represent the net obligation in relation to defined benefit employee pension plans operated by SCOR. No surplus was recognized across the plans operated by SCOR as at December 31, 2016.
The Group provides retirement benefits to its employees, in accordance with the laws and practices of each country. The main plans are in France, Switzerland, the UK, the US and Germany.
Defined benefit plans are those where a sum is paid to the employee upon retirement, which is dependent upon one or several factors such as age, years of service and salary. Defined benefit obligations and contributions are calculated annually by independent qualified actuaries using the projected unit credit method, taking into consideration actuarial assumptions, salary increases, retirement age, mortality, turnover and discount rates. The assumptions are based on the macroeconomic environment of each country in which the Group operates. In assessing its liability for these plans, the Group uses external actuarial valuations which involve critical judgments and estimates of mortality rates, rates of employee turnover, disability, early retirement, discount rates, future salary increases and future pension increases.
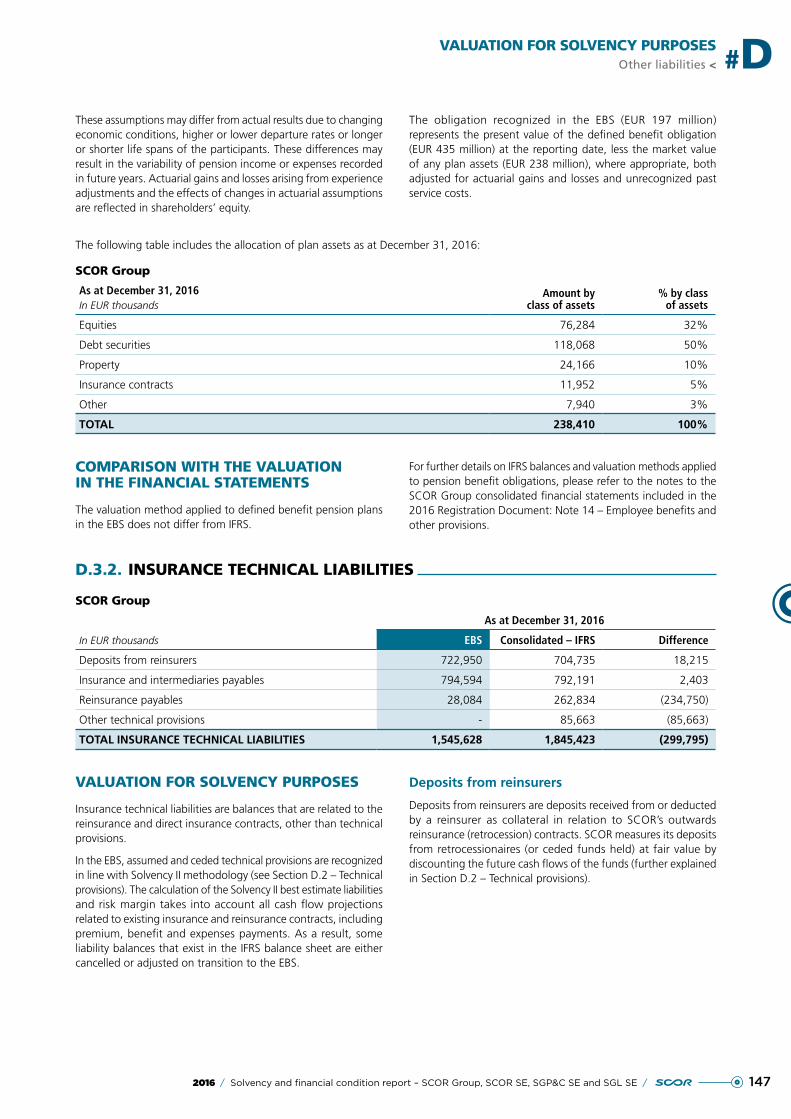
1472016 / Solvency and financial condition report – SCOR Group, SCOR SE, SGP&C SE and SGL SE /
VALUATION FOR SOLVENCY PURPOSESOther liabilities < #D
These assumptions may differ from actual results due to changing economic conditions, higher or lower departure rates or longer or shorter life spans of the participants. These differences may result in the variability of pension income or expenses recorded in future years. Actuarial gains and losses arising from experience adjustments and the effects of changes in actuarial assumptions are reflected in shareholders’ equity.
The obligation recognized in the EBS (EUR 197 million) represents the present value of the defined benefit obligation (EUR 435 million) at the reporting date, less the market value of any plan assets (EUR 238 million), where appropriate, both adjusted for actuarial gains and losses and unrecognized past service costs.
The following table includes the allocation of plan assets as at December 31, 2016:
SCOR Group
As at December 31, 2016In EUR thousands
Amount by class of assets
% by class of assets
Equities 76,284 32%
Debt securities 118,068 50%
Property 24,166 10%
Insurance contracts 11,952 5%
Other 7,940 3%
TOTAL 238,410 100%
COMPARISON WITH THE VALUATION IN THE FINANCIAL STATEMENTS
The valuation method applied to defined benefit pension plans in the EBS does not differ from IFRS.
For further details on IFRS balances and valuation methods applied to pension benefit obligations, please refer to the notes to the SCOR Group consolidated financial statements included in the 2016 Registration Document: Note 14 – Employee benefits and other provisions.
D.3.2. INSURANCE TECHNICAL LIABILITIES
SCOR Group
In EUR thousands
As at December 31, 2016
EBS Consolidated – IFRS Difference
Deposits from reinsurers 722,950 704,735 18,215
Insurance and intermediaries payables 794,594 792,191 2,403
Reinsurance payables 28,084 262,834 (234,750)
Other technical provisions - 85,663 (85,663)
TOTAL INSURANCE TECHNICAL LIABILITIES 1,545,628 1,845,423 (299,795)
VALUATION FOR SOLVENCY PURPOSES
Insurance technical liabilities are balances that are related to the reinsurance and direct insurance contracts, other than technical provisions.
In the EBS, assumed and ceded technical provisions are recognized in line with Solvency II methodology (see Section D.2 – Technical provisions). The calculation of the Solvency II best estimate liabilities and risk margin takes into account all cash flow projections related to existing insurance and reinsurance contracts, including premium, benefit and expenses payments. As a result, some liability balances that exist in the IFRS balance sheet are either cancelled or adjusted on transition to the EBS.
Deposits from reinsurers
Deposits from reinsurers are deposits received from or deducted by a reinsurer as collateral in relation to SCOR’s outwards reinsurance (retrocession) contracts. SCOR measures its deposits from retrocessionaires (or ceded funds held) at fair value by discounting the future cash flows of the funds (further explained in Section D.2 – Technical provisions).
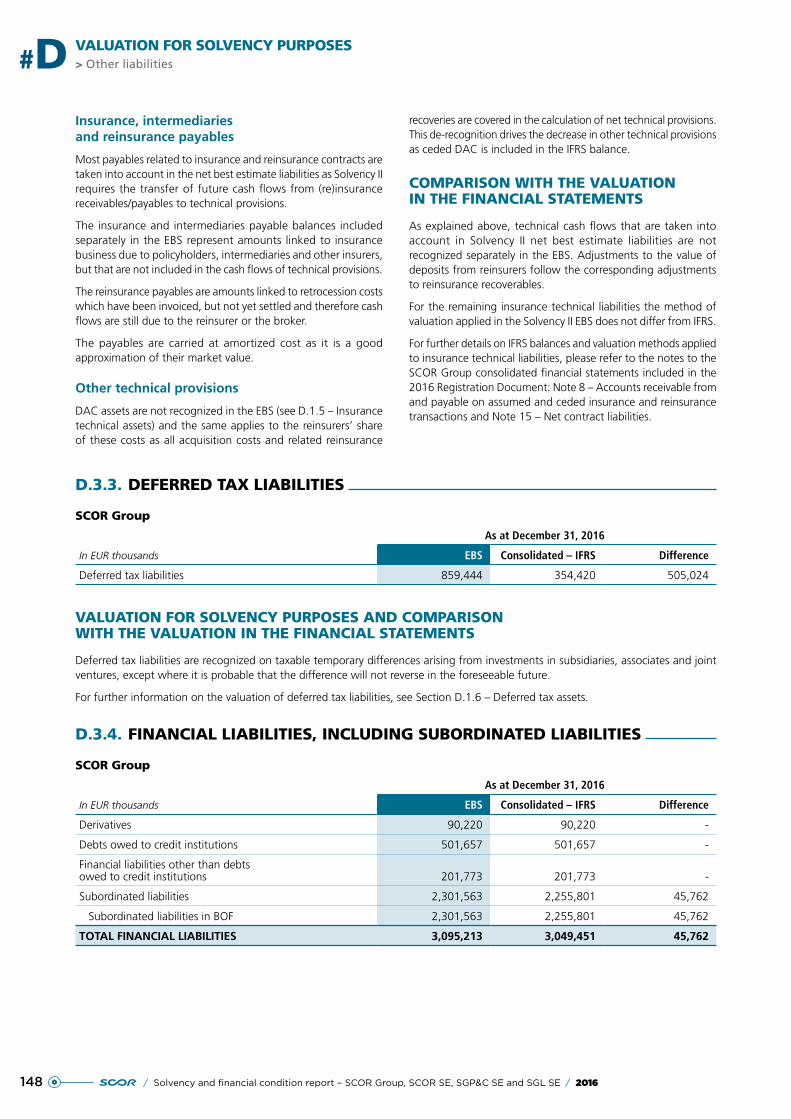
148 / Solvency and financial condition report – SCOR Group, SCOR SE, SGP&C SE and SGL SE / 2016
> Other liabilities#D VALUATION FOR SOLVENCY PURPOSES
Insurance, intermediaries and reinsurance payables
Most payables related to insurance and reinsurance contracts are taken into account in the net best estimate liabilities as Solvency II requires the transfer of future cash flows from (re)insurance receivables/payables to technical provisions.
The insurance and intermediaries payable balances included separately in the EBS represent amounts linked to insurance business due to policyholders, intermediaries and other insurers, but that are not included in the cash flows of technical provisions.
The reinsurance payables are amounts linked to retrocession costs which have been invoiced, but not yet settled and therefore cash flows are still due to the reinsurer or the broker.
The payables are carried at amortized cost as it is a good approximation of their market value.
Other technical provisions
DAC assets are not recognized in the EBS (see D.1.5 – Insurance technical assets) and the same applies to the reinsurers’ share of these costs as all acquisition costs and related reinsurance
recoveries are covered in the calculation of net technical provisions. This de-recognition drives the decrease in other technical provisions as ceded DAC is included in the IFRS balance.
COMPARISON WITH THE VALUATION IN THE FINANCIAL STATEMENTS
As explained above, technical cash flows that are taken into account in Solvency II net best estimate liabilities are not recognized separately in the EBS. Adjustments to the value of deposits from reinsurers follow the corresponding adjustments to reinsurance recoverables.
For the remaining insurance technical liabilities the method of valuation applied in the Solvency II EBS does not differ from IFRS.
For further details on IFRS balances and valuation methods applied to insurance technical liabilities, please refer to the notes to the SCOR Group consolidated financial statements included in the 2016 Registration Document: Note 8 – Accounts receivable from and payable on assumed and ceded insurance and reinsurance transactions and Note 15 – Net contract liabilities.
D.3.3. DEFERRED TAX LIABILITIES
SCOR Group
In EUR thousands
As at December 31, 2016
EBS Consolidated – IFRS Difference
Deferred tax liabilities 859,444 354,420 505,024
VALUATION FOR SOLVENCY PURPOSES AND COMPARISON WITH THE VALUATION IN THE FINANCIAL STATEMENTS
Deferred tax liabilities are recognized on taxable temporary differences arising from investments in subsidiaries, associates and joint ventures, except where it is probable that the difference will not reverse in the foreseeable future.
For further information on the valuation of deferred tax liabilities, see Section D.1.6 – Deferred tax assets.
D.3.4. FINANCIAL LIABILITIES, INCLUDING SUBORDINATED LIABILITIES
SCOR Group
In EUR thousands
As at December 31, 2016
EBS Consolidated – IFRS Difference
Derivatives 90,220 90,220 -
Debts owed to credit institutions 501,657 501,657 -
Financial liabilities other than debts owed to credit institutions 201,773 201,773 -
Subordinated liabilities 2,301,563 2,255,801 45,762
Subordinated liabilities in BOF 2,301,563 2,255,801 45,762
TOTAL FINANCIAL LIABILITIES 3,095,213 3,049,451 45,762
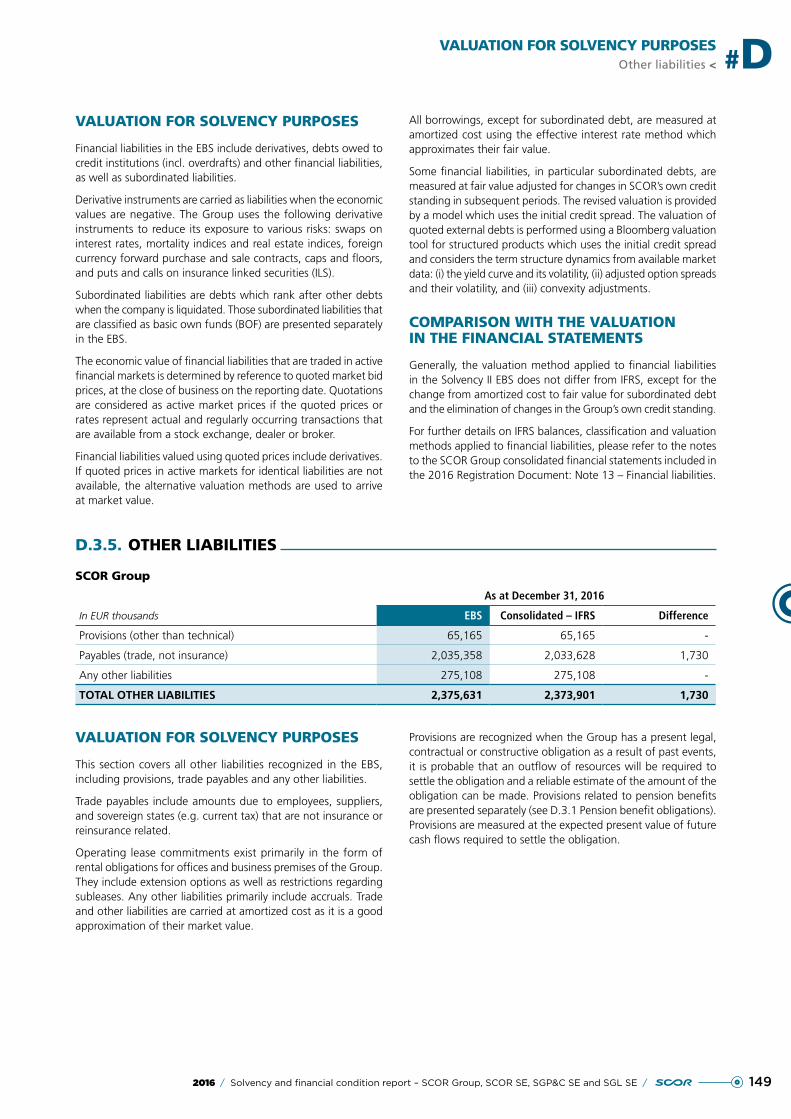
1492016 / Solvency and financial condition report – SCOR Group, SCOR SE, SGP&C SE and SGL SE /
VALUATION FOR SOLVENCY PURPOSESOther liabilities < #D
VALUATION FOR SOLVENCY PURPOSES
Financial liabilities in the EBS include derivatives, debts owed to credit institutions (incl. overdrafts) and other financial liabilities, as well as subordinated liabilities.
Derivative instruments are carried as liabilities when the economic values are negative. The Group uses the following derivative instruments to reduce its exposure to various risks: swaps on interest rates, mortality indices and real estate indices, foreign currency forward purchase and sale contracts, caps and floors, and puts and calls on insurance linked securities (ILS).
Subordinated liabilities are debts which rank after other debts when the company is liquidated. Those subordinated liabilities that are classified as basic own funds (BOF) are presented separately in the EBS.
The economic value of financial liabilities that are traded in active financial markets is determined by reference to quoted market bid prices, at the close of business on the reporting date. Quotations are considered as active market prices if the quoted prices or rates represent actual and regularly occurring transactions that are available from a stock exchange, dealer or broker.
Financial liabilities valued using quoted prices include derivatives. If quoted prices in active markets for identical liabilities are not available, the alternative valuation methods are used to arrive at market value.
All borrowings, except for subordinated debt, are measured at amortized cost using the effective interest rate method which approximates their fair value.
Some financial liabilities, in particular subordinated debts, are measured at fair value adjusted for changes in SCOR’s own credit standing in subsequent periods. The revised valuation is provided by a model which uses the initial credit spread. The valuation of quoted external debts is performed using a Bloomberg valuation tool for structured products which uses the initial credit spread and considers the term structure dynamics from available market data: (i) the yield curve and its volatility, (ii) adjusted option spreads and their volatility, and (iii) convexity adjustments.
COMPARISON WITH THE VALUATION IN THE FINANCIAL STATEMENTS
Generally, the valuation method applied to financial liabilities in the Solvency II EBS does not differ from IFRS, except for the change from amortized cost to fair value for subordinated debt and the elimination of changes in the Group’s own credit standing.
For further details on IFRS balances, classification and valuation methods applied to financial liabilities, please refer to the notes to the SCOR Group consolidated financial statements included in the 2016 Registration Document: Note 13 – Financial liabilities.
D.3.5. OTHER LIABILITIES
SCOR Group
In EUR thousands
As at December 31, 2016
EBS Consolidated – IFRS Difference
Provisions (other than technical) 65,165 65,165 -
Payables (trade, not insurance) 2,035,358 2,033,628 1,730
Any other liabilities 275,108 275,108 -
TOTAL OTHER LIABILITIES 2,375,631 2,373,901 1,730
VALUATION FOR SOLVENCY PURPOSES
This section covers all other liabilities recognized in the EBS, including provisions, trade payables and any other liabilities.
Trade payables include amounts due to employees, suppliers, and sovereign states (e.g. current tax) that are not insurance or reinsurance related.
Operating lease commitments exist primarily in the form of rental obligations for offices and business premises of the Group. They include extension options as well as restrictions regarding subleases. Any other liabilities primarily include accruals. Trade and other liabilities are carried at amortized cost as it is a good approximation of their market value.
Provisions are recognized when the Group has a present legal, contractual or constructive obligation as a result of past events, it is probable that an outflow of resources will be required to settle the obligation and a reliable estimate of the amount of the obligation can be made. Provisions related to pension benefits are presented separately (see D.3.1 Pension benefit obligations). Provisions are measured at the expected present value of future cash flows required to settle the obligation.
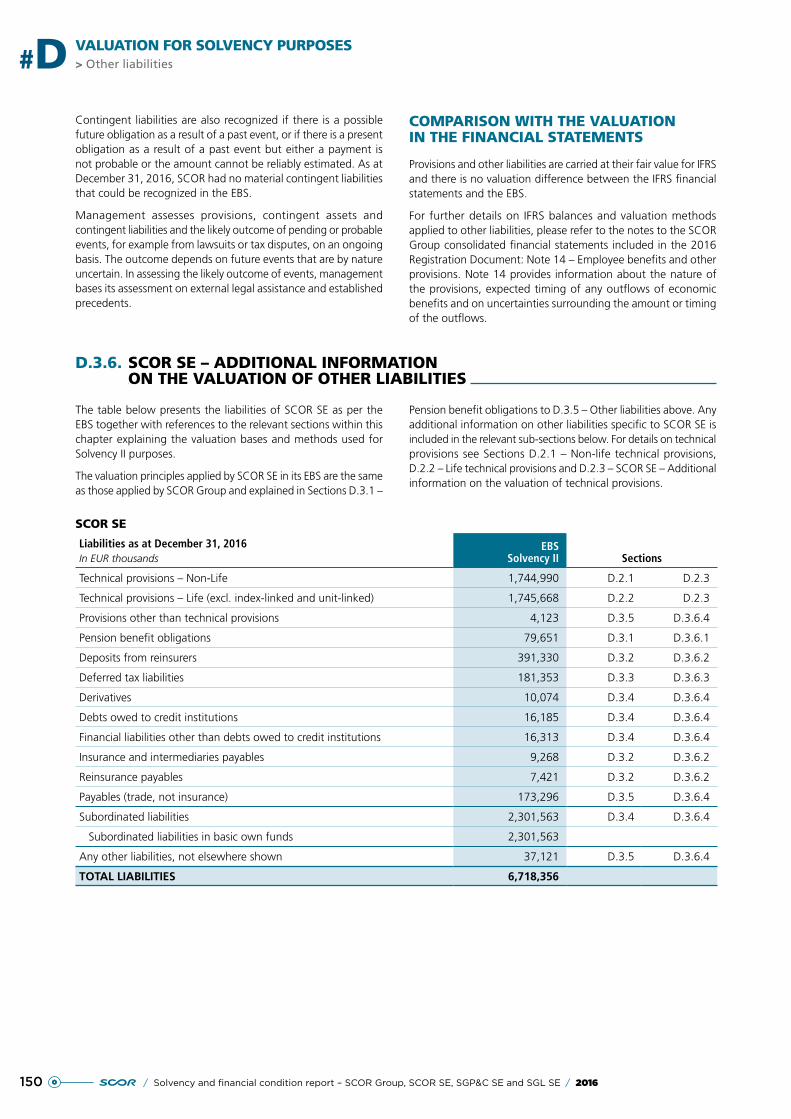
150 / Solvency and financial condition report – SCOR Group, SCOR SE, SGP&C SE and SGL SE / 2016
> Other liabilities#D VALUATION FOR SOLVENCY PURPOSES
Contingent liabilities are also recognized if there is a possible future obligation as a result of a past event, or if there is a present obligation as a result of a past event but either a payment is not probable or the amount cannot be reliably estimated. As at December 31, 2016, SCOR had no material contingent liabilities that could be recognized in the EBS.
Management assesses provisions, contingent assets and contingent liabilities and the likely outcome of pending or probable events, for example from lawsuits or tax disputes, on an ongoing basis. The outcome depends on future events that are by nature uncertain. In assessing the likely outcome of events, management bases its assessment on external legal assistance and established precedents.
COMPARISON WITH THE VALUATION IN THE FINANCIAL STATEMENTS
Provisions and other liabilities are carried at their fair value for IFRS and there is no valuation difference between the IFRS financial statements and the EBS.
For further details on IFRS balances and valuation methods applied to other liabilities, please refer to the notes to the SCOR Group consolidated financial statements included in the 2016 Registration Document: Note 14 – Employee benefits and other provisions. Note 14 provides information about the nature of the provisions, expected timing of any outflows of economic benefits and on uncertainties surrounding the amount or timing of the outflows.
D.3.6. SCOR SE – ADDITIONAL INFORMATION ON THE VALUATION OF OTHER LIABILITIES
The table below presents the liabilities of SCOR SE as per the EBS together with references to the relevant sections within this chapter explaining the valuation bases and methods used for Solvency II purposes.
The valuation principles applied by SCOR SE in its EBS are the same as those applied by SCOR Group and explained in Sections D.3.1 –
Pension benefit obligations to D.3.5 – Other liabilities above. Any additional information on other liabilities specific to SCOR SE is included in the relevant sub-sections below. For details on technical provisions see Sections D.2.1 – Non-life technical provisions, D.2.2 – Life technical provisions and D.2.3 – SCOR SE – Additional information on the valuation of technical provisions.
SCOR SE
Liabilities as at December 31, 2016In EUR thousands
EBSSolvency II Sections
Technical provisions – Non-Life 1,744,990 D.2.1 D.2.3
Technical provisions – Life (excl. index-linked and unit-linked) 1,745,668 D.2.2 D.2.3
Provisions other than technical provisions 4,123 D.3.5 D.3.6.4
Pension benefit obligations 79,651 D.3.1 D.3.6.1
Deposits from reinsurers 391,330 D.3.2 D.3.6.2
Deferred tax liabilities 181,353 D.3.3 D.3.6.3
Derivatives 10,074 D.3.4 D.3.6.4
Debts owed to credit institutions 16,185 D.3.4 D.3.6.4
Financial liabilities other than debts owed to credit institutions 16,313 D.3.4 D.3.6.4
Insurance and intermediaries payables 9,268 D.3.2 D.3.6.2
Reinsurance payables 7,421 D.3.2 D.3.6.2
Payables (trade, not insurance) 173,296 D.3.5 D.3.6.4
Subordinated liabilities 2,301,563 D.3.4 D.3.6.4
Subordinated liabilities in basic own funds 2,301,563
Any other liabilities, not elsewhere shown 37,121 D.3.5 D.3.6.4
TOTAL LIABILITIES 6,718,356
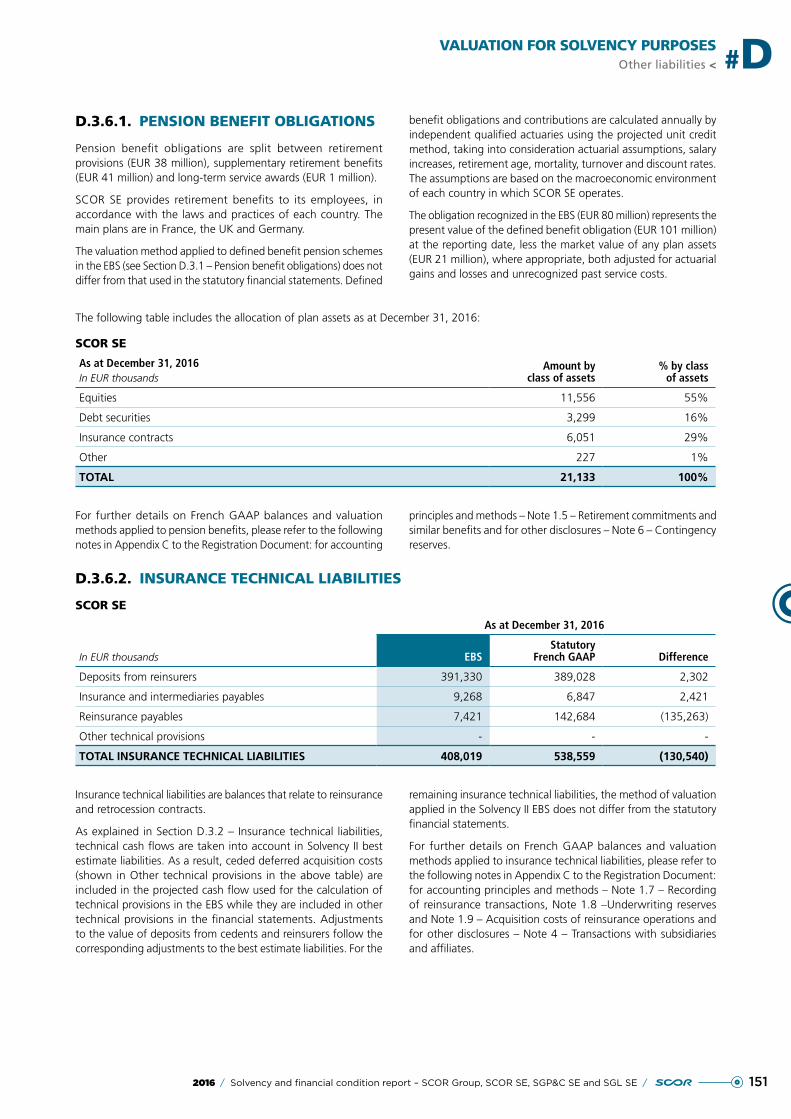
1512016 / Solvency and financial condition report – SCOR Group, SCOR SE, SGP&C SE and SGL SE /
VALUATION FOR SOLVENCY PURPOSESOther liabilities < #D
D.3.6.1. PENSION BENEFIT OBLIGATIONS
Pension benefit obligations are split between retirement provisions (EUR 38 million), supplementary retirement benefits (EUR 41 million) and long-term service awards (EUR 1 million).
SCOR SE provides retirement benefits to its employees, in accordance with the laws and practices of each country. The main plans are in France, the UK and Germany.
The valuation method applied to defined benefit pension schemes in the EBS (see Section D.3.1 – Pension benefit obligations) does not differ from that used in the statutory financial statements. Defined
benefit obligations and contributions are calculated annually by independent qualified actuaries using the projected unit credit method, taking into consideration actuarial assumptions, salary increases, retirement age, mortality, turnover and discount rates. The assumptions are based on the macroeconomic environment of each country in which SCOR SE operates.
The obligation recognized in the EBS (EUR 80 million) represents the present value of the defined benefit obligation (EUR 101 million) at the reporting date, less the market value of any plan assets (EUR 21 million), where appropriate, both adjusted for actuarial gains and losses and unrecognized past service costs.
The following table includes the allocation of plan assets as at December 31, 2016:
SCOR SE
As at December 31, 2016In EUR thousands
Amount by class of assets
% by class of assets
Equities 11,556 55%
Debt securities 3,299 16%
Insurance contracts 6,051 29%
Other 227 1%
TOTAL 21,133 100%
For further details on French GAAP balances and valuation methods applied to pension benefits, please refer to the following notes in Appendix C to the Registration Document: for accounting
principles and methods – Note 1.5 – Retirement commitments and similar benefits and for other disclosures – Note 6 – Contingency reserves.
D.3.6.2. INSURANCE TECHNICAL LIABILITIES
SCOR SE
In EUR thousands
As at December 31, 2016
EBSStatutory
French GAAP Difference
Deposits from reinsurers 391,330 389,028 2,302
Insurance and intermediaries payables 9,268 6,847 2,421
Reinsurance payables 7,421 142,684 (135,263)
Other technical provisions - - -
TOTAL INSURANCE TECHNICAL LIABILITIES 408,019 538,559 (130,540)
Insurance technical liabilities are balances that relate to reinsurance and retrocession contracts.
As explained in Section D.3.2 – Insurance technical liabilities, technical cash flows are taken into account in Solvency II best estimate liabilities. As a result, ceded deferred acquisition costs (shown in Other technical provisions in the above table) are included in the projected cash flow used for the calculation of technical provisions in the EBS while they are included in other technical provisions in the financial statements. Adjustments to the value of deposits from cedents and reinsurers follow the corresponding adjustments to the best estimate liabilities. For the
remaining insurance technical liabilities, the method of valuation applied in the Solvency II EBS does not differ from the statutory financial statements.
For further details on French GAAP balances and valuation methods applied to insurance technical liabilities, please refer to the following notes in Appendix C to the Registration Document: for accounting principles and methods – Note 1.7 – Recording of reinsurance transactions, Note 1.8 –Underwriting reserves and Note 1.9 – Acquisition costs of reinsurance operations and for other disclosures – Note 4 – Transactions with subsidiaries and affiliates.
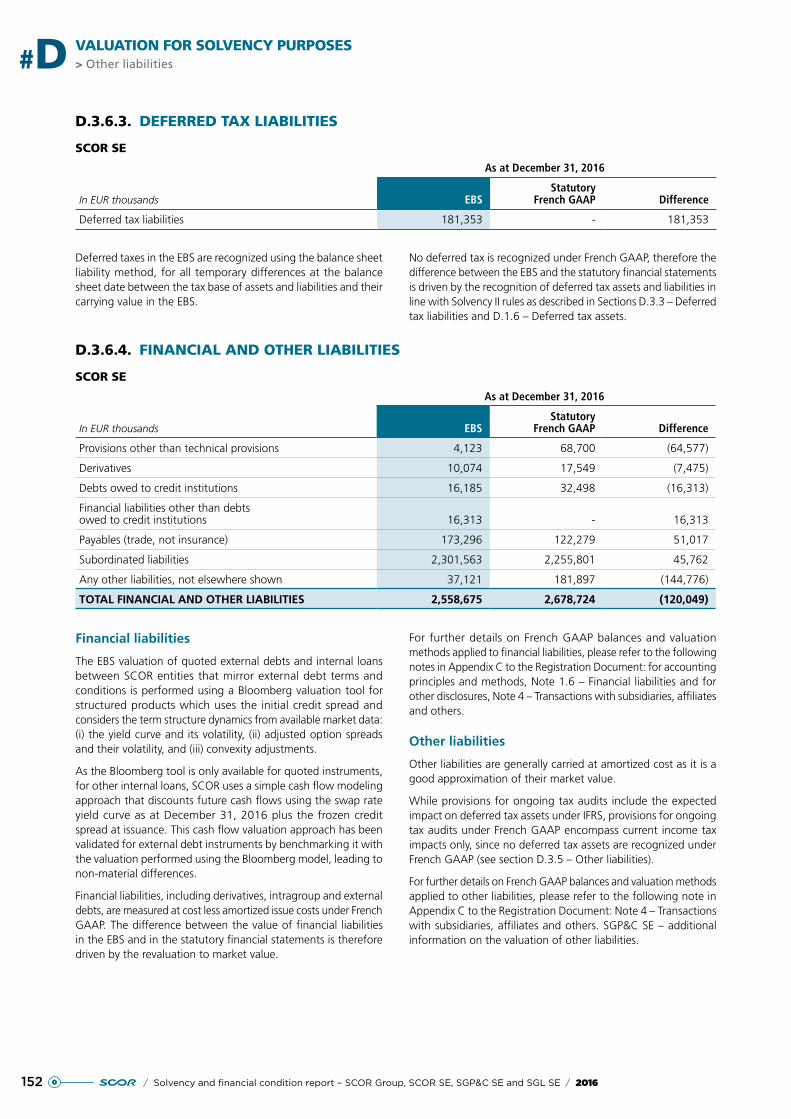
152 / Solvency and financial condition report – SCOR Group, SCOR SE, SGP&C SE and SGL SE / 2016
> Other liabilities#D VALUATION FOR SOLVENCY PURPOSES
D.3.6.3. DEFERRED TAX LIABILITIES
SCOR SE
In EUR thousands
As at December 31, 2016
EBSStatutory
French GAAP Difference
Deferred tax liabilities 181,353 - 181,353
Deferred taxes in the EBS are recognized using the balance sheet liability method, for all temporary differences at the balance sheet date between the tax base of assets and liabilities and their carrying value in the EBS.
No deferred tax is recognized under French GAAP, therefore the difference between the EBS and the statutory financial statements is driven by the recognition of deferred tax assets and liabilities in line with Solvency II rules as described in Sections D.3.3 – Deferred tax liabilities and D.1.6 – Deferred tax assets.
D.3.6.4. FINANCIAL AND OTHER LIABILITIES
SCOR SE
In EUR thousands
As at December 31, 2016
EBSStatutory
French GAAP Difference
Provisions other than technical provisions 4,123 68,700 (64,577)
Derivatives 10,074 17,549 (7,475)
Debts owed to credit institutions 16,185 32,498 (16,313)
Financial liabilities other than debts owed to credit institutions 16,313 - 16,313
Payables (trade, not insurance) 173,296 122,279 51,017
Subordinated liabilities 2,301,563 2,255,801 45,762
Any other liabilities, not elsewhere shown 37,121 181,897 (144,776)
TOTAL FINANCIAL AND OTHER LIABILITIES 2,558,675 2,678,724 (120,049)
Financial liabilities
The EBS valuation of quoted external debts and internal loans between SCOR entities that mirror external debt terms and conditions is performed using a Bloomberg valuation tool for structured products which uses the initial credit spread and considers the term structure dynamics from available market data: (i) the yield curve and its volatility, (ii) adjusted option spreads and their volatility, and (iii) convexity adjustments.
As the Bloomberg tool is only available for quoted instruments, for other internal loans, SCOR uses a simple cash flow modeling approach that discounts future cash flows using the swap rate yield curve as at December 31, 2016 plus the frozen credit spread at issuance. This cash flow valuation approach has been validated for external debt instruments by benchmarking it with the valuation performed using the Bloomberg model, leading to non-material differences.
Financial liabilities, including derivatives, intragroup and external debts, are measured at cost less amortized issue costs under French GAAP. The difference between the value of financial liabilities in the EBS and in the statutory financial statements is therefore driven by the revaluation to market value.
For further details on French GAAP balances and valuation methods applied to financial liabilities, please refer to the following notes in Appendix C to the Registration Document: for accounting principles and methods, Note 1.6 – Financial liabilities and for other disclosures, Note 4 – Transactions with subsidiaries, affiliates and others.
Other liabilities
Other liabilities are generally carried at amortized cost as it is a good approximation of their market value.
While provisions for ongoing tax audits include the expected impact on deferred tax assets under IFRS, provisions for ongoing tax audits under French GAAP encompass current income tax impacts only, since no deferred tax assets are recognized under French GAAP (see section D.3.5 – Other liabilities).
For further details on French GAAP balances and valuation methods applied to other liabilities, please refer to the following note in Appendix C to the Registration Document: Note 4 – Transactions with subsidiaries, affiliates and others. SGP&C SE – additional information on the valuation of other liabilities.
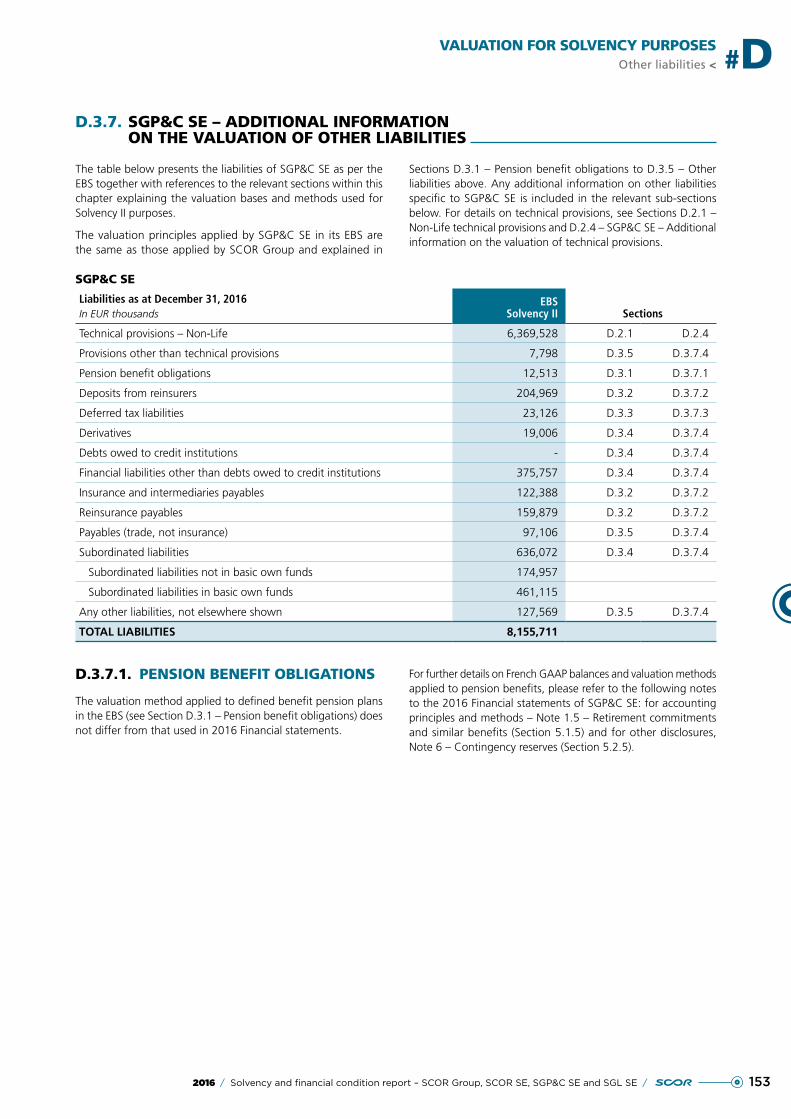
1532016 / Solvency and financial condition report – SCOR Group, SCOR SE, SGP&C SE and SGL SE /
VALUATION FOR SOLVENCY PURPOSESOther liabilities < #D
D.3.7. SGP&C SE – ADDITIONAL INFORMATION ON THE VALUATION OF OTHER LIABILITIES
The table below presents the liabilities of SGP&C SE as per the EBS together with references to the relevant sections within this chapter explaining the valuation bases and methods used for Solvency II purposes.
The valuation principles applied by SGP&C SE in its EBS are the same as those applied by SCOR Group and explained in
Sections D.3.1 – Pension benefit obligations to D.3.5 – Other liabilities above. Any additional information on other liabilities specific to SGP&C SE is included in the relevant sub-sections below. For details on technical provisions, see Sections D.2.1 – Non-Life technical provisions and D.2.4 – SGP&C SE – Additional information on the valuation of technical provisions.
SGP&C SE
Liabilities as at December 31, 2016In EUR thousands
EBSSolvency II Sections
Technical provisions – Non-Life 6,369,528 D.2.1 D.2.4
Provisions other than technical provisions 7,798 D.3.5 D.3.7.4
Pension benefit obligations 12,513 D.3.1 D.3.7.1
Deposits from reinsurers 204,969 D.3.2 D.3.7.2
Deferred tax liabilities 23,126 D.3.3 D.3.7.3
Derivatives 19,006 D.3.4 D.3.7.4
Debts owed to credit institutions - D.3.4 D.3.7.4
Financial liabilities other than debts owed to credit institutions 375,757 D.3.4 D.3.7.4
Insurance and intermediaries payables 122,388 D.3.2 D.3.7.2
Reinsurance payables 159,879 D.3.2 D.3.7.2
Payables (trade, not insurance) 97,106 D.3.5 D.3.7.4
Subordinated liabilities 636,072 D.3.4 D.3.7.4
Subordinated liabilities not in basic own funds 174,957
Subordinated liabilities in basic own funds 461,115
Any other liabilities, not elsewhere shown 127,569 D.3.5 D.3.7.4
TOTAL LIABILITIES 8,155,711
D.3.7.1. PENSION BENEFIT OBLIGATIONS
The valuation method applied to defined benefit pension plans in the EBS (see Section D.3.1 – Pension benefit obligations) does not differ from that used in 2016 Financial statements.
For further details on French GAAP balances and valuation methods applied to pension benefits, please refer to the following notes to the 2016 Financial statements of SGP&C SE: for accounting principles and methods – Note 1.5 – Retirement commitments and similar benefits (Section 5.1.5) and for other disclosures, Note 6 – Contingency reserves (Section 5.2.5).
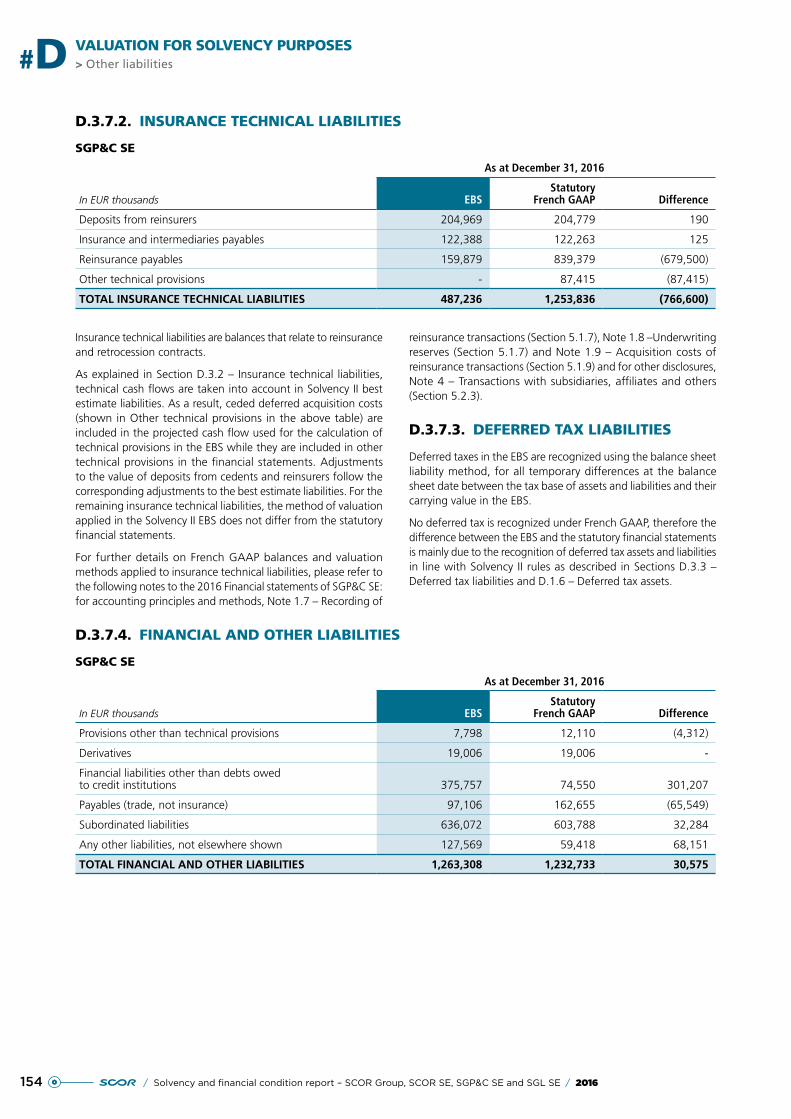
154 / Solvency and financial condition report – SCOR Group, SCOR SE, SGP&C SE and SGL SE / 2016
> Other liabilities#D VALUATION FOR SOLVENCY PURPOSES
D.3.7.2. INSURANCE TECHNICAL LIABILITIES
SGP&C SE
In EUR thousands
As at December 31, 2016
EBSStatutory
French GAAP Difference
Deposits from reinsurers 204,969 204,779 190
Insurance and intermediaries payables 122,388 122,263 125
Reinsurance payables 159,879 839,379 (679,500)
Other technical provisions - 87,415 (87,415)
TOTAL INSURANCE TECHNICAL LIABILITIES 487,236 1,253,836 (766,600)
Insurance technical liabilities are balances that relate to reinsurance and retrocession contracts.
As explained in Section D.3.2 – Insurance technical liabilities, technical cash flows are taken into account in Solvency II best estimate liabilities. As a result, ceded deferred acquisition costs (shown in Other technical provisions in the above table) are included in the projected cash flow used for the calculation of technical provisions in the EBS while they are included in other technical provisions in the financial statements. Adjustments to the value of deposits from cedents and reinsurers follow the corresponding adjustments to the best estimate liabilities. For the remaining insurance technical liabilities, the method of valuation applied in the Solvency II EBS does not differ from the statutory financial statements.
For further details on French GAAP balances and valuation methods applied to insurance technical liabilities, please refer to the following notes to the 2016 Financial statements of SGP&C SE: for accounting principles and methods, Note 1.7 – Recording of
reinsurance transactions (Section 5.1.7), Note 1.8 –Underwriting reserves (Section 5.1.7) and Note 1.9 – Acquisition costs of reinsurance transactions (Section 5.1.9) and for other disclosures, Note 4 – Transactions with subsidiaries, affiliates and others (Section 5.2.3).
D.3.7.3. DEFERRED TAX LIABILITIES
Deferred taxes in the EBS are recognized using the balance sheet liability method, for all temporary differences at the balance sheet date between the tax base of assets and liabilities and their carrying value in the EBS.
No deferred tax is recognized under French GAAP, therefore the difference between the EBS and the statutory financial statements is mainly due to the recognition of deferred tax assets and liabilities in line with Solvency II rules as described in Sections D.3.3 – Deferred tax liabilities and D.1.6 – Deferred tax assets.
D.3.7.4. FINANCIAL AND OTHER LIABILITIES
SGP&C SE
In EUR thousands
As at December 31, 2016
EBSStatutory
French GAAP Difference
Provisions other than technical provisions 7,798 12,110 (4,312)
Derivatives 19,006 19,006 -
Financial liabilities other than debts owed to credit institutions 375,757 74,550 301,207
Payables (trade, not insurance) 97,106 162,655 (65,549)
Subordinated liabilities 636,072 603,788 32,284
Any other liabilities, not elsewhere shown 127,569 59,418 68,151
TOTAL FINANCIAL AND OTHER LIABILITIES 1,263,308 1,232,733 30,575
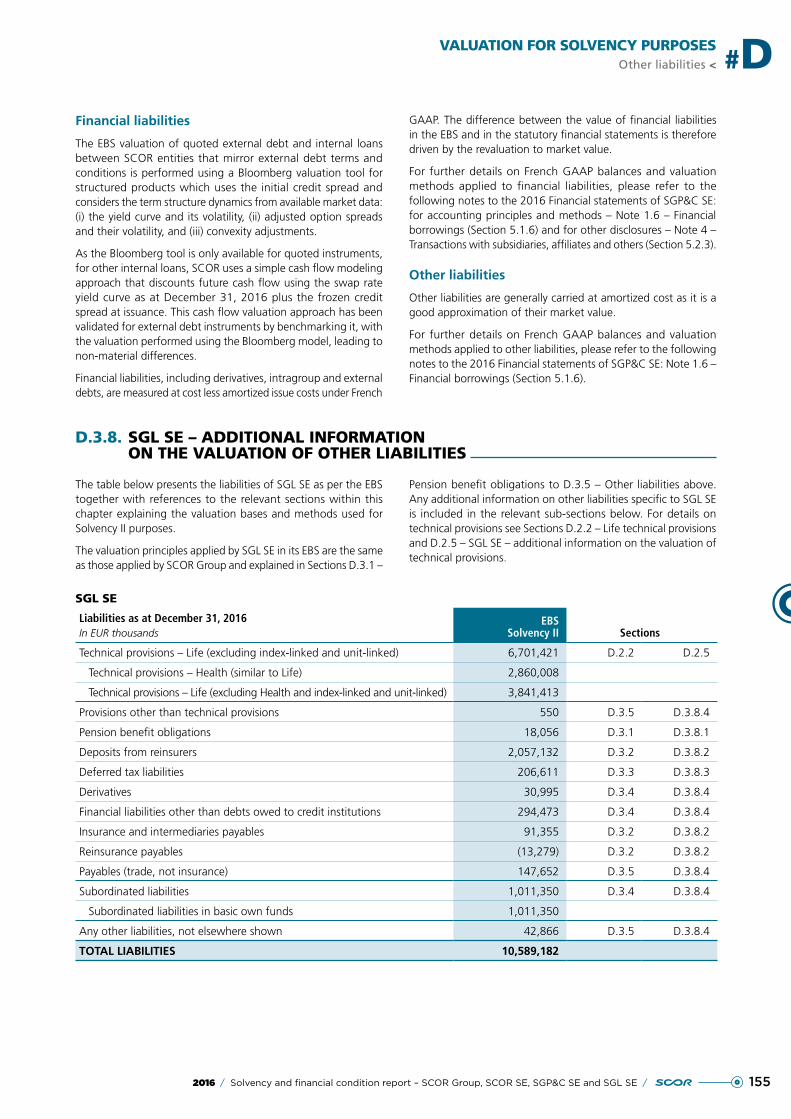
1552016 / Solvency and financial condition report – SCOR Group, SCOR SE, SGP&C SE and SGL SE /
VALUATION FOR SOLVENCY PURPOSESOther liabilities < #D
Financial liabilities
The EBS valuation of quoted external debt and internal loans between SCOR entities that mirror external debt terms and conditions is performed using a Bloomberg valuation tool for structured products which uses the initial credit spread and considers the term structure dynamics from available market data: (i) the yield curve and its volatility, (ii) adjusted option spreads and their volatility, and (iii) convexity adjustments.
As the Bloomberg tool is only available for quoted instruments, for other internal loans, SCOR uses a simple cash flow modeling approach that discounts future cash flow using the swap rate yield curve as at December 31, 2016 plus the frozen credit spread at issuance. This cash flow valuation approach has been validated for external debt instruments by benchmarking it, with the valuation performed using the Bloomberg model, leading to non-material differences.
Financial liabilities, including derivatives, intragroup and external debts, are measured at cost less amortized issue costs under French
GAAP. The difference between the value of financial liabilities in the EBS and in the statutory financial statements is therefore driven by the revaluation to market value.
For further details on French GAAP balances and valuation methods applied to financial liabilities, please refer to the following notes to the 2016 Financial statements of SGP&C SE: for accounting principles and methods – Note 1.6 – Financial borrowings (Section 5.1.6) and for other disclosures – Note 4 – Transactions with subsidiaries, affiliates and others (Section 5.2.3).
Other liabilities
Other liabilities are generally carried at amortized cost as it is a good approximation of their market value.
For further details on French GAAP balances and valuation methods applied to other liabilities, please refer to the following notes to the 2016 Financial statements of SGP&C SE: Note 1.6 – Financial borrowings (Section 5.1.6).
D.3.8. SGL SE – ADDITIONAL INFORMATION ON THE VALUATION OF OTHER LIABILITIES
The table below presents the liabilities of SGL SE as per the EBS together with references to the relevant sections within this chapter explaining the valuation bases and methods used for Solvency II purposes.
The valuation principles applied by SGL SE in its EBS are the same as those applied by SCOR Group and explained in Sections D.3.1 –
Pension benefit obligations to D.3.5 – Other liabilities above. Any additional information on other liabilities specific to SGL SE is included in the relevant sub-sections below. For details on technical provisions see Sections D.2.2 – Life technical provisions and D.2.5 – SGL SE – additional information on the valuation of technical provisions.
SGL SE
Liabilities as at December 31, 2016In EUR thousands
EBSSolvency II Sections
Technical provisions – Life (excluding index-linked and unit-linked) 6,701,421 D.2.2 D.2.5
Technical provisions – Health (similar to Life) 2,860,008
Technical provisions – Life (excluding Health and index-linked and unit-linked) 3,841,413
Provisions other than technical provisions 550 D.3.5 D.3.8.4
Pension benefit obligations 18,056 D.3.1 D.3.8.1
Deposits from reinsurers 2,057,132 D.3.2 D.3.8.2
Deferred tax liabilities 206,611 D.3.3 D.3.8.3
Derivatives 30,995 D.3.4 D.3.8.4
Financial liabilities other than debts owed to credit institutions 294,473 D.3.4 D.3.8.4
Insurance and intermediaries payables 91,355 D.3.2 D.3.8.2
Reinsurance payables (13,279) D.3.2 D.3.8.2
Payables (trade, not insurance) 147,652 D.3.5 D.3.8.4
Subordinated liabilities 1,011,350 D.3.4 D.3.8.4
Subordinated liabilities in basic own funds 1,011,350
Any other liabilities, not elsewhere shown 42,866 D.3.5 D.3.8.4
TOTAL LIABILITIES 10,589,182
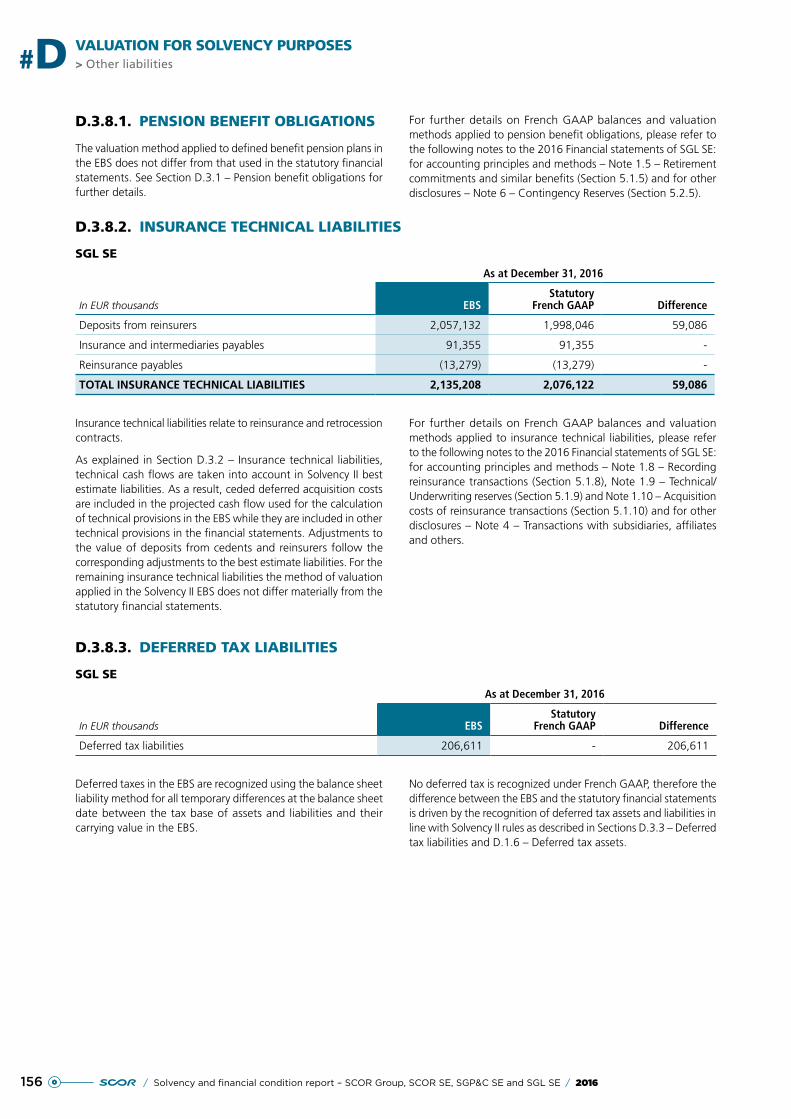
156 / Solvency and financial condition report – SCOR Group, SCOR SE, SGP&C SE and SGL SE / 2016
> Other liabilities#D VALUATION FOR SOLVENCY PURPOSES
D.3.8.1. PENSION BENEFIT OBLIGATIONS
The valuation method applied to defined benefit pension plans in the EBS does not differ from that used in the statutory financial statements. See Section D.3.1 – Pension benefit obligations for further details.
For further details on French GAAP balances and valuation methods applied to pension benefit obligations, please refer to the following notes to the 2016 Financial statements of SGL SE: for accounting principles and methods – Note 1.5 – Retirement commitments and similar benefits (Section 5.1.5) and for other disclosures – Note 6 – Contingency Reserves (Section 5.2.5).
D.3.8.2. INSURANCE TECHNICAL LIABILITIES
SGL SE
In EUR thousands
As at December 31, 2016
EBSStatutory
French GAAP Difference
Deposits from reinsurers 2,057,132 1,998,046 59,086
Insurance and intermediaries payables 91,355 91,355 -
Reinsurance payables (13,279) (13,279) -
TOTAL INSURANCE TECHNICAL LIABILITIES 2,135,208 2,076,122 59,086
Insurance technical liabilities relate to reinsurance and retrocession contracts.
As explained in Section D.3.2 – Insurance technical liabilities, technical cash flows are taken into account in Solvency II best estimate liabilities. As a result, ceded deferred acquisition costs are included in the projected cash flow used for the calculation of technical provisions in the EBS while they are included in other technical provisions in the financial statements. Adjustments to the value of deposits from cedents and reinsurers follow the corresponding adjustments to the best estimate liabilities. For the remaining insurance technical liabilities the method of valuation applied in the Solvency II EBS does not differ materially from the statutory financial statements.
For further details on French GAAP balances and valuation methods applied to insurance technical liabilities, please refer to the following notes to the 2016 Financial statements of SGL SE: for accounting principles and methods – Note 1.8 – Recording reinsurance transactions (Section 5.1.8), Note 1.9 – Technical/Underwriting reserves (Section 5.1.9) and Note 1.10 – Acquisition costs of reinsurance transactions (Section 5.1.10) and for other disclosures – Note 4 – Transactions with subsidiaries, affiliates and others.
D.3.8.3. DEFERRED TAX LIABILITIES
SGL SE
In EUR thousands
As at December 31, 2016
EBSStatutory
French GAAP Difference
Deferred tax liabilities 206,611 - 206,611
Deferred taxes in the EBS are recognized using the balance sheet liability method for all temporary differences at the balance sheet date between the tax base of assets and liabilities and their carrying value in the EBS.
No deferred tax is recognized under French GAAP, therefore the difference between the EBS and the statutory financial statements is driven by the recognition of deferred tax assets and liabilities in line with Solvency II rules as described in Sections D.3.3 – Deferred tax liabilities and D.1.6 – Deferred tax assets.
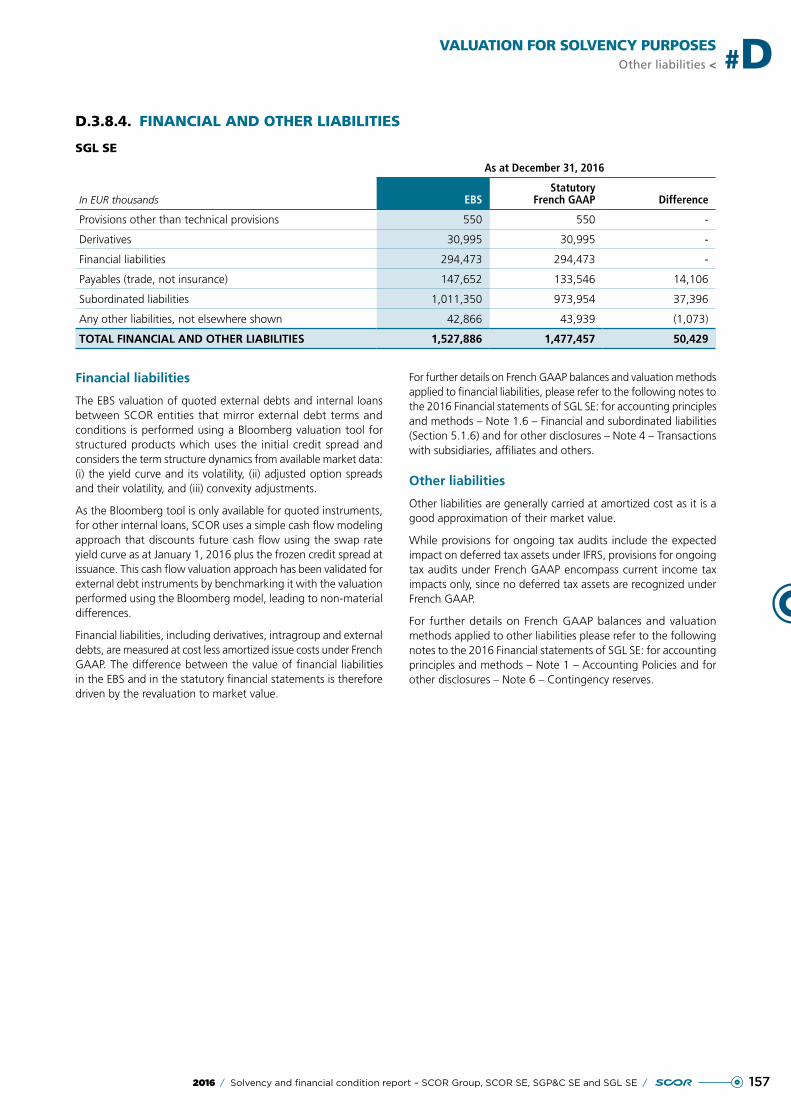
1572016 / Solvency and financial condition report – SCOR Group, SCOR SE, SGP&C SE and SGL SE /
VALUATION FOR SOLVENCY PURPOSESOther liabilities < #D
D.3.8.4. FINANCIAL AND OTHER LIABILITIES
SGL SE
In EUR thousands
As at December 31, 2016
EBSStatutory
French GAAP Difference
Provisions other than technical provisions 550 550 -
Derivatives 30,995 30,995 -
Financial liabilities 294,473 294,473 -
Payables (trade, not insurance) 147,652 133,546 14,106
Subordinated liabilities 1,011,350 973,954 37,396
Any other liabilities, not elsewhere shown 42,866 43,939 (1,073)
TOTAL FINANCIAL AND OTHER LIABILITIES 1,527,886 1,477,457 50,429
Financial liabilities
The EBS valuation of quoted external debts and internal loans between SCOR entities that mirror external debt terms and conditions is performed using a Bloomberg valuation tool for structured products which uses the initial credit spread and considers the term structure dynamics from available market data: (i) the yield curve and its volatility, (ii) adjusted option spreads and their volatility, and (iii) convexity adjustments.
As the Bloomberg tool is only available for quoted instruments, for other internal loans, SCOR uses a simple cash flow modeling approach that discounts future cash flow using the swap rate yield curve as at January 1, 2016 plus the frozen credit spread at issuance. This cash flow valuation approach has been validated for external debt instruments by benchmarking it with the valuation performed using the Bloomberg model, leading to non-material differences.
Financial liabilities, including derivatives, intragroup and external debts, are measured at cost less amortized issue costs under French GAAP. The difference between the value of financial liabilities in the EBS and in the statutory financial statements is therefore driven by the revaluation to market value.
For further details on French GAAP balances and valuation methods applied to financial liabilities, please refer to the following notes to the 2016 Financial statements of SGL SE: for accounting principles and methods – Note 1.6 – Financial and subordinated liabilities (Section 5.1.6) and for other disclosures – Note 4 – Transactions with subsidiaries, affiliates and others.
Other liabilities
Other liabilities are generally carried at amortized cost as it is a good approximation of their market value.
While provisions for ongoing tax audits include the expected impact on deferred tax assets under IFRS, provisions for ongoing tax audits under French GAAP encompass current income tax impacts only, since no deferred tax assets are recognized under French GAAP.
For further details on French GAAP balances and valuation methods applied to other liabilities please refer to the following notes to the 2016 Financial statements of SGL SE: for accounting principles and methods – Note 1 – Accounting Policies and for other disclosures – Note 6 – Contingency reserves.
158 / Solvency and financial condition report – SCOR Group, SCOR SE, SGP&C SE and SGL SE / 2016
> Alternative methods for valuation#D VALUATION FOR SOLVENCY PURPOSES
D.4. ALTERNATIVE METHODS FOR VALUATION
As noted in Sections D.1 – Assets and D.3 – Other liabilities, in certain circumstances for some assets and liabilities, SCOR uses alternative valuation methods (including models) to estimate the market value. These methods are applied where the valuation is not possible using the default method (valuation based on quoted prices in active markets for the same assets or liabilities)
or using quoted market prices in active markets for similar assets and liabilities with adjustments to allow for specific differences. All valuation methodologies applied by SCOR are explained within the relevant sections: in Sections D.1 for assets, D.2 for technical provisions and D.3 for other liabilities.
D.4.1. SCOR GROUP
Please see Sections D.1 – Assets and D.3 – Other liabilities for information on the alternative valuation methods used by SCOR Group.
D.4.2. SCOR SE – ADDITIONAL INFORMATION ON ALTERNATIVE METHODS OF VALUATION
Please see Sections D.1.10 – Additional information on the valuation of assets and D.3.6 – Additional information on the valuation of other liabilities for information on the alternative valuation methods used by SCOR SE.
D.4.3. SGP&C SE – ADDITIONAL INFORMATION ON ALTERNATIVE METHODS OF VALUATION
Please see Sections D.1.11 – Additional information on the valuation of assets and D.3.7 – Additional information on the valuation of other liabilities for information on the alternative valuation methods used by SGP&C SE.
D.4.4. SGL SE – ADDITIONAL INFORMATION ON ALTERNATIVE METHODS OF VALUATION
Please see Sections D.1.12 – Additional information on the valuation of assets and D.3.8 – Additional information on the valuation of other liabilities for information on the alternative valuation methods used by SGL SE.
1592016 / Solvency and financial condition report – SCOR Group, SCOR SE, SGP&C SE and SGL SE /
VALUATION FOR SOLVENCY PURPOSESAny other information < #D
D.5. ANY OTHER INFORMATION
No other material information was identified by SCOR over the reporting period other than the valuation of assets and liabilities presented in Sections D.1 – Assets to D.4 – Alternative methods for valuation.
160 / Solvency and financial condition report – SCOR Group, SCOR SE, SGP&C SE and SGL SE / 2016
CAPITAL MANAGEMENT
#E
E.1. SCOR GROUP 162
E.1.1. Own funds 162
E.1.2. Solvency capital requirement 166
E.1.3. Use of the duration-based equity risk sub-module in the calculation of the solvency capital requirement 166
E.1.4. Differences between the standard formula and any internal model used 166
E.1.5. Non-compliance with the solvency capital requirement 170
E.1.6. Any other information 170
E.2. SCOR SE 171
E.2.1. Own funds 171
E.2.2. Solvency capital requirement and minimum capital requirement 172
E.2.3. Use of the duration-based equity risk sub-module in the calculation of the solvency capital requirement 173
E.2.4. Differences between the standard formula and any internal model used 173
E.2.5. Non-compliance with the minimum capital requirement and non-compliance with the solvency capital requirement 173
E.2.6. Any other information 173
1612016 / Solvency and financial condition report – SCOR Group, SCOR SE, SGP&C SE and SGL SE /
E.3. SGP&C SE 174
E.3.1. Own funds 174
E.3.2. Solvency capital requirement and minimum capital requirement 176
E.3.3. Use of the duration-based equity risk sub-module in the calculation of the solvency capital requirement 177
E.3.4. Differences between the standard formula and any internal model used 177
E.3.5. Non-compliance with the minimum capital requirement and non-compliance with the solvency capital requirement 177
E.3.6. Any other information 177
E.4. SGL SE 178
E.4.1. Own funds 178
E.4.2. Solvency capital requirement and minimum capital requirement 180
E.4.3. Use of the duration-based equity risk sub-module in the calculation of the solvency capital requirement 181
E.4.4. Differences between the standard formula and any internal model used 181
E.4.5. Non-compliance with the minimum capital requirement and non-compliance with the solvency capital requirement 181
E.4.6. Any other information 181
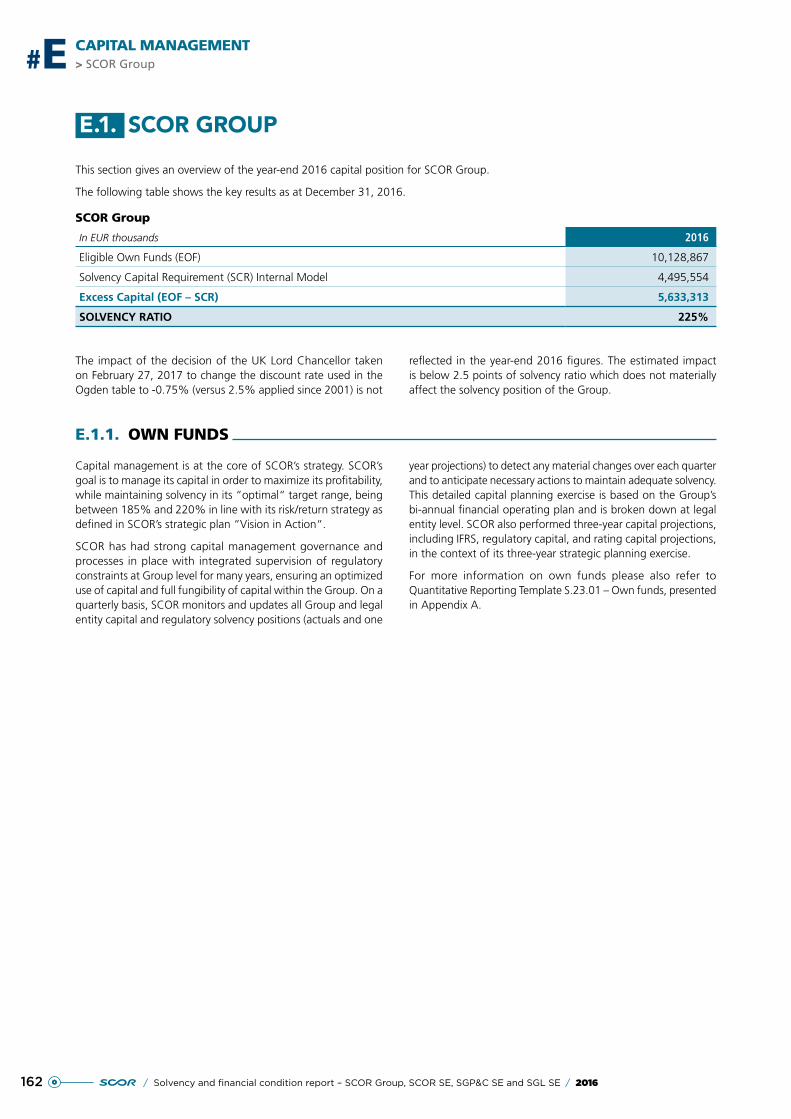
162 / Solvency and financial condition report – SCOR Group, SCOR SE, SGP&C SE and SGL SE / 2016
> SCOR Group#E CAPITAL MANAGEMENT
E.1. SCOR GROUP
This section gives an overview of the year-end 2016 capital position for SCOR Group.
The following table shows the key results as at December 31, 2016.
SCOR Group
In EUR thousands 2016
Eligible Own Funds (EOF) 10,128,867
Solvency Capital Requirement (SCR) Internal Model 4,495,554
Excess Capital (EOF – SCR) 5,633,313
SOLVENCY RATIO 225%
The impact of the decision of the UK Lord Chancellor taken on February 27, 2017 to change the discount rate used in the Ogden table to -0.75% (versus 2.5% applied since 2001) is not
reflected in the year-end 2016 figures. The estimated impact is below 2.5 points of solvency ratio which does not materially affect the solvency position of the Group.
E.1.1. OWN FUNDS
Capital management is at the core of SCOR’s strategy. SCOR’s goal is to manage its capital in order to maximize its profitability, while maintaining solvency in its “optimal“ target range, being between 185% and 220% in line with its risk/return strategy as defined in SCOR’s strategic plan “Vision in Action“.
SCOR has had strong capital management governance and processes in place with integrated supervision of regulatory constraints at Group level for many years, ensuring an optimized use of capital and full fungibility of capital within the Group. On a quarterly basis, SCOR monitors and updates all Group and legal entity capital and regulatory solvency positions (actuals and one
year projections) to detect any material changes over each quarter and to anticipate necessary actions to maintain adequate solvency. This detailed capital planning exercise is based on the Group’s bi-annual financial operating plan and is broken down at legal entity level. SCOR also performed three-year capital projections, including IFRS, regulatory capital, and rating capital projections, in the context of its three-year strategic planning exercise.
For more information on own funds please also refer to Quantitative Reporting Template S.23.01 – Own funds, presented in Appendix A.
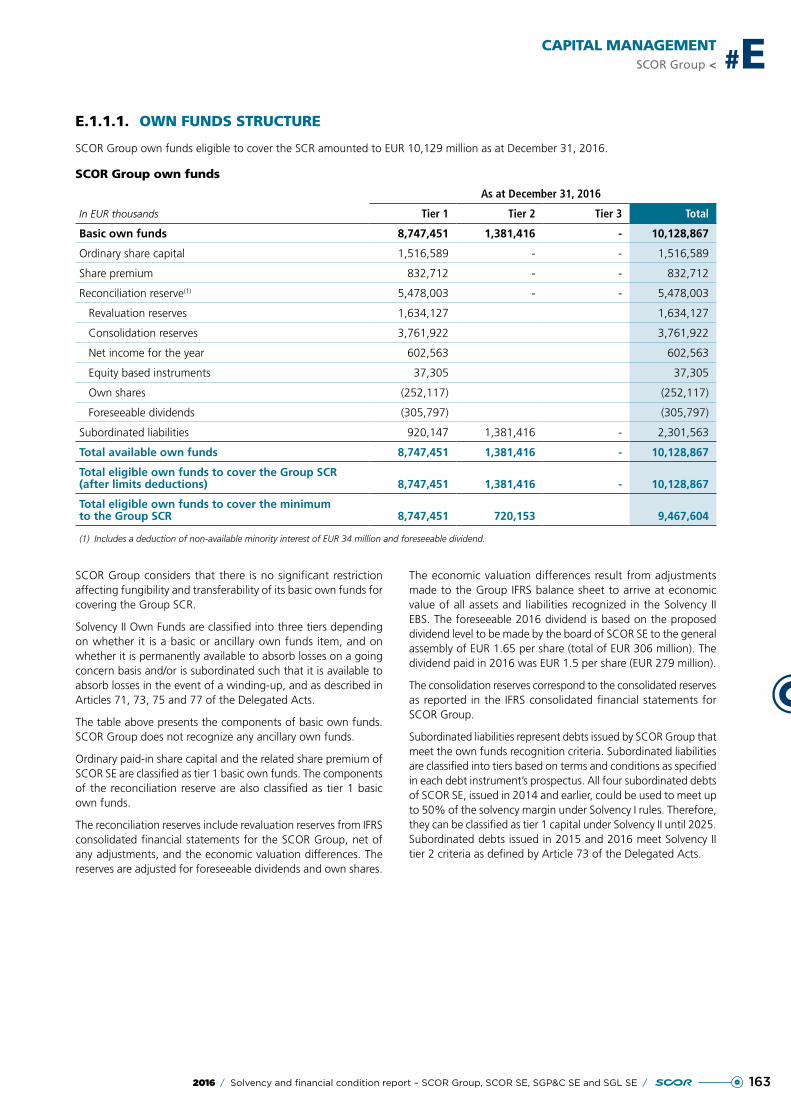
1632016 / Solvency and financial condition report – SCOR Group, SCOR SE, SGP&C SE and SGL SE /
CAPITAL MANAGEMENTSCOR Group < #E
E.1.1.1. OWN FUNDS STRUCTURE
SCOR Group own funds eligible to cover the SCR amounted to EUR 10,129 million as at December 31, 2016.
SCOR Group own funds
In EUR thousands
As at December 31, 2016
Tier 1 Tier 2 Tier 3 Total
Basic own funds 8,747,451 1,381,416 - 10,128,867
Ordinary share capital 1,516,589 - - 1,516,589
Share premium 832,712 - - 832,712
Reconciliation reserve(1) 5,478,003 - - 5,478,003
Revaluation reserves 1,634,127 1,634,127
Consolidation reserves 3,761,922 3,761,922
Net income for the year 602,563 602,563
Equity based instruments 37,305 37,305
Own shares (252,117) (252,117)
Foreseeable dividends (305,797) (305,797)
Subordinated liabilities 920,147 1,381,416 - 2,301,563
Total available own funds 8,747,451 1,381,416 - 10,128,867
Total eligible own funds to cover the Group SCR (after limits deductions) 8,747,451 1,381,416 - 10,128,867
Total eligible own funds to cover the minimum to the Group SCR 8,747,451 720,153 9,467,604
(1) Includes a deduction of non-available minority interest of EUR 34 million and foreseeable dividend.
SCOR Group considers that there is no significant restriction affecting fungibility and transferability of its basic own funds for covering the Group SCR.
Solvency II Own Funds are classified into three tiers depending on whether it is a basic or ancillary own funds item, and on whether it is permanently available to absorb losses on a going concern basis and/or is subordinated such that it is available to absorb losses in the event of a winding-up, and as described in Articles 71, 73, 75 and 77 of the Delegated Acts.
The table above presents the components of basic own funds. SCOR Group does not recognize any ancillary own funds.
Ordinary paid-in share capital and the related share premium of SCOR SE are classified as tier 1 basic own funds. The components of the reconciliation reserve are also classified as tier 1 basic own funds.
The reconciliation reserves include revaluation reserves from IFRS consolidated financial statements for the SCOR Group, net of any adjustments, and the economic valuation differences. The reserves are adjusted for foreseeable dividends and own shares.
The economic valuation differences result from adjustments made to the Group IFRS balance sheet to arrive at economic value of all assets and liabilities recognized in the Solvency II EBS. The foreseeable 2016 dividend is based on the proposed dividend level to be made by the board of SCOR SE to the general assembly of EUR 1.65 per share (total of EUR 306 million). The dividend paid in 2016 was EUR 1.5 per share (EUR 279 million).
The consolidation reserves correspond to the consolidated reserves as reported in the IFRS consolidated financial statements for SCOR Group.
Subordinated liabilities represent debts issued by SCOR Group that meet the own funds recognition criteria. Subordinated liabilities are classified into tiers based on terms and conditions as specified in each debt instrument’s prospectus. All four subordinated debts of SCOR SE, issued in 2014 and earlier, could be used to meet up to 50% of the solvency margin under Solvency I rules. Therefore, they can be classified as tier 1 capital under Solvency II until 2025. Subordinated debts issued in 2015 and 2016 meet Solvency II tier 2 criteria as defined by Article 73 of the Delegated Acts.
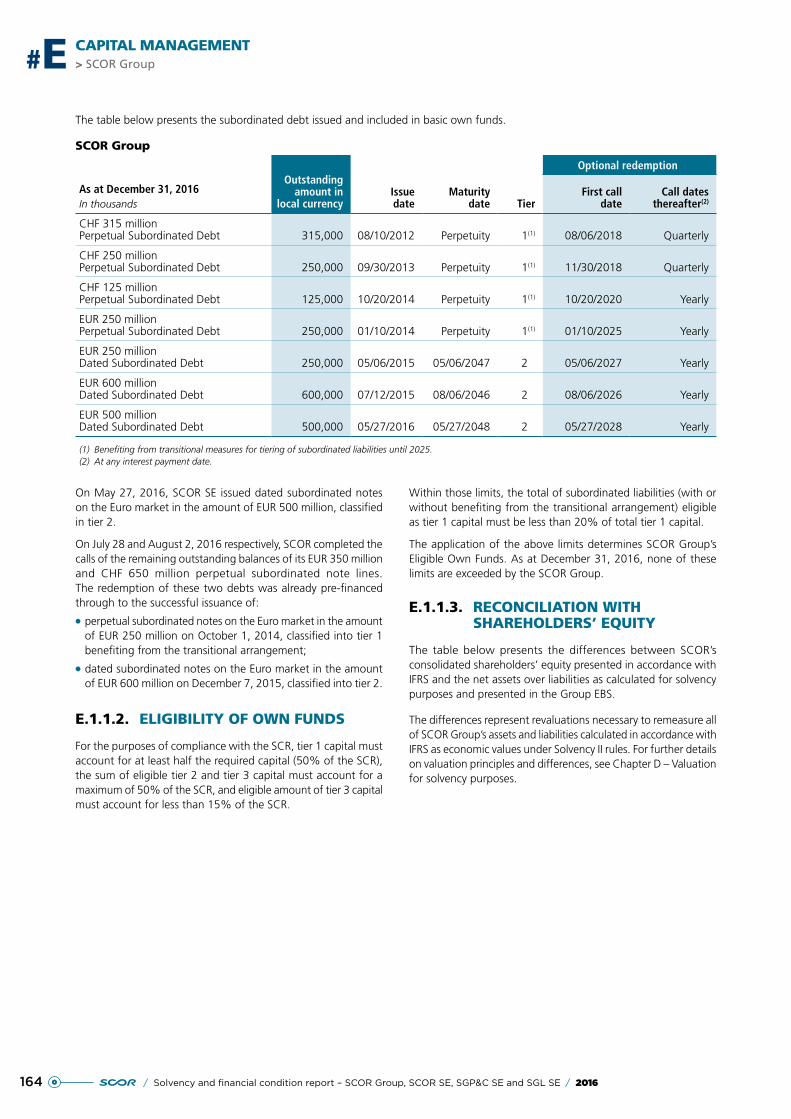
164 / Solvency and financial condition report – SCOR Group, SCOR SE, SGP&C SE and SGL SE / 2016
> SCOR Group#E CAPITAL MANAGEMENT
The table below presents the subordinated debt issued and included in basic own funds.
SCOR Group
As at December 31, 2016In thousands
Outstanding amount in
local currencyIssue date
Maturity date Tier
Optional redemption
First call date
Call dates thereafter(2)
CHF 315 million Perpetual Subordinated Debt 315,000 08/10/2012 Perpetuity 1(1) 08/06/2018 Quarterly
CHF 250 million Perpetual Subordinated Debt 250,000 09/30/2013 Perpetuity 1(1) 11/30/2018 Quarterly
CHF 125 million Perpetual Subordinated Debt 125,000 10/20/2014 Perpetuity 1(1) 10/20/2020 Yearly
EUR 250 million Perpetual Subordinated Debt 250,000 01/10/2014 Perpetuity 1(1) 01/10/2025 Yearly
EUR 250 million Dated Subordinated Debt 250,000 05/06/2015 05/06/2047 2 05/06/2027 Yearly
EUR 600 million Dated Subordinated Debt 600,000 07/12/2015 08/06/2046 2 08/06/2026 Yearly
EUR 500 million Dated Subordinated Debt 500,000 05/27/2016 05/27/2048 2 05/27/2028 Yearly
(1) Benefiting from transitional measures for tiering of subordinated liabilities until 2025.(2) At any interest payment date.
On May 27, 2016, SCOR SE issued dated subordinated notes on the Euro market in the amount of EUR 500 million, classified in tier 2.
On July 28 and August 2, 2016 respectively, SCOR completed the calls of the remaining outstanding balances of its EUR 350 million and CHF 650 million perpetual subordinated note lines. The redemption of these two debts was already pre-financed through to the successful issuance of:
●● perpetual subordinated notes on the Euro market in the amount of EUR 250 million on October 1, 2014, classified into tier 1 benefiting from the transitional arrangement;
●● dated subordinated notes on the Euro market in the amount of EUR 600 million on December 7, 2015, classified into tier 2.
E.1.1.2. ELIGIBILITY OF OWN FUNDS
For the purposes of compliance with the SCR, tier 1 capital must account for at least half the required capital (50% of the SCR), the sum of eligible tier 2 and tier 3 capital must account for a maximum of 50% of the SCR, and eligible amount of tier 3 capital must account for less than 15% of the SCR.
Within those limits, the total of subordinated liabilities (with or without benefiting from the transitional arrangement) eligible as tier 1 capital must be less than 20% of total tier 1 capital.
The application of the above limits determines SCOR Group’s Eligible Own Funds. As at December 31, 2016, none of these limits are exceeded by the SCOR Group.
E.1.1.3. RECONCILIATION WITH SHAREHOLDERS’ EQUITY
The table below presents the differences between SCOR’s consolidated shareholders’ equity presented in accordance with IFRS and the net assets over liabilities as calculated for solvency purposes and presented in the Group EBS.
The differences represent revaluations necessary to remeasure all of SCOR Group’s assets and liabilities calculated in accordance with IFRS as economic values under Solvency II rules. For further details on valuation principles and differences, see Chapter D – Valuation for solvency purposes.
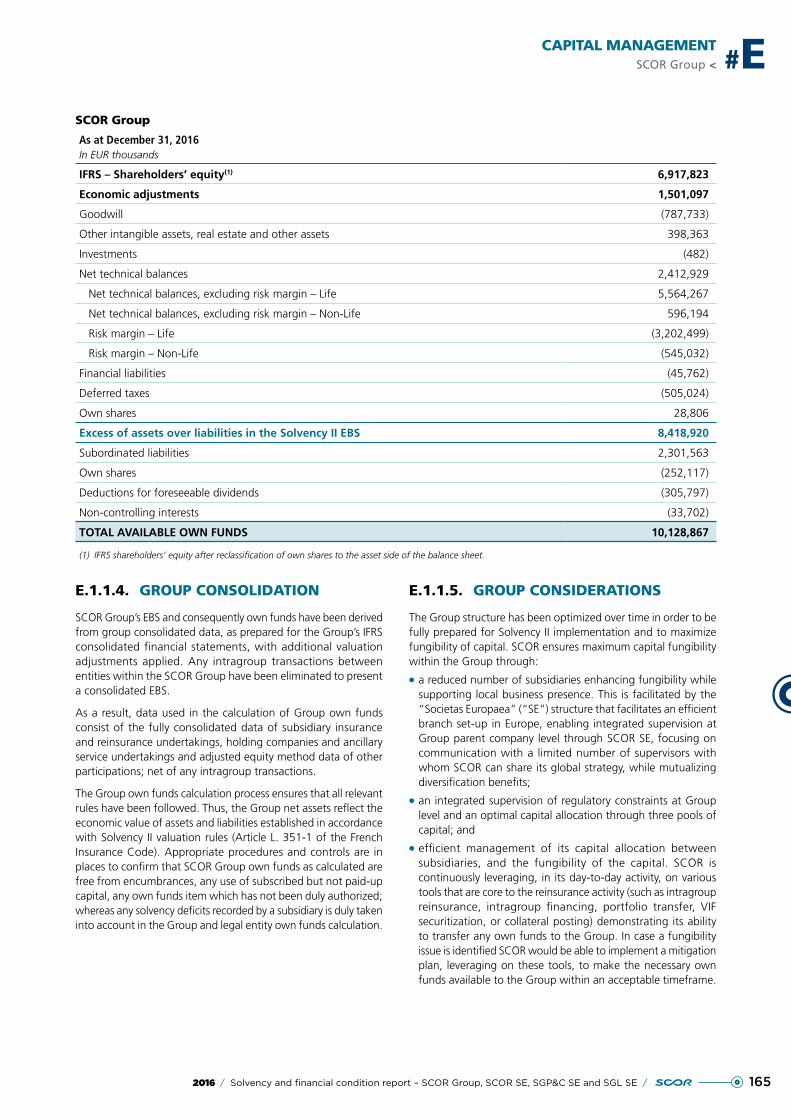
1652016 / Solvency and financial condition report – SCOR Group, SCOR SE, SGP&C SE and SGL SE /
CAPITAL MANAGEMENTSCOR Group < #E
SCOR Group
As at December 31, 2016In EUR thousands
IFRS – Shareholders’ equity(1) 6,917,823
Economic adjustments 1,501,097
Goodwill (787,733)
Other intangible assets, real estate and other assets 398,363
Investments (482)
Net technical balances 2,412,929
Net technical balances, excluding risk margin – Life 5,564,267
Net technical balances, excluding risk margin – Non-Life 596,194
Risk margin – Life (3,202,499)
Risk margin – Non-Life (545,032)
Financial liabilities (45,762)
Deferred taxes (505,024)
Own shares 28,806
Excess of assets over liabilities in the Solvency II EBS 8,418,920
Subordinated liabilities 2,301,563
Own shares (252,117)
Deductions for foreseeable dividends (305,797)
Non-controlling interests (33,702)
TOTAL AVAILABLE OWN FUNDS 10,128,867
(1) IFRS shareholders’ equity after reclassification of own shares to the asset side of the balance sheet.
E.1.1.4. GROUP CONSOLIDATION
SCOR Group’s EBS and consequently own funds have been derived from group consolidated data, as prepared for the Group’s IFRS consolidated financial statements, with additional valuation adjustments applied. Any intragroup transactions between entities within the SCOR Group have been eliminated to present a consolidated EBS.
As a result, data used in the calculation of Group own funds consist of the fully consolidated data of subsidiary insurance and reinsurance undertakings, holding companies and ancillary service undertakings and adjusted equity method data of other participations; net of any intragroup transactions.
The Group own funds calculation process ensures that all relevant rules have been followed. Thus, the Group net assets reflect the economic value of assets and liabilities established in accordance with Solvency II valuation rules (Article L. 351-1 of the French Insurance Code). Appropriate procedures and controls are in places to confirm that SCOR Group own funds as calculated are free from encumbrances, any use of subscribed but not paid-up capital, any own funds item which has not been duly authorized; whereas any solvency deficits recorded by a subsidiary is duly taken into account in the Group and legal entity own funds calculation.
E.1.1.5. GROUP CONSIDERATIONS
The Group structure has been optimized over time in order to be fully prepared for Solvency II implementation and to maximize fungibility of capital. SCOR ensures maximum capital fungibility within the Group through:
●● a reduced number of subsidiaries enhancing fungibility while supporting local business presence. This is facilitated by the “Societas Europaea“ (“SE“) structure that facilitates an efficient branch set-up in Europe, enabling integrated supervision at Group parent company level through SCOR SE, focusing on communication with a limited number of supervisors with whom SCOR can share its global strategy, while mutualizing diversification benefits;
●● an integrated supervision of regulatory constraints at Group level and an optimal capital allocation through three pools of capital; and
●● efficient management of its capital allocation between subsidiaries, and the fungibility of the capital. SCOR is continuously leveraging, in its day-to-day activity, on various tools that are core to the reinsurance activity (such as intragroup reinsurance, intragroup financing, portfolio transfer, VIF securitization, or collateral posting) demonstrating its ability to transfer any own funds to the Group. In case a fungibility issue is identified SCOR would be able to implement a mitigation plan, leveraging on these tools, to make the necessary own funds available to the Group within an acceptable timeframe.
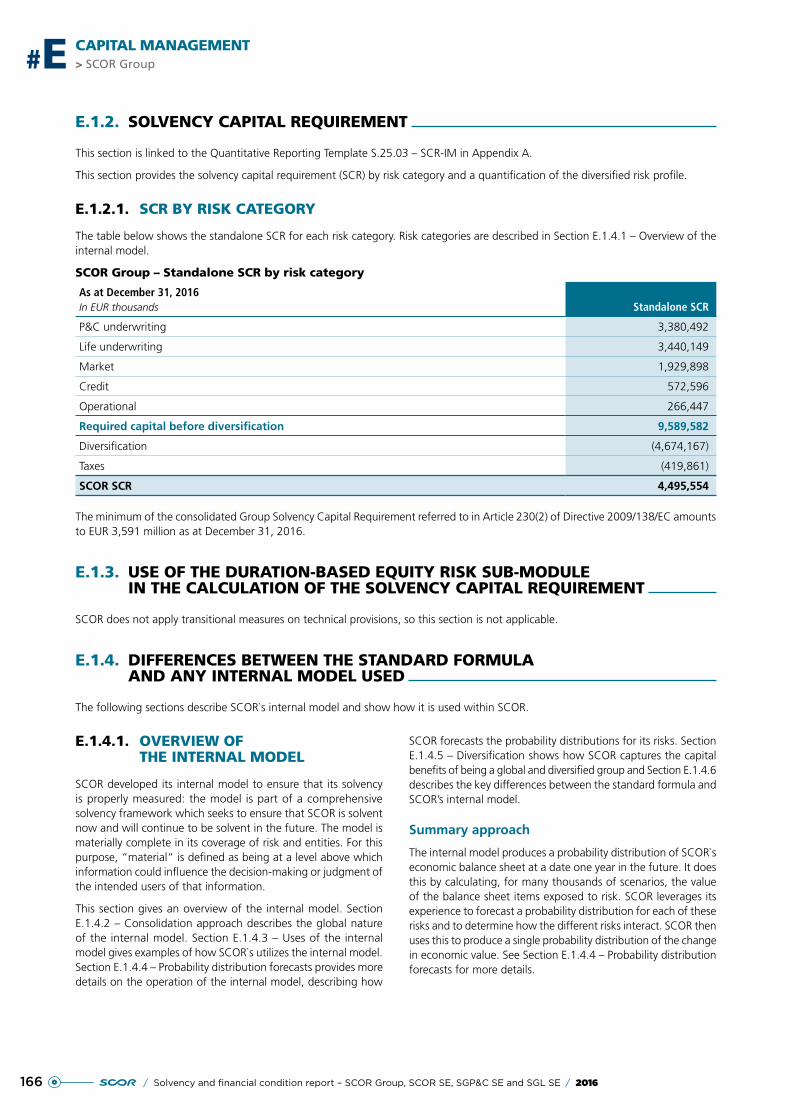
166 / Solvency and financial condition report – SCOR Group, SCOR SE, SGP&C SE and SGL SE / 2016
> SCOR Group#E CAPITAL MANAGEMENT
E.1.2. SOLVENCY CAPITAL REQUIREMENT
This section is linked to the Quantitative Reporting Template S.25.03 – SCR-IM in Appendix A.
This section provides the solvency capital requirement (SCR) by risk category and a quantification of the diversified risk profile.
E.1.2.1. SCR BY RISK CATEGORY
The table below shows the standalone SCR for each risk category. Risk categories are described in Section E.1.4.1 – Overview of the internal model.
SCOR Group – Standalone SCR by risk category
As at December 31, 2016In EUR thousands Standalone SCR
P&C underwriting 3,380,492
Life underwriting 3,440,149
Market 1,929,898
Credit 572,596
Operational 266,447
Required capital before diversification 9,589,582
Diversification (4,674,167)
Taxes (419,861)
SCOR SCR 4,495,554
The minimum of the consolidated Group Solvency Capital Requirement referred to in Article 230(2) of Directive 2009/138/EC amounts to EUR 3,591 million as at December 31, 2016.
E.1.3. USE OF THE DURATION-BASED EQUITY RISK SUB-MODULE IN THE CALCULATION OF THE SOLVENCY CAPITAL REQUIREMENT
SCOR does not apply transitional measures on technical provisions, so this section is not applicable.
E.1.4. DIFFERENCES BETWEEN THE STANDARD FORMULA AND ANY INTERNAL MODEL USED
The following sections describe SCOR`s internal model and show how it is used within SCOR.
E.1.4.1. OVERVIEW OF THE INTERNAL MODEL
SCOR developed its internal model to ensure that its solvency is properly measured: the model is part of a comprehensive solvency framework which seeks to ensure that SCOR is solvent now and will continue to be solvent in the future. The model is materially complete in its coverage of risk and entities. For this purpose, “material“ is defined as being at a level above which information could influence the decision-making or judgment of the intended users of that information.
This section gives an overview of the internal model. Section E.1.4.2 – Consolidation approach describes the global nature of the internal model. Section E.1.4.3 – Uses of the internal model gives examples of how SCOR`s utilizes the internal model. Section E.1.4.4 – Probability distribution forecasts provides more details on the operation of the internal model, describing how
SCOR forecasts the probability distributions for its risks. Section E.1.4.5 – Diversification shows how SCOR captures the capital benefits of being a global and diversified group and Section E.1.4.6 describes the key differences between the standard formula and SCOR’s internal model.
Summary approach
The internal model produces a probability distribution of SCOR`s economic balance sheet at a date one year in the future. It does this by calculating, for many thousands of scenarios, the value of the balance sheet items exposed to risk. SCOR leverages its experience to forecast a probability distribution for each of these risks and to determine how the different risks interact. SCOR then uses this to produce a single probability distribution of the change in economic value. See Section E.1.4.4 – Probability distribution forecasts for more details.
1672016 / Solvency and financial condition report – SCOR Group, SCOR SE, SGP&C SE and SGL SE /
CAPITAL MANAGEMENTSCOR Group < #E
Scope of the internal model
Business units
The internal model is a global model and operates under the same standards across the Group, within and outside the Solvency II regime. SCOR manages its business using a Group and Divisional approach as described in Section A.1.1.5 – Governance, organizational and legal structure of the Group, under which the activities of the Life and P&C divisions are represented alongside SCOR Global Investments.
The internal model fully captures the risk exposures of all EEA-regulated entities; these include SCOR SE, SGLRI, SGL SE and SGP&C SE; the latter two are the primary consolidating entities for the Life division and P&C division internal model results respectively. For non-EAA entities the model captures material participation and other risks.
Risk measure and time period
The risk measure used to determine the Solvency Capital Requirement is VaR 0.5%, i.e. the minimum loss of the 0.5% highest values of the probability distribution forecast described above. The time period used is one year. In other words, there is only a one in 200 chance of a loss higher than this value during the 12 months following the reporting date.
Risk categories
SCOR groups the risks modeled into five categories, Property and Casualty (P&C) underwriting, Life underwriting, market, credit and operational risks. Definitions of the risk categories are as follows:
●● P&C underwriting risk is the risk of adverse change in the value of non-life liabilities. It also includes related risks such as those associated with expenses, deposits to cedents, reinsurance recoverables and reinsurance payables and interest income on funds withheld;
●● life underwriting risk is the risk of adverse change in the value of life and health liabilities. It also includes related risks such as those associated with deposits to cedents, reinsurance recoverables and reinsurance payables;
●● market risk is the risk of loss to balance sheet items (for instance provisions, payables, investments and debt) from change in the level of market prices;
●● credit risk is the risk of loss from the default or changes in the rating of insurance or investment counterparties;
●● operational risk is the risk of loss from inadequate or failed internal processes, personnel or systems or from external events. Operational risk includes legal risks, and excludes risks arising from strategic decisions and reputational risks.
Underwriting risks cover risks from business written to date and over the one year period.
The risk categories are reported net of tax and net of risk mitigating measures. Reporting also shows:
●● Diversification. This is the impact of determining the joint capital requirements of the five risk categories. The aggregated capital requirement is less than the sum of the individual capital requirements because of SCOR`s diversified portfolio which significantly reduces the likelihood of simultaneous occurrence of adverse experience and because losses in one area are offset by gains in another. See Section E.1.4.5 – Diversification for more details;
●● Taxes. For each modeled scenario, the internal model calculates the tax impact of the change in economic value.
Data used in the internal model
The probability distribution forecast of SCOR`s economic balance sheet requires forecasts to be made for the economic background, for each risk factor, and for the dependencies between the various risk factors. These forecasts rely on actuarial, economic, financial and business portfolio assumptions and data. Because the accuracy and appropriateness of this data are crucial, SCOR carefully manages data to ensure its proper and structured storage, reliability and accessibility. SCOR applies a data quality management framework to identify key data affecting internal model results, in particular the SCR, and data quality criteria to all of this data. Section E.1.4.4 – Probability distribution forecasts describes in more detail the data used for each risk category and how SCOR ensures that the data is appropriate.
In some areas, there is little data available or the data lacks credibility. In these cases, SCOR applies expert judgment to enrich data, derive parameters for the forecast, and reduce uncertainty in internal model estimations – see for example the approach to supplementing data on extreme events for P&C underwriting described in Section E.1.4.4 – Probability distribution forecasts.
E.1.4.2. CONSOLIDATION APPROACH
SCOR follows Solvency II standards for the uses of the internal model described below, whether within the Solvency II regime, for internal management reporting purposes, or for externally presenting the business results.
SCOR determines its Group solvency position using consolidated data. Both the own funds and SCR are calculated using the accounting consolidation based method (method 1).
SCOR consolidates small non-insurance companies where SCOR has significant influence but no control, other small non-controlled related (re)insurance undertakings and participations in investment firms. This consolidation is based on their net asset value (the ‘adjusted equity method’). The SCR includes no added amounts for these entities as such amounts would be immaterial.
168 / Solvency and financial condition report – SCOR Group, SCOR SE, SGP&C SE and SGL SE / 2016
> SCOR Group#E CAPITAL MANAGEMENT
E.1.4.3. USES OF THE INTERNAL MODEL
The internal model is used to support the Group’s business initiatives and to provide input for management decisions. See for example Sections B.3.1.3 – Risk tolerances, B.3.2.3 – Identification and assessment of risks and C.2.3 – Risks related to reserves. Other examples are as follows:
●● SCOR uses the internal model to align solvency and profitability and for economic and solvency capital assessment. The internal model is used to produce distributions of scenarios for changes in basic own funds over the coming year for SCOR Group and material Group entities, in accordance with Solvency II principles;
●● SCOR uses the internal model for strategic solvency management. The internal model is the core tool for setting and maintaining SCOR’s strategic solvency target, under which SCOR’s solvency position remains within a range set to align shareholder returns, business growth, profitability and solvency protection for clients;
●● the internal model plays an important role in SCOR’s System of Governance, and Risk Management System and thereby helps to optimize shareholder return. SCOR designed and developed the model specifically for its own risks, so the internal model provides a better understanding of its risk profile than an industry-standard or standard formula approach;
●● SCOR’s Capital Shield strategy, see Section C.2.4 – Retrocession and other risk mitigation techniques, uses a range of protection mechanisms to ensure that the retained risk profile remains in line with the risk appetite framework and risk tolerances;
●● SCOR’s SCR is mainly driven by its underwriting risks, with high diversification through well-balanced Life and P&C portfolios. Full distribution modeling and capital allocation based on the Euler(1) technique steer SCOR’s risk return profile to the optimum allocation of economic capital to divisions and lines of business, and to new business. This approach means that capital allocation in pricing targets’ business is expected to give a good return on capital;
●● SCOR uses the internal model for risk analysis to support acquisitions and other major decisions and to assess the impact on the Group’s (and relevant entity’s) solvency and SCR.
E.1.4.4. PROBABILITY DISTRIBUTION FORECASTS
This section describes how SCOR forecasts the probability distribution for each risk category. The approach can be summarized as follows:
●● SCOR determines the exposure of the EBS items exposed to risk using the economic characteristics of its portfolio;
●● SCOR analyses each risk category into a number of risk factors and generates probability distributions for each of these risk factors, using its own experience and expertise applied to internal, external and market data;
●● SCOR uses Monte-Carlo simulation techniques to produce the full probability distribution forecast for each risk category. The risk factor distributions are applied to the exposures to generate the changes in the EBS for a large number of simulations.
P&C Underwriting Risk
The business covered by the P&C risk category is all external and internal non-life re/insurance and retrocession contracts from both in force business and new business within the one-year time period. The forecasts are determined for three categories of business (Treaty, Facultative and Natural Catastrophe) and for reserve risk.
SCOR leverages its own experience to understand its P&C risks and to derive observed statistical characteristics of these risks, particularly probability distributions, the nature of the dependencies between them and their expected behavior over the next year. Particular attention is paid to extreme events and SCOR uses a statistical (Bayesian) method to supplement the data on these. This method (Probex), see SCOR Paper(2) for details, combines expert judgment with existing industry and economic data, both internal and external, and improves SCOR’s understanding of adverse scenarios.
Probability distributions are generated for each of the three different categories of business and for reserve risk, based on the nature of the underlying risks and forecast using claim inflation curves and economic trends.
Life Underwriting Risk
SCOR has developed its capacity to model its life and health risks since 2005, combining global expertise and significant amounts of experience, including data from acquisitions. It uses this to derive the statistical characteristics of these risks, particularly their current probability distributions, the nature of the dependencies between them and their expected behavior over the next year.
(1) See https://www.scor.com/images/stories/pdf/scorpapers/scorpapers1_en.pdf and https://www.scor.com/images/stories/pdf/scorpapers/scorpapers7-en.pdf.(2) See https://www.scor.com/images/stories/pdf/scorpapers/scorpapers10_en.pdf.
1692016 / Solvency and financial condition report – SCOR Group, SCOR SE, SGP&C SE and SGL SE /
CAPITAL MANAGEMENTSCOR Group < #E
Probability distribution functions are chosen to model the underlying risk factors such as mortality, longevity and policyholder behavior. SCOR applies expert judgment and scenario analyses where experience data are relatively scarce, for example lapse and morbidity risks.
The internal model takes future management actions into account, reflecting the optionality available to SCOR on certain blocks of business in the event of adverse mortality or critical illness experience.
Market Risk
The market risk category comprises a number of risk factors, including government bond yields and credit spreads for different ratings, maturities and economies and currency exchange (FX).
SCOR applies probability distributions for these risk factors to the values of EBS items. Within this risk category SCOR also applies probability distributions for interest rates to the modeled values of discounted best estimate liabilities and deposits to cedents.
SCOR forecasts the probability distributions of the risk factors, and the dependencies between them, using economic scenarios for a number of major currencies. These economic scenarios are created by SCOR`s Economic Scenario Generator (ESG), which produces scenarios representing various plausible states of the economy specified in terms of economic risk factors, to determine how the economic balance sheet would react under these various scenarios.
The internal model determines, for each ESG scenario, the impact on the underlying EBS item. Repeating this exercise many times for different future economic scenarios gives the full probability distribution forecast for market risk.
Credit Risk
The probability distribution forecast for credit risk is determined in three stages. Firstly, using historical data on credit spreads and downgrading, the risks of counterparty downgrade (including default) and credit spreads are forecast. Secondly, the loss on downgrade or default is determined from the exposure to the counterparty. Finally, this exercise is repeated many times for different future economic scenarios to arrive at the probability distribution forecast for credit risk.
Operational Risk
SCOR models annual losses at the entity level and by key operational areas. There are two main data sources for modeling operational risk: scenario analyses from experts and historical
losses. The methodology for modeling losses for each operational risk area is based on a Bayesian(1) approach. This allows for the combination of several input data sources for each modeled operational risk area to obtain credible data.
Other
Tax. The modeled EBS starts with actual deferred tax assets and deferred tax liabilities recognized at the beginning of the year. For each modeled scenario, the internal model calculates the tax impact of the change in economic value (i.e. economic profit or loss). The internal model determines this item by modeled entity and by scenario. The Group tax effects represent the aggregated tax effects of the modeled legal entities.
Contingent capital. When calculating the SCR, the internal model allows for risk-mitigation from the contingent capital facility (CC), see Section C.2.4 – Retrocession and other risk mitigation techniques. In its current form, the CC can be triggered by a severe loss in P&C, or a severe loss in Life, or a severe depreciation in the SCOR share price.
Minor balance sheet items, such as intangible assets or debt, are assumed to carry a low intrinsic risk. These are modeled in a simplified way and included in the relevant risk category.
E.1.4.5. DIVERSIFICATION
SCOR is a global Group with significant presence in the Americas, EMEA (Europe, Middle East and Africa) and Asia-Pacific regions. Its portfolio is diversified with a balanced mix of life and property and casualty business. Diversification benefit arises because the risks on different parts of the portfolio are independent of, weakly correlated or negatively correlated with the risks on other parts. This is particularly important for the interaction between the Life and P&C risk categories but there are further areas where SCOR benefits from diversification. SCOR benefits from geographical spread of risks: major adverse events are unlikely to occur simultaneously on a global scale. Within Life underwriting, long-term risks such as trend risks are largely independent of shock risks such as pandemics, and longevity risk is negatively correlated with mortality risk.
At December 31, 2016, the sum of the capital requirements before diversification was EUR 9,590 million. After allowing for diversification between risk categories, the capital requirement decreased by EUR 4,674 million. SCOR can achieve this level of diversification thanks to its specific business mix. The majority of the diversification benefit derives from the balance between the P&C and Life portfolios.
(1) See footnote 2 for details.
170 / Solvency and financial condition report – SCOR Group, SCOR SE, SGP&C SE and SGL SE / 2016
> SCOR Group#E CAPITAL MANAGEMENT
E.1.4.6. KEY DIFFERENCES BETWEEN THE STANDARD FORMULA AND THE INTERNAL MODEL
The SCR standard formula follows a modular approach where the overall risk to which the (re)insurance entity is exposed is divided into risk module. These risk modules include Life underwriting, Non-Life underwriting, Health underwriting, Market and Operational. The capital requirements for each risk module are calculated using a table of factors applied to exposures. Correlation matrices are applied to the risk modules to calculate the total SCR.
Subject to regulatory approval, (re)insurers are permitted to use their own internal model to calculate their SCR rather than the standard formula. Since 2003 SCOR has used its experience and knowledge to develop an internal model which accurately reflects SCOR`s risk profile as a global reinsurer.
SCOR’s internal model is similar to the standard formula in that both use a risk category approach, apply diversification between the risk categories, and calculate the SCR at a 99.5% VaR. However, in contrast to the simplified factor approach of the standard formula, the internal model applies full distribution modeling.
SCOR’s internal model structure reflects geographical market specificity by use of appropriate risk factor calibration. The standard formula uses generic diversification factors for all (re)
insurers, whereas the SCOR internal model reflects the benefits of risk diversification specific to a global reinsurer as compared to a less diversified local insurance undertaking.
Additional key differences are summarized below by risk category:
●● for P&C underwriting, SCOR determines the probability distributions, and models natural catastrophe risk using sophisticated proprietary tools applied to SCOR`s own portfolio. The internal model also captures the specific characteristics of non-proportional reinsurance;
●● for Life underwriting, a wider range of risk factors than considered in the standard formula is modeled. Also, for Life underwriting the standard formula only covers risks from business in force, whereas the SCOR internal model also includes risks from future business expected to be written over the next year according to the Business Plan;
●● for Market risk, SCOR uses its own ESG which reflects dependencies over the full range of outcomes (not just those at the 99.5th percentile) between the different components of market risk modeled;
●● for Credit risk, SCOR models migration and default risk comprehensively for marketable securities and covers default of future profits from cedents;
●● for Operational risk, SCOR adopts a granular approach, which reflects actual historical operational loss data from key operating areas.
E.1.5. NON-COMPLIANCE WITH THE SOLVENCY CAPITAL REQUIREMENT
SCOR Group and all legal entities belonging to SCOR Group subject to Solvency II have complied with the MCR and the SCR requirement throughout the period covered by this report.
E.1.6. ANY OTHER INFORMATION
No other material information is reported regarding SCOR Group’s capital management other than that presented above in Section E.1 – SCOR Group.
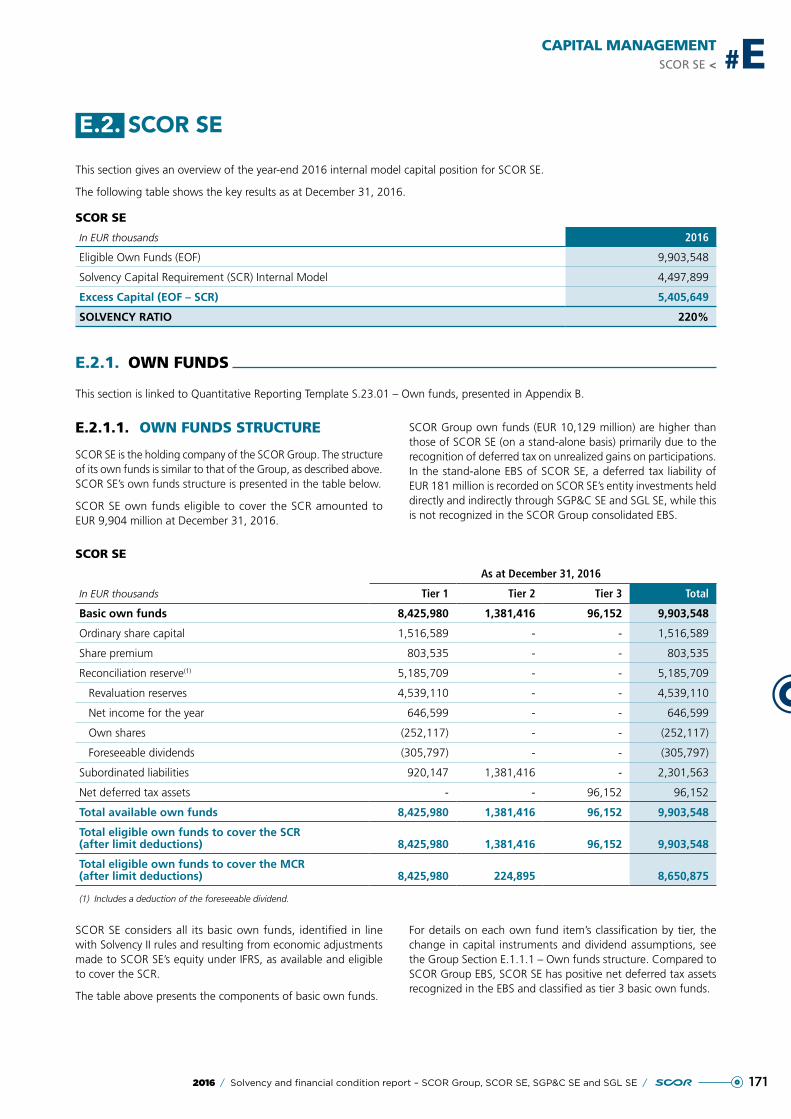
1712016 / Solvency and financial condition report – SCOR Group, SCOR SE, SGP&C SE and SGL SE /
CAPITAL MANAGEMENTSCOR SE < #E
E.2. SCOR SE
This section gives an overview of the year-end 2016 internal model capital position for SCOR SE.
The following table shows the key results as at December 31, 2016.
SCOR SE
In EUR thousands 2016
Eligible Own Funds (EOF) 9,903,548
Solvency Capital Requirement (SCR) Internal Model 4,497,899
Excess Capital (EOF – SCR) 5,405,649
SOLVENCY RATIO 220%
E.2.1. OWN FUNDS
This section is linked to Quantitative Reporting Template S.23.01 – Own funds, presented in Appendix B.
E.2.1.1. OWN FUNDS STRUCTURE
SCOR SE is the holding company of the SCOR Group. The structure of its own funds is similar to that of the Group, as described above. SCOR SE’s own funds structure is presented in the table below.
SCOR SE own funds eligible to cover the SCR amounted to EUR 9,904 million at December 31, 2016.
SCOR Group own funds (EUR 10,129 million) are higher than those of SCOR SE (on a stand-alone basis) primarily due to the recognition of deferred tax on unrealized gains on participations. In the stand-alone EBS of SCOR SE, a deferred tax liability of EUR 181 million is recorded on SCOR SE’s entity investments held directly and indirectly through SGP&C SE and SGL SE, while this is not recognized in the SCOR Group consolidated EBS.
SCOR SE
In EUR thousands
As at December 31, 2016
Tier 1 Tier 2 Tier 3 Total
Basic own funds 8,425,980 1,381,416 96,152 9,903,548
Ordinary share capital 1,516,589 - - 1,516,589
Share premium 803,535 - - 803,535
Reconciliation reserve(1) 5,185,709 - - 5,185,709
Revaluation reserves 4,539,110 - - 4,539,110
Net income for the year 646,599 - - 646,599
Own shares (252,117) - - (252,117)
Foreseeable dividends (305,797) - - (305,797)
Subordinated liabilities 920,147 1,381,416 - 2,301,563
Net deferred tax assets - - 96,152 96,152
Total available own funds 8,425,980 1,381,416 96,152 9,903,548
Total eligible own funds to cover the SCR (after limit deductions) 8,425,980 1,381,416 96,152 9,903,548
Total eligible own funds to cover the MCR (after limit deductions) 8,425,980 224,895 8,650,875
(1) Includes a deduction of the foreseeable dividend.
SCOR SE considers all its basic own funds, identified in line with Solvency II rules and resulting from economic adjustments made to SCOR SE’s equity under IFRS, as available and eligible to cover the SCR.
The table above presents the components of basic own funds.
For details on each own fund item’s classification by tier, the change in capital instruments and dividend assumptions, see the Group Section E.1.1.1 – Own funds structure. Compared to SCOR Group EBS, SCOR SE has positive net deferred tax assets recognized in the EBS and classified as tier 3 basic own funds.
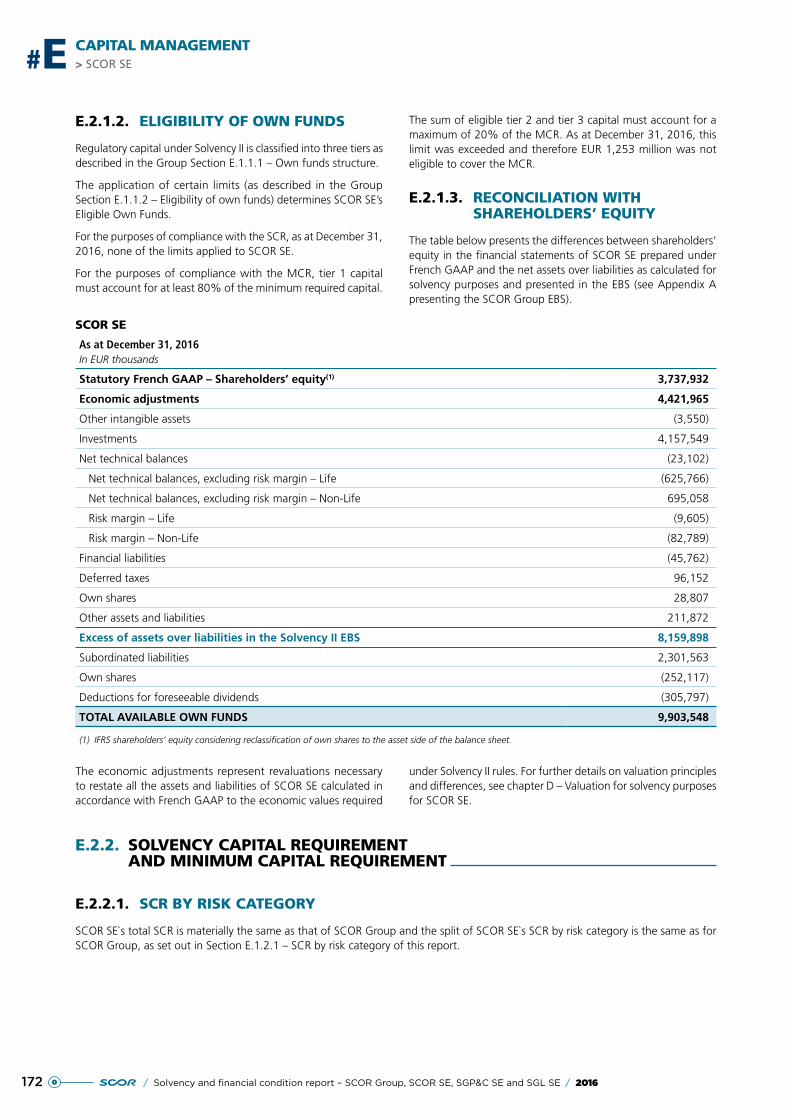
172 / Solvency and financial condition report – SCOR Group, SCOR SE, SGP&C SE and SGL SE / 2016
> SCOR SE#E CAPITAL MANAGEMENT
E.2.1.2. ELIGIBILITY OF OWN FUNDS
Regulatory capital under Solvency II is classified into three tiers as described in the Group Section E.1.1.1 – Own funds structure.
The application of certain limits (as described in the Group Section E.1.1.2 – Eligibility of own funds) determines SCOR SE’s Eligible Own Funds.
For the purposes of compliance with the SCR, as at December 31, 2016, none of the limits applied to SCOR SE.
For the purposes of compliance with the MCR, tier 1 capital must account for at least 80% of the minimum required capital.
The sum of eligible tier 2 and tier 3 capital must account for a maximum of 20% of the MCR. As at December 31, 2016, this limit was exceeded and therefore EUR 1,253 million was not eligible to cover the MCR.
E.2.1.3. RECONCILIATION WITH SHAREHOLDERS’ EQUITY
The table below presents the differences between shareholders’ equity in the financial statements of SCOR SE prepared under French GAAP and the net assets over liabilities as calculated for solvency purposes and presented in the EBS (see Appendix A presenting the SCOR Group EBS).
SCOR SE
As at December 31, 2016In EUR thousands
Statutory French GAAP – Shareholders’ equity(1) 3,737,932
Economic adjustments 4,421,965
Other intangible assets (3,550)
Investments 4,157,549
Net technical balances (23,102)
Net technical balances, excluding risk margin – Life (625,766)
Net technical balances, excluding risk margin – Non-Life 695,058
Risk margin – Life (9,605)
Risk margin – Non-Life (82,789)
Financial liabilities (45,762)
Deferred taxes 96,152
Own shares 28,807
Other assets and liabilities 211,872
Excess of assets over liabilities in the Solvency II EBS 8,159,898
Subordinated liabilities 2,301,563
Own shares (252,117)
Deductions for foreseeable dividends (305,797)
TOTAL AVAILABLE OWN FUNDS 9,903,548
(1) IFRS shareholders’ equity considering reclassification of own shares to the asset side of the balance sheet.
The economic adjustments represent revaluations necessary to restate all the assets and liabilities of SCOR SE calculated in accordance with French GAAP to the economic values required
under Solvency II rules. For further details on valuation principles and differences, see chapter D – Valuation for solvency purposes for SCOR SE.
E.2.2. SOLVENCY CAPITAL REQUIREMENT AND MINIMUM CAPITAL REQUIREMENT
E.2.2.1. SCR BY RISK CATEGORY
SCOR SE`s total SCR is materially the same as that of SCOR Group and the split of SCOR SE`s SCR by risk category is the same as for SCOR Group, as set out in Section E.1.2.1 – SCR by risk category of this report.
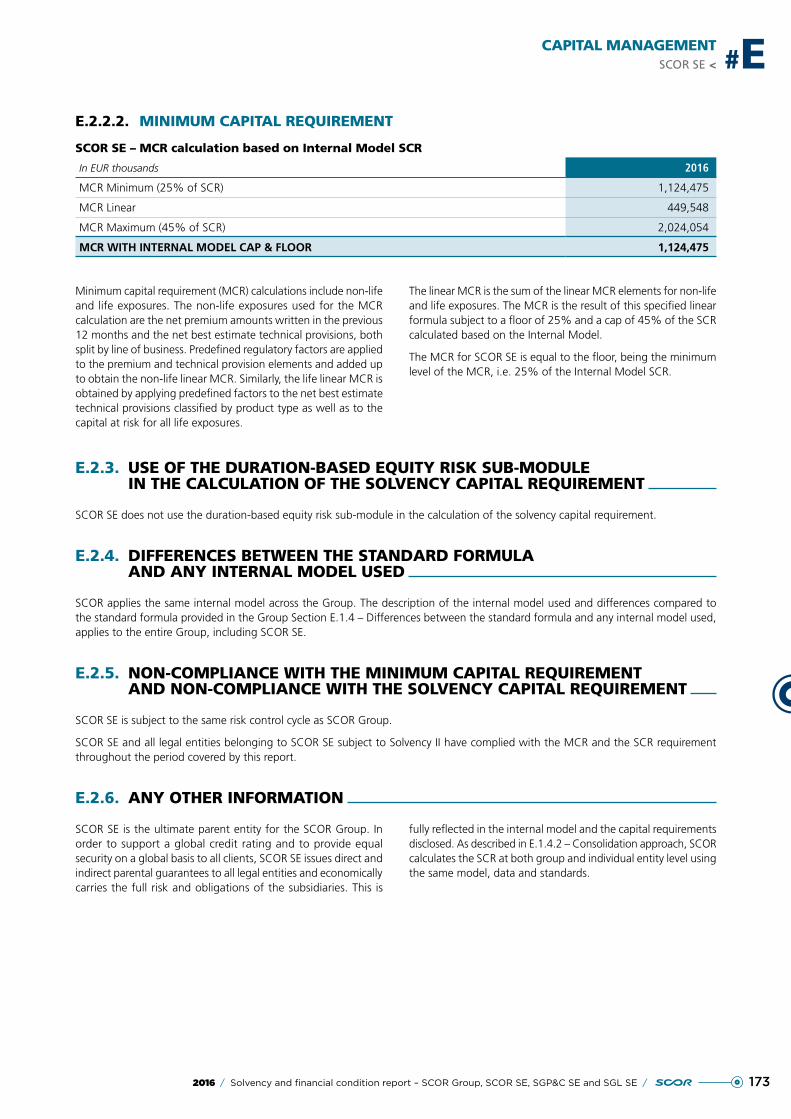
1732016 / Solvency and financial condition report – SCOR Group, SCOR SE, SGP&C SE and SGL SE /
CAPITAL MANAGEMENTSCOR SE < #E
E.2.2.2. MINIMUM CAPITAL REQUIREMENT
SCOR SE – MCR calculation based on Internal Model SCR
In EUR thousands 2016
MCR Minimum (25% of SCR) 1,124,475
MCR Linear 449,548
MCR Maximum (45% of SCR) 2,024,054
MCR WITH INTERNAL MODEL CAP & FLOOR 1,124,475
Minimum capital requirement (MCR) calculations include non-life and life exposures. The non-life exposures used for the MCR calculation are the net premium amounts written in the previous 12 months and the net best estimate technical provisions, both split by line of business. Predefined regulatory factors are applied to the premium and technical provision elements and added up to obtain the non-life linear MCR. Similarly, the life linear MCR is obtained by applying predefined factors to the net best estimate technical provisions classified by product type as well as to the capital at risk for all life exposures.
The linear MCR is the sum of the linear MCR elements for non-life and life exposures. The MCR is the result of this specified linear formula subject to a floor of 25% and a cap of 45% of the SCR calculated based on the Internal Model.
The MCR for SCOR SE is equal to the floor, being the minimum level of the MCR, i.e. 25% of the Internal Model SCR.
E.2.3. USE OF THE DURATION-BASED EQUITY RISK SUB-MODULE IN THE CALCULATION OF THE SOLVENCY CAPITAL REQUIREMENT
SCOR SE does not use the duration-based equity risk sub-module in the calculation of the solvency capital requirement.
E.2.4. DIFFERENCES BETWEEN THE STANDARD FORMULA AND ANY INTERNAL MODEL USED
SCOR applies the same internal model across the Group. The description of the internal model used and differences compared to the standard formula provided in the Group Section E.1.4 – Differences between the standard formula and any internal model used, applies to the entire Group, including SCOR SE.
E.2.5. NON-COMPLIANCE WITH THE MINIMUM CAPITAL REQUIREMENT AND NON-COMPLIANCE WITH THE SOLVENCY CAPITAL REQUIREMENT
SCOR SE is subject to the same risk control cycle as SCOR Group.
SCOR SE and all legal entities belonging to SCOR SE subject to Solvency II have complied with the MCR and the SCR requirement throughout the period covered by this report.
E.2.6. ANY OTHER INFORMATION
SCOR SE is the ultimate parent entity for the SCOR Group. In order to support a global credit rating and to provide equal security on a global basis to all clients, SCOR SE issues direct and indirect parental guarantees to all legal entities and economically carries the full risk and obligations of the subsidiaries. This is
fully reflected in the internal model and the capital requirements disclosed. As described in E.1.4.2 – Consolidation approach, SCOR calculates the SCR at both group and individual entity level using the same model, data and standards.
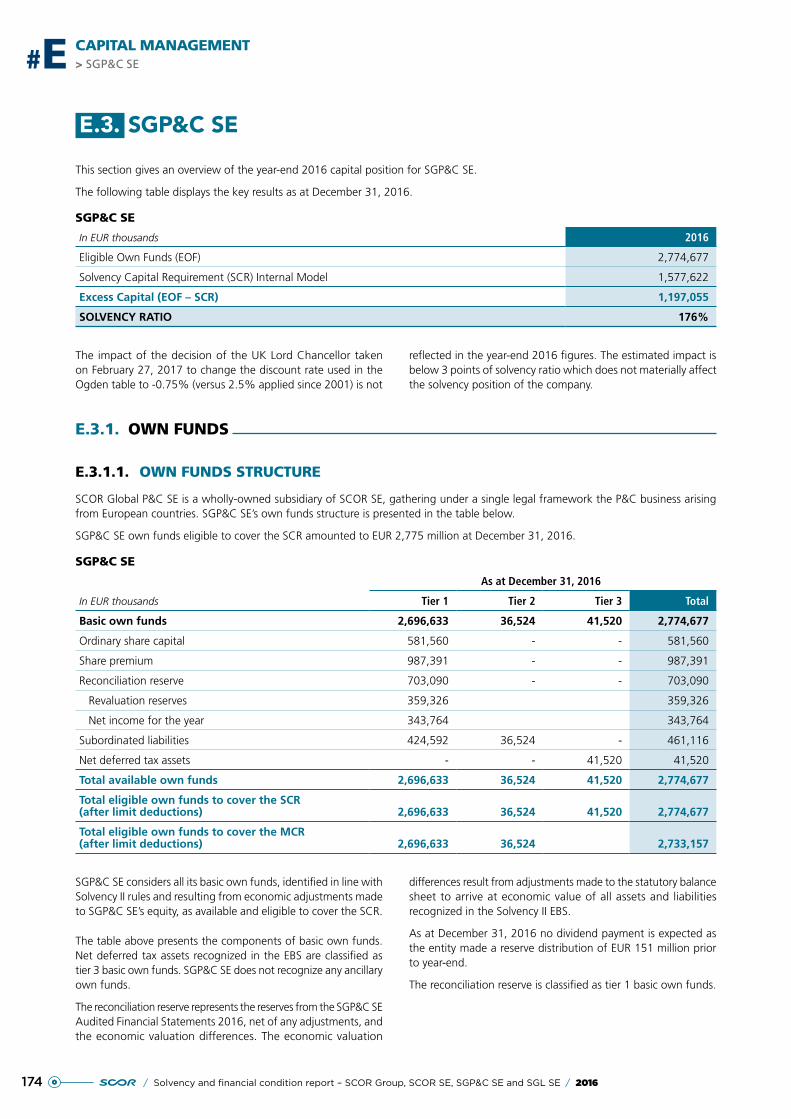
174 / Solvency and financial condition report – SCOR Group, SCOR SE, SGP&C SE and SGL SE / 2016
> SGP&C SE#E CAPITAL MANAGEMENT
E.3. SGP&C SE
This section gives an overview of the year-end 2016 capital position for SGP&C SE.
The following table displays the key results as at December 31, 2016.
SGP&C SE
In EUR thousands 2016
Eligible Own Funds (EOF) 2,774,677
Solvency Capital Requirement (SCR) Internal Model 1,577,622
Excess Capital (EOF – SCR) 1,197,055
SOLVENCY RATIO 176%
The impact of the decision of the UK Lord Chancellor taken on February 27, 2017 to change the discount rate used in the Ogden table to -0.75% (versus 2.5% applied since 2001) is not
reflected in the year-end 2016 figures. The estimated impact is below 3 points of solvency ratio which does not materially affect the solvency position of the company.
E.3.1. OWN FUNDS
E.3.1.1. OWN FUNDS STRUCTURE
SCOR Global P&C SE is a wholly-owned subsidiary of SCOR SE, gathering under a single legal framework the P&C business arising from European countries. SGP&C SE’s own funds structure is presented in the table below.
SGP&C SE own funds eligible to cover the SCR amounted to EUR 2,775 million at December 31, 2016.
SGP&C SE
In EUR thousands
As at December 31, 2016
Tier 1 Tier 2 Tier 3 Total
Basic own funds 2,696,633 36,524 41,520 2,774,677
Ordinary share capital 581,560 - - 581,560
Share premium 987,391 - - 987,391
Reconciliation reserve 703,090 - - 703,090
Revaluation reserves 359,326 359,326
Net income for the year 343,764 343,764
Subordinated liabilities 424,592 36,524 - 461,116
Net deferred tax assets - - 41,520 41,520
Total available own funds 2,696,633 36,524 41,520 2,774,677
Total eligible own funds to cover the SCR (after limit deductions) 2,696,633 36,524 41,520 2,774,677
Total eligible own funds to cover the MCR (after limit deductions) 2,696,633 36,524 2,733,157
SGP&C SE considers all its basic own funds, identified in line with Solvency II rules and resulting from economic adjustments made to SGP&C SE’s equity, as available and eligible to cover the SCR.
The table above presents the components of basic own funds. Net deferred tax assets recognized in the EBS are classified as tier 3 basic own funds. SGP&C SE does not recognize any ancillary own funds.
The reconciliation reserve represents the reserves from the SGP&C SE Audited Financial Statements 2016, net of any adjustments, and the economic valuation differences. The economic valuation
differences result from adjustments made to the statutory balance sheet to arrive at economic value of all assets and liabilities recognized in the Solvency II EBS.
As at December 31, 2016 no dividend payment is expected as the entity made a reserve distribution of EUR 151 million prior to year-end.
The reconciliation reserve is classified as tier 1 basic own funds.
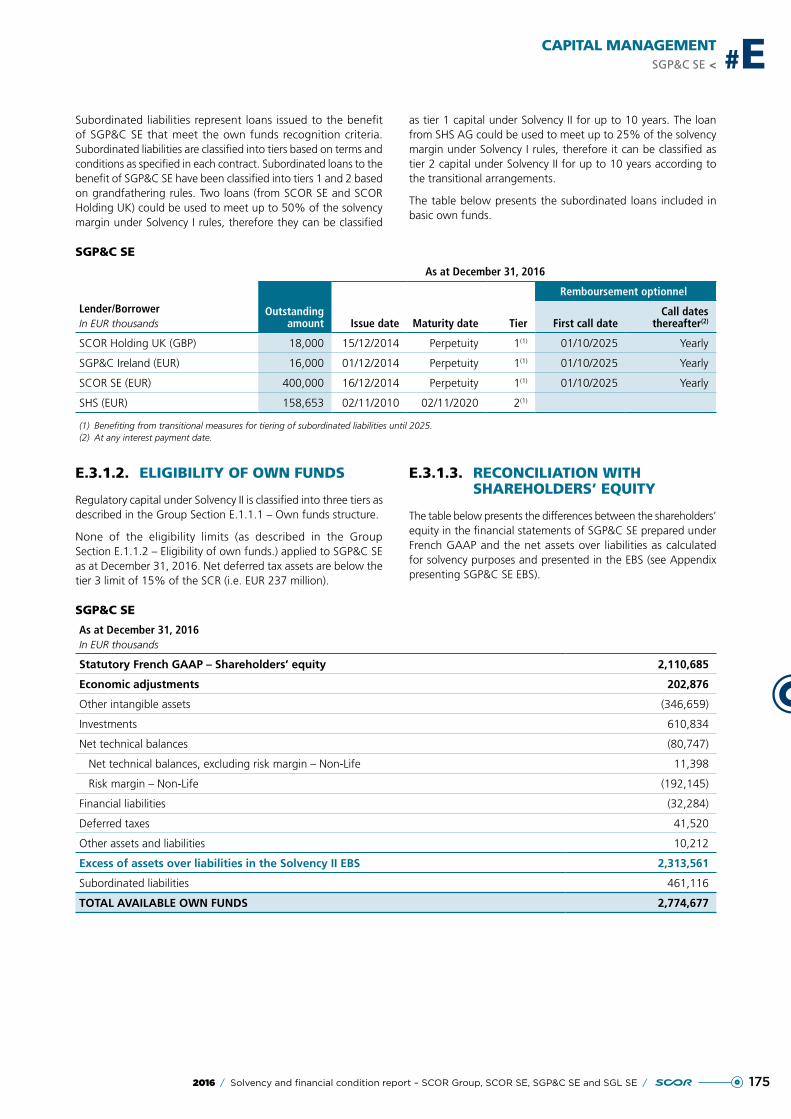
1752016 / Solvency and financial condition report – SCOR Group, SCOR SE, SGP&C SE and SGL SE /
CAPITAL MANAGEMENTSGP&C SE < #E
Subordinated liabilities represent loans issued to the benefit of SGP&C SE that meet the own funds recognition criteria. Subordinated liabilities are classified into tiers based on terms and conditions as specified in each contract. Subordinated loans to the benefit of SGP&C SE have been classified into tiers 1 and 2 based on grandfathering rules. Two loans (from SCOR SE and SCOR Holding UK) could be used to meet up to 50% of the solvency margin under Solvency I rules, therefore they can be classified
as tier 1 capital under Solvency II for up to 10 years. The loan from SHS AG could be used to meet up to 25% of the solvency margin under Solvency I rules, therefore it can be classified as tier 2 capital under Solvency II for up to 10 years according to the transitional arrangements.
The table below presents the subordinated loans included in basic own funds.
SGP&C SE
Lender/BorrowerIn EUR thousands
As at December 31, 2016
Remboursement optionnel
Outstanding amount Issue date Maturity date Tier First call date
Call dates thereafter(2)
SCOR Holding UK (GBP) 18,000 15/12/2014 Perpetuity 1(1) 01/10/2025 Yearly
SGP&C Ireland (EUR) 16,000 01/12/2014 Perpetuity 1(1) 01/10/2025 Yearly
SCOR SE (EUR) 400,000 16/12/2014 Perpetuity 1(1) 01/10/2025 Yearly
SHS (EUR) 158,653 02/11/2010 02/11/2020 2(1)
(1) Benefiting from transitional measures for tiering of subordinated liabilities until 2025.(2) At any interest payment date.
E.3.1.2. ELIGIBILITY OF OWN FUNDS
Regulatory capital under Solvency II is classified into three tiers as described in the Group Section E.1.1.1 – Own funds structure.
None of the eligibility limits (as described in the Group Section E.1.1.2 – Eligibility of own funds.) applied to SGP&C SE as at December 31, 2016. Net deferred tax assets are below the tier 3 limit of 15% of the SCR (i.e. EUR 237 million).
E.3.1.3. RECONCILIATION WITH SHAREHOLDERS’ EQUITY
The table below presents the differences between the shareholders’ equity in the financial statements of SGP&C SE prepared under French GAAP and the net assets over liabilities as calculated for solvency purposes and presented in the EBS (see Appendix presenting SGP&C SE EBS).
SGP&C SE
As at December 31, 2016In EUR thousands
Statutory French GAAP – Shareholders’ equity 2,110,685
Economic adjustments 202,876
Other intangible assets (346,659)
Investments 610,834
Net technical balances (80,747)
Net technical balances, excluding risk margin – Non-Life 11,398
Risk margin – Non-Life (192,145)
Financial liabilities (32,284)
Deferred taxes 41,520
Other assets and liabilities 10,212
Excess of assets over liabilities in the Solvency II EBS 2,313,561
Subordinated liabilities 461,116
TOTAL AVAILABLE OWN FUNDS 2,774,677
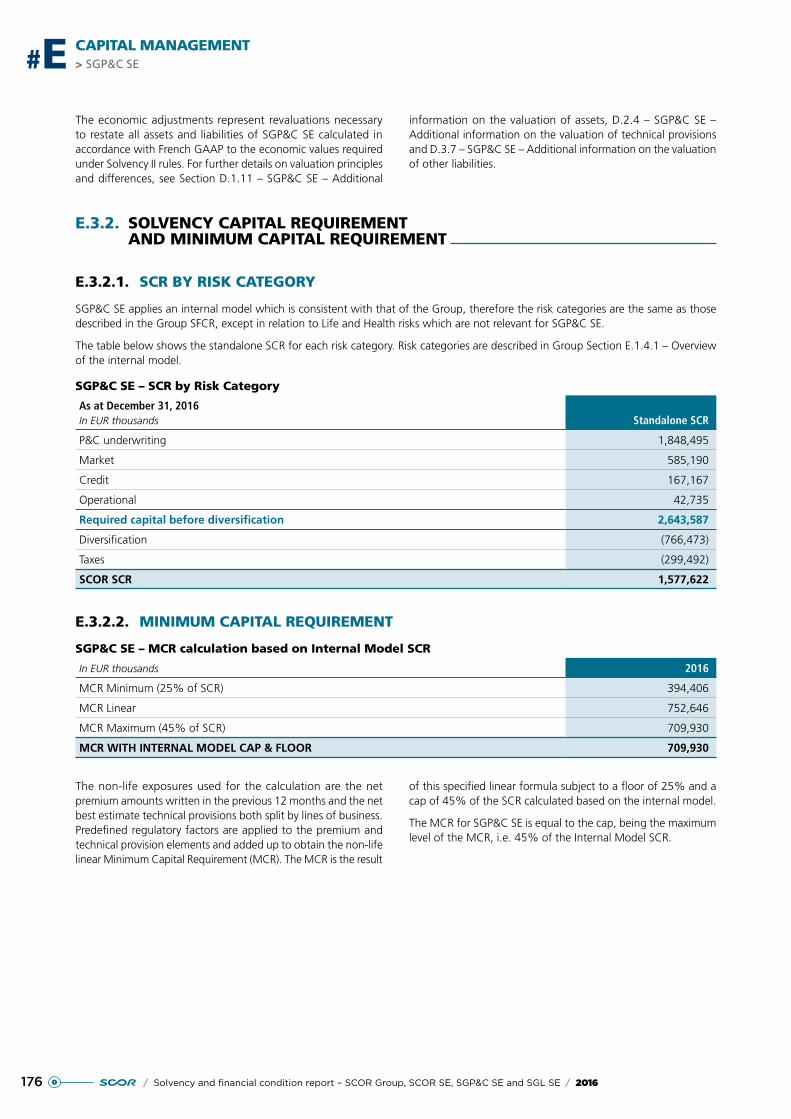
176 / Solvency and financial condition report – SCOR Group, SCOR SE, SGP&C SE and SGL SE / 2016
> SGP&C SE#E CAPITAL MANAGEMENT
The economic adjustments represent revaluations necessary to restate all assets and liabilities of SGP&C SE calculated in accordance with French GAAP to the economic values required under Solvency II rules. For further details on valuation principles and differences, see Section D.1.11 – SGP&C SE – Additional
information on the valuation of assets, D.2.4 – SGP&C SE – Additional information on the valuation of technical provisions and D.3.7 – SGP&C SE – Additional information on the valuation of other liabilities.
E.3.2. SOLVENCY CAPITAL REQUIREMENT AND MINIMUM CAPITAL REQUIREMENT
E.3.2.1. SCR BY RISK CATEGORY
SGP&C SE applies an internal model which is consistent with that of the Group, therefore the risk categories are the same as those described in the Group SFCR, except in relation to Life and Health risks which are not relevant for SGP&C SE.
The table below shows the standalone SCR for each risk category. Risk categories are described in Group Section E.1.4.1 – Overview of the internal model.
SGP&C SE – SCR by Risk Category
As at December 31, 2016In EUR thousands Standalone SCR
P&C underwriting 1,848,495
Market 585,190
Credit 167,167
Operational 42,735
Required capital before diversification 2,643,587
Diversification (766,473)
Taxes (299,492)
SCOR SCR 1,577,622
E.3.2.2. MINIMUM CAPITAL REQUIREMENT
SGP&C SE – MCR calculation based on Internal Model SCR
In EUR thousands 2016
MCR Minimum (25% of SCR) 394,406
MCR Linear 752,646
MCR Maximum (45% of SCR) 709,930
MCR WITH INTERNAL MODEL CAP & FLOOR 709,930
The non-life exposures used for the calculation are the net premium amounts written in the previous 12 months and the net best estimate technical provisions both split by lines of business. Predefined regulatory factors are applied to the premium and technical provision elements and added up to obtain the non-life linear Minimum Capital Requirement (MCR). The MCR is the result
of this specified linear formula subject to a floor of 25% and a cap of 45% of the SCR calculated based on the internal model.
The MCR for SGP&C SE is equal to the cap, being the maximum level of the MCR, i.e. 45% of the Internal Model SCR.
1772016 / Solvency and financial condition report – SCOR Group, SCOR SE, SGP&C SE and SGL SE /
CAPITAL MANAGEMENTSGP&C SE < #E
E.3.3. USE OF THE DURATION-BASED EQUITY RISK SUB-MODULE IN THE CALCULATION OF THE SOLVENCY CAPITAL REQUIREMENT
SGP&C SE does not use the duration-based equity risk sub-module in the calculation of the solvency capital requirement.
E.3.4. DIFFERENCES BETWEEN THE STANDARD FORMULA AND ANY INTERNAL MODEL USED
SCOR applies the same internal model across the Group. The description provided in the Group SFCR, Section E.1.4 – Differences between the standard formula and any internal model used, applies to the entire Group including SGP&C SE, but includes aspects such as modeling of life and health risks which are not relevant for SGP&C SE.
E.3.5. NON-COMPLIANCE WITH THE MINIMUM CAPITAL REQUIREMENT AND NON-COMPLIANCE WITH THE SOLVENCY CAPITAL REQUIREMENT
SGP&C SE is subject to the same risk control cycle as SCOR Group.
SGP&C SE and all legal entities belonging to SGP&C SE subject to Solvency II have been compliant with the MCR and the SCR requirement throughout the period covered by this report.
E.3.6. ANY OTHER INFORMATION
No other material information is reported regarding SGP&C SE’s capital management other than that presented above in Section E.3 – SGP&C SE.
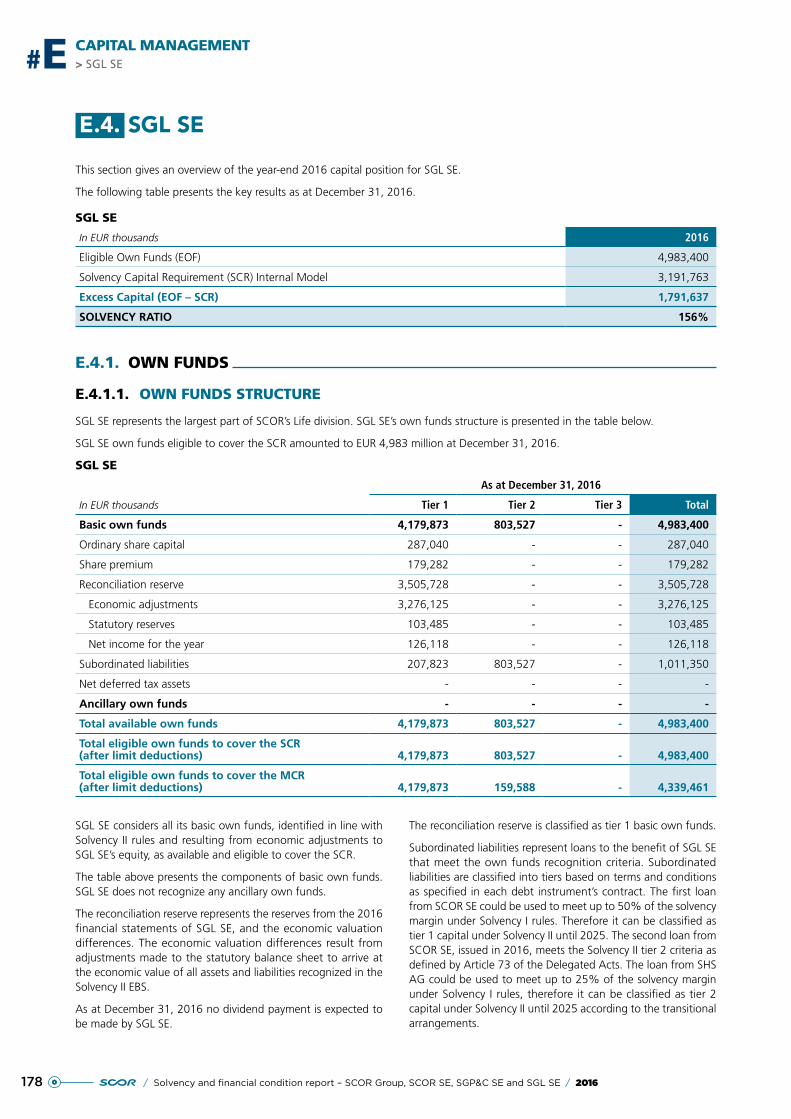
178 / Solvency and financial condition report – SCOR Group, SCOR SE, SGP&C SE and SGL SE / 2016
> SGL SE#E CAPITAL MANAGEMENT
E.4. SGL SE
This section gives an overview of the year-end 2016 capital position for SGL SE.
The following table presents the key results as at December 31, 2016.
SGL SE
In EUR thousands 2016
Eligible Own Funds (EOF) 4,983,400
Solvency Capital Requirement (SCR) Internal Model 3,191,763
Excess Capital (EOF – SCR) 1,791,637
SOLVENCY RATIO 156%
E.4.1. OWN FUNDS
E.4.1.1. OWN FUNDS STRUCTURE
SGL SE represents the largest part of SCOR’s Life division. SGL SE’s own funds structure is presented in the table below.
SGL SE own funds eligible to cover the SCR amounted to EUR 4,983 million at December 31, 2016.
SGL SE
In EUR thousands
As at December 31, 2016
Tier 1 Tier 2 Tier 3 Total
Basic own funds 4,179,873 803,527 - 4,983,400
Ordinary share capital 287,040 - - 287,040
Share premium 179,282 - - 179,282
Reconciliation reserve 3,505,728 - - 3,505,728
Economic adjustments 3,276,125 - - 3,276,125
Statutory reserves 103,485 - - 103,485
Net income for the year 126,118 - - 126,118
Subordinated liabilities 207,823 803,527 - 1,011,350
Net deferred tax assets - - - -
Ancillary own funds - - - -
Total available own funds 4,179,873 803,527 - 4,983,400
Total eligible own funds to cover the SCR (after limit deductions) 4,179,873 803,527 - 4,983,400
Total eligible own funds to cover the MCR (after limit deductions) 4,179,873 159,588 - 4,339,461
SGL SE considers all its basic own funds, identified in line with Solvency II rules and resulting from economic adjustments to SGL SE’s equity, as available and eligible to cover the SCR.
The table above presents the components of basic own funds. SGL SE does not recognize any ancillary own funds.
The reconciliation reserve represents the reserves from the 2016 financial statements of SGL SE, and the economic valuation differences. The economic valuation differences result from adjustments made to the statutory balance sheet to arrive at the economic value of all assets and liabilities recognized in the Solvency II EBS.
As at December 31, 2016 no dividend payment is expected to be made by SGL SE.
The reconciliation reserve is classified as tier 1 basic own funds.
Subordinated liabilities represent loans to the benefit of SGL SE that meet the own funds recognition criteria. Subordinated liabilities are classified into tiers based on terms and conditions as specified in each debt instrument’s contract. The first loan from SCOR SE could be used to meet up to 50% of the solvency margin under Solvency I rules. Therefore it can be classified as tier 1 capital under Solvency II until 2025. The second loan from SCOR SE, issued in 2016, meets the Solvency II tier 2 criteria as defined by Article 73 of the Delegated Acts. The loan from SHS AG could be used to meet up to 25% of the solvency margin under Solvency I rules, therefore it can be classified as tier 2 capital under Solvency II until 2025 according to the transitional arrangements.
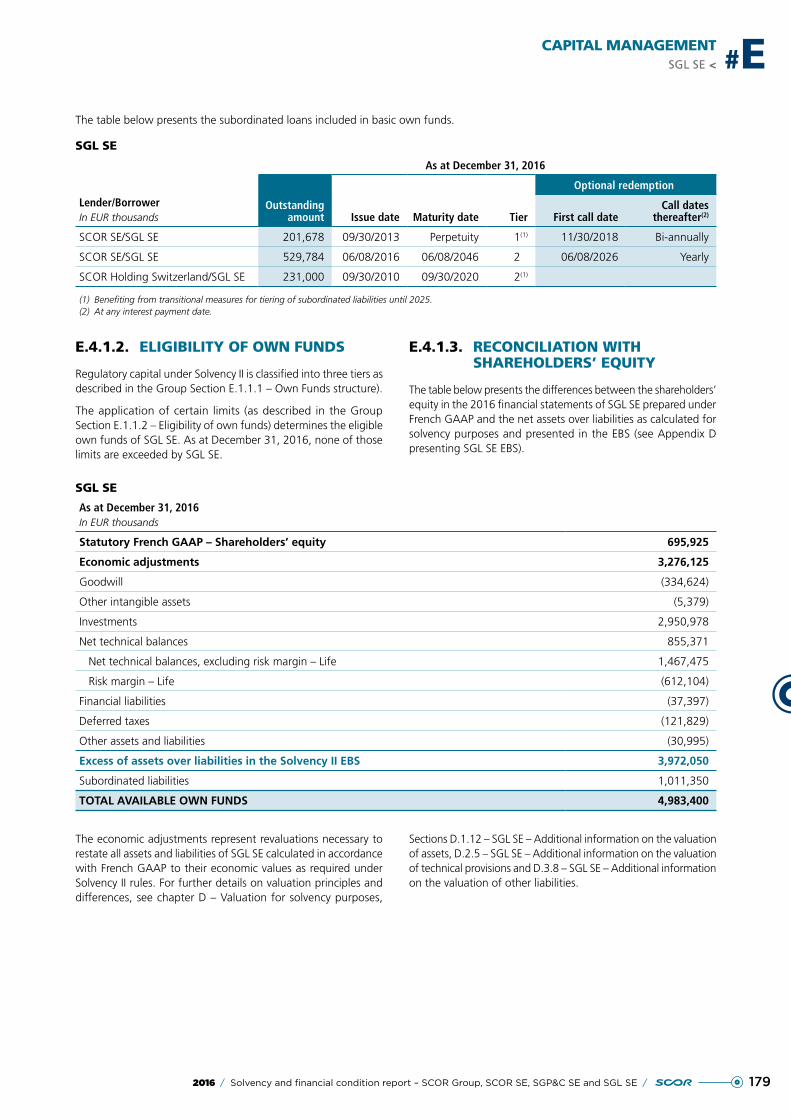
1792016 / Solvency and financial condition report – SCOR Group, SCOR SE, SGP&C SE and SGL SE /
CAPITAL MANAGEMENTSGL SE < #E
The table below presents the subordinated loans included in basic own funds.
SGL SE
Lender/BorrowerIn EUR thousands
As at December 31, 2016
Optional redemption
Outstanding amount Issue date Maturity date Tier First call date
Call dates thereafter(2)
SCOR SE/SGL SE 201,678 09/30/2013 Perpetuity 1(1) 11/30/2018 Bi-annually
SCOR SE/SGL SE 529,784 06/08/2016 06/08/2046 2 06/08/2026 Yearly
SCOR Holding Switzerland/SGL SE 231,000 09/30/2010 09/30/2020 2(1)
(1) Benefiting from transitional measures for tiering of subordinated liabilities until 2025.(2) At any interest payment date.
E.4.1.2. ELIGIBILITY OF OWN FUNDS
Regulatory capital under Solvency II is classified into three tiers as described in the Group Section E.1.1.1 – Own Funds structure).
The application of certain limits (as described in the Group Section E.1.1.2 – Eligibility of own funds) determines the eligible own funds of SGL SE. As at December 31, 2016, none of those limits are exceeded by SGL SE.
E.4.1.3. RECONCILIATION WITH SHAREHOLDERS’ EQUITY
The table below presents the differences between the shareholders’ equity in the 2016 financial statements of SGL SE prepared under French GAAP and the net assets over liabilities as calculated for solvency purposes and presented in the EBS (see Appendix D presenting SGL SE EBS).
SGL SE
As at December 31, 2016In EUR thousands
Statutory French GAAP – Shareholders’ equity 695,925
Economic adjustments 3,276,125
Goodwill (334,624)
Other intangible assets (5,379)
Investments 2,950,978
Net technical balances 855,371
Net technical balances, excluding risk margin – Life 1,467,475
Risk margin – Life (612,104)
Financial liabilities (37,397)
Deferred taxes (121,829)
Other assets and liabilities (30,995)
Excess of assets over liabilities in the Solvency II EBS 3,972,050
Subordinated liabilities 1,011,350
TOTAL AVAILABLE OWN FUNDS 4,983,400
The economic adjustments represent revaluations necessary to restate all assets and liabilities of SGL SE calculated in accordance with French GAAP to their economic values as required under Solvency II rules. For further details on valuation principles and differences, see chapter D – Valuation for solvency purposes,
Sections D.1.12 – SGL SE – Additional information on the valuation of assets, D.2.5 – SGL SE – Additional information on the valuation of technical provisions and D.3.8 – SGL SE – Additional information on the valuation of other liabilities.
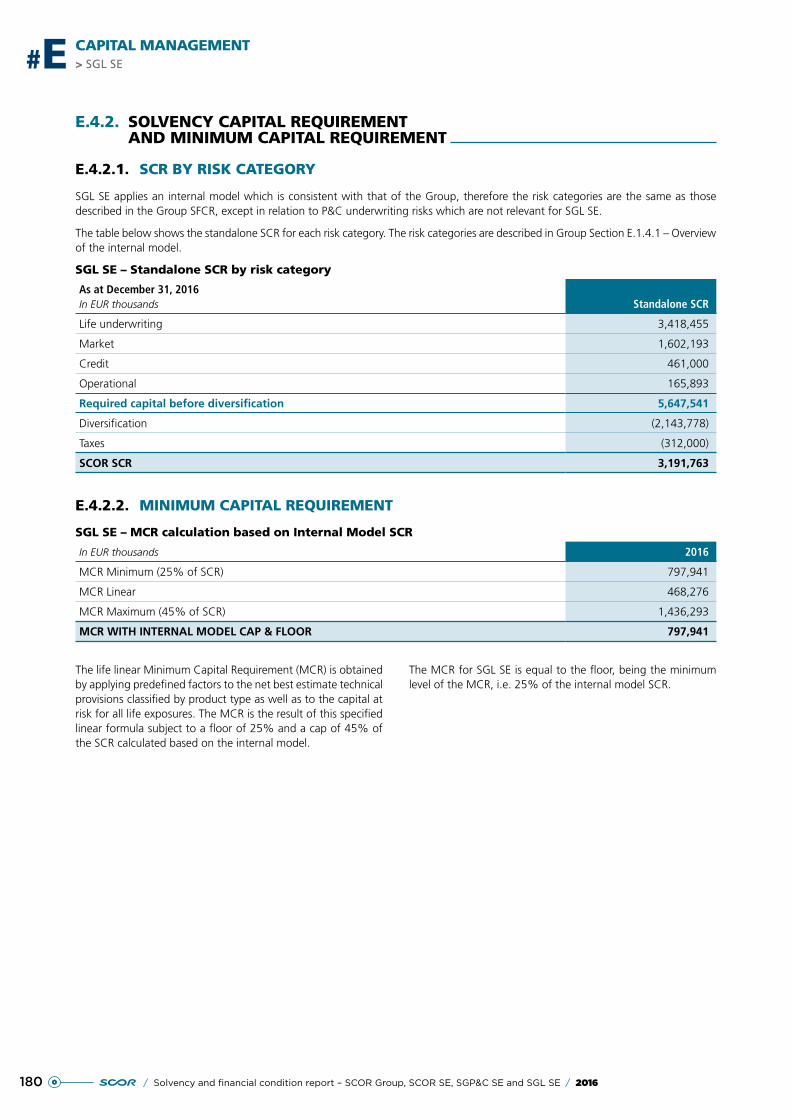
180 / Solvency and financial condition report – SCOR Group, SCOR SE, SGP&C SE and SGL SE / 2016
> SGL SE#E CAPITAL MANAGEMENT
E.4.2. SOLVENCY CAPITAL REQUIREMENT AND MINIMUM CAPITAL REQUIREMENT
E.4.2.1. SCR BY RISK CATEGORY
SGL SE applies an internal model which is consistent with that of the Group, therefore the risk categories are the same as those described in the Group SFCR, except in relation to P&C underwriting risks which are not relevant for SGL SE.
The table below shows the standalone SCR for each risk category. The risk categories are described in Group Section E.1.4.1 – Overview of the internal model.
SGL SE – Standalone SCR by risk category
As at December 31, 2016In EUR thousands Standalone SCR
Life underwriting 3,418,455
Market 1,602,193
Credit 461,000
Operational 165,893
Required capital before diversification 5,647,541
Diversification (2,143,778)
Taxes (312,000)
SCOR SCR 3,191,763
E.4.2.2. MINIMUM CAPITAL REQUIREMENT
SGL SE – MCR calculation based on Internal Model SCR
In EUR thousands 2016
MCR Minimum (25% of SCR) 797,941
MCR Linear 468,276
MCR Maximum (45% of SCR) 1,436,293
MCR WITH INTERNAL MODEL CAP & FLOOR 797,941
The life linear Minimum Capital Requirement (MCR) is obtained by applying predefined factors to the net best estimate technical provisions classified by product type as well as to the capital at risk for all life exposures. The MCR is the result of this specified linear formula subject to a floor of 25% and a cap of 45% of the SCR calculated based on the internal model.
The MCR for SGL SE is equal to the floor, being the minimum level of the MCR, i.e. 25% of the internal model SCR.
1812016 / Solvency and financial condition report – SCOR Group, SCOR SE, SGP&C SE and SGL SE /
CAPITAL MANAGEMENTSGL SE < #E
E.4.3. USE OF THE DURATION-BASED EQUITY RISK SUB-MODULE IN THE CALCULATION OF THE SOLVENCY CAPITAL REQUIREMENT
SGL SE does not use the duration-based equity risk sub-module in the calculation of the solvency capital requirement.
E.4.4. DIFFERENCES BETWEEN THE STANDARD FORMULA AND ANY INTERNAL MODEL USED
SGL SE applies the same internal model across the Group. The description provided in the Group Section E.1.4 – Differences between the standard formula and any internal model used, applies to the entire Group, including SGL SE, but includes aspects such as modeling of property and casualty risk, which are not relevant for SGL SE.
E.4.5. NON-COMPLIANCE WITH THE MINIMUM CAPITAL REQUIREMENT AND NON-COMPLIANCE WITH THE SOLVENCY CAPITAL REQUIREMENT
SGL SE is subject to the same risk control cycle as SCOR Group.
SGL SE and all legal entities belonging to SGL SE subject to Solvency II have been compliant with the MCR and the SCR requirement throughout the period covered by this report.
E.4.6. ANY OTHER INFORMATION
No material information is reported regarding SGL SE’s capital management other than that presented above in Section E.4 – SGL SE.
182 / Solvency and financial condition report – SCOR Group, SCOR SE, SGP&C SE and SGL SE / 2016
SCOR GROUP PUBLIC DISCLOSURE QRTS
# APPENDIX A
S.02.01.02 – Balance sheet 183
S.05.01.02 – Non-Life premiums, claims and expenses by line of business 185
S.05.01.02 – Life premiums, claims and expenses by line of business 187
S.05.02.01 – Non-Life premiums, claims and expenses by country 188
S.05.02.01 – Life premiums, claims and expenses by country 189
S.23.01.22 – Own funds 190
S.25.03.22 – Solvency Capital Requirement – For groups on Full Internal Models 193
S.32.01.22 – Undertakings in the scope of Group 194
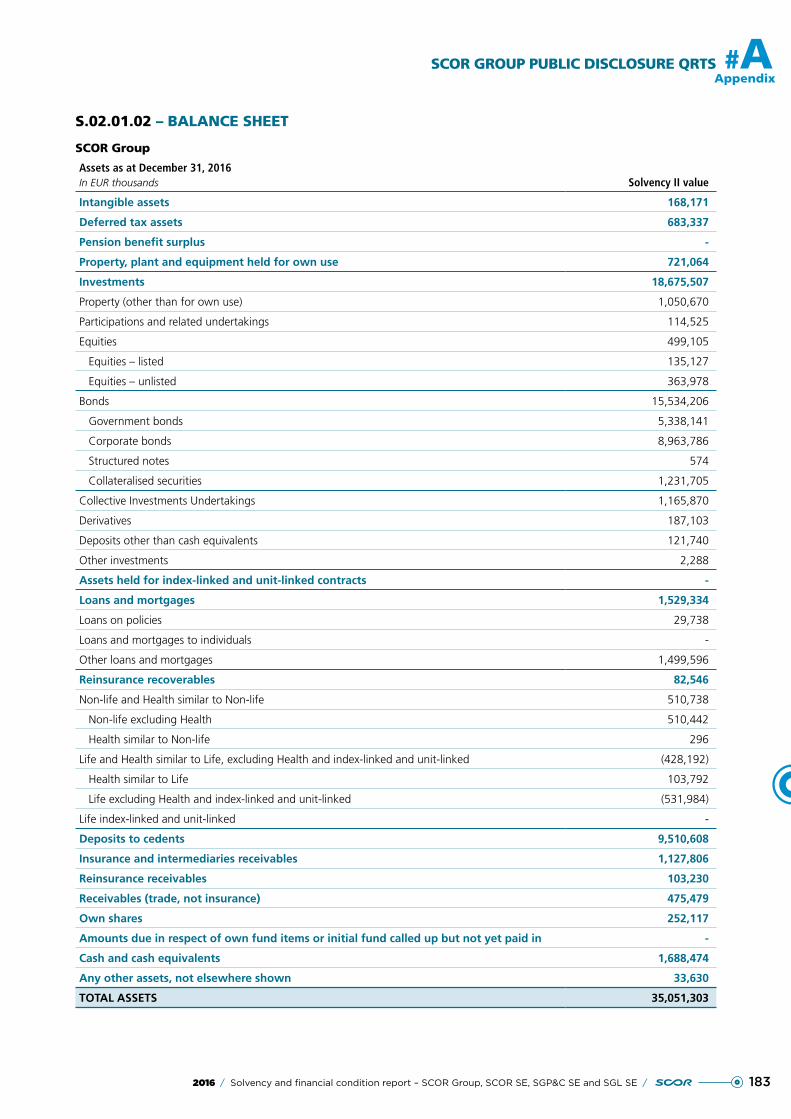
1832016 / Solvency and financial condition report – SCOR Group, SCOR SE, SGP&C SE and SGL SE /
SCOR GROUP PUBLIC DISCLOSURE QRTS #AAppendix
S.02.01.02 – BALANCE SHEET
SCOR Group
Assets as at December 31, 2016In EUR thousands Solvency II value
Intangible assets 168,171
Deferred tax assets 683,337
Pension benefit surplus -
Property, plant and equipment held for own use 721,064
Investments 18,675,507
Property (other than for own use) 1,050,670
Participations and related undertakings 114,525
Equities 499,105
Equities – listed 135,127
Equities – unlisted 363,978
Bonds 15,534,206
Government bonds 5,338,141
Corporate bonds 8,963,786
Structured notes 574
Collateralised securities 1,231,705
Collective Investments Undertakings 1,165,870
Derivatives 187,103
Deposits other than cash equivalents 121,740
Other investments 2,288
Assets held for index-linked and unit-linked contracts -
Loans and mortgages 1,529,334
Loans on policies 29,738
Loans and mortgages to individuals -
Other loans and mortgages 1,499,596
Reinsurance recoverables 82,546
Non-life and Health similar to Non-life 510,738
Non-life excluding Health 510,442
Health similar to Non-life 296
Life and Health similar to Life, excluding Health and index-linked and unit-linked (428,192)
Health similar to Life 103,792
Life excluding Health and index-linked and unit-linked (531,984)
Life index-linked and unit-linked -
Deposits to cedents 9,510,608
Insurance and intermediaries receivables 1,127,806
Reinsurance receivables 103,230
Receivables (trade, not insurance) 475,479
Own shares 252,117
Amounts due in respect of own fund items or initial fund called up but not yet paid in -
Cash and cash equivalents 1,688,474
Any other assets, not elsewhere shown 33,630
TOTAL ASSETS 35,051,303
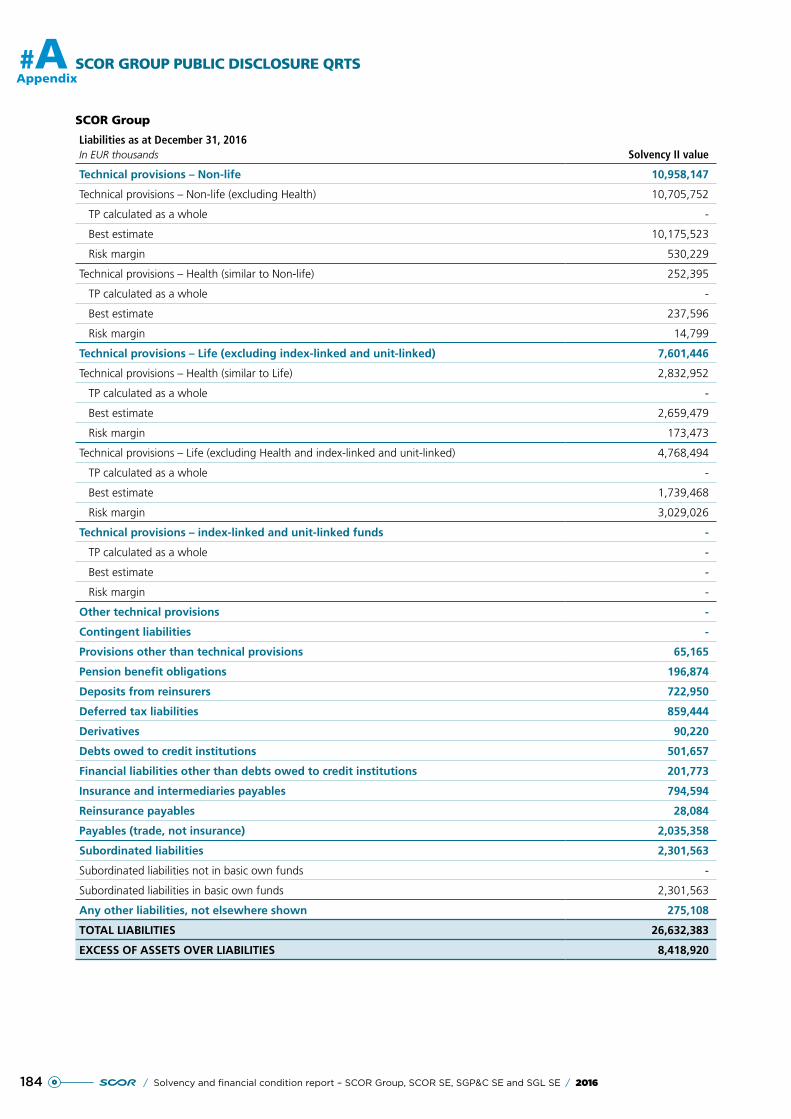
184 / Solvency and financial condition report – SCOR Group, SCOR SE, SGP&C SE and SGL SE / 2016
#A SCOR GROUP PUBLIC DISCLOSURE QRTS
Appendix
SCOR Group
Liabilities as at December 31, 2016In EUR thousands Solvency II value
Technical provisions – Non-life 10,958,147
Technical provisions – Non-life (excluding Health) 10,705,752
TP calculated as a whole -
Best estimate 10,175,523
Risk margin 530,229
Technical provisions – Health (similar to Non-life) 252,395
TP calculated as a whole -
Best estimate 237,596
Risk margin 14,799
Technical provisions – Life (excluding index-linked and unit-linked) 7,601,446
Technical provisions – Health (similar to Life) 2,832,952
TP calculated as a whole -
Best estimate 2,659,479
Risk margin 173,473
Technical provisions – Life (excluding Health and index-linked and unit-linked) 4,768,494
TP calculated as a whole -
Best estimate 1,739,468
Risk margin 3,029,026
Technical provisions – index-linked and unit-linked funds -
TP calculated as a whole -
Best estimate -
Risk margin -
Other technical provisions -
Contingent liabilities -
Provisions other than technical provisions 65,165
Pension benefit obligations 196,874
Deposits from reinsurers 722,950
Deferred tax liabilities 859,444
Derivatives 90,220
Debts owed to credit institutions 501,657
Financial liabilities other than debts owed to credit institutions 201,773
Insurance and intermediaries payables 794,594
Reinsurance payables 28,084
Payables (trade, not insurance) 2,035,358
Subordinated liabilities 2,301,563
Subordinated liabilities not in basic own funds -
Subordinated liabilities in basic own funds 2,301,563
Any other liabilities, not elsewhere shown 275,108
TOTAL LIABILITIES 26,632,383
EXCESS OF ASSETS OVER LIABILITIES 8,418,920
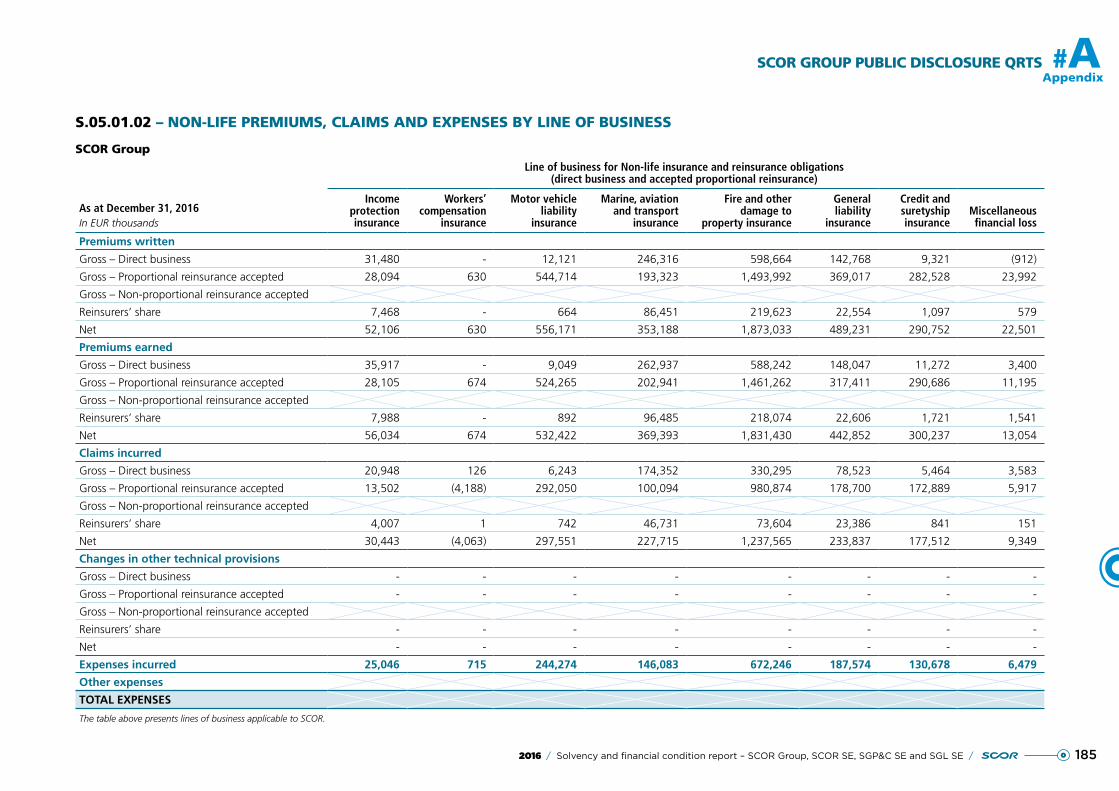
SCOR GROUP PUBLIC DISCLOSURE QRTS
185
#A
2016 / Solvency and financial condition report – SCOR Group, SCOR SE, SGP&C SE and SGL SE /
Appendix
S.05.01.02 – NON-LIFE PREMIUMS, CLAIMS AND EXPENSES BY LINE OF BUSINESS
SCOR Group
As at December 31, 2016In EUR thousands
Line of business for Non-life insurance and reinsurance obligations(direct business and accepted proportional reinsurance)
Income protection insurance
Workers’ compensation
insurance
Motor vehicle liability
insurance
Marine, aviation and transport
insurance
Fire and other damage to
property insurance
General liability
insurance
Credit and suretyship insurance
Miscellaneous financial loss
Premiums written
Gross – Direct business 31,480 - 12,121 246,316 598,664 142,768 9,321 (912)
Gross – Proportional reinsurance accepted 28,094 630 544,714 193,323 1,493,992 369,017 282,528 23,992
Gross – Non-proportional reinsurance accepted
Reinsurers’ share 7,468 - 664 86,451 219,623 22,554 1,097 579
Net 52,106 630 556,171 353,188 1,873,033 489,231 290,752 22,501
Premiums earned
Gross – Direct business 35,917 - 9,049 262,937 588,242 148,047 11,272 3,400
Gross – Proportional reinsurance accepted 28,105 674 524,265 202,941 1,461,262 317,411 290,686 11,195
Gross – Non-proportional reinsurance accepted
Reinsurers’ share 7,988 - 892 96,485 218,074 22,606 1,721 1,541
Net 56,034 674 532,422 369,393 1,831,430 442,852 300,237 13,054
Claims incurred
Gross – Direct business 20,948 126 6,243 174,352 330,295 78,523 5,464 3,583
Gross – Proportional reinsurance accepted 13,502 (4,188) 292,050 100,094 980,874 178,700 172,889 5,917
Gross – Non-proportional reinsurance accepted
Reinsurers’ share 4,007 1 742 46,731 73,604 23,386 841 151
Net 30,443 (4,063) 297,551 227,715 1,237,565 233,837 177,512 9,349
Changes in other technical provisions
Gross – Direct business - - - - - - - -
Gross – Proportional reinsurance accepted - - - - - - - -
Gross – Non-proportional reinsurance accepted
Reinsurers’ share - - - - - - - -
Net - - - - - - - -
Expenses incurred 25,046 715 244,274 146,083 672,246 187,574 130,678 6,479
Other expenses
TOTAL EXPENSES
The table above presents lines of business applicable to SCOR.
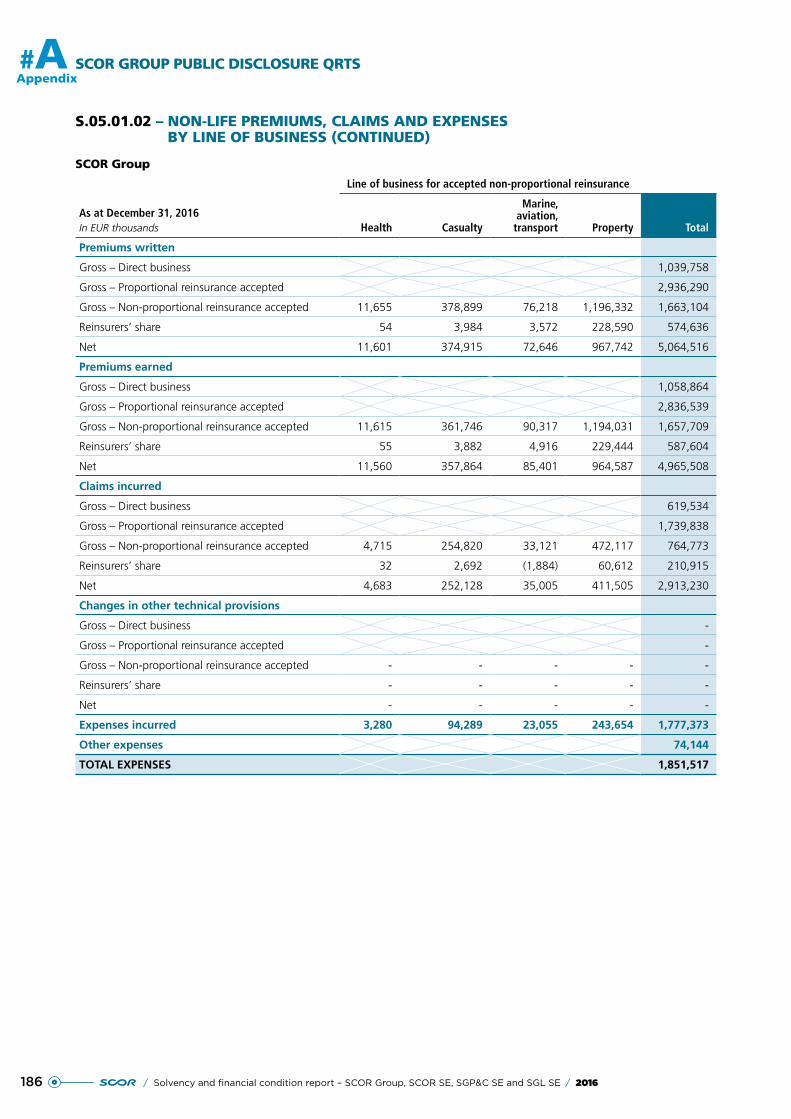
186 / Solvency and financial condition report – SCOR Group, SCOR SE, SGP&C SE and SGL SE / 2016
#A SCOR GROUP PUBLIC DISCLOSURE QRTS
Appendix
S.05.01.02 – NON-LIFE PREMIUMS, CLAIMS AND EXPENSES BY LINE OF BUSINESS (CONTINUED)
SCOR Group
As at December 31, 2016In EUR thousands
Line of business for accepted non-proportional reinsurance
Health Casualty
Marine, aviation,
transport Property Total
Premiums written
Gross – Direct business 1,039,758
Gross – Proportional reinsurance accepted 2,936,290
Gross – Non-proportional reinsurance accepted 11,655 378,899 76,218 1,196,332 1,663,104
Reinsurers’ share 54 3,984 3,572 228,590 574,636
Net 11,601 374,915 72,646 967,742 5,064,516
Premiums earned
Gross – Direct business 1,058,864
Gross – Proportional reinsurance accepted 2,836,539
Gross – Non-proportional reinsurance accepted 11,615 361,746 90,317 1,194,031 1,657,709
Reinsurers’ share 55 3,882 4,916 229,444 587,604
Net 11,560 357,864 85,401 964,587 4,965,508
Claims incurred
Gross – Direct business 619,534
Gross – Proportional reinsurance accepted 1,739,838
Gross – Non-proportional reinsurance accepted 4,715 254,820 33,121 472,117 764,773
Reinsurers’ share 32 2,692 (1,884) 60,612 210,915
Net 4,683 252,128 35,005 411,505 2,913,230
Changes in other technical provisions
Gross – Direct business -
Gross – Proportional reinsurance accepted -
Gross – Non-proportional reinsurance accepted - - - - -
Reinsurers’ share - - - - -
Net - - - - -
Expenses incurred 3,280 94,289 23,055 243,654 1,777,373
Other expenses 74,144
TOTAL EXPENSES 1,851,517
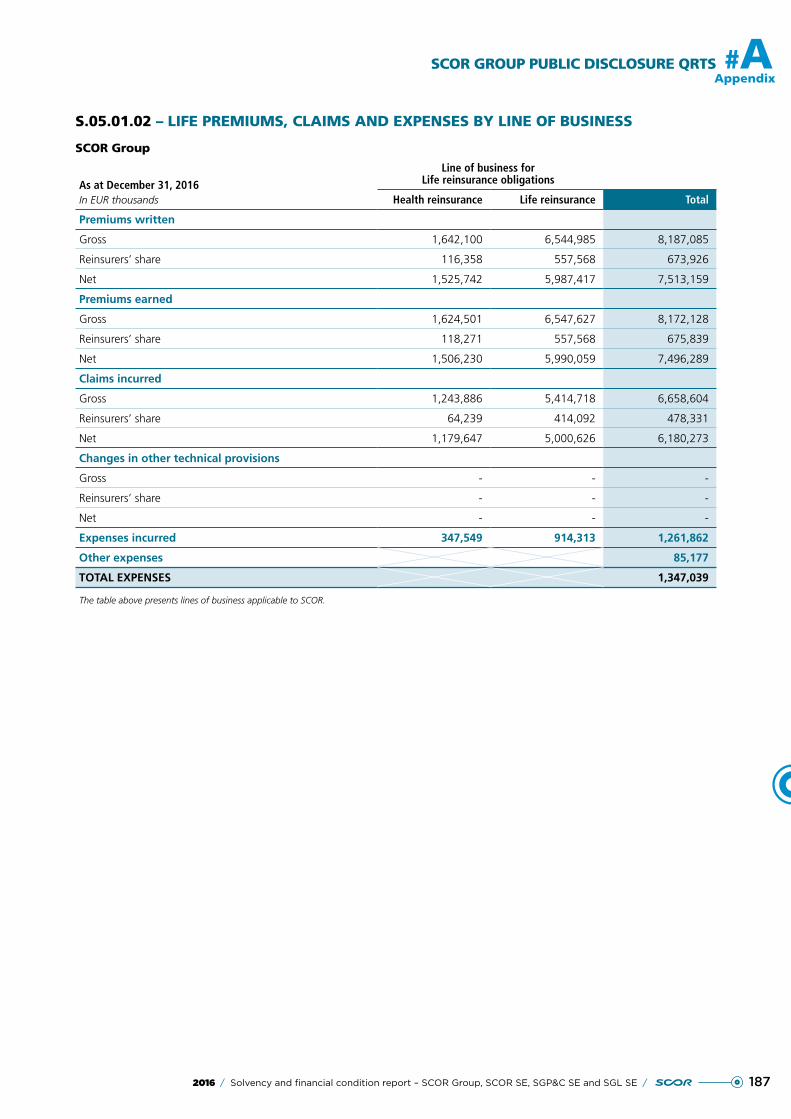
1872016 / Solvency and financial condition report – SCOR Group, SCOR SE, SGP&C SE and SGL SE /
SCOR GROUP PUBLIC DISCLOSURE QRTS #AAppendix
S.05.01.02 – LIFE PREMIUMS, CLAIMS AND EXPENSES BY LINE OF BUSINESS
SCOR Group
As at December 31, 2016In EUR thousands
Line of business for Life reinsurance obligations
Health reinsurance Life reinsurance Total
Premiums written
Gross 1,642,100 6,544,985 8,187,085
Reinsurers’ share 116,358 557,568 673,926
Net 1,525,742 5,987,417 7,513,159
Premiums earned
Gross 1,624,501 6,547,627 8,172,128
Reinsurers’ share 118,271 557,568 675,839
Net 1,506,230 5,990,059 7,496,289
Claims incurred
Gross 1,243,886 5,414,718 6,658,604
Reinsurers’ share 64,239 414,092 478,331
Net 1,179,647 5,000,626 6,180,273
Changes in other technical provisions
Gross - - -
Reinsurers’ share - - -
Net - - -
Expenses incurred 347,549 914,313 1,261,862
Other expenses 85,177
TOTAL EXPENSES 1,347,039
The table above presents lines of business applicable to SCOR.
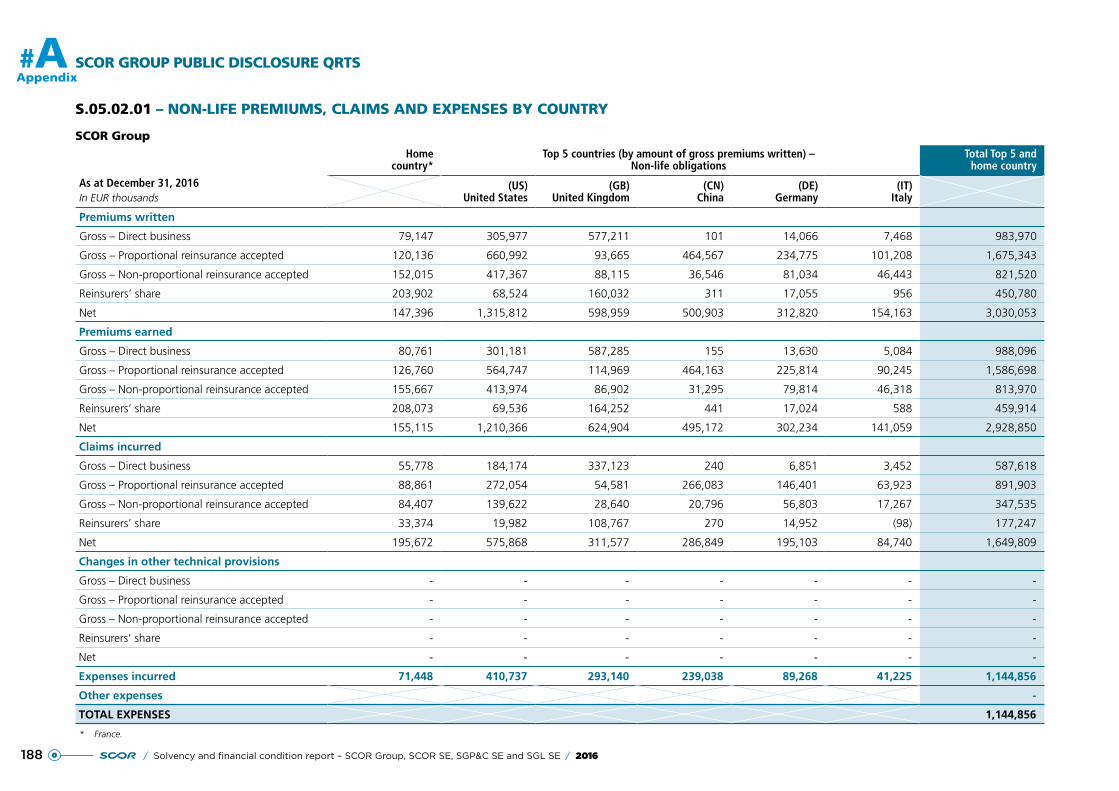
SCOR GROUP PUBLIC DISCLOSURE QRTS
188
#A
/ Solvency and financial condition report – SCOR Group, SCOR SE, SGP&C SE and SGL SE / 2016
Appendix
S.05.02.01 – NON-LIFE PREMIUMS, CLAIMS AND EXPENSES BY COUNTRY
SCOR Group
As at December 31, 2016In EUR thousands
Homecountry*
Top 5 countries (by amount of gross premiums written) – Non-life obligations
Total Top 5 and home country
(US) United States
(GB) United Kingdom
(CN) China
(DE) Germany
(IT) Italy
Premiums written
Gross – Direct business 79,147 305,977 577,211 101 14,066 7,468 983,970
Gross – Proportional reinsurance accepted 120,136 660,992 93,665 464,567 234,775 101,208 1,675,343
Gross – Non-proportional reinsurance accepted 152,015 417,367 88,115 36,546 81,034 46,443 821,520
Reinsurers’ share 203,902 68,524 160,032 311 17,055 956 450,780
Net 147,396 1,315,812 598,959 500,903 312,820 154,163 3,030,053
Premiums earned
Gross – Direct business 80,761 301,181 587,285 155 13,630 5,084 988,096
Gross – Proportional reinsurance accepted 126,760 564,747 114,969 464,163 225,814 90,245 1,586,698
Gross – Non-proportional reinsurance accepted 155,667 413,974 86,902 31,295 79,814 46,318 813,970
Reinsurers’ share 208,073 69,536 164,252 441 17,024 588 459,914
Net 155,115 1,210,366 624,904 495,172 302,234 141,059 2,928,850
Claims incurred
Gross – Direct business 55,778 184,174 337,123 240 6,851 3,452 587,618
Gross – Proportional reinsurance accepted 88,861 272,054 54,581 266,083 146,401 63,923 891,903
Gross – Non-proportional reinsurance accepted 84,407 139,622 28,640 20,796 56,803 17,267 347,535
Reinsurers’ share 33,374 19,982 108,767 270 14,952 (98) 177,247
Net 195,672 575,868 311,577 286,849 195,103 84,740 1,649,809
Changes in other technical provisions
Gross – Direct business - - - - - - -
Gross – Proportional reinsurance accepted - - - - - - -
Gross – Non-proportional reinsurance accepted - - - - - - -
Reinsurers’ share - - - - - - -
Net - - - - - - -
Expenses incurred 71,448 410,737 293,140 239,038 89,268 41,225 1,144,856
Other expenses -
TOTAL EXPENSES 1,144,856
* France.
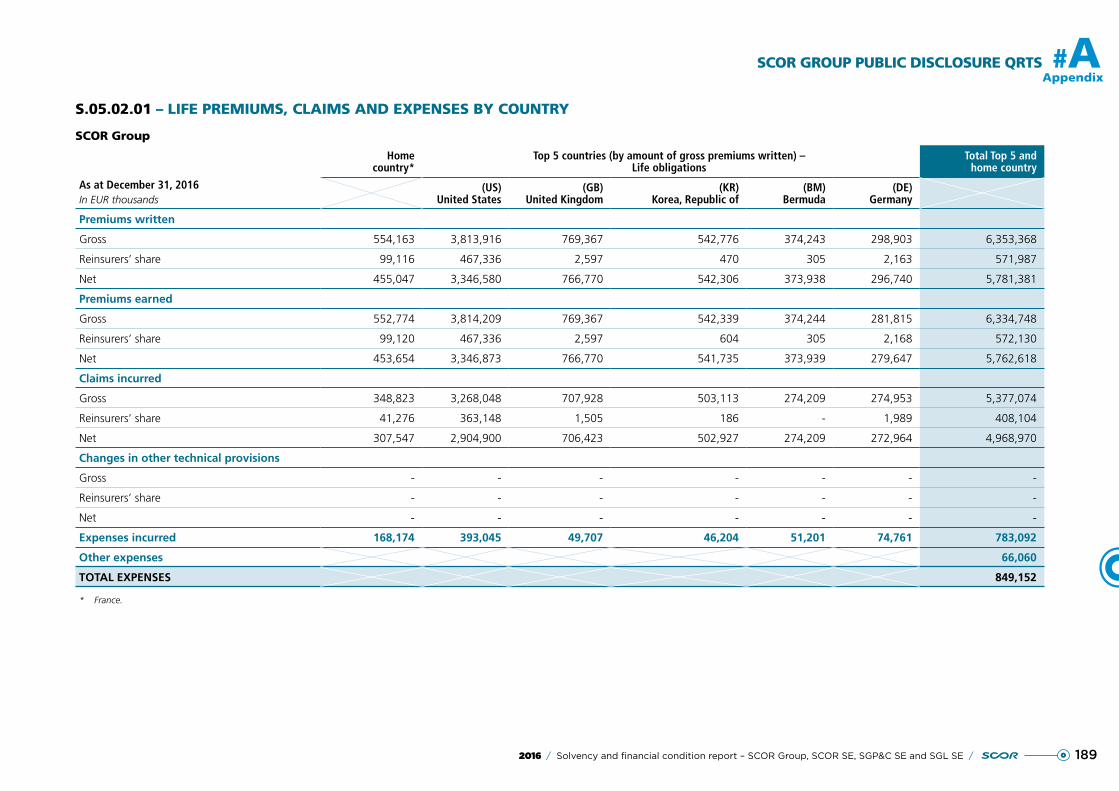
SCOR GROUP PUBLIC DISCLOSURE QRTS
189
#A
2016 / Solvency and financial condition report – SCOR Group, SCOR SE, SGP&C SE and SGL SE /
Appendix
S.05.02.01 – LIFE PREMIUMS, CLAIMS AND EXPENSES BY COUNTRY
SCOR Group
As at December 31, 2016In EUR thousands
Homecountry*
Top 5 countries (by amount of gross premiums written) – Life obligations
Total Top 5 and home country
(US) United States
(GB) United Kingdom
(KR) Korea, Republic of
(BM) Bermuda
(DE) Germany
Premiums written
Gross 554,163 3,813,916 769,367 542,776 374,243 298,903 6,353,368
Reinsurers’ share 99,116 467,336 2,597 470 305 2,163 571,987
Net 455,047 3,346,580 766,770 542,306 373,938 296,740 5,781,381
Premiums earned
Gross 552,774 3,814,209 769,367 542,339 374,244 281,815 6,334,748
Reinsurers’ share 99,120 467,336 2,597 604 305 2,168 572,130
Net 453,654 3,346,873 766,770 541,735 373,939 279,647 5,762,618
Claims incurred
Gross 348,823 3,268,048 707,928 503,113 274,209 274,953 5,377,074
Reinsurers’ share 41,276 363,148 1,505 186 - 1,989 408,104
Net 307,547 2,904,900 706,423 502,927 274,209 272,964 4,968,970
Changes in other technical provisions
Gross - - - - - - -
Reinsurers’ share - - - - - - -
Net - - - - - - -
Expenses incurred 168,174 393,045 49,707 46,204 51,201 74,761 783,092
Other expenses 66,060
TOTAL EXPENSES 849,152
* France.
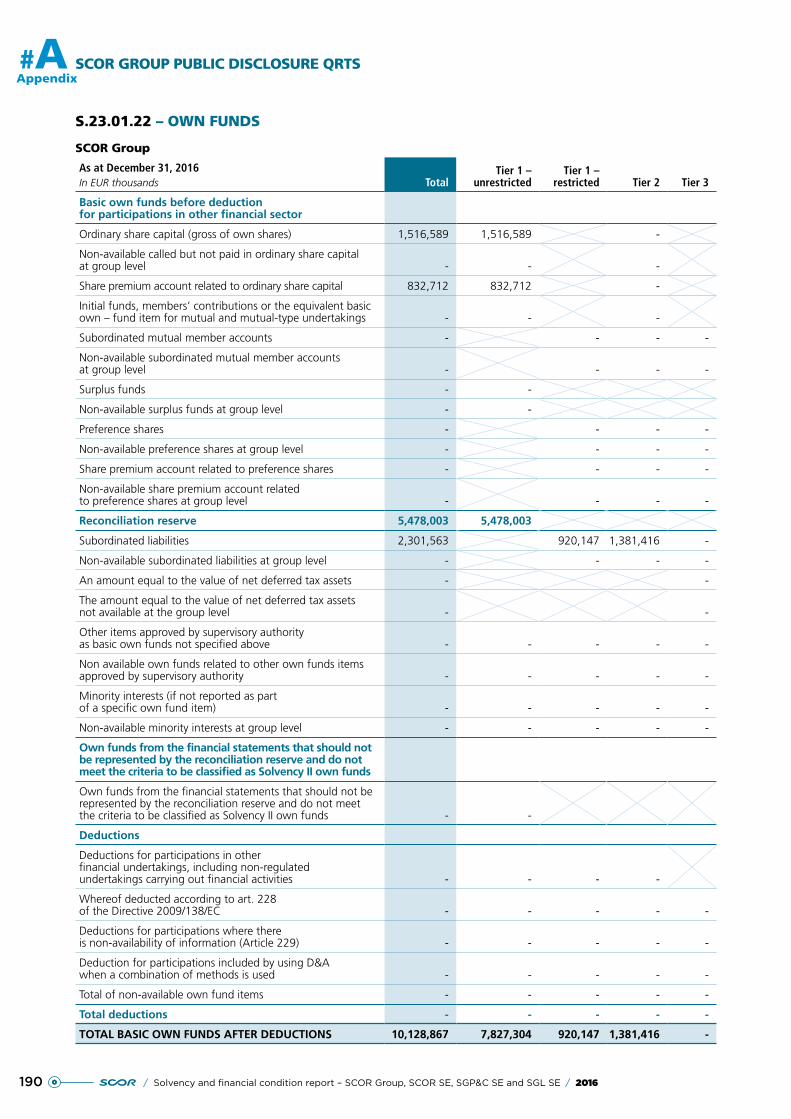
190 / Solvency and financial condition report – SCOR Group, SCOR SE, SGP&C SE and SGL SE / 2016
#A SCOR GROUP PUBLIC DISCLOSURE QRTS
Appendix
S.23.01.22 – OWN FUNDS
SCOR Group
As at December 31, 2016In EUR thousands Total
Tier 1 – unrestricted
Tier 1 – restricted Tier 2 Tier 3
Basic own funds before deduction for participations in other financial sector
Ordinary share capital (gross of own shares) 1,516,589 1,516,589 -
Non-available called but not paid in ordinary share capital at group level - - -
Share premium account related to ordinary share capital 832,712 832,712 -
Initial funds, members’ contributions or the equivalent basic own – fund item for mutual and mutual-type undertakings - - -
Subordinated mutual member accounts - - - -
Non-available subordinated mutual member accounts at group level - - - -
Surplus funds - -
Non-available surplus funds at group level - -
Preference shares - - - -
Non-available preference shares at group level - - - -
Share premium account related to preference shares - - - -
Non-available share premium account related to preference shares at group level - - - -
Reconciliation reserve 5,478,003 5,478,003
Subordinated liabilities 2,301,563 920,147 1,381,416 -
Non-available subordinated liabilities at group level - - - -
An amount equal to the value of net deferred tax assets - -
The amount equal to the value of net deferred tax assets not available at the group level - -
Other items approved by supervisory authority as basic own funds not specified above - - - - -
Non available own funds related to other own funds items approved by supervisory authority - - - - -
Minority interests (if not reported as part of a specific own fund item) - - - - -
Non-available minority interests at group level - - - - -
Own funds from the financial statements that should not be represented by the reconciliation reserve and do not meet the criteria to be classified as Solvency II own funds
Own funds from the financial statements that should not be represented by the reconciliation reserve and do not meet the criteria to be classified as Solvency II own funds - -
Deductions
Deductions for participations in other financial undertakings, including non-regulated undertakings carrying out financial activities - - - -
Whereof deducted according to art. 228 of the Directive 2009/138/EC - - - - -
Deductions for participations where there is non-availability of information (Article 229) - - - - -
Deduction for participations included by using D&A when a combination of methods is used - - - - -
Total of non-available own fund items - - - - -
Total deductions - - - - -
TOTAL BASIC OWN FUNDS AFTER DEDUCTIONS 10,128,867 7,827,304 920,147 1,381,416 -
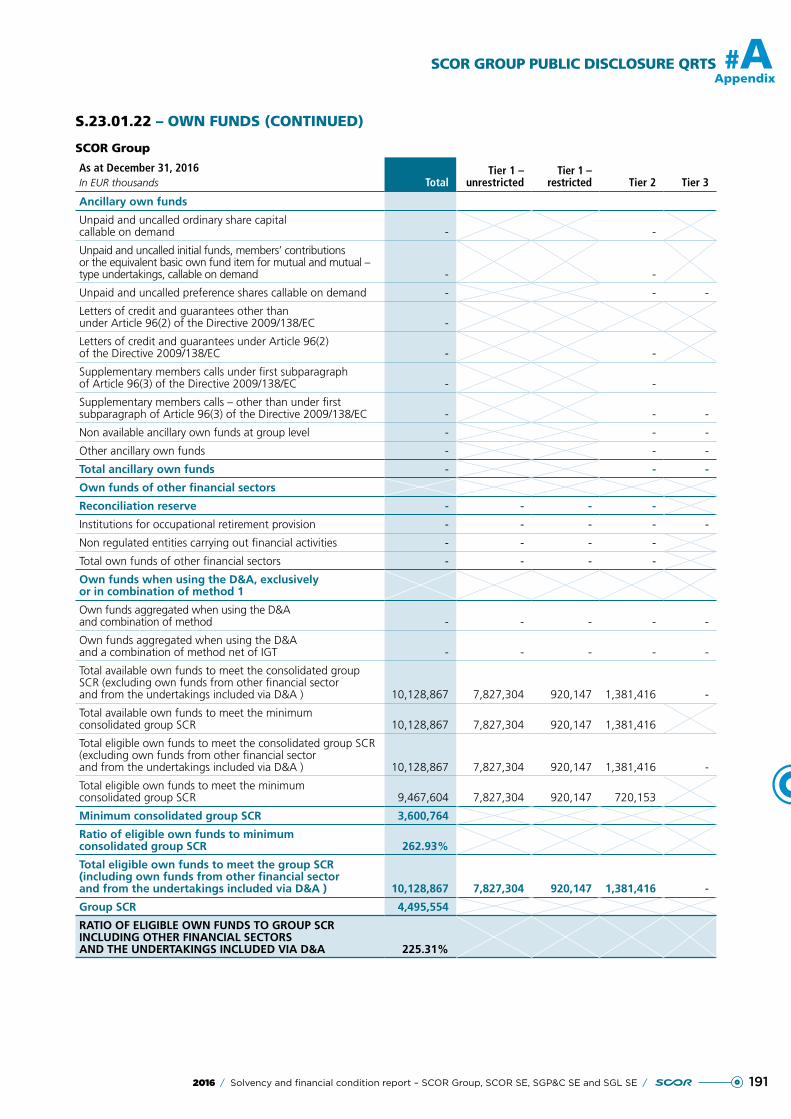
1912016 / Solvency and financial condition report – SCOR Group, SCOR SE, SGP&C SE and SGL SE /
SCOR GROUP PUBLIC DISCLOSURE QRTS #AAppendix
S.23.01.22 – OWN FUNDS (CONTINUED)
SCOR Group
As at December 31, 2016In EUR thousands Total
Tier 1 – unrestricted
Tier 1 – restricted Tier 2 Tier 3
Ancillary own funds
Unpaid and uncalled ordinary share capital callable on demand - -
Unpaid and uncalled initial funds, members’ contributions or the equivalent basic own fund item for mutual and mutual – type undertakings, callable on demand - -
Unpaid and uncalled preference shares callable on demand - - -
Letters of credit and guarantees other than under Article 96(2) of the Directive 2009/138/EC -
Letters of credit and guarantees under Article 96(2) of the Directive 2009/138/EC - -
Supplementary members calls under first subparagraph of Article 96(3) of the Directive 2009/138/EC - -
Supplementary members calls – other than under first subparagraph of Article 96(3) of the Directive 2009/138/EC - - -
Non available ancillary own funds at group level - - -
Other ancillary own funds - - -
Total ancillary own funds - - -
Own funds of other financial sectors
Reconciliation reserve - - - -
Institutions for occupational retirement provision - - - - -
Non regulated entities carrying out financial activities - - - -
Total own funds of other financial sectors - - - -
Own funds when using the D&A, exclusively or in combination of method 1
Own funds aggregated when using the D&A and combination of method - - - - -
Own funds aggregated when using the D&A and a combination of method net of IGT - - - - -
Total available own funds to meet the consolidated group SCR (excluding own funds from other financial sector and from the undertakings included via D&A ) 10,128,867 7,827,304 920,147 1,381,416 -
Total available own funds to meet the minimum consolidated group SCR 10,128,867 7,827,304 920,147 1,381,416
Total eligible own funds to meet the consolidated group SCR (excluding own funds from other financial sector and from the undertakings included via D&A ) 10,128,867 7,827,304 920,147 1,381,416 -
Total eligible own funds to meet the minimum consolidated group SCR 9,467,604 7,827,304 920,147 720,153
Minimum consolidated group SCR 3,600,764
Ratio of eligible own funds to minimum consolidated group SCR 262.93%
Total eligible own funds to meet the group SCR (including own funds from other financial sector and from the undertakings included via D&A ) 10,128,867 7,827,304 920,147 1,381,416 -
Group SCR 4,495,554
RATIO OF ELIGIBLE OWN FUNDS TO GROUP SCR INCLUDING OTHER FINANCIAL SECTORS AND THE UNDERTAKINGS INCLUDED VIA D&A 225.31%
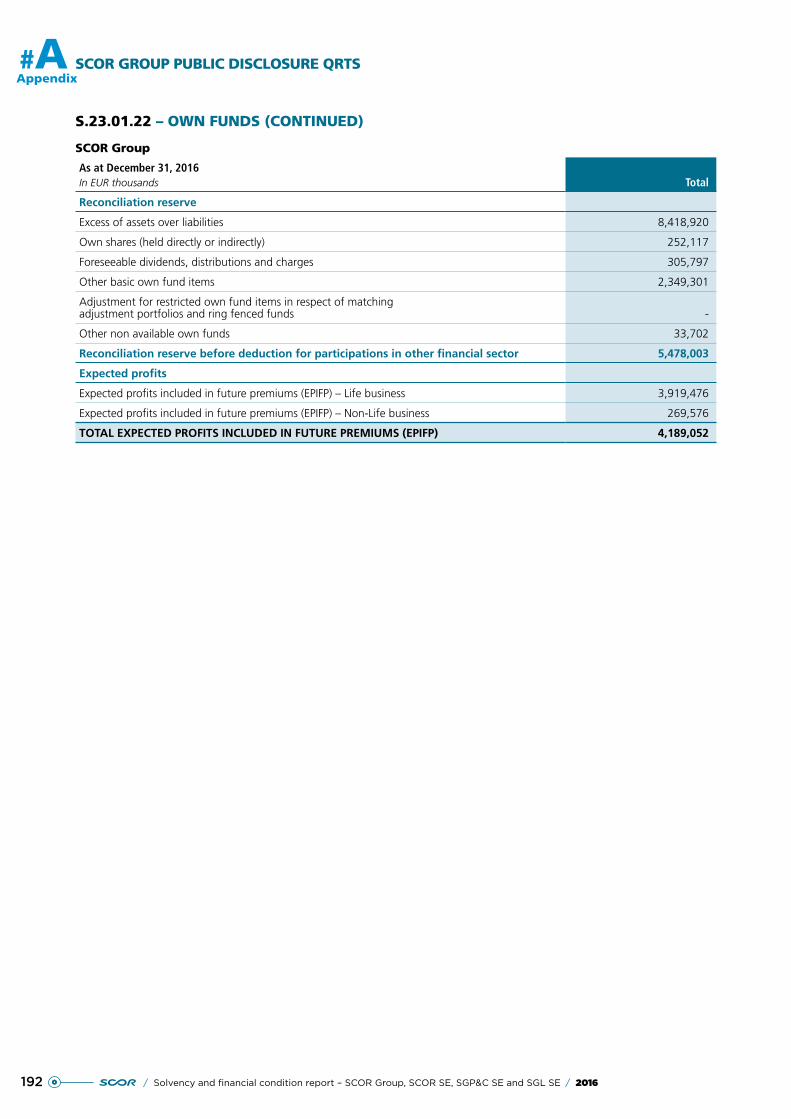
192 / Solvency and financial condition report – SCOR Group, SCOR SE, SGP&C SE and SGL SE / 2016
#A SCOR GROUP PUBLIC DISCLOSURE QRTS
Appendix
S.23.01.22 – OWN FUNDS (CONTINUED)
SCOR Group
As at December 31, 2016In EUR thousands Total
Reconciliation reserve
Excess of assets over liabilities 8,418,920
Own shares (held directly or indirectly) 252,117
Foreseeable dividends, distributions and charges 305,797
Other basic own fund items 2,349,301
Adjustment for restricted own fund items in respect of matching adjustment portfolios and ring fenced funds -
Other non available own funds 33,702
Reconciliation reserve before deduction for participations in other financial sector 5,478,003
Expected profits
Expected profits included in future premiums (EPIFP) – Life business 3,919,476
Expected profits included in future premiums (EPIFP) – Non-Life business 269,576
TOTAL EXPECTED PROFITS INCLUDED IN FUTURE PREMIUMS (EPIFP) 4,189,052
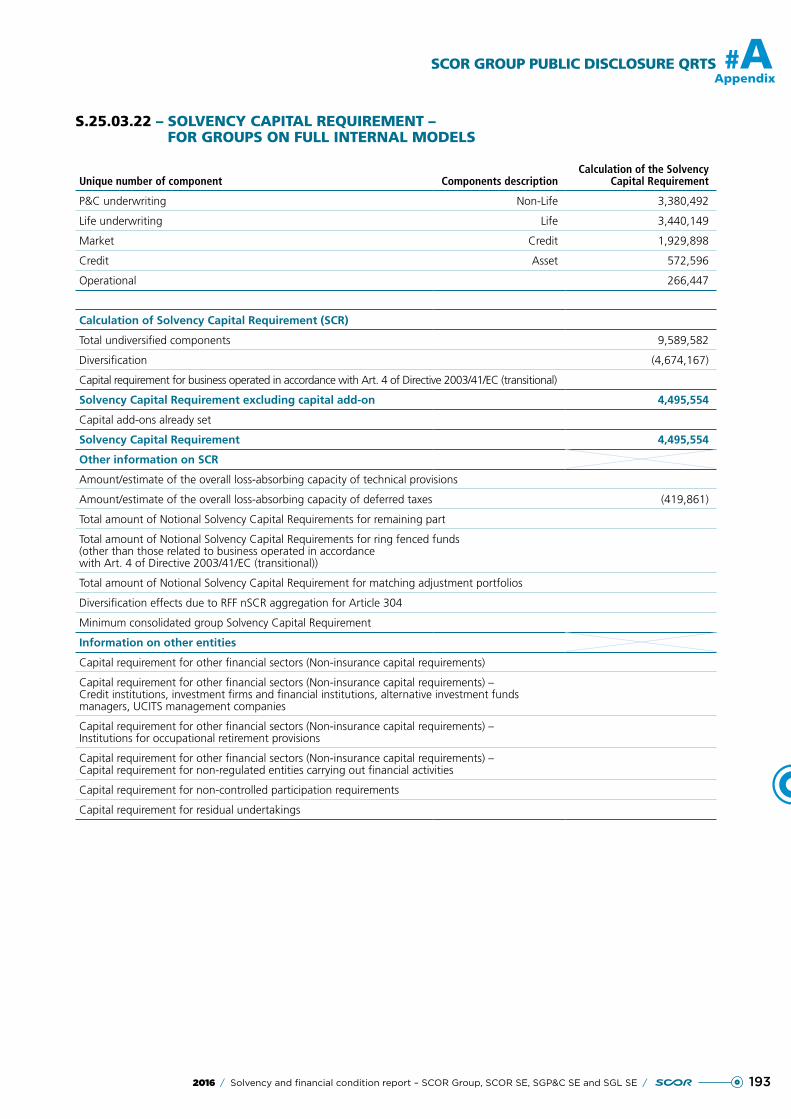
1932016 / Solvency and financial condition report – SCOR Group, SCOR SE, SGP&C SE and SGL SE /
SCOR GROUP PUBLIC DISCLOSURE QRTS #AAppendix
S.25.03.22 – SOLVENCY CAPITAL REQUIREMENT – FOR GROUPS ON FULL INTERNAL MODELS
Unique number of component Components descriptionCalculation of the Solvency
Capital Requirement
P&C underwriting Non-Life 3,380,492
Life underwriting Life 3,440,149
Market Credit 1,929,898
Credit Asset 572,596
Operational 266,447
Calculation of Solvency Capital Requirement (SCR)
Total undiversified components 9,589,582
Diversification (4,674,167)
Capital requirement for business operated in accordance with Art. 4 of Directive 2003/41/EC (transitional)
Solvency Capital Requirement excluding capital add-on 4,495,554
Capital add-ons already set
Solvency Capital Requirement 4,495,554
Other information on SCR
Amount/estimate of the overall loss-absorbing capacity of technical provisions
Amount/estimate of the overall loss-absorbing capacity of deferred taxes (419,861)
Total amount of Notional Solvency Capital Requirements for remaining part
Total amount of Notional Solvency Capital Requirements for ring fenced funds (other than those related to business operated in accordance with Art. 4 of Directive 2003/41/EC (transitional))
Total amount of Notional Solvency Capital Requirement for matching adjustment portfolios
Diversification effects due to RFF nSCR aggregation for Article 304
Minimum consolidated group Solvency Capital Requirement
Information on other entities
Capital requirement for other financial sectors (Non-insurance capital requirements)
Capital requirement for other financial sectors (Non-insurance capital requirements) – Credit institutions, investment firms and financial institutions, alternative investment funds managers, UCITS management companies
Capital requirement for other financial sectors (Non-insurance capital requirements) – Institutions for occupational retirement provisions
Capital requirement for other financial sectors (Non-insurance capital requirements) – Capital requirement for non-regulated entities carrying out financial activities
Capital requirement for non-controlled participation requirements
Capital requirement for residual undertakings
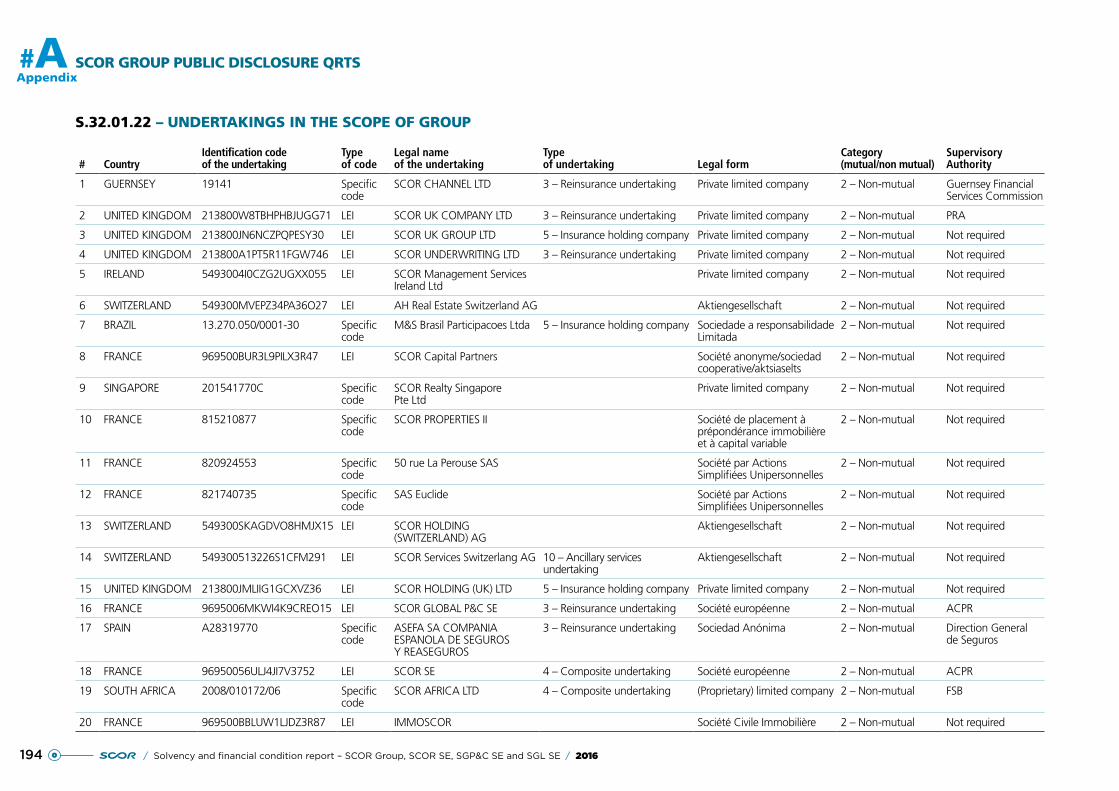
SCOR GROUP PUBLIC DISCLOSURE QRTS
194
#A
/ Solvency and financial condition report – SCOR Group, SCOR SE, SGP&C SE and SGL SE / 2016
Appendix
S.32.01.22 – UNDERTAKINGS IN THE SCOPE OF GROUP
# CountryIdentification code of the undertaking
Type of code
Legal name of the undertaking
Type of undertaking Legal form
Category (mutual/non mutual)
Supervisory Authority
1 GUERNSEY 19141 Specific code
SCOR CHANNEL LTD 3 – Reinsurance undertaking Private limited company 2 – Non-mutual Guernsey Financial Services Commission
2 UNITED KINGDOM 213800W8TBHPHBJUGG71 LEI SCOR UK COMPANY LTD 3 – Reinsurance undertaking Private limited company 2 – Non-mutual PRA
3 UNITED KINGDOM 213800JN6NCZPQPESY30 LEI SCOR UK GROUP LTD 5 – Insurance holding company Private limited company 2 – Non-mutual Not required
4 UNITED KINGDOM 213800A1PT5R11FGW746 LEI SCOR UNDERWRITING LTD 3 – Reinsurance undertaking Private limited company 2 – Non-mutual Not required
5 IRELAND 5493004I0CZG2UGXX055 LEI SCOR Management Services Ireland Ltd
Private limited company 2 – Non-mutual Not required
6 SWITZERLAND 549300MVEPZ34PA36O27 LEI AH Real Estate Switzerland AG Aktiengesellschaft 2 – Non-mutual Not required
7 BRAZIL 13.270.050/0001-30 Specific code
M&S Brasil Participacoes Ltda 5 – Insurance holding company Sociedade a responsabilidade Limitada
2 – Non-mutual Not required
8 FRANCE 969500BUR3L9PILX3R47 LEI SCOR Capital Partners Société anonyme/sociedad cooperative/aktsiaselts
2 – Non-mutual Not required
9 SINGAPORE 201541770C Specific code
SCOR Realty Singapore Pte Ltd
Private limited company 2 – Non-mutual Not required
10 FRANCE 815210877 Specific code
SCOR PROPERTIES II Société de placement à prépondérance immobilière et à capital variable
2 – Non-mutual Not required
11 FRANCE 820924553 Specific code
50 rue La Perouse SAS Société par Actions Simplifiées Unipersonnelles
2 – Non-mutual Not required
12 FRANCE 821740735 Specific code
SAS Euclide Société par Actions Simplifiées Unipersonnelles
2 – Non-mutual Not required
13 SWITZERLAND 549300SKAGDVO8HMJX15 LEI SCOR HOLDING (SWITZERLAND) AG
Aktiengesellschaft 2 – Non-mutual Not required
14 SWITZERLAND 549300513226S1CFM291 LEI SCOR Services Switzerlang AG 10 – Ancillary services undertaking
Aktiengesellschaft 2 – Non-mutual Not required
15 UNITED KINGDOM 213800JMLIIG1GCXVZ36 LEI SCOR HOLDING (UK) LTD 5 – Insurance holding company Private limited company 2 – Non-mutual Not required
16 FRANCE 9695006MKWI4K9CREO15 LEI SCOR GLOBAL P&C SE 3 – Reinsurance undertaking Société européenne 2 – Non-mutual ACPR
17 SPAIN A28319770 Specific code
ASEFA SA COMPANIA ESPANOLA DE SEGUROS Y REASEGUROS
3 – Reinsurance undertaking Sociedad Anónima 2 – Non-mutual Direction General de Seguros
18 FRANCE 96950056ULJ4JI7V3752 LEI SCOR SE 4 – Composite undertaking Société européenne 2 – Non-mutual ACPR
19 SOUTH AFRICA 2008/010172/06 Specific code
SCOR AFRICA LTD 4 – Composite undertaking (Proprietary) limited company 2 – Non-mutual FSB
20 FRANCE 969500BBLUW1LJDZ3R87 LEI IMMOSCOR Société Civile Immobilière 2 – Non-mutual Not required
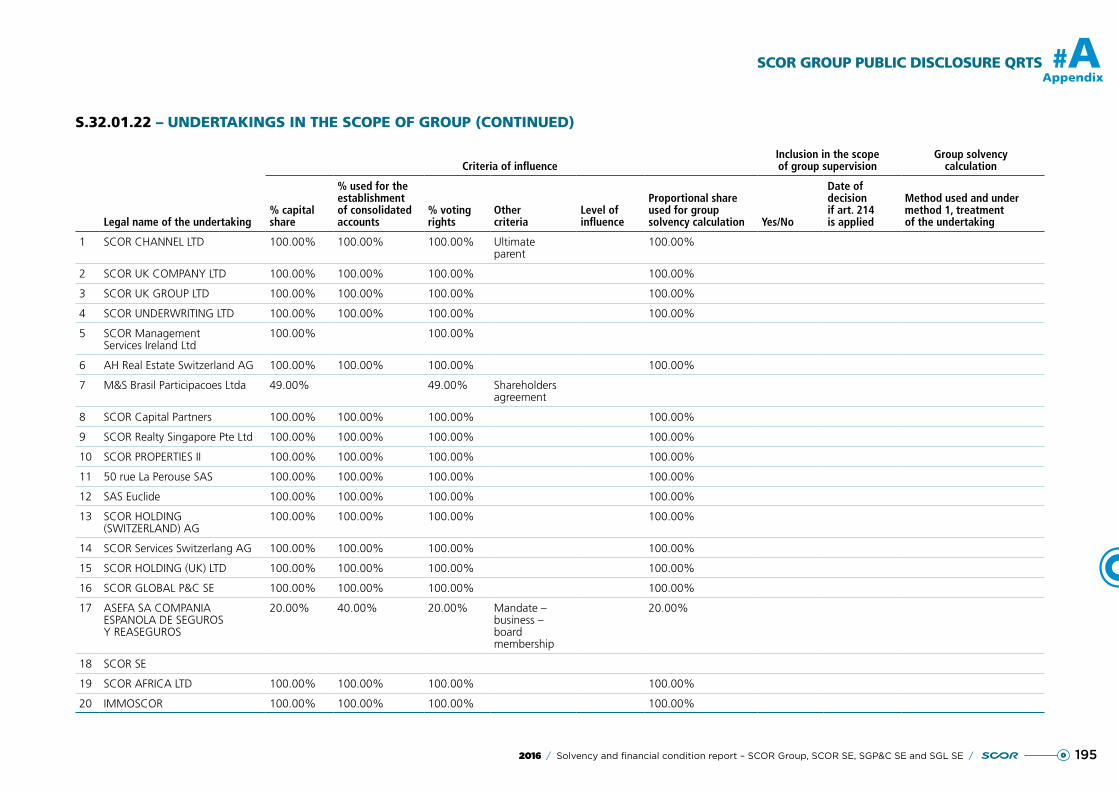
SCOR GROUP PUBLIC DISCLOSURE QRTS
195
#A
2016 / Solvency and financial condition report – SCOR Group, SCOR SE, SGP&C SE and SGL SE /
Appendix
S.32.01.22 – UNDERTAKINGS IN THE SCOPE OF GROUP (CONTINUED)
Criteria of influenceInclusion in the scope of group supervision
Group solvency calculation
Legal name of the undertaking% capital share
% used for the establishment of consolidated accounts
% voting rights
Other criteria
Level of influence
Proportional share used for group solvency calculation Yes/No
Date of decision if art. 214 is applied
Method used and under method 1, treatment of the undertaking
1 SCOR CHANNEL LTD 100.00% 100.00% 100.00% Ultimate parent
100.00%
2 SCOR UK COMPANY LTD 100.00% 100.00% 100.00% 100.00%
3 SCOR UK GROUP LTD 100.00% 100.00% 100.00% 100.00%
4 SCOR UNDERWRITING LTD 100.00% 100.00% 100.00% 100.00%
5 SCOR Management Services Ireland Ltd
100.00% 100.00%
6 AH Real Estate Switzerland AG 100.00% 100.00% 100.00% 100.00%
7 M&S Brasil Participacoes Ltda 49.00% 49.00% Shareholders agreement
8 SCOR Capital Partners 100.00% 100.00% 100.00% 100.00%
9 SCOR Realty Singapore Pte Ltd 100.00% 100.00% 100.00% 100.00%
10 SCOR PROPERTIES II 100.00% 100.00% 100.00% 100.00%
11 50 rue La Perouse SAS 100.00% 100.00% 100.00% 100.00%
12 SAS Euclide 100.00% 100.00% 100.00% 100.00%
13 SCOR HOLDING (SWITZERLAND) AG
100.00% 100.00% 100.00% 100.00%
14 SCOR Services Switzerlang AG 100.00% 100.00% 100.00% 100.00%
15 SCOR HOLDING (UK) LTD 100.00% 100.00% 100.00% 100.00%
16 SCOR GLOBAL P&C SE 100.00% 100.00% 100.00% 100.00%
17 ASEFA SA COMPANIA ESPANOLA DE SEGUROS Y REASEGUROS
20.00% 40.00% 20.00% Mandate – business – board membership
20.00%
18 SCOR SE
19 SCOR AFRICA LTD 100.00% 100.00% 100.00% 100.00%
20 IMMOSCOR 100.00% 100.00% 100.00% 100.00%
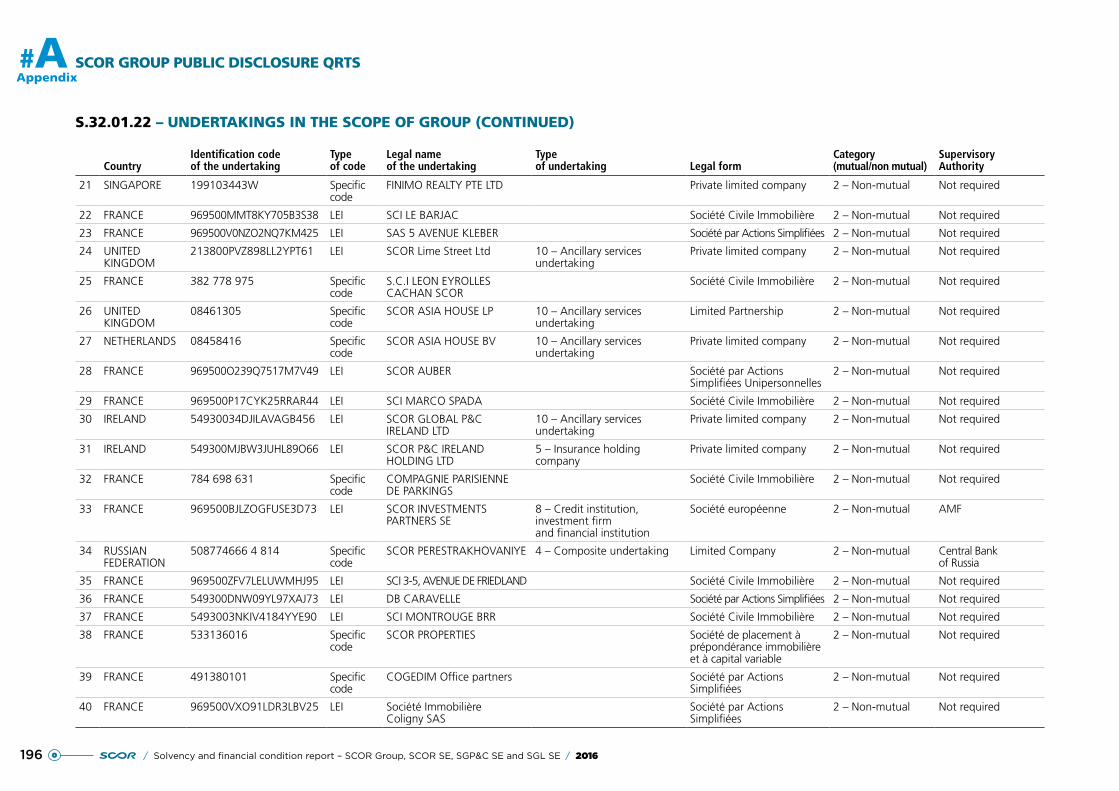
SCOR GROUP PUBLIC DISCLOSURE QRTS
196
#A
/ Solvency and financial condition report – SCOR Group, SCOR SE, SGP&C SE and SGL SE / 2016
Appendix
S.32.01.22 – UNDERTAKINGS IN THE SCOPE OF GROUP (CONTINUED)
CountryIdentification code of the undertaking
Type of code
Legal name of the undertaking
Type of undertaking Legal form
Category (mutual/non mutual)
Supervisory Authority
21 SINGAPORE 199103443W Specific code
FINIMO REALTY PTE LTD Private limited company 2 – Non-mutual Not required
22 FRANCE 969500MMT8KY705B3S38 LEI SCI LE BARJAC Société Civile Immobilière 2 – Non-mutual Not required
23 FRANCE 969500V0NZO2NQ7KM425 LEI SAS 5 AVENUE KLEBER Société par Actions Simplifiées 2 – Non-mutual Not required
24 UNITED KINGDOM
213800PVZ898LL2YPT61 LEI SCOR Lime Street Ltd 10 – Ancillary services undertaking
Private limited company 2 – Non-mutual Not required
25 FRANCE 382 778 975 Specific code
S.C.I LEON EYROLLES CACHAN SCOR
Société Civile Immobilière 2 – Non-mutual Not required
26 UNITED KINGDOM
08461305 Specific code
SCOR ASIA HOUSE LP 10 – Ancillary services undertaking
Limited Partnership 2 – Non-mutual Not required
27 NETHERLANDS 08458416 Specific code
SCOR ASIA HOUSE BV 10 – Ancillary services undertaking
Private limited company 2 – Non-mutual Not required
28 FRANCE 969500O239Q7517M7V49 LEI SCOR AUBER Société par Actions Simplifiées Unipersonnelles
2 – Non-mutual Not required
29 FRANCE 969500P17CYK25RRAR44 LEI SCI MARCO SPADA Société Civile Immobilière 2 – Non-mutual Not required
30 IRELAND 54930034DJILAVAGB456 LEI SCOR GLOBAL P&C IRELAND LTD
10 – Ancillary services undertaking
Private limited company 2 – Non-mutual Not required
31 IRELAND 549300MJBW3JUHL89O66 LEI SCOR P&C IRELAND HOLDING LTD
5 – Insurance holding company
Private limited company 2 – Non-mutual Not required
32 FRANCE 784 698 631 Specific code
COMPAGNIE PARISIENNE DE PARKINGS
Société Civile Immobilière 2 – Non-mutual Not required
33 FRANCE 969500BJLZOGFUSE3D73 LEI SCOR INVESTMENTS PARTNERS SE
8 – Credit institution, investment firm and financial institution
Société européenne 2 – Non-mutual AMF
34 RUSSIAN FEDERATION
508774666 4 814 Specific code
SCOR PERESTRAKHOVANIYE 4 – Composite undertaking Limited Company 2 – Non-mutual Central Bank of Russia
35 FRANCE 969500ZFV7LELUWMHJ95 LEI SCI 3-5, AVENUE DE FRIEDLAND Société Civile Immobilière 2 – Non-mutual Not required
36 FRANCE 549300DNW09YL97XAJ73 LEI DB CARAVELLE Société par Actions Simplifiées 2 – Non-mutual Not required
37 FRANCE 5493003NKIV4184YYE90 LEI SCI MONTROUGE BRR Société Civile Immobilière 2 – Non-mutual Not required
38 FRANCE 533136016 Specific code
SCOR PROPERTIES Société de placement à prépondérance immobilière et à capital variable
2 – Non-mutual Not required
39 FRANCE 491380101 Specific code
COGEDIM Office partners Société par Actions Simplifiées
2 – Non-mutual Not required
40 FRANCE 969500VXO91LDR3LBV25 LEI Société Immobilière Coligny SAS
Société par Actions Simplifiées
2 – Non-mutual Not required
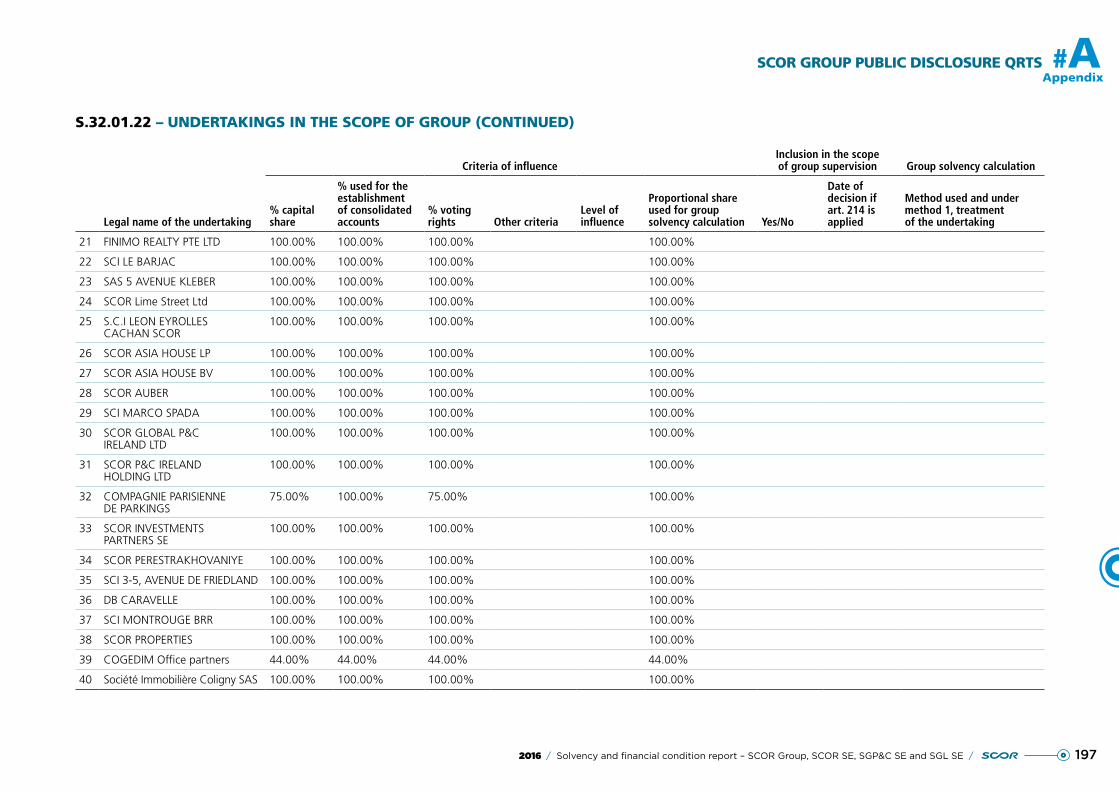
SCOR GROUP PUBLIC DISCLOSURE QRTS
197
#A
2016 / Solvency and financial condition report – SCOR Group, SCOR SE, SGP&C SE and SGL SE /
Appendix
S.32.01.22 – UNDERTAKINGS IN THE SCOPE OF GROUP (CONTINUED)
Criteria of influenceInclusion in the scope of group supervision Group solvency calculation
Legal name of the undertaking% capital share
% used for the establishment of consolidated accounts
% voting rights Other criteria
Level of influence
Proportional share used for group solvency calculation Yes/No
Date of decision if art. 214 is applied
Method used and under method 1, treatment of the undertaking
21 FINIMO REALTY PTE LTD 100.00% 100.00% 100.00% 100.00%
22 SCI LE BARJAC 100.00% 100.00% 100.00% 100.00%
23 SAS 5 AVENUE KLEBER 100.00% 100.00% 100.00% 100.00%
24 SCOR Lime Street Ltd 100.00% 100.00% 100.00% 100.00%
25 S.C.I LEON EYROLLES CACHAN SCOR
100.00% 100.00% 100.00% 100.00%
26 SCOR ASIA HOUSE LP 100.00% 100.00% 100.00% 100.00%
27 SCOR ASIA HOUSE BV 100.00% 100.00% 100.00% 100.00%
28 SCOR AUBER 100.00% 100.00% 100.00% 100.00%
29 SCI MARCO SPADA 100.00% 100.00% 100.00% 100.00%
30 SCOR GLOBAL P&C IRELAND LTD
100.00% 100.00% 100.00% 100.00%
31 SCOR P&C IRELAND HOLDING LTD
100.00% 100.00% 100.00% 100.00%
32 COMPAGNIE PARISIENNE DE PARKINGS
75.00% 100.00% 75.00% 100.00%
33 SCOR INVESTMENTS PARTNERS SE
100.00% 100.00% 100.00% 100.00%
34 SCOR PERESTRAKHOVANIYE 100.00% 100.00% 100.00% 100.00%
35 SCI 3-5, AVENUE DE FRIEDLAND 100.00% 100.00% 100.00% 100.00%
36 DB CARAVELLE 100.00% 100.00% 100.00% 100.00%
37 SCI MONTROUGE BRR 100.00% 100.00% 100.00% 100.00%
38 SCOR PROPERTIES 100.00% 100.00% 100.00% 100.00%
39 COGEDIM Office partners 44.00% 44.00% 44.00% 44.00%
40 Société Immobilière Coligny SAS 100.00% 100.00% 100.00% 100.00%
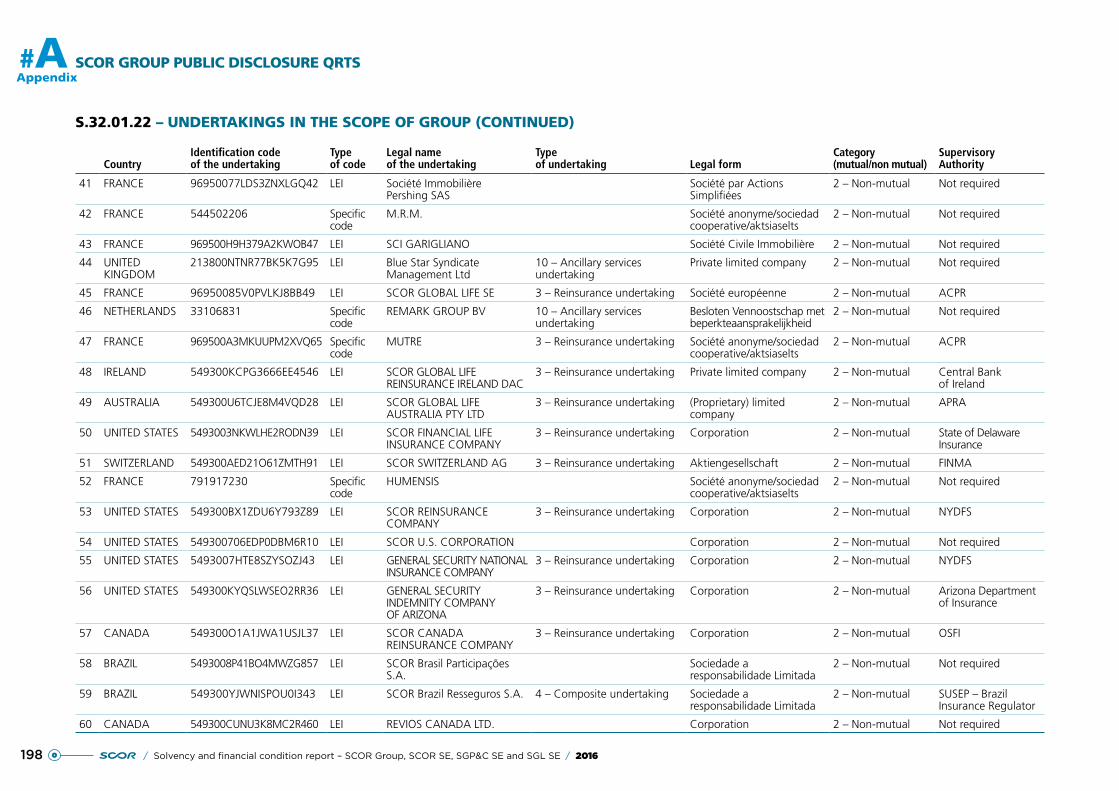
SCOR GROUP PUBLIC DISCLOSURE QRTS
198
#A
/ Solvency and financial condition report – SCOR Group, SCOR SE, SGP&C SE and SGL SE / 2016
Appendix
S.32.01.22 – UNDERTAKINGS IN THE SCOPE OF GROUP (CONTINUED)
CountryIdentification code of the undertaking
Type of code
Legal name of the undertaking
Type of undertaking Legal form
Category (mutual/non mutual)
Supervisory Authority
41 FRANCE 96950077LDS3ZNXLGQ42 LEI Société Immobilière Pershing SAS
Société par Actions Simplifiées
2 – Non-mutual Not required
42 FRANCE 544502206 Specific code
M.R.M. Société anonyme/sociedad cooperative/aktsiaselts
2 – Non-mutual Not required
43 FRANCE 969500H9H379A2KWOB47 LEI SCI GARIGLIANO Société Civile Immobilière 2 – Non-mutual Not required
44 UNITED KINGDOM
213800NTNR77BK5K7G95 LEI Blue Star Syndicate Management Ltd
10 – Ancillary services undertaking
Private limited company 2 – Non-mutual Not required
45 FRANCE 96950085V0PVLKJ8BB49 LEI SCOR GLOBAL LIFE SE 3 – Reinsurance undertaking Société européenne 2 – Non-mutual ACPR
46 NETHERLANDS 33106831 Specific code
REMARK GROUP BV 10 – Ancillary services undertaking
Besloten Vennoostschap met beperkteaansprakelijkheid
2 – Non-mutual Not required
47 FRANCE 969500A3MKUUPM2XVQ65 Specific code
MUTRE 3 – Reinsurance undertaking Société anonyme/sociedad cooperative/aktsiaselts
2 – Non-mutual ACPR
48 IRELAND 549300KCPG3666EE4546 LEI SCOR GLOBAL LIFE REINSURANCE IRELAND DAC
3 – Reinsurance undertaking Private limited company 2 – Non-mutual Central Bank of Ireland
49 AUSTRALIA 549300U6TCJE8M4VQD28 LEI SCOR GLOBAL LIFE AUSTRALIA PTY LTD
3 – Reinsurance undertaking (Proprietary) limited company
2 – Non-mutual APRA
50 UNITED STATES 5493003NKWLHE2RODN39 LEI SCOR FINANCIAL LIFE INSURANCE COMPANY
3 – Reinsurance undertaking Corporation 2 – Non-mutual State of Delaware Insurance
51 SWITZERLAND 549300AED21O61ZMTH91 LEI SCOR SWITZERLAND AG 3 – Reinsurance undertaking Aktiengesellschaft 2 – Non-mutual FINMA
52 FRANCE 791917230 Specific code
HUMENSIS Société anonyme/sociedad cooperative/aktsiaselts
2 – Non-mutual Not required
53 UNITED STATES 549300BX1ZDU6Y793Z89 LEI SCOR REINSURANCE COMPANY
3 – Reinsurance undertaking Corporation 2 – Non-mutual NYDFS
54 UNITED STATES 549300706EDP0DBM6R10 LEI SCOR U.S. CORPORATION Corporation 2 – Non-mutual Not required
55 UNITED STATES 5493007HTE8SZYSOZJ43 LEI GENERAL SECURITY NATIONAL INSURANCE COMPANY
3 – Reinsurance undertaking Corporation 2 – Non-mutual NYDFS
56 UNITED STATES 549300KYQSLWSEO2RR36 LEI GENERAL SECURITY INDEMNITY COMPANY OF ARIZONA
3 – Reinsurance undertaking Corporation 2 – Non-mutual Arizona Department of Insurance
57 CANADA 549300O1A1JWA1USJL37 LEI SCOR CANADA REINSURANCE COMPANY
3 – Reinsurance undertaking Corporation 2 – Non-mutual OSFI
58 BRAZIL 5493008P41BO4MWZG857 LEI SCOR Brasil Participações S.A.
Sociedade a responsabilidade Limitada
2 – Non-mutual Not required
59 BRAZIL 549300YJWNISPOU0I343 LEI SCOR Brazil Resseguros S.A. 4 – Composite undertaking Sociedade a responsabilidade Limitada
2 – Non-mutual SUSEP – Brazil Insurance Regulator
60 CANADA 549300CUNU3K8MC2R460 LEI REVIOS CANADA LTD. Corporation 2 – Non-mutual Not required
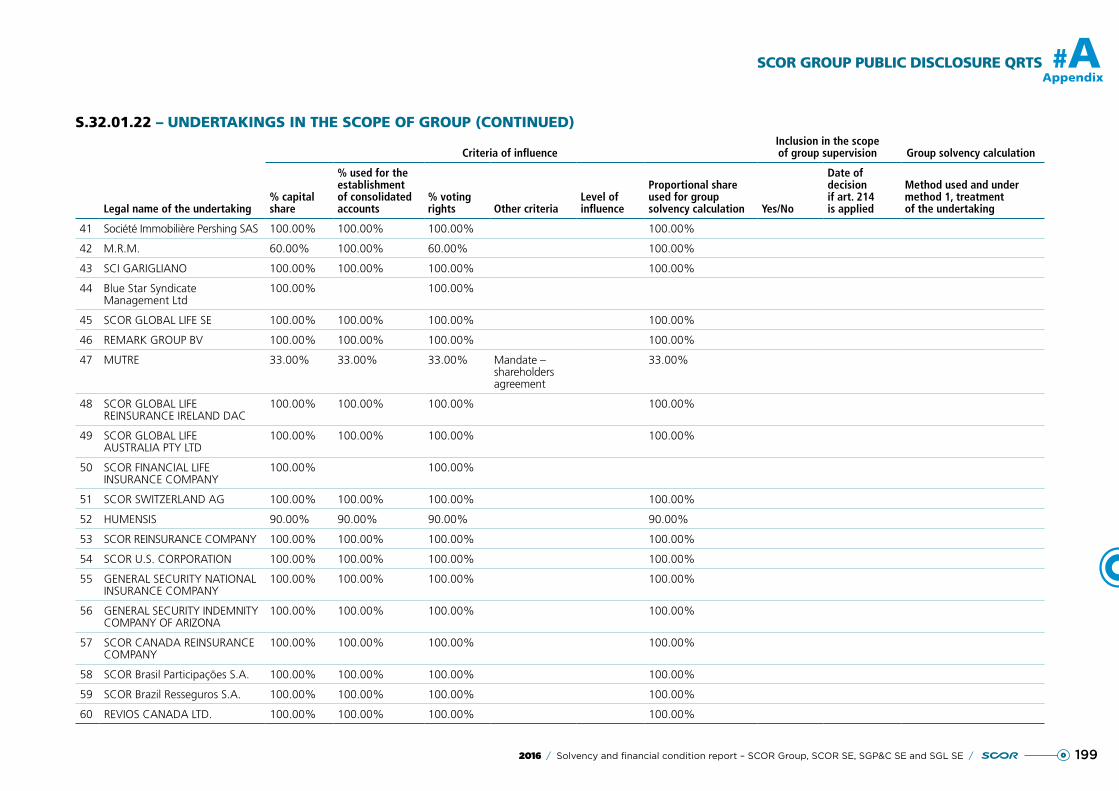
SCOR GROUP PUBLIC DISCLOSURE QRTS
199
#A
2016 / Solvency and financial condition report – SCOR Group, SCOR SE, SGP&C SE and SGL SE /
Appendix
S.32.01.22 – UNDERTAKINGS IN THE SCOPE OF GROUP (CONTINUED)
Criteria of influenceInclusion in the scope of group supervision Group solvency calculation
Legal name of the undertaking% capital share
% used for the establishment of consolidated accounts
% voting rights Other criteria
Level of influence
Proportional share used for group solvency calculation Yes/No
Date of decision if art. 214 is applied
Method used and under method 1, treatment of the undertaking
41 Société Immobilière Pershing SAS 100.00% 100.00% 100.00% 100.00%
42 M.R.M. 60.00% 100.00% 60.00% 100.00%
43 SCI GARIGLIANO 100.00% 100.00% 100.00% 100.00%
44 Blue Star Syndicate Management Ltd
100.00% 100.00%
45 SCOR GLOBAL LIFE SE 100.00% 100.00% 100.00% 100.00%
46 REMARK GROUP BV 100.00% 100.00% 100.00% 100.00%
47 MUTRE 33.00% 33.00% 33.00% Mandate – shareholders agreement
33.00%
48 SCOR GLOBAL LIFE REINSURANCE IRELAND DAC
100.00% 100.00% 100.00% 100.00%
49 SCOR GLOBAL LIFE AUSTRALIA PTY LTD
100.00% 100.00% 100.00% 100.00%
50 SCOR FINANCIAL LIFE INSURANCE COMPANY
100.00% 100.00%
51 SCOR SWITZERLAND AG 100.00% 100.00% 100.00% 100.00%
52 HUMENSIS 90.00% 90.00% 90.00% 90.00%
53 SCOR REINSURANCE COMPANY 100.00% 100.00% 100.00% 100.00%
54 SCOR U.S. CORPORATION 100.00% 100.00% 100.00% 100.00%
55 GENERAL SECURITY NATIONAL INSURANCE COMPANY
100.00% 100.00% 100.00% 100.00%
56 GENERAL SECURITY INDEMNITY COMPANY OF ARIZONA
100.00% 100.00% 100.00% 100.00%
57 SCOR CANADA REINSURANCE COMPANY
100.00% 100.00% 100.00% 100.00%
58 SCOR Brasil Participações S.A. 100.00% 100.00% 100.00% 100.00%
59 SCOR Brazil Resseguros S.A. 100.00% 100.00% 100.00% 100.00%
60 REVIOS CANADA LTD. 100.00% 100.00% 100.00% 100.00%
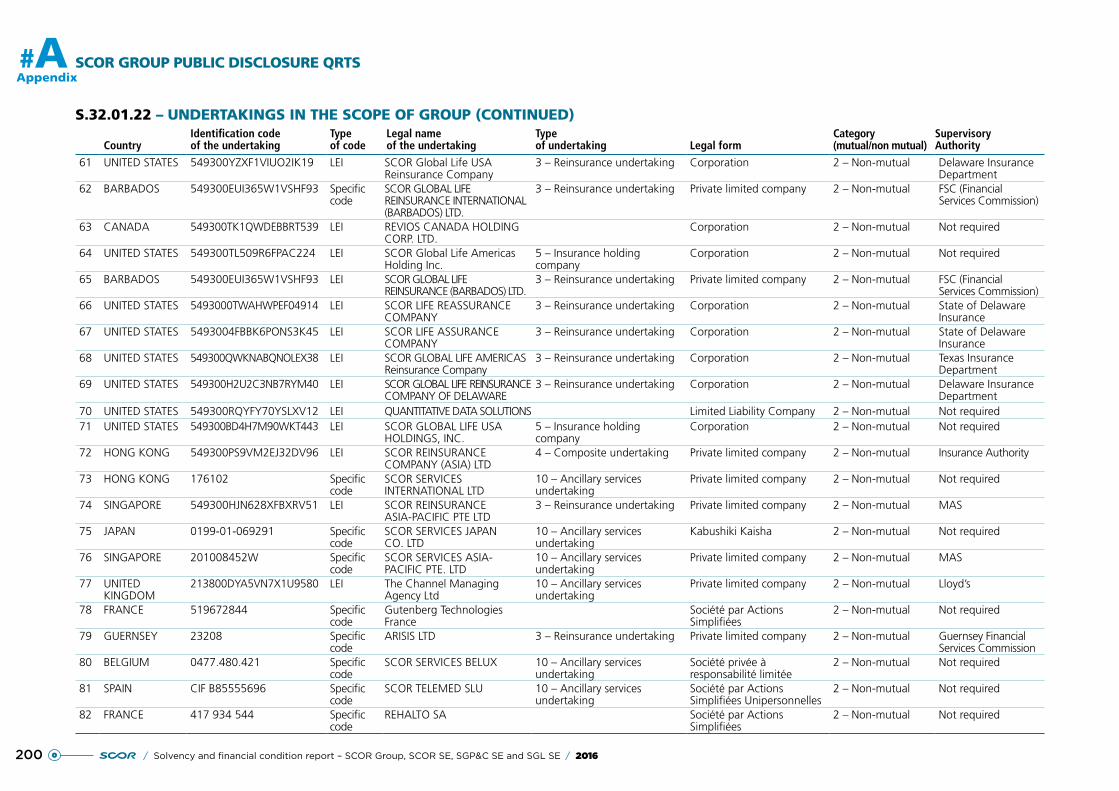
SCOR GROUP PUBLIC DISCLOSURE QRTS
200
#A
/ Solvency and financial condition report – SCOR Group, SCOR SE, SGP&C SE and SGL SE / 2016
Appendix
S.32.01.22 – UNDERTAKINGS IN THE SCOPE OF GROUP (CONTINUED)
CountryIdentification code of the undertaking
Type of code
Legal name of the undertaking
Type of undertaking Legal form
Category (mutual/non mutual)
Supervisory Authority
61 UNITED STATES 549300YZXF1VIUO2IK19 LEI SCOR Global Life USA Reinsurance Company
3 – Reinsurance undertaking Corporation 2 – Non-mutual Delaware Insurance Department
62 BARBADOS 549300EUI365W1VSHF93 Specific code
SCOR GLOBAL LIFE REINSURANCE INTERNATIONAL (BARBADOS) LTD.
3 – Reinsurance undertaking Private limited company 2 – Non-mutual FSC (Financial Services Commission)
63 CANADA 549300TK1QWDEBBRT539 LEI REVIOS CANADA HOLDING CORP. LTD.
Corporation 2 – Non-mutual Not required
64 UNITED STATES 549300TL509R6FPAC224 LEI SCOR Global Life Americas Holding Inc.
5 – Insurance holding company
Corporation 2 – Non-mutual Not required
65 BARBADOS 549300EUI365W1VSHF93 LEI SCOR GLOBAL LIFE REINSURANCE (BARBADOS) LTD.
3 – Reinsurance undertaking Private limited company 2 – Non-mutual FSC (Financial Services Commission)
66 UNITED STATES 5493000TWAHWPEF04914 LEI SCOR LIFE REASSURANCE COMPANY
3 – Reinsurance undertaking Corporation 2 – Non-mutual State of Delaware Insurance
67 UNITED STATES 5493004FBBK6PONS3K45 LEI SCOR LIFE ASSURANCE COMPANY
3 – Reinsurance undertaking Corporation 2 – Non-mutual State of Delaware Insurance
68 UNITED STATES 549300QWKNABQNOLEX38 LEI SCOR GLOBAL LIFE AMERICAS Reinsurance Company
3 – Reinsurance undertaking Corporation 2 – Non-mutual Texas Insurance Department
69 UNITED STATES 549300H2U2C3NB7RYM40 LEI SCOR GLOBAL LIFE REINSURANCE COMPANY OF DELAWARE
3 – Reinsurance undertaking Corporation 2 – Non-mutual Delaware Insurance Department
70 UNITED STATES 549300RQYFY70YSLXV12 LEI QUANTITATIVE DATA SOLUTIONS Limited Liability Company 2 – Non-mutual Not required71 UNITED STATES 549300BD4H7M90WKT443 LEI SCOR GLOBAL LIFE USA
HOLDINGS, INC.5 – Insurance holding company
Corporation 2 – Non-mutual Not required
72 HONG KONG 549300PS9VM2EJ32DV96 LEI SCOR REINSURANCE COMPANY (ASIA) LTD
4 – Composite undertaking Private limited company 2 – Non-mutual Insurance Authority
73 HONG KONG 176102 Specific code
SCOR SERVICES INTERNATIONAL LTD
10 – Ancillary services undertaking
Private limited company 2 – Non-mutual Not required
74 SINGAPORE 549300HJN628XFBXRV51 LEI SCOR REINSURANCE ASIA-PACIFIC PTE LTD
3 – Reinsurance undertaking Private limited company 2 – Non-mutual MAS
75 JAPAN 0199-01-069291 Specific code
SCOR SERVICES JAPAN CO. LTD
10 – Ancillary services undertaking
Kabushiki Kaisha 2 – Non-mutual Not required
76 SINGAPORE 201008452W Specific code
SCOR SERVICES ASIA-PACIFIC PTE. LTD
10 – Ancillary services undertaking
Private limited company 2 – Non-mutual MAS
77 UNITED KINGDOM
213800DYA5VN7X1U9580 LEI The Channel Managing Agency Ltd
10 – Ancillary services undertaking
Private limited company 2 – Non-mutual Lloyd’s
78 FRANCE 519672844 Specific code
Gutenberg Technologies France
Société par Actions Simplifiées
2 – Non-mutual Not required
79 GUERNSEY 23208 Specific code
ARISIS LTD 3 – Reinsurance undertaking Private limited company 2 – Non-mutual Guernsey Financial Services Commission
80 BELGIUM 0477.480.421 Specific code
SCOR SERVICES BELUX 10 – Ancillary services undertaking
Société privée à responsabilité limitée
2 – Non-mutual Not required
81 SPAIN CIF B85555696 Specific code
SCOR TELEMED SLU 10 – Ancillary services undertaking
Société par Actions Simplifiées Unipersonnelles
2 – Non-mutual Not required
82 FRANCE 417 934 544 Specific code
REHALTO SA Société par Actions Simplifiées
2 – Non-mutual Not required
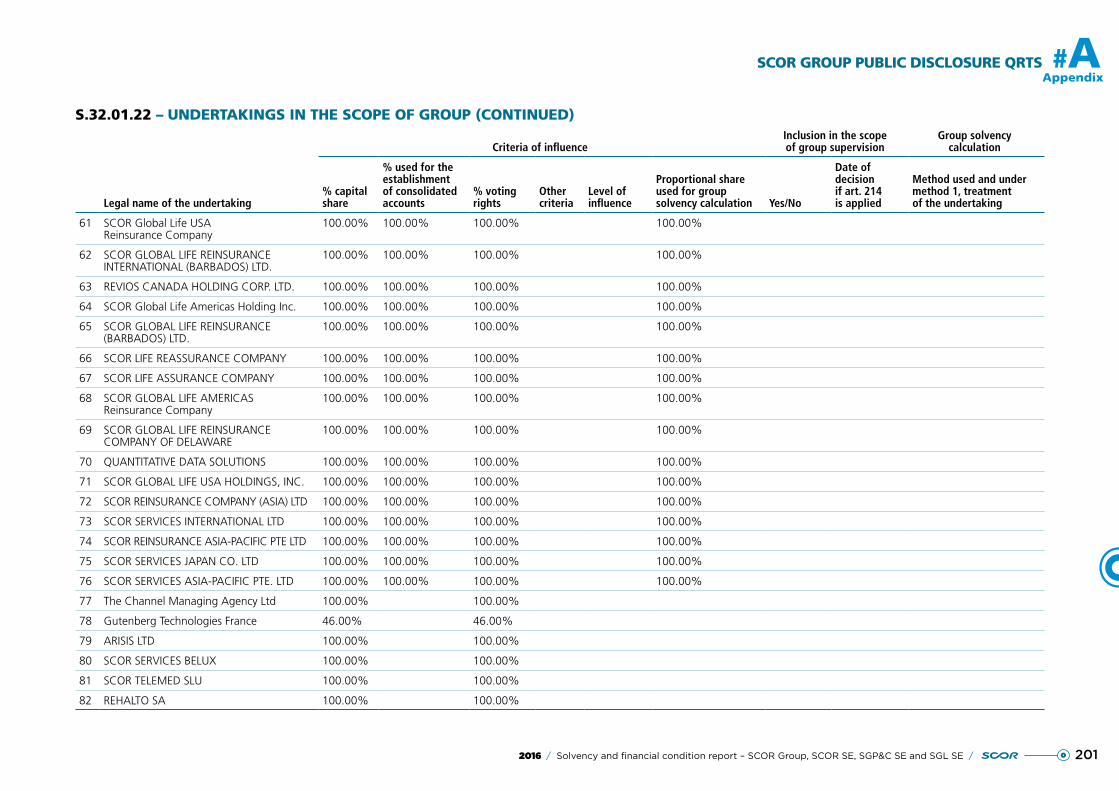
SCOR GROUP PUBLIC DISCLOSURE QRTS
201
#A
2016 / Solvency and financial condition report – SCOR Group, SCOR SE, SGP&C SE and SGL SE /
Appendix
S.32.01.22 – UNDERTAKINGS IN THE SCOPE OF GROUP (CONTINUED)
Criteria of influenceInclusion in the scope of group supervision
Group solvency calculation
Legal name of the undertaking% capital share
% used for the establishment of consolidated accounts
% voting rights
Other criteria
Level of influence
Proportional share used for group solvency calculation Yes/No
Date of decision if art. 214 is applied
Method used and under method 1, treatment of the undertaking
61 SCOR Global Life USA Reinsurance Company
100.00% 100.00% 100.00% 100.00%
62 SCOR GLOBAL LIFE REINSURANCE INTERNATIONAL (BARBADOS) LTD.
100.00% 100.00% 100.00% 100.00%
63 REVIOS CANADA HOLDING CORP. LTD. 100.00% 100.00% 100.00% 100.00%
64 SCOR Global Life Americas Holding Inc. 100.00% 100.00% 100.00% 100.00%
65 SCOR GLOBAL LIFE REINSURANCE (BARBADOS) LTD.
100.00% 100.00% 100.00% 100.00%
66 SCOR LIFE REASSURANCE COMPANY 100.00% 100.00% 100.00% 100.00%
67 SCOR LIFE ASSURANCE COMPANY 100.00% 100.00% 100.00% 100.00%
68 SCOR GLOBAL LIFE AMERICAS Reinsurance Company
100.00% 100.00% 100.00% 100.00%
69 SCOR GLOBAL LIFE REINSURANCE COMPANY OF DELAWARE
100.00% 100.00% 100.00% 100.00%
70 QUANTITATIVE DATA SOLUTIONS 100.00% 100.00% 100.00% 100.00%
71 SCOR GLOBAL LIFE USA HOLDINGS, INC. 100.00% 100.00% 100.00% 100.00%
72 SCOR REINSURANCE COMPANY (ASIA) LTD 100.00% 100.00% 100.00% 100.00%
73 SCOR SERVICES INTERNATIONAL LTD 100.00% 100.00% 100.00% 100.00%
74 SCOR REINSURANCE ASIA-PACIFIC PTE LTD 100.00% 100.00% 100.00% 100.00%
75 SCOR SERVICES JAPAN CO. LTD 100.00% 100.00% 100.00% 100.00%
76 SCOR SERVICES ASIA-PACIFIC PTE. LTD 100.00% 100.00% 100.00% 100.00%
77 The Channel Managing Agency Ltd 100.00% 100.00%
78 Gutenberg Technologies France 46.00% 46.00%
79 ARISIS LTD 100.00% 100.00%
80 SCOR SERVICES BELUX 100.00% 100.00%
81 SCOR TELEMED SLU 100.00% 100.00%
82 REHALTO SA 100.00% 100.00%
202 / Solvency and financial condition report – SCOR Group, SCOR SE, SGP&C SE and SGL SE / 2016
SCOR SE PUBLIC DISCLOSURE QRTS
# APPENDIX B
S.02.01.02 – Balance sheet 203
S.05.01.02 – Non-Life premiums, claims and expenses by line of business 205
S.05.01.02 – Life premiums, claims and expenses by line of business (continued) 207
S.05.02.01 – Non-Life premiums, claims and expenses by country 208
S.05.02.01 – Life premiums, claims and expenses by country 209
S.12.01.02 – Life and Health SLT Technical Provisions 210
S.17.01.02 – Non-Life Technical Provisions 211
S.19.01.21 – Non-Life Insurance Claims Information 213
S.23.01.01 – Own funds 214
S.25.03.21 – Solvency Capital Requirement – For undertakings on Full Internal Models 216
S.28.01.01 – Minimum Capital Requirement – Only Life or only Non-Life insurance or reinsurance activity 217
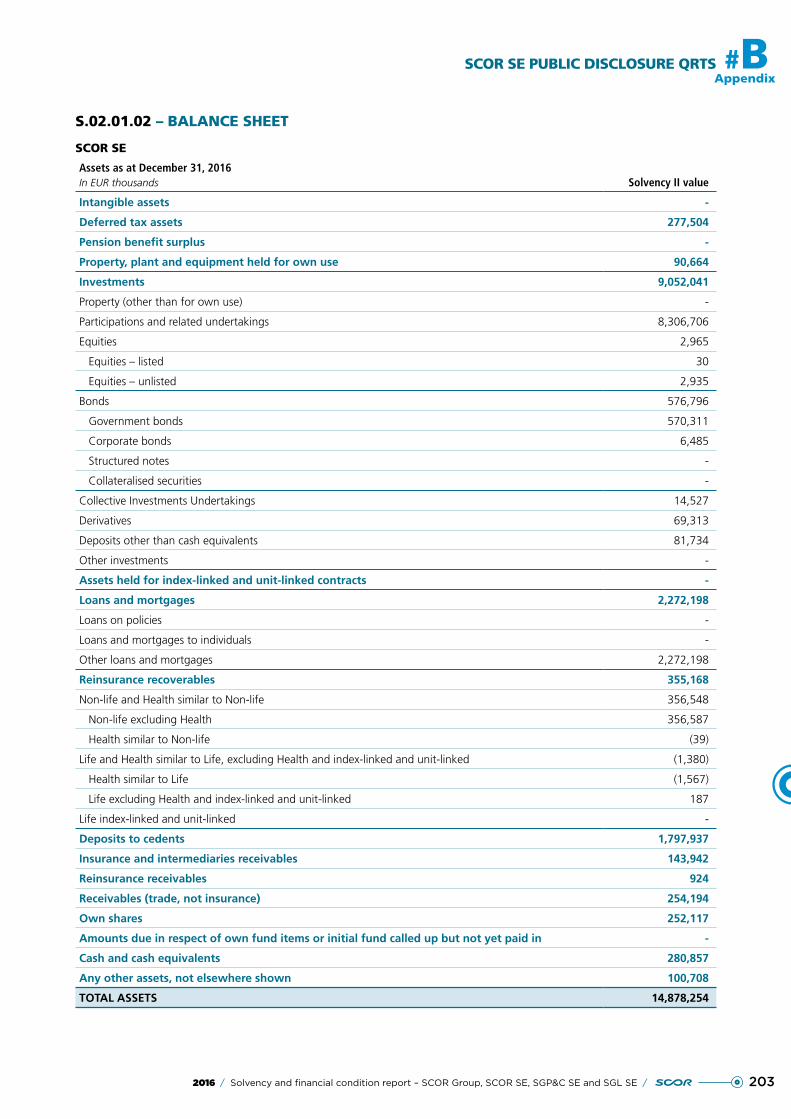
2032016 / Solvency and financial condition report – SCOR Group, SCOR SE, SGP&C SE and SGL SE /
SCOR SE PUBLIC DISCLOSURE QRTS #B
Appendix
S.02.01.02 – BALANCE SHEET
SCOR SE
Assets as at December 31, 2016In EUR thousands Solvency II value
Intangible assets -
Deferred tax assets 277,504
Pension benefit surplus -
Property, plant and equipment held for own use 90,664
Investments 9,052,041
Property (other than for own use) -
Participations and related undertakings 8,306,706
Equities 2,965
Equities – listed 30
Equities – unlisted 2,935
Bonds 576,796
Government bonds 570,311
Corporate bonds 6,485
Structured notes -
Collateralised securities -
Collective Investments Undertakings 14,527
Derivatives 69,313
Deposits other than cash equivalents 81,734
Other investments -
Assets held for index-linked and unit-linked contracts -
Loans and mortgages 2,272,198
Loans on policies -
Loans and mortgages to individuals -
Other loans and mortgages 2,272,198
Reinsurance recoverables 355,168
Non-life and Health similar to Non-life 356,548
Non-life excluding Health 356,587
Health similar to Non-life (39)
Life and Health similar to Life, excluding Health and index-linked and unit-linked (1,380)
Health similar to Life (1,567)
Life excluding Health and index-linked and unit-linked 187
Life index-linked and unit-linked -
Deposits to cedents 1,797,937
Insurance and intermediaries receivables 143,942
Reinsurance receivables 924
Receivables (trade, not insurance) 254,194
Own shares 252,117
Amounts due in respect of own fund items or initial fund called up but not yet paid in -
Cash and cash equivalents 280,857
Any other assets, not elsewhere shown 100,708
TOTAL ASSETS 14,878,254
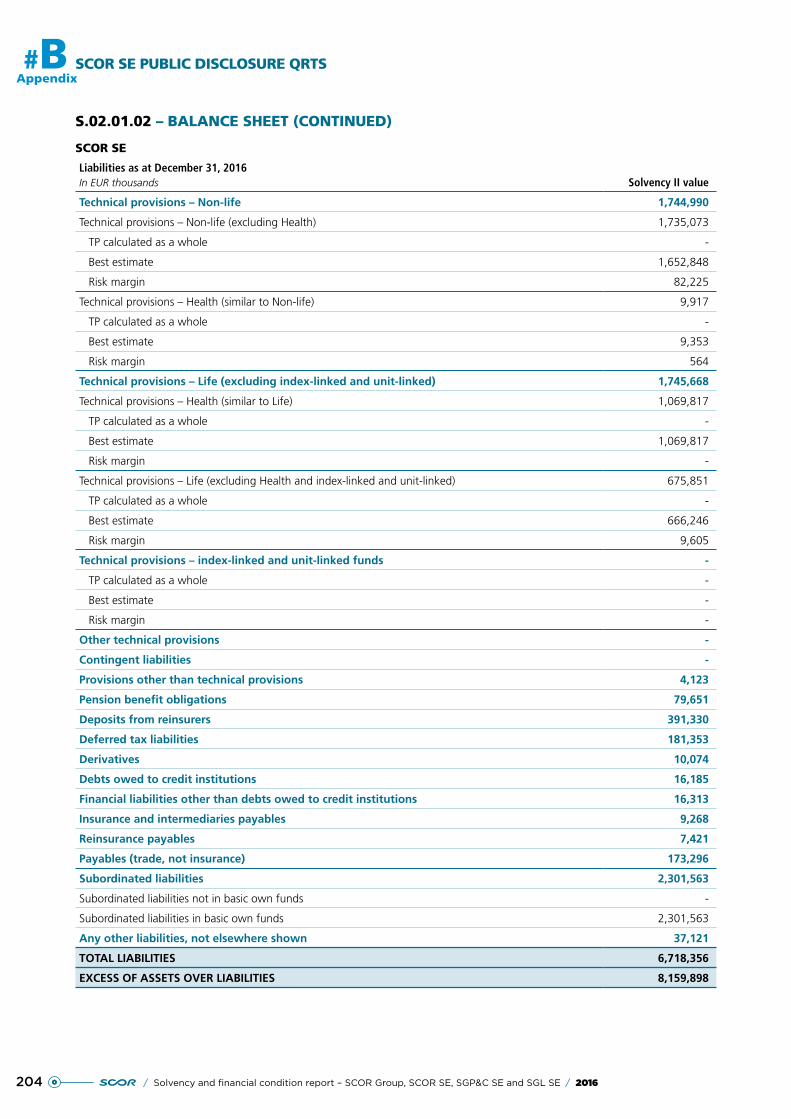
204 / Solvency and financial condition report – SCOR Group, SCOR SE, SGP&C SE and SGL SE / 2016
#BAppendix
SCOR SE PUBLIC DISCLOSURE QRTS
S.02.01.02 – BALANCE SHEET (CONTINUED)
SCOR SE
Liabilities as at December 31, 2016In EUR thousands Solvency II value
Technical provisions – Non-life 1,744,990
Technical provisions – Non-life (excluding Health) 1,735,073
TP calculated as a whole -
Best estimate 1,652,848
Risk margin 82,225
Technical provisions – Health (similar to Non-life) 9,917
TP calculated as a whole -
Best estimate 9,353
Risk margin 564
Technical provisions – Life (excluding index-linked and unit-linked) 1,745,668
Technical provisions – Health (similar to Life) 1,069,817
TP calculated as a whole -
Best estimate 1,069,817
Risk margin -
Technical provisions – Life (excluding Health and index-linked and unit-linked) 675,851
TP calculated as a whole -
Best estimate 666,246
Risk margin 9,605
Technical provisions – index-linked and unit-linked funds -
TP calculated as a whole -
Best estimate -
Risk margin -
Other technical provisions -
Contingent liabilities -
Provisions other than technical provisions 4,123
Pension benefit obligations 79,651
Deposits from reinsurers 391,330
Deferred tax liabilities 181,353
Derivatives 10,074
Debts owed to credit institutions 16,185
Financial liabilities other than debts owed to credit institutions 16,313
Insurance and intermediaries payables 9,268
Reinsurance payables 7,421
Payables (trade, not insurance) 173,296
Subordinated liabilities 2,301,563
Subordinated liabilities not in basic own funds -
Subordinated liabilities in basic own funds 2,301,563
Any other liabilities, not elsewhere shown 37,121
TOTAL LIABILITIES 6,718,356
EXCESS OF ASSETS OVER LIABILITIES 8,159,898
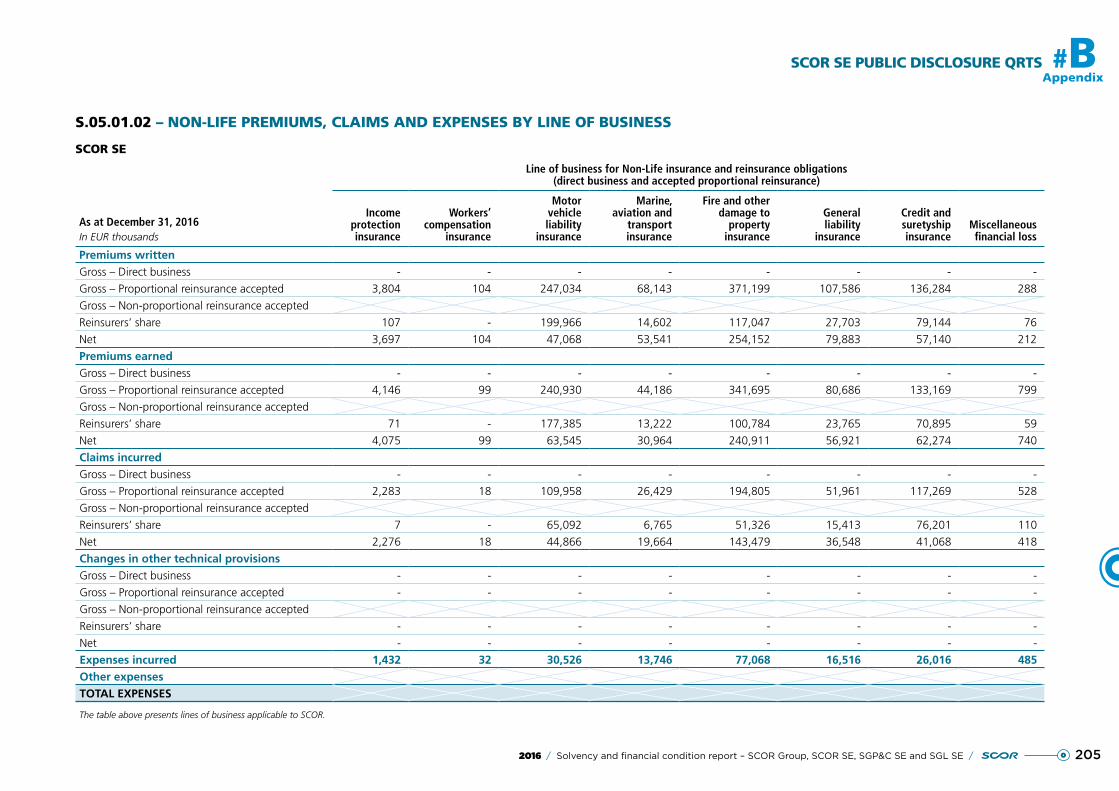
SCOR SE PUBLIC DISCLOSURE QRTS #BAppendix
2052016 / Solvency and financial condition report – SCOR Group, SCOR SE, SGP&C SE and SGL SE /
S.05.01.02 – NON-LIFE PREMIUMS, CLAIMS AND EXPENSES BY LINE OF BUSINESS
SCOR SE
Line of business for Non-Life insurance and reinsurance obligations(direct business and accepted proportional reinsurance)
As at December 31, 2016In EUR thousands
Income protection insurance
Workers’ compensation
insurance
Motor vehicle liability
insurance
Marine, aviation and
transport insurance
Fire and other damage to
property insurance
General liability
insurance
Credit and suretyship insurance
Miscellaneous financial loss
Premiums writtenGross – Direct business - - - - - - - -
Gross – Proportional reinsurance accepted 3,804 104 247,034 68,143 371,199 107,586 136,284 288
Gross – Non-proportional reinsurance accepted
Reinsurers’ share 107 - 199,966 14,602 117,047 27,703 79,144 76
Net 3,697 104 47,068 53,541 254,152 79,883 57,140 212
Premiums earnedGross – Direct business - - - - - - - -
Gross – Proportional reinsurance accepted 4,146 99 240,930 44,186 341,695 80,686 133,169 799
Gross – Non-proportional reinsurance accepted
Reinsurers’ share 71 - 177,385 13,222 100,784 23,765 70,895 59
Net 4,075 99 63,545 30,964 240,911 56,921 62,274 740
Claims incurredGross – Direct business - - - - - - - -
Gross – Proportional reinsurance accepted 2,283 18 109,958 26,429 194,805 51,961 117,269 528
Gross – Non-proportional reinsurance accepted
Reinsurers’ share 7 - 65,092 6,765 51,326 15,413 76,201 110
Net 2,276 18 44,866 19,664 143,479 36,548 41,068 418
Changes in other technical provisionsGross – Direct business - - - - - - - -
Gross – Proportional reinsurance accepted - - - - - - - -
Gross – Non-proportional reinsurance accepted
Reinsurers’ share - - - - - - - -
Net - - - - - - - -
Expenses incurred 1,432 32 30,526 13,746 77,068 16,516 26,016 485Other expensesTOTAL EXPENSES
The table above presents lines of business applicable to SCOR.
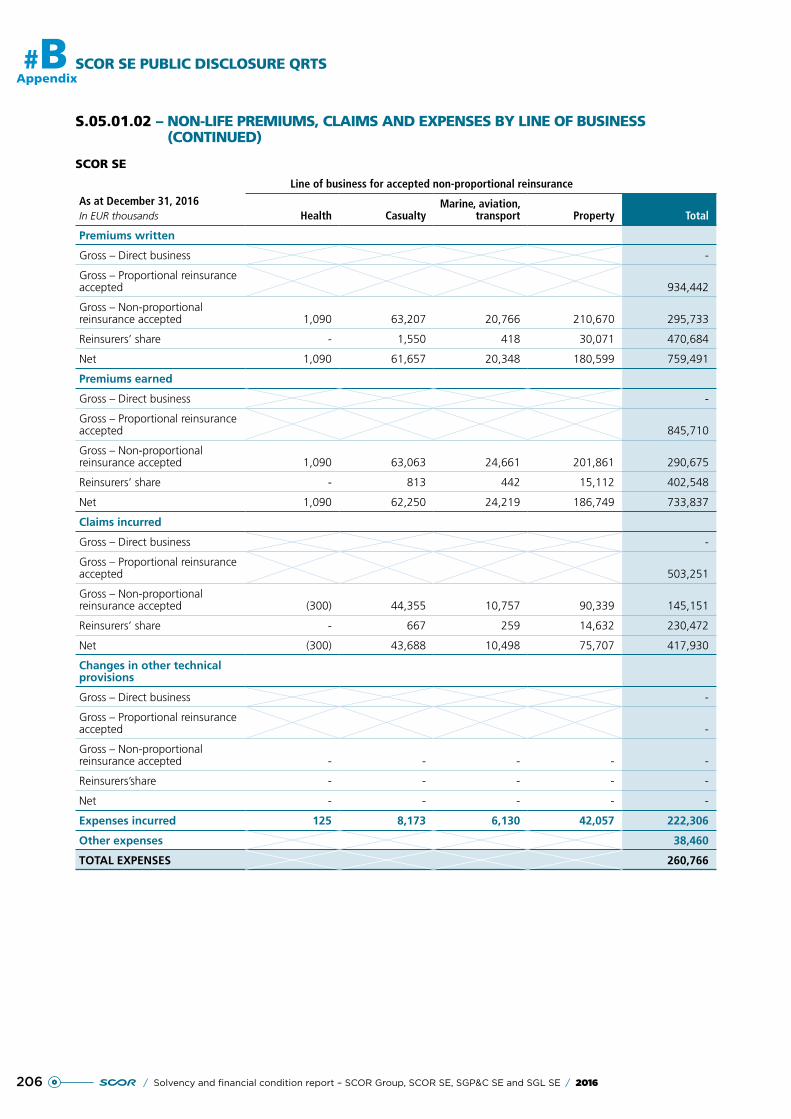
206 / Solvency and financial condition report – SCOR Group, SCOR SE, SGP&C SE and SGL SE / 2016
#BAppendix
SCOR SE PUBLIC DISCLOSURE QRTS
S.05.01.02 – NON-LIFE PREMIUMS, CLAIMS AND EXPENSES BY LINE OF BUSINESS (CONTINUED)
SCOR SE
As at December 31, 2016In EUR thousands
Line of business for accepted non-proportional reinsurance
Health CasualtyMarine, aviation,
transport Property Total
Premiums written
Gross – Direct business -
Gross – Proportional reinsurance accepted 934,442
Gross – Non-proportional reinsurance accepted 1,090 63,207 20,766 210,670 295,733
Reinsurers’ share - 1,550 418 30,071 470,684
Net 1,090 61,657 20,348 180,599 759,491
Premiums earned
Gross – Direct business -
Gross – Proportional reinsurance accepted 845,710
Gross – Non-proportional reinsurance accepted 1,090 63,063 24,661 201,861 290,675
Reinsurers’ share - 813 442 15,112 402,548
Net 1,090 62,250 24,219 186,749 733,837
Claims incurred
Gross – Direct business -
Gross – Proportional reinsurance accepted 503,251
Gross – Non-proportional reinsurance accepted (300) 44,355 10,757 90,339 145,151
Reinsurers’ share - 667 259 14,632 230,472
Net (300) 43,688 10,498 75,707 417,930
Changes in other technical provisions
Gross – Direct business -
Gross – Proportional reinsurance accepted -
Gross – Non-proportional reinsurance accepted - - - - -
Reinsurers’share - - - - -
Net - - - - -
Expenses incurred 125 8,173 6,130 42,057 222,306
Other expenses 38,460
TOTAL EXPENSES 260,766
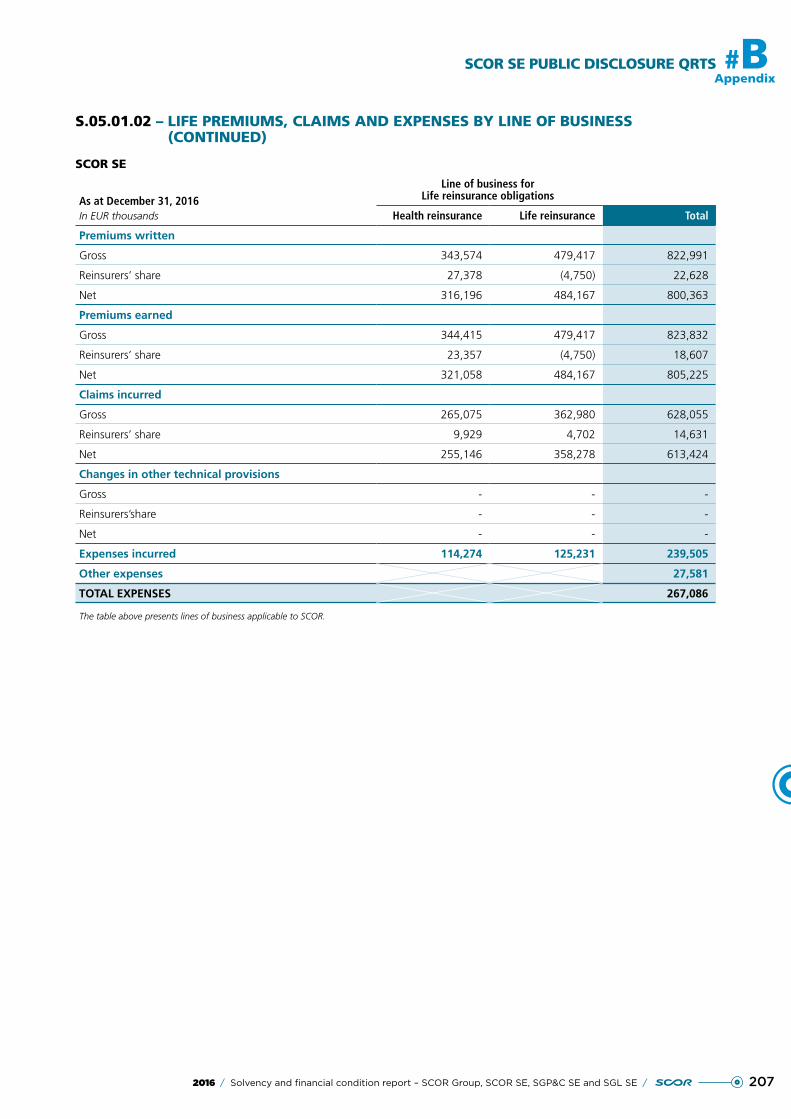
2072016 / Solvency and financial condition report – SCOR Group, SCOR SE, SGP&C SE and SGL SE /
SCOR SE PUBLIC DISCLOSURE QRTS #B
Appendix
S.05.01.02 – LIFE PREMIUMS, CLAIMS AND EXPENSES BY LINE OF BUSINESS (CONTINUED)
SCOR SE
As at December 31, 2016In EUR thousands
Line of business for Life reinsurance obligations
Health reinsurance Life reinsurance Total
Premiums written
Gross 343,574 479,417 822,991
Reinsurers’ share 27,378 (4,750) 22,628
Net 316,196 484,167 800,363
Premiums earned
Gross 344,415 479,417 823,832
Reinsurers’ share 23,357 (4,750) 18,607
Net 321,058 484,167 805,225
Claims incurred
Gross 265,075 362,980 628,055
Reinsurers’ share 9,929 4,702 14,631
Net 255,146 358,278 613,424
Changes in other technical provisions
Gross - - -
Reinsurers’share - - -
Net - - -
Expenses incurred 114,274 125,231 239,505
Other expenses 27,581
TOTAL EXPENSES 267,086
The table above presents lines of business applicable to SCOR.
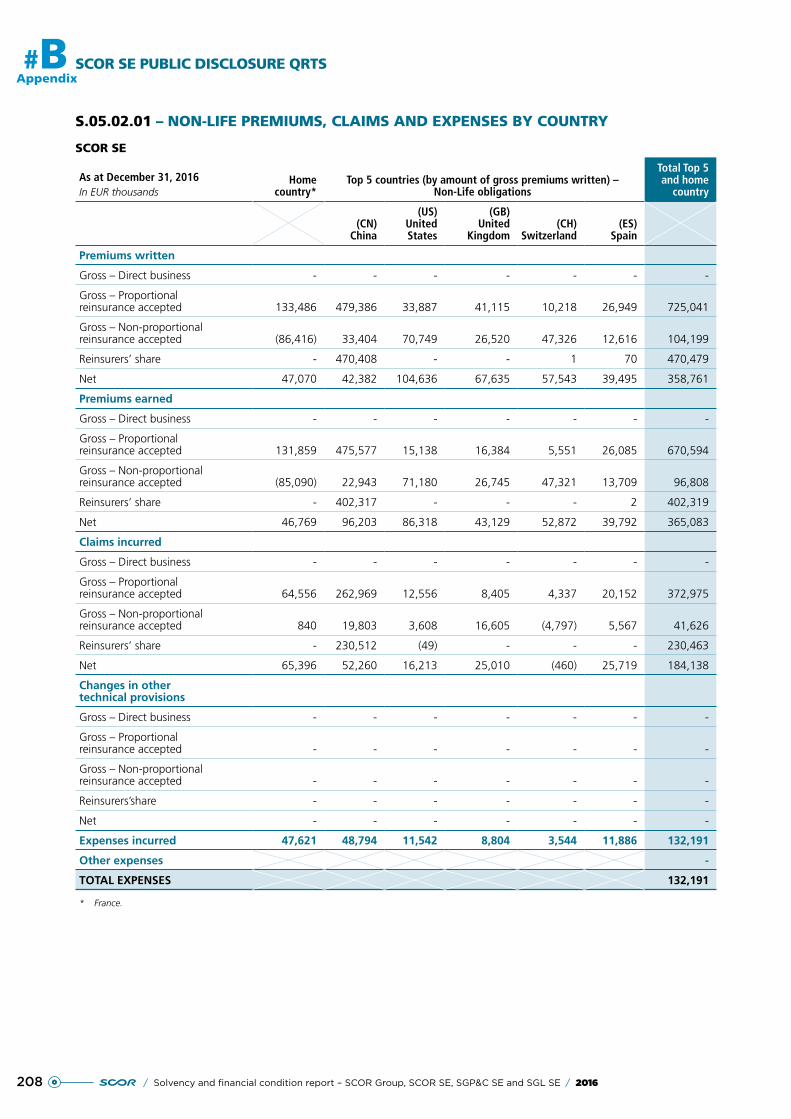
208 / Solvency and financial condition report – SCOR Group, SCOR SE, SGP&C SE and SGL SE / 2016
#BAppendix
SCOR SE PUBLIC DISCLOSURE QRTS
S.05.02.01 – NON-LIFE PREMIUMS, CLAIMS AND EXPENSES BY COUNTRY
SCOR SE
As at December 31, 2016In EUR thousands
Homecountry*
Top 5 countries (by amount of gross premiums written) – Non-Life obligations
Total Top 5 and home
country
(CN) China
(US) United States
(GB) United
Kingdom(CH)
Switzerland(ES)
Spain
Premiums written
Gross – Direct business - - - - - - -
Gross – Proportional reinsurance accepted 133,486 479,386 33,887 41,115 10,218 26,949 725,041
Gross – Non-proportional reinsurance accepted (86,416) 33,404 70,749 26,520 47,326 12,616 104,199
Reinsurers’ share - 470,408 - - 1 70 470,479
Net 47,070 42,382 104,636 67,635 57,543 39,495 358,761
Premiums earned
Gross – Direct business - - - - - - -
Gross – Proportional reinsurance accepted 131,859 475,577 15,138 16,384 5,551 26,085 670,594
Gross – Non-proportional reinsurance accepted (85,090) 22,943 71,180 26,745 47,321 13,709 96,808
Reinsurers’ share - 402,317 - - - 2 402,319
Net 46,769 96,203 86,318 43,129 52,872 39,792 365,083
Claims incurred
Gross – Direct business - - - - - - -
Gross – Proportional reinsurance accepted 64,556 262,969 12,556 8,405 4,337 20,152 372,975
Gross – Non-proportional reinsurance accepted 840 19,803 3,608 16,605 (4,797) 5,567 41,626
Reinsurers’ share - 230,512 (49) - - - 230,463
Net 65,396 52,260 16,213 25,010 (460) 25,719 184,138
Changes in other technical provisions
Gross – Direct business - - - - - - -
Gross – Proportional reinsurance accepted - - - - - - -
Gross – Non-proportional reinsurance accepted - - - - - - -
Reinsurers’share - - - - - - -
Net - - - - - - -
Expenses incurred 47,621 48,794 11,542 8,804 3,544 11,886 132,191
Other expenses -
TOTAL EXPENSES 132,191
* France.
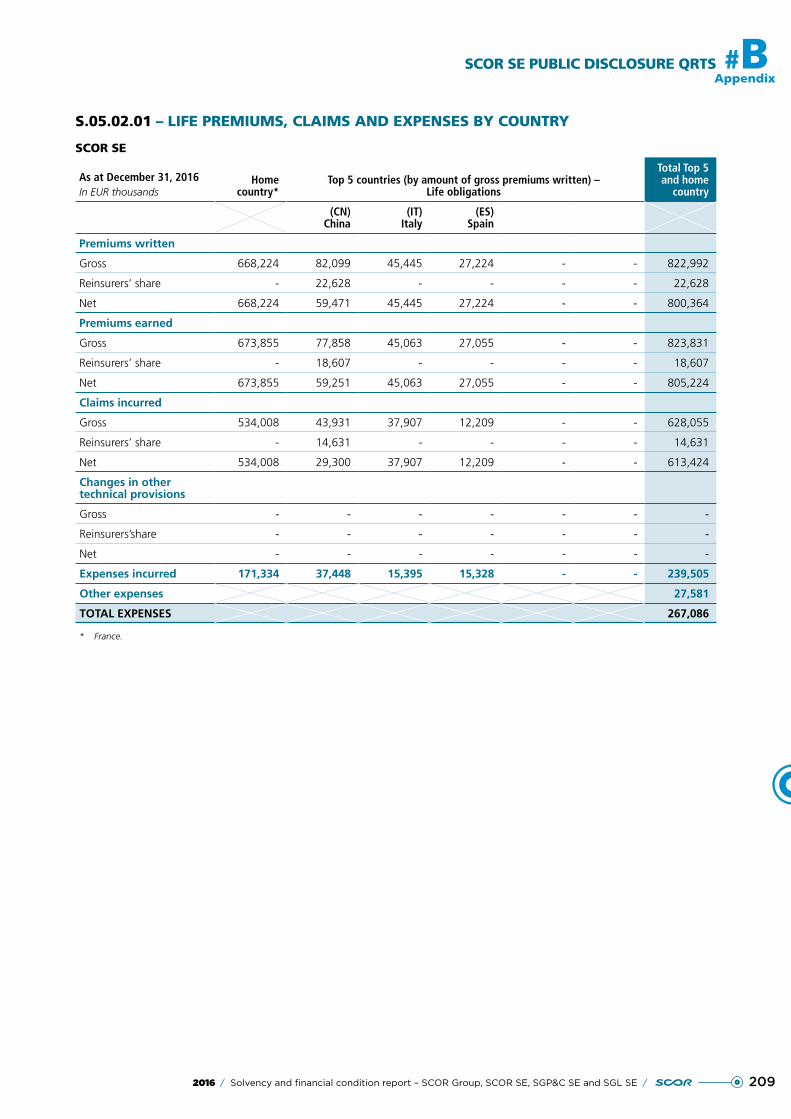
2092016 / Solvency and financial condition report – SCOR Group, SCOR SE, SGP&C SE and SGL SE /
SCOR SE PUBLIC DISCLOSURE QRTS #B
Appendix
S.05.02.01 – LIFE PREMIUMS, CLAIMS AND EXPENSES BY COUNTRY
SCOR SE
As at December 31, 2016In EUR thousands
Homecountry*
Top 5 countries (by amount of gross premiums written) – Life obligations
Total Top 5 and home
country
(CN)China
(IT)Italy
(ES)Spain
Premiums written
Gross 668,224 82,099 45,445 27,224 - - 822,992
Reinsurers’ share - 22,628 - - - - 22,628
Net 668,224 59,471 45,445 27,224 - - 800,364
Premiums earned
Gross 673,855 77,858 45,063 27,055 - - 823,831
Reinsurers’ share - 18,607 - - - - 18,607
Net 673,855 59,251 45,063 27,055 - - 805,224
Claims incurred
Gross 534,008 43,931 37,907 12,209 - - 628,055
Reinsurers’ share - 14,631 - - - - 14,631
Net 534,008 29,300 37,907 12,209 - - 613,424
Changes in other technical provisions
Gross - - - - - - -
Reinsurers’share - - - - - - -
Net - - - - - - -
Expenses incurred 171,334 37,448 15,395 15,328 - - 239,505
Other expenses 27,581
TOTAL EXPENSES 267,086
* France.
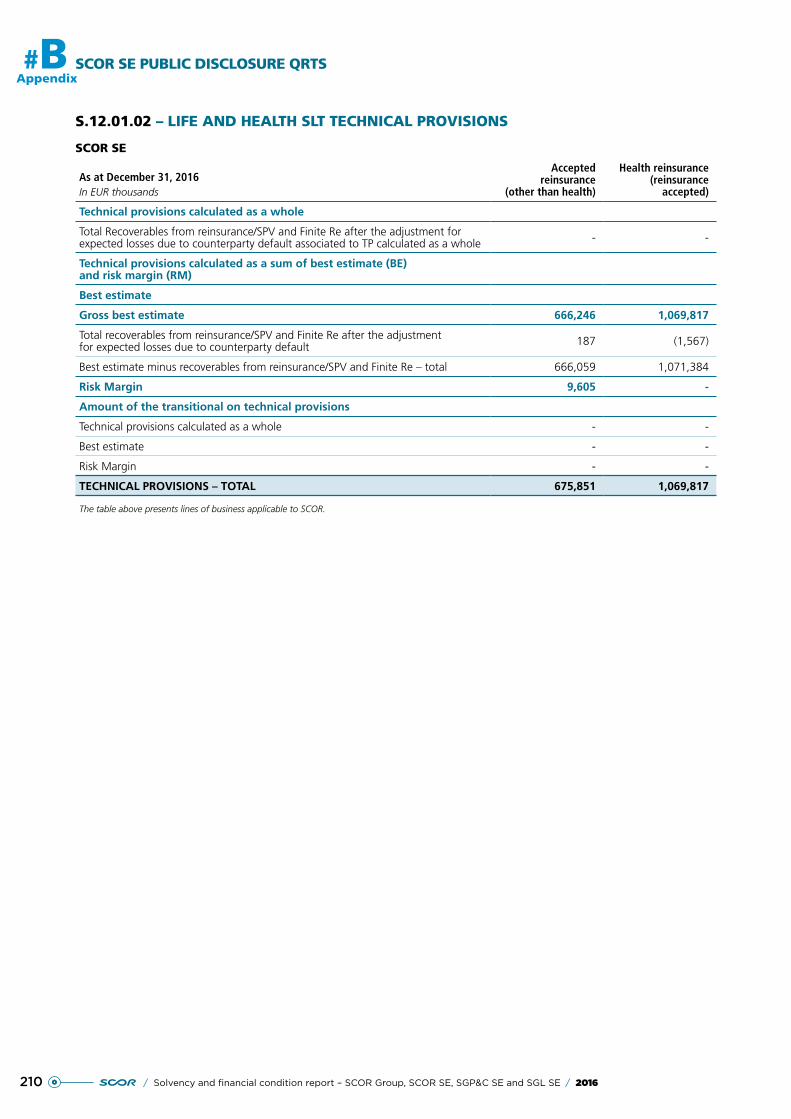
210 / Solvency and financial condition report – SCOR Group, SCOR SE, SGP&C SE and SGL SE / 2016
#BAppendix
SCOR SE PUBLIC DISCLOSURE QRTS
S.12.01.02 – LIFE AND HEALTH SLT TECHNICAL PROVISIONS
SCOR SE
As at December 31, 2016In EUR thousands
Accepted reinsurance
(other than health)
Health reinsurance (reinsurance
accepted)
Technical provisions calculated as a whole
Total Recoverables from reinsurance/SPV and Finite Re after the adjustment for expected losses due to counterparty default associated to TP calculated as a whole - -
Technical provisions calculated as a sum of best estimate (BE) and risk margin (RM)
Best estimate
Gross best estimate 666,246 1,069,817
Total recoverables from reinsurance/SPV and Finite Re after the adjustment for expected losses due to counterparty default 187 (1,567)
Best estimate minus recoverables from reinsurance/SPV and Finite Re – total 666,059 1,071,384
Risk Margin 9,605 -
Amount of the transitional on technical provisions
Technical provisions calculated as a whole - -
Best estimate - -
Risk Margin - -
TECHNICAL PROVISIONS – TOTAL 675,851 1,069,817
The table above presents lines of business applicable to SCOR.
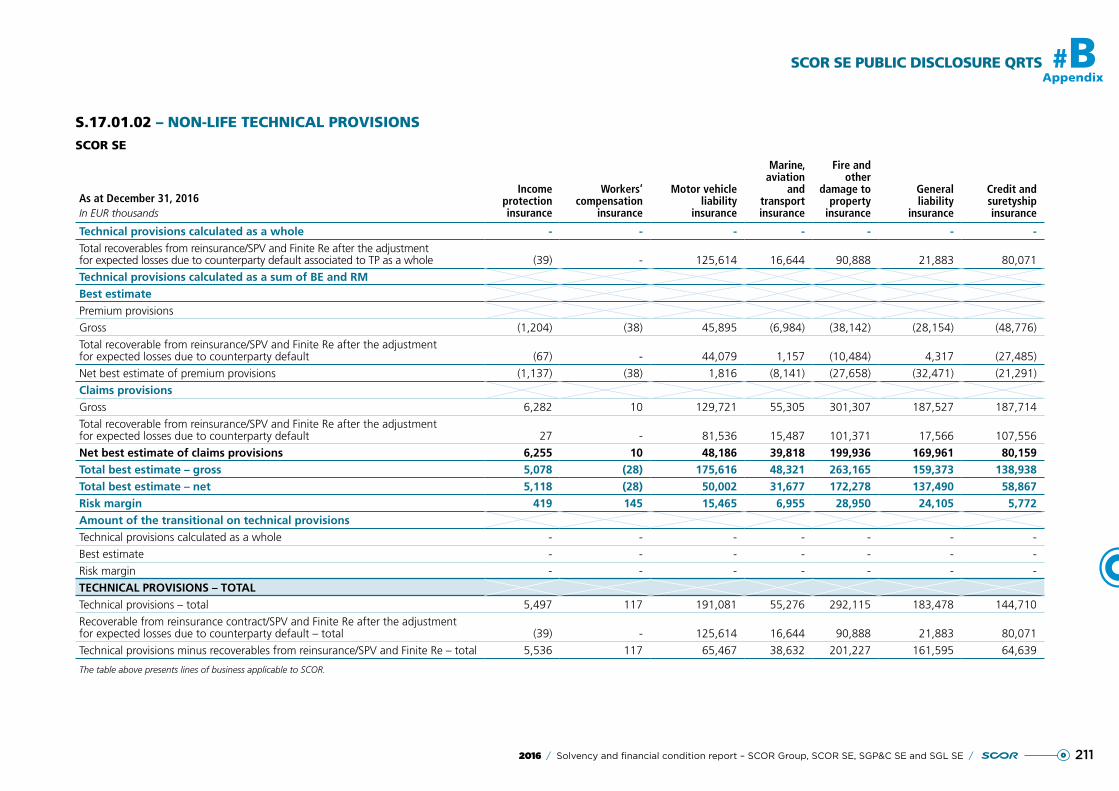
SCOR SE PUBLIC DISCLOSURE QRTS #BAppendix
2112016 / Solvency and financial condition report – SCOR Group, SCOR SE, SGP&C SE and SGL SE /
S.17.01.02 – NON-LIFE TECHNICAL PROVISIONS
SCOR SE
As at December 31, 2016In EUR thousands
Income protection insurance
Workers’ compensation
insurance
Motor vehicle liability
insurance
Marine, aviation
and transport insurance
Fire and other
damage to property
insurance
General liability
insurance
Credit and suretyship insurance
Technical provisions calculated as a whole - - - - - - -Total recoverables from reinsurance/SPV and Finite Re after the adjustment for expected losses due to counterparty default associated to TP as a whole (39) - 125,614 16,644 90,888 21,883 80,071
Technical provisions calculated as a sum of BE and RMBest estimatePremium provisions
Gross (1,204) (38) 45,895 (6,984) (38,142) (28,154) (48,776)
Total recoverable from reinsurance/SPV and Finite Re after the adjustment for expected losses due to counterparty default (67) - 44,079 1,157 (10,484) 4,317 (27,485)
Net best estimate of premium provisions (1,137) (38) 1,816 (8,141) (27,658) (32,471) (21,291)
Claims provisionsGross 6,282 10 129,721 55,305 301,307 187,527 187,714
Total recoverable from reinsurance/SPV and Finite Re after the adjustment for expected losses due to counterparty default 27 - 81,536 15,487 101,371 17,566 107,556
Net best estimate of claims provisions 6,255 10 48,186 39,818 199,936 169,961 80,159Total best estimate – gross 5,078 (28) 175,616 48,321 263,165 159,373 138,938Total best estimate – net 5,118 (28) 50,002 31,677 172,278 137,490 58,867Risk margin 419 145 15,465 6,955 28,950 24,105 5,772Amount of the transitional on technical provisionsTechnical provisions calculated as a whole - - - - - - -
Best estimate - - - - - - -
Risk margin - - - - - - -
TECHNICAL PROVISIONS – TOTALTechnical provisions – total 5,497 117 191,081 55,276 292,115 183,478 144,710
Recoverable from reinsurance contract/SPV and Finite Re after the adjustment for expected losses due to counterparty default – total (39) - 125,614 16,644 90,888 21,883 80,071
Technical provisions minus recoverables from reinsurance/SPV and Finite Re – total 5,536 117 65,467 38,632 201,227 161,595 64,639
The table above presents lines of business applicable to SCOR.
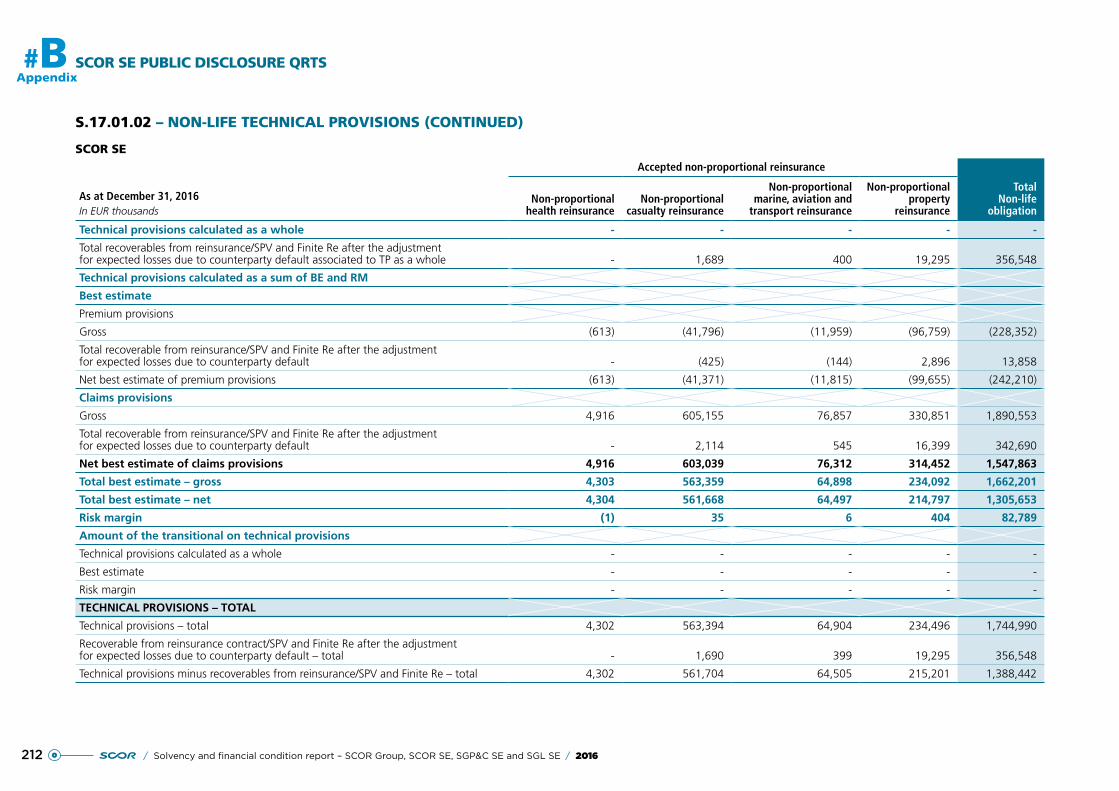
SCOR SE PUBLIC DISCLOSURE QRTS#BAppendix
212 / Solvency and financial condition report – SCOR Group, SCOR SE, SGP&C SE and SGL SE / 2016
S.17.01.02 – NON-LIFE TECHNICAL PROVISIONS (CONTINUED)
SCOR SE
As at December 31, 2016In EUR thousands
Accepted non-proportional reinsurance
Total Non-life
obligationNon-proportional
health reinsuranceNon-proportional
casualty reinsurance
Non-proportional marine, aviation and
transport reinsurance
Non-proportional property
reinsurance
Technical provisions calculated as a whole - - - - -
Total recoverables from reinsurance/SPV and Finite Re after the adjustment for expected losses due to counterparty default associated to TP as a whole - 1,689 400 19,295 356,548
Technical provisions calculated as a sum of BE and RM
Best estimate
Premium provisions
Gross (613) (41,796) (11,959) (96,759) (228,352)
Total recoverable from reinsurance/SPV and Finite Re after the adjustment for expected losses due to counterparty default - (425) (144) 2,896 13,858
Net best estimate of premium provisions (613) (41,371) (11,815) (99,655) (242,210)
Claims provisions
Gross 4,916 605,155 76,857 330,851 1,890,553
Total recoverable from reinsurance/SPV and Finite Re after the adjustment for expected losses due to counterparty default - 2,114 545 16,399 342,690
Net best estimate of claims provisions 4,916 603,039 76,312 314,452 1,547,863
Total best estimate – gross 4,303 563,359 64,898 234,092 1,662,201
Total best estimate – net 4,304 561,668 64,497 214,797 1,305,653
Risk margin (1) 35 6 404 82,789
Amount of the transitional on technical provisions
Technical provisions calculated as a whole - - - - -
Best estimate - - - - -
Risk margin - - - - -
TECHNICAL PROVISIONS – TOTAL
Technical provisions – total 4,302 563,394 64,904 234,496 1,744,990
Recoverable from reinsurance contract/SPV and Finite Re after the adjustment for expected losses due to counterparty default – total - 1,690 399 19,295 356,548
Technical provisions minus recoverables from reinsurance/SPV and Finite Re – total 4,302 561,704 64,505 215,201 1,388,442
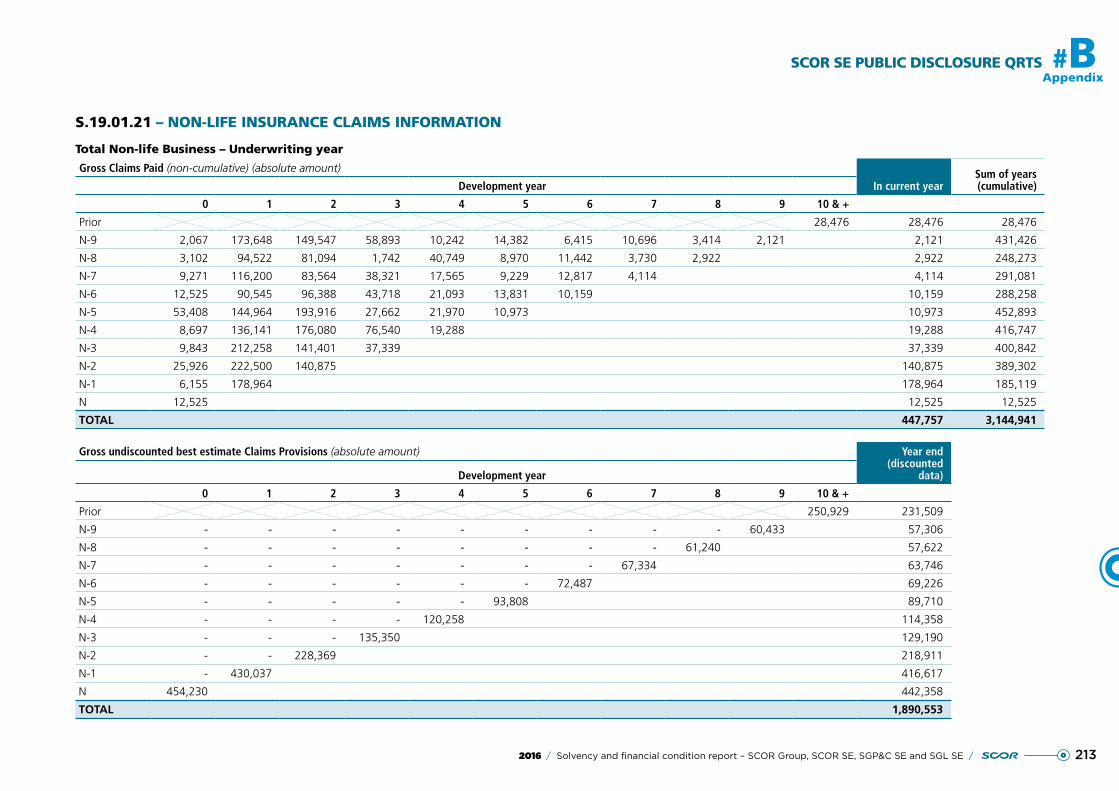
SCOR SE PUBLIC DISCLOSURE QRTS #BAppendix
2132016 / Solvency and financial condition report – SCOR Group, SCOR SE, SGP&C SE and SGL SE /
S.19.01.21 – NON-LIFE INSURANCE CLAIMS INFORMATION
Total Non-life Business – Underwriting year
Gross Claims Paid (non-cumulative) (absolute amount)
In current yearSum of years (cumulative)Development year
0 1 2 3 4 5 6 7 8 9 10 & +
Prior 28,476 28,476 28,476
N-9 2,067 173,648 149,547 58,893 10,242 14,382 6,415 10,696 3,414 2,121 2,121 431,426
N-8 3,102 94,522 81,094 1,742 40,749 8,970 11,442 3,730 2,922 2,922 248,273
N-7 9,271 116,200 83,564 38,321 17,565 9,229 12,817 4,114 4,114 291,081
N-6 12,525 90,545 96,388 43,718 21,093 13,831 10,159 10,159 288,258
N-5 53,408 144,964 193,916 27,662 21,970 10,973 10,973 452,893
N-4 8,697 136,141 176,080 76,540 19,288 19,288 416,747
N-3 9,843 212,258 141,401 37,339 37,339 400,842
N-2 25,926 222,500 140,875 140,875 389,302
N-1 6,155 178,964 178,964 185,119
N 12,525 12,525 12,525
TOTAL 447,757 3,144,941
Gross undiscounted best estimate Claims Provisions (absolute amount) Year end (discounted
data)Development year
0 1 2 3 4 5 6 7 8 9 10 & +
Prior 250,929 231,509
N-9 - - - - - - - - - 60,433 57,306
N-8 - - - - - - - - 61,240 57,622
N-7 - - - - - - - 67,334 63,746
N-6 - - - - - - 72,487 69,226
N-5 - - - - - 93,808 89,710
N-4 - - - - 120,258 114,358
N-3 - - - 135,350 129,190
N-2 - - 228,369 218,911
N-1 - 430,037 416,617
N 454,230 442,358
TOTAL 1,890,553
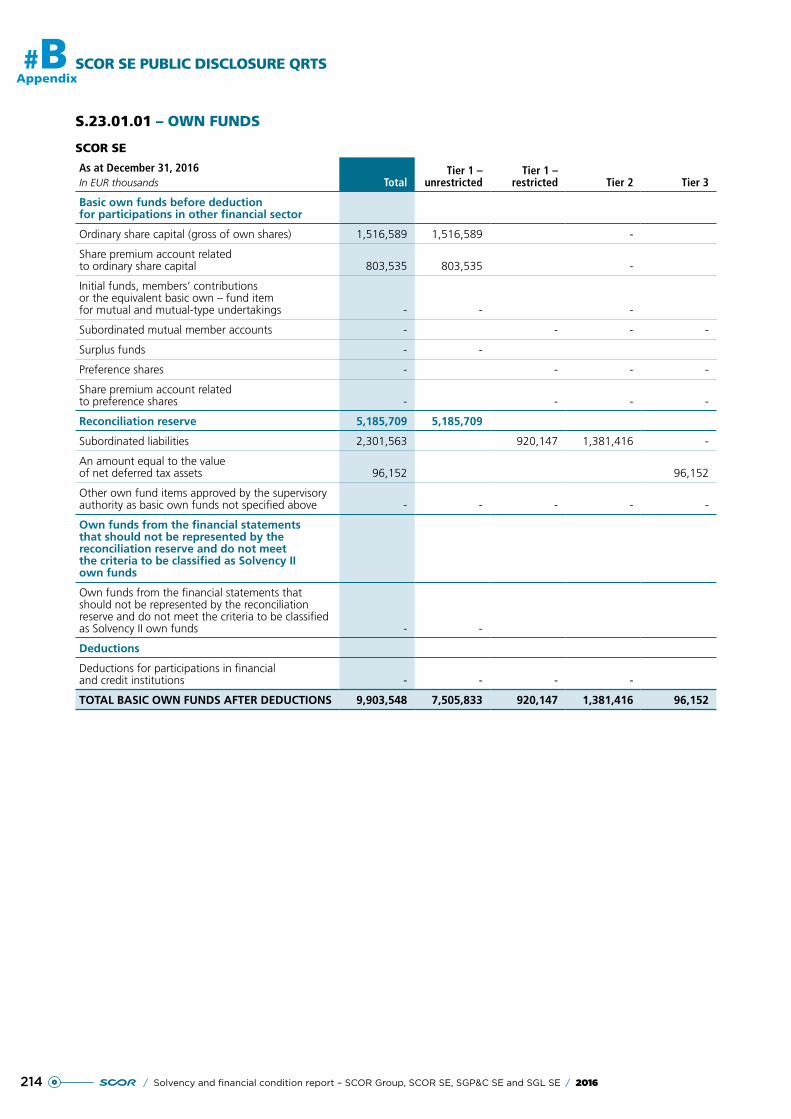
214 / Solvency and financial condition report – SCOR Group, SCOR SE, SGP&C SE and SGL SE / 2016
#BAppendix
SCOR SE PUBLIC DISCLOSURE QRTS
S.23.01.01 – OWN FUNDS
SCOR SE
As at December 31, 2016In EUR thousands Total
Tier 1 – unrestricted
Tier 1 – restricted Tier 2 Tier 3
Basic own funds before deduction for participations in other financial sector
Ordinary share capital (gross of own shares) 1,516,589 1,516,589 -
Share premium account related to ordinary share capital 803,535 803,535 -
Initial funds, members’ contributions or the equivalent basic own – fund item for mutual and mutual-type undertakings - - -
Subordinated mutual member accounts - - - -
Surplus funds - -
Preference shares - - - -
Share premium account related to preference shares - - - -
Reconciliation reserve 5,185,709 5,185,709
Subordinated liabilities 2,301,563 920,147 1,381,416 -
An amount equal to the value of net deferred tax assets 96,152 96,152
Other own fund items approved by the supervisory authority as basic own funds not specified above - - - - -
Own funds from the financial statements that should not be represented by the reconciliation reserve and do not meet the criteria to be classified as Solvency II own funds
Own funds from the financial statements that should not be represented by the reconciliation reserve and do not meet the criteria to be classified as Solvency II own funds - -
Deductions
Deductions for participations in financial and credit institutions - - - -
TOTAL BASIC OWN FUNDS AFTER DEDUCTIONS 9,903,548 7,505,833 920,147 1,381,416 96,152
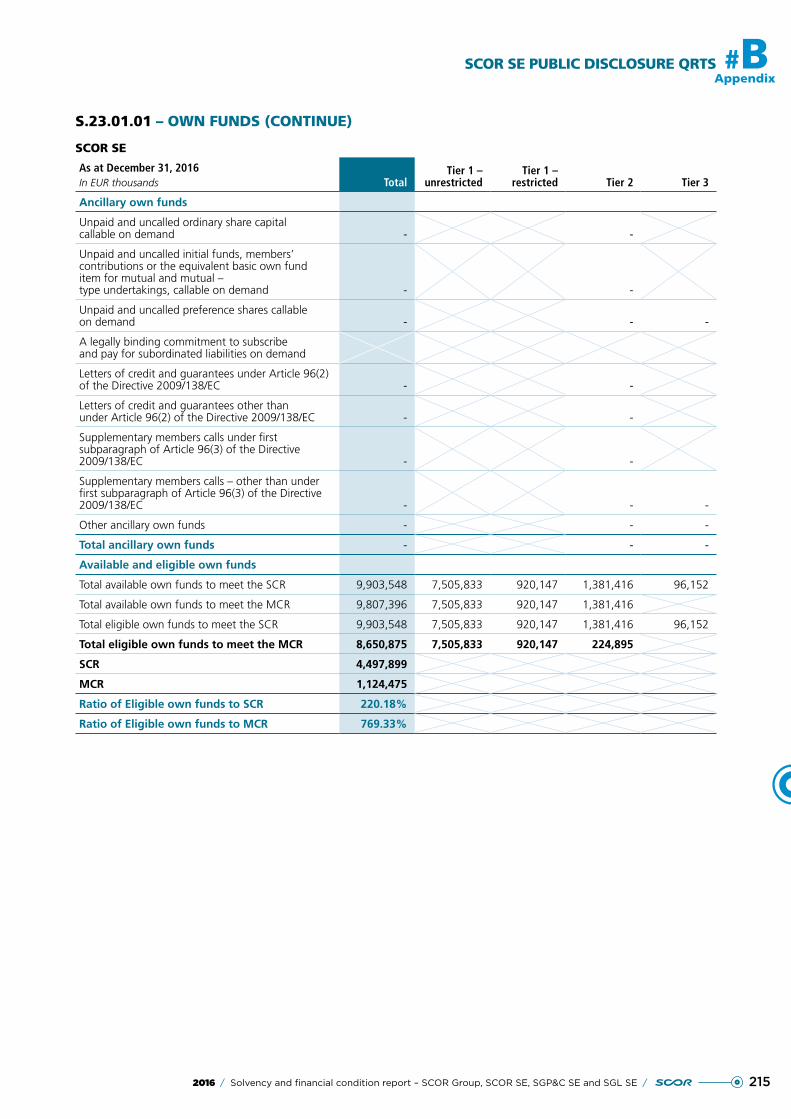
2152016 / Solvency and financial condition report – SCOR Group, SCOR SE, SGP&C SE and SGL SE /
SCOR SE PUBLIC DISCLOSURE QRTS #B
Appendix
S.23.01.01 – OWN FUNDS (CONTINUE)
SCOR SE
As at December 31, 2016In EUR thousands Total
Tier 1 – unrestricted
Tier 1 – restricted Tier 2 Tier 3
Ancillary own funds
Unpaid and uncalled ordinary share capital callable on demand - -
Unpaid and uncalled initial funds, members’ contributions or the equivalent basic own fund item for mutual and mutual – type undertakings, callable on demand - -
Unpaid and uncalled preference shares callable on demand - - -
A legally binding commitment to subscribe and pay for subordinated liabilities on demand
Letters of credit and guarantees under Article 96(2) of the Directive 2009/138/EC - -
Letters of credit and guarantees other than under Article 96(2) of the Directive 2009/138/EC - -
Supplementary members calls under first subparagraph of Article 96(3) of the Directive 2009/138/EC - -
Supplementary members calls – other than under first subparagraph of Article 96(3) of the Directive 2009/138/EC - - -
Other ancillary own funds - - -
Total ancillary own funds - - -
Available and eligible own funds
Total available own funds to meet the SCR 9,903,548 7,505,833 920,147 1,381,416 96,152
Total available own funds to meet the MCR 9,807,396 7,505,833 920,147 1,381,416
Total eligible own funds to meet the SCR 9,903,548 7,505,833 920,147 1,381,416 96,152
Total eligible own funds to meet the MCR 8,650,875 7,505,833 920,147 224,895
SCR 4,497,899
MCR 1,124,475
Ratio of Eligible own funds to SCR 220.18%
Ratio of Eligible own funds to MCR 769.33%
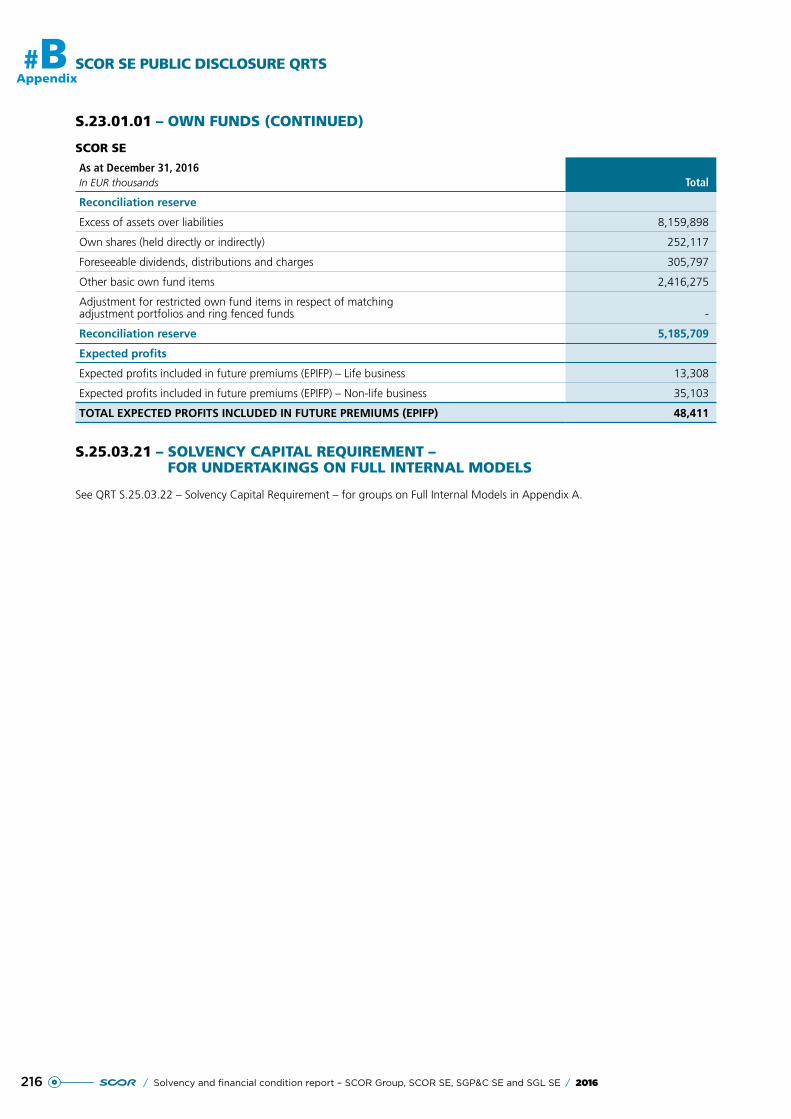
216 / Solvency and financial condition report – SCOR Group, SCOR SE, SGP&C SE and SGL SE / 2016
#BAppendix
SCOR SE PUBLIC DISCLOSURE QRTS
S.23.01.01 – OWN FUNDS (CONTINUED)
SCOR SE
As at December 31, 2016In EUR thousands Total
Reconciliation reserve
Excess of assets over liabilities 8,159,898
Own shares (held directly or indirectly) 252,117
Foreseeable dividends, distributions and charges 305,797
Other basic own fund items 2,416,275
Adjustment for restricted own fund items in respect of matching adjustment portfolios and ring fenced funds -
Reconciliation reserve 5,185,709
Expected profits
Expected profits included in future premiums (EPIFP) – Life business 13,308
Expected profits included in future premiums (EPIFP) – Non-life business 35,103
TOTAL EXPECTED PROFITS INCLUDED IN FUTURE PREMIUMS (EPIFP) 48,411
S.25.03.21 – SOLVENCY CAPITAL REQUIREMENT – FOR UNDERTAKINGS ON FULL INTERNAL MODELS
See QRT S.25.03.22 – Solvency Capital Requirement – for groups on Full Internal Models in Appendix A.
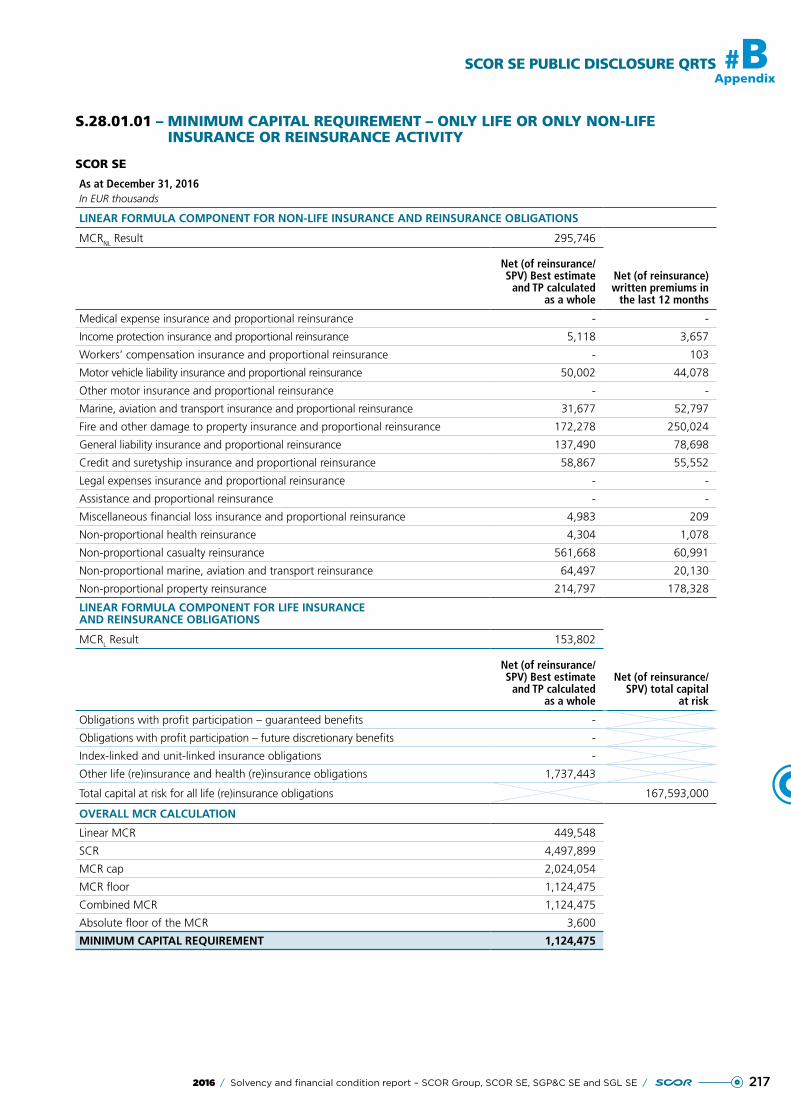
2172016 / Solvency and financial condition report – SCOR Group, SCOR SE, SGP&C SE and SGL SE /
SCOR SE PUBLIC DISCLOSURE QRTS #B
Appendix
S.28.01.01 – MINIMUM CAPITAL REQUIREMENT – ONLY LIFE OR ONLY NON-LIFE INSURANCE OR REINSURANCE ACTIVITY
SCOR SE
As at December 31, 2016In EUR thousands
LINEAR FORMULA COMPONENT FOR NON-LIFE INSURANCE AND REINSURANCE OBLIGATIONS
MCRNL Result 295,746
Net (of reinsurance/SPV) Best estimate
and TP calculated as a whole
Net (of reinsurance) written premiums in
the last 12 months
Medical expense insurance and proportional reinsurance - -
Income protection insurance and proportional reinsurance 5,118 3,657
Workers’ compensation insurance and proportional reinsurance - 103
Motor vehicle liability insurance and proportional reinsurance 50,002 44,078
Other motor insurance and proportional reinsurance - -
Marine, aviation and transport insurance and proportional reinsurance 31,677 52,797
Fire and other damage to property insurance and proportional reinsurance 172,278 250,024
General liability insurance and proportional reinsurance 137,490 78,698
Credit and suretyship insurance and proportional reinsurance 58,867 55,552
Legal expenses insurance and proportional reinsurance - -
Assistance and proportional reinsurance - -
Miscellaneous financial loss insurance and proportional reinsurance 4,983 209
Non-proportional health reinsurance 4,304 1,078
Non-proportional casualty reinsurance 561,668 60,991
Non-proportional marine, aviation and transport reinsurance 64,497 20,130
Non-proportional property reinsurance 214,797 178,328
LINEAR FORMULA COMPONENT FOR LIFE INSURANCE AND REINSURANCE OBLIGATIONS
MCRL Result 153,802
Net (of reinsurance/SPV) Best estimate
and TP calculated as a whole
Net (of reinsurance/SPV) total capital
at risk
Obligations with profit participation – guaranteed benefits -
Obligations with profit participation – future discretionary benefits -
Index-linked and unit-linked insurance obligations -
Other life (re)insurance and health (re)insurance obligations 1,737,443
Total capital at risk for all life (re)insurance obligations 167,593,000
OVERALL MCR CALCULATION
Linear MCR 449,548
SCR 4,497,899
MCR cap 2,024,054
MCR floor 1,124,475
Combined MCR 1,124,475
Absolute floor of the MCR 3,600
MINIMUM CAPITAL REQUIREMENT 1,124,475
218 / Solvency and financial condition report – SCOR Group, SCOR SE, SGP&C SE and SGL SE / 2016
SGP&C SE PUBLIC DISCLOSURE QRTS
# APPENDIX C
S.02.01.02 – Balance sheet 219
S.05.01.02 – Premiums, claims and expenses by line of business 221
S.05.01.02 – Premiums, claims and expenses by line of business 222
S.05.02.01 – Premiums, claims and expenses by country 223
S.17.01.02 – Non-life Technical Provisions 224
S.19.01.21 – Non-life Insurance Claims Information 226
S.23.01.22 – Own funds 227
S.25.03.21 – Solvency Capital Requirement – For undertakings on Full Internal Models 229
S.28.01.01 – Minimum Capital Requirement – Only Life or only Non-Life insurance or reinsurance activity 230
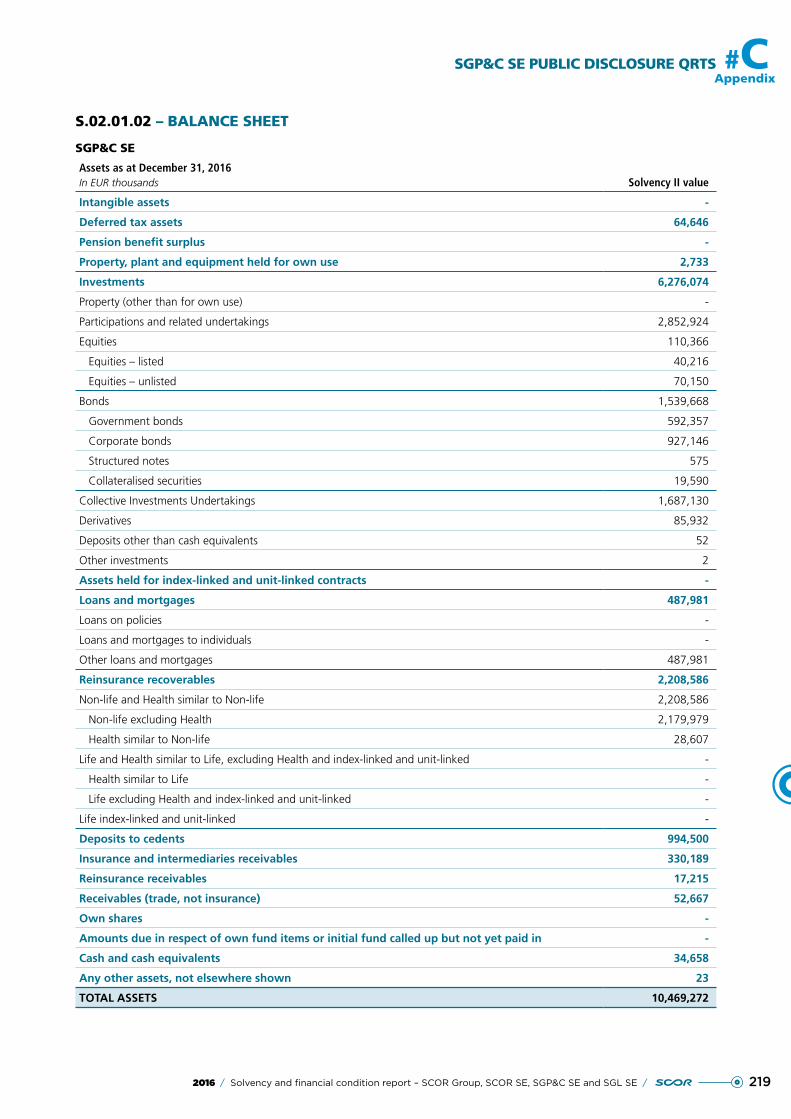
2192016 / Solvency and financial condition report – SCOR Group, SCOR SE, SGP&C SE and SGL SE /
SGP&C SE PUBLIC DISCLOSURE QRTS #CAppendix
S.02.01.02 – BALANCE SHEET
SGP&C SE
Assets as at December 31, 2016In EUR thousands Solvency II value
Intangible assets -
Deferred tax assets 64,646
Pension benefit surplus -
Property, plant and equipment held for own use 2,733
Investments 6,276,074
Property (other than for own use) -
Participations and related undertakings 2,852,924
Equities 110,366
Equities – listed 40,216
Equities – unlisted 70,150
Bonds 1,539,668
Government bonds 592,357
Corporate bonds 927,146
Structured notes 575
Collateralised securities 19,590
Collective Investments Undertakings 1,687,130
Derivatives 85,932
Deposits other than cash equivalents 52
Other investments 2
Assets held for index-linked and unit-linked contracts -
Loans and mortgages 487,981
Loans on policies -
Loans and mortgages to individuals -
Other loans and mortgages 487,981
Reinsurance recoverables 2,208,586
Non-life and Health similar to Non-life 2,208,586
Non-life excluding Health 2,179,979
Health similar to Non-life 28,607
Life and Health similar to Life, excluding Health and index-linked and unit-linked -
Health similar to Life -
Life excluding Health and index-linked and unit-linked -
Life index-linked and unit-linked -
Deposits to cedents 994,500
Insurance and intermediaries receivables 330,189
Reinsurance receivables 17,215
Receivables (trade, not insurance) 52,667
Own shares -
Amounts due in respect of own fund items or initial fund called up but not yet paid in -
Cash and cash equivalents 34,658
Any other assets, not elsewhere shown 23
TOTAL ASSETS 10,469,272
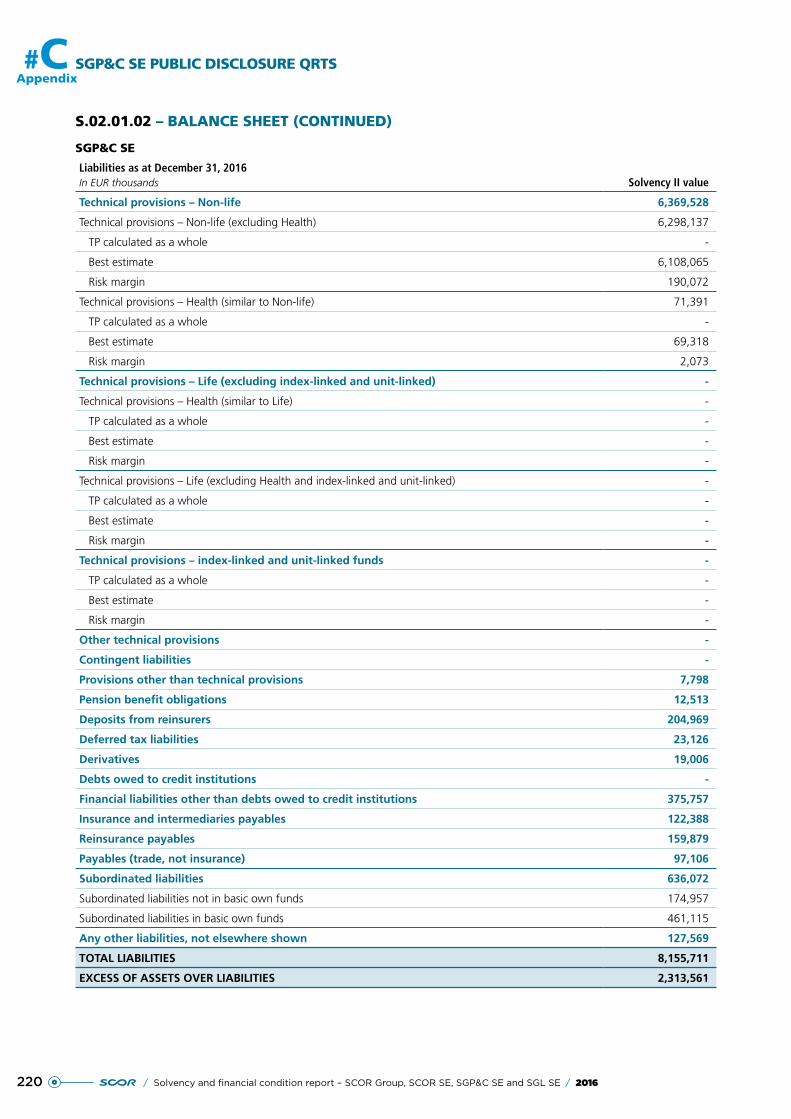
220 / Solvency and financial condition report – SCOR Group, SCOR SE, SGP&C SE and SGL SE / 2016
#C SGP&C SE PUBLIC DISCLOSURE QRTSAppendix
S.02.01.02 – BALANCE SHEET (CONTINUED)
SGP&C SE
Liabilities as at December 31, 2016In EUR thousands Solvency II value
Technical provisions – Non-life 6,369,528
Technical provisions – Non-life (excluding Health) 6,298,137
TP calculated as a whole -
Best estimate 6,108,065
Risk margin 190,072
Technical provisions – Health (similar to Non-life) 71,391
TP calculated as a whole -
Best estimate 69,318
Risk margin 2,073
Technical provisions – Life (excluding index-linked and unit-linked) -
Technical provisions – Health (similar to Life) -
TP calculated as a whole -
Best estimate -
Risk margin -
Technical provisions – Life (excluding Health and index-linked and unit-linked) -
TP calculated as a whole -
Best estimate -
Risk margin -
Technical provisions – index-linked and unit-linked funds -
TP calculated as a whole -
Best estimate -
Risk margin -
Other technical provisions -
Contingent liabilities -
Provisions other than technical provisions 7,798
Pension benefit obligations 12,513
Deposits from reinsurers 204,969
Deferred tax liabilities 23,126
Derivatives 19,006
Debts owed to credit institutions -
Financial liabilities other than debts owed to credit institutions 375,757
Insurance and intermediaries payables 122,388
Reinsurance payables 159,879
Payables (trade, not insurance) 97,106
Subordinated liabilities 636,072
Subordinated liabilities not in basic own funds 174,957
Subordinated liabilities in basic own funds 461,115
Any other liabilities, not elsewhere shown 127,569
TOTAL LIABILITIES 8,155,711
EXCESS OF ASSETS OVER LIABILITIES 2,313,561
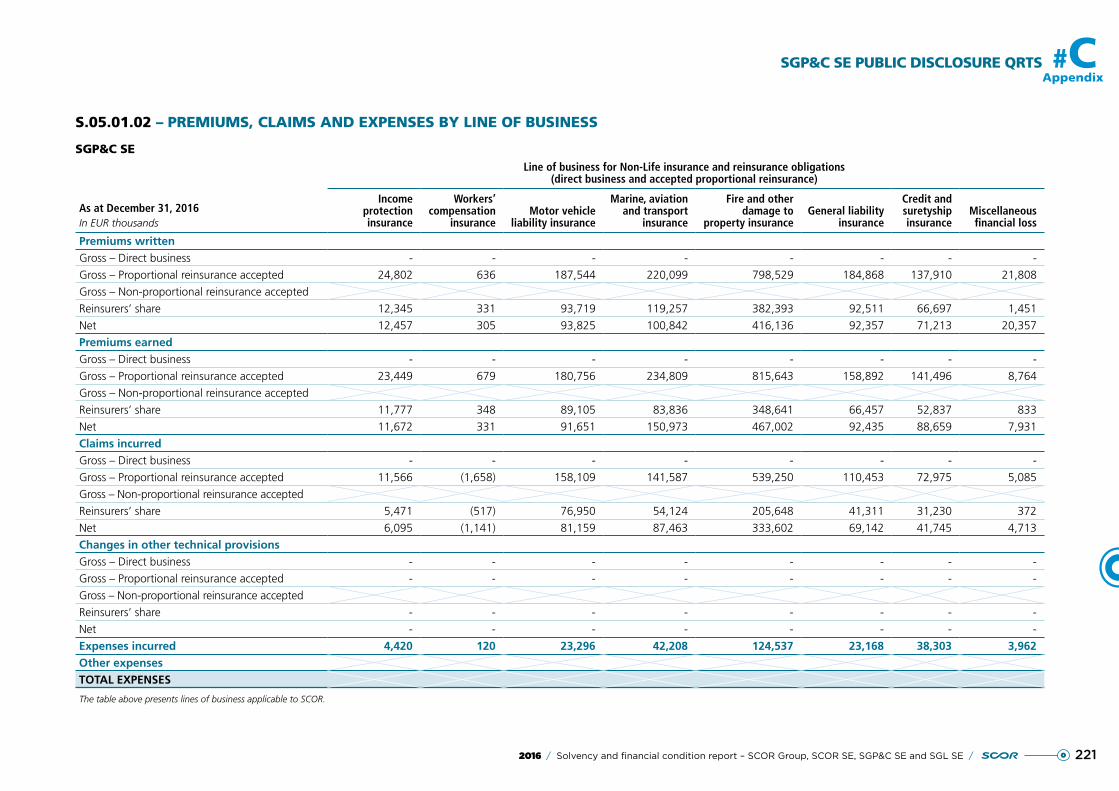
SGP&C SE PUBLIC DISCLOSURE QRTS
221
#C
2016 / Solvency and financial condition report – SCOR Group, SCOR SE, SGP&C SE and SGL SE /
Appendix
S.05.01.02 – PREMIUMS, CLAIMS AND EXPENSES BY LINE OF BUSINESS
SGP&C SE
As at December 31, 2016In EUR thousands
Line of business for Non-Life insurance and reinsurance obligations(direct business and accepted proportional reinsurance)
Income protection insurance
Workers’ compensation
insuranceMotor vehicle
liability insurance
Marine, aviation and transport
insurance
Fire and other damage to
property insuranceGeneral liability
insurance
Credit and suretyship insurance
Miscellaneous financial loss
Premiums writtenGross – Direct business - - - - - - - -
Gross – Proportional reinsurance accepted 24,802 636 187,544 220,099 798,529 184,868 137,910 21,808
Gross – Non-proportional reinsurance accepted
Reinsurers’ share 12,345 331 93,719 119,257 382,393 92,511 66,697 1,451
Net 12,457 305 93,825 100,842 416,136 92,357 71,213 20,357
Premiums earnedGross – Direct business - - - - - - - -
Gross – Proportional reinsurance accepted 23,449 679 180,756 234,809 815,643 158,892 141,496 8,764
Gross – Non-proportional reinsurance accepted
Reinsurers’ share 11,777 348 89,105 83,836 348,641 66,457 52,837 833
Net 11,672 331 91,651 150,973 467,002 92,435 88,659 7,931
Claims incurredGross – Direct business - - - - - - - -
Gross – Proportional reinsurance accepted 11,566 (1,658) 158,109 141,587 539,250 110,453 72,975 5,085
Gross – Non-proportional reinsurance accepted
Reinsurers’ share 5,471 (517) 76,950 54,124 205,648 41,311 31,230 372
Net 6,095 (1,141) 81,159 87,463 333,602 69,142 41,745 4,713
Changes in other technical provisionsGross – Direct business - - - - - - - -
Gross – Proportional reinsurance accepted - - - - - - - -
Gross – Non-proportional reinsurance accepted
Reinsurers’ share - - - - - - - -
Net - - - - - - - -
Expenses incurred 4,420 120 23,296 42,208 124,537 23,168 38,303 3,962Other expensesTOTAL EXPENSES
The table above presents lines of business applicable to SCOR.
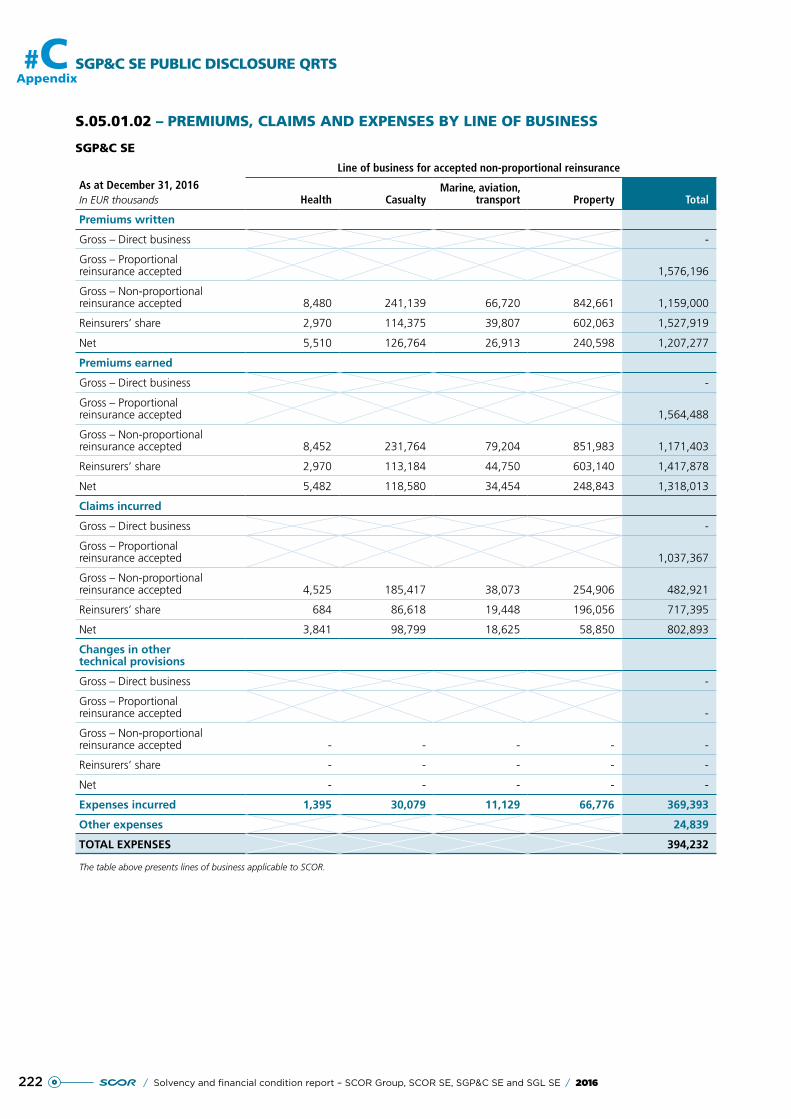
222 / Solvency and financial condition report – SCOR Group, SCOR SE, SGP&C SE and SGL SE / 2016
#C SGP&C SE PUBLIC DISCLOSURE QRTSAppendix
S.05.01.02 – PREMIUMS, CLAIMS AND EXPENSES BY LINE OF BUSINESS
SGP&C SE
As at December 31, 2016In EUR thousands
Line of business for accepted non-proportional reinsurance
Health CasualtyMarine, aviation,
transport Property Total
Premiums written
Gross – Direct business -
Gross – Proportional reinsurance accepted 1,576,196
Gross – Non-proportional reinsurance accepted 8,480 241,139 66,720 842,661 1,159,000
Reinsurers’ share 2,970 114,375 39,807 602,063 1,527,919
Net 5,510 126,764 26,913 240,598 1,207,277
Premiums earned
Gross – Direct business -
Gross – Proportional reinsurance accepted 1,564,488
Gross – Non-proportional reinsurance accepted 8,452 231,764 79,204 851,983 1,171,403
Reinsurers’ share 2,970 113,184 44,750 603,140 1,417,878
Net 5,482 118,580 34,454 248,843 1,318,013
Claims incurred
Gross – Direct business -
Gross – Proportional reinsurance accepted 1,037,367
Gross – Non-proportional reinsurance accepted 4,525 185,417 38,073 254,906 482,921
Reinsurers’ share 684 86,618 19,448 196,056 717,395
Net 3,841 98,799 18,625 58,850 802,893
Changes in other technical provisions
Gross – Direct business -
Gross – Proportional reinsurance accepted -
Gross – Non-proportional reinsurance accepted - - - - -
Reinsurers’ share - - - - -
Net - - - - -
Expenses incurred 1,395 30,079 11,129 66,776 369,393
Other expenses 24,839
TOTAL EXPENSES 394,232
The table above presents lines of business applicable to SCOR.
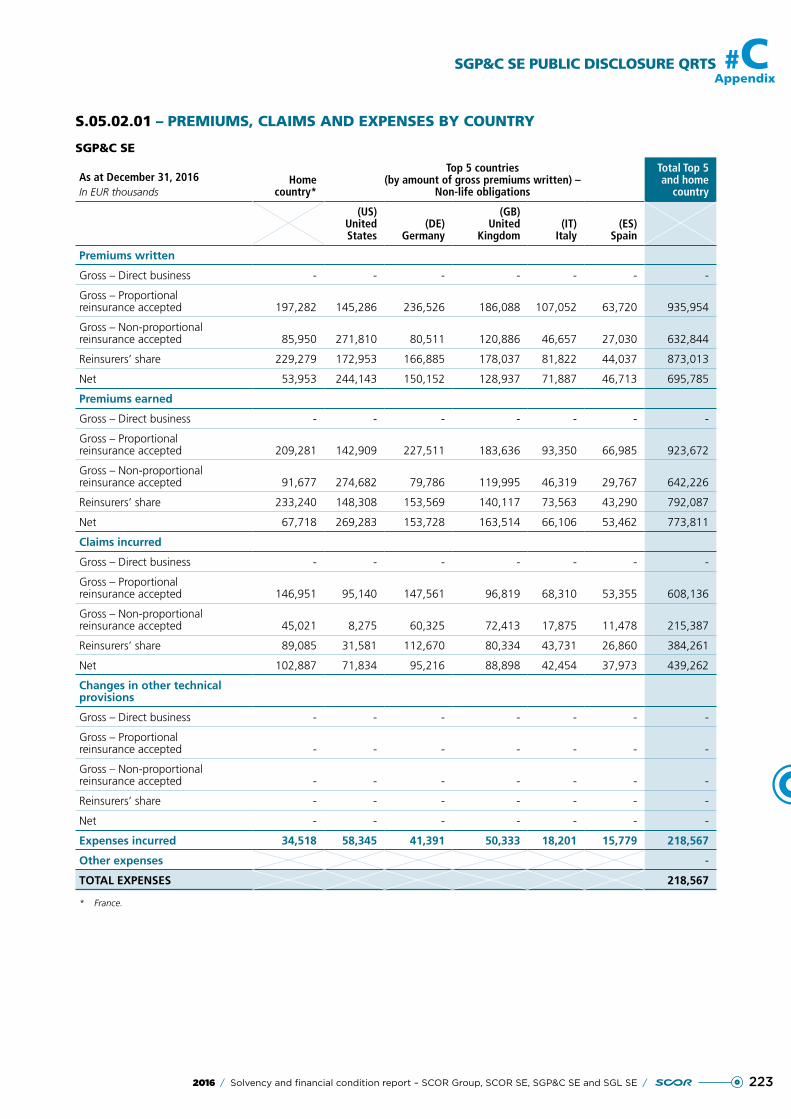
2232016 / Solvency and financial condition report – SCOR Group, SCOR SE, SGP&C SE and SGL SE /
SGP&C SE PUBLIC DISCLOSURE QRTS #CAppendix
S.05.02.01 – PREMIUMS, CLAIMS AND EXPENSES BY COUNTRY
SGP&C SE
As at December 31, 2016In EUR thousands
Homecountry*
Top 5 countries (by amount of gross premiums written) –
Non-life obligations
Total Top 5 and home
country
(US)United States
(DE)Germany
(GB)United
Kingdom(IT)
Italy(ES)
Spain
Premiums written
Gross – Direct business - - - - - - -
Gross – Proportional reinsurance accepted 197,282 145,286 236,526 186,088 107,052 63,720 935,954
Gross – Non-proportional reinsurance accepted 85,950 271,810 80,511 120,886 46,657 27,030 632,844
Reinsurers’ share 229,279 172,953 166,885 178,037 81,822 44,037 873,013
Net 53,953 244,143 150,152 128,937 71,887 46,713 695,785
Premiums earned
Gross – Direct business - - - - - - -
Gross – Proportional reinsurance accepted 209,281 142,909 227,511 183,636 93,350 66,985 923,672
Gross – Non-proportional reinsurance accepted 91,677 274,682 79,786 119,995 46,319 29,767 642,226
Reinsurers’ share 233,240 148,308 153,569 140,117 73,563 43,290 792,087
Net 67,718 269,283 153,728 163,514 66,106 53,462 773,811
Claims incurred
Gross – Direct business - - - - - - -
Gross – Proportional reinsurance accepted 146,951 95,140 147,561 96,819 68,310 53,355 608,136
Gross – Non-proportional reinsurance accepted 45,021 8,275 60,325 72,413 17,875 11,478 215,387
Reinsurers’ share 89,085 31,581 112,670 80,334 43,731 26,860 384,261
Net 102,887 71,834 95,216 88,898 42,454 37,973 439,262
Changes in other technical provisions
Gross – Direct business - - - - - - -
Gross – Proportional reinsurance accepted - - - - - - -
Gross – Non-proportional reinsurance accepted - - - - - - -
Reinsurers’ share - - - - - - -
Net - - - - - - -
Expenses incurred 34,518 58,345 41,391 50,333 18,201 15,779 218,567
Other expenses -
TOTAL EXPENSES 218,567
* France.
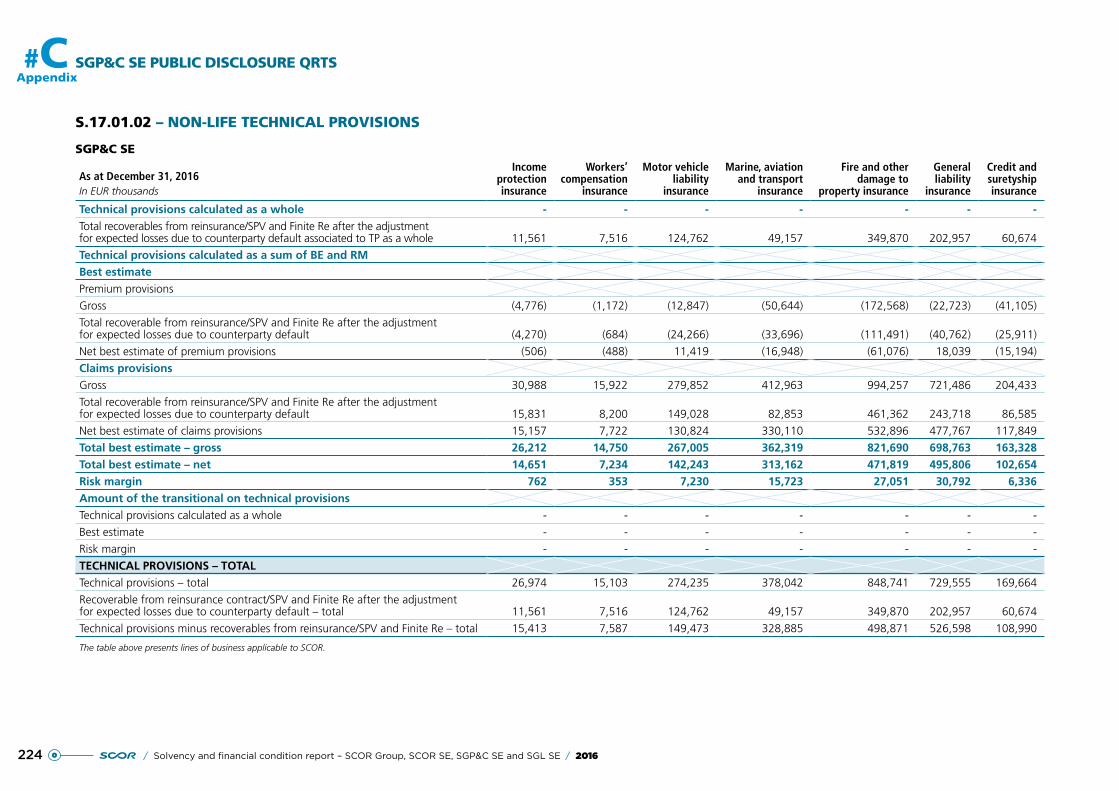
SGP&C SE PUBLIC DISCLOSURE QRTS
224
#C
/ Solvency and financial condition report – SCOR Group, SCOR SE, SGP&C SE and SGL SE / 2016
Appendix
S.17.01.02 – NON-LIFE TECHNICAL PROVISIONS
SGP&C SE
As at December 31, 2016In EUR thousands
Income protection insurance
Workers’ compensation
insurance
Motor vehicle liability
insurance
Marine, aviation and transport
insurance
Fire and other damage to
property insurance
General liability
insurance
Credit and suretyship insurance
Technical provisions calculated as a whole - - - - - - -Total recoverables from reinsurance/SPV and Finite Re after the adjustment for expected losses due to counterparty default associated to TP as a whole 11,561 7,516 124,762 49,157 349,870 202,957 60,674
Technical provisions calculated as a sum of BE and RMBest estimatePremium provisions
Gross (4,776) (1,172) (12,847) (50,644) (172,568) (22,723) (41,105)
Total recoverable from reinsurance/SPV and Finite Re after the adjustment for expected losses due to counterparty default (4,270) (684) (24,266) (33,696) (111,491) (40,762) (25,911)
Net best estimate of premium provisions (506) (488) 11,419 (16,948) (61,076) 18,039 (15,194)
Claims provisionsGross 30,988 15,922 279,852 412,963 994,257 721,486 204,433
Total recoverable from reinsurance/SPV and Finite Re after the adjustment for expected losses due to counterparty default 15,831 8,200 149,028 82,853 461,362 243,718 86,585
Net best estimate of claims provisions 15,157 7,722 130,824 330,110 532,896 477,767 117,849
Total best estimate – gross 26,212 14,750 267,005 362,319 821,690 698,763 163,328Total best estimate – net 14,651 7,234 142,243 313,162 471,819 495,806 102,654Risk margin 762 353 7,230 15,723 27,051 30,792 6,336Amount of the transitional on technical provisionsTechnical provisions calculated as a whole - - - - - - -
Best estimate - - - - - - -
Risk margin - - - - - - -
TECHNICAL PROVISIONS – TOTALTechnical provisions – total 26,974 15,103 274,235 378,042 848,741 729,555 169,664
Recoverable from reinsurance contract/SPV and Finite Re after the adjustment for expected losses due to counterparty default – total 11,561 7,516 124,762 49,157 349,870 202,957 60,674
Technical provisions minus recoverables from reinsurance/SPV and Finite Re – total 15,413 7,587 149,473 328,885 498,871 526,598 108,990
The table above presents lines of business applicable to SCOR.
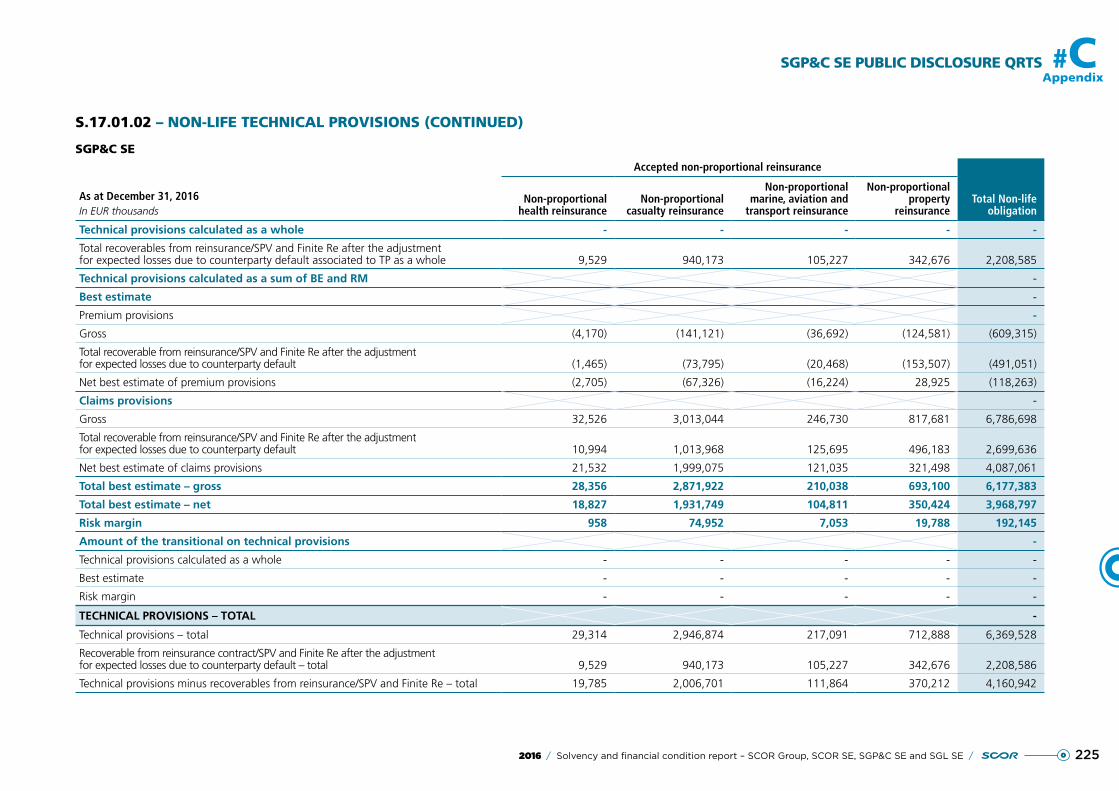
SGP&C SE PUBLIC DISCLOSURE QRTS
225
#C
2016 / Solvency and financial condition report – SCOR Group, SCOR SE, SGP&C SE and SGL SE /
Appendix
S.17.01.02 – NON-LIFE TECHNICAL PROVISIONS (CONTINUED)
SGP&C SE
As at December 31, 2016In EUR thousands
Accepted non-proportional reinsurance
Total Non-life obligation
Non-proportional health reinsurance
Non-proportional casualty reinsurance
Non-proportional marine, aviation and
transport reinsurance
Non-proportional property
reinsurance
Technical provisions calculated as a whole - - - - -
Total recoverables from reinsurance/SPV and Finite Re after the adjustment for expected losses due to counterparty default associated to TP as a whole 9,529 940,173 105,227 342,676 2,208,585
Technical provisions calculated as a sum of BE and RM -
Best estimate -
Premium provisions -
Gross (4,170) (141,121) (36,692) (124,581) (609,315)
Total recoverable from reinsurance/SPV and Finite Re after the adjustment for expected losses due to counterparty default (1,465) (73,795) (20,468) (153,507) (491,051)
Net best estimate of premium provisions (2,705) (67,326) (16,224) 28,925 (118,263)
Claims provisions -
Gross 32,526 3,013,044 246,730 817,681 6,786,698
Total recoverable from reinsurance/SPV and Finite Re after the adjustment for expected losses due to counterparty default 10,994 1,013,968 125,695 496,183 2,699,636
Net best estimate of claims provisions 21,532 1,999,075 121,035 321,498 4,087,061
Total best estimate – gross 28,356 2,871,922 210,038 693,100 6,177,383
Total best estimate – net 18,827 1,931,749 104,811 350,424 3,968,797
Risk margin 958 74,952 7,053 19,788 192,145
Amount of the transitional on technical provisions -
Technical provisions calculated as a whole - - - - -
Best estimate - - - - -
Risk margin - - - - -
TECHNICAL PROVISIONS – TOTAL -
Technical provisions – total 29,314 2,946,874 217,091 712,888 6,369,528
Recoverable from reinsurance contract/SPV and Finite Re after the adjustment for expected losses due to counterparty default – total 9,529 940,173 105,227 342,676 2,208,586
Technical provisions minus recoverables from reinsurance/SPV and Finite Re – total 19,785 2,006,701 111,864 370,212 4,160,942
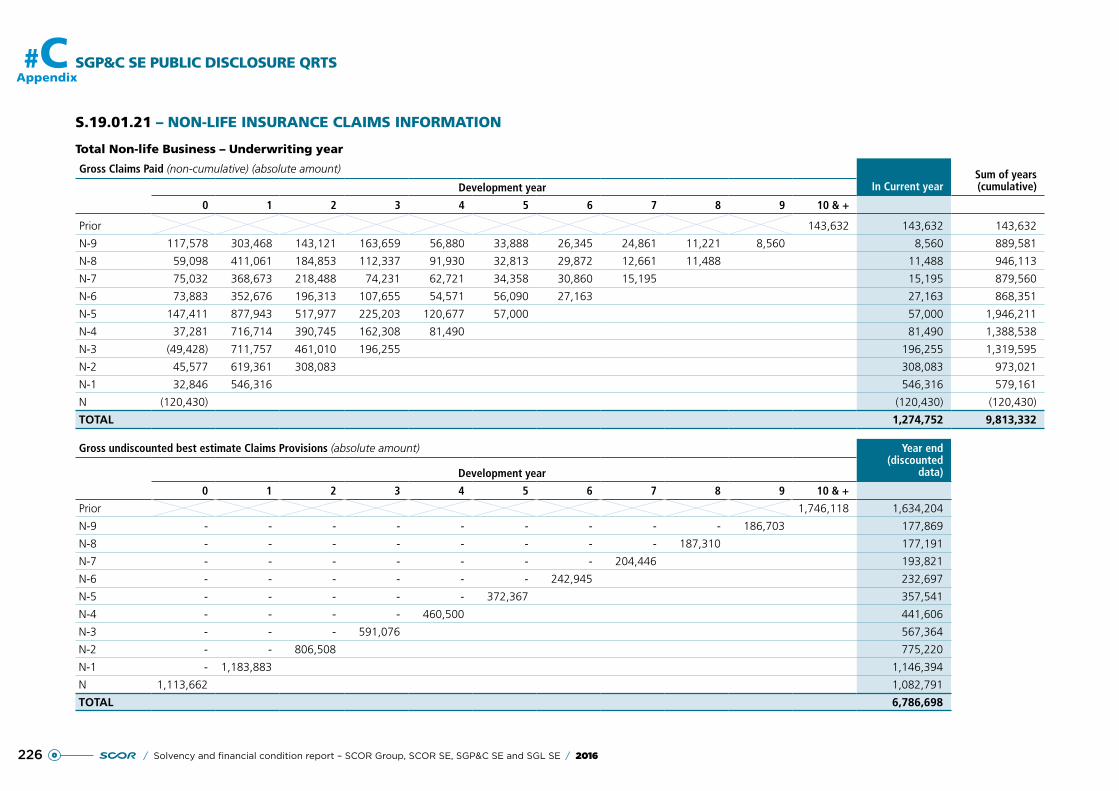
SGP&C SE PUBLIC DISCLOSURE QRTS
226
#C
/ Solvency and financial condition report – SCOR Group, SCOR SE, SGP&C SE and SGL SE / 2016
Appendix
S.19.01.21 – NON-LIFE INSURANCE CLAIMS INFORMATION
Total Non-life Business – Underwriting year
Gross Claims Paid (non-cumulative) (absolute amount)
In Current yearSum of years (cumulative)Development year
0 1 2 3 4 5 6 7 8 9 10 & +
Prior 143,632 143,632 143,632
N-9 117,578 303,468 143,121 163,659 56,880 33,888 26,345 24,861 11,221 8,560 8,560 889,581
N-8 59,098 411,061 184,853 112,337 91,930 32,813 29,872 12,661 11,488 11,488 946,113
N-7 75,032 368,673 218,488 74,231 62,721 34,358 30,860 15,195 15,195 879,560
N-6 73,883 352,676 196,313 107,655 54,571 56,090 27,163 27,163 868,351
N-5 147,411 877,943 517,977 225,203 120,677 57,000 57,000 1,946,211
N-4 37,281 716,714 390,745 162,308 81,490 81,490 1,388,538
N-3 (49,428) 711,757 461,010 196,255 196,255 1,319,595
N-2 45,577 619,361 308,083 308,083 973,021
N-1 32,846 546,316 546,316 579,161
N (120,430) (120,430) (120,430)
TOTAL 1,274,752 9,813,332
Gross undiscounted best estimate Claims Provisions (absolute amount) Year end (discounted
data)Development year
0 1 2 3 4 5 6 7 8 9 10 & +
Prior 1,746,118 1,634,204
N-9 - - - - - - - - - 186,703 177,869
N-8 - - - - - - - - 187,310 177,191
N-7 - - - - - - - 204,446 193,821
N-6 - - - - - - 242,945 232,697
N-5 - - - - - 372,367 357,541
N-4 - - - - 460,500 441,606
N-3 - - - 591,076 567,364
N-2 - - 806,508 775,220
N-1 - 1,183,883 1,146,394
N 1,113,662 1,082,791
TOTAL 6,786,698
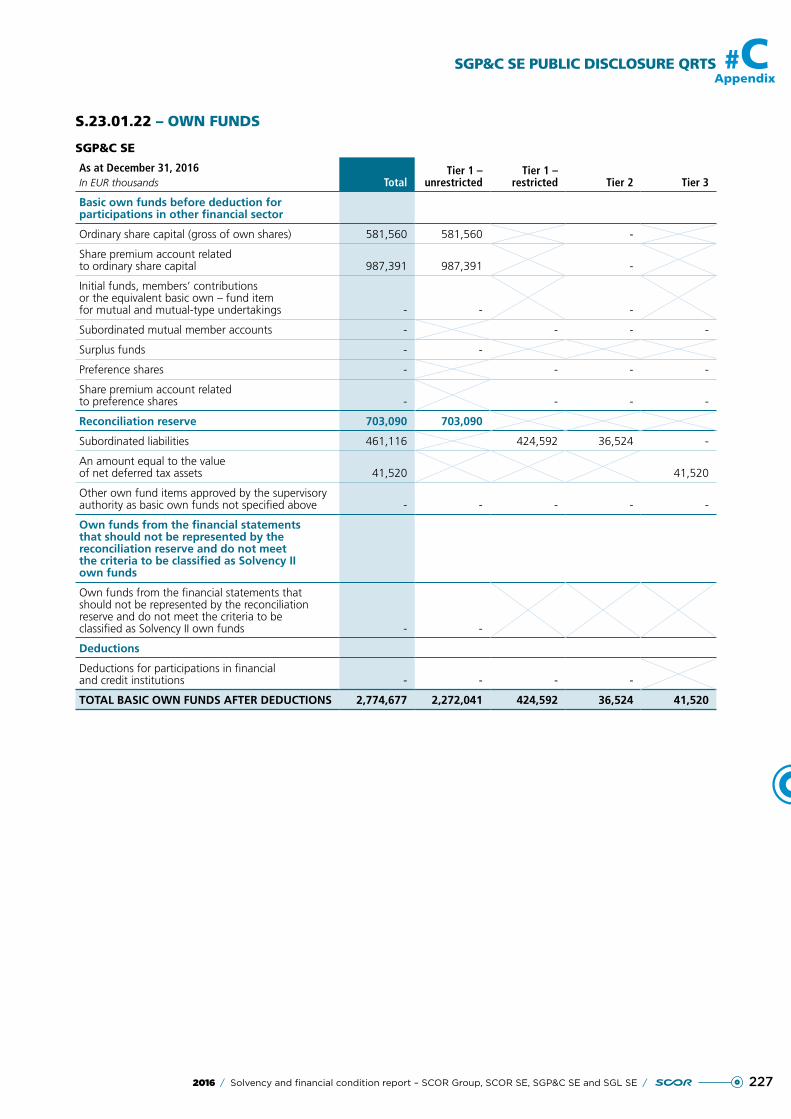
2272016 / Solvency and financial condition report – SCOR Group, SCOR SE, SGP&C SE and SGL SE /
SGP&C SE PUBLIC DISCLOSURE QRTS #CAppendix
S.23.01.22 – OWN FUNDS
SGP&C SE
As at December 31, 2016In EUR thousands Total
Tier 1 – unrestricted
Tier 1 – restricted Tier 2 Tier 3
Basic own funds before deduction for participations in other financial sector
Ordinary share capital (gross of own shares) 581,560 581,560 -
Share premium account related to ordinary share capital 987,391 987,391 -
Initial funds, members’ contributions or the equivalent basic own – fund item for mutual and mutual-type undertakings - - -
Subordinated mutual member accounts - - - -
Surplus funds - -
Preference shares - - - -
Share premium account related to preference shares - - - -
Reconciliation reserve 703,090 703,090
Subordinated liabilities 461,116 424,592 36,524 -
An amount equal to the value of net deferred tax assets 41,520 41,520
Other own fund items approved by the supervisory authority as basic own funds not specified above - - - - -
Own funds from the financial statements that should not be represented by the reconciliation reserve and do not meet the criteria to be classified as Solvency II own funds
Own funds from the financial statements that should not be represented by the reconciliation reserve and do not meet the criteria to be classified as Solvency II own funds - -
Deductions
Deductions for participations in financial and credit institutions - - - -
TOTAL BASIC OWN FUNDS AFTER DEDUCTIONS 2,774,677 2,272,041 424,592 36,524 41,520
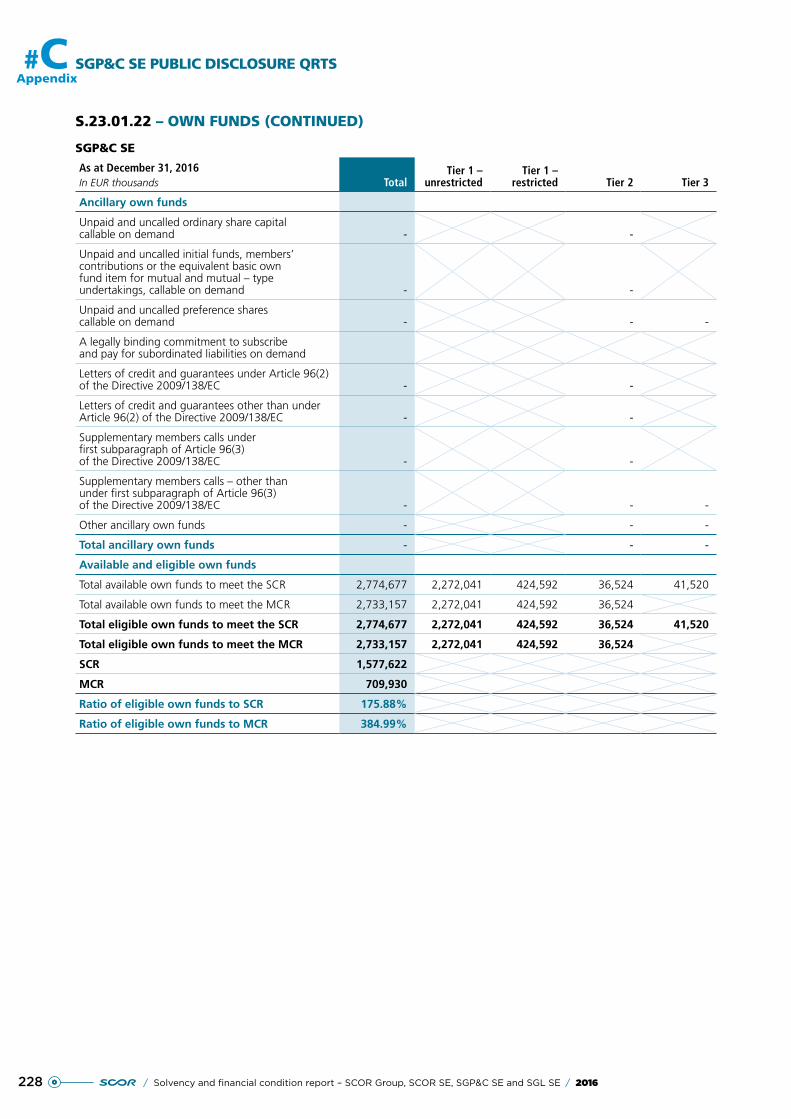
228 / Solvency and financial condition report – SCOR Group, SCOR SE, SGP&C SE and SGL SE / 2016
#C SGP&C SE PUBLIC DISCLOSURE QRTSAppendix
S.23.01.22 – OWN FUNDS (CONTINUED)
SGP&C SE
As at December 31, 2016In EUR thousands Total
Tier 1 – unrestricted
Tier 1 – restricted Tier 2 Tier 3
Ancillary own funds
Unpaid and uncalled ordinary share capital callable on demand - -
Unpaid and uncalled initial funds, members’ contributions or the equivalent basic own fund item for mutual and mutual – type undertakings, callable on demand - -
Unpaid and uncalled preference shares callable on demand - - -
A legally binding commitment to subscribe and pay for subordinated liabilities on demand
Letters of credit and guarantees under Article 96(2) of the Directive 2009/138/EC - -
Letters of credit and guarantees other than under Article 96(2) of the Directive 2009/138/EC - -
Supplementary members calls under first subparagraph of Article 96(3) of the Directive 2009/138/EC - -
Supplementary members calls – other than under first subparagraph of Article 96(3) of the Directive 2009/138/EC - - -
Other ancillary own funds - - -
Total ancillary own funds - - -
Available and eligible own funds
Total available own funds to meet the SCR 2,774,677 2,272,041 424,592 36,524 41,520
Total available own funds to meet the MCR 2,733,157 2,272,041 424,592 36,524
Total eligible own funds to meet the SCR 2,774,677 2,272,041 424,592 36,524 41,520
Total eligible own funds to meet the MCR 2,733,157 2,272,041 424,592 36,524
SCR 1,577,622
MCR 709,930
Ratio of eligible own funds to SCR 175.88%
Ratio of eligible own funds to MCR 384.99%
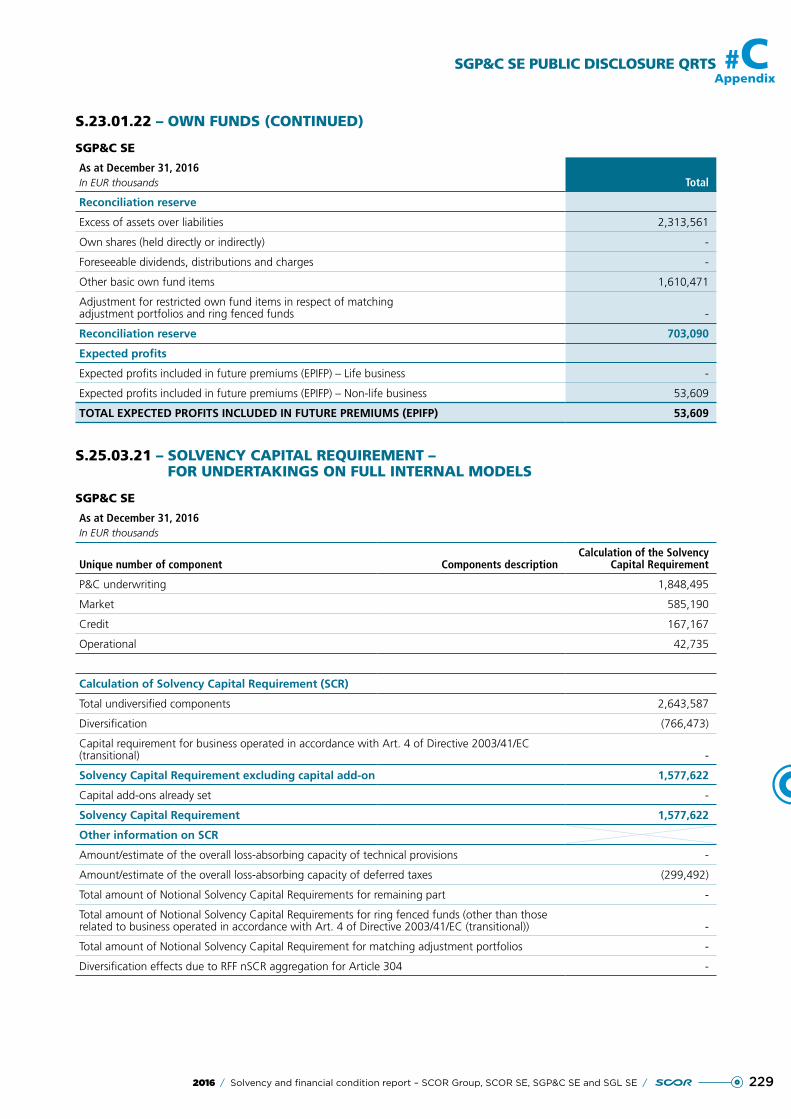
2292016 / Solvency and financial condition report – SCOR Group, SCOR SE, SGP&C SE and SGL SE /
SGP&C SE PUBLIC DISCLOSURE QRTS #CAppendix
S.23.01.22 – OWN FUNDS (CONTINUED)
SGP&C SE
As at December 31, 2016In EUR thousands Total
Reconciliation reserve
Excess of assets over liabilities 2,313,561
Own shares (held directly or indirectly) -
Foreseeable dividends, distributions and charges -
Other basic own fund items 1,610,471
Adjustment for restricted own fund items in respect of matching adjustment portfolios and ring fenced funds -
Reconciliation reserve 703,090
Expected profits
Expected profits included in future premiums (EPIFP) – Life business -
Expected profits included in future premiums (EPIFP) – Non-life business 53,609
TOTAL EXPECTED PROFITS INCLUDED IN FUTURE PREMIUMS (EPIFP) 53,609
S.25.03.21 – SOLVENCY CAPITAL REQUIREMENT – FOR UNDERTAKINGS ON FULL INTERNAL MODELS
SGP&C SE
As at December 31, 2016In EUR thousands
Unique number of component Components descriptionCalculation of the Solvency
Capital Requirement
P&C underwriting 1,848,495
Market 585,190
Credit 167,167
Operational 42,735
Calculation of Solvency Capital Requirement (SCR)
Total undiversified components 2,643,587
Diversification (766,473)
Capital requirement for business operated in accordance with Art. 4 of Directive 2003/41/EC (transitional) -
Solvency Capital Requirement excluding capital add-on 1,577,622
Capital add-ons already set -
Solvency Capital Requirement 1,577,622
Other information on SCR
Amount/estimate of the overall loss-absorbing capacity of technical provisions -
Amount/estimate of the overall loss-absorbing capacity of deferred taxes (299,492)
Total amount of Notional Solvency Capital Requirements for remaining part -
Total amount of Notional Solvency Capital Requirements for ring fenced funds (other than those related to business operated in accordance with Art. 4 of Directive 2003/41/EC (transitional)) -
Total amount of Notional Solvency Capital Requirement for matching adjustment portfolios -
Diversification effects due to RFF nSCR aggregation for Article 304 -
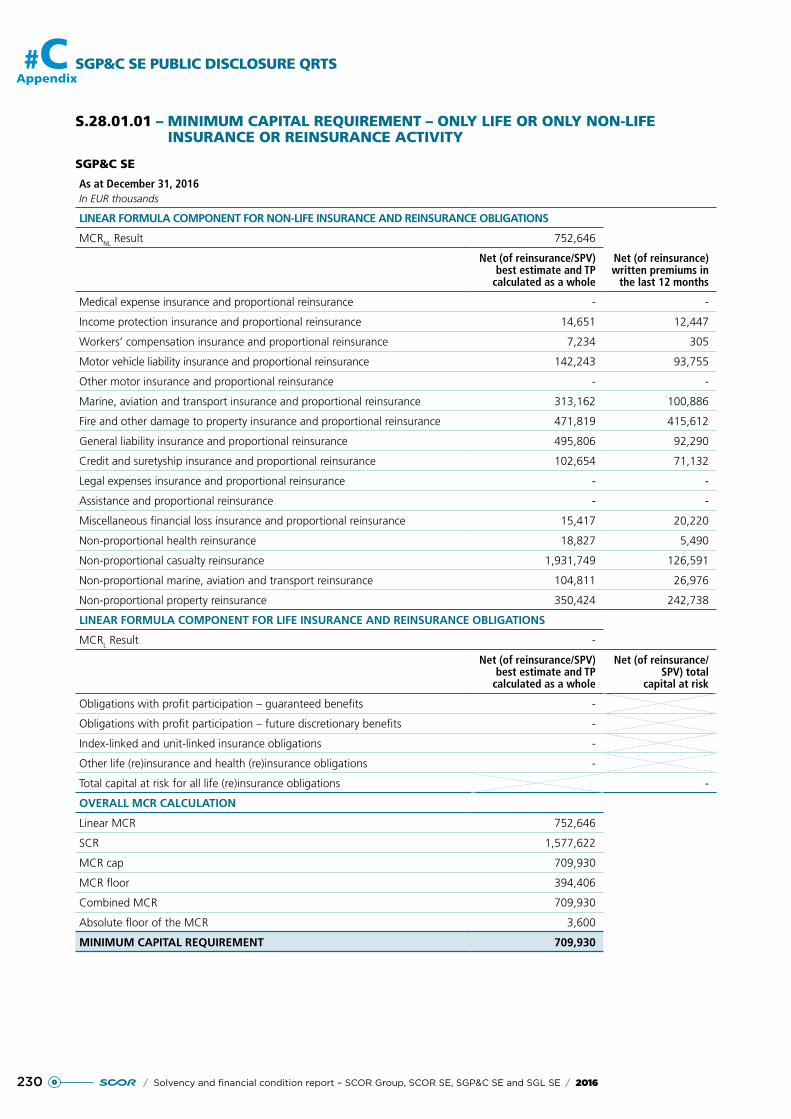
230 / Solvency and financial condition report – SCOR Group, SCOR SE, SGP&C SE and SGL SE / 2016
#C SGP&C SE PUBLIC DISCLOSURE QRTSAppendix
S.28.01.01 – MINIMUM CAPITAL REQUIREMENT – ONLY LIFE OR ONLY NON-LIFE INSURANCE OR REINSURANCE ACTIVITY
SGP&C SE
As at December 31, 2016In EUR thousands
LINEAR FORMULA COMPONENT FOR NON-LIFE INSURANCE AND REINSURANCE OBLIGATIONS
MCRNL Result 752,646
Net (of reinsurance/SPV) best estimate and TP
calculated as a whole
Net (of reinsurance) written premiums in
the last 12 months
Medical expense insurance and proportional reinsurance - -
Income protection insurance and proportional reinsurance 14,651 12,447
Workers’ compensation insurance and proportional reinsurance 7,234 305
Motor vehicle liability insurance and proportional reinsurance 142,243 93,755
Other motor insurance and proportional reinsurance - -
Marine, aviation and transport insurance and proportional reinsurance 313,162 100,886
Fire and other damage to property insurance and proportional reinsurance 471,819 415,612
General liability insurance and proportional reinsurance 495,806 92,290
Credit and suretyship insurance and proportional reinsurance 102,654 71,132
Legal expenses insurance and proportional reinsurance - -
Assistance and proportional reinsurance - -
Miscellaneous financial loss insurance and proportional reinsurance 15,417 20,220
Non-proportional health reinsurance 18,827 5,490
Non-proportional casualty reinsurance 1,931,749 126,591
Non-proportional marine, aviation and transport reinsurance 104,811 26,976
Non-proportional property reinsurance 350,424 242,738
LINEAR FORMULA COMPONENT FOR LIFE INSURANCE AND REINSURANCE OBLIGATIONS
MCRL Result -
Net (of reinsurance/SPV) best estimate and TP
calculated as a whole
Net (of reinsurance/SPV) total
capital at risk
Obligations with profit participation – guaranteed benefits -
Obligations with profit participation – future discretionary benefits -
Index-linked and unit-linked insurance obligations -
Other life (re)insurance and health (re)insurance obligations -
Total capital at risk for all life (re)insurance obligations -
OVERALL MCR CALCULATION
Linear MCR 752,646
SCR 1,577,622
MCR cap 709,930
MCR floor 394,406
Combined MCR 709,930
Absolute floor of the MCR 3,600
MINIMUM CAPITAL REQUIREMENT 709,930
2312016 / Solvency and financial condition report – SCOR Group, SCOR SE, SGP&C SE and SGL SE /
SGL SE PUBLIC DISCLOSURE QRTS
# APPENDIX D
S.02.01.02 – Balance sheet 232
S.05.01.02 – Premiums, claims and expenses by line of business 234
S.05.02.01 – Premiums, claims and expenses by country 235
S.12.01.02 – Life and Health SLT Technical Provisions 236
S.23.01.01 – Own funds 237
S.25.03.21 – Solvency Capital Requirement – For undertakings on Full Internal Models 239
S.28.01.01 – Minimum Capital Requirement – Only Life or only Non-Life insurance or reinsurance activity 240
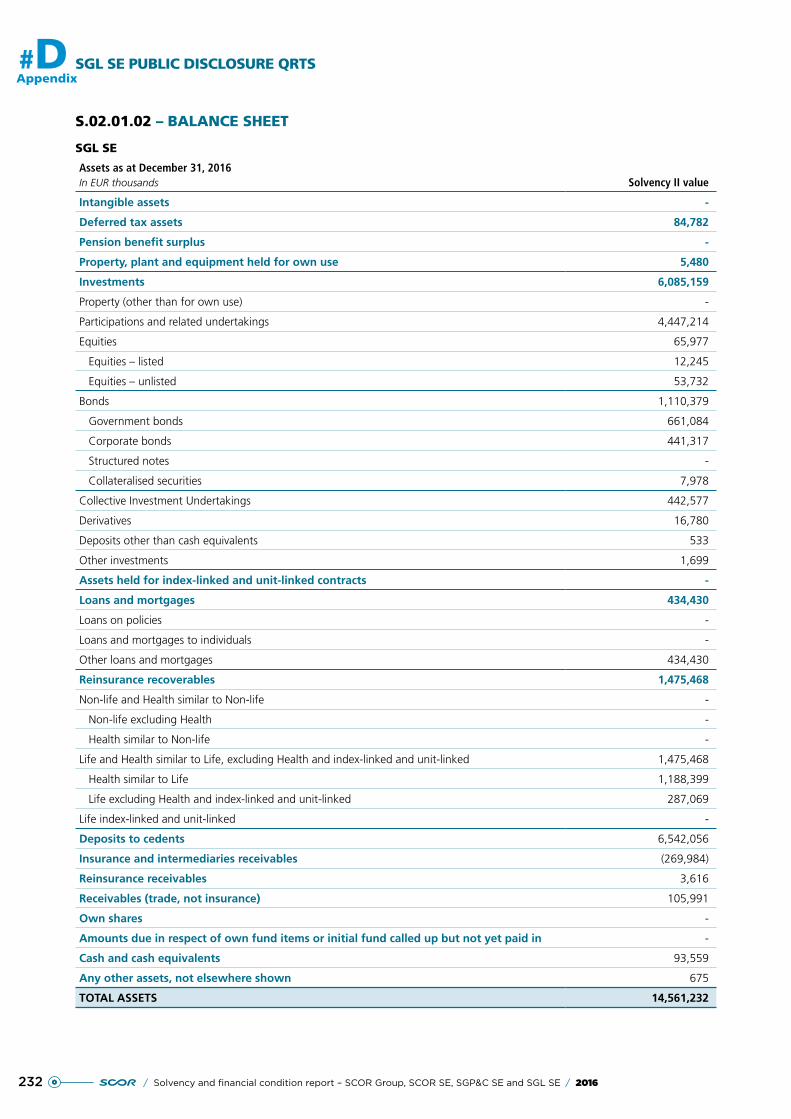
232 / Solvency and financial condition report – SCOR Group, SCOR SE, SGP&C SE and SGL SE / 2016
#DAppendix
SGL SE PUBLIC DISCLOSURE QRTS
S.02.01.02 – BALANCE SHEET
SGL SE
Assets as at December 31, 2016In EUR thousands Solvency II value
Intangible assets -
Deferred tax assets 84,782
Pension benefit surplus -
Property, plant and equipment held for own use 5,480
Investments 6,085,159
Property (other than for own use) -
Participations and related undertakings 4,447,214
Equities 65,977
Equities – listed 12,245
Equities – unlisted 53,732
Bonds 1,110,379
Government bonds 661,084
Corporate bonds 441,317
Structured notes -
Collateralised securities 7,978
Collective Investment Undertakings 442,577
Derivatives 16,780
Deposits other than cash equivalents 533
Other investments 1,699
Assets held for index-linked and unit-linked contracts -
Loans and mortgages 434,430
Loans on policies -
Loans and mortgages to individuals -
Other loans and mortgages 434,430
Reinsurance recoverables 1,475,468
Non-life and Health similar to Non-life -
Non-life excluding Health -
Health similar to Non-life -
Life and Health similar to Life, excluding Health and index-linked and unit-linked 1,475,468
Health similar to Life 1,188,399
Life excluding Health and index-linked and unit-linked 287,069
Life index-linked and unit-linked -
Deposits to cedents 6,542,056
Insurance and intermediaries receivables (269,984)
Reinsurance receivables 3,616
Receivables (trade, not insurance) 105,991
Own shares -
Amounts due in respect of own fund items or initial fund called up but not yet paid in -
Cash and cash equivalents 93,559
Any other assets, not elsewhere shown 675
TOTAL ASSETS 14,561,232
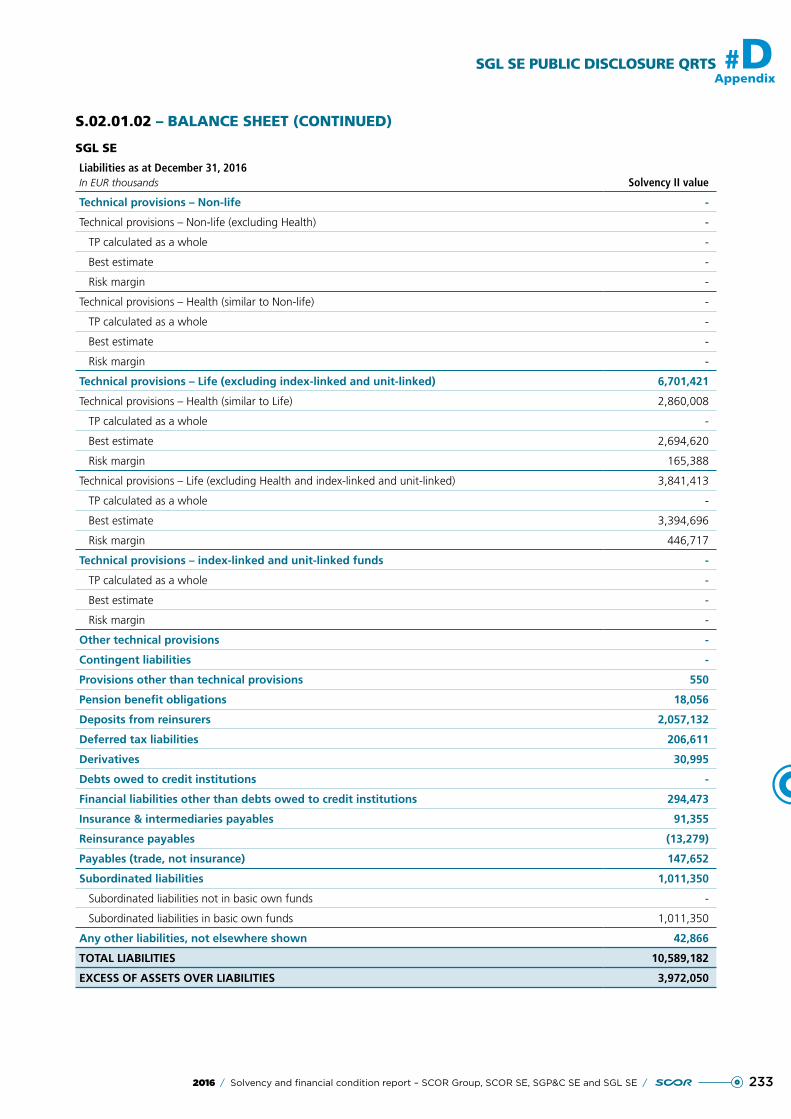
2332016 / Solvency and financial condition report – SCOR Group, SCOR SE, SGP&C SE and SGL SE /
SGL SE PUBLIC DISCLOSURE QRTS #DAppendix
S.02.01.02 – BALANCE SHEET (CONTINUED)
SGL SE
Liabilities as at December 31, 2016In EUR thousands Solvency II value
Technical provisions – Non-life -
Technical provisions – Non-life (excluding Health) -
TP calculated as a whole -
Best estimate -
Risk margin -
Technical provisions – Health (similar to Non-life) -
TP calculated as a whole -
Best estimate -
Risk margin -
Technical provisions – Life (excluding index-linked and unit-linked) 6,701,421
Technical provisions – Health (similar to Life) 2,860,008
TP calculated as a whole -
Best estimate 2,694,620
Risk margin 165,388
Technical provisions – Life (excluding Health and index-linked and unit-linked) 3,841,413
TP calculated as a whole -
Best estimate 3,394,696
Risk margin 446,717
Technical provisions – index-linked and unit-linked funds -
TP calculated as a whole -
Best estimate -
Risk margin -
Other technical provisions -
Contingent liabilities -
Provisions other than technical provisions 550
Pension benefit obligations 18,056
Deposits from reinsurers 2,057,132
Deferred tax liabilities 206,611
Derivatives 30,995
Debts owed to credit institutions -
Financial liabilities other than debts owed to credit institutions 294,473
Insurance & intermediaries payables 91,355
Reinsurance payables (13,279)
Payables (trade, not insurance) 147,652
Subordinated liabilities 1,011,350
Subordinated liabilities not in basic own funds -
Subordinated liabilities in basic own funds 1,011,350
Any other liabilities, not elsewhere shown 42,866
TOTAL LIABILITIES 10,589,182
EXCESS OF ASSETS OVER LIABILITIES 3,972,050
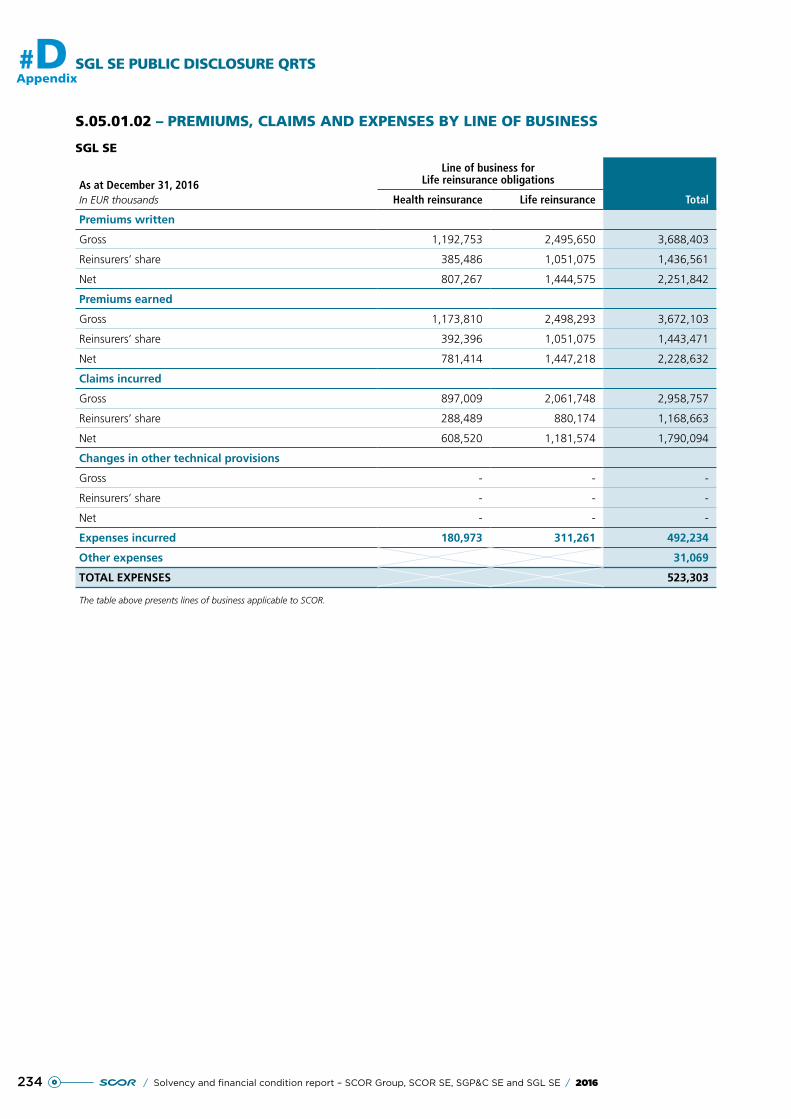
234 / Solvency and financial condition report – SCOR Group, SCOR SE, SGP&C SE and SGL SE / 2016
#DAppendix
SGL SE PUBLIC DISCLOSURE QRTS
S.05.01.02 – PREMIUMS, CLAIMS AND EXPENSES BY LINE OF BUSINESS
SGL SE
As at December 31, 2016In EUR thousands
Line of business for Life reinsurance obligations
TotalHealth reinsurance Life reinsurance
Premiums written
Gross 1,192,753 2,495,650 3,688,403
Reinsurers’ share 385,486 1,051,075 1,436,561
Net 807,267 1,444,575 2,251,842
Premiums earned
Gross 1,173,810 2,498,293 3,672,103
Reinsurers’ share 392,396 1,051,075 1,443,471
Net 781,414 1,447,218 2,228,632
Claims incurred
Gross 897,009 2,061,748 2,958,757
Reinsurers’ share 288,489 880,174 1,168,663
Net 608,520 1,181,574 1,790,094
Changes in other technical provisions
Gross - - -
Reinsurers’ share - - -
Net - - -
Expenses incurred 180,973 311,261 492,234
Other expenses 31,069
TOTAL EXPENSES 523,303
The table above presents lines of business applicable to SCOR.
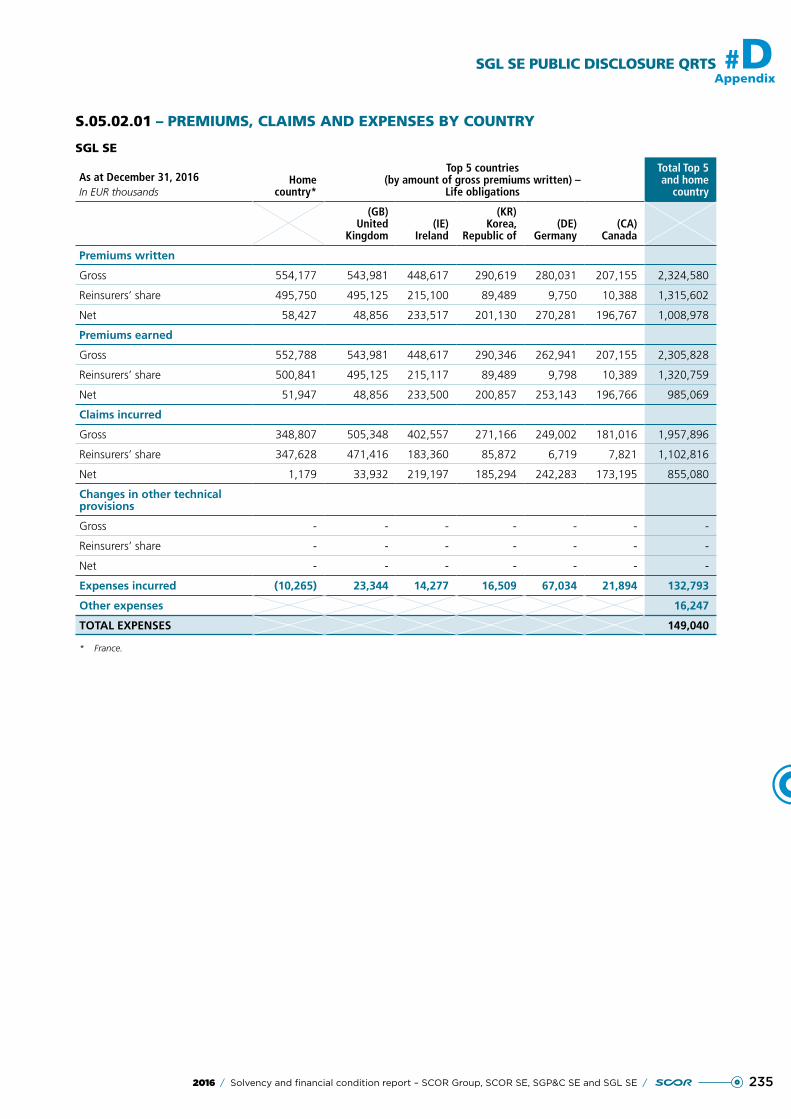
2352016 / Solvency and financial condition report – SCOR Group, SCOR SE, SGP&C SE and SGL SE /
SGL SE PUBLIC DISCLOSURE QRTS #DAppendix
S.05.02.01 – PREMIUMS, CLAIMS AND EXPENSES BY COUNTRY
SGL SE
As at December 31, 2016In EUR thousands
Home country*
Top 5 countries (by amount of gross premiums written) –
Life obligations
Total Top 5 and home
country
(GB)United
Kingdom(IE)
Ireland
(KR)Korea,
Republic of(DE)
Germany(CA)
Canada
Premiums written
Gross 554,177 543,981 448,617 290,619 280,031 207,155 2,324,580
Reinsurers’ share 495,750 495,125 215,100 89,489 9,750 10,388 1,315,602
Net 58,427 48,856 233,517 201,130 270,281 196,767 1,008,978
Premiums earned
Gross 552,788 543,981 448,617 290,346 262,941 207,155 2,305,828
Reinsurers’ share 500,841 495,125 215,117 89,489 9,798 10,389 1,320,759
Net 51,947 48,856 233,500 200,857 253,143 196,766 985,069
Claims incurred
Gross 348,807 505,348 402,557 271,166 249,002 181,016 1,957,896
Reinsurers’ share 347,628 471,416 183,360 85,872 6,719 7,821 1,102,816
Net 1,179 33,932 219,197 185,294 242,283 173,195 855,080
Changes in other technical provisions
Gross - - - - - - -
Reinsurers’ share - - - - - - -
Net - - - - - - -
Expenses incurred (10,265) 23,344 14,277 16,509 67,034 21,894 132,793
Other expenses 16,247
TOTAL EXPENSES 149,040
* France.
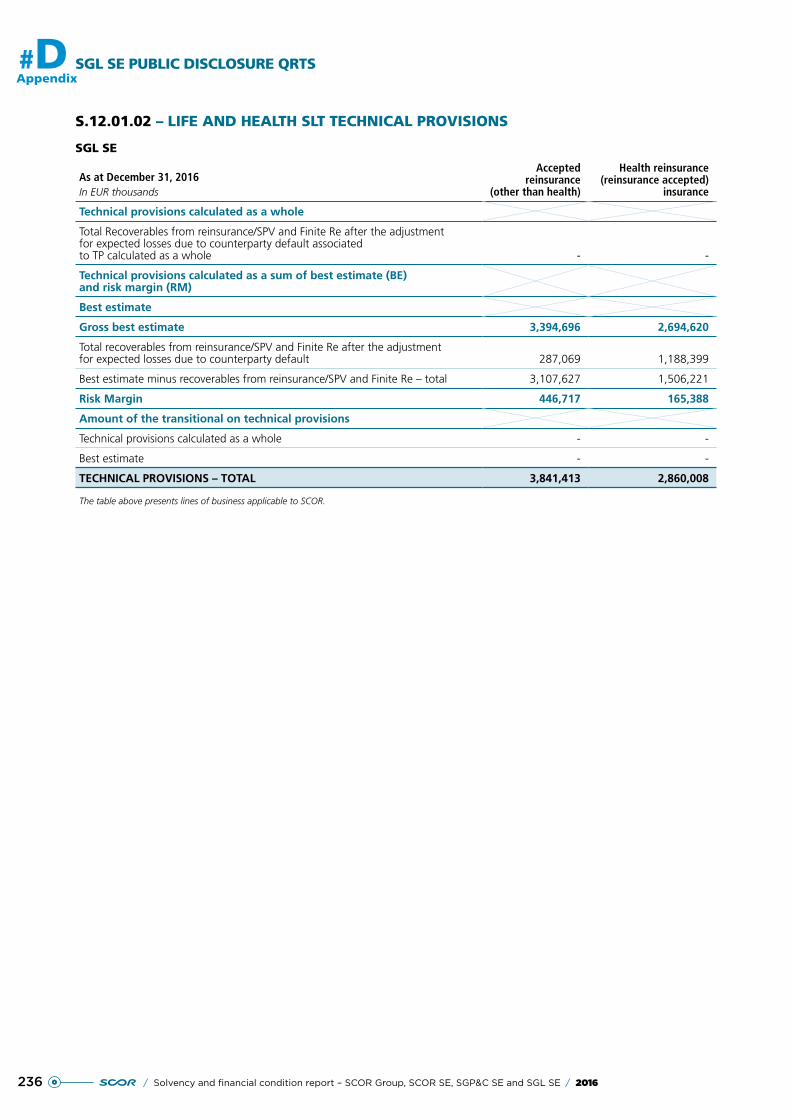
236 / Solvency and financial condition report – SCOR Group, SCOR SE, SGP&C SE and SGL SE / 2016
#DAppendix
SGL SE PUBLIC DISCLOSURE QRTS
S.12.01.02 – LIFE AND HEALTH SLT TECHNICAL PROVISIONS
SGL SE
As at December 31, 2016In EUR thousands
Accepted reinsurance
(other than health)
Health reinsurance (reinsurance accepted)
insurance
Technical provisions calculated as a whole
Total Recoverables from reinsurance/SPV and Finite Re after the adjustment for expected losses due to counterparty default associated to TP calculated as a whole - -
Technical provisions calculated as a sum of best estimate (BE) and risk margin (RM)
Best estimate
Gross best estimate 3,394,696 2,694,620
Total recoverables from reinsurance/SPV and Finite Re after the adjustment for expected losses due to counterparty default 287,069 1,188,399
Best estimate minus recoverables from reinsurance/SPV and Finite Re – total 3,107,627 1,506,221
Risk Margin 446,717 165,388
Amount of the transitional on technical provisions
Technical provisions calculated as a whole - -
Best estimate - -
TECHNICAL PROVISIONS – TOTAL 3,841,413 2,860,008
The table above presents lines of business applicable to SCOR.

2372016 / Solvency and financial condition report – SCOR Group, SCOR SE, SGP&C SE and SGL SE /
SGL SE PUBLIC DISCLOSURE QRTS #DAppendix
S.23.01.01 – OWN FUNDS
SGL SE
As at December 31, 2016In EUR thousands Total
Tier 1 – unrestricted
Tier 1 – restricted Tier 2 Tier 3
Basic own funds before deduction for participations in other financial sector
Ordinary share capital (gross of own shares) 287,040 287,040 -
Share premium account related to ordinary share capital 179,282 179,282 -
Initial funds, members’ contributions or the equivalent basic own – fund item for mutual and mutual-type undertakings - - -
Subordinated mutual member accounts - - - -
Surplus funds - -
Preference shares - - - -
Share premium account related to preference shares - - - -
Reconciliation reserve 3,505,728 3,505,728
Subordinated liabilities 1,011,350 207,823 803,527 -
An amount equal to the value of net deferred tax assets - -
Other own fund items approved by the supervisory authority as basic own funds not specified above - - - - -
Own funds from the financial statements that should not be represented by the reconciliation reserve and do not meet the criteria to be classified as Solvency II own funds
Own funds from the financial statements that should not be represented by the reconciliation reserve and do not meet the criteria to be classified as Solvency II own funds - -
Deductions
Deductions for participations in financial and credit institutions - - - -
TOTAL BASIC OWN FUNDS AFTER DEDUCTIONS 4,983,400 3,972,050 207,823 803,527 -
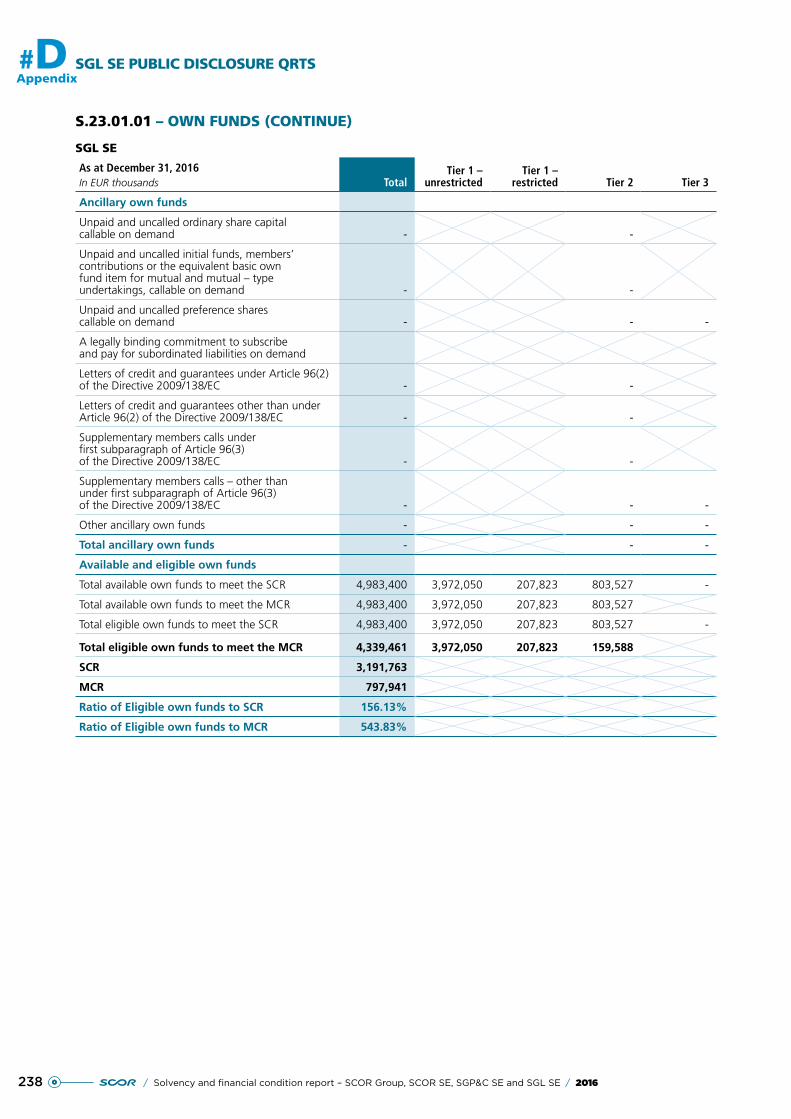
238 / Solvency and financial condition report – SCOR Group, SCOR SE, SGP&C SE and SGL SE / 2016
#DAppendix
SGL SE PUBLIC DISCLOSURE QRTS
S.23.01.01 – OWN FUNDS (CONTINUE)
SGL SE
As at December 31, 2016In EUR thousands Total
Tier 1 – unrestricted
Tier 1 – restricted Tier 2 Tier 3
Ancillary own funds
Unpaid and uncalled ordinary share capital callable on demand - -
Unpaid and uncalled initial funds, members’ contributions or the equivalent basic own fund item for mutual and mutual – type undertakings, callable on demand - -
Unpaid and uncalled preference shares callable on demand - - -
A legally binding commitment to subscribe and pay for subordinated liabilities on demand
Letters of credit and guarantees under Article 96(2) of the Directive 2009/138/EC - -
Letters of credit and guarantees other than under Article 96(2) of the Directive 2009/138/EC - -
Supplementary members calls under first subparagraph of Article 96(3) of the Directive 2009/138/EC - -
Supplementary members calls – other than under first subparagraph of Article 96(3) of the Directive 2009/138/EC - - -
Other ancillary own funds - - -
Total ancillary own funds - - -
Available and eligible own funds
Total available own funds to meet the SCR 4,983,400 3,972,050 207,823 803,527 -
Total available own funds to meet the MCR 4,983,400 3,972,050 207,823 803,527
Total eligible own funds to meet the SCR 4,983,400 3,972,050 207,823 803,527 -
Total eligible own funds to meet the MCR 4,339,461 3,972,050 207,823 159,588
SCR 3,191,763
MCR 797,941
Ratio of Eligible own funds to SCR 156.13%
Ratio of Eligible own funds to MCR 543.83%
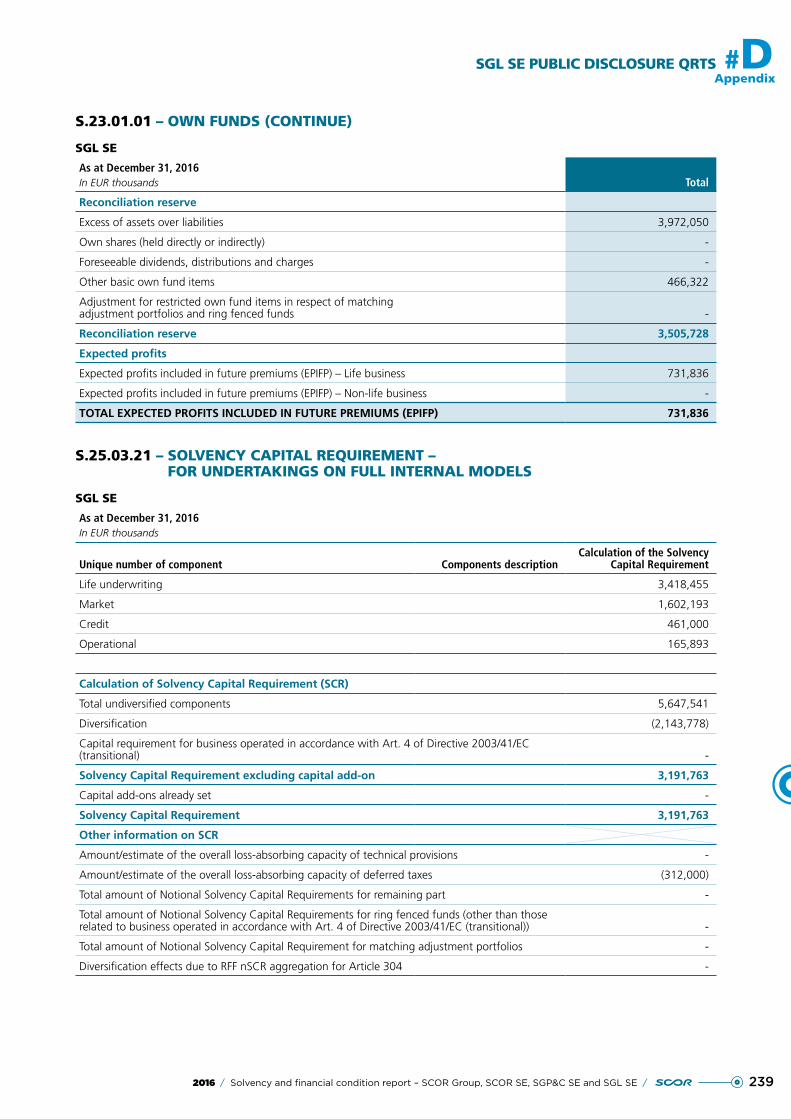
2392016 / Solvency and financial condition report – SCOR Group, SCOR SE, SGP&C SE and SGL SE /
SGL SE PUBLIC DISCLOSURE QRTS #DAppendix
S.23.01.01 – OWN FUNDS (CONTINUE)
SGL SE
As at December 31, 2016In EUR thousands Total
Reconciliation reserve
Excess of assets over liabilities 3,972,050
Own shares (held directly or indirectly) -
Foreseeable dividends, distributions and charges -
Other basic own fund items 466,322
Adjustment for restricted own fund items in respect of matching adjustment portfolios and ring fenced funds -
Reconciliation reserve 3,505,728
Expected profits
Expected profits included in future premiums (EPIFP) – Life business 731,836
Expected profits included in future premiums (EPIFP) – Non-life business -
TOTAL EXPECTED PROFITS INCLUDED IN FUTURE PREMIUMS (EPIFP) 731,836
S.25.03.21 – SOLVENCY CAPITAL REQUIREMENT – FOR UNDERTAKINGS ON FULL INTERNAL MODELS
SGL SE
As at December 31, 2016In EUR thousands
Unique number of component Components descriptionCalculation of the Solvency
Capital Requirement
Life underwriting 3,418,455
Market 1,602,193
Credit 461,000
Operational 165,893
Calculation of Solvency Capital Requirement (SCR)
Total undiversified components 5,647,541
Diversification (2,143,778)
Capital requirement for business operated in accordance with Art. 4 of Directive 2003/41/EC (transitional) -
Solvency Capital Requirement excluding capital add-on 3,191,763
Capital add-ons already set -
Solvency Capital Requirement 3,191,763
Other information on SCR
Amount/estimate of the overall loss-absorbing capacity of technical provisions -
Amount/estimate of the overall loss-absorbing capacity of deferred taxes (312,000)
Total amount of Notional Solvency Capital Requirements for remaining part -
Total amount of Notional Solvency Capital Requirements for ring fenced funds (other than those related to business operated in accordance with Art. 4 of Directive 2003/41/EC (transitional)) -
Total amount of Notional Solvency Capital Requirement for matching adjustment portfolios -
Diversification effects due to RFF nSCR aggregation for Article 304 -
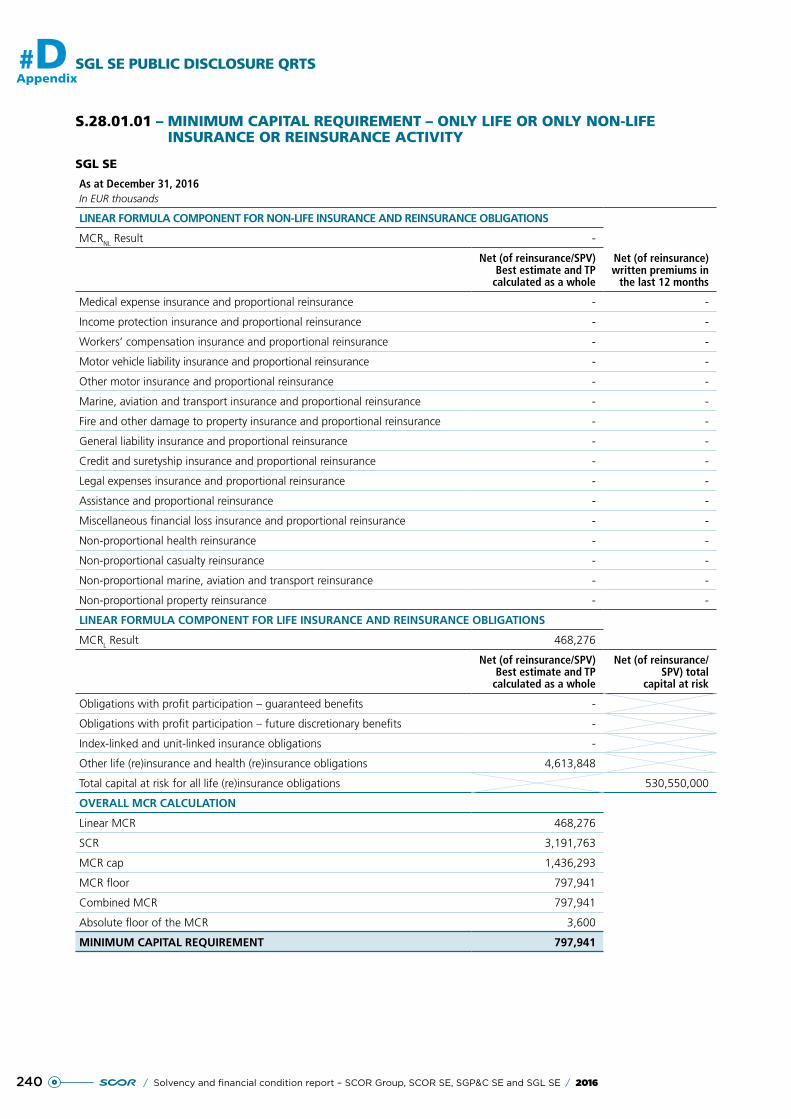
240 / Solvency and financial condition report – SCOR Group, SCOR SE, SGP&C SE and SGL SE / 2016
#DAppendix
SGL SE PUBLIC DISCLOSURE QRTS
S.28.01.01 – MINIMUM CAPITAL REQUIREMENT – ONLY LIFE OR ONLY NON-LIFE INSURANCE OR REINSURANCE ACTIVITY
SGL SE
As at December 31, 2016In EUR thousands
LINEAR FORMULA COMPONENT FOR NON-LIFE INSURANCE AND REINSURANCE OBLIGATIONS
MCRNL Result -
Net (of reinsurance/SPV) Best estimate and TP
calculated as a whole
Net (of reinsurance) written premiums in
the last 12 months
Medical expense insurance and proportional reinsurance - -
Income protection insurance and proportional reinsurance - -
Workers’ compensation insurance and proportional reinsurance - -
Motor vehicle liability insurance and proportional reinsurance - -
Other motor insurance and proportional reinsurance - -
Marine, aviation and transport insurance and proportional reinsurance - -
Fire and other damage to property insurance and proportional reinsurance - -
General liability insurance and proportional reinsurance - -
Credit and suretyship insurance and proportional reinsurance - -
Legal expenses insurance and proportional reinsurance - -
Assistance and proportional reinsurance - -
Miscellaneous financial loss insurance and proportional reinsurance - -
Non-proportional health reinsurance - -
Non-proportional casualty reinsurance - -
Non-proportional marine, aviation and transport reinsurance - -
Non-proportional property reinsurance - -
LINEAR FORMULA COMPONENT FOR LIFE INSURANCE AND REINSURANCE OBLIGATIONS
MCRL Result 468,276
Net (of reinsurance/SPV) Best estimate and TP
calculated as a whole
Net (of reinsurance/SPV) total
capital at risk
Obligations with profit participation – guaranteed benefits -
Obligations with profit participation – future discretionary benefits -
Index-linked and unit-linked insurance obligations -
Other life (re)insurance and health (re)insurance obligations 4,613,848
Total capital at risk for all life (re)insurance obligations 530,550,000
OVERALL MCR CALCULATION
Linear MCR 468,276
SCR 3,191,763
MCR cap 1,436,293
MCR floor 797,941
Combined MCR 797,941
Absolute floor of the MCR 3,600
MINIMUM CAPITAL REQUIREMENT 797,941

Design and production:
Tel.: +33 (0)1 55 32 29 74
SCOR SE5, Avenue Kléber
75795 Paris Cedex 16Tel. + 33 (0) 1 58 44 70 00 Fax + 33 (0) 1 58 44 85 00
www.scor.com
RCS Paris B 562 033 357European company
with a share capital ofEUR 1,516,589,466.80