solvency & financial condition report (sfcr) · the club is the sole owner of two reinsurance...
TRANSCRIPT
Solvency & Financial Condition Report | 1
The Shipowners’ Mutual Protection and Indemnity Association (Luxembourg)
Solvency & Financial Condition Report (SFCR)SINGLE SFCR AS AT 31 DECEMBER 2017
2 | Solvency & Financial Condition ReportSolvency & Financial Condition Report
Contents
01 Chairman’s statement
02 Summary
03 Regulatory requirements
08 System of governance
14 Riskprofile
18 Valuation for solvency purposes
23 Capital management
29 Appendices: Appendix A: Structure and governance Appendix B: Solo entity performance Appendix C: Quantitative reporting templates
Solvency & Financial Condition Report | 01
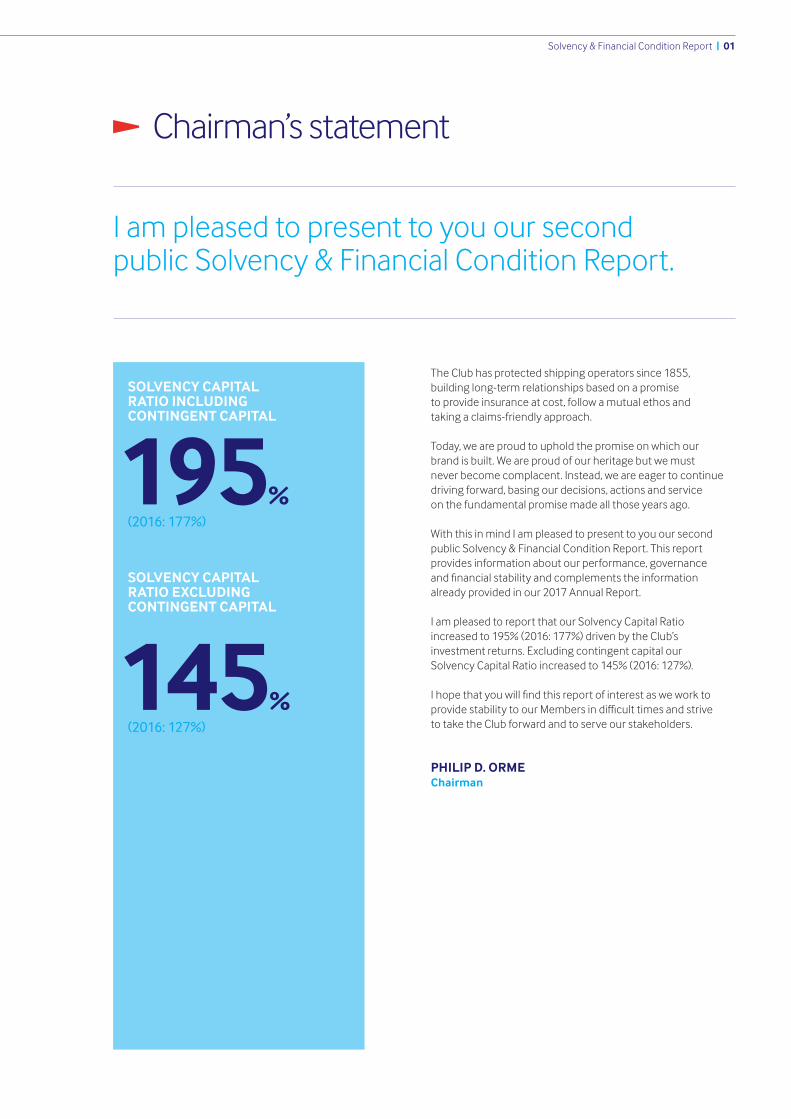
The Club has protected shipping operators since 1855, building long-term relationships based on a promise to provide insurance at cost, follow a mutual ethos and taking a claims-friendly approach.
Today, we are proud to uphold the promise on which our brand is built. We are proud of our heritage but we must never become complacent. Instead, we are eager to continue driving forward, basing our decisions, actions and service on the fundamental promise made all those years ago.
With this in mind I am pleased to present to you our second public Solvency & Financial Condition Report. This report provides information about our performance, governance andfinancialstabilityandcomplementstheinformationalready provided in our 2017 Annual Report.
I am pleased to report that our Solvency Capital Ratio increased to 195% (2016: 177%) driven by the Club’s investment returns. Excluding contingent capital our Solvency Capital Ratio increased to 145% (2016: 127%).
IhopethatyouwillfindthisreportofinterestasweworktoprovidestabilitytoourMembersindifficulttimesandstrive to take the Club forward and to serve our stakeholders.
PHILIP D. ORMEChairman
I am pleased to present to you our second public Solvency & Financial Condition Report.
SOLVENCY CAPITAL RATIO INCLUDING CONTINGENT CAPITAL
195%(2016: 177%)
SOLVENCY CAPITAL RATIO EXCLUDING CONTINGENT CAPITAL
145%(2016: 127%)
Chairman’s statement
02 | Solvency & Financial Condition Report
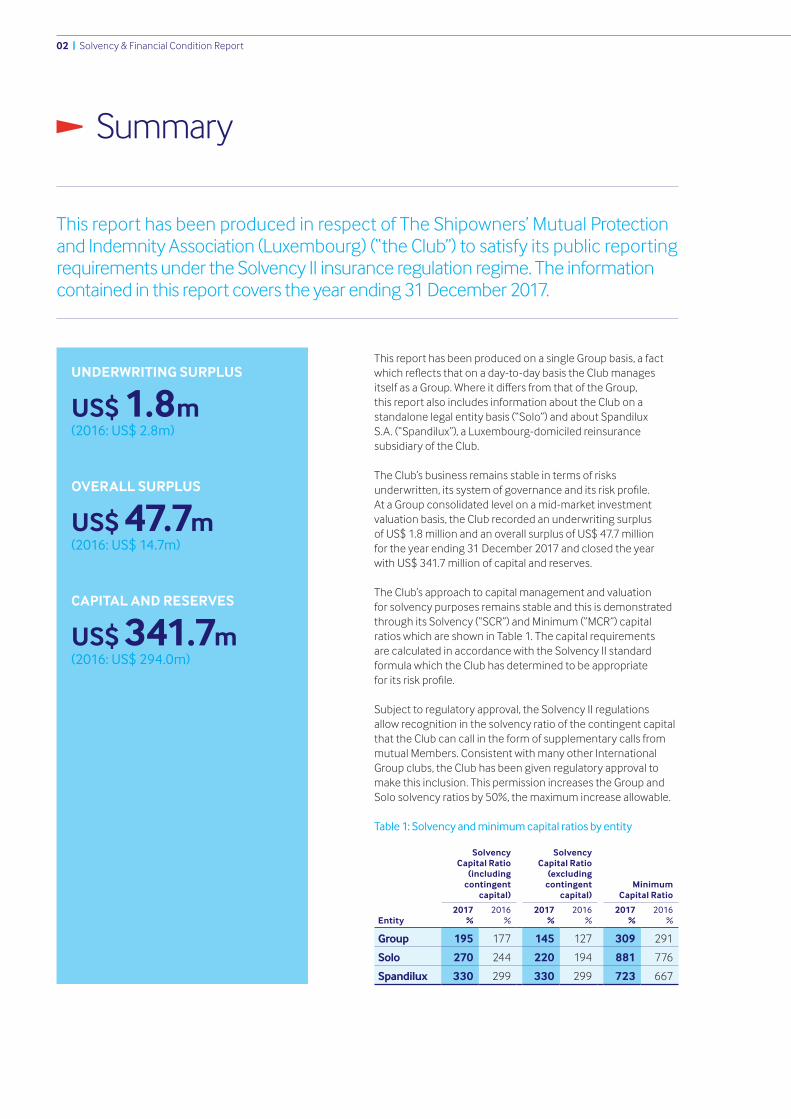
This report has been produced in respect of The Shipowners’ Mutual Protection and Indemnity Association (Luxembourg) (“the Club”) to satisfy its public reporting requirements under the Solvency II insurance regulation regime. The information contained in this report covers the year ending 31 December 2017.
This report has been produced on a single Group basis, a fact whichreflectsthatonaday-to-daybasistheClubmanagesitselfasaGroup.WhereitdiffersfromthatoftheGroup, this report also includes information about the Club on a standalone legal entity basis (“Solo”) and about Spandilux S.A. (“Spandilux”), a Luxembourg-domiciled reinsurance subsidiary of the Club.
The Club’s business remains stable in terms of risks underwritten,itssystemofgovernanceanditsriskprofile. At a Group consolidated level on a mid-market investment valuation basis, the Club recorded an underwriting surplus of US$ 1.8 million and an overall surplus of US$ 47.7 million for the year ending 31 December 2017 and closed the year with US$ 341.7 million of capital and reserves.
The Club’s approach to capital management and valuation for solvency purposes remains stable and this is demonstrated through its Solvency (“SCR”) and Minimum (“MCR”) capital ratios which are shown in Table 1. The capital requirements are calculated in accordance with the Solvency II standard formula which the Club has determined to be appropriate foritsriskprofile.
Subject to regulatory approval, the Solvency II regulations allow recognition in the solvency ratio of the contingent capital that the Club can call in the form of supplementary calls from mutual Members. Consistent with many other International Group clubs, the Club has been given regulatory approval to make this inclusion. This permission increases the Group and Solo solvency ratios by 50%, the maximum increase allowable.
Table 1: Solvency and minimum capital ratios by entity
Entity
Solvency Capital Ratio
(including contingent
capital)
Solvency Capital Ratio
(excluding contingent
capital)Minimum
Capital Ratio
2017%
2016%
2017%
2016%
2017%
2016%
Group 195 177 145 127 309 291
Solo 270 244 220 194 881 776
Spandilux 330 299 330 299 723 667
UNDERWRITING SURPLUS
US$ 1.8m(2016: US$ 2.8m)
OVERALL SURPLUS
US$ 47.7m(2016: US$ 14.7m)
CAPITAL AND RESERVES
US$ 341.7m(2016: US$ 294.0m)
Summary
Solvency & Financial Condition Report | 03
This report has been produced to satisfy the relevant articles of the Solvency II Directive1 and supporting Commission Delegated2 regulation as incorporated into the Luxembourg Insurance Law of 7 December 20153.
The information contained in this report has been approved by the Club Board in accordance with its public disclosure reporting policy.
Unlessstatedotherwise,allfiguresshowninthisreportare inUS$millions.Individualfigureshavebeenroundedandthismayresultinroundingdifferencesintablesoffiguresshown.
1 Directive 2009/138/EC of the European Parliament and of the Council of 25 November 2009 on the taking-up and pursuit of the business of Insurance and Reinsurance (Solvency II).
2 Commission Delegated Regulation (EU) 2015/35 of 10 October 2014 supplementing Directive 2009/138/EC of the European Parliament and of the Council on the taking-up and pursuit of the business of Insurance and Reinsurance (Solvency II).
3 http://legilux.public.lu/eli/etat/leg/loi/2015/12/07/n1/jo4 Articles 306-311 of Commission Delegated Regulation (EU) 2015/35.
THIS REPORT INCLUDES SECTIONS COVERING THE FIVE REQUIRED AREAS AS FOLLOWS4:
BUSINESS AND PERFORMANCE
SYSTEM OF GOVERNANCE
RISK PROFILE
VALUATION FOR SOLVENCY PURPOSES
CAPITAL MANAGEMENT
Regulatory requirements
04 | Solvency & Financial Condition Report
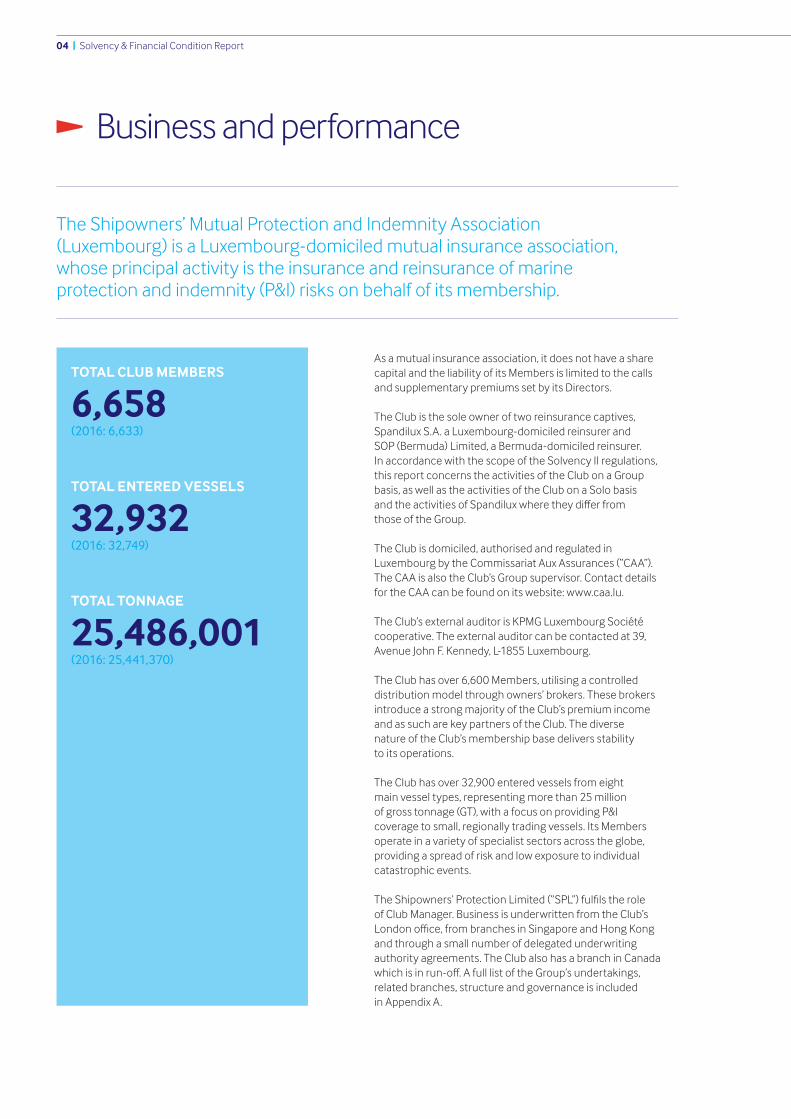
As a mutual insurance association, it does not have a share capital and the liability of its Members is limited to the calls and supplementary premiums set by its Directors.
The Club is the sole owner of two reinsurance captives, Spandilux S.A. a Luxembourg-domiciled reinsurer and SOP (Bermuda) Limited, a Bermuda-domiciled reinsurer. In accordance with the scope of the Solvency II regulations, this report concerns the activities of the Club on a Group basis, as well as the activities of the Club on a Solo basis andtheactivitiesofSpandiluxwheretheydifferfrom those of the Group.
The Club is domiciled, authorised and regulated in Luxembourg by the Commissariat Aux Assurances (“CAA”). The CAA is also the Club’s Group supervisor. Contact details for the CAA can be found on its website: www.caa.lu.
The Club’s external auditor is KPMG Luxembourg Société cooperative. The external auditor can be contacted at 39, Avenue John F. Kennedy, L-1855 Luxembourg.
The Club has over 6,600 Members, utilising a controlled distribution model through owners’ brokers. These brokers introduce a strong majority of the Club’s premium income and as such are key partners of the Club. The diverse nature of the Club’s membership base delivers stability to its operations.
The Club has over 32,900 entered vessels from eight main vessel types, representing more than 25 million of gross tonnage (GT), with a focus on providing P&I coverage to small, regionally trading vessels. Its Members operate in a variety of specialist sectors across the globe, providing a spread of risk and low exposure to individual catastrophic events.
TheShipowners’ProtectionLimited(“SPL”)fulfilstherole of Club Manager. Business is underwritten from the Club’s Londonoffice,frombranchesinSingaporeandHongKong and through a small number of delegated underwriting authority agreements. The Club also has a branch in Canada whichisinrun-off.AfulllistoftheGroup’sundertakings, related branches, structure and governance is included in Appendix A.
The Shipowners’ Mutual Protection and Indemnity Association (Luxembourg) is a Luxembourg-domiciled mutual insurance association, whose principal activity is the insurance and reinsurance of marine protection and indemnity (P&I) risks on behalf of its membership.
TOTAL CLUB MEMBERS
6,658(2016: 6,633)
TOTAL ENTERED VESSELS
32,932(2016: 32,749)
TOTAL TONNAGE
25,486,001(2016: 25,441,370)
Business and performance
Solvency & Financial Condition Report | 05
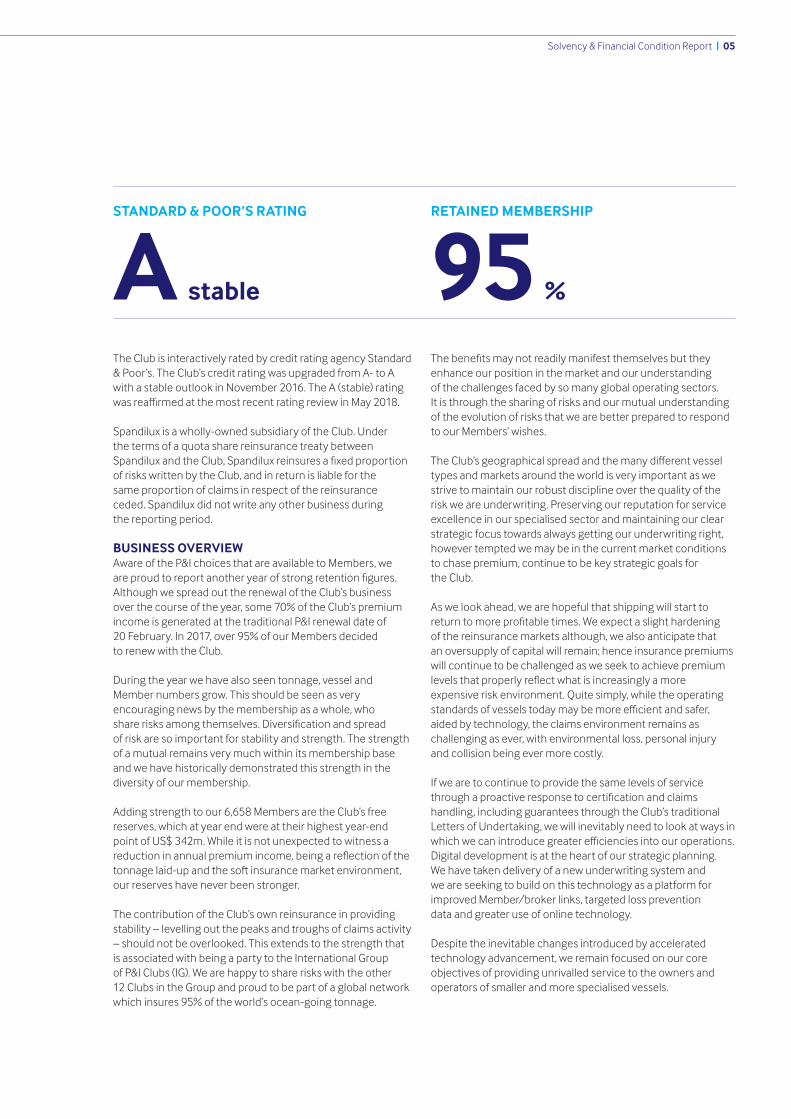
The Club is interactively rated by credit rating agency Standard & Poor’s. The Club’s credit rating was upgraded from A- to A with a stable outlook in November 2016. The A (stable) rating wasreaffirmedatthemostrecentratingreviewinMay2018.
Spandilux is a wholly-owned subsidiary of the Club. Under the terms of a quota share reinsurance treaty between SpandiluxandtheClub,Spandiluxreinsuresafixedproportionof risks written by the Club, and in return is liable for the same proportion of claims in respect of the reinsurance ceded. Spandilux did not write any other business during the reporting period.
BUSINESS OVERVIEWAware of the P&I choices that are available to Members, we areproudtoreportanotheryearofstrongretentionfigures.Although we spread out the renewal of the Club’s business over the course of the year, some 70% of the Club’s premium income is generated at the traditional P&I renewal date of 20 February.In2017,over95%ofourMembersdecided to renew with the Club.
During the year we have also seen tonnage, vessel and Member numbers grow. This should be seen as very encouraging news by the membership as a whole, who sharerisksamongthemselves.Diversificationandspread of risk are so important for stability and strength. The strength of a mutual remains very much within its membership base and we have historically demonstrated this strength in the diversity of our membership.
Adding strength to our 6,658 Members are the Club’s free reserves, which at year end were at their highest year-end point of US$ 342m. While it is not unexpected to witness a reductioninannualpremiumincome,beingareflectionofthetonnagelaid-upandthesoftinsurancemarketenvironment,our reserves have never been stronger.
The contribution of the Club’s own reinsurance in providing stability – levelling out the peaks and troughs of claims activity – should not be overlooked. This extends to the strength that is associated with being a party to the International Group of P&I Clubs (IG). We are happy to share risks with the other 12 Clubs in the Group and proud to be part of a global network which insures 95% of the world’s ocean-going tonnage.
Thebenefitsmaynotreadilymanifestthemselvesbuttheyenhance our position in the market and our understanding of the challenges faced by so many global operating sectors. It is through the sharing of risks and our mutual understanding of the evolution of risks that we are better prepared to respond to our Members’ wishes.
TheClub’sgeographicalspreadandthemanydifferentvesseltypes and markets around the world is very important as we strive to maintain our robust discipline over the quality of the risk we are underwriting. Preserving our reputation for service excellence in our specialised sector and maintaining our clear strategic focus towards always getting our underwriting right, however tempted we may be in the current market conditions to chase premium, continue to be key strategic goals for the Club.
As we look ahead, we are hopeful that shipping will start to returntomoreprofitabletimes.Weexpectaslighthardening of the reinsurance markets although, we also anticipate that an oversupply of capital will remain; hence insurance premiums will continue to be challenged as we seek to achieve premium levelsthatproperlyreflectwhatisincreasinglyamoreexpensive risk environment. Quite simply, while the operating standardsofvesselstodaymaybemoreefficientandsafer,aided by technology, the claims environment remains as challenging as ever, with environmental loss, personal injury and collision being ever more costly.
If we are to continue to provide the same levels of service throughaproactiveresponsetocertificationandclaimshandling, including guarantees through the Club’s traditional Letters of Undertaking, we will inevitably need to look at ways in whichwecanintroducegreaterefficienciesintoouroperations.Digital development is at the heart of our strategic planning. We have taken delivery of a new underwriting system and we are seeking to build on this technology as a platform for improved Member/broker links, targeted loss prevention data and greater use of online technology.
Despite the inevitable changes introduced by accelerated technology advancement, we remain focused on our core objectives of providing unrivalled service to the owners and operators of smaller and more specialised vessels.
STANDARD & POOR’S RATING
A stable
RETAINED MEMBERSHIP
95 %
06 | Solvency & Financial Condition Report
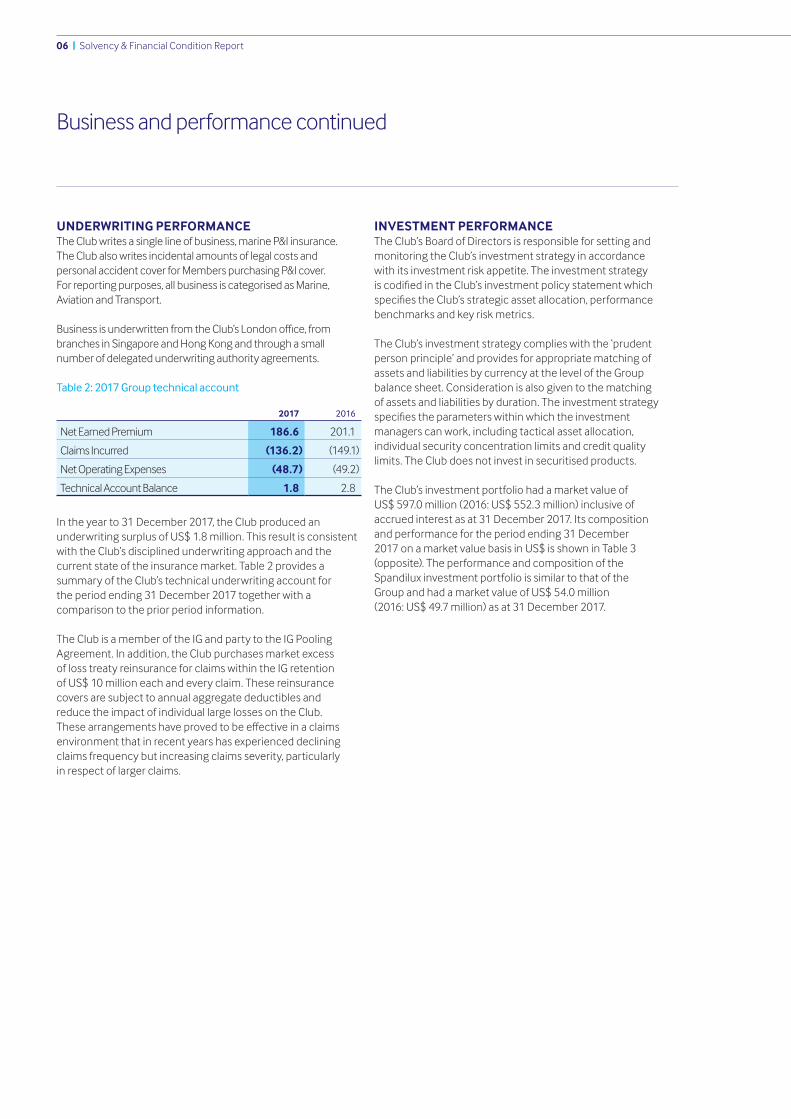
UNDERWRITING PERFORMANCEThe Club writes a single line of business, marine P&I insurance. The Club also writes incidental amounts of legal costs and personal accident cover for Members purchasing P&I cover. For reporting purposes, all business is categorised as Marine, Aviation and Transport.
BusinessisunderwrittenfromtheClub’sLondonoffice,frombranchesinSingaporeandHongKongandthroughasmallnumber of delegated underwriting authority agreements.
Table 2: 2017 Group technical account
2017 2016
Net Earned Premium 186.6 201.1
Claims Incurred (136.2) (149.1)
Net Operating Expenses (48.7) (49.2)
Technical Account Balance 1.8 2.8
In the year to 31 December 2017, the Club produced an underwriting surplus of US$ 1.8 million. This result is consistent with the Club’s disciplined underwriting approach and the current state of the insurance market. Table 2 provides a summary of the Club’s technical underwriting account for the period ending 31 December 2017 together with a comparison to the prior period information.
The Club is a member of the IG and party to the IG Pooling Agreement. In addition, the Club purchases market excess of loss treaty reinsurance for claims within the IG retention of US$ 10 million each and every claim. These reinsurance covers are subject to annual aggregate deductibles and reduce the impact of individual large losses on the Club. Thesearrangementshaveprovedtobeeffectiveinaclaimsenvironment that in recent years has experienced declining claims frequency but increasing claims severity, particularly in respect of larger claims.
INVESTMENT PERFORMANCEThe Club’s Board of Directors is responsible for setting and monitoring the Club’s investment strategy in accordance with its investment risk appetite. The investment strategy iscodifiedintheClub’sinvestmentpolicystatementwhichspecifiestheClub’sstrategicassetallocation,performancebenchmarks and key risk metrics.
The Club’s investment strategy complies with the ‘prudent person principle’ and provides for appropriate matching of assets and liabilities by currency at the level of the Group balance sheet. Consideration is also given to the matching of assets and liabilities by duration. The investment strategy specifiestheparameterswithinwhichtheinvestmentmanagers can work, including tactical asset allocation, individual security concentration limits and credit quality limits. The Club does not invest in securitised products.
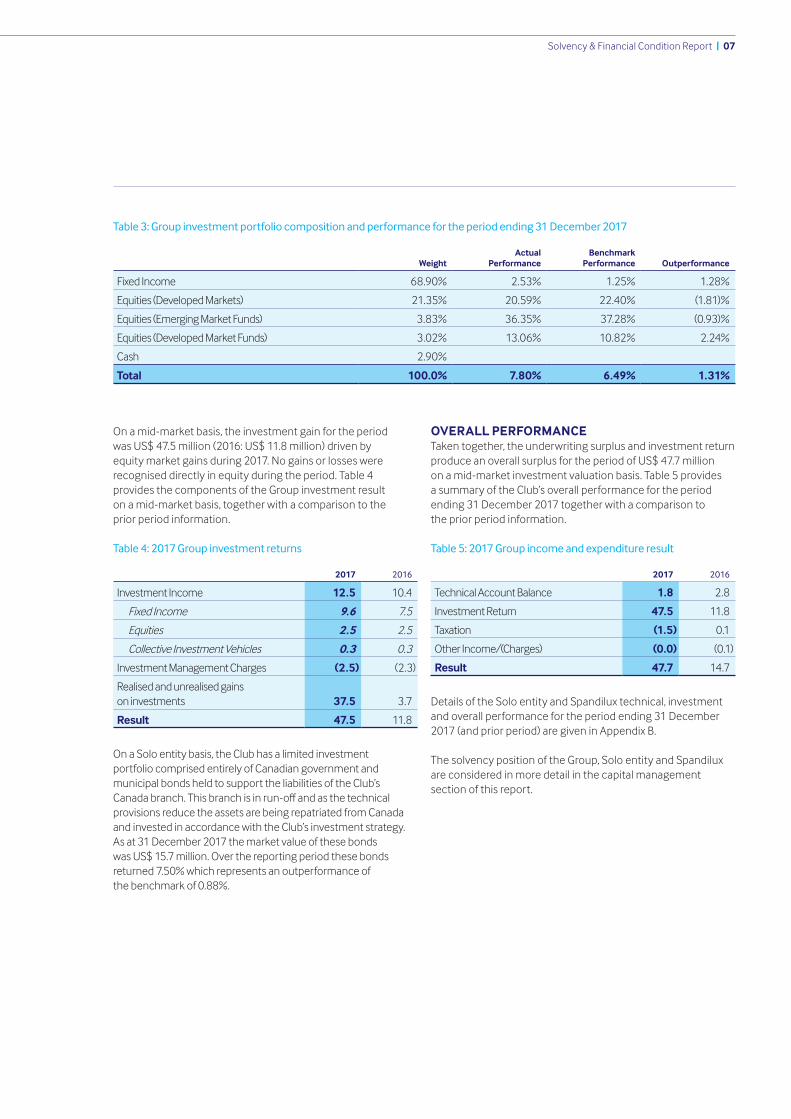
The Club’s investment portfolio had a market value of US$ 597.0 million (2016: US$ 552.3 million) inclusive of accrued interest as at 31 December 2017. Its composition and performance for the period ending 31 December 2017 on a market value basis in US$ is shown in Table 3 (opposite). The performance and composition of the Spandilux investment portfolio is similar to that of the Group and had a market value of US$ 54.0 million (2016: US$ 49.7 million) as at 31 December 2017.
Business and performance continued
Solvency & Financial Condition Report | 07
Table 3: Group investment portfolio composition and performance for the period ending 31 December 2017
WeightActual
PerformanceBenchmark
Performance Outperformance
Fixed Income 68.90% 2.53% 1.25% 1.28%
Equities (Developed Markets) 21.35% 20.59% 22.40% (1.81)%
Equities (Emerging Market Funds) 3.83% 36.35% 37.28% (0.93)%
Equities (Developed Market Funds) 3.02% 13.06% 10.82% 2.24%
Cash 2.90%
Total 100.0% 7.80% 6.49% 1.31%
On a mid-market basis, the investment gain for the period was US$ 47.5 million (2016: US$ 11.8 million) driven by equity market gains during 2017. No gains or losses were recognised directly in equity during the period. Table 4 provides the components of the Group investment result on a mid-market basis, together with a comparison to the prior period information.
Table 4: 2017 Group investment returns
2017 2016
Investment Income 12.5 10.4
Fixed Income 9.6 7.5
Equities 2.5 2.5
Collective Investment Vehicles 0.3 0.3
Investment Management Charges (2.5) (2.3)
Realised and unrealised gains on investments 37.5 3.7
Result 47.5 11.8
On a Solo entity basis, the Club has a limited investment portfolio comprised entirely of Canadian government and municipal bonds held to support the liabilities of the Club’s Canadabranch.Thisbranchisinrun-offandasthetechnicalprovisions reduce the assets are being repatriated from Canada and invested in accordance with the Club’s investment strategy. As at 31 December 2017 the market value of these bonds was US$ 15.7 million. Over the reporting period these bonds returned 7.50% which represents an outperformance of the benchmark of 0.88%.
OVERALL PERFORMANCETaken together, the underwriting surplus and investment return produce an overall surplus for the period of US$ 47.7 million on a mid-market investment valuation basis. Table 5 provides a summary of the Club’s overall performance for the period ending 31 December 2017 together with a comparison to the prior period information.
Table 5: 2017 Group income and expenditure result
2017 2016
Technical Account Balance 1.8 2.8
Investment Return 47.5 11.8
Taxation (1.5) 0.1
Other Income/(Charges) (0.0) (0.1)
Result 47.7 14.7
Details of the Solo entity and Spandilux technical, investment and overall performance for the period ending 31 December 2017 (and prior period) are given in Appendix B.
The solvency position of the Group, Solo entity and Spandilux are considered in more detail in the capital management section of this report.
08 | Solvency & Financial Condition Report
THE ROLE OF THE BOARDThe role of the Board is to direct the high level strategy of the Club on the basis of recommendations from the Club’s Managers. The Board does so by receiving regular reports from the Managers at the quarterly Board meetings on the developmentoftheClub’sbusinessandfinances,onthe basis of which it is able to make informed decisions.
Board activities are supported by three Board committees covering Finance, Remuneration and Audit & Risk, with each committee reporting back to the Board. Spandilux is governed by a separate board of non-executive directors while the three Board committees meet on behalf of both the Club and its subsidiary companies.
The agendas of the Board itself, and those of its Committees which report back to the Board, cover a full range of governance issues during the course of a year in accordance withaspecifiedmatrixofactivities.Thisensuresthatthe key risks associated with the management of the Club are regularly monitored and reviewed and that appropriate steps are taken to address them.
There have been no material changes to the system of governance and no material transactions with persons who exercisesignificantinfluenceovertheCluboritssubsidiariesduring the reporting period. The Club considers its system of governance to be appropriate to the nature, scale and complexity of its operations given the risks it faces in the course of doing business.
System of governance
BOARD COMPOSITIONTwelve of the non-executive directors are drawn from the Club’s membership and provide broad representation by geographical regionandvesseltype,aswellasspecificfunctionalandoperational expertise. Two of the non-executive directors bringspecificskills,experienceandexpertisetotheBoard in the areas of investments and reinsurance.
The Spandilux board is comprised of four NEDs including oneNEDwhobringsspecificskills,experienceandexpertise to the Board in respect of investments.
TheClub’sLuxembourgofficeisresponsibleforthecorporatesecretariat functions of the Club under the direction of the Club’s general manager.
CLUB MANAGEMENTThe Club is managed on a day-to-day basis by SPL, which in similar fashion to a number of other IG clubs is a wholly owned subsidiary of the Club, under a management services agreement which describes the responsibilities of each party. SPL is governed by its own board of executive directors that meets on an at least quarterly basis.
SPL provides day-to-day insurance company management services including the required key Solvency II functions, namely Actuarial, Compliance, Internal Audit and Risk Management. Under this agreement the key functions, each led by a SPL Director, have the necessary authority, resources and operational independence to carry out their tasks and report on them to both the SPL and Club Board. Responsibility for the Club’s investments is retained by the Club Board.
The Club’s governance map and organisational chart provide a pictorial representation of the information described above (see Appendix A). The Club’s key functions and their roles and responsibilities are described later in this report.
The Club is governed in accordance with its governance charter and subject to its constitution by a board of 14 non-executive directors (“NEDs”) that meets on a quarterly basis.
Solvency & Financial Condition Report | 09
REMUNERATIONRemuneration and reward is overseen by the Remuneration Committee of the Board. Non-executive directors are remuneratedonafixedfeebasisforresponsibilities undertaken and Board and Committee meetings attended. The level of fees payable is reviewed every three years by the Remuneration Committee.
The Club’s remuneration policy is underpinned by ten core remuneration principles which are set out in its remuneration policy. The approach to remuneration is consistent with the Club’s risk appetite and includes appropriate governance and controls. The Club’s remuneration practices do not encourage anyconflictsofinterest,potentialmisconductorrisktaking that is excessive in view of the management strategy.
FIT AND PROPER REQUIREMENTS
Club BoardIn order to ensure that it can discharge its collective responsibility the Board has an established training and competency framework that seeks to develop the contribution that Directors individually make to the Board’s collective responsibility for the good governance of the Club. This frameworkcoversgeneralandspecificexpectationsthatNEDs are expected to meet in a range of areas that include governance, oversight, controls, risk management, regulatory requirements,financialanalysisandcontrol,businessstrategyand the broader market and business environment.
Directors are elected to the Board for a term of three-years, afterwhichtheymustbere-electedtoserveasubsequentterm. The Board has an agreed process whereby Directors self-assess their own contribution and understanding against an agreed set of competencies. Over the term of their appointment, each NED meets with the Club Chairman to consider the self-assessment results and identify any areasforspecificindividualdevelopment.
The training and competency framework encourages the development of expertise at Board level. It is also relevant to the re-election process for Directors and to the appointment of new Directors.
In addition to training and competency requirements, NEDs are subject to the obligations set out in the Club’s Governance Charterwhichcoversconflictsofinterestandbusinessethicsrules. Notwithstanding that NEDs are drawn principally from the membership, and may have individual interests as Members, in their role as NEDs they represent the Members as a whole and make decisions solely in the Club’s interest and independently of any personal or membership interest.
Club ManagersAs Club Manager, SPL has procedures in place to ensurethatindividualsinkeypositionsofinfluenceandresponsibilityarefitandproperandcompetenttoexecutetheirassignedresponsibilities.Whereapplicable,assessmentsoffitnessandpropriety are made as part of the recruitment process and on an annual basis as part of the performance review process.
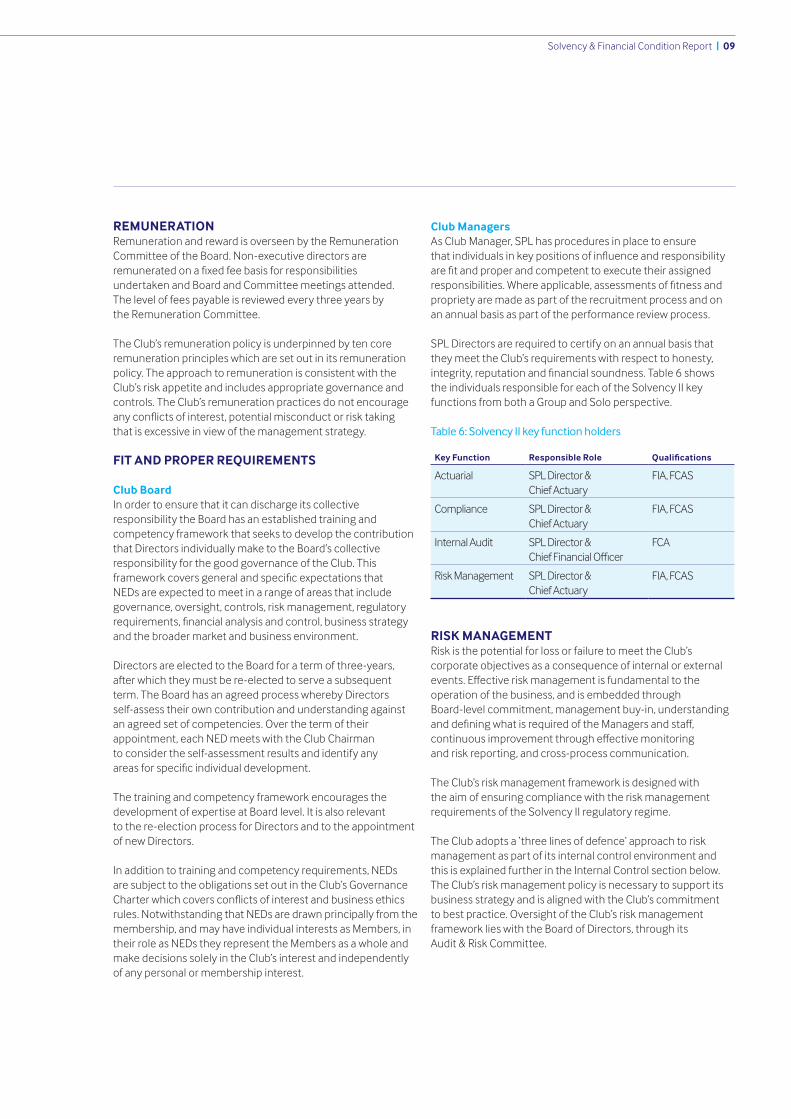
SPL Directors are required to certify on an annual basis that they meet the Club’s requirements with respect to honesty, integrity,reputationandfinancialsoundness.Table6shows the individuals responsible for each of the Solvency II key functions from both a Group and Solo perspective.
Table 6: Solvency II key function holders
Key Function Responsible Role Qualifications
Actuarial SPL Director & Chief Actuary
FIA, FCAS
Compliance SPL Director & Chief Actuary
FIA, FCAS
Internal Audit SPL Director & ChiefFinancialOfficer
FCA
Risk Management SPL Director & Chief Actuary
FIA, FCAS
RISK MANAGEMENTRisk is the potential for loss or failure to meet the Club’s corporate objectives as a consequence of internal or external events.Effectiveriskmanagementisfundamentaltotheoperation of the business, and is embedded throughBoard-level commitment, management buy-in, understanding anddefiningwhatisrequiredoftheManagersandstaff,continuousimprovementthrougheffectivemonitoring and risk reporting, and cross-process communication.
The Club’s risk management framework is designed with the aim of ensuring compliance with the risk management requirements of the Solvency II regulatory regime.
The Club adopts a ‘three lines of defence’ approach to risk management as part of its internal control environment and this is explained further in the Internal Control section below. The Club’s risk management policy is necessary to support its business strategy and is aligned with the Club’s commitment to best practice. Oversight of the Club’s risk management framework lies with the Board of Directors, through its Audit & Risk Committee.
10 | Solvency & Financial Condition Report
TheClub’spolicyistoidentifyallrealisticsignificantrisksfacedin implementing the business strategy and record them in its risk register. Risks are analysed by reference to likelihood of occurrence and potential severity of impact. The level of acceptablerisk(‘riskappetite’)isidentifiedforeachriskandcontrols established with the aim of ensuring that this level is not exceeded.
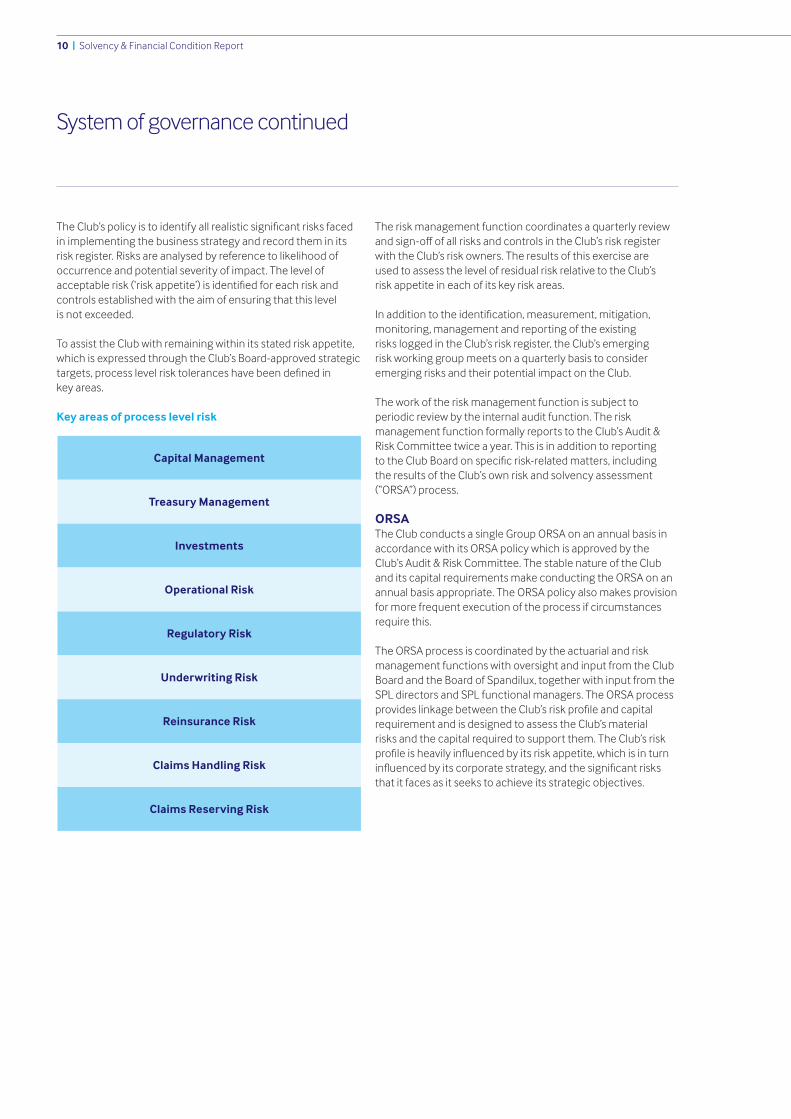
To assist the Club with remaining within its stated risk appetite, which is expressed through the Club’s Board-approved strategic targets,processlevelrisktoleranceshavebeendefinedin key areas.
Key areas of process level risk
The risk management function coordinates a quarterly review andsign-offofallrisksandcontrolsintheClub’sriskregisterwith the Club’s risk owners. The results of this exercise are used to assess the level of residual risk relative to the Club’s risk appetite in each of its key risk areas.
Inadditiontotheidentification,measurement,mitigation,monitoring, management and reporting of the existing risks logged in the Club’s risk register, the Club’s emerging risk working group meets on a quarterly basis to consider emerging risks and their potential impact on the Club.
The work of the risk management function is subject to periodic review by the internal audit function. The risk management function formally reports to the Club’s Audit & Risk Committee twice a year. This is in addition to reporting totheClubBoardonspecificrisk-relatedmatters,including the results of the Club’s own risk and solvency assessment (“ORSA”) process.
ORSAThe Club conducts a single Group ORSA on an annual basis in accordance with its ORSA policy which is approved by the Club’s Audit & Risk Committee. The stable nature of the Club and its capital requirements make conducting the ORSA on an annual basis appropriate. The ORSA policy also makes provision for more frequent execution of the process if circumstances require this.
The ORSA process is coordinated by the actuarial and risk management functions with oversight and input from the Club Board and the Board of Spandilux, together with input from the SPL directors and SPL functional managers. The ORSA process provideslinkagebetweentheClub’sriskprofileandcapitalrequirement and is designed to assess the Club’s material risks and the capital required to support them. The Club’s risk profileisheavilyinfluencedbyitsriskappetite,whichisinturninfluencedbyitscorporatestrategy,andthesignificantrisksthat it faces as it seeks to achieve its strategic objectives.
Capital Management
Treasury Management
Investments
Operational Risk
Regulatory Risk
Underwriting Risk
Reinsurance Risk
Claims Handling Risk
Claims Reserving Risk
System of governance continued
Solvency & Financial Condition Report | 11
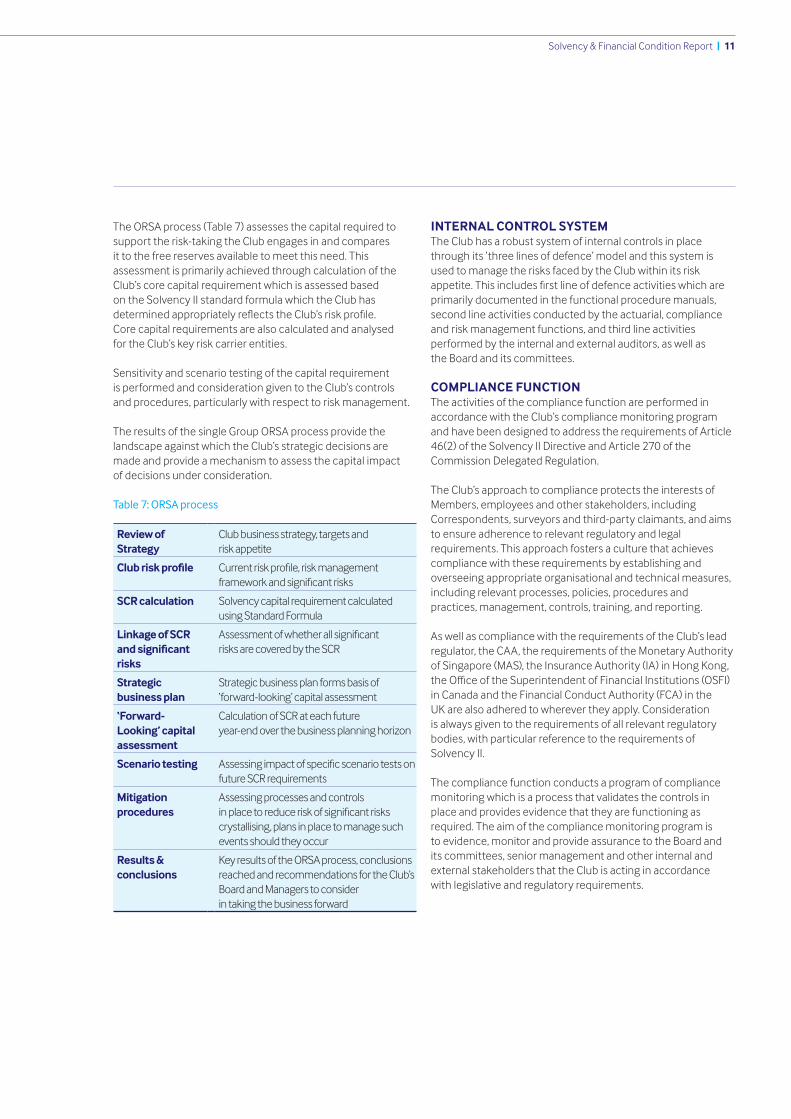
The ORSA process (Table 7) assesses the capital required to support the risk-taking the Club engages in and compares it to the free reserves available to meet this need. This assessment is primarily achieved through calculation of the Club’s core capital requirement which is assessed based on the Solvency II standard formula which the Club has determinedappropriatelyreflectstheClub’sriskprofile. Core capital requirements are also calculated and analysed for the Club’s key risk carrier entities.
Sensitivity and scenario testing of the capital requirement is performed and consideration given to the Club’s controls and procedures, particularly with respect to risk management.
The results of the single Group ORSA process provide the landscape against which the Club’s strategic decisions are made and provide a mechanism to assess the capital impact of decisions under consideration.
Table 7: ORSA process
Review of Strategy
Club business strategy, targets and risk appetite
Club risk profile Currentriskprofile,riskmanagementframeworkandsignificantrisks
SCR calculation Solvency capital requirement calculated using Standard Formula
Linkage of SCR and significant risks
Assessmentofwhetherallsignificant risks are covered by the SCR
Strategic business plan
Strategic business plan forms basis of ‘forward-looking’ capital assessment
‘Forward-Looking’ capital assessment
Calculation of SCR at each future year-end over the business planning horizon
Scenario testing Assessingimpactofspecificscenariotestsonfuture SCR requirements
Mitigation procedures
Assessing processes and controls inplacetoreduceriskofsignificantriskscrystallising, plans in place to manage such events should they occur
Results & conclusions
Key results of the ORSA process, conclusions reached and recommendations for the Club’s Board and Managers to consider in taking the business forward
INTERNAL CONTROL SYSTEMThe Club has a robust system of internal controls in place through its ‘three lines of defence’ model and this system is used to manage the risks faced by the Club within its risk appetite.Thisincludesfirstlineofdefenceactivitieswhichareprimarily documented in the functional procedure manuals, second line activities conducted by the actuarial, compliance and risk management functions, and third line activities performed by the internal and external auditors, as well as the Board and its committees.
COMPLIANCE FUNCTIONThe activities of the compliance function are performed in accordance with the Club’s compliance monitoring program and have been designed to address the requirements of Article 46(2) of the Solvency II Directive and Article 270 of the Commission Delegated Regulation.
The Club’s approach to compliance protects the interests of Members, employees and other stakeholders, including Correspondents, surveyors and third-party claimants, and aims to ensure adherence to relevant regulatory and legal requirements. This approach fosters a culture that achieves compliance with these requirements by establishing and overseeing appropriate organisational and technical measures, including relevant processes, policies, procedures and practices, management, controls, training, and reporting.
As well as compliance with the requirements of the Club’s lead regulator, the CAA, the requirements of the Monetary Authority ofSingapore(MAS),theInsuranceAuthority(IA)inHongKong,theOfficeoftheSuperintendentofFinancialInstitutions(OSFI)in Canada and the Financial Conduct Authority (FCA) in the UK are also adhered to wherever they apply. Consideration is always given to the requirements of all relevant regulatory bodies, with particular reference to the requirements of Solvency II.
The compliance function conducts a program of compliance monitoring which is a process that validates the controls in place and provides evidence that they are functioning as required. The aim of the compliance monitoring program is to evidence, monitor and provide assurance to the Board and its committees, senior management and other internal and external stakeholders that the Club is acting in accordance with legislative and regulatory requirements.
12 | Solvency & Financial Condition Report
The compliance monitoring plan schedule covers all applicable regulatory risks. It is regularly reviewed to ensure that it represents a fair assessment of risks to be monitored, in order thatverificationthatoperationalandreportingissueswithinthe business are conducted in accordance with the regulatory and legal requirements can be made to the Managers, the Audit & Risk Committee and the Board.
The compliance monitoring plan provides assurance to all stakeholders that the business is adhering to legislative and regulatory requirements, identifying and monitoring key risks, particularly regulatory and conduct risks, and supporting the businessinfindingandimplementingsolutionsincluding those that have a commercial impact.
RISK FUNCTIONThe risk function is responsible for advising, enabling, monitoring and reporting on risk and risk-related activities within the Club. The risk function supports management and theBoardintheeffectiveoperationoftheriskmanagementframework through a series of activities which include:
• Maintaining and developing the Club’s risk register. • Monitoring compliance with the quarterly review and
certificationbyriskownersoftheirriskswithintherisk register and any resulting actions.
• Monitoring risk in relation to strategic considerations and major initiatives the Club may be undertaking.
• Conducting a rolling program of detailed review of the completeness and accuracy of the risks facing the Club and their assessment within the risk register.
• Maintaining a Club-wide perspective and aggregated view oftheriskprofile,includingpotentialriskaggregationsandinterdependency between the risks included within the risk register.
• Measuring and managing potential risk aggregations through stress and scenario and reverse stress testing.
• Assessing the Club’s regulatory capital requirements at least annually.
• On an annual basis, completing the ORSA in accordance with the ORSA policy and presenting the results in the ORSA report.
• Reviewinganysignificantriskeventsandmaterialnear misses which may have resulted in the Club’s risk tolerances being exceeded.
• Reporting to the SPL Board, Audit & Risk Committee and Club Board on the outcome of the risk function’s activities, together with any recommendations based on the outcomes.
• Ongoing development and implementation of the risk management framework.
INTERNAL AUDIT FUNCTIONThe Club conducts a risk-based program of internal audits in accordance with its Internal Audit Policy and Internal Audit Charter. Internal audits are scheduled using a three-year rolling plan that is reviewed on an annual basis to respond to changes in risk. Internal audit is outsourced to Moore Stephens LLP for the purpose of providing a greater level of subject matter expertise to these audits and this function than would be available within a single individual or small team directly employed by an organisation of the size of SPL. This arrangement also ensures the independence of the internal audit function from the activities it reviews.
The internal audit function is accountable to the Chair of the Audit & Risk Committee and for day-to-day matters liaises with theChiefFinancialOfficerofSPL.TheChiefFinancialOfficeristhe SPL key function holder who retains responsibility for the performance of the internal audit function under its contractual agreement with the Club.
ACTUARIAL FUNCTIONThe Chief Actuary is responsible for ensuring that the responsibilities of the actuarial function are dispensed in accordance with its terms of reference and reports to the Chief FinancialOfficer.TheChiefActuaryisaFellowoftheInstituteofActuaries and a Fellow of the Casualty Actuarial Society, with over14yearsofexperienceasaqualifiedactuary.Healsohasextensive experience in actuarial reserving, capital modelling and risk management.
The SPL Board, of which the Chief Actuary is a member, has satisfieditselfthattheChiefActuaryhastherelevantknowledgeandexperiencetofulfiltheregulatoryrequirements.
The Chief Actuary is supported by an Actuarial Analyst who is a UKqualifiedactuary.Thepresenceoftwoqualifiedactuariesenables separation of production and review.
The actuarial function conducts a range of activities in each of the areas required by Article 48 of the Solvency II Directive. These activities are described in the annual actuarial function report to the Club Board.
System of governance continued
Solvency & Financial Condition Report | 13
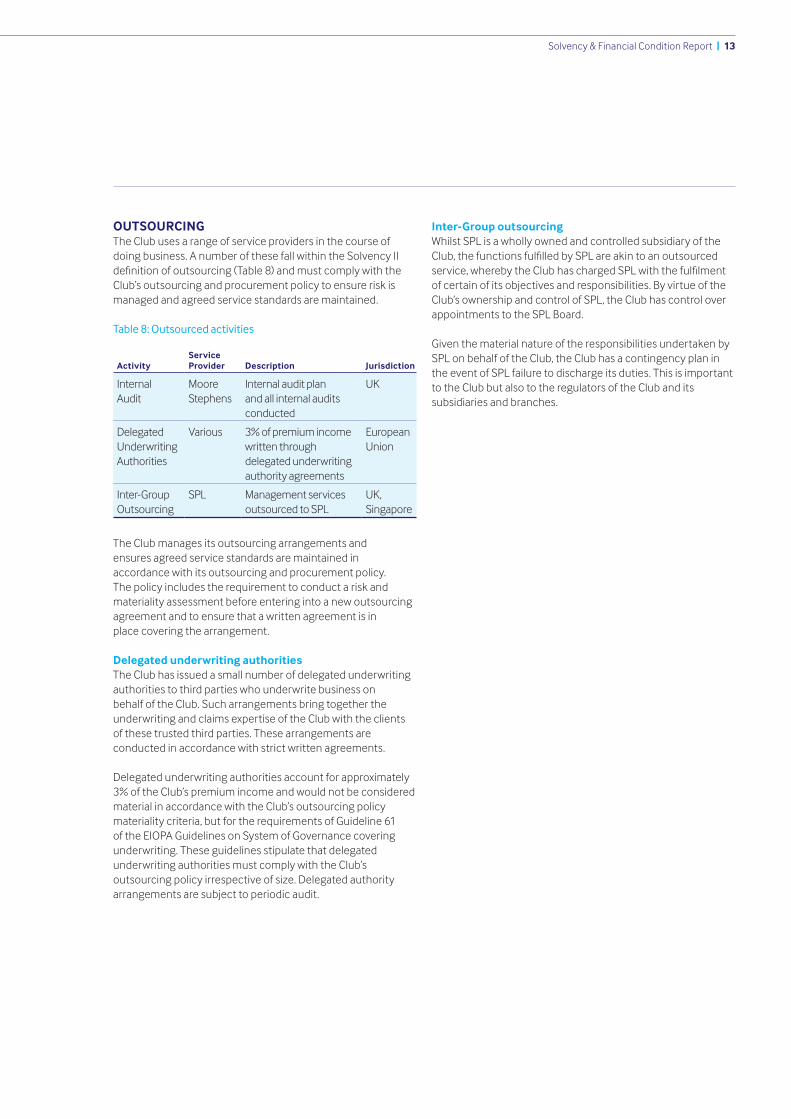
OUTSOURCINGThe Club uses a range of service providers in the course of doing business. A number of these fall within the Solvency II definitionofoutsourcing(Table8)andmustcomplywiththeClub’s outsourcing and procurement policy to ensure risk is managed and agreed service standards are maintained.
Table 8: Outsourced activities
ActivityService Provider Description Jurisdiction
Internal Audit
Moore Stephens
Internal audit plan and all internal audits conducted
UK
Delegated Underwriting Authorities
Various 3% of premium income written through delegated underwriting authority agreements
European Union
Inter-Group Outsourcing
SPL Management services outsourced to SPL
UK, Singapore
The Club manages its outsourcing arrangements and ensures agreed service standards are maintained in accordance with its outsourcing and procurement policy. The policy includes the requirement to conduct a risk and materiality assessment before entering into a new outsourcing agreement and to ensure that a written agreement is in place covering the arrangement.
Delegated underwriting authoritiesThe Club has issued a small number of delegated underwriting authorities to third parties who underwrite business on behalf of the Club. Such arrangements bring together the underwriting and claims expertise of the Club with the clients of these trusted third parties. These arrangements are conducted in accordance with strict written agreements.
Delegated underwriting authorities account for approximately 3% of the Club’s premium income and would not be considered material in accordance with the Club’s outsourcing policy materiality criteria, but for the requirements of Guideline 61 of the EIOPA Guidelines on System of Governance covering underwriting. These guidelines stipulate that delegated underwriting authorities must comply with the Club’s outsourcing policy irrespective of size. Delegated authority arrangements are subject to periodic audit.
Inter-Group outsourcingWhilst SPL is a wholly owned and controlled subsidiary of the Club,thefunctionsfulfilledbySPLareakintoanoutsourcedservice,wherebytheClubhaschargedSPLwiththefulfilmentof certain of its objectives and responsibilities. By virtue of the Club’s ownership and control of SPL, the Club has control over appointments to the SPL Board.
Given the material nature of the responsibilities undertaken by SPL on behalf of the Club, the Club has a contingency plan in the event of SPL failure to discharge its duties. This is important to the Club but also to the regulators of the Club and its subsidiaries and branches.
14 | Solvency & Financial Condition Report
Reinsurance is a key tool used to reduce the underwriting risk exposure and to stabilise underwriting results. The Club’s reinsurance programme is subject to annual review and agreement by the Board of Directors to ensure that it continues tobeaneffectivetoolforachievingtheseobjectives.TheClubutilises the services of professional reinsurance brokers in the purchaseofitsfundamentalreinsuranceprogramandbenefitsfrom their expertise and experience when considering the ongoing appropriateness, structure and pricing of the program. The Club expects to purchase a similar program to that currently in place over the Club’s business planning horizon.
In addition to its own reinsurance programme, the Club is party to the IG Pooling Agreement, whereby for the 2017 policy year individual claims of between US$ 10 million and US$ 80 million are pooled. Above this level, the IG purchases reinsurance protection up to US$ 3.1 billion on behalf of all members of the Group.
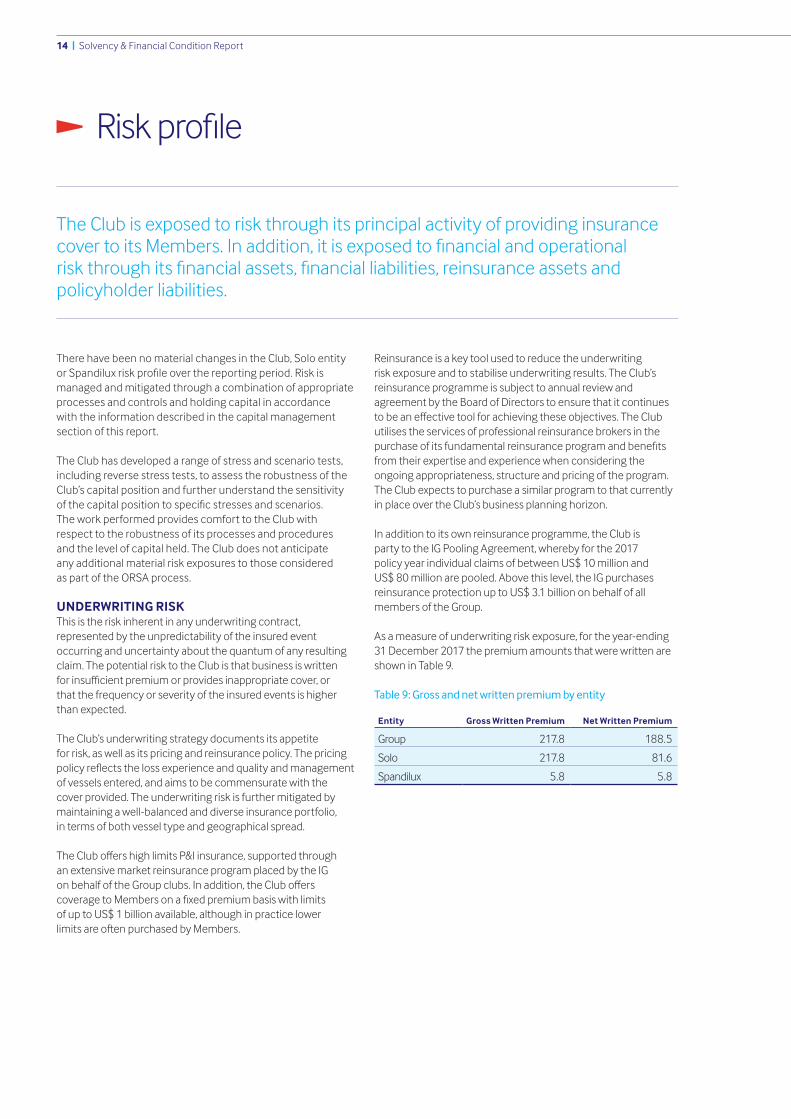
As a measure of underwriting risk exposure, for the year-ending 31 December 2017 the premium amounts that were written are shown in Table 9.
Table 9: Gross and net written premium by entity
Entity Gross Written Premium Net Written Premium
Group 217.8 188.5
Solo 217.8 81.6
Spandilux 5.8 5.8
There have been no material changes in the Club, Solo entity orSpandiluxriskprofileoverthereportingperiod.Riskismanaged and mitigated through a combination of appropriate processes and controls and holding capital in accordance with the information described in the capital management section of this report.
The Club has developed a range of stress and scenario tests, including reverse stress tests, to assess the robustness of the Club’s capital position and further understand the sensitivity ofthecapitalpositiontospecificstressesandscenarios. The work performed provides comfort to the Club with respect to the robustness of its processes and procedures and the level of capital held. The Club does not anticipate any additional material risk exposures to those considered as part of the ORSA process.
UNDERWRITING RISKThis is the risk inherent in any underwriting contract, represented by the unpredictability of the insured event occurring and uncertainty about the quantum of any resulting claim. The potential risk to the Club is that business is written forinsufficientpremiumorprovidesinappropriatecover,or that the frequency or severity of the insured events is higher than expected.
The Club’s underwriting strategy documents its appetite for risk, as well as its pricing and reinsurance policy. The pricingpolicyreflectsthelossexperienceandqualityandmanagementof vessels entered, and aims to be commensurate with the cover provided. The underwriting risk is further mitigated by maintaining a well-balanced and diverse insurance portfolio,in terms of both vessel type and geographical spread.
TheCluboffershighlimitsP&Iinsurance,supportedthrough an extensive market reinsurance program placed by the IG onbehalfoftheGroupclubs.Inaddition,theCluboffers coveragetoMembersonafixedpremiumbasiswithlimits of up to US$ 1 billion available, although in practice lower limitsareoftenpurchasedbyMembers.
Riskprofile
The Club is exposed to risk through its principal activity of providing insurance covertoitsMembers.Inaddition,itisexposedtofinancialandoperational riskthroughitsfinancialassets,financialliabilities,reinsuranceassetsandpolicyholder liabilities.

Solvency & Financial Condition Report | 15
RESERVING RISKThis represents the risk that reserves established in the balance sheetareinsufficienttomeetthecostofoutstandingclaims, as a result of inadequate case reserves or inadequate reserves for claims that have been incurred but not reported. The Club has an established conservative estimating policy in place, based on always estimating the cost of the claim in the appropriatecurrency,alwaysreflectingthemostup-to-dateinformation available and not deviating from a pessimistic basis (worst reasonable likely outcome) for estimating a claim. The reserving process uses a variety of statistical and actuarial techniques, with the level of reserves calculated using internal actuarial resources and maintained on a conservative basis.
As a measure of reserving risk exposure, for the year-ending 31 December 2017 the Solvency II technical provisions were as shown in Table 10. Solvency II technical provisions are comprised of premium provisions, claims provisions and a risk margin, with the claims provisions forming the largest component.
Table 10: Gross and net technical provisions by entity
EntityGross Technical
ProvisionsNet Technical
Provisions
Group 467.6 391.3
Solo 460.1 151.9
Spandilux 18.2 18.2
REGULATORY RISKThis represents the risk to the Club of a loss or reputational damage resulting from a failure to respond to and comply with a changing regulatory landscape. The Club actively adheres to regulatory requirements in worldwide jurisdictions where it operates, and in addition monitors all entities within the insurance and accounting systems against relevant sanction lists on a daily basis.
TheClubhasadefinedprocesstomonitorcompliance with worldwide regulatory issues and to respond to any newdevelopmentsastheyareidentified.
CREDIT RISKThis is the risk to the Club of a loss resulting from a counterparty being unable to meet its contractual obligations.
The main credit risk arises from the potential for reinsurers to default on their obligations under the terms of the reinsurance policy. The Club manages this risk by ensuring that the reinsurance security used is both strong and diverse. Thefinancialstandingofreinsurersiskeptunderregular review.
The Club is also exposed to its Members not paying premiums when due. Strong credit control procedures are in place to mitigate this risk. In addition, the Rules of the Club allow it to terminate an entry from inception in case of non-paymentof premiums. Furthermore, the payment of claims in respect of a policy is suspended if premiums associated with that policy are outstanding.
The Club also holds cash balances with a number of banks and this provides a further credit risk exposure to the Club.
As a measure of credit risk exposure, for the year-ending31 December 2017 the reinsurance recoverables, insurance and intermediaries receivables and cash and cash equivalents were as shown in Table 11. Table 11: Credit risk exposures by entity
Exposure Group Solo Spandilux
Reinsurance Recoverables 76.3 308.2 –
Insurance and Intermediaries Receivables 22.9 22.8 –
Cash and Cash Equivalents 98.5 71.5 0.1
16 | Solvency & Financial Condition Report
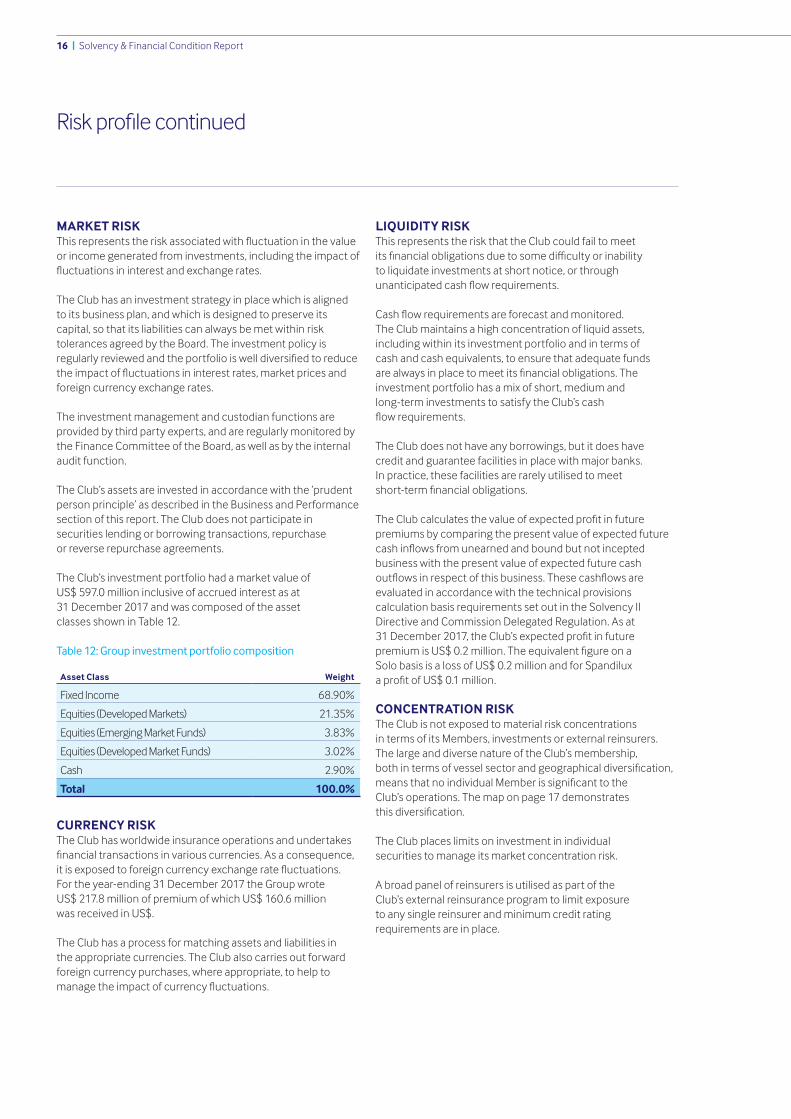
MARKET RISKThisrepresentstheriskassociatedwithfluctuationinthevalueor income generated from investments, including the impact of fluctuationsininterestandexchangerates.
The Club has an investment strategy in place which is aligned to its business plan, and which is designed to preserve its capital, so that its liabilities can always be met within risk tolerances agreed by the Board. The investment policy is regularlyreviewedandtheportfolioiswelldiversifiedtoreducetheimpactoffluctuationsininterestrates,marketpricesandforeign currency exchange rates.
The investment management and custodian functions are provided by third party experts, and are regularly monitored by the Finance Committee of the Board, as well as by the internal audit function.
The Club’s assets are invested in accordance with the ‘prudent person principle’ as described in the Business and Performance section of this report. The Club does not participate in securities lending or borrowing transactions, repurchaseor reverse repurchase agreements.
The Club’s investment portfolio had a market value of US$ 597.0 million inclusive of accrued interest as at 31 December 2017 and was composed of the asset classes shown in Table 12.
Table 12: Group investment portfolio composition
Asset Class Weight
Fixed Income 68.90%
Equities (Developed Markets) 21.35%
Equities (Emerging Market Funds) 3.83%
Equities (Developed Market Funds) 3.02%
Cash 2.90%
Total 100.0%
CURRENCY RISKThe Club has worldwide insurance operations and undertakes financialtransactionsinvariouscurrencies.Asaconsequence,itisexposedtoforeigncurrencyexchangeratefluctuations.For the year-ending 31 December 2017 the Group wroteUS$ 217.8 million of premium of which US$ 160.6 million was received in US$. The Club has a process for matching assets and liabilities in the appropriate currencies. The Club also carries out forward foreign currency purchases, where appropriate, to help to managetheimpactofcurrencyfluctuations.
LIQUIDITY RISKThis represents the risk that the Club could fail to meet itsfinancialobligationsduetosomedifficultyorinability to liquidate investments at short notice, or through unanticipatedcashflowrequirements.
Cashflowrequirementsareforecastandmonitored. The Club maintains a high concentration of liquid assets, including within its investment portfolio and in terms of cash and cash equivalents, to ensure that adequate funds arealwaysinplacetomeetitsfinancialobligations.Theinvestment portfolio has a mix of short, medium and long-term investments to satisfy the Club’s cash flowrequirements.
The Club does not have any borrowings, but it does have credit and guarantee facilities in place with major banks. In practice, these facilities are rarely utilised to meet short-termfinancialobligations.
TheClubcalculatesthevalueofexpectedprofitinfuturepremiums by comparing the present value of expected future cashinflowsfromunearnedandboundbutnotinceptedbusiness with the present value of expected future cash outflowsinrespectofthisbusiness.Thesecashflowsareevaluated in accordance with the technical provisions calculation basis requirements set out in the Solvency II Directive and Commission Delegated Regulation. As at31December2017,theClub’sexpectedprofitinfuturepremiumisUS$0.2million.Theequivalentfigureona Solo basis is a loss of US$ 0.2 million and for Spandilux aprofitofUS$0.1million.
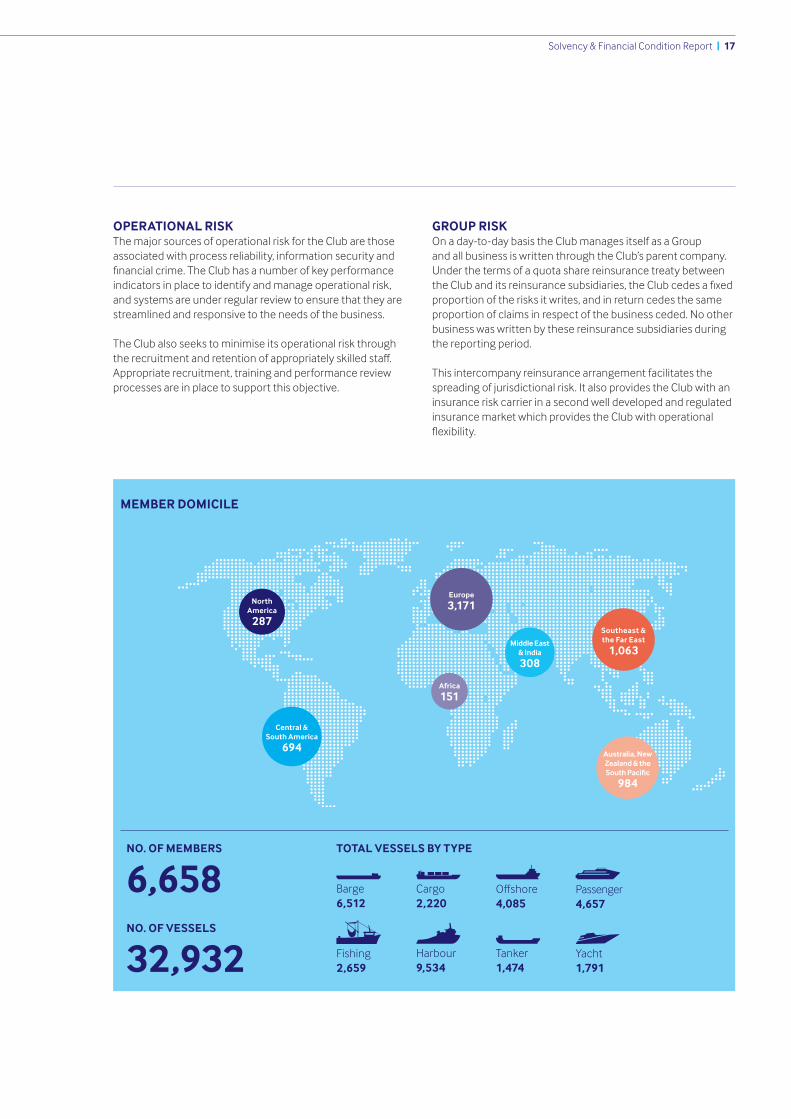
CONCENTRATION RISKThe Club is not exposed to material risk concentrations in terms of its Members, investments or external reinsurers. The large and diverse nature of the Club’s membership, bothintermsofvesselsectorandgeographicaldiversification,meansthatnoindividualMemberissignificanttothe Club’s operations. The map on page 17 demonstrates thisdiversification.
The Club places limits on investment in individual securities to manage its market concentration risk.
A broad panel of reinsurers is utilised as part of the Club’s external reinsurance program to limit exposure to any single reinsurer and minimum credit rating requirements are in place.
Riskprofilecontinued
Solvency & Financial Condition Report | 17
OPERATIONAL RISKThe major sources of operational risk for the Club are those associated with process reliability, information security and financialcrime.TheClubhasanumberofkeyperformanceindicators in place to identify and manage operational risk, and systems are under regular review to ensure that they are streamlined and responsive to the needs of the business.
The Club also seeks to minimise its operational risk through therecruitmentandretentionofappropriatelyskilledstaff.Appropriate recruitment, training and performance review processes are in place to support this objective.
GROUP RISKOn a day-to-day basis the Club manages itself as a Group and all business is written through the Club’s parent company. Under the terms of a quota share reinsurance treaty between theClubanditsreinsurancesubsidiaries,theClubcedesafixedproportion of the risks it writes, and in return cedes the same proportion of claims in respect of the business ceded. No other business was written by these reinsurance subsidiaries during the reporting period.
This intercompany reinsurance arrangement facilitates the spreading of jurisdictional risk. It also provides the Club with an insurance risk carrier in a second well developed and regulated insurance market which provides the Club with operational flexibility.
Southeast & the Far East
1,063
TOTAL VESSELS BY TYPENO. OF MEMBERS
6,658NO. OF VESSELS
32,932
North America
287
Africa
151
Central & South America
694Australia, New Zealand & the South Pacific
984
Middle East & India
308
Europe
3,171
MEMBER DOMICILE
Yacht1,791
Tanker1,474
Cargo2,220
Passenger4,657
Fishing2,659
Offshore4,085
Barge6,512
Harbour9,534
18 | Solvency & Financial Condition Report
For statutory reporting purposes the Club values its assets in accordancewithLuxembourgfinancialreportingrequirements(“Lux GAAP”). This, in particular, results in investments being reported under Lux GAAP at the lower of cost and market value. No changes were made to the statutory recognition and valuation bases used during the reporting period.
Assets and liabilities for solvency purposes are prepared using the Accounting Consolidation Method (Method 1) in accordance with the Club’s processes and procedures and are subject to the usual review and approval mechanisms prior to use.
The Club does not make use of the matching adjustment, volatility adjustment, transitional risk-free interest rate term structure or any of the other Solvency II transitional arrangements in its valuation basis.
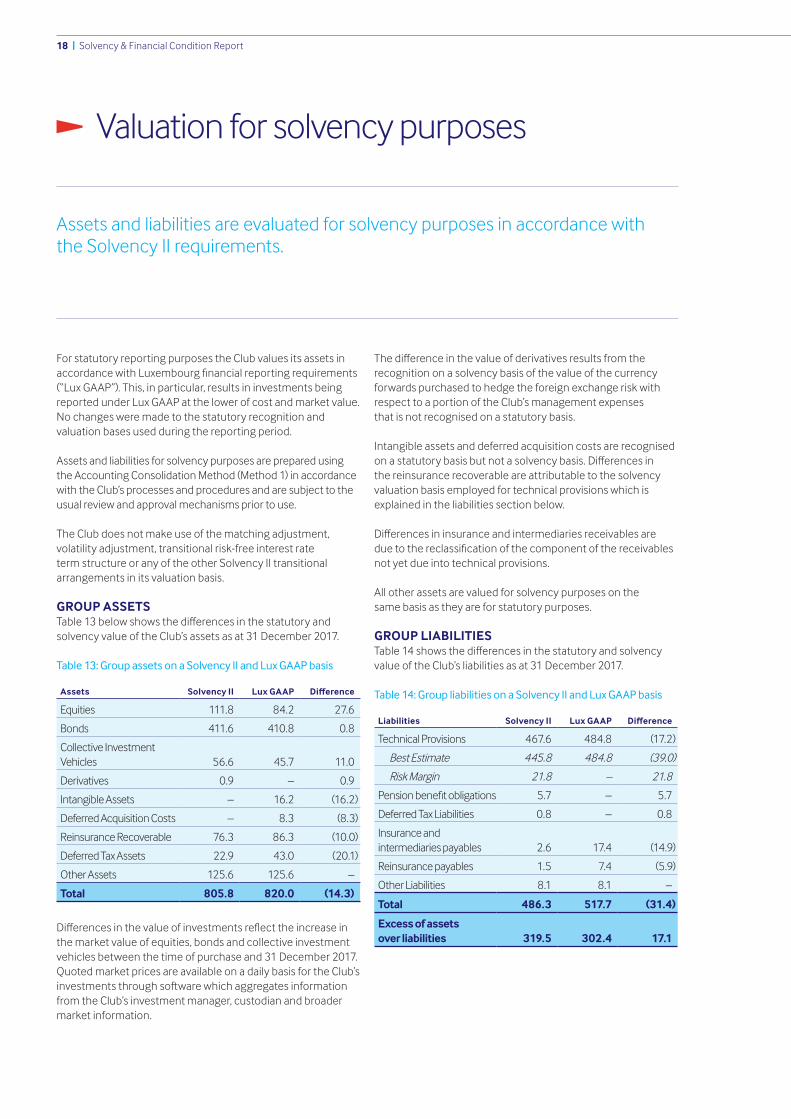
GROUP ASSETSTable13belowshowsthedifferencesinthestatutoryandsolvency value of the Club’s assets as at 31 December 2017.
Table 13: Group assets on a Solvency II and Lux GAAP basis
Assets Solvency II Lux GAAP Difference
Equities 111.8 84.2 27.6
Bonds 411.6 410.8 0.8
Collective Investment Vehicles 56.6 45.7 11.0
Derivatives 0.9 – 0.9
Intangible Assets – 16.2 (16.2)
Deferred Acquisition Costs – 8.3 (8.3)
Reinsurance Recoverable 76.3 86.3 (10.0)
Deferred Tax Assets 22.9 43.0 (20.1)
Other Assets 125.6 125.6 –
Total 805.8 820.0 (14.3)
Differencesinthevalueofinvestmentsreflecttheincreaseinthe market value of equities, bonds and collective investment vehicles between the time of purchase and 31 December 2017. Quoted market prices are available on a daily basis for the Club’s investmentsthroughsoftwarewhichaggregatesinformationfrom the Club’s investment manager, custodian and broader market information.
Thedifferenceinthevalueofderivativesresultsfromtherecognition on a solvency basis of the value of the currency forwards purchased to hedge the foreign exchange risk with respect to a portion of the Club’s management expenses that is not recognised on a statutory basis.
Intangible assets and deferred acquisition costs are recognised onastatutorybasisbutnotasolvencybasis.Differencesin the reinsurance recoverable are attributable to the solvency valuation basis employed for technical provisions which is explained in the liabilities section below.
Differencesininsuranceandintermediariesreceivablesare duetothereclassificationofthecomponentofthereceivablesnot yet due into technical provisions.
All other assets are valued for solvency purposes on the same basis as they are for statutory purposes.
GROUP LIABILITIESTable14showsthedifferencesinthestatutoryandsolvencyvalue of the Club’s liabilities as at 31 December 2017.
Table 14: Group liabilities on a Solvency II and Lux GAAP basis
Liabilities Solvency II Lux GAAP Difference
Technical Provisions 467.6 484.8 (17.2)
Best Estimate 445.8 484.8 (39.0)
Risk Margin 21.8 – 21.8
Pensionbenefitobligations 5.7 – 5.7
Deferred Tax Liabilities 0.8 – 0.8
Insurance and intermediaries payables 2.6 17.4 (14.9)
Reinsurance payables 1.5 7.4 (5.9)
Other Liabilities 8.1 8.1 –
Total 486.3 517.7 (31.4)
Excess of assets over liabilities 319.5 302.4 17.1
Valuation for solvency purposes
Assets and liabilities are evaluated for solvency purposes in accordance with the Solvency II requirements.
Solvency & Financial Condition Report | 19
Differencesinthevalueoftechnicalprovisionsreflectthedifferentvaluationrulesonasolvencyandstatutorybasis(described within the Technical Provisions Methodology section on page 20).
Thedifferenceinthevalueofpensionbenefitobligationsresults from the recognition on a solvency basis of the value ofthepensionbenefitobligationsthatisnotrecognised on a statutory basis in accordance with Lux GAAP.
Thedifferenceinthevalueofdeferredtaxliabilitiesisattributable to the additional tax that would be payable on the Club’s investments on a mid-market valuation basis.
Differencesininsuranceandintermediariespayablesandreinsurancepayablesareduetothereclassificationofthecomponent of the payables not yet due into technical provisions.
The excess of assets over liabilities increases from its statutory valueasaresultofthevaluationdifferencesinrespectoftheClub’s assets and liabilities already described.
All other liabilities are valued for solvency purposes on the same basis as they are for statutory purposes.
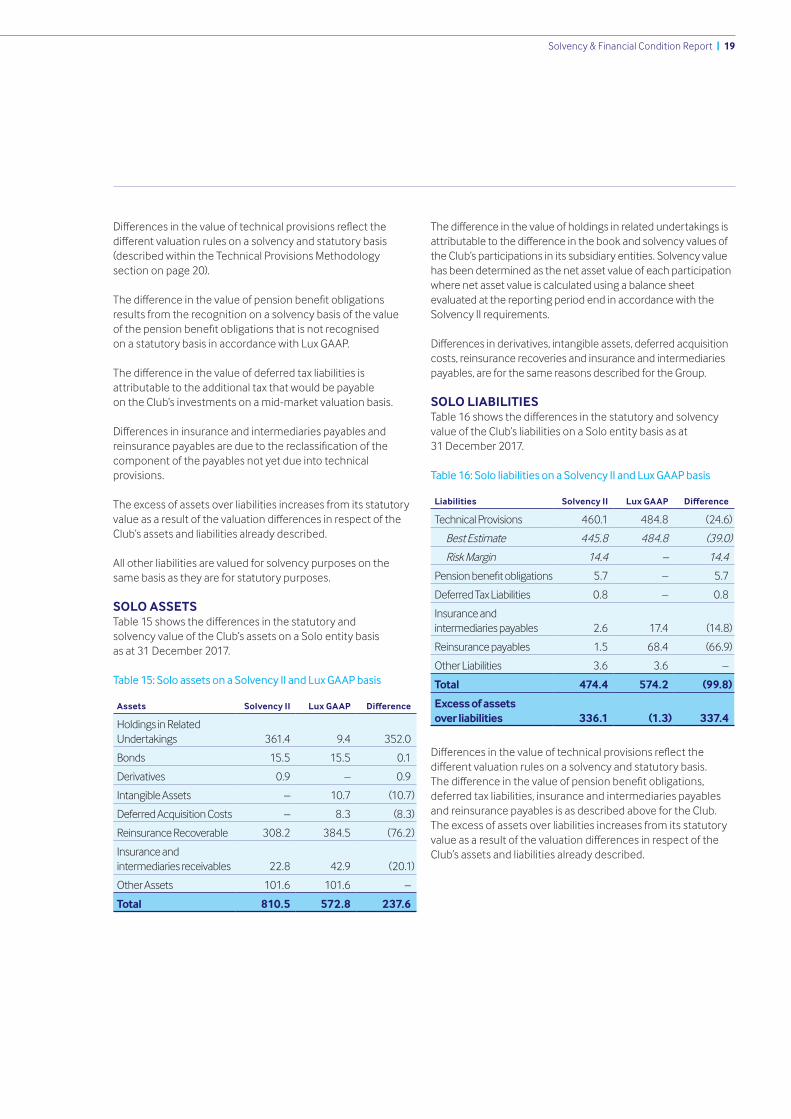
SOLO ASSETSTable15showsthedifferencesinthestatutoryand solvency value of the Club’s assets on a Solo entity basis as at 31 December 2017.
Table 15: Solo assets on a Solvency II and Lux GAAP basis
Assets Solvency II Lux GAAP Difference
HoldingsinRelatedUndertakings 361.4 9.4 352.0
Bonds 15.5 15.5 0.1
Derivatives 0.9 – 0.9
Intangible Assets – 10.7 (10.7)
Deferred Acquisition Costs – 8.3 (8.3)
Reinsurance Recoverable 308.2 384.5 (76.2)
Insurance and intermediaries receivables 22.8 42.9 (20.1)
Other Assets 101.6 101.6 –
Total 810.5 572.8 237.6
Thedifferenceinthevalueofholdingsinrelatedundertakingsisattributabletothedifferenceinthebookandsolvencyvaluesofthe Club’s participations in its subsidiary entities. Solvency value has been determined as the net asset value of each participation where net asset value is calculated using a balance sheet evaluated at the reporting period end in accordance with the Solvency II requirements.
Differencesinderivatives,intangibleassets,deferredacquisitioncosts, reinsurance recoveries and insurance and intermediaries payables, are for the same reasons described for the Group.
SOLO LIABILITIESTable16showsthedifferencesinthestatutoryandsolvencyvalue of the Club’s liabilities on a Solo entity basis as at31 December 2017.
Table 16: Solo liabilities on a Solvency II and Lux GAAP basis
Liabilities Solvency II Lux GAAP Difference
Technical Provisions 460.1 484.8 (24.6)
Best Estimate 445.8 484.8 (39.0)
Risk Margin 14.4 – 14.4
Pensionbenefitobligations 5.7 – 5.7
Deferred Tax Liabilities 0.8 – 0.8
Insurance and intermediaries payables 2.6 17.4 (14.8)
Reinsurance payables 1.5 68.4 (66.9)
Other Liabilities 3.6 3.6 –
Total 474.4 574.2 (99.8)
Excess of assets over liabilities 336.1 (1.3) 337.4
Differencesinthevalueoftechnicalprovisionsreflectthedifferentvaluationrulesonasolvencyandstatutorybasis. Thedifferenceinthevalueofpensionbenefitobligations,deferred tax liabilities, insurance and intermediaries payables and reinsurance payables is as described above for the Club. The excess of assets over liabilities increases from its statutory valueasaresultofthevaluationdifferencesinrespectoftheClub’s assets and liabilities already described.
20 | Solvency & Financial Condition Report
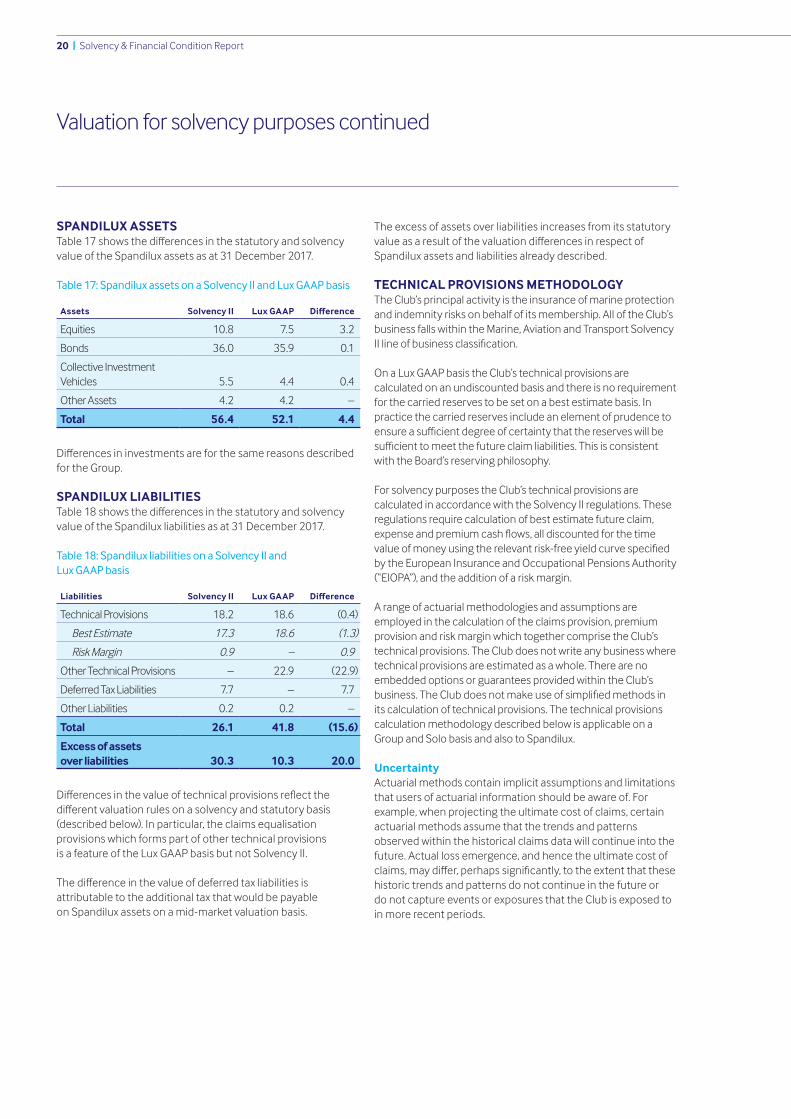
SPANDILUX ASSETSTable17showsthedifferencesinthestatutoryandsolvencyvalue of the Spandilux assets as at 31 December 2017.
Table 17: Spandilux assets on a Solvency II and Lux GAAP basis
Assets Solvency II Lux GAAP Difference
Equities 10.8 7.5 3.2
Bonds 36.0 35.9 0.1
Collective Investment Vehicles 5.5 4.4 0.4
Other Assets 4.2 4.2 –
Total 56.4 52.1 4.4
Differencesininvestmentsareforthesamereasonsdescribedfor the Group.
SPANDILUX LIABILITIESTable18showsthedifferencesinthestatutoryandsolvencyvalue of the Spandilux liabilities as at 31 December 2017.
Table 18: Spandilux liabilities on a Solvency II and Lux GAAP basis
Liabilities Solvency II Lux GAAP Difference
Technical Provisions 18.2 18.6 (0.4)
Best Estimate 17.3 18.6 (1.3)
Risk Margin 0.9 – 0.9
Other Technical Provisions – 22.9 (22.9)
Deferred Tax Liabilities 7.7 – 7.7
Other Liabilities 0.2 0.2 –
Total 26.1 41.8 (15.6)
Excess of assets over liabilities 30.3 10.3 20.0
Differencesinthevalueoftechnicalprovisionsreflectthedifferentvaluationrulesonasolvencyandstatutorybasis(described below). In particular, the claims equalisation provisions which forms part of other technical provisions is a feature of the Lux GAAP basis but not Solvency II.
Thedifferenceinthevalueofdeferredtaxliabilitiesisattributable to the additional tax that would be payable on Spandilux assets on a mid-market valuation basis.
The excess of assets over liabilities increases from its statutory valueasaresultofthevaluationdifferencesinrespectofSpandilux assets and liabilities already described.
TECHNICAL PROVISIONS METHODOLOGYThe Club’s principal activity is the insurance of marine protection and indemnity risks on behalf of its membership. All of the Club’s business falls within the Marine, Aviation and Transport Solvency IIlineofbusinessclassification.
On a Lux GAAP basis the Club’s technical provisions are calculated on an undiscounted basis and there is no requirement for the carried reserves to be set on a best estimate basis. In practice the carried reserves include an element of prudence to ensureasufficientdegreeofcertaintythatthereserveswillbesufficienttomeetthefutureclaimliabilities.Thisisconsistentwith the Board’s reserving philosophy. For solvency purposes the Club’s technical provisions are calculated in accordance with the Solvency II regulations. These regulations require calculation of best estimate future claim, expenseandpremiumcashflows,alldiscountedforthetimevalueofmoneyusingtherelevantrisk-freeyieldcurvespecifiedby the European Insurance and Occupational Pensions Authority (“EIOPA”), and the addition of a risk margin.
A range of actuarial methodologies and assumptions are employed in the calculation of the claims provision, premium provision and risk margin which together comprise the Club’s technical provisions. The Club does not write any business where technical provisions are estimated as a whole. There are no embedded options or guarantees provided within the Club’s business.TheClubdoesnotmakeuseofsimplifiedmethodsin its calculation of technical provisions. The technical provisions calculation methodology described below is applicable on a Group and Solo basis and also to Spandilux.
UncertaintyActuarial methods contain implicit assumptions and limitations that users of actuarial information should be aware of. For example, when projecting the ultimate cost of claims, certain actuarial methods assume that the trends and patternsobserved within the historical claims data will continue into the future. Actual loss emergence, and hence the ultimate cost of claims,maydiffer,perhapssignificantly,totheextentthatthesehistoric trends and patterns do not continue in the future ordo not capture events or exposures that the Club is exposed to in more recent periods.
Valuation for solvency purposes continued
Solvency & Financial Condition Report | 21
A key source of uncertainty within the Club’s technical provisions is the outcome of its 100 largest claims in a given policy year and how they develop to their ultimate value.
Unless explicitly allowed for, actuarial methods may not anticipate or make any allowance for extraordinary changes in the legal, social, regulatory or economic environment that couldaffectthefrequencyorseverityofclaimsordevelopmentof claims to their ultimate amounts.
Claims provisionThe best estimate claims provision calculations use a range of standard actuarial methods including the Chain Ladder, Bornhuetter-Ferguson and Expected Loss Ratio methods. These methods are applied separately to the homogeneous groupings into which the Club segments its business for the purpose of actuarial analysis, namely own Member claims segmented by claim size and the Club’s share of other IG club pool claims. The claims provision also makes allowance for claims handling expenses.
These methods are applied to the gross of reinsurance data to produce gross of reinsurance best estimates. These methods are also applied to the net of reinsurance data to produce net of reinsurance best estimates, but in this case the Member claims are considered in aggregate rather than split by claim size.
A separate approach to the net best estimate is also considered whereby the estimated aggregate gross of reinsurance ultimate claim cost amounts are assigned at the individual claim level and the Club’s reinsurance structure is applied to produce the net of reinsurance position.
Premium provisionThe ultimate loss ratios and payment patterns for the most recent accident year derived in the claims provision analysis are utilised in the estimate of the premium provision. Acquisition, administrative and claims handling expenses are consideredaspartofthefuturecashoutflows.
The premium provision calculations are performed gross and net of reinsurance and take account of the period end unearned premium reserve and the volume of bound but not incepted business.
Receivables and payablesFollowing a review of market practice, the components of insurance and intermediaries receivables, insurance and intermediaries payables and reinsurance payables not yet due havebeenreclassifiedintotechnicalprovisions.Thisrepresentsachangeinclassificationfromtheprioryearbutisnotconsideredmaterialasitisachangeinclassificationandnotvaluation.
Contract boundariesUnder the ‘legal obligation’ basis of Solvency II5, all existing contracts must be valued as part of technical provisions, whether the contracts have incepted or not. The Club’s technical provisions therefore take account of business that has incepted prior to the end of the reporting period, as well as business to which the Club is legally obligated but which has not incepted prior to the end of the reporting period.
Events not in dataTechnicalprovisionsmustreflectthepossibilityoflossestotheClubthatareofatypeorscalenotreflectedintheClub’shistoricclaims data. Such events are referred to as ‘events not in data’. This could be due to changes in the exposures faced by the Club based on the business written or changes in the legal, social, regulatory or economic environment.
The Club has made separate additional provisions for events not in data within both its claims and premium provisions based on considerations of a hypothetical latent claim exposure and large loss incident respectively.
Investment management expensesProvision must be made for investment management expenses in respect of the assets supporting the technical provisions. The Club pays annual investment management expenses based on both the value of assets under management and a fixedfee.Aninvestmentmanagementexpensereservehasbeen calculated in respect of the assets supporting the full run-offoftheundiscountedtechnicalprovisions.
Profit in future premiumTheClubhasconsideredtheprofitinfuturepremiumbyassessingthesufficiencyoftheClub’sunearnedpremiumreserveandtheexpectedprofitarisingfrombusinesstowhichthe Club is legally obligated, but which has not yet incepted. This contrasts to the statutory basis where the unearned premium is held at its full value and no account is taken of business for which the Club is not on risk at the reporting date.
DiscountingThe undiscounted technical provisions, including both the claims provision and premium provision, are discounted for the time value of money using the relevant currency yield curve published by EIOPA and the claim payment patterns derived in the Club’s actuarial analysis.
5 Articles 17 & 18 of Commission Delegated Regulation 2015/35.
22 | Solvency & Financial Condition Report
Credit risk adjustmentProjectedreinsurancerecoveriesareadjustedtoreflect the risk of default taking account of the credit standing of the Club’s reinsurers.
Risk marginThe risk margin is calculated as part of the SCR calculation processusingthecostofcapitalapproachasspecifiedin Article 77 of the Solvency II Directive. The method adopted withintheSCRcalculationisasimplificationthattheSCR infutureyearsisproportionaltotherun-offofthetechnicalprovisions. The Club believes that this approach is proportionate to the nature, scale and complexity of its business and is consistent with the approach taken by many market participants including those of a similar nature, scale and complexity. Data qualityThe Club continues to develop its information technology infrastructure and this continues to enhance the availability, quality and granularity of the data available for actuarial analysis. The Club also continues to develop its information reporting capabilities and this supports the technical provisions calculation process.
The Club makes numerous assumptions in the calculation of its technical provisions and these are documented in theClub’sexpertjudgementlog.However,noneoftheseadjustmentsaretheresultofsignificantdeficienciesin the Club’s data.
AssumptionsIn respect of ceded reinsurance, the Club assumes that its market reinsurance program will respond as intended and that reinsurers will pay valid claims. Consideration of the associated credit risk is made through the Club’s regulatory capital calculation. For the purpose of assessing solvency, the Club assumes that its reinsurance program will be renewed on similar terms using a similar structure for the future year of new business incorporated into the assessment.
TECHNICAL PROVISIONS RESULTSApplication of the methodology described above results intwokeydifferencesbetweenthestatutoryandsolvencytechnical provisions. These relate to the best estimate and risk margin respectively.
Differencesinthebestestimateareprimarilyattributable to the scope of what must be included in technical provisions (as described above) and the application of discounting. The risk margin is required on a solvency basis but not on astatutorybasisandisdesignedtoreflecttheadditional funds a willing buyer would require in an arms-length transaction to purchase the technical provision liabilities given the uncertainties involved.
Valuation for solvency purposes continued
Solvency & Financial Condition Report | 23
The Club manages the risks it faces through a series of processes and controls, which are reviewed on a regular basis. In addition, it holds capital to cover unexpected losses arising from the risks it faces and to meet its regulatory obligations.
As a result of its most recent review in May 2018, credit rating agency Standard & Poor’s has rated the Club ‘AAA’ from a capital adequacy perspective.
The Club operates a capital management policy with theaim of ensuring that the Group, subsidiaries and branches can continuously meet their regulatory and internally set capital requirements. The policy aims to ensure that own funds of sufficientmagnitudeandqualityexisttomeetthecapitalrequirements on a continuous basis.
The Club determines its expected capital requirement overits three-year business planning horizon. This forward-looking assessment takes account of planned changes to the Club’s riskprofileandtheexpecteddevelopmentintheexternalenvironment in which it operates.
The Club’s medium-term capital management plan is monitored by the Club Board and takes account of all relevant factors to ensure that the Club’s capital position is accurate and develops in an expected and controlled manner overits forward-looking time horizon.
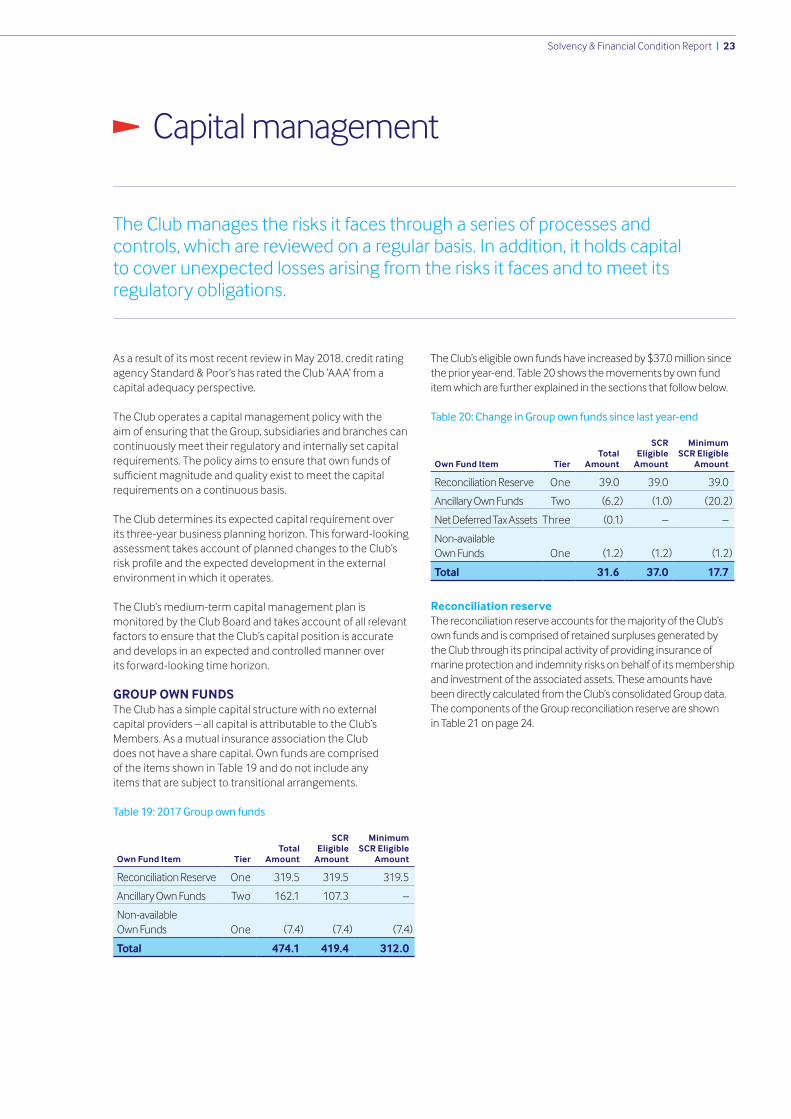
GROUP OWN FUNDSThe Club has a simple capital structure with no external capital providers – all capital is attributable to the Club’s Members. As a mutual insurance association the Club does not have a share capital. Own funds are comprised of the items shown in Table 19 and do not include any items that are subject to transitional arrangements.
Table 19: 2017 Group own funds
Own Fund Item TierTotal
Amount
SCR Eligible
Amount
Minimum SCR Eligible
Amount
Reconciliation Reserve One 319.5 319.5 319.5
Ancillary Own Funds Two 162.1 107.3 –
Non-available Own Funds One (7.4) (7.4) (7.4)
Total 474.1 419.4 312.0
The Club’s eligible own funds have increased by $37.0 million since the prior year-end. Table 20 shows the movements by own fund item which are further explained in the sections that follow below.
Table 20: Change in Group own funds since last year-end
Own Fund Item TierTotal
Amount
SCR Eligible
Amount
Minimum SCR Eligible
Amount
Reconciliation Reserve One 39.0 39.0 39.0
Ancillary Own Funds Two (6.2) (1.0) (20.2)
Net Deferred Tax Assets Three (0.1) – –
Non-available Own Funds One (1.2) (1.2) (1.2)
Total 31.6 37.0 17.7
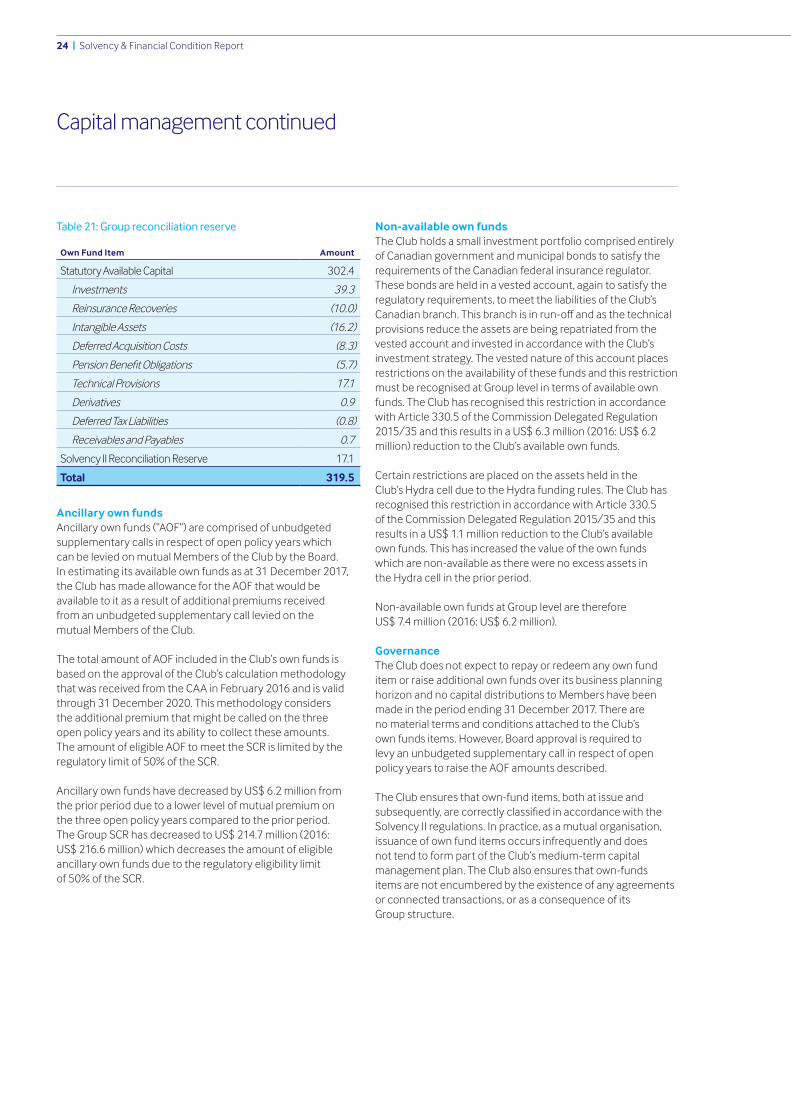
Reconciliation reserveThe reconciliation reserve accounts for the majority of the Club’s own funds and is comprised of retained surpluses generated by the Club through its principal activity of providing insurance of marine protection and indemnity risks on behalf of its membership and investment of the associated assets. These amounts have been directly calculated from the Club’s consolidated Group data. The components of the Group reconciliation reserve are shown in Table 21 on page 24.
Capital management
24 | Solvency & Financial Condition Report
Table 21: Group reconciliation reserve
Own Fund Item Amount
Statutory Available Capital 302.4
Investments 39.3
Reinsurance Recoveries (10.0)
Intangible Assets (16.2)
Deferred Acquisition Costs (8.3)
PensionBenefitObligations (5.7)
Technical Provisions 17.1
Derivatives 0.9
Deferred Tax Liabilities (0.8)
Receivables and Payables 0.7
Solvency II Reconciliation Reserve 17.1
Total 319.5
Ancillary own fundsAncillary own funds (“AOF”) are comprised of unbudgeted supplementary calls in respect of open policy years which can be levied on mutual Members of the Club by the Board. In estimating its available own funds as at 31 December 2017, the Club has made allowance for the AOF that would be available to it as a result of additional premiums received from an unbudgeted supplementary call levied on the mutual Members of the Club.
The total amount of AOF included in the Club’s own funds is based on the approval of the Club’s calculation methodology that was received from the CAA in February 2016 and is valid through 31 December 2020. This methodology considers the additional premium that might be called on the three open policy years and its ability to collect these amounts. The amount of eligible AOF to meet the SCR is limited by the regulatory limit of 50% of the SCR.
Ancillary own funds have decreased by US$ 6.2 million from the prior period due to a lower level of mutual premium on the three open policy years compared to the prior period. The Group SCR has decreased to US$ 214.7 million (2016: US$ 216.6 million) which decreases the amount of eligible ancillary own funds due to the regulatory eligibility limit of 50% of the SCR.
Non-available own fundsThe Club holds a small investment portfolio comprised entirely of Canadian government and municipal bonds to satisfy the requirements of the Canadian federal insurance regulator.These bonds are held in a vested account, again to satisfy the regulatory requirements, to meet the liabilities of the Club’s Canadianbranch.Thisbranchisinrun-offandasthetechnicalprovisions reduce the assets are being repatriated from the vested account and invested in accordance with the Club’s investment strategy. The vested nature of this account places restrictions on the availability of these funds and this restriction must be recognised at Group level in terms of available own funds. The Club has recognised this restriction in accordance with Article 330.5 of the Commission Delegated Regulation 2015/35 and this results in a US$ 6.3 million (2016: US$ 6.2 million) reduction to the Club’s available own funds.
Certain restrictions are placed on the assets held in the Club’sHydracellduetotheHydrafundingrules.TheClubhasrecognised this restriction in accordance with Article 330.5 of the Commission Delegated Regulation 2015/35 and this results in a US$ 1.1 million reduction to the Club’s available own funds. This has increased the value of the own funds which are non-available as there were no excess assets in theHydracellinthepriorperiod.
Non-available own funds at Group level are therefore US$ 7.4 million (2016: US$ 6.2 million).
GovernanceThe Club does not expect to repay or redeem any own fund item or raise additional own funds over its business planning horizon and no capital distributions to Members have been made in the period ending 31 December 2017. There are no material terms and conditions attached to the Club’s ownfundsitems.However,Boardapprovalisrequiredto levy an unbudgeted supplementary call in respect of open policy years to raise the AOF amounts described.
The Club ensures that own-fund items, both at issue and subsequently,arecorrectlyclassifiedinaccordancewiththeSolvency II regulations. In practice, as a mutual organisation, issuance of own fund items occurs infrequently and does not tend to form part of the Club’s medium-term capital management plan. The Club also ensures that own-fundsitems are not encumbered by the existence of any agreements or connected transactions, or as a consequence of itsGroup structure.
Capital management continued
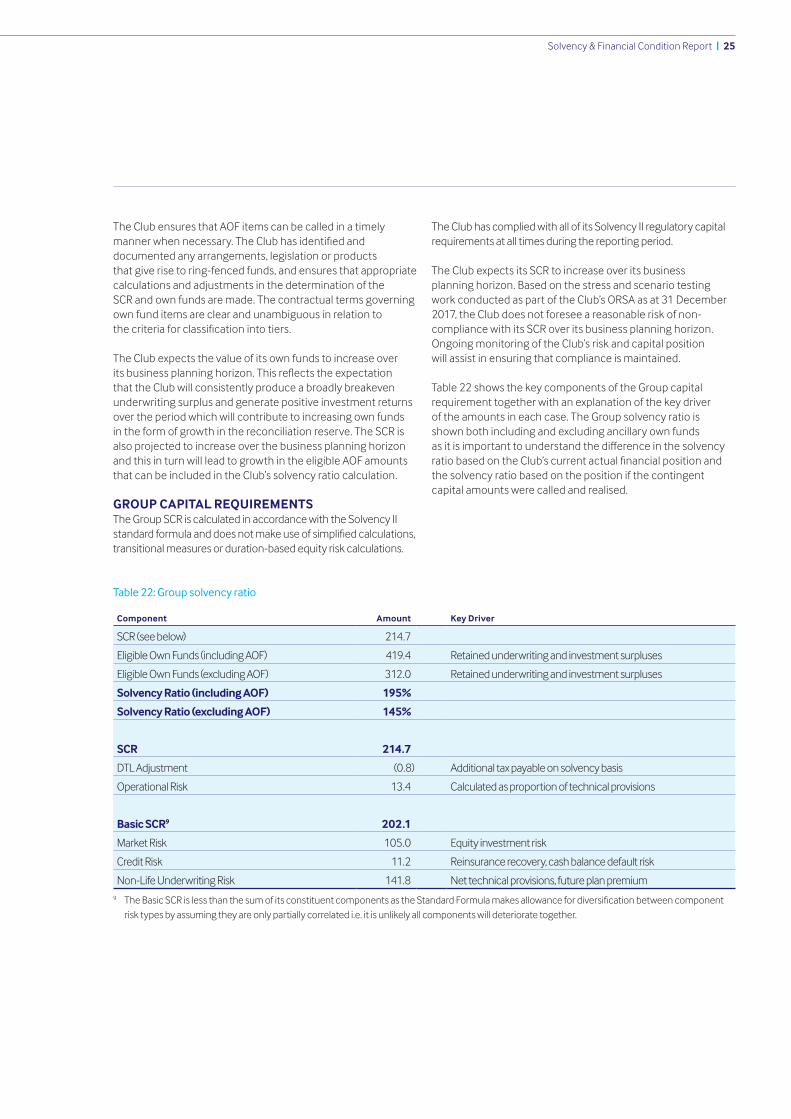
Solvency & Financial Condition Report | 25
The Club ensures that AOF items can be called in a timely mannerwhennecessary.TheClubhasidentifiedanddocumented any arrangements, legislation or products that give rise to ring-fenced funds, and ensures that appropriate calculations and adjustments in the determination of the SCR and own funds are made. The contractual terms governing own fund items are clear and unambiguous in relation to thecriteriaforclassificationintotiers.
The Club expects the value of its own funds to increase overitsbusinessplanninghorizon.Thisreflectstheexpectation that the Club will consistently produce a broadly breakeven underwriting surplus and generate positive investment returns over the period which will contribute to increasing own funds in the form of growth in the reconciliation reserve. The SCR is also projected to increase over the business planning horizon and this in turn will lead to growth in the eligible AOF amounts that can be included in the Club’s solvency ratio calculation.
GROUP CAPITAL REQUIREMENTSThe Group SCR is calculated in accordance with the Solvency II standardformulaanddoesnotmakeuseofsimplifiedcalculations,transitional measures or duration-based equity risk calculations.
The Club has complied with all of its Solvency II regulatory capital requirements at all times during the reporting period.
The Club expects its SCR to increase over its business planning horizon. Based on the stress and scenario testing work conducted as part of the Club’s ORSA as at 31 December 2017, the Club does not foresee a reasonable risk of non-compliance with its SCR over its business planning horizon. Ongoing monitoring of the Club’s risk and capital position will assist in ensuring that compliance is maintained.
Table 22 shows the key components of the Group capital requirement together with an explanation of the key driver of the amounts in each case. The Group solvency ratio is shown both including and excluding ancillary own funds asitisimportanttounderstandthedifferenceinthesolvencyratiobasedontheClub’scurrentactualfinancialpositionandthe solvency ratio based on the position if the contingent capital amounts were called and realised.
Table 22: Group solvency ratio
Component Amount Key Driver
SCR (see below) 214.7
Eligible Own Funds (including AOF) 419.4 Retained underwriting and investment surpluses
Eligible Own Funds (excluding AOF) 312.0 Retained underwriting and investment surpluses
Solvency Ratio (including AOF) 195%
Solvency Ratio (excluding AOF) 145%
SCR 214.7
DTL Adjustment (0.8) Additional tax payable on solvency basis
Operational Risk 13.4 Calculated as proportion of technical provisions
Basic SCR9 202.1
Market Risk 105.0 Equity investment risk
Credit Risk 11.2 Reinsurance recovery, cash balance default risk
Non-Life Underwriting Risk 141.8 Net technical provisions, future plan premium9 TheBasicSCRislessthanthesumofitsconstituentcomponentsastheStandardFormulamakesallowancefordiversificationbetweencomponent
risk types by assuming they are only partially correlated i.e. it is unlikely all components will deteriorate together.
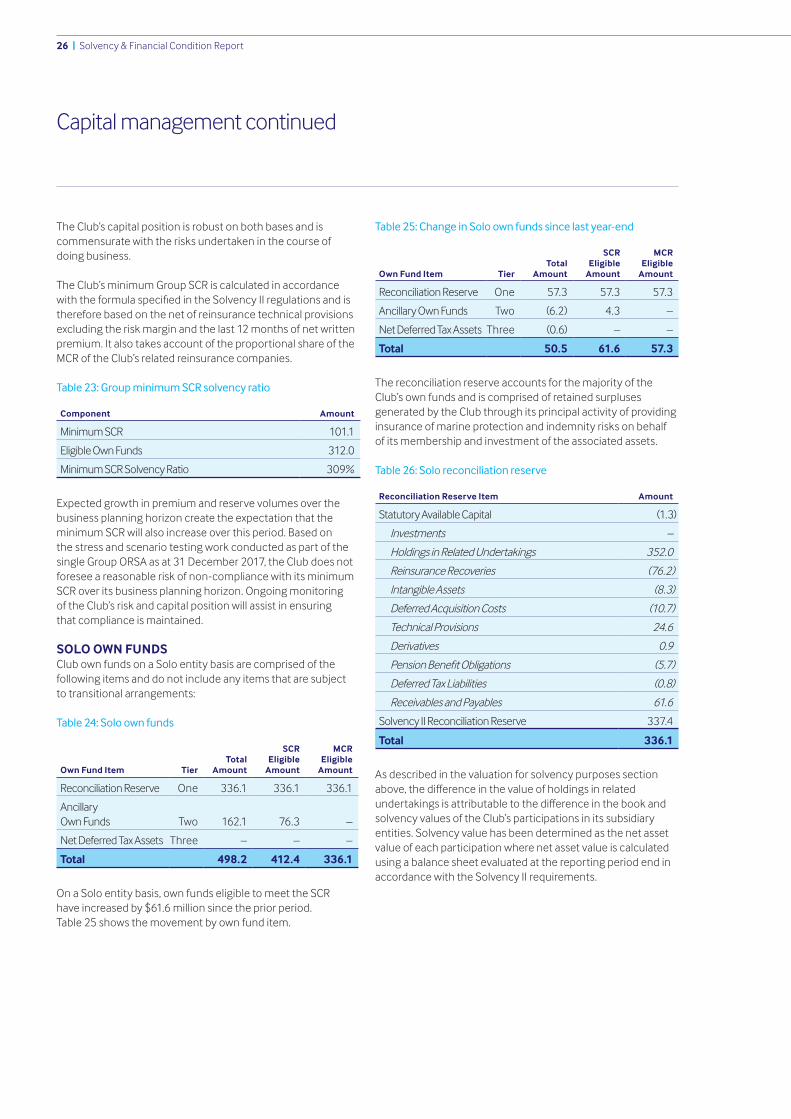
26 | Solvency & Financial Condition Report
The Club’s capital position is robust on both bases and is commensurate with the risks undertaken in the course of doing business.
The Club’s minimum Group SCR is calculated in accordance withtheformulaspecifiedintheSolvencyIIregulationsandistherefore based on the net of reinsurance technical provisions excluding the risk margin and the last 12 months of net written premium. It also takes account of the proportional share of the MCR of the Club’s related reinsurance companies.
Table 23: Group minimum SCR solvency ratio
Component Amount
Minimum SCR 101.1
Eligible Own Funds 312.0
Minimum SCR Solvency Ratio 309%
Expected growth in premium and reserve volumes over the business planning horizon create the expectation that the minimum SCR will also increase over this period. Based on the stress and scenario testing work conducted as part of the single Group ORSA as at 31 December 2017, the Club does not foresee a reasonable risk of non-compliance with its minimum SCR over its business planning horizon. Ongoing monitoring of the Club’s risk and capital position will assist in ensuring that compliance is maintained.
SOLO OWN FUNDSClub own funds on a Solo entity basis are comprised of the following items and do not include any items that are subject to transitional arrangements:
Table 24: Solo own funds
Own Fund Item TierTotal
Amount
SCR Eligible
Amount
MCR Eligible
Amount
Reconciliation Reserve One 336.1 336.1 336.1
Ancillary Own Funds Two 162.1 76.3 –
Net Deferred Tax Assets Three – – –
Total 498.2 412.4 336.1
On a Solo entity basis, own funds eligible to meet the SCR have increased by $61.6 million since the prior period. Table 25 shows the movement by own fund item.
Table 25: Change in Solo own funds since last year-end
Own Fund Item TierTotal
Amount
SCR Eligible
Amount
MCR Eligible
Amount
Reconciliation Reserve One 57.3 57.3 57.3
Ancillary Own Funds Two (6.2) 4.3 –
Net Deferred Tax Assets Three (0.6) – –
Total 50.5 61.6 57.3
The reconciliation reserve accounts for the majority of the Club’s own funds and is comprised of retained surpluses generated by the Club through its principal activity of providing insurance of marine protection and indemnity risks on behalf of its membership and investment of the associated assets.
Table 26: Solo reconciliation reserve
Reconciliation Reserve Item Amount
Statutory Available Capital (1.3)
Investments –
HoldingsinRelatedUndertakings 352.0
Reinsurance Recoveries (76.2)
Intangible Assets (8.3)
Deferred Acquisition Costs (10.7)
Technical Provisions 24.6
Derivatives 0.9
PensionBenefitObligations (5.7)
Deferred Tax Liabilities (0.8)
Receivables and Payables 61.6
Solvency II Reconciliation Reserve 337.4
Total 336.1
As described in the valuation for solvency purposes section above,thedifferenceinthevalueofholdingsinrelatedundertakingsisattributabletothedifferenceinthebookandsolvency values of the Club’s participations in its subsidiary entities. Solvency value has been determined as the net asset value of each participation where net asset value is calculated using a balance sheet evaluated at the reporting period end in accordance with the Solvency II requirements.
Capital management continued
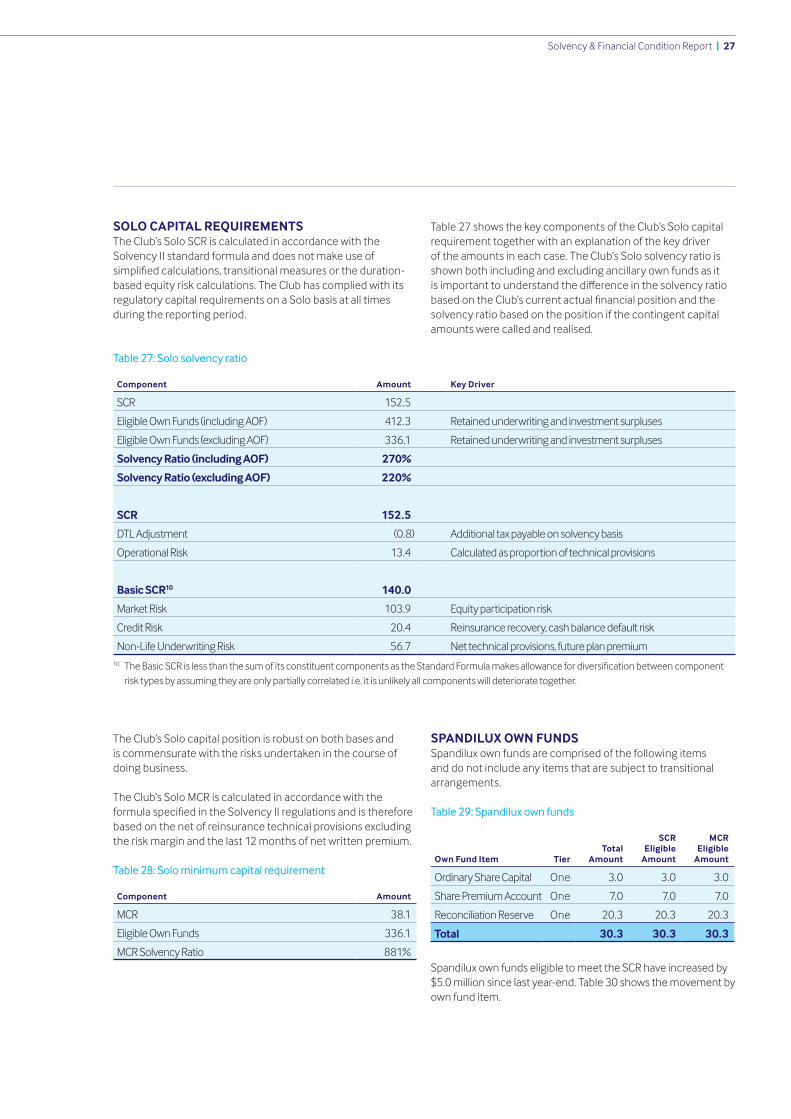
Solvency & Financial Condition Report | 27
SOLO CAPITAL REQUIREMENTSThe Club’s Solo SCR is calculated in accordance with the Solvency II standard formula and does not make use of simplifiedcalculations,transitionalmeasuresortheduration-based equity risk calculations. The Club has complied with its regulatory capital requirements on a Solo basis at all times during the reporting period.
The Club’s Solo capital position is robust on both bases and is commensurate with the risks undertaken in the course of doing business.
The Club’s Solo MCR is calculated in accordance with the formulaspecifiedintheSolvencyIIregulationsandisthereforebased on the net of reinsurance technical provisions excluding the risk margin and the last 12 months of net written premium.
Table 28: Solo minimum capital requirement
Component Amount
MCR 38.1
Eligible Own Funds 336.1
MCR Solvency Ratio 881%
Table 27: Solo solvency ratio
Component Amount Key Driver
SCR 152.5
Eligible Own Funds (including AOF) 412.3 Retained underwriting and investment surpluses
Eligible Own Funds (excluding AOF) 336.1 Retained underwriting and investment surpluses
Solvency Ratio (including AOF) 270%
Solvency Ratio (excluding AOF) 220%
SCR 152.5
DTL Adjustment (0.8) Additional tax payable on solvency basis
Operational Risk 13.4 Calculated as proportion of technical provisions
Basic SCR10 140.0
Market Risk 103.9 Equity participation risk
Credit Risk 20.4 Reinsurance recovery, cash balance default risk
Non-Life Underwriting Risk 56.7 Net technical provisions, future plan premium10 TheBasicSCRislessthanthesumofitsconstituentcomponentsastheStandardFormulamakesallowancefordiversificationbetweencomponent
risk types by assuming they are only partially correlated i.e. it is unlikely all components will deteriorate together.
Table 27 shows the key components of the Club’s Solo capital requirement together with an explanation of the key driver of the amounts in each case. The Club’s Solo solvency ratio is shown both including and excluding ancillary own funds as it isimportanttounderstandthedifferenceinthesolvencyratiobasedontheClub’scurrentactualfinancialpositionandthesolvency ratio based on the position if the contingent capital amounts were called and realised.
SPANDILUX OWN FUNDSSpandilux own funds are comprised of the following items and do not include any items that are subject to transitional arrangements.
Table 29: Spandilux own funds
Own Fund Item TierTotal
Amount
SCR Eligible
Amount
MCR Eligible
Amount
Ordinary Share Capital One 3.0 3.0 3.0
Share Premium Account One 7.0 7.0 7.0
Reconciliation Reserve One 20.3 20.3 20.3
Total 30.3 30.3 30.3
Spandilux own funds eligible to meet the SCR have increased by $5.0 million since last year-end. Table 30 shows the movement by own fund item.
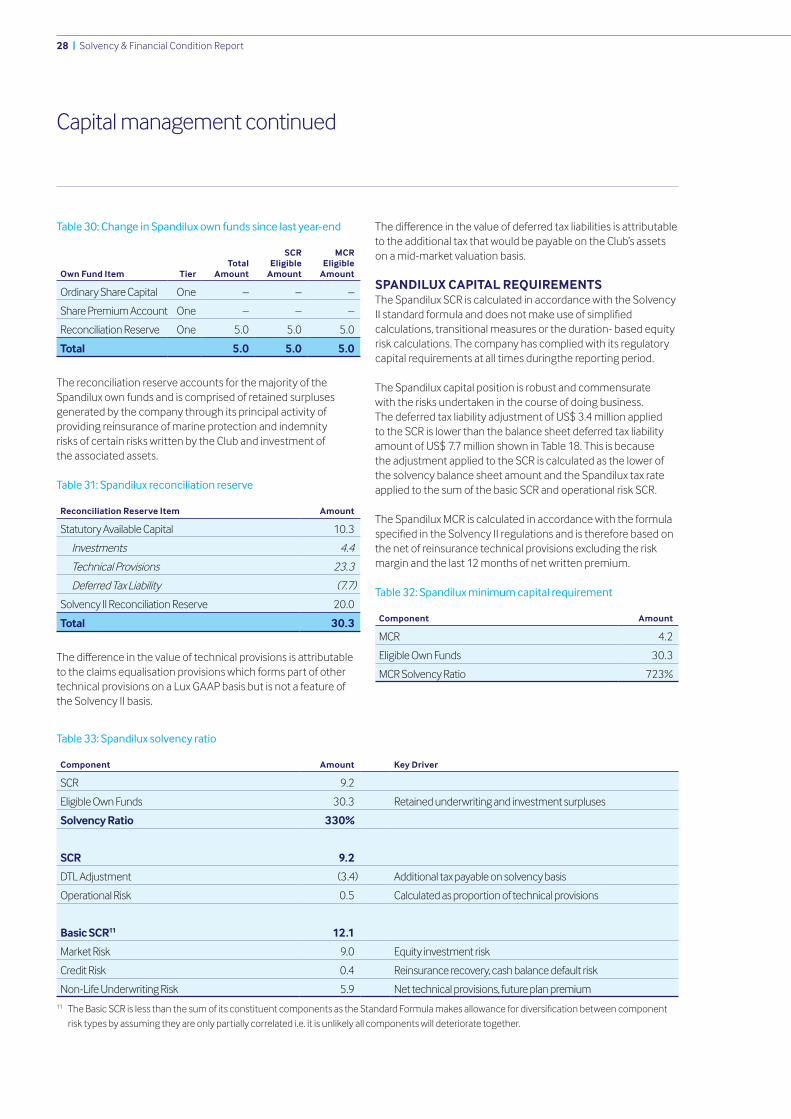
28 | Solvency & Financial Condition Report
Table 30: Change in Spandilux own funds since last year-end
Own Fund Item TierTotal
Amount
SCR Eligible
Amount
MCR Eligible
Amount
Ordinary Share Capital One – – –
Share Premium Account One – – –
Reconciliation Reserve One 5.0 5.0 5.0
Total 5.0 5.0 5.0
The reconciliation reserve accounts for the majority of the Spandilux own funds and is comprised of retained surpluses generated by the company through its principal activity of providing reinsurance of marine protection and indemnity risks of certain risks written by the Club and investment of the associated assets.
Table 31: Spandilux reconciliation reserve
Reconciliation Reserve Item Amount
Statutory Available Capital 10.3
Investments 4.4
Technical Provisions 23.3
Deferred Tax Liability (7.7)
Solvency II Reconciliation Reserve 20.0
Total 30.3
Thedifferenceinthevalueoftechnicalprovisionsisattributableto the claims equalisation provisions which forms part of other technical provisions on a Lux GAAP basis but is not a feature of the Solvency II basis.
Thedifferenceinthevalueofdeferredtaxliabilitiesisattributableto the additional tax that would be payable on the Club’s assets on a mid-market valuation basis.
SPANDILUX CAPITAL REQUIREMENTSThe Spandilux SCR is calculated in accordance with the Solvency IIstandardformulaanddoesnotmakeuseofsimplifiedcalculations, transitional measures or the duration- based equity risk calculations. The company has complied with its regulatory capital requirements at all times duringthe reporting period.
The Spandilux capital position is robust and commensurate with the risks undertaken in the course of doing business. The deferred tax liability adjustment of US$ 3.4 million applied to the SCR is lower than the balance sheet deferred tax liability amount of US$ 7.7 million shown in Table 18. This is because the adjustment applied to the SCR is calculated as the lower of the solvency balance sheet amount and the Spandilux tax rate applied to the sum of the basic SCR and operational risk SCR.
The Spandilux MCR is calculated in accordance with the formula specifiedintheSolvencyIIregulationsandisthereforebasedonthe net of reinsurance technical provisions excluding the risk margin and the last 12 months of net written premium.
Table 32: Spandilux minimum capital requirement
Component Amount
MCR 4.2
Eligible Own Funds 30.3
MCR Solvency Ratio 723%
Table 33: Spandilux solvency ratio
Component Amount Key Driver
SCR 9.2
Eligible Own Funds 30.3 Retained underwriting and investment surpluses
Solvency Ratio 330%
SCR 9.2
DTL Adjustment (3.4) Additional tax payable on solvency basis
Operational Risk 0.5 Calculated as proportion of technical provisions
Basic SCR11 12.1
Market Risk 9.0 Equity investment risk
Credit Risk 0.4 Reinsurance recovery, cash balance default risk
Non-Life Underwriting Risk 5.9 Net technical provisions, future plan premium11 TheBasicSCRislessthanthesumofitsconstituentcomponentsastheStandardFormulamakesallowancefordiversificationbetweencomponent
risk types by assuming they are only partially correlated i.e. it is unlikely all components will deteriorate together.
Capital management continued
Appendices
Appendix A: Structure and governance
Appendix B: Solo entity performance
Appendix C: Quantitative reporting templates
Solvency & Financial Condition Report | 29
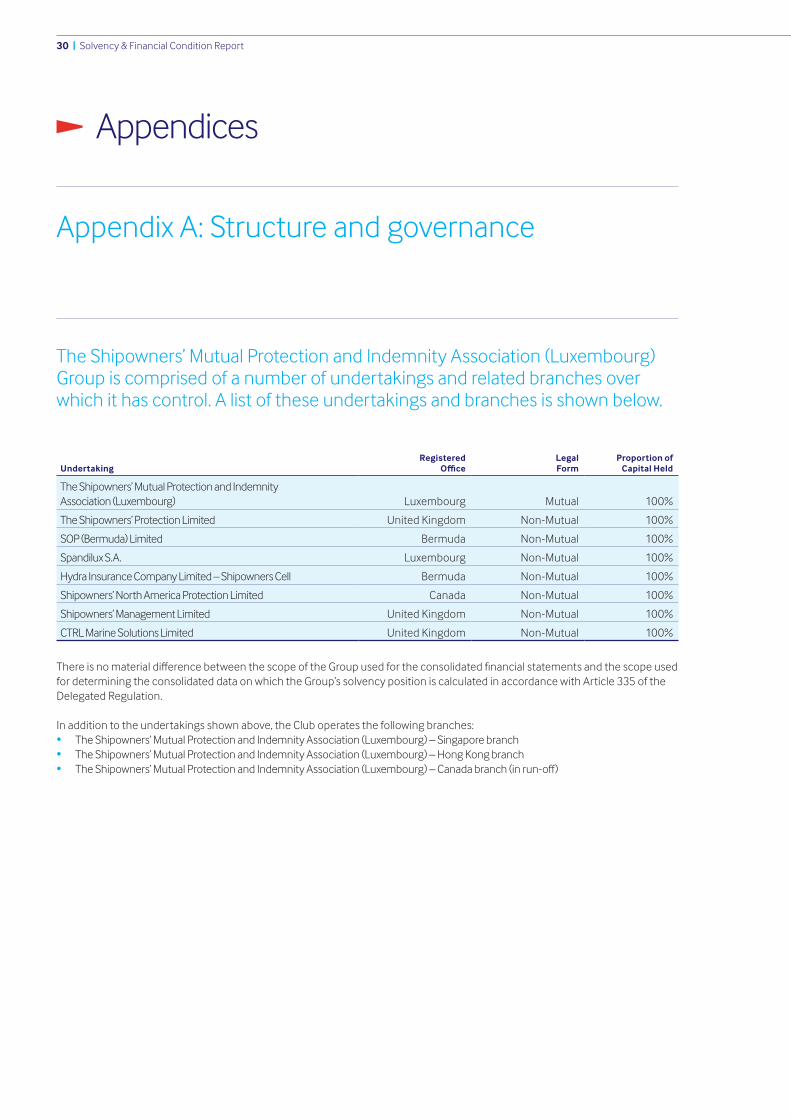
30 | Solvency & Financial Condition Report
UndertakingRegistered
OfficeLegalForm
Proportion ofCapital Held
The Shipowners’ Mutual Protection and Indemnity Association (Luxembourg) Luxembourg Mutual 100%
The Shipowners’ Protection Limited United Kingdom Non-Mutual 100%
SOP (Bermuda) Limited Bermuda Non-Mutual 100%
Spandilux S.A. Luxembourg Non-Mutual 100%
HydraInsuranceCompanyLimited–ShipownersCell Bermuda Non-Mutual 100%
Shipowners’ North America Protection Limited Canada Non-Mutual 100%
Shipowners’ Management Limited United Kingdom Non-Mutual 100%
CTRL Marine Solutions Limited United Kingdom Non-Mutual 100%
ThereisnomaterialdifferencebetweenthescopeoftheGroupusedfortheconsolidatedfinancialstatementsandthescopeusedfor determining the consolidated data on which the Group’s solvency position is calculated in accordance with Article 335 of the Delegated Regulation.
In addition to the undertakings shown above, the Club operates the following branches: • The Shipowners’ Mutual Protection and Indemnity Association (Luxembourg) – Singapore branch • TheShipowners’MutualProtectionandIndemnityAssociation(Luxembourg)–HongKongbranch • TheShipowners’MutualProtectionandIndemnityAssociation(Luxembourg)–Canadabranch(inrun-off)
The Shipowners’ Mutual Protection and Indemnity Association (Luxembourg) Group is comprised of a number of undertakings and related branches over which it has control. A list of these undertakings and branches is shown below.
Appendices
Appendix A: Structure and governance
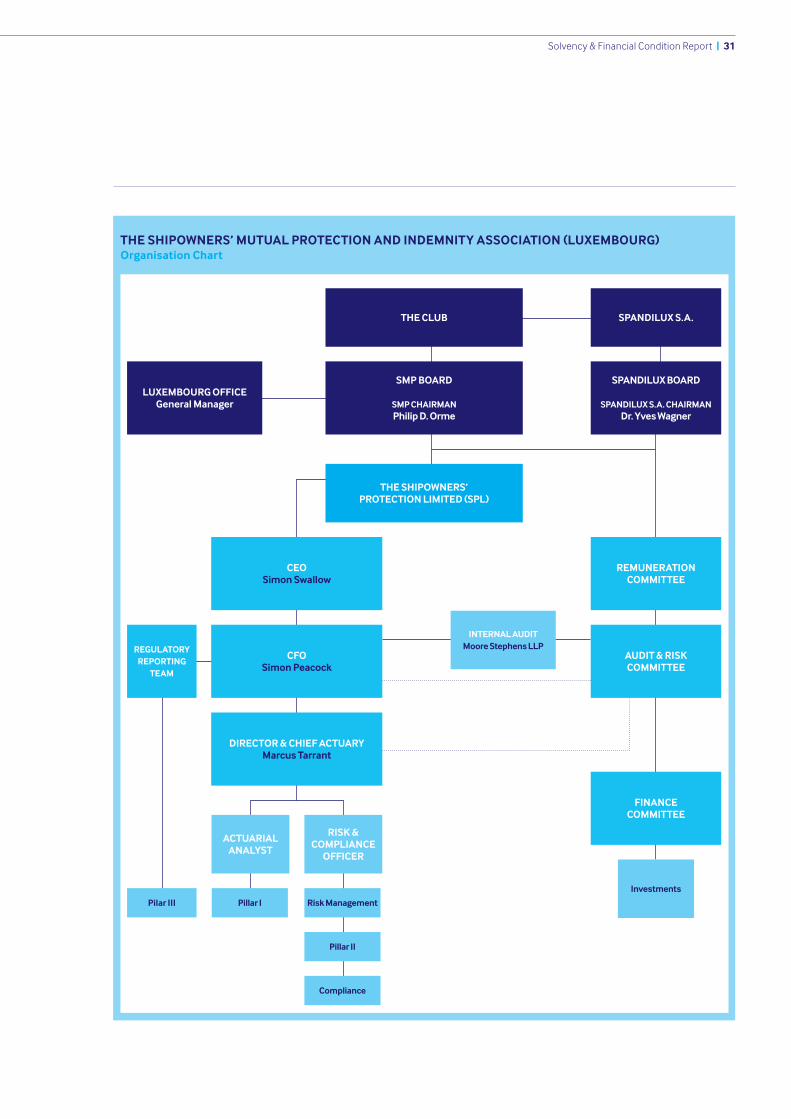
Solvency & Financial Condition Report | 31
THE SHIPOWNERS’ MUTUAL PROTECTION AND INDEMNITY ASSOCIATION (LUXEMBOURG)Organisation Chart
SMP BOARD
SMP CHAIRMANPhilip D. Orme
REGULATORY REPORTING
TEAM
Investments
LUXEMBOURG OFFICEGeneral Manager
SPANDILUX BOARD
SPANDILUX S.A. CHAIRMANDr. Yves Wagner
REMUNERATION COMMITTEE
AUDIT & RISK COMMITTEE
CEOSimon Swallow
CFOSimon Peacock
DIRECTOR & CHIEF ACTUARYMarcus Tarrant
Pilar III
FINANCE COMMITTEE
SPANDILUX S.A.
THE SHIPOWNERS’ PROTECTION LIMITED (SPL)
ACTUARIAL ANALYST
RISK & COMPLIANCE
OFFICER
Pillar I
Compliance
Pillar II
Risk Management
THE CLUB
INTERNAL AUDITMoore Stephens LLP
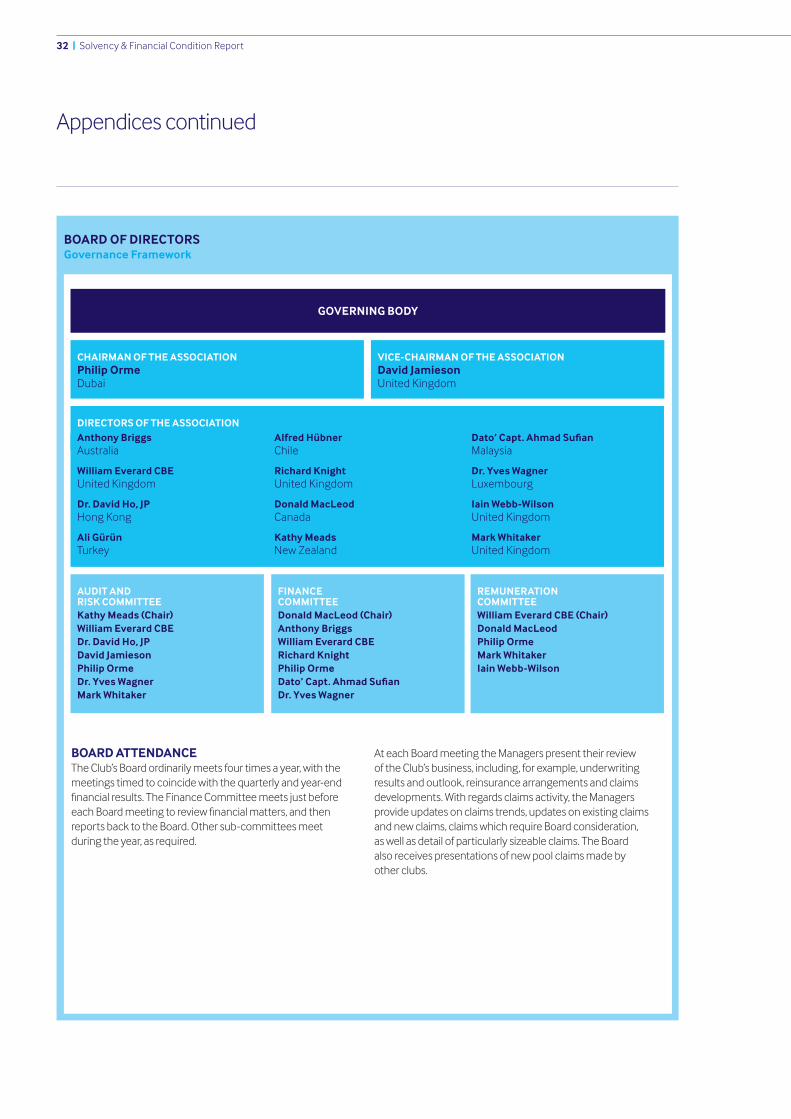
32 | Solvency & Financial Condition Report
BOARD ATTENDANCEThe Club’s Board ordinarily meets four times a year, with the meetings timed to coincide with the quarterly and year-end financialresults.TheFinanceCommitteemeetsjustbeforeeachBoardmeetingtoreviewfinancialmatters,andthenreports back to the Board. Other sub-committees meet during the year, as required.
At each Board meeting the Managers present their review of the Club’s business, including, for example, underwriting results and outlook, reinsurance arrangements and claims developments. With regards claims activity, the Managers provide updates on claims trends, updates on existing claims and new claims, claims which require Board consideration, as well as detail of particularly sizeable claims. The Board also receives presentations of new pool claims made by other clubs.
BOARD OF DIRECTORSGovernance Framework
GOVERNING BODY
DIRECTORS OF THE ASSOCIATIONAnthony BriggsAustralia
William Everard CBEUnited Kingdom
Dr. David Ho, JPHongKong
Ali GürünTurkey
Alfred HübnerChile
Richard KnightUnited Kingdom
Donald MacLeodCanada
Kathy MeadsNew Zealand
Dato’ Capt. Ahmad SufianMalaysia
Dr. Yves WagnerLuxembourg
Iain Webb-WilsonUnited Kingdom
Mark WhitakerUnited Kingdom
REMUNERATION COMMITTEEWilliam Everard CBE (Chair)Donald MacLeodPhilip OrmeMark WhitakerIain Webb-Wilson
AUDIT AND RISK COMMITTEEKathy Meads (Chair)William Everard CBEDr. David Ho, JPDavid JamiesonPhilip OrmeDr. Yves WagnerMark Whitaker
FINANCE COMMITTEEDonald MacLeod (Chair)Anthony BriggsWilliam Everard CBERichard KnightPhilip OrmeDato’ Capt. Ahmad SufianDr. Yves Wagner
CHAIRMAN OF THE ASSOCIATIONPhilip OrmeDubai
VICE-CHAIRMAN OF THE ASSOCIATIONDavid JamiesonUnited Kingdom
Appendices continued
Solvency & Financial Condition Report | 33
THE COMMITTEES AND THEIR RESPONSIBILITIES
The Board
• Determining strategic objectives, acceptable level of risk and key policies
• Effectivedischargeofitsobligationsandmeetingatleast once a quarter in order to monitor the development of the Club’s activities
• Delegation to the Club Managers, The Shipowners’ Protection Limited, a wholly owned subsidiary of the Club, of operational management of the Club while maintaining ultimate oversight of, and responsibility for the management
• Providing oversight through scrutiny at every quarterly meeting of the Club’s business operation on the basis of reports prepared by the Managers
• Engaging in constructive and critical discussion of the strategy and key policies put forward by the Managers and contributing to their development
Audit and Risk Committee
• Monitoringtheintegrityofthefinancialreportingprocess andthefinancialstatementsandanyformalannouncementsrelatingtofinancialperformance
• Reporting to the Board on the statutory audit outcome anditscontributiontotheintegrityoffinancialreporting
• ReviewingtheClub’ssignificantaccountingpoliciesand any changes to them
• Making recommendations to the Board and its subsidiaries as to the terms of engagement, including the remuneration, of the external auditors
• Reviewing the external auditors’ independence and objectivity, including with respect to any non-audit services
• Reviewingwiththeexternalauditorsthefindingsof their work
• Reviewingtheeffectivenessofthecorporategovernanceframework and other operational matters required under Solvency II
• Reviewingtheeffectivenessoftheinternalcontroland risk management systems
• Maintaining oversight of the Club’s risk and regulatory compliance processes and procedures and monitoring theireffectiveness
• Monitoringsignificantriskandregulatorymattersaffectingthe Club and resolution of any material compliance or regulatory breaches or other matters arising
Finance Committee
• Monitoring and reporting to the Board the quarterly financialpositionoftheClub,includingtheannual financialstatements
• MonitoringkeySolvencyIIfinancialandsolvencymeasures
• Making recommendation to the Board and its subsidiaries onannualexpenseplansandbudgets,specificcapitalprojects, acquisitions, joint ventures and divestitures, structure, initiatives and regulatory matters
• Investment strategy, including plans and strategies for hedging and mitigating risk, foreign currency exchange, interest rate exposure and other risk exposures
• Appointment and terms of engagement, including remuneration, of the external investment managers
• Monitoring and reporting to the Board on the performance of the external investment managers
• Liaising with the subsidiary companies as applicable on implementation of the above matters
Remuneration Committee
• Determining and agreeing employment, termination andretirementconditions,andremunerationandbenefitpackages of senior employees
• Reviewing the overall annual percentage increase in managementcompanystaffsalariesandthestructure and application of the discretionary bonus scheme
• Monitoring and reviewing succession planning for senior management including prospective senior appointments
• Agreeing appropriate levels of remuneration for Directors of the Club and its subsidiary companies
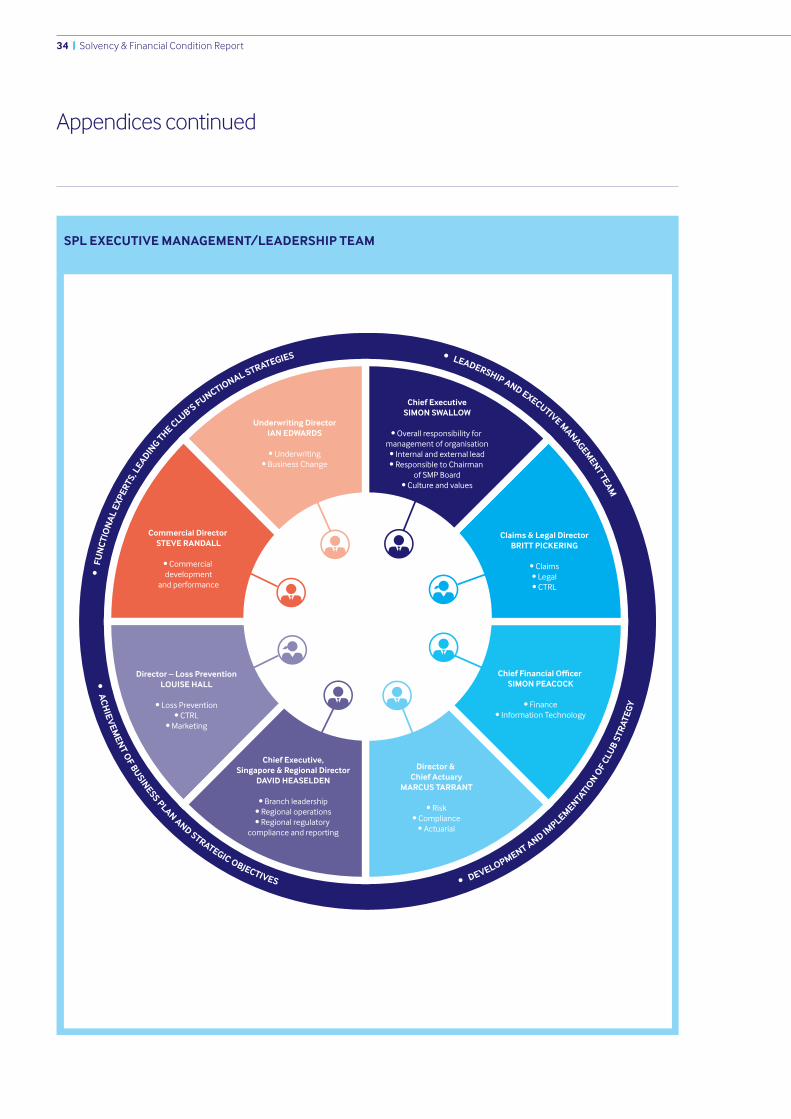
34 | Solvency & Financial Condition Report
SPL EXECUTIVE MANAGEMENT/LEADERSHIP TEAM
Underwriting DirectorIAN EDWARDS
• Underwriting• Business Change
Commercial Director STEVE RANDALL
• Commercial development
and performance
Director – Loss PreventionLOUISE HALL
• Loss Prevention• CTRL
• Marketing
Chief Executive,Singapore & Regional Director
DAVID HEASELDEN
• Branch leadership• Regional operations• Regional regulatory
compliance and reporting
Director & Chief Actuary
MARCUS TARRANT
• Risk• Compliance
• Actuarial
Chief Financial Officer SIMON PEACOCK
• Finance• Information Technology
Claims & Legal DirectorBRITT PICKERING
• Claims• Legal• CTRL
Chief ExecutiveSIMON SWALLOW
• Overall responsibility for management of organisation
• Internal and external lead• Responsible to Chairman
of SMP Board• Culture and values
• F
UN
CTIO
NA
L EX
PERT
S, L
EADING THE CLUB’S FUNCTIONAL STRATEGIES
• AC
HIEV
EMEN
T OF BUSINESS PLAN AND STRATEGIC OBJECTIVES • DEVELOPMENT AND IM
PLEMENTATIO
N OF
CLUB
STR
ATEG
Y
• LEADERSHIP AND EXECUTIVE MANAGEMENT TEAM
Appendices continued
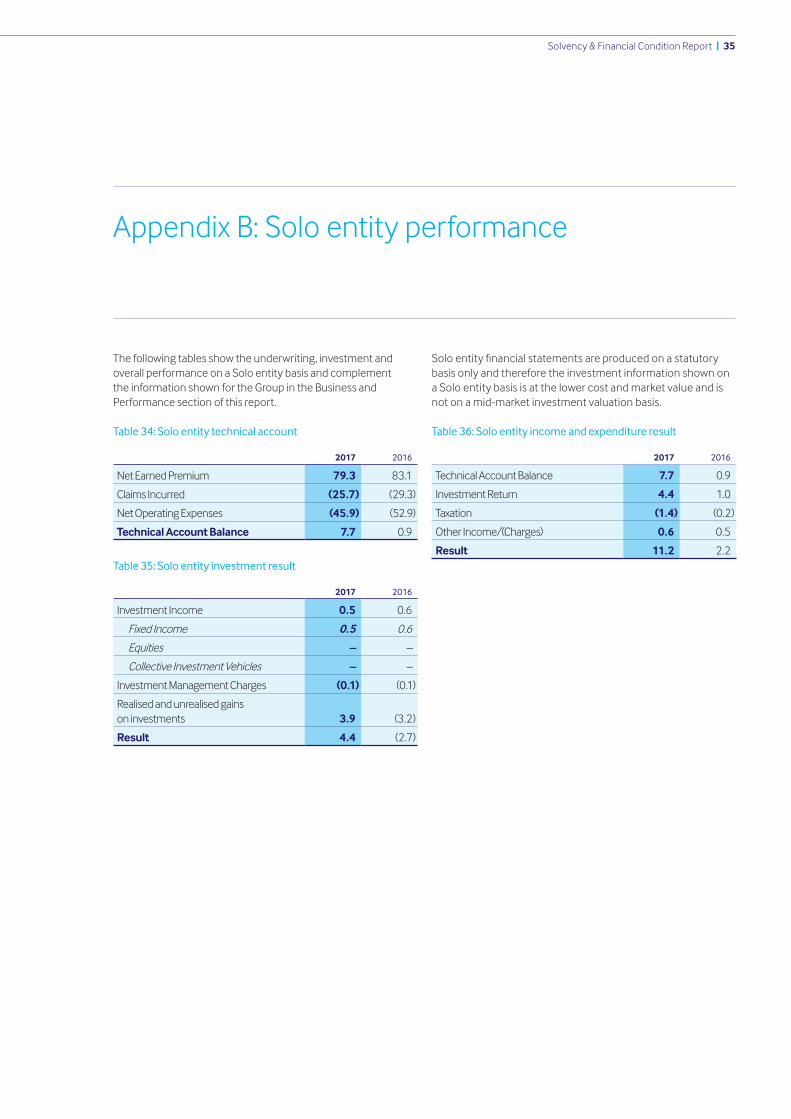
Solvency & Financial Condition Report | 35
The following tables show the underwriting, investment and overall performance on a Solo entity basis and complement the information shown for the Group in the Business and Performance section of this report.
Table 34: Solo entity technical account
2017 2016
Net Earned Premium 79.3 83.1
Claims Incurred (25.7) (29.3)
Net Operating Expenses (45.9) (52.9)
Technical Account Balance 7.7 0.9
Table 35: Solo entity investment result
2017 2016
Investment Income 0.5 0.6
Fixed Income 0.5 0.6
Equities – –
Collective Investment Vehicles – –
Investment Management Charges (0.1) (0.1)
Realised and unrealised gains on investments 3.9 (3.2)
Result 4.4 (2.7)
Soloentityfinancialstatementsareproducedonastatutorybasis only and therefore the investment information shown on a Solo entity basis is at the lower cost and market value and is not on a mid-market investment valuation basis.
Table 36: Solo entity income and expenditure result
2017 2016
Technical Account Balance 7.7 0.9
Investment Return 4.4 1.0
Taxation (1.4) (0.2)
Other Income/(Charges) 0.6 0.5
Result 11.2 2.2
Appendix B: Solo entity performance
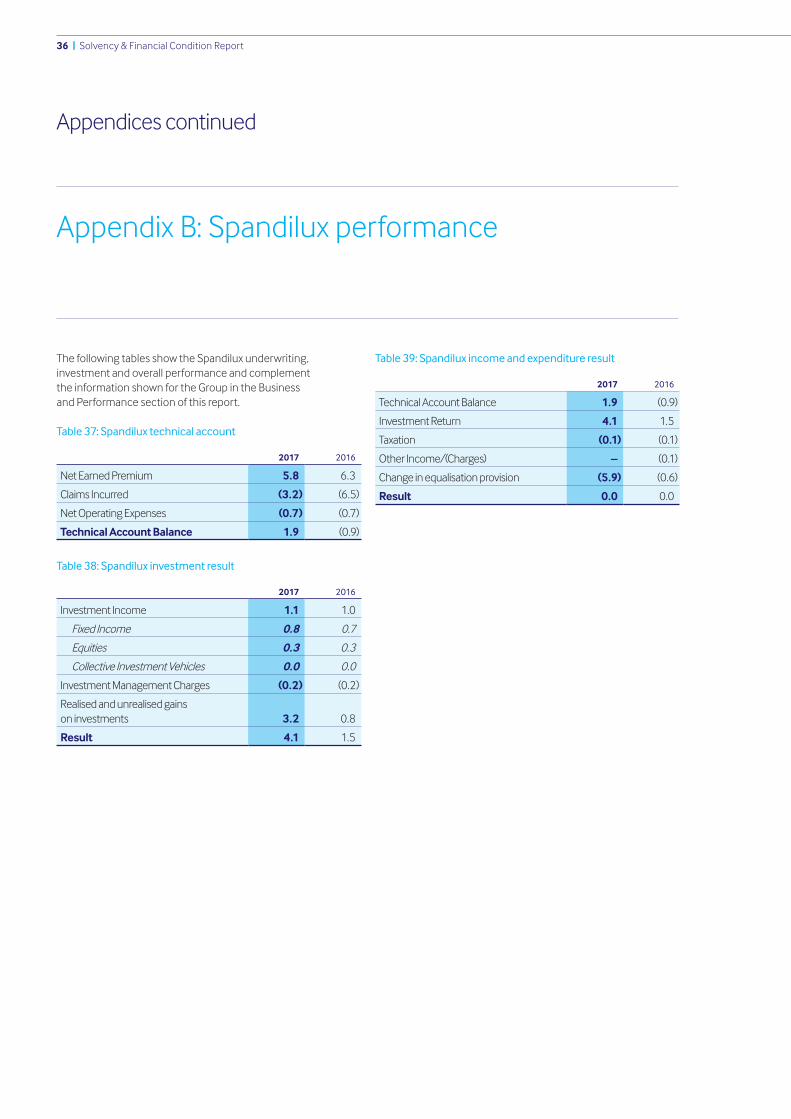
36 | Solvency & Financial Condition Report
The following tables show the Spandilux underwriting, investment and overall performance and complement the information shown for the Group in the Business and Performance section of this report.
Table 37: Spandilux technical account
2017 2016
Net Earned Premium 5.8 6.3
Claims Incurred (3.2) (6.5)
Net Operating Expenses (0.7) (0.7)
Technical Account Balance 1.9 (0.9)
Table 38: Spandilux investment result
2017 2016
Investment Income 1.1 1.0
Fixed Income 0.8 0.7
Equities 0.3 0.3
Collective Investment Vehicles 0.0 0.0
Investment Management Charges (0.2) (0.2)
Realised and unrealised gains on investments 3.2 0.8
Result 4.1 1.5
Table 39: Spandilux income and expenditure result
2017 2016
Technical Account Balance 1.9 (0.9)
Investment Return 4.1 1.5
Taxation (0.1) (0.1)
Other Income/(Charges) – (0.1)
Change in equalisation provision (5.9) (0.6)
Result 0.0 0.0
Appendix B: Spandilux performance
Appendices continued

Solvency & Financial Condition Report | 37
Appendix C: Quantitative reporting templates
The Shipowners' Mutual Protection and Indemnity Association (Luxembourg)
Solvency and Financial Condition Report
GROUP DISCLOSURES
31 December 2017
(Monetary amounts in US$ thousands)
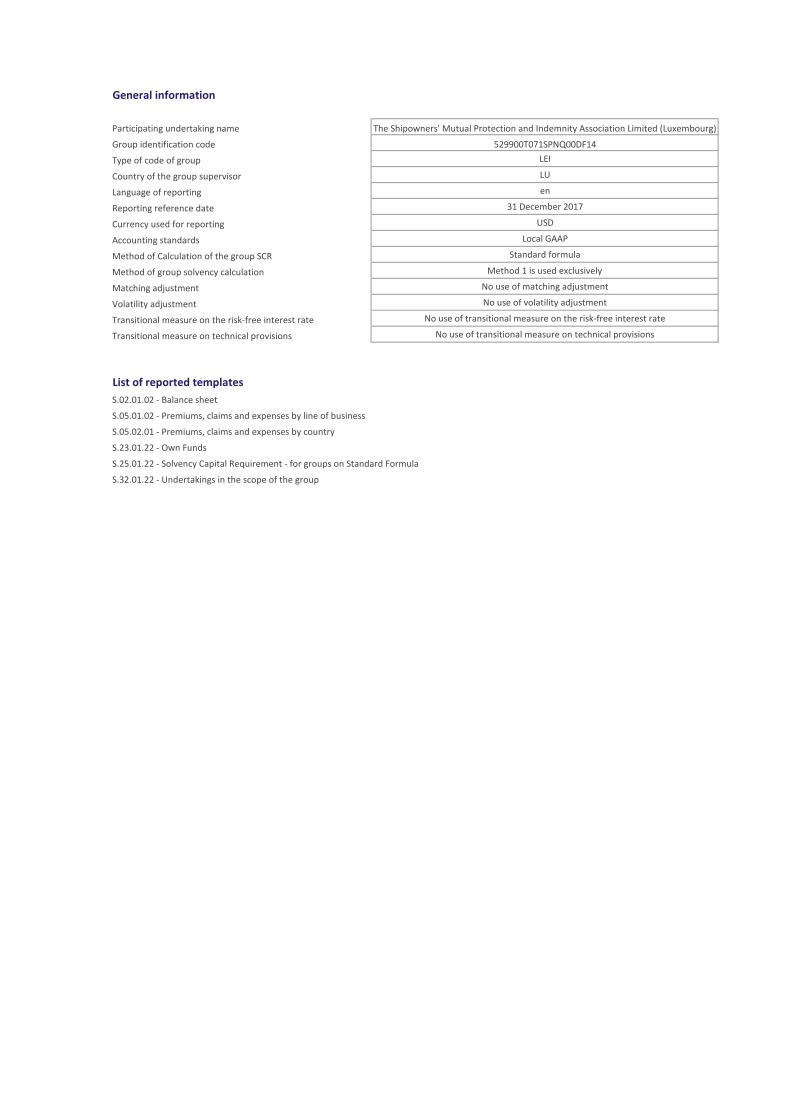
General information
Participating undertaking name The Shipowners' Mutual Protection and Indemnity Association Limited (Luxembourg)
Group identification code 529900T071SPNQ00DF14
Type of code of group LEI
Country of the group supervisor LU
Language of reporting en
Reporting reference date 31 December 2017
Currency used for reporting USD
Accounting standards Local GAAP
Method of Calculation of the group SCR Standard formula
Method of group solvency calculation Method 1 is used exclusively
Matching adjustment No use of matching adjustment
Volatility adjustment No use of volatility adjustment
Transitional measure on the risk-free interest rate No use of transitional measure on the risk-free interest rate
Transitional measure on technical provisions No use of transitional measure on technical provisions
List of reported templates
S.02.01.02 - Balance sheet
S.05.01.02 - Premiums, claims and expenses by line of business
S.05.02.01 - Premiums, claims and expenses by country
S.23.01.22 - Own Funds
S.25.01.22 - Solvency Capital Requirement - for groups on Standard Formula
S.32.01.22 - Undertakings in the scope of the group
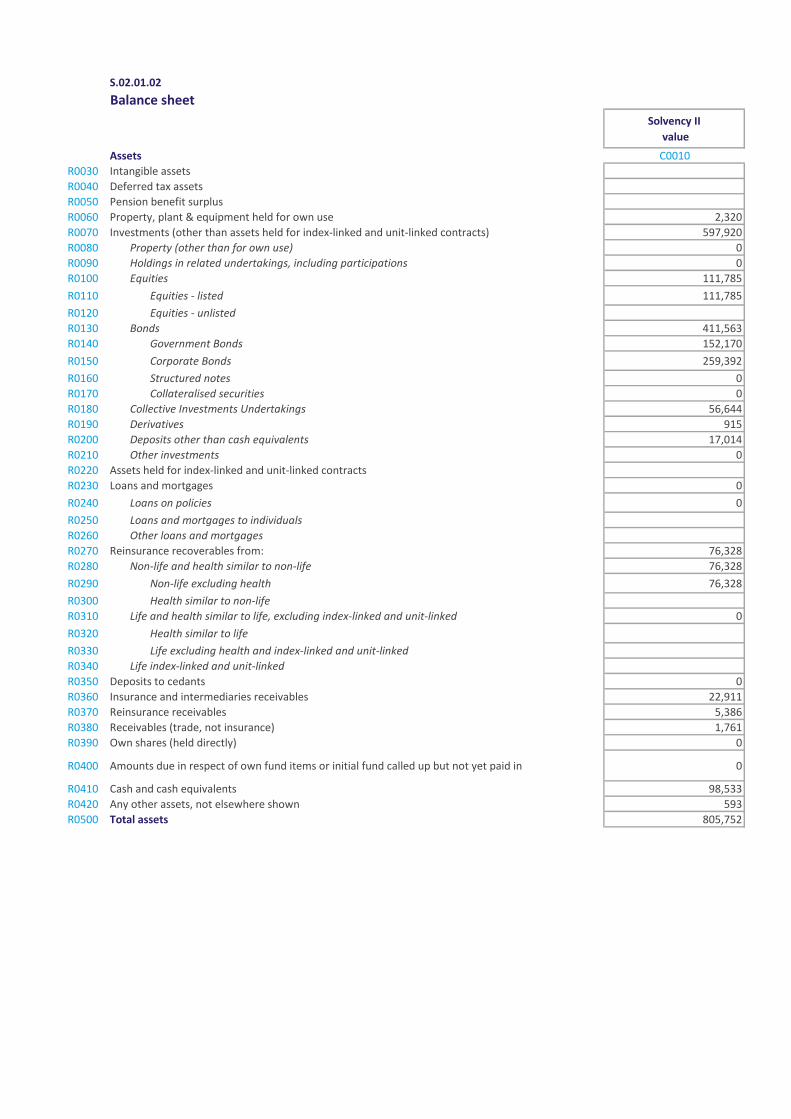
S.02.01.02
Balance sheet
Solvency II
value
Assets C0010
R0030 Intangible assets
R0040 Deferred tax assets
R0050 Pension benefit surplus
R0060 Property, plant & equipment held for own use 2,320
R0070 Investments (other than assets held for index-linked and unit-linked contracts) 597,920
R0080 Property (other than for own use) 0
R0090 Holdings in related undertakings, including participations 0
R0100 Equities 111,785
R0110 Equities - listed 111,785
R0120 Equities - unlisted
R0130 Bonds 411,563
R0140 Government Bonds 152,170
R0150 Corporate Bonds 259,392
R0160 Structured notes 0
R0170 Collateralised securities 0
R0180 Collective Investments Undertakings 56,644
R0190 Derivatives 915
R0200 Deposits other than cash equivalents 17,014
R0210 Other investments 0
R0220 Assets held for index-linked and unit-linked contracts
R0230 Loans and mortgages 0
R0240 Loans on policies 0
R0250 Loans and mortgages to individuals
R0260 Other loans and mortgages
R0270 Reinsurance recoverables from: 76,328
R0280 Non-life and health similar to non-life 76,328
R0290 Non-life excluding health 76,328
R0300 Health similar to non-life
R0310 Life and health similar to life, excluding index-linked and unit-linked 0
R0320 Health similar to life
R0330 Life excluding health and index-linked and unit-linked
R0340 Life index-linked and unit-linked
R0350 Deposits to cedants 0
R0360 Insurance and intermediaries receivables 22,911
R0370 Reinsurance receivables 5,386
R0380 Receivables (trade, not insurance) 1,761
R0390 Own shares (held directly) 0
R0400 Amounts due in respect of own fund items or initial fund called up but not yet paid in 0
R0410 Cash and cash equivalents 98,533
R0420 Any other assets, not elsewhere shown 593
R0500 Total assets 805,752
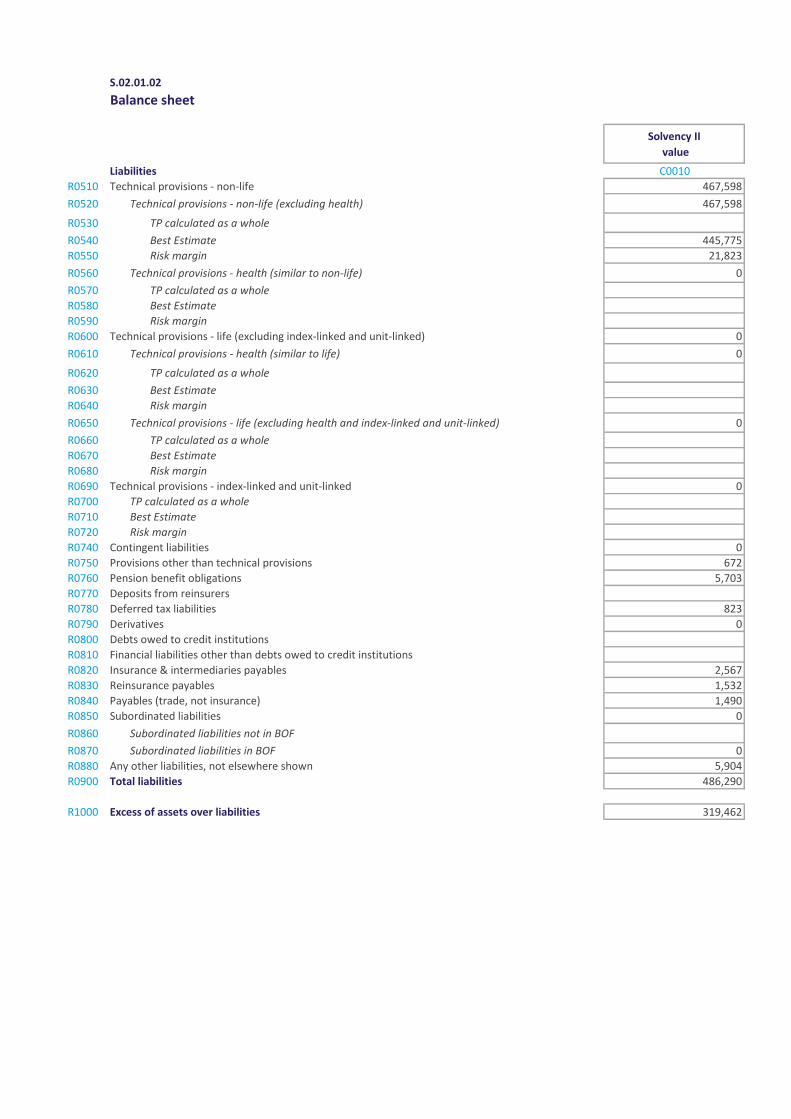
S.02.01.02
Balance sheet
Solvency II
value
Liabilities C0010
R0510 Technical provisions - non-life 467,598
R0520 Technical provisions - non-life (excluding health) 467,598
R0530 TP calculated as a whole
R0540 Best Estimate 445,775
R0550 Risk margin 21,823
R0560 Technical provisions - health (similar to non-life) 0
R0570 TP calculated as a whole
R0580 Best Estimate
R0590 Risk margin
R0600 Technical provisions - life (excluding index-linked and unit-linked) 0
R0610 Technical provisions - health (similar to life) 0
R0620 TP calculated as a whole
R0630 Best Estimate
R0640 Risk margin
R0650 Technical provisions - life (excluding health and index-linked and unit-linked) 0
R0660 TP calculated as a whole
R0670 Best Estimate
R0680 Risk margin
R0690 Technical provisions - index-linked and unit-linked 0
R0700 TP calculated as a whole
R0710 Best Estimate
R0720 Risk margin
R0740 Contingent liabilities 0
R0750 Provisions other than technical provisions 672
R0760 Pension benefit obligations 5,703
R0770 Deposits from reinsurers
R0780 Deferred tax liabilities 823
R0790 Derivatives 0
R0800 Debts owed to credit institutions
R0810 Financial liabilities other than debts owed to credit institutions
R0820 Insurance & intermediaries payables 2,567
R0830 Reinsurance payables 1,532
R0840 Payables (trade, not insurance) 1,490
R0850 Subordinated liabilities 0
R0860 Subordinated liabilities not in BOF
R0870 Subordinated liabilities in BOF 0
R0880 Any other liabilities, not elsewhere shown 5,904
R0900 Total liabilities 486,290
R1000 Excess of assets over liabilities 319,462
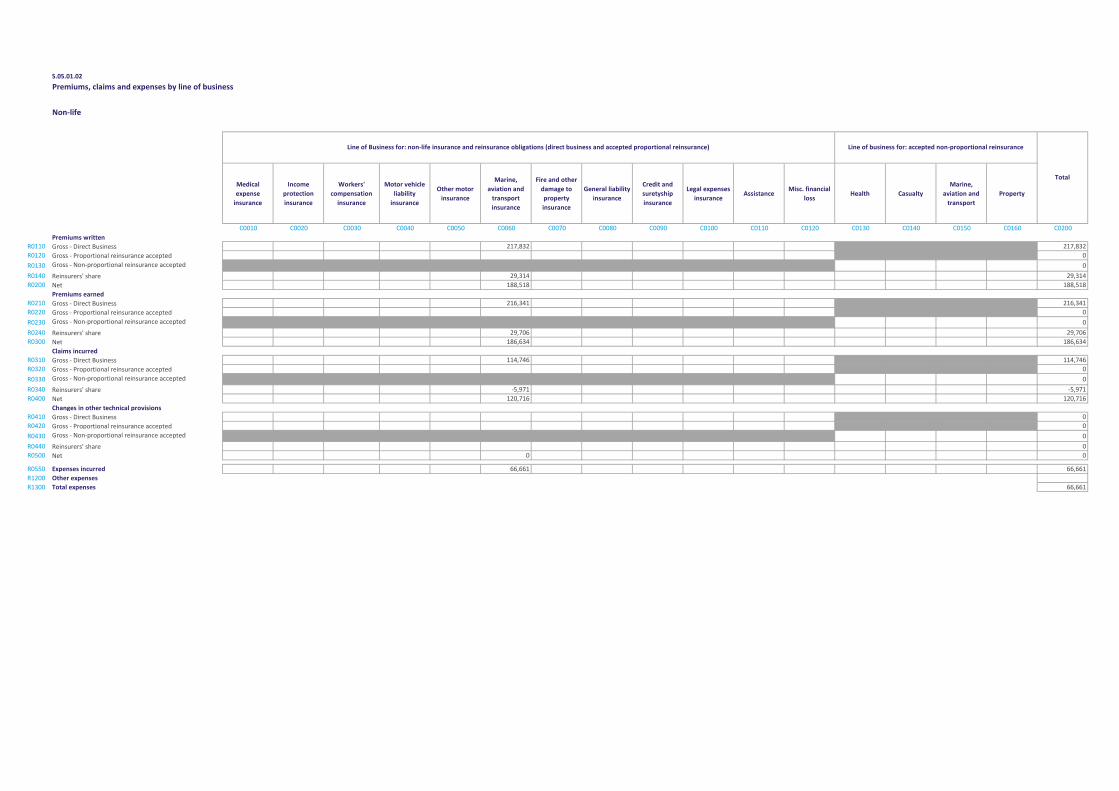
S.05.01.02
Non-life
Medical
expense
insurance
Income
protection
insurance
Workers'
compensation
insurance
Motor vehicle
liability
insurance
Other motor
insurance
Marine,
aviation and
transport
insurance
Fire and other
damage to
property
insurance
General liability
insurance
Credit and
suretyship
insurance
Legal expenses
insuranceAssistance
Misc. financial
lossHealth Casualty
Marine,
aviation and
transport
Property
C0010 C0020 C0030 C0040 C0050 C0060 C0070 C0080 C0090 C0100 C0110 C0120 C0130 C0140 C0150 C0160 C0200
Premiums writtenR0110 Gross - Direct Business 217,832 217,832
R0120 Gross - Proportional reinsurance accepted 0
R0130 Gross - Non-proportional reinsurance accepted 0
R0140 Reinsurers' share 29,314 29,314
R0200 Net 188,518 188,518
Premiums earnedR0210 Gross - Direct Business 216,341 216,341
R0220 Gross - Proportional reinsurance accepted 0
R0230 Gross - Non-proportional reinsurance accepted 0
R0240 Reinsurers' share 29,706 29,706
R0300 Net 186,634 186,634
Claims incurred
R0310 Gross - Direct Business 114,746 114,746
R0320 Gross - Proportional reinsurance accepted 0
R0330 Gross - Non-proportional reinsurance accepted 0
R0340 Reinsurers' share -5,971 -5,971
R0400 Net 120,716 120,716
Changes in other technical provisions
R0410 Gross - Direct Business 0
R0420 Gross - Proportional reinsurance accepted 0
R0430 Gross - Non-proportional reinsurance accepted 0
R0440 Reinsurers' share 0
R0500 Net 0 0
R0550 Expenses incurred 66,661 66,661
R1200 Other expenses
R1300 Total expenses 66,661
Premiums, claims and expenses by line of business
Line of Business for: non-life insurance and reinsurance obligations (direct business and accepted proportional reinsurance) Line of business for: accepted non-proportional reinsurance
Total
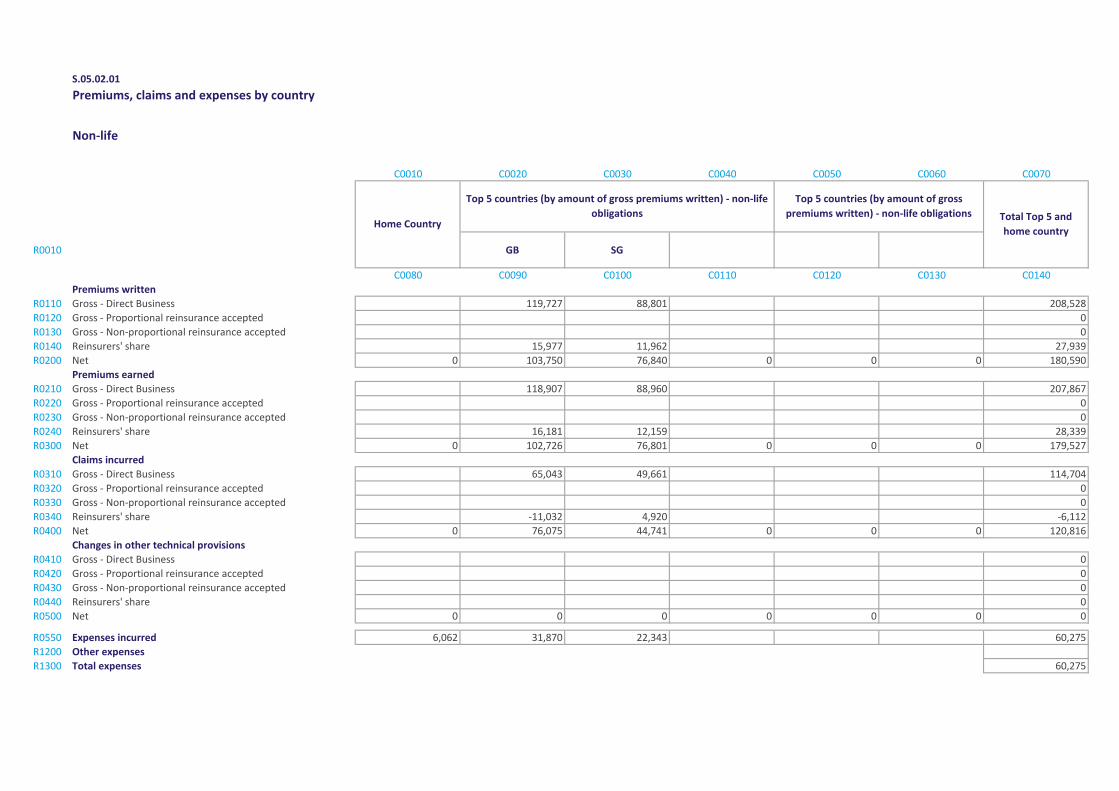
S.05.02.01
Premiums, claims and expenses by country
Non-life
C0010 C0020 C0030 C0040 C0050 C0060 C0070
R0010 GB SG
C0080 C0090 C0100 C0110 C0120 C0130 C0140
Premiums written
R0110 Gross - Direct Business 119,727 88,801 208,528
R0120 Gross - Proportional reinsurance accepted 0
R0130 Gross - Non-proportional reinsurance accepted 0
R0140 Reinsurers' share 15,977 11,962 27,939
R0200 Net 0 103,750 76,840 0 0 0 180,590
Premiums earned
R0210 Gross - Direct Business 118,907 88,960 207,867
R0220 Gross - Proportional reinsurance accepted 0
R0230 Gross - Non-proportional reinsurance accepted 0
R0240 Reinsurers' share 16,181 12,159 28,339
R0300 Net 0 102,726 76,801 0 0 0 179,527
Claims incurred
R0310 Gross - Direct Business 65,043 49,661 114,704
R0320 Gross - Proportional reinsurance accepted 0
R0330 Gross - Non-proportional reinsurance accepted 0
R0340 Reinsurers' share -11,032 4,920 -6,112
R0400 Net 0 76,075 44,741 0 0 0 120,816
Changes in other technical provisions
R0410 Gross - Direct Business 0
R0420 Gross - Proportional reinsurance accepted 0
R0430 Gross - Non-proportional reinsurance accepted 0
R0440 Reinsurers' share 0
R0500 Net 0 0 0 0 0 0 0
R0550 Expenses incurred 6,062 31,870 22,343 60,275
R1200 Other expenses
R1300 Total expenses 60,275
Home Country
Top 5 countries (by amount of gross premiums written) - non-life
obligations
Top 5 countries (by amount of gross
premiums written) - non-life obligations Total Top 5 and
home country
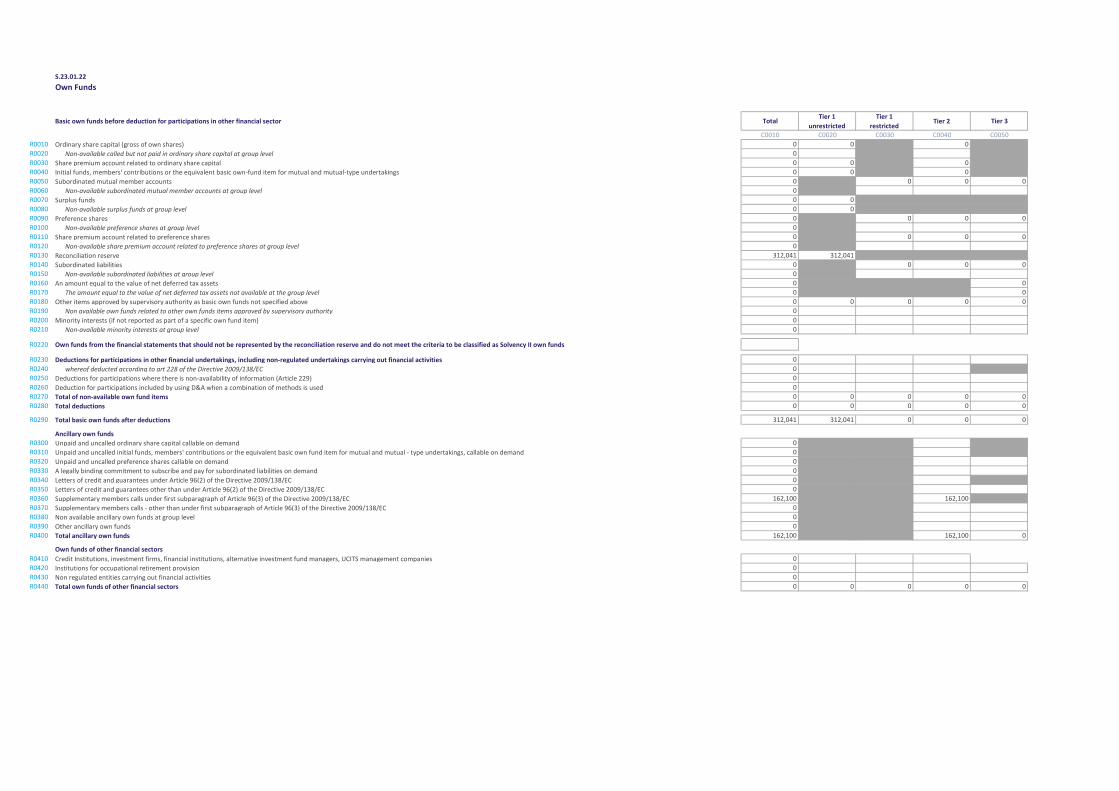
S.23.01.22
Own Funds
Basic own funds before deduction for participations in other financial sector TotalTier 1
unrestricted
Tier 1
restrictedTier 2 Tier 3
C0010 C0020 C0030 C0040 C0050
R0010 Ordinary share capital (gross of own shares) 0 0 0
R0020 Non-available called but not paid in ordinary share capital at group level 0
R0030 Share premium account related to ordinary share capital 0 0 0
R0040 Initial funds, members' contributions or the equivalent basic own-fund item for mutual and mutual-type undertakings 0 0 0
R0050 Subordinated mutual member accounts 0 0 0 0
R0060 Non-available subordinated mutual member accounts at group level 0
R0070 Surplus funds 0 0
R0080 Non-available surplus funds at group level 0 0
R0090 Preference shares 0 0 0 0
R0100 Non-available preference shares at group level 0
R0110 Share premium account related to preference shares 0 0 0 0
R0120 Non-available share premium account related to preference shares at group level 0
R0130 Reconciliation reserve 312,041 312,041
R0140 Subordinated liabilities 0 0 0 0
R0150 Non-available subordinated liabilities at group level 0
R0160 An amount equal to the value of net deferred tax assets 0 0
R0170 The amount equal to the value of net deferred tax assets not available at the group level 0 0
R0180 Other items approved by supervisory authority as basic own funds not specified above 0 0 0 0 0
R0190 Non available own funds related to other own funds items approved by supervisory authority 0
R0200 Minority interests (if not reported as part of a specific own fund item) 0
R0210 Non-available minority interests at group level 0
R0220 Own funds from the financial statements that should not be represented by the reconciliation reserve and do not meet the criteria to be classified as Solvency II own funds
R0230 Deductions for participations in other financial undertakings, including non-regulated undertakings carrying out financial activities 0
R0240 whereof deducted according to art 228 of the Directive 2009/138/EC 0
R0250 Deductions for participations where there is non-availability of information (Article 229) 0
R0260 Deduction for participations included by using D&A when a combination of methods is used 0
R0270 Total of non-available own fund items 0 0 0 0 0
R0280 Total deductions 0 0 0 0 0
R0290 Total basic own funds after deductions 312,041 312,041 0 0 0
Ancillary own fundsR0300 Unpaid and uncalled ordinary share capital callable on demand 0
R0310 Unpaid and uncalled initial funds, members' contributions or the equivalent basic own fund item for mutual and mutual - type undertakings, callable on demand 0
R0320 Unpaid and uncalled preference shares callable on demand 0
R0330 A legally binding commitment to subscribe and pay for subordinated liabilities on demand 0
R0340 Letters of credit and guarantees under Article 96(2) of the Directive 2009/138/EC 0
R0350 Letters of credit and guarantees other than under Article 96(2) of the Directive 2009/138/EC 0
R0360 Supplementary members calls under first subparagraph of Article 96(3) of the Directive 2009/138/EC 162,100 162,100
R0370 Supplementary members calls - other than under first subparagraph of Article 96(3) of the Directive 2009/138/EC 0
R0380 Non available ancillary own funds at group level 0
R0390 Other ancillary own funds 0
R0400 Total ancillary own funds 162,100 162,100 0
Own funds of other financial sectors
R0410 Credit Institutions, investment firms, financial institutions, alternative investment fund managers, UCITS management companies 0
R0420 Institutions for occupational retirement provision 0
R0430 Non regulated entities carrying out financial activities 0
R0440 Total own funds of other financial sectors 0 0 0 0 0
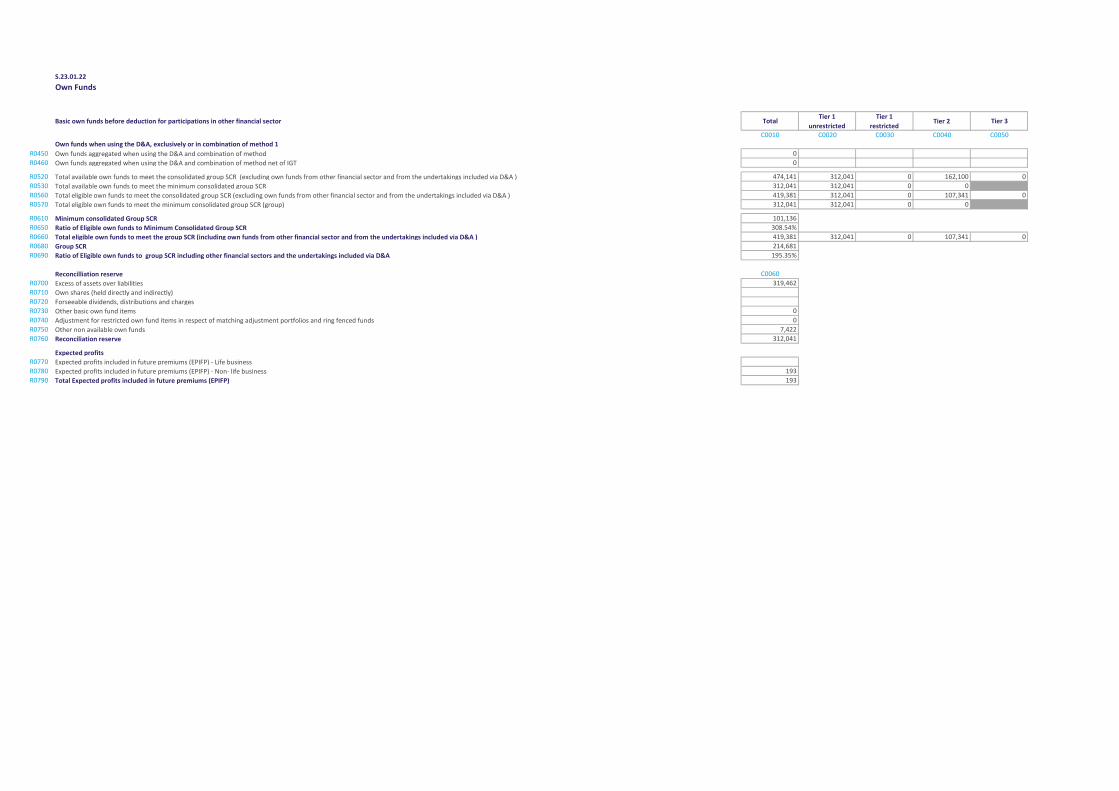
S.23.01.22
Own Funds
Basic own funds before deduction for participations in other financial sector TotalTier 1
unrestricted
Tier 1
restrictedTier 2 Tier 3
C0010 C0020 C0030 C0040 C0050
Own funds when using the D&A, exclusively or in combination of method 1
R0450 Own funds aggregated when using the D&A and combination of method 0
R0460 Own funds aggregated when using the D&A and combination of method net of IGT 0
R0520 Total available own funds to meet the consolidated group SCR (excluding own funds from other financial sector and from the undertakings included via D&A ) 474,141 312,041 0 162,100 0
R0530 Total available own funds to meet the minimum consolidated group SCR 312,041 312,041 0 0
R0560 Total eligible own funds to meet the consolidated group SCR (excluding own funds from other financial sector and from the undertakings included via D&A ) 419,381 312,041 0 107,341 0
R0570 Total eligible own funds to meet the minimum consolidated group SCR (group) 312,041 312,041 0 0
R0610 Minimum consolidated Group SCR 101,136
R0650 Ratio of Eligible own funds to Minimum Consolidated Group SCR 308.54%
R0660 Total eligible own funds to meet the group SCR (including own funds from other financial sector and from the undertakings included via D&A ) 419,381 312,041 0 107,341 0
R0680 Group SCR 214,681
R0690 Ratio of Eligible own funds to group SCR including other financial sectors and the undertakings included via D&A 195.35%
Reconcilliation reserve C0060
R0700 Excess of assets over liabilities 319,462
R0710 Own shares (held directly and indirectly)R0720 Forseeable dividends, distributions and chargesR0730 Other basic own fund items 0
R0740 Adjustment for restricted own fund items in respect of matching adjustment portfolios and ring fenced funds 0
R0750 Other non available own funds 7,422
R0760 Reconciliation reserve 312,041
Expected profitsR0770 Expected profits included in future premiums (EPIFP) - Life businessR0780 Expected profits included in future premiums (EPIFP) - Non- life business 193
R0790 Total Expected profits included in future premiums (EPIFP) 193
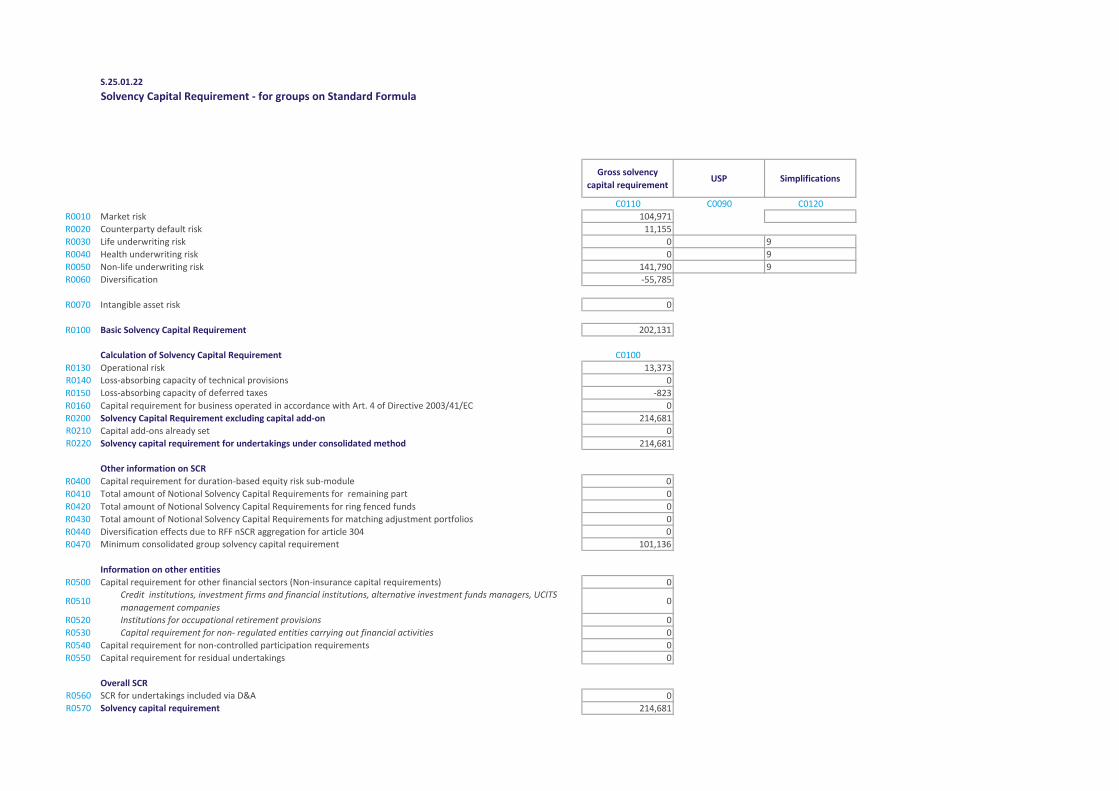
S.25.01.22
Solvency Capital Requirement - for groups on Standard Formula
Gross solvency
capital requirementUSP Simplifications
C0110 C0090 C0120
R0010 Market risk 104,971
R0020 Counterparty default risk 11,155
R0030 Life underwriting risk 0 9
R0040 Health underwriting risk 0 9
R0050 Non-life underwriting risk 141,790 9
R0060 Diversification -55,785
R0070 Intangible asset risk 0
R0100 Basic Solvency Capital Requirement 202,131
Calculation of Solvency Capital Requirement C0100
R0130 Operational risk 13,373
R0140 Loss-absorbing capacity of technical provisions 0
R0150 Loss-absorbing capacity of deferred taxes -823
R0160 Capital requirement for business operated in accordance with Art. 4 of Directive 2003/41/EC 0
R0200 Solvency Capital Requirement excluding capital add-on 214,681
R0210 Capital add-ons already set 0
R0220 Solvency capital requirement for undertakings under consolidated method 214,681
Other information on SCR
R0400 Capital requirement for duration-based equity risk sub-module 0
R0410 Total amount of Notional Solvency Capital Requirements for remaining part 0
R0420 Total amount of Notional Solvency Capital Requirements for ring fenced funds 0
R0430 Total amount of Notional Solvency Capital Requirements for matching adjustment portfolios 0
R0440 Diversification effects due to RFF nSCR aggregation for article 304 0
R0470 Minimum consolidated group solvency capital requirement 101,136
Information on other entities
R0500 Capital requirement for other financial sectors (Non-insurance capital requirements) 0
R0510Credit institutions, investment firms and financial institutions, alternative investment funds managers, UCITS
management companies 0
R0520 Institutions for occupational retirement provisions 0
R0530 Capital requirement for non- regulated entities carrying out financial activities 0
R0540 Capital requirement for non-controlled participation requirements 0
R0550 Capital requirement for residual undertakings 0
Overall SCR
R0560 SCR for undertakings included via D&A 0
R0570 Solvency capital requirement 214,681
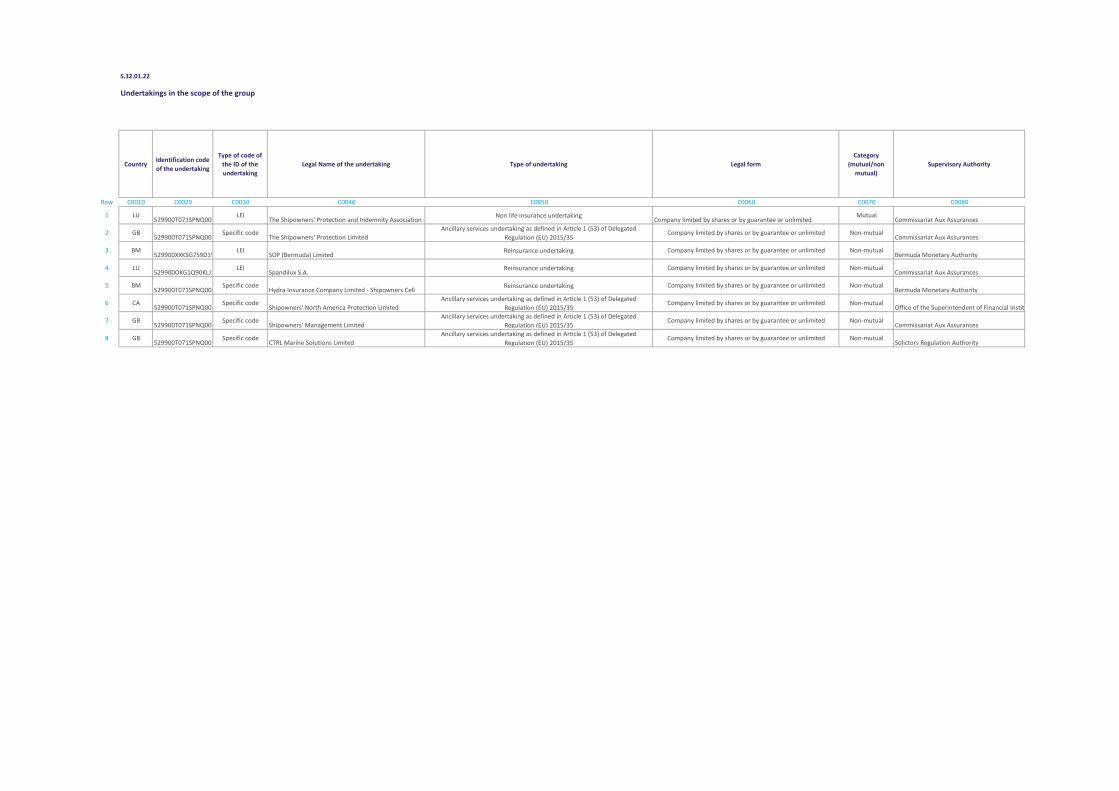
S.32.01.22
Undertakings in the scope of the group
CountryIdentification code
of the undertaking
Type of code of
the ID of the
undertaking
Legal Name of the undertaking Type of undertaking Legal form
Category
(mutual/non
mutual)
Supervisory Authority
Row C0010 C0020 C0030 C0040 C0050 C0060 C0070 C0080
1 LU529900T071SPNQ00DF14
LEIThe Shipowners' Protection and Indemnity Association (Luxembourg)
Non life insurance undertakingCompany limited by shares or by guarantee or unlimited
MutualCommissariat Aux Assurances
2 GB529900T071SPNQ00DF14GB00001
Specific codeThe Shipowners' Protection Limited
Ancillary services undertaking as defined in Article 1 (53) of Delegated
Regulation (EU) 2015/35Company limited by shares or by guarantee or unlimited Non-mutual
Commissariat Aux Assurances
3 BM529900XXKSG7S9D1W317
LEISOP (Bermuda) Limited
Reinsurance undertaking Company limited by shares or by guarantee or unlimited Non-mutualBermuda Monetary Authority
4 LU529900OKG1Q90KLJ3745
LEISpandilux S.A.
Reinsurance undertaking Company limited by shares or by guarantee or unlimited Non-mutualCommissariat Aux Assurances
5 BM529900T071SPNQ00DF14BM00001
Specific codeHydra Insurance Company Limited - Shipowners Cell
Reinsurance undertaking Company limited by shares or by guarantee or unlimited Non-mutualBermuda Monetary Authority
6 CA529900T071SPNQ00DF14GB00004
Specific codeShipowners' North America Protection Limited
Ancillary services undertaking as defined in Article 1 (53) of Delegated
Regulation (EU) 2015/35Company limited by shares or by guarantee or unlimited Non-mutual
Office of the Superintendent of Financial Institutions
7 GB529900T071SPNQ00DF14GB00003
Specific codeShipowners' Management Limited
Ancillary services undertaking as defined in Article 1 (53) of Delegated
Regulation (EU) 2015/35Company limited by shares or by guarantee or unlimited Non-mutual
Commissariat Aux Assurances
8 GB529900T071SPNQ00DF14GB00002
Specific codeCTRL Marine Solutions Limited
Ancillary services undertaking as defined in Article 1 (53) of Delegated
Regulation (EU) 2015/35Company limited by shares or by guarantee or unlimited Non-mutual
Solictors Regulation Authority
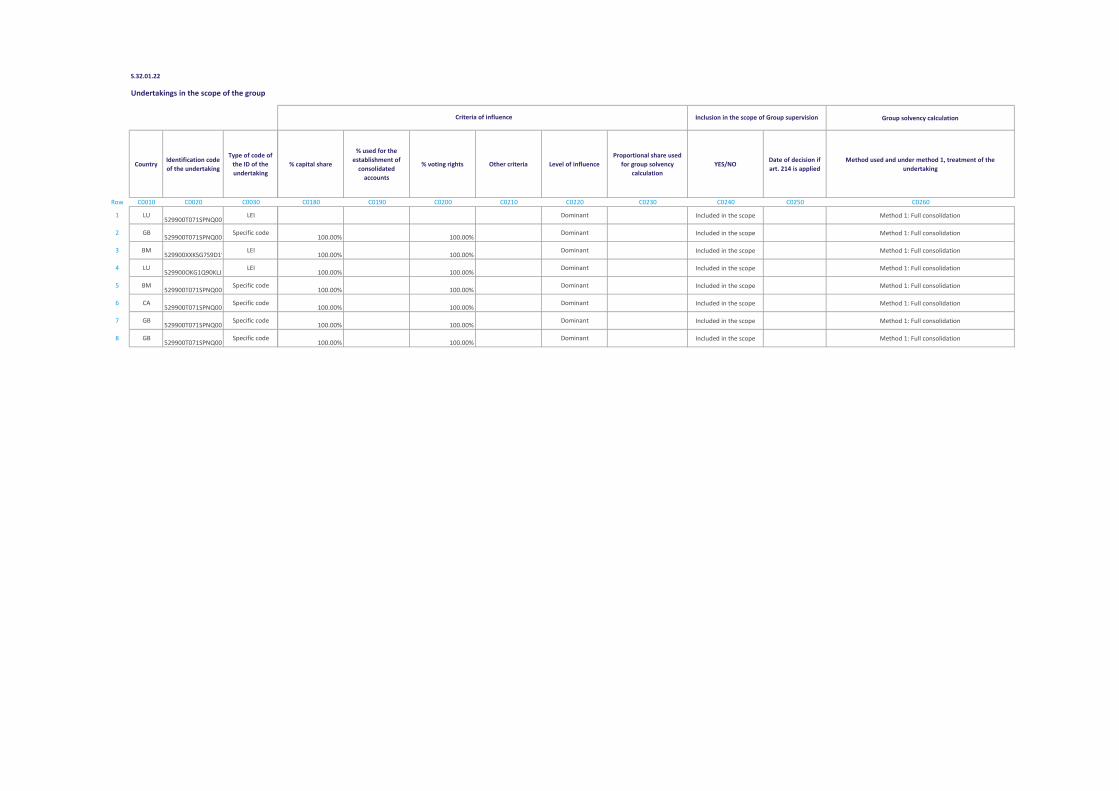
S.32.01.22
Undertakings in the scope of the group
CountryIdentification code
of the undertaking
Type of code of
the ID of the
undertaking
Row C0010 C0020 C0030
1 LU529900T071SPNQ00DF14
LEI
2 GB529900T071SPNQ00DF14GB00001
Specific code
3 BM529900XXKSG7S9D1W317
LEI
4 LU529900OKG1Q90KLJ3745
LEI
5 BM529900T071SPNQ00DF14BM00001
Specific code
6 CA529900T071SPNQ00DF14GB00004
Specific code
7 GB529900T071SPNQ00DF14GB00003
Specific code
8 GB529900T071SPNQ00DF14GB00002
Specific code
Group solvency calculation
% capital share
% used for the
establishment of
consolidated
accounts
% voting rights Other criteria Level of influence
Proportional share used
for group solvency
calculation
YES/NODate of decision if
art. 214 is applied
Method used and under method 1, treatment of the
undertaking
C0180 C0190 C0200 C0210 C0220 C0230 C0240 C0250 C0260
Dominant Included in the scope Method 1: Full consolidation
100.00% 100.00%Dominant Included in the scope Method 1: Full consolidation
100.00% 100.00%Dominant Included in the scope Method 1: Full consolidation
100.00% 100.00%Dominant Included in the scope Method 1: Full consolidation
100.00% 100.00%Dominant Included in the scope Method 1: Full consolidation
100.00% 100.00%Dominant Included in the scope Method 1: Full consolidation
100.00% 100.00%Dominant Included in the scope Method 1: Full consolidation
100.00% 100.00%Dominant Included in the scope Method 1: Full consolidation
Criteria of influence Inclusion in the scope of Group supervision
The Shipowners' Mutual Protection and Indemnity Association (Luxembourg)
Solvency and Financial Condition Report
SOLO DISCLOSURES
31 December 2017
(Monetary amounts in US$ thousands)
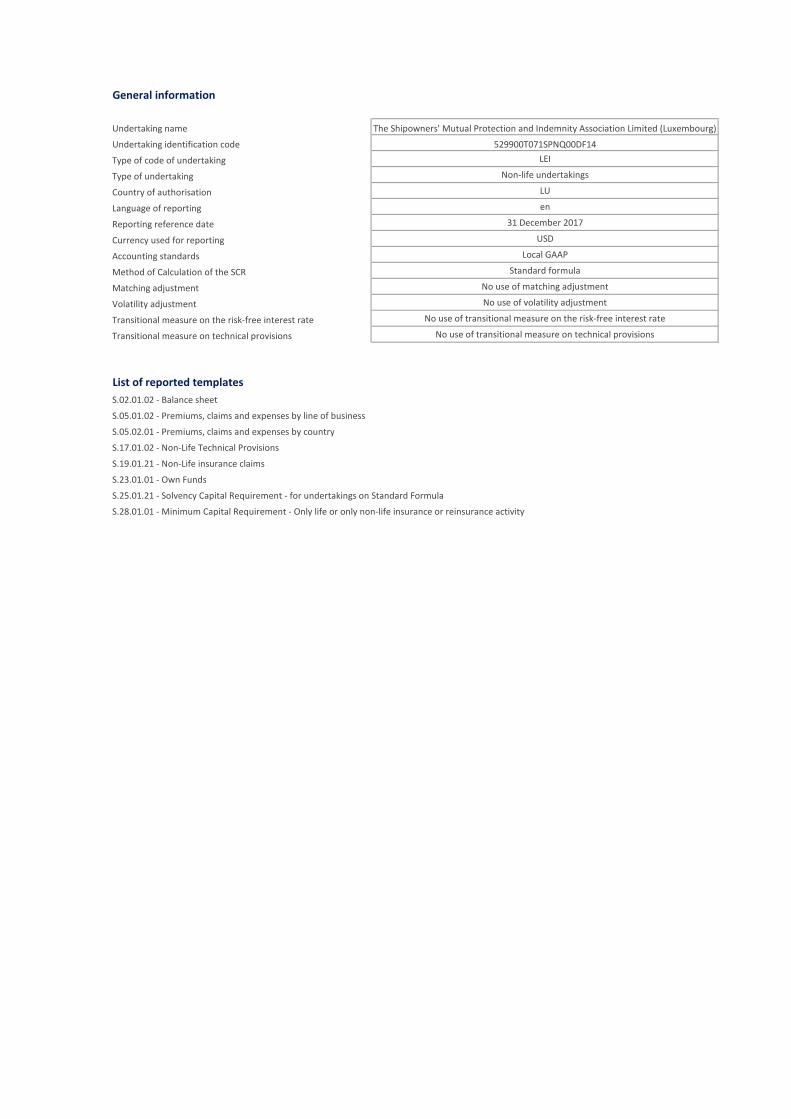
General information
Undertaking name The Shipowners' Mutual Protection and Indemnity Association Limited (Luxembourg)
Undertaking identification code 529900T071SPNQ00DF14
Type of code of undertaking LEI
Type of undertaking Non-life undertakings
Country of authorisation LU
Language of reporting en
Reporting reference date 31 December 2017
Currency used for reporting USD
Accounting standards Local GAAP
Method of Calculation of the SCR Standard formula
Matching adjustment No use of matching adjustment
Volatility adjustment No use of volatility adjustment
Transitional measure on the risk-free interest rate No use of transitional measure on the risk-free interest rate
Transitional measure on technical provisions No use of transitional measure on technical provisions
List of reported templates
S.02.01.02 - Balance sheet
S.05.01.02 - Premiums, claims and expenses by line of business
S.05.02.01 - Premiums, claims and expenses by country
S.17.01.02 - Non-Life Technical Provisions
S.19.01.21 - Non-Life insurance claims
S.23.01.01 - Own Funds
S.25.01.21 - Solvency Capital Requirement - for undertakings on Standard Formula
S.28.01.01 - Minimum Capital Requirement - Only life or only non-life insurance or reinsurance activity
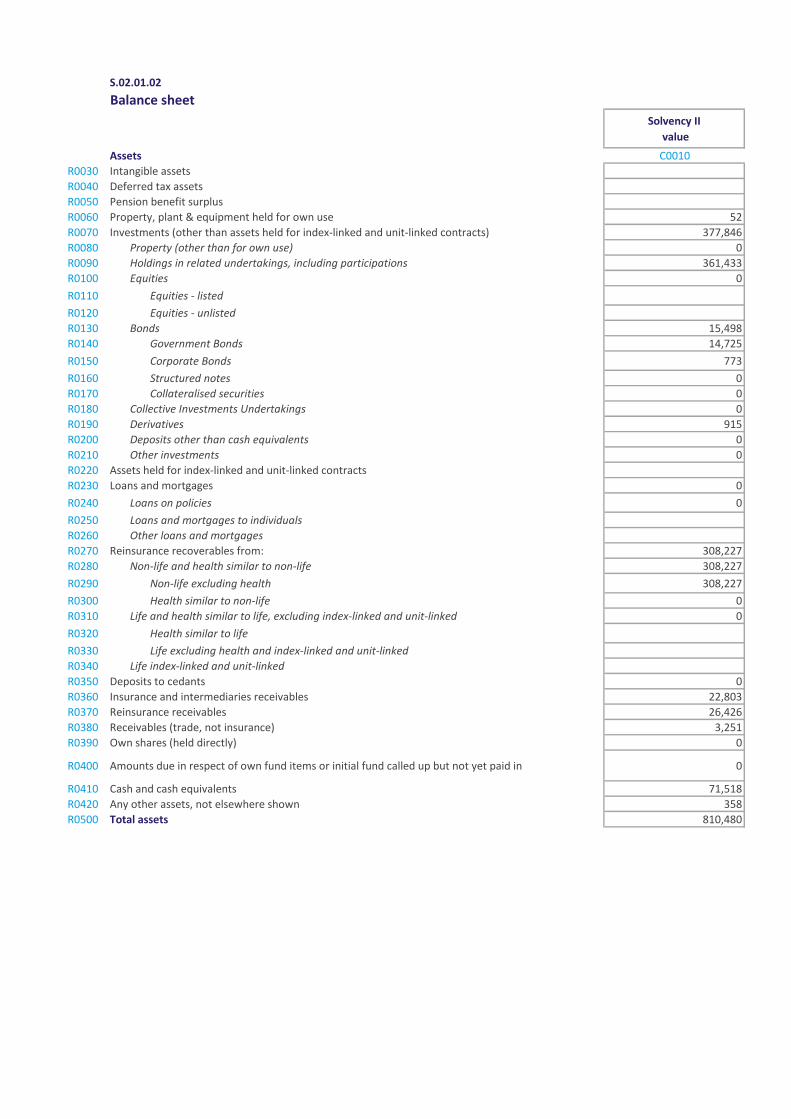
S.02.01.02
Balance sheet
Solvency II
value
Assets C0010
R0030 Intangible assets
R0040 Deferred tax assets
R0050 Pension benefit surplus
R0060 Property, plant & equipment held for own use 52
R0070 Investments (other than assets held for index-linked and unit-linked contracts) 377,846
R0080 Property (other than for own use) 0
R0090 Holdings in related undertakings, including participations 361,433
R0100 Equities 0
R0110 Equities - listed
R0120 Equities - unlisted
R0130 Bonds 15,498
R0140 Government Bonds 14,725
R0150 Corporate Bonds 773
R0160 Structured notes 0
R0170 Collateralised securities 0
R0180 Collective Investments Undertakings 0
R0190 Derivatives 915
R0200 Deposits other than cash equivalents 0
R0210 Other investments 0
R0220 Assets held for index-linked and unit-linked contracts
R0230 Loans and mortgages 0
R0240 Loans on policies 0
R0250 Loans and mortgages to individuals
R0260 Other loans and mortgages
R0270 Reinsurance recoverables from: 308,227
R0280 Non-life and health similar to non-life 308,227
R0290 Non-life excluding health 308,227
R0300 Health similar to non-life 0
R0310 Life and health similar to life, excluding index-linked and unit-linked 0
R0320 Health similar to life
R0330 Life excluding health and index-linked and unit-linked
R0340 Life index-linked and unit-linked
R0350 Deposits to cedants 0
R0360 Insurance and intermediaries receivables 22,803
R0370 Reinsurance receivables 26,426
R0380 Receivables (trade, not insurance) 3,251
R0390 Own shares (held directly) 0
R0400 Amounts due in respect of own fund items or initial fund called up but not yet paid in 0
R0410 Cash and cash equivalents 71,518
R0420 Any other assets, not elsewhere shown 358
R0500 Total assets 810,480

S.02.01.02
Balance sheet
Solvency II
value
Liabilities C0010
R0510 Technical provisions - non-life 460,135
R0520 Technical provisions - non-life (excluding health) 460,135
R0530 TP calculated as a whole 0
R0540 Best Estimate 445,762
R0550 Risk margin 14,373
R0560 Technical provisions - health (similar to non-life) 0
R0570 TP calculated as a whole 0
R0580 Best Estimate 0
R0590 Risk margin 0
R0600 Technical provisions - life (excluding index-linked and unit-linked) 0
R0610 Technical provisions - health (similar to life) 0
R0620 TP calculated as a whole
R0630 Best Estimate
R0640 Risk margin
R0650 Technical provisions - life (excluding health and index-linked and unit-linked) 0
R0660 TP calculated as a whole
R0670 Best Estimate
R0680 Risk margin
R0690 Technical provisions - index-linked and unit-linked 0
R0700 TP calculated as a whole
R0710 Best Estimate
R0720 Risk margin
R0740 Contingent liabilities 0
R0750 Provisions other than technical provisions 672
R0760 Pension benefit obligations 5,703
R0770 Deposits from reinsurers
R0780 Deferred tax liabilities 823
R0790 Derivatives 0
R0800 Debts owed to credit institutions 0
R0810 Financial liabilities other than debts owed to credit institutions 0
R0820 Insurance & intermediaries payables 2,567
R0830 Reinsurance payables 1,532
R0840 Payables (trade, not insurance) 1,019
R0850 Subordinated liabilities 0
R0860 Subordinated liabilities not in BOF
R0870 Subordinated liabilities in BOF 0
R0880 Any other liabilities, not elsewhere shown 1,924
R0900 Total liabilities 474,375
R1000 Excess of assets over liabilities 336,105
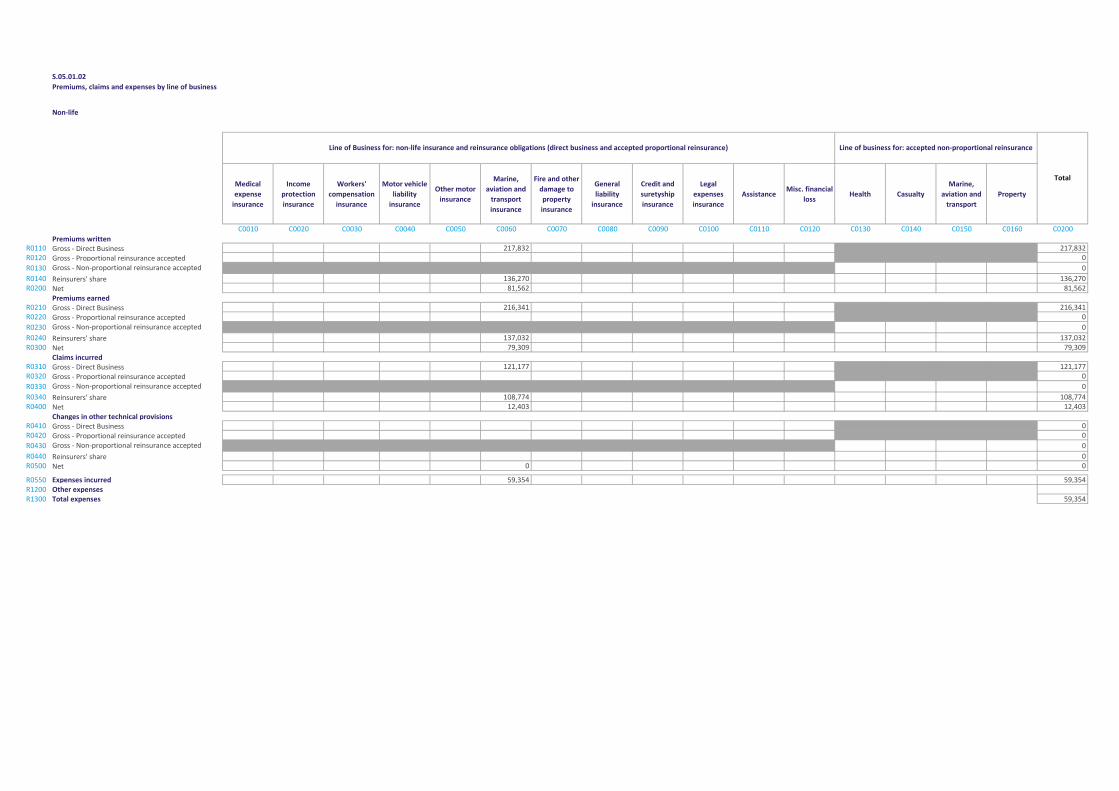
S.05.01.02
Non-life
Medical
expense
insurance
Income
protection
insurance
Workers'
compensation
insurance
Motor vehicle
liability
insurance
Other motor
insurance
Marine,
aviation and
transport
insurance
Fire and other
damage to
property
insurance
General
liability
insurance
Credit and
suretyship
insurance
Legal
expenses
insurance
AssistanceMisc. financial
lossHealth Casualty
Marine,
aviation and
transport
Property
C0010 C0020 C0030 C0040 C0050 C0060 C0070 C0080 C0090 C0100 C0110 C0120 C0130 C0140 C0150 C0160 C0200
Premiums writtenR0110 Gross - Direct Business 217,832 217,832R0120 Gross - Proportional reinsurance accepted 0
R0130 Gross - Non-proportional reinsurance accepted 0
R0140 Reinsurers' share 136,270 136,270R0200 Net 81,562 81,562
Premiums earnedR0210 Gross - Direct Business 216,341 216,341R0220 Gross - Proportional reinsurance accepted 0
R0230 Gross - Non-proportional reinsurance accepted 0
R0240 Reinsurers' share 137,032 137,032R0300 Net 79,309 79,309
Claims incurredR0310 Gross - Direct Business 121,177 121,177R0320 Gross - Proportional reinsurance accepted 0
R0330 Gross - Non-proportional reinsurance accepted 0
R0340 Reinsurers' share 108,774 108,774R0400 Net 12,403 12,403
Changes in other technical provisionsR0410 Gross - Direct Business 0R0420 Gross - Proportional reinsurance accepted 0
R0430 Gross - Non-proportional reinsurance accepted 0
R0440 Reinsurers' share 0R0500 Net 0 0
R0550 Expenses incurred 59,354 59,354R1200 Other expensesR1300 Total expenses 59,354
Premiums, claims and expenses by line of business
Line of Business for: non-life insurance and reinsurance obligations (direct business and accepted proportional reinsurance) Line of business for: accepted non-proportional reinsurance
Total

S.05.02.01
Premiums, claims and expenses by country
Non-life
C0010 C0020 C0030 C0040 C0050 C0060 C0070
R0010 GB SG
C0080 C0090 C0100 C0110 C0120 C0130 C0140
Premiums written
R0110 Gross - Direct Business 119,727 88,801 208,528
R0120 Gross - Proportional reinsurance accepted 0
R0130 Gross - Non-proportional reinsurance accepted 0
R0140 Reinsurers' share 77,640 57,718 135,358
R0200 Net 0 42,087 31,083 0 0 0 73,170
Premiums earned
R0210 Gross - Direct Business 118,907 88,960 207,867
R0220 Gross - Proportional reinsurance accepted 0
R0230 Gross - Non-proportional reinsurance accepted 0
R0240 Reinsurers' share 77,806 58,322 136,127
R0300 Net 0 41,101 30,638 0 0 0 71,739
Claims incurred
R0310 Gross - Direct Business 65,043 49,661 114,704
R0320 Gross - Proportional reinsurance accepted 0
R0330 Gross - Non-proportional reinsurance accepted 0
R0340 Reinsurers' share 57,208 45,189 102,397
R0400 Net 0 7,835 4,472 0 0 0 12,307
Changes in other technical provisions
R0410 Gross - Direct Business 0
R0420 Gross - Proportional reinsurance accepted 0
R0430 Gross - Non-proportional reinsurance accepted 0
R0440 Reinsurers' share 0
R0500 Net 0 0 0 0 0 0 0
R0550 Expenses incurred 6,062 27,670 22,343 56,075
R1200 Other expenses
R1300 Total expenses 56,075
Home Country
Top 5 countries (by amount of gross premiums written) - non-life
obligations
Top 5 countries (by amount of gross
premiums written) - non-life obligations Total Top 5 and
home country
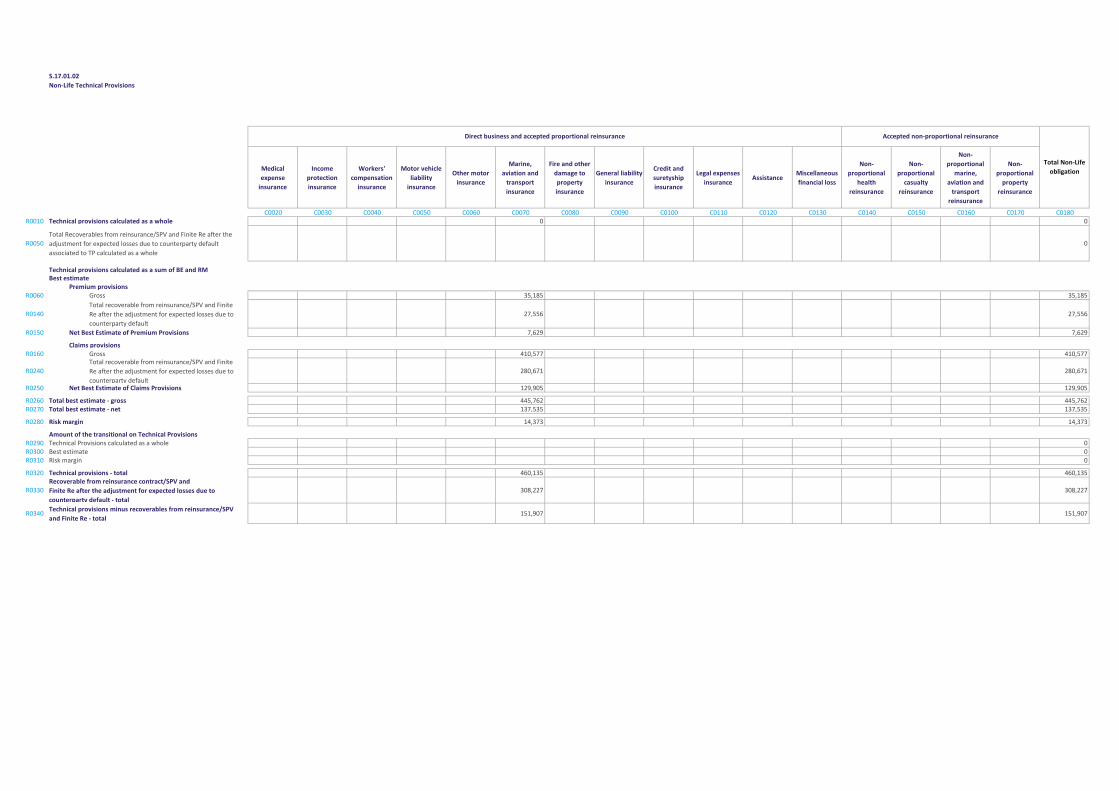
S.17.01.02
Non-Life Technical Provisions
Medical
expense
insurance
Income
protection
insurance
Workers'
compensation
insurance
Motor vehicle
liability
insurance
Other motor
insurance
Marine,
aviation and
transport
insurance
Fire and other
damage to
property
insurance
General liability
insurance
Credit and
suretyship
insurance
Legal expenses
insuranceAssistance
Miscellaneous
financial loss
Non-
proportional
health
reinsurance
Non-
proportional
casualty
reinsurance
Non-
proportional
marine,
aviation and
transport
reinsurance
Non-
proportional
property
reinsurance
C0020 C0030 C0040 C0050 C0060 C0070 C0080 C0090 C0100 C0110 C0120 C0130 C0140 C0150 C0160 C0170 C0180R0010 Technical provisions calculated as a whole 0 0
R0050
Total Recoverables from reinsurance/SPV and Finite Re after the
adjustment for expected losses due to counterparty default
associated to TP calculated as a whole
0
Technical provisions calculated as a sum of BE and RMBest estimate
Premium provisionsR0060 Gross 35,185 35,185
R0140
Total recoverable from reinsurance/SPV and Finite
Re after the adjustment for expected losses due to
counterparty default
27,556 27,556
R0150 Net Best Estimate of Premium Provisions 7,629 7,629
Claims provisionsR0160 Gross 410,577 410,577
R0240
Total recoverable from reinsurance/SPV and Finite
Re after the adjustment for expected losses due to
counterparty default
280,671 280,671
R0250 Net Best Estimate of Claims Provisions 129,905 129,905
R0260 Total best estimate - gross 445,762 445,762R0270 Total best estimate - net 137,535 137,535
R0280 Risk margin 14,373 14,373
Amount of the transitional on Technical ProvisionsR0290 Technical Provisions calculated as a whole 0R0300 Best estimate 0R0310 Risk margin 0
R0320 Technical provisions - total 460,135 460,135
R0330
Recoverable from reinsurance contract/SPV and
Finite Re after the adjustment for expected losses due to
counterparty default - total
308,227 308,227
R0340Technical provisions minus recoverables from reinsurance/SPV
and Finite Re - total151,907 151,907
Direct business and accepted proportional reinsurance Accepted non-proportional reinsurance
Total Non-Life
obligation
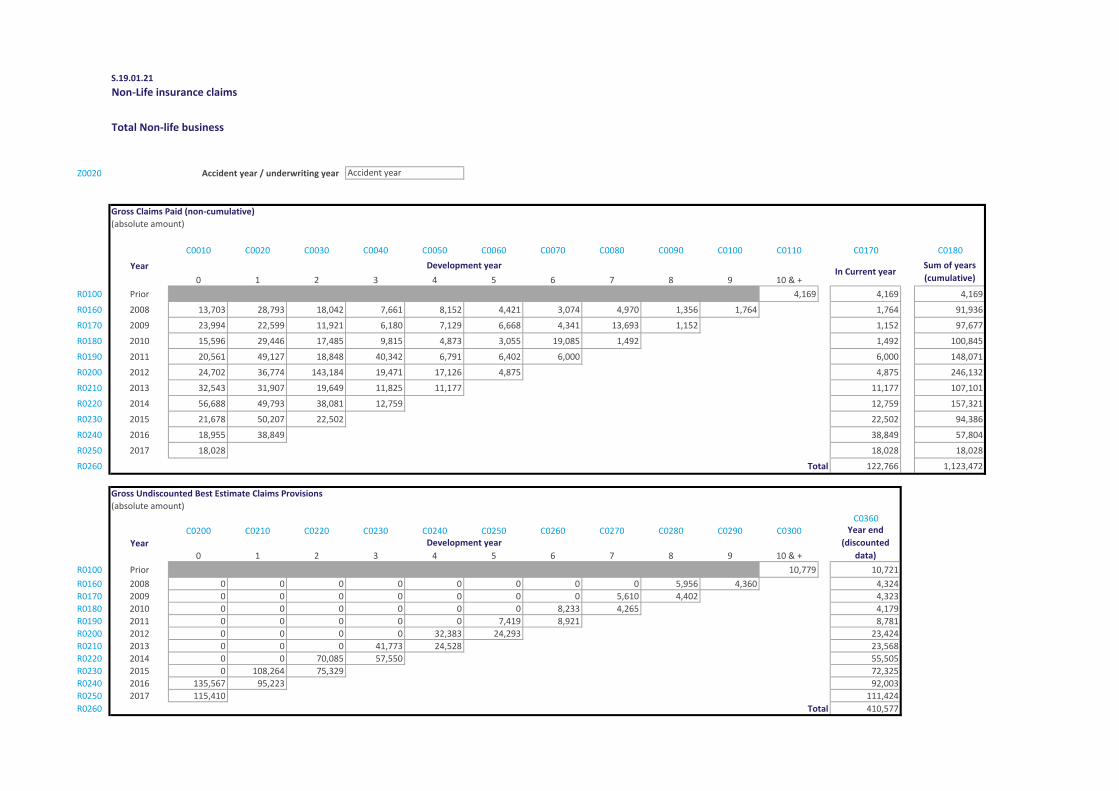
S.19.01.21
Non-Life insurance claims
Total Non-life business
Z0020 Accident year / underwriting year
Gross Claims Paid (non-cumulative)
(absolute amount)
C0010 C0020 C0030 C0040 C0050 C0060 C0070 C0080 C0090 C0100 C0110 C0170 C0180
Year
0 1 2 3 4 5 6 7 8 9 10 & +
R0100 Prior 4,169 4,169 4,169
R0160 2008 13,703 28,793 18,042 7,661 8,152 4,421 3,074 4,970 1,356 1,764 1,764 91,936
R0170 2009 23,994 22,599 11,921 6,180 7,129 6,668 4,341 13,693 1,152 1,152 97,677
R0180 2010 15,596 29,446 17,485 9,815 4,873 3,055 19,085 1,492 1,492 100,845
R0190 2011 20,561 49,127 18,848 40,342 6,791 6,402 6,000 6,000 148,071
R0200 2012 24,702 36,774 143,184 19,471 17,126 4,875 4,875 246,132
R0210 2013 32,543 31,907 19,649 11,825 11,177 11,177 107,101
R0220 2014 56,688 49,793 38,081 12,759 12,759 157,321
R0230 2015 21,678 50,207 22,502 22,502 94,386
R0240 2016 18,955 38,849 38,849 57,804
R0250 2017 18,028 18,028 18,028
R0260 Total 122,766 1,123,472
Gross Undiscounted Best Estimate Claims Provisions
(absolute amount)
C0360
C0200 C0210 C0220 C0230 C0240 C0250 C0260 C0270 C0280 C0290 C0300
Year
0 1 2 3 4 5 6 7 8 9 10 & +
R0100 Prior 10,779 10,721
R0160 2008 0 0 0 0 0 0 0 0 5,956 4,360 4,324
R0170 2009 0 0 0 0 0 0 0 5,610 4,402 4,323
R0180 2010 0 0 0 0 0 0 8,233 4,265 4,179
R0190 2011 0 0 0 0 0 7,419 8,921 8,781
R0200 2012 0 0 0 0 32,383 24,293 23,424
R0210 2013 0 0 0 41,773 24,528 23,568
R0220 2014 0 0 70,085 57,550 55,505
R0230 2015 0 108,264 75,329 72,325
R0240 2016 135,567 95,223 92,003
R0250 2017 115,410 111,424
R0260 Total 410,577
Accident year
Development yearIn Current year
Sum of years
(cumulative)
Year end
(discounted
data)
Development year
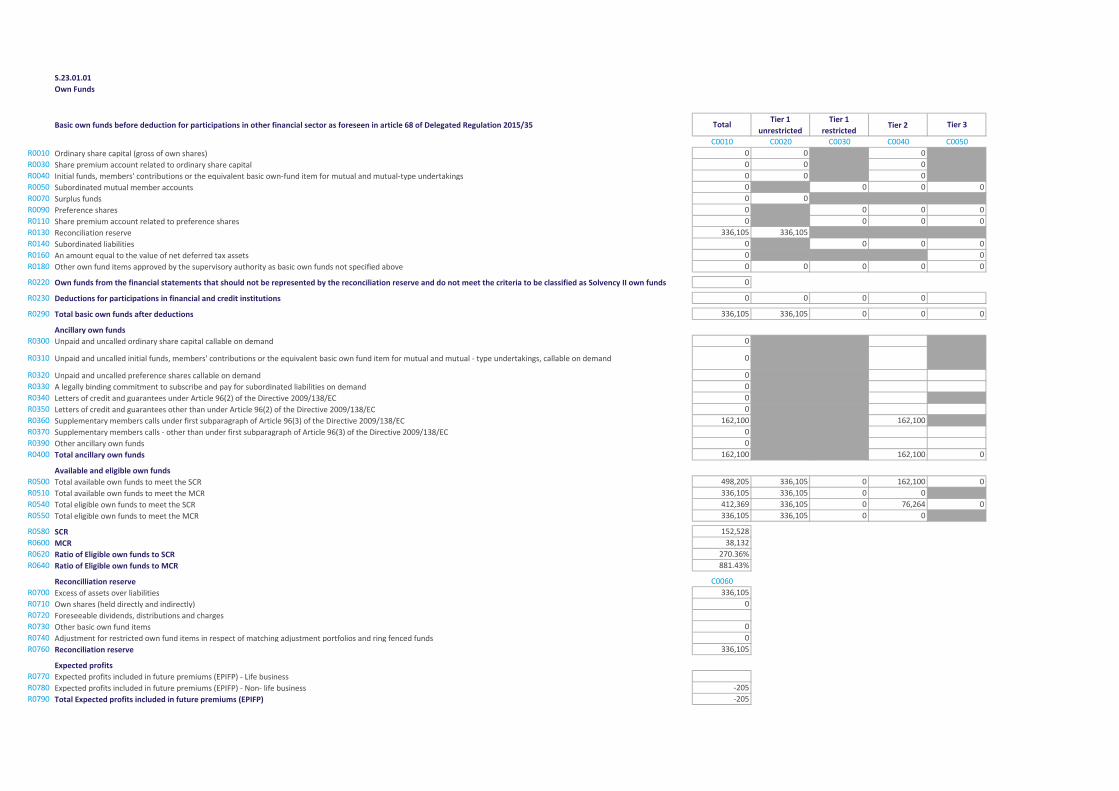
S.23.01.01
Own Funds
Basic own funds before deduction for participations in other financial sector as foreseen in article 68 of Delegated Regulation 2015/35 TotalTier 1
unrestricted
Tier 1
restrictedTier 2 Tier 3
C0010 C0020 C0030 C0040 C0050
R0010 Ordinary share capital (gross of own shares) 0 0 0
R0030 Share premium account related to ordinary share capital 0 0 0
R0040 Initial funds, members' contributions or the equivalent basic own-fund item for mutual and mutual-type undertakings 0 0 0
R0050 Subordinated mutual member accounts 0 0 0 0
R0070 Surplus funds 0 0
R0090 Preference shares 0 0 0 0
R0110 Share premium account related to preference shares 0 0 0 0
R0130 Reconciliation reserve 336,105 336,105
R0140 Subordinated liabilities 0 0 0 0
R0160 An amount equal to the value of net deferred tax assets 0 0
R0180 Other own fund items approved by the supervisory authority as basic own funds not specified above 0 0 0 0 0
R0220 Own funds from the financial statements that should not be represented by the reconciliation reserve and do not meet the criteria to be classified as Solvency II own funds 0
R0230 Deductions for participations in financial and credit institutions 0 0 0 0
R0290 Total basic own funds after deductions 336,105 336,105 0 0 0
Ancillary own funds
R0300 Unpaid and uncalled ordinary share capital callable on demand 0
R0310 Unpaid and uncalled initial funds, members' contributions or the equivalent basic own fund item for mutual and mutual - type undertakings, callable on demand 0
R0320 Unpaid and uncalled preference shares callable on demand 0
R0330 A legally binding commitment to subscribe and pay for subordinated liabilities on demand 0
R0340 Letters of credit and guarantees under Article 96(2) of the Directive 2009/138/EC 0
R0350 Letters of credit and guarantees other than under Article 96(2) of the Directive 2009/138/EC 0
R0360 Supplementary members calls under first subparagraph of Article 96(3) of the Directive 2009/138/EC 162,100 162,100
R0370 Supplementary members calls - other than under first subparagraph of Article 96(3) of the Directive 2009/138/EC 0
R0390 Other ancillary own funds 0
R0400 Total ancillary own funds 162,100 162,100 0
Available and eligible own funds
R0500 Total available own funds to meet the SCR 498,205 336,105 0 162,100 0
R0510 Total available own funds to meet the MCR 336,105 336,105 0 0
R0540 Total eligible own funds to meet the SCR 412,369 336,105 0 76,264 0
R0550 Total eligible own funds to meet the MCR 336,105 336,105 0 0
R0580 SCR 152,528
R0600 MCR 38,132
R0620 Ratio of Eligible own funds to SCR 270.36%
R0640 Ratio of Eligible own funds to MCR 881.43%
Reconcilliation reserve C0060
R0700 Excess of assets over liabilities 336,105
R0710 Own shares (held directly and indirectly) 0
R0720 Foreseeable dividends, distributions and charges
R0730 Other basic own fund items 0
R0740 Adjustment for restricted own fund items in respect of matching adjustment portfolios and ring fenced funds 0
R0760 Reconciliation reserve 336,105
Expected profits
R0770 Expected profits included in future premiums (EPIFP) - Life business
R0780 Expected profits included in future premiums (EPIFP) - Non- life business -205
R0790 Total Expected profits included in future premiums (EPIFP) -205

S.25.01.21
Solvency Capital Requirement - for undertakings on Standard Formula
Gross solvency capital
requirementUSP Simplifications
C0110 C0090 C0120
R0010 Market risk 103,949
R0020 Counterparty default risk 20,396
R0030 Life underwriting risk 0
R0040 Health underwriting risk 0
R0050 Non-life underwriting risk 56,667
R0060 Diversification -41,035
R0070 Intangible asset risk 0
R0100 Basic Solvency Capital Requirement 139,978
Calculation of Solvency Capital Requirement C0100
R0130 Operational risk 13,373
R0140 Loss-absorbing capacity of technical provisions 0
R0150 Loss-absorbing capacity of deferred taxes -823
R0160 Capital requirement for business operated in accordance with Art. 4 of Directive 2003/41/EC 0
R0200 Solvency Capital Requirement excluding capital add-on 152,528
R0210 Capital add-ons already set 0
R0220 Solvency capital requirement 152,528
Other information on SCR
R0400 Capital requirement for duration-based equity risk sub-module 0
R0410 Total amount of Notional Solvency Capital Requirements for remaining part 0
R0420 Total amount of Notional Solvency Capital Requirements for ring fenced funds 0
R0430 Total amount of Notional Solvency Capital Requirements for matching adjustment portfolios 0
R0440 Diversification effects due to RFF nSCR aggregation for article 304 0
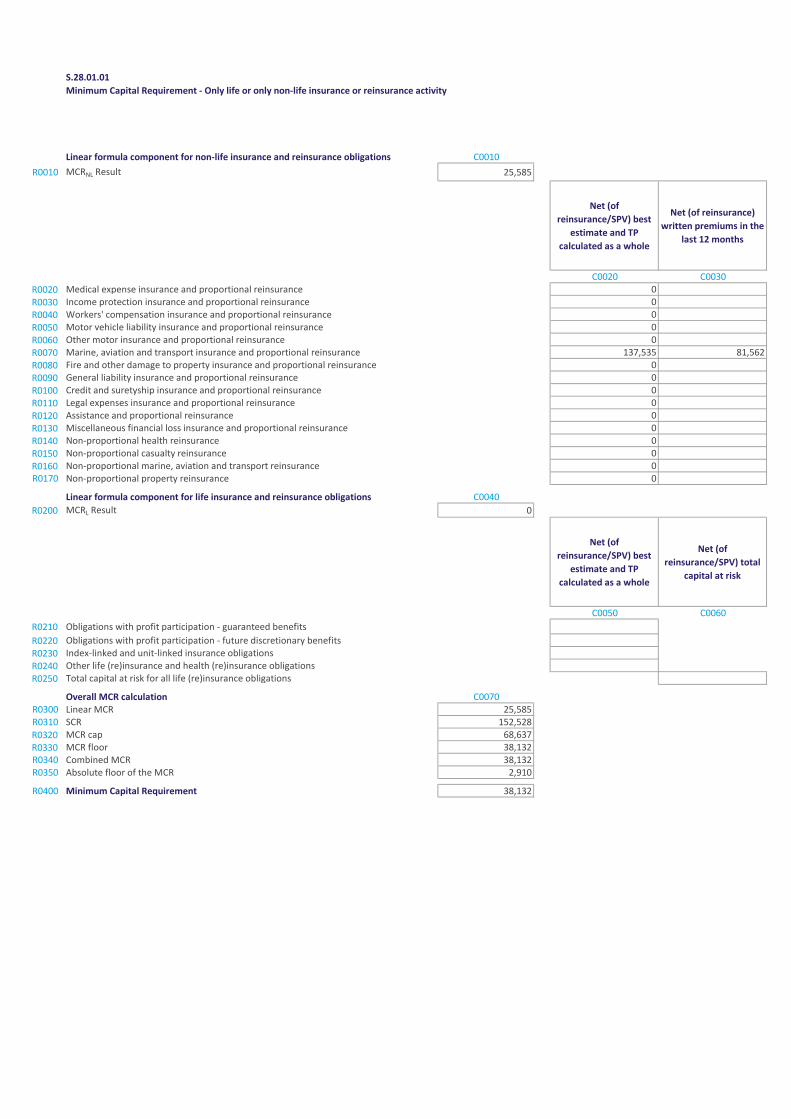
S.28.01.01
Minimum Capital Requirement - Only life or only non-life insurance or reinsurance activity
Linear formula component for non-life insurance and reinsurance obligations C0010
R0010 MCRNL Result 25,585
Net (of
reinsurance/SPV) best
estimate and TP
calculated as a whole
Net (of reinsurance)
written premiums in the
last 12 months
C0020 C0030
R0020 Medical expense insurance and proportional reinsurance 0
R0030 Income protection insurance and proportional reinsurance 0
R0040 Workers' compensation insurance and proportional reinsurance 0
R0050 Motor vehicle liability insurance and proportional reinsurance 0
R0060 Other motor insurance and proportional reinsurance 0
R0070 Marine, aviation and transport insurance and proportional reinsurance 137,535 81,562
R0080 Fire and other damage to property insurance and proportional reinsurance 0
R0090 General liability insurance and proportional reinsurance 0
R0100 Credit and suretyship insurance and proportional reinsurance 0
R0110 Legal expenses insurance and proportional reinsurance 0
R0120 Assistance and proportional reinsurance 0
R0130 Miscellaneous financial loss insurance and proportional reinsurance 0
R0140 Non-proportional health reinsurance 0
R0150 Non-proportional casualty reinsurance 0
R0160 Non-proportional marine, aviation and transport reinsurance 0R0170 Non-proportional property reinsurance 0
Linear formula component for life insurance and reinsurance obligations C0040
R0200 MCRL Result 0
Net (of
reinsurance/SPV) best
estimate and TP
calculated as a whole
Net (of
reinsurance/SPV) total
capital at risk
C0050 C0060
R0210 Obligations with profit participation - guaranteed benefits
R0220 Obligations with profit participation - future discretionary benefits
R0230 Index-linked and unit-linked insurance obligations
R0240 Other life (re)insurance and health (re)insurance obligations
R0250 Total capital at risk for all life (re)insurance obligations
Overall MCR calculation C0070R0300 Linear MCR 25,585R0310 SCR 152,528
R0320 MCR cap 68,637
R0330 MCR floor 38,132R0340 Combined MCR 38,132R0350 Absolute floor of the MCR 2,910
R0400 Minimum Capital Requirement 38,132
The Shipowners' Mutual Protection and Indemnity Association (Luxembourg)
Solvency and Financial Condition Report
SPANDILUX S.A. DISCLOSURES
31 December 2017
(Monetary amounts in US$ thousands)
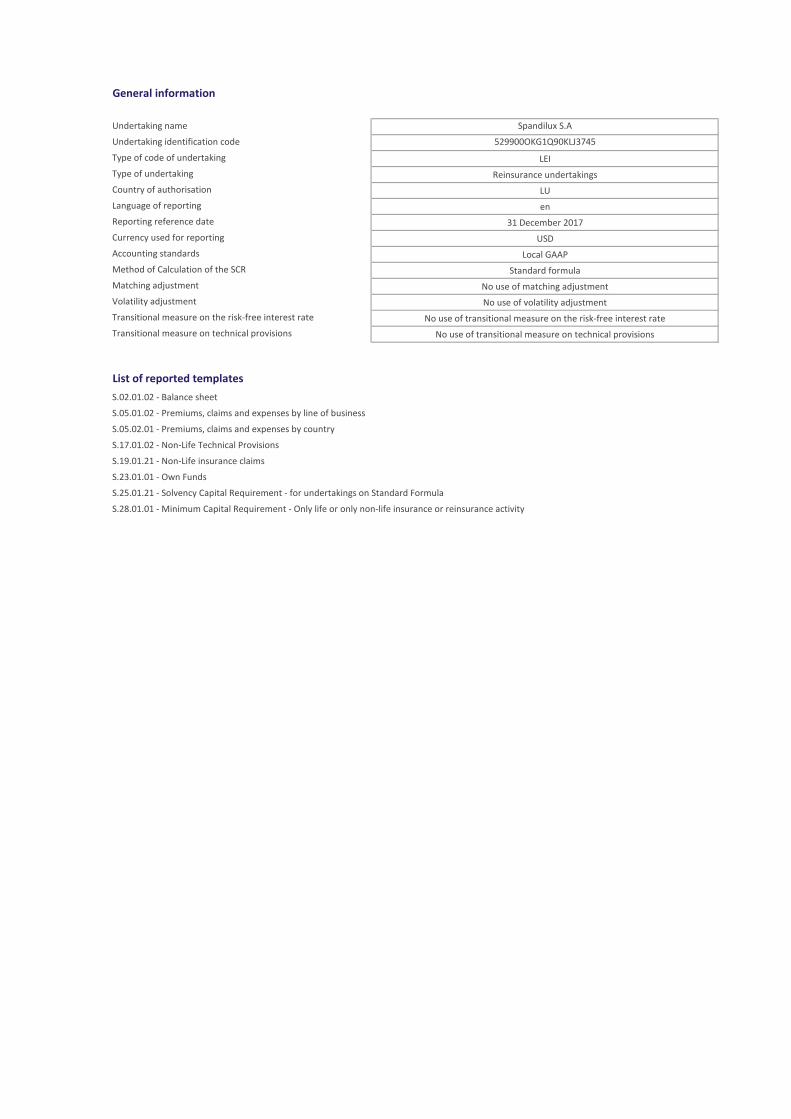
General information
Undertaking name Spandilux S.A
Undertaking identification code 529900OKG1Q90KLJ3745
Type of code of undertaking LEI
Type of undertaking Reinsurance undertakings
Country of authorisation LU
Language of reporting en
Reporting reference date 31 December 2017
Currency used for reporting USD
Accounting standards Local GAAP
Method of Calculation of the SCR Standard formula
Matching adjustment No use of matching adjustment
Volatility adjustment No use of volatility adjustment
Transitional measure on the risk-free interest rate No use of transitional measure on the risk-free interest rate
Transitional measure on technical provisions No use of transitional measure on technical provisions
List of reported templates
S.02.01.02 - Balance sheet
S.05.01.02 - Premiums, claims and expenses by line of business
S.05.02.01 - Premiums, claims and expenses by country
S.17.01.02 - Non-Life Technical Provisions
S.19.01.21 - Non-Life insurance claims
S.23.01.01 - Own Funds
S.25.01.21 - Solvency Capital Requirement - for undertakings on Standard Formula
S.28.01.01 - Minimum Capital Requirement - Only life or only non-life insurance or reinsurance activity
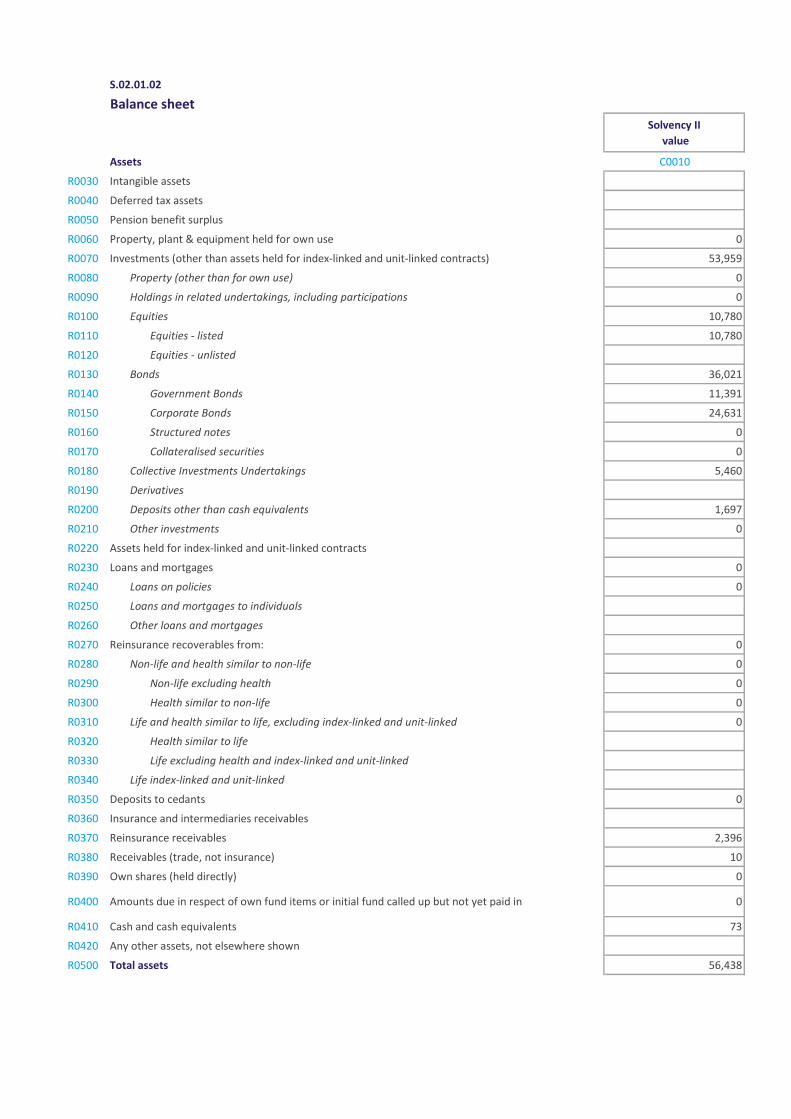
S.02.01.02
Balance sheet
Solvency II
value
Assets C0010
R0030 Intangible assets
R0040 Deferred tax assets
R0050 Pension benefit surplus
R0060 Property, plant & equipment held for own use 0
R0070 Investments (other than assets held for index-linked and unit-linked contracts) 53,959
R0080 Property (other than for own use) 0
R0090 Holdings in related undertakings, including participations 0
R0100 Equities 10,780
R0110 Equities - listed 10,780
R0120 Equities - unlisted
R0130 Bonds 36,021
R0140 Government Bonds 11,391
R0150 Corporate Bonds 24,631
R0160 Structured notes 0
R0170 Collateralised securities 0
R0180 Collective Investments Undertakings 5,460
R0190 Derivatives
R0200 Deposits other than cash equivalents 1,697
R0210 Other investments 0
R0220 Assets held for index-linked and unit-linked contracts
R0230 Loans and mortgages 0
R0240 Loans on policies 0
R0250 Loans and mortgages to individuals
R0260 Other loans and mortgages
R0270 Reinsurance recoverables from: 0
R0280 Non-life and health similar to non-life 0
R0290 Non-life excluding health 0
R0300 Health similar to non-life 0
R0310 Life and health similar to life, excluding index-linked and unit-linked 0
R0320 Health similar to life
R0330 Life excluding health and index-linked and unit-linked
R0340 Life index-linked and unit-linked
R0350 Deposits to cedants 0
R0360 Insurance and intermediaries receivables
R0370 Reinsurance receivables 2,396
R0380 Receivables (trade, not insurance) 10
R0390 Own shares (held directly) 0
R0400 Amounts due in respect of own fund items or initial fund called up but not yet paid in 0
R0410 Cash and cash equivalents 73
R0420 Any other assets, not elsewhere shown
R0500 Total assets 56,438
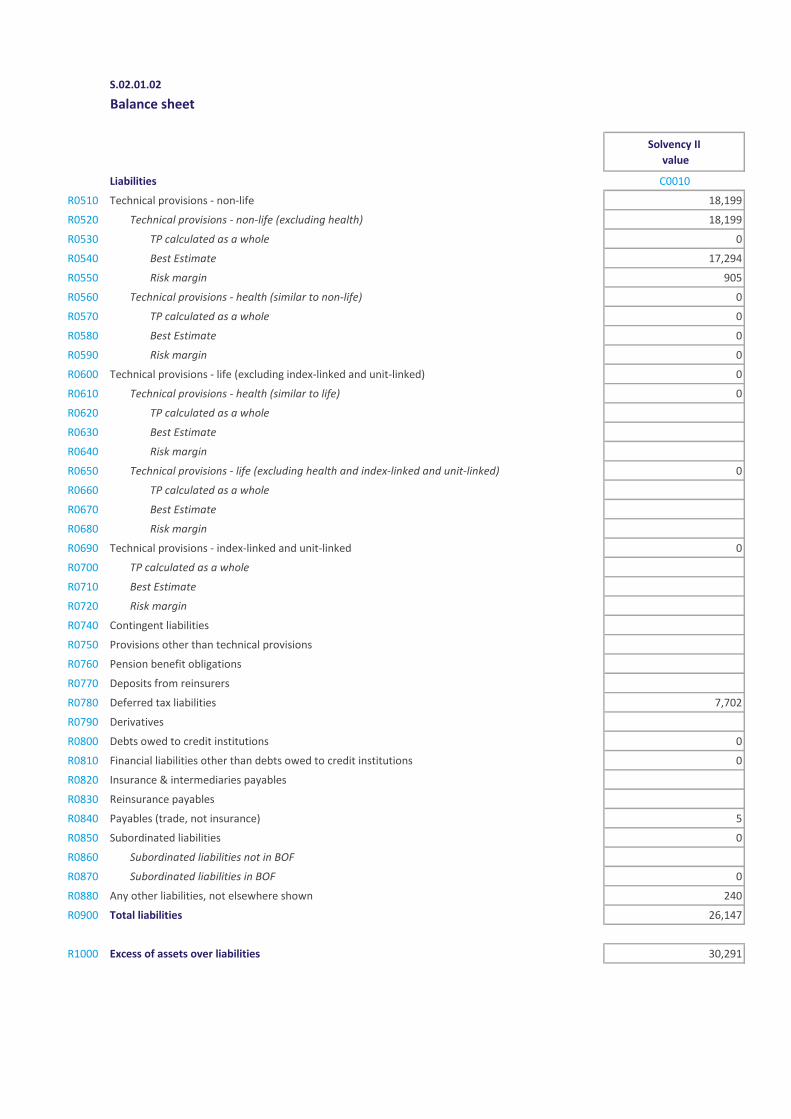
S.02.01.02
Balance sheet
Solvency II
value
Liabilities C0010
R0510 Technical provisions - non-life 18,199
R0520 Technical provisions - non-life (excluding health) 18,199
R0530 TP calculated as a whole 0
R0540 Best Estimate 17,294
R0550 Risk margin 905
R0560 Technical provisions - health (similar to non-life) 0
R0570 TP calculated as a whole 0
R0580 Best Estimate 0
R0590 Risk margin 0
R0600 Technical provisions - life (excluding index-linked and unit-linked) 0
R0610 Technical provisions - health (similar to life) 0
R0620 TP calculated as a whole
R0630 Best Estimate
R0640 Risk margin
R0650 Technical provisions - life (excluding health and index-linked and unit-linked) 0
R0660 TP calculated as a whole
R0670 Best Estimate
R0680 Risk margin
R0690 Technical provisions - index-linked and unit-linked 0
R0700 TP calculated as a whole
R0710 Best Estimate
R0720 Risk margin
R0740 Contingent liabilities
R0750 Provisions other than technical provisions
R0760 Pension benefit obligations
R0770 Deposits from reinsurers
R0780 Deferred tax liabilities 7,702
R0790 Derivatives
R0800 Debts owed to credit institutions 0
R0810 Financial liabilities other than debts owed to credit institutions 0
R0820 Insurance & intermediaries payables
R0830 Reinsurance payables
R0840 Payables (trade, not insurance) 5
R0850 Subordinated liabilities 0
R0860 Subordinated liabilities not in BOF
R0870 Subordinated liabilities in BOF 0
R0880 Any other liabilities, not elsewhere shown 240
R0900 Total liabilities 26,147
R1000 Excess of assets over liabilities 30,291
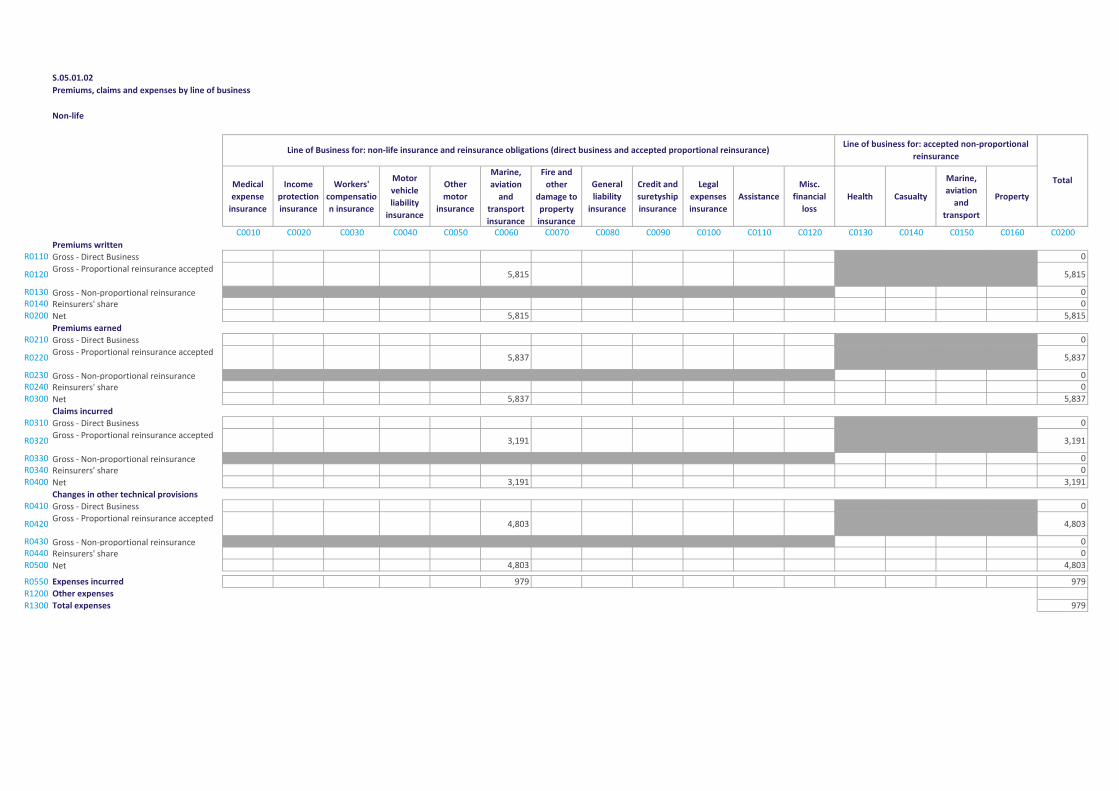
S.05.01.02
Non-life
Medical
expense
insurance
Income
protection
insurance
Workers'
compensatio
n insurance
Motor
vehicle
liability
insurance
Other
motor
insurance
Marine,
aviation
and
transport
insurance
Fire and
other
damage to
property
insurance
General
liability
insurance
Credit and
suretyship
insurance
Legal
expenses
insurance
Assistance
Misc.
financial
loss
Health Casualty
Marine,
aviation
and
transport
Property
C0010 C0020 C0030 C0040 C0050 C0060 C0070 C0080 C0090 C0100 C0110 C0120 C0130 C0140 C0150 C0160 C0200
Premiums writtenR0110 Gross - Direct Business 0
R0120Gross - Proportional reinsurance accepted
5,815 5,815
R0130 Gross - Non-proportional reinsurance 0R0140 Reinsurers' share 0
R0200 Net 5,815 5,815
Premiums earnedR0210 Gross - Direct Business 0
R0220Gross - Proportional reinsurance accepted
5,837 5,837
R0230 Gross - Non-proportional reinsurance 0R0240 Reinsurers' share 0
R0300 Net 5,837 5,837
Claims incurredR0310 Gross - Direct Business 0
R0320Gross - Proportional reinsurance accepted
3,191 3,191
R0330 Gross - Non-proportional reinsurance 0R0340 Reinsurers' share 0
R0400 Net 3,191 3,191
Changes in other technical provisionsR0410 Gross - Direct Business 0
R0420Gross - Proportional reinsurance accepted
4,803 4,803
R0430 Gross - Non-proportional reinsurance 0R0440 Reinsurers' share 0
R0500 Net 4,803 4,803
R0550 Expenses incurred 979 979
R1200 Other expenses
R1300 Total expenses 979
Premiums, claims and expenses by line of business
Line of Business for: non-life insurance and reinsurance obligations (direct business and accepted proportional reinsurance)Line of business for: accepted non-proportional
reinsurance
Total
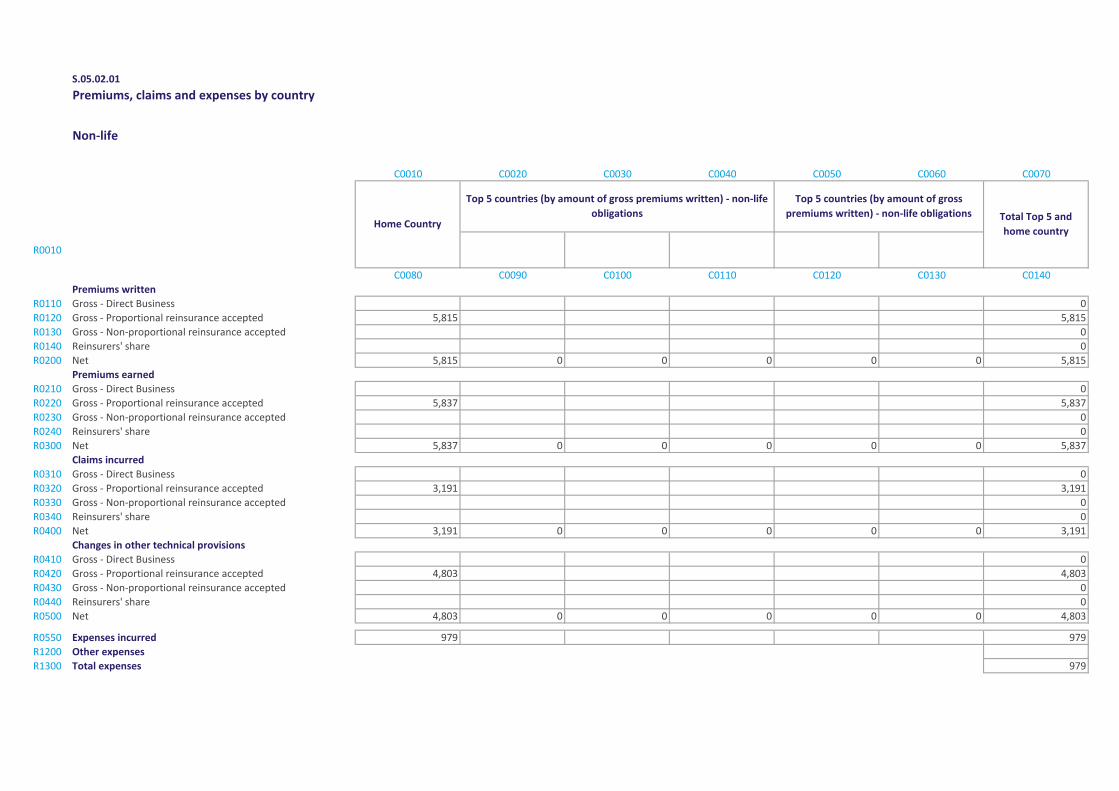
S.05.02.01
Premiums, claims and expenses by country
Non-life
C0010 C0020 C0030 C0040 C0050 C0060 C0070
R0010
C0080 C0090 C0100 C0110 C0120 C0130 C0140
Premiums written
R0110 Gross - Direct Business 0
R0120 Gross - Proportional reinsurance accepted 5,815 5,815
R0130 Gross - Non-proportional reinsurance accepted 0
R0140 Reinsurers' share 0
R0200 Net 5,815 0 0 0 0 0 5,815
Premiums earned
R0210 Gross - Direct Business 0
R0220 Gross - Proportional reinsurance accepted 5,837 5,837
R0230 Gross - Non-proportional reinsurance accepted 0
R0240 Reinsurers' share 0
R0300 Net 5,837 0 0 0 0 0 5,837
Claims incurred
R0310 Gross - Direct Business 0
R0320 Gross - Proportional reinsurance accepted 3,191 3,191
R0330 Gross - Non-proportional reinsurance accepted 0
R0340 Reinsurers' share 0
R0400 Net 3,191 0 0 0 0 0 3,191
Changes in other technical provisions
R0410 Gross - Direct Business 0
R0420 Gross - Proportional reinsurance accepted 4,803 4,803
R0430 Gross - Non-proportional reinsurance accepted 0
R0440 Reinsurers' share 0
R0500 Net 4,803 0 0 0 0 0 4,803
R0550 Expenses incurred 979 979
R1200 Other expenses
R1300 Total expenses 979
Home Country
Top 5 countries (by amount of gross premiums written) - non-life
obligations
Top 5 countries (by amount of gross
premiums written) - non-life obligations Total Top 5 and
home country
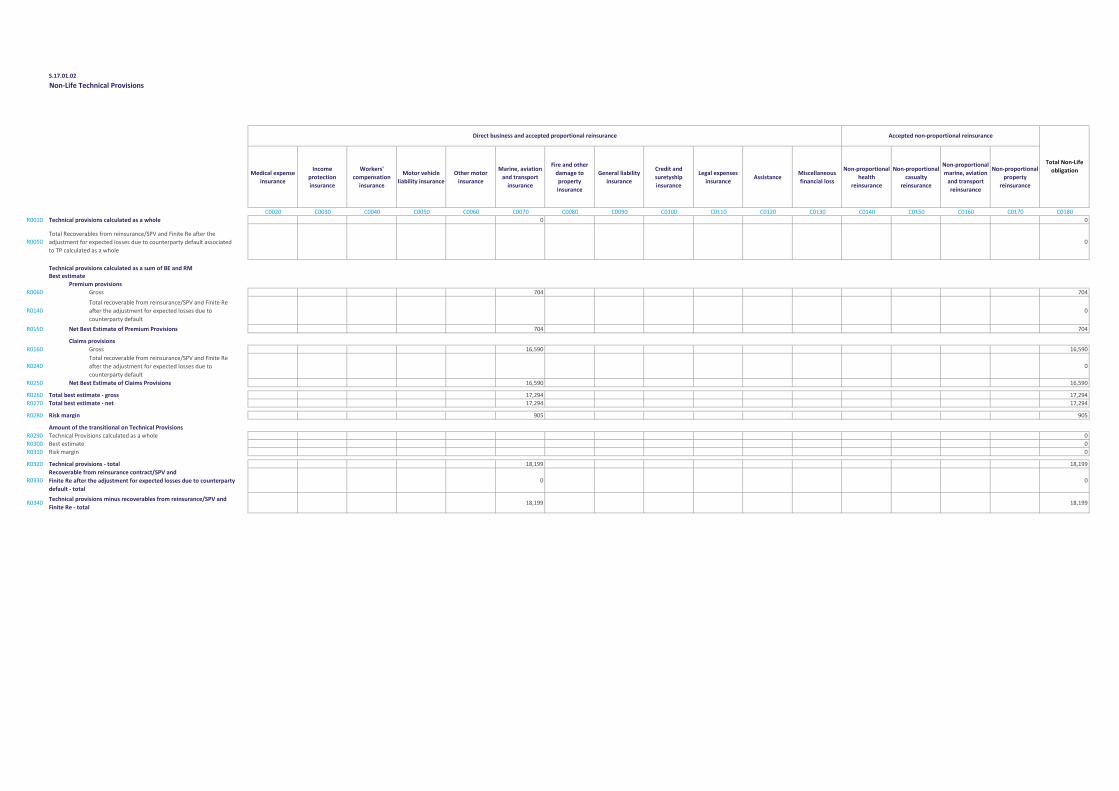
S.17.01.02
Non-Life Technical Provisions
Medical expense
insurance
Income
protection
insurance
Workers'
compensation
insurance
Motor vehicle
liability insurance
Other motor
insurance
Marine, aviation
and transport
insurance
Fire and other
damage to
property
insurance
General liability
insurance
Credit and
suretyship
insurance
Legal expenses
insuranceAssistance
Miscellaneous
financial loss
Non-proportional
health
reinsurance
Non-proportional
casualty
reinsurance
Non-proportional
marine, aviation
and transport
reinsurance
Non-proportional
property
reinsurance
C0020 C0030 C0040 C0050 C0060 C0070 C0080 C0090 C0100 C0110 C0120 C0130 C0140 C0150 C0160 C0170 C0180
R0010 Technical provisions calculated as a whole 0 0
R0050Total Recoverables from reinsurance/SPV and Finite Re after the
adjustment for expected losses due to counterparty default associated
to TP calculated as a whole
0
Technical provisions calculated as a sum of BE and RMBest estimate
Premium provisions
R0060 Gross 704 704
R0140
Total recoverable from reinsurance/SPV and Finite Re
after the adjustment for expected losses due to
counterparty default
0
R0150 Net Best Estimate of Premium Provisions 704 704
Claims provisions
R0160 Gross 16,590 16,590
R0240Total recoverable from reinsurance/SPV and Finite Re
after the adjustment for expected losses due to
counterparty default
0
R0250 Net Best Estimate of Claims Provisions 16,590 16,590
R0260 Total best estimate - gross 17,294 17,294
R0270 Total best estimate - net 17,294 17,294
R0280 Risk margin 905 905
Amount of the transitional on Technical Provisions
R0290 Technical Provisions calculated as a whole 0
R0300 Best estimate 0
R0310 Risk margin 0
R0320 Technical provisions - total 18,199 18,199
R0330
Recoverable from reinsurance contract/SPV and
Finite Re after the adjustment for expected losses due to counterparty
default - total
0 0
R0340Technical provisions minus recoverables from reinsurance/SPV and
Finite Re - total18,199 18,199
Direct business and accepted proportional reinsurance Accepted non-proportional reinsurance
Total Non-Life
obligation
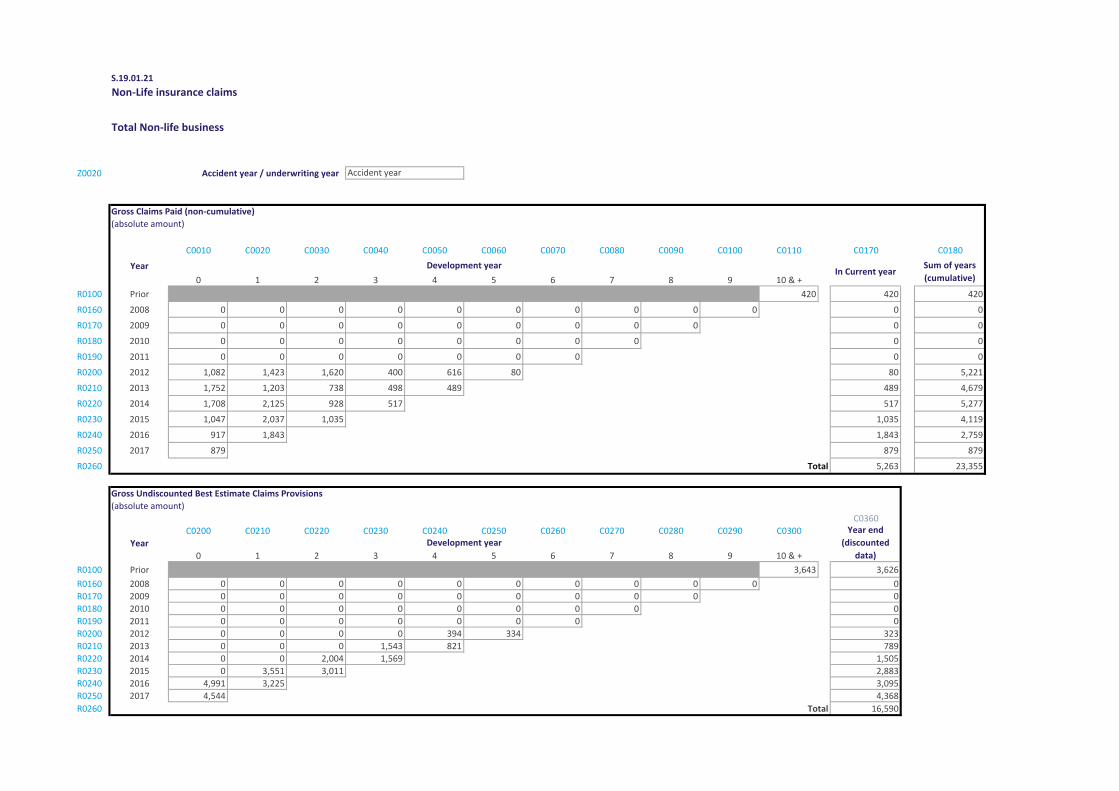
S.19.01.21
Non-Life insurance claims
Total Non-life business
Z0020 Accident year / underwriting year
Gross Claims Paid (non-cumulative)
(absolute amount)
C0010 C0020 C0030 C0040 C0050 C0060 C0070 C0080 C0090 C0100 C0110 C0170 C0180
Year
0 1 2 3 4 5 6 7 8 9 10 & +
R0100 Prior 420 420 420
R0160 2008 0 0 0 0 0 0 0 0 0 0 0 0
R0170 2009 0 0 0 0 0 0 0 0 0 0 0
R0180 2010 0 0 0 0 0 0 0 0 0 0
R0190 2011 0 0 0 0 0 0 0 0 0
R0200 2012 1,082 1,423 1,620 400 616 80 80 5,221
R0210 2013 1,752 1,203 738 498 489 489 4,679
R0220 2014 1,708 2,125 928 517 517 5,277
R0230 2015 1,047 2,037 1,035 1,035 4,119
R0240 2016 917 1,843 1,843 2,759
R0250 2017 879 879 879
R0260 Total 5,263 23,355
Gross Undiscounted Best Estimate Claims Provisions
(absolute amount)
C0360
C0200 C0210 C0220 C0230 C0240 C0250 C0260 C0270 C0280 C0290 C0300
Year
0 1 2 3 4 5 6 7 8 9 10 & +
R0100 Prior 3,643 3,626
R0160 2008 0 0 0 0 0 0 0 0 0 0 0
R0170 2009 0 0 0 0 0 0 0 0 0 0
R0180 2010 0 0 0 0 0 0 0 0 0
R0190 2011 0 0 0 0 0 0 0 0
R0200 2012 0 0 0 0 394 334 323
R0210 2013 0 0 0 1,543 821 789
R0220 2014 0 0 2,004 1,569 1,505
R0230 2015 0 3,551 3,011 2,883
R0240 2016 4,991 3,225 3,095
R0250 2017 4,544 4,368
R0260 Total 16,590
Accident year
Development yearIn Current year
Sum of years
(cumulative)
Year end
(discounted
data)
Development year
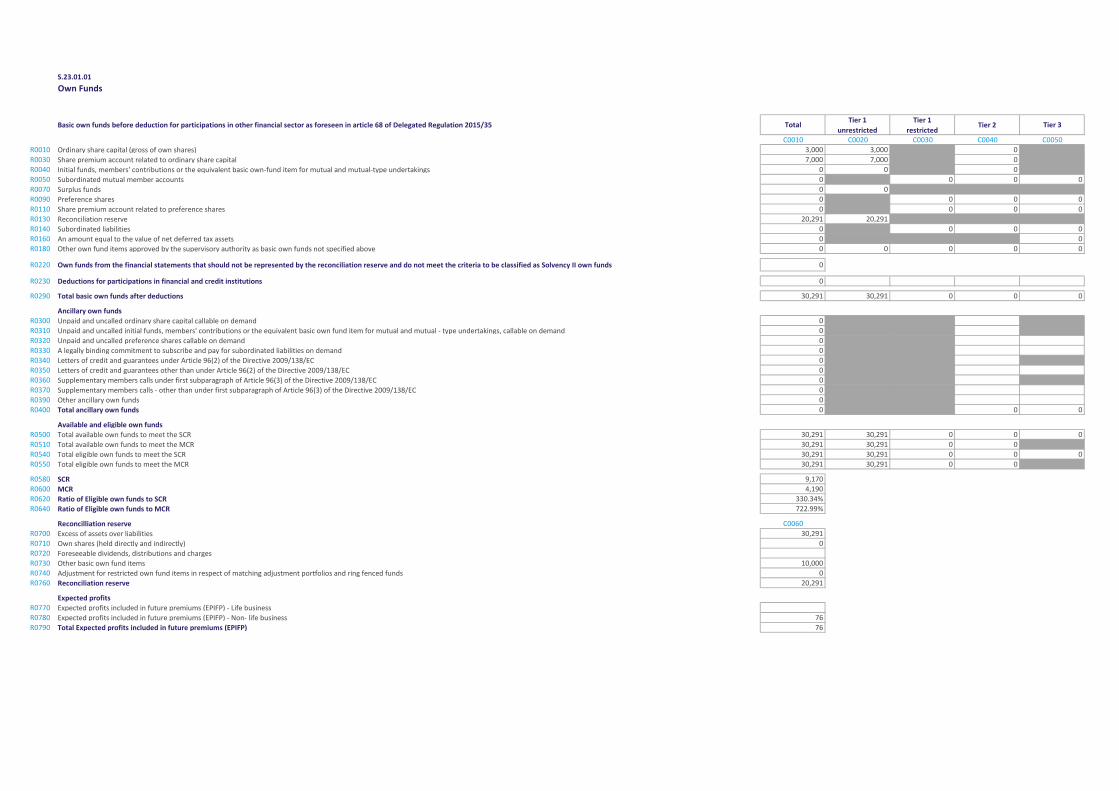
S.23.01.01
Own Funds
Basic own funds before deduction for participations in other financial sector as foreseen in article 68 of Delegated Regulation 2015/35 TotalTier 1
unrestricted
Tier 1
restrictedTier 2 Tier 3
C0010 C0020 C0030 C0040 C0050
R0010 Ordinary share capital (gross of own shares) 3,000 3,000 0
R0030 Share premium account related to ordinary share capital 7,000 7,000 0
R0040 Initial funds, members' contributions or the equivalent basic own-fund item for mutual and mutual-type undertakings 0 0 0
R0050 Subordinated mutual member accounts 0 0 0 0
R0070 Surplus funds 0 0
R0090 Preference shares 0 0 0 0
R0110 Share premium account related to preference shares 0 0 0 0
R0130 Reconciliation reserve 20,291 20,291
R0140 Subordinated liabilities 0 0 0 0
R0160 An amount equal to the value of net deferred tax assets 0 0
R0180 Other own fund items approved by the supervisory authority as basic own funds not specified above 0 0 0 0 0
R0220 Own funds from the financial statements that should not be represented by the reconciliation reserve and do not meet the criteria to be classified as Solvency II own funds 0
R0230 Deductions for participations in financial and credit institutions 0
R0290 Total basic own funds after deductions 30,291 30,291 0 0 0
Ancillary own fundsR0300 Unpaid and uncalled ordinary share capital callable on demand 0
R0310 Unpaid and uncalled initial funds, members' contributions or the equivalent basic own fund item for mutual and mutual - type undertakings, callable on demand 0
R0320 Unpaid and uncalled preference shares callable on demand 0
R0330 A legally binding commitment to subscribe and pay for subordinated liabilities on demand 0
R0340 Letters of credit and guarantees under Article 96(2) of the Directive 2009/138/EC 0
R0350 Letters of credit and guarantees other than under Article 96(2) of the Directive 2009/138/EC 0
R0360 Supplementary members calls under first subparagraph of Article 96(3) of the Directive 2009/138/EC 0
R0370 Supplementary members calls - other than under first subparagraph of Article 96(3) of the Directive 2009/138/EC 0
R0390 Other ancillary own funds 0
R0400 Total ancillary own funds 0 0 0
Available and eligible own fundsR0500 Total available own funds to meet the SCR 30,291 30,291 0 0 0
R0510 Total available own funds to meet the MCR 30,291 30,291 0 0
R0540 Total eligible own funds to meet the SCR 30,291 30,291 0 0 0
R0550 Total eligible own funds to meet the MCR 30,291 30,291 0 0
R0580 SCR 9,170
R0600 MCR 4,190
R0620 Ratio of Eligible own funds to SCR 330.34%
R0640 Ratio of Eligible own funds to MCR 722.99%
Reconcilliation reserve C0060
R0700 Excess of assets over liabilities 30,291
R0710 Own shares (held directly and indirectly) 0
R0720 Foreseeable dividends, distributions and chargesR0730 Other basic own fund items 10,000
R0740 Adjustment for restricted own fund items in respect of matching adjustment portfolios and ring fenced funds 0
R0760 Reconciliation reserve 20,291
Expected profitsR0770 Expected profits included in future premiums (EPIFP) - Life businessR0780 Expected profits included in future premiums (EPIFP) - Non- life business 76
R0790 Total Expected profits included in future premiums (EPIFP) 76
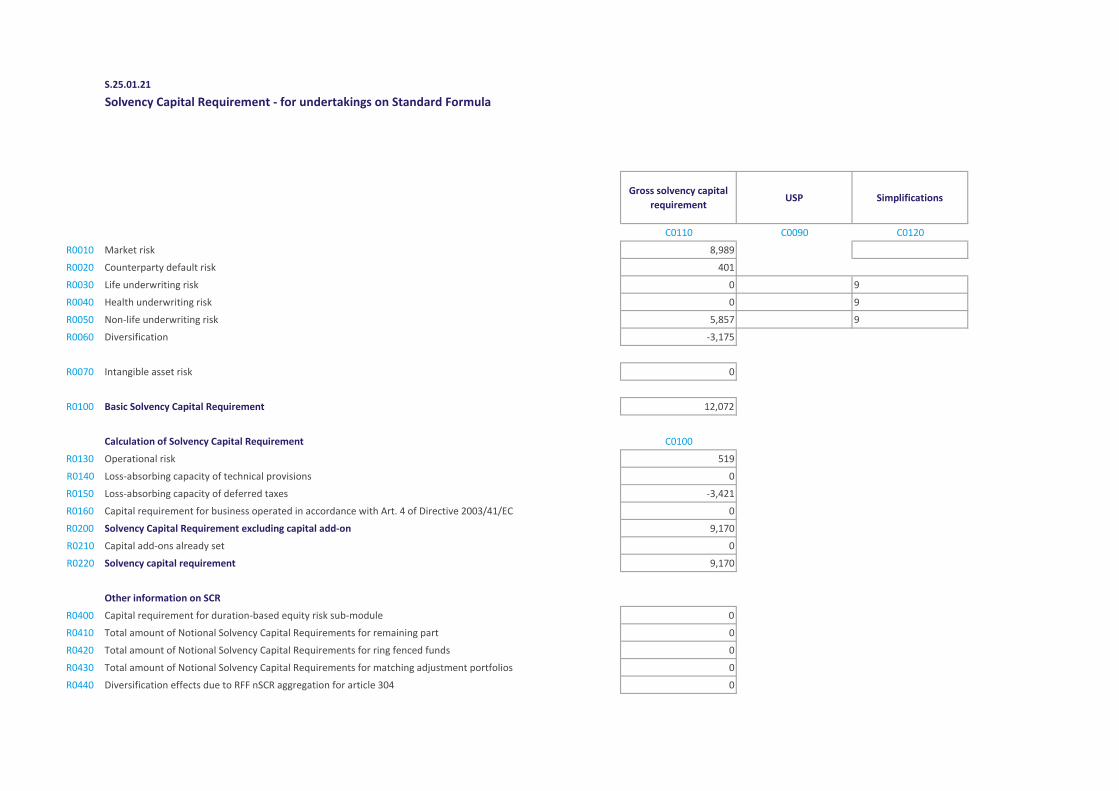
S.25.01.21
Solvency Capital Requirement - for undertakings on Standard Formula
Gross solvency capital
requirementUSP Simplifications
C0110 C0090 C0120
R0010 Market risk 8,989
R0020 Counterparty default risk 401
R0030 Life underwriting risk 0 9
R0040 Health underwriting risk 0 9
R0050 Non-life underwriting risk 5,857 9
R0060 Diversification -3,175
R0070 Intangible asset risk 0
R0100 Basic Solvency Capital Requirement 12,072
Calculation of Solvency Capital Requirement C0100
R0130 Operational risk 519
R0140 Loss-absorbing capacity of technical provisions 0
R0150 Loss-absorbing capacity of deferred taxes -3,421
R0160 Capital requirement for business operated in accordance with Art. 4 of Directive 2003/41/EC 0
R0200 Solvency Capital Requirement excluding capital add-on 9,170
R0210 Capital add-ons already set 0
R0220 Solvency capital requirement 9,170
Other information on SCR
R0400 Capital requirement for duration-based equity risk sub-module 0
R0410 Total amount of Notional Solvency Capital Requirements for remaining part 0
R0420 Total amount of Notional Solvency Capital Requirements for ring fenced funds 0
R0430 Total amount of Notional Solvency Capital Requirements for matching adjustment portfolios 0
R0440 Diversification effects due to RFF nSCR aggregation for article 304 0
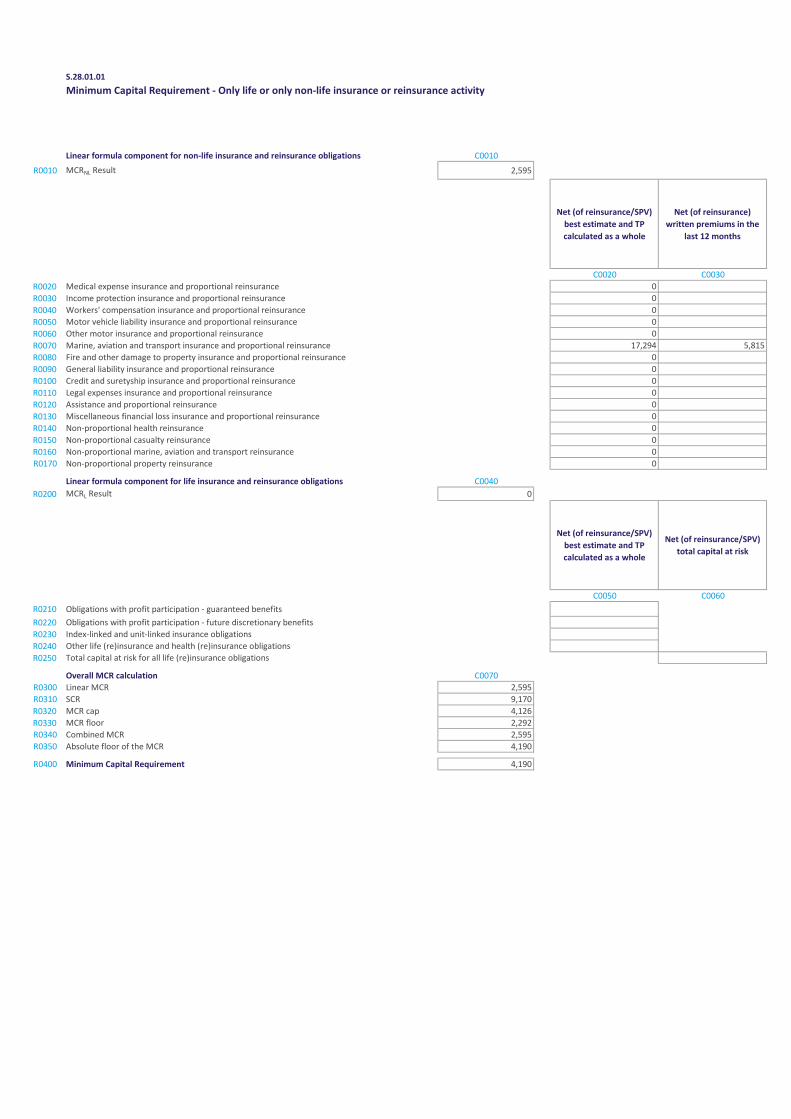
S.28.01.01
Minimum Capital Requirement - Only life or only non-life insurance or reinsurance activity
Linear formula component for non-life insurance and reinsurance obligations C0010
R0010 MCRNL Result 2,595
Net (of reinsurance/SPV)
best estimate and TP
calculated as a whole
Net (of reinsurance)
written premiums in the
last 12 months
C0020 C0030
R0020 Medical expense insurance and proportional reinsurance 0
R0030 Income protection insurance and proportional reinsurance 0
R0040 Workers' compensation insurance and proportional reinsurance 0
R0050 Motor vehicle liability insurance and proportional reinsurance 0
R0060 Other motor insurance and proportional reinsurance 0
R0070 Marine, aviation and transport insurance and proportional reinsurance 17,294 5,815
R0080 Fire and other damage to property insurance and proportional reinsurance 0
R0090 General liability insurance and proportional reinsurance 0
R0100 Credit and suretyship insurance and proportional reinsurance 0
R0110 Legal expenses insurance and proportional reinsurance 0
R0120 Assistance and proportional reinsurance 0
R0130 Miscellaneous financial loss insurance and proportional reinsurance 0
R0140 Non-proportional health reinsurance 0
R0150 Non-proportional casualty reinsurance 0
R0160 Non-proportional marine, aviation and transport reinsurance 0
R0170 Non-proportional property reinsurance 0
Linear formula component for life insurance and reinsurance obligations C0040
R0200 MCRL Result 0
Net (of reinsurance/SPV)
best estimate and TP
calculated as a whole
Net (of reinsurance/SPV)
total capital at risk
C0050 C0060
R0210 Obligations with profit participation - guaranteed benefits
R0220 Obligations with profit participation - future discretionary benefits
R0230 Index-linked and unit-linked insurance obligations
R0240 Other life (re)insurance and health (re)insurance obligations
R0250 Total capital at risk for all life (re)insurance obligations
Overall MCR calculation C0070
R0300 Linear MCR 2,595
R0310 SCR 9,170
R0320 MCR cap 4,126
R0330 MCR floor 2,292
R0340 Combined MCR 2,595
R0350 Absolute floor of the MCR 4,190
R0400 Minimum Capital Requirement 4,190
CORPORATE INFORMATION
Registered officeThe Shipowners’ Mutual Protection and Indemnity Association (Luxembourg) 16, Rue Notre-Dame L–2240 Luxembourg
T +352 229 710 1 F +352 229 710 222 E [email protected]
ManagersThe Shipowners’ Protection Limited White Chapel Building, 2nd Floor 10WhitechapelHighStreetLondon E1 8QS
T +44 207 488 0911 F +44 207 480 5806 E [email protected]
AuditorsKPMG Luxembourg Société coopérative Réviseur d’Entreprises agréé 39, Avenue John F. Kennedy L–1855 Luxembourg

40 | Solvency & Financial Condition Report
@ShipownersClub The Shipowners’ Clubwww.shipownersclub.com