solvency ii for reinsurance managers - aon...
TRANSCRIPT

SOLVENCY II FOR REINSURANCE MANAGERS Key Discussion Points For Non-Life Insurers
1
July 2010 2nd edition

SOLVENCY II FOR REINSURANCE MANAGERS
2
About Aon Benfield As the industry leader in treaty, facultative and capital markets, Aon Benfield is redefining the role of the reinsurance intermediary and capital advisor. Through our unmatched talent and industry-leading proprietary tools and products, we help our clients to redefine themselves and their success. Aon Benfield offers unbiased capital advice and customized access to more reinsurance and capital markets than anyone else. As a trusted advocate, we provide local reach to the world’s markets, an unparalleled investment in innovative analytics, including catastrophe management, actuarial, and rating agency advisory, and the right professionals to advise clients in making the optimal capital choice for their business. With an international network of more than 4,000 professionals in 50 countries, our worldwide client base is able to access the broadest portfolio of integrated capital solutions and services. Learn more at aonbenfield.com.

AON BENFIELD
Contents Solvency II – What Does it Mean to You and How Can We Help?
10 Key Facts 4 The 4 Ways We Are Helping Our Clients 5 The 3 Key Questions for Clients 5 Frequently Asked Questions by Reinsurance Departments on Solvency II 6
Solvency II – Discussion Papers Executive Summary 8 Solvency II: Can It Deliver? 10 Treatment of Reinsurance in the Solvency II Capital Requirement 13 Reinsurance Under Solvency II – an Exceptional Source of Capital 17 The Impact of Solvency II on Risk Calibration 21 Impact of Non-Proportional Reinsurance on Solvency II Capital 25 S2Metrica – a New Tool for a New World of Regulation 34 The Rating Agency Perspective 36 Challenges for a Captive Audience 39 IFRS and Solvency II – The Wobbling Road to Divergence? 42
Country Overviews 46
Glossary 54
Table of QIS5 parameters 56
Contacts 61
3

SOLVENCY II FOR REINSURANCE MANAGERS
Solvency II – 10 key facts 1. Solvency II is a law replacing Solvency I (1973) which is being introduced by the Committee of
European Insurance and Occupational Pensions Supervisors (CEIOPS) to harmonise insurance risk management practices across Europe.
2. It is expected to take effect in October 2012 but re/insurers across the European Union should take action now if they want to be compliant in time for its inception.
3. Solvency II is a risk-based approach to required capital that demands insurers develop robust risk management practices. It is regarded as state-of-the-art by regulators globally.
4. Solvency II is similar to the Basel II banking regulation by way of its three-pillar approach – Pillar 1 being the quantitative calculation of required and available capital; Pillar 2 the qualitative justification to the regulator (own risk and solvency assessment), and Pillar 3 the disclosure requirements to all stakeholders.
5. For the first time, insurance companies will report on a Fair Value basis, which will impact balance sheet valuations of reinsurance assets and liabilities. Reinsurance assets will be valued on a (discounted) best estimate basis, allowing for an expected loss and accounting for reinsurer ratings.
6. Under Solvency II, all re/insurers will be required to calculate a regulatory capital amount based on a Standard Formula (using standard parameters or company-specific parameters), or an alternative capital amount based on a partial internal model or a full internal model.
7. Natural and man-made catastrophe risk is calculated in the Standard Formula via a complex spreadsheet based on CRESTA zone exposures (natural catastrophes) or via scenarios (man-made catastrophes). Output from commercial catastrophe models will only be accepted through a (partial) internal model. Insurers will be able to apply their own existing (catastrophe) reinsurance programme and will have to show the regulator how they apply this to arrive at net exposures. Both proportional and non-proportional reinsurance for insurance companies are adequately reflected in the Standard Formula for cat risk. Companies with material cat exposures outside the EU will be forced into a partial internal model.
8. The risk and capital mitigating effect of reinsurance in the ‘required capital’ calculation will be allowed only if the reinsurance counterparty has a Solvency II ratio above 100% (or equivalent if supervised by a Solvency II-equivalent regulatory system). Non-Solvency II-equivalent counterparties require a minimal rating of BBB (stable) provided by an external rating agency.
9. Although the Solvency II framework directive was approved in April 2009, there is still uncertainty regarding the calculation of required capital and the allowance of available capital. A QIS5 exercise will take place between August and November 2010 to analyse CEIOPS’ 15 April 2010 proposal. The results of this exercise will be used to finalise the Level 2 implementation measures that, together with the Solvency II Directive, will form the final legal framework.
10. Solvency II is likely to result in a significant increase in regulatory capital for most companies in the market. This is especially true for reinsurers, owing to the nature of the business they underwrite. Some of this increase will be offset by an increasing amount of available capital as a result of Fair Value estimates of liabilities, including discounting. Overall, we estimate that the average solvency ratio for the Non-Life industry will reduce from about 250% (Solvency I) to about 140%.
4

AON BENFIELD
The 4 ways we are helping our clients 1. Reinsurance optimisation: We optimise our clients’ reinsurance programmes so that their capital
requirements are brought in line with the risk appetite and the capital structure of the company.
2. Capital advisory: We guide our clients through the calculation of their Solvency II capital requirement under the Standard Formula in order for them to be fully compliant and knowledgeable, and have their systems ready by 2012. In addition, we perform sensitivity analyses to help them better understand the key drivers of required capital under the new framework.
3. Internal model development: Together with Aon Benfield’s sister division, Aon Global Risk Consulting (AGRC), we help our clients to design and implement an internal model which allows their company to gain insight into the risk and capital position of its balance sheet in a Fair Value world. We can assist in calibration and provide market benchmark data. We compare these results to those that would be achieved under the Standard Formula and assess the impact of their business decisions on capital. We provide a soundboard for specific issues regarding Solvency II and calibration.
4. Risk advice via Aon Global Risk Consulting: We advise our clients on how to derive value from embedding risk management within an organisation, and support them in their Pillar 3 reporting requirements to regulators.
The 3 key questions for our clients • Can I produce my Solvency II Fair Value balance sheet on a quarterly basis, and do I have the
sufficient quality of historical data valued on a one-year Fair Value basis? • Should I use an internal model and how can it help me to calculate the Solvency II capital
requirement, Own Risk and Solvency Assessment (ORSA), risk limits, and Solvency II disclosures? • How do I ensure that my current reinsurance programme is optimised to reduce my capital
requirements under the new Solvency II regime?
5

SOLVENCY II FOR REINSURANCE MANAGERS
FAQs by reinsurance departments on Solvency II 1. Will surplus decrease from Solvency I to Solvency II and can reinsurance help the situation?
We expect that the surplus, or Solvency Ratio, for Non-Life insurers (Available Capital / Required Capital) will fall from around 250% on average under Solvency I to around 140% under Solvency II.
Reinsurance is an efficient way to reduce both earnings volatility and capital requirements, and it will play a more important role under Solvency II than Solvency I – reinsurance credit is much more explicit than it used to be except for quota share reinsurance, for which the effect is largely unchanged.
2. Will the Solvency II regime really begin in October 2012?
Recent comments by some European regulators suggest it may be delayed – but only slightly. We would expect that Solvency II will apply from 1 January 2013, and so 2013 will be the first year for the new rules, and reporting will start based on Q1 2013 figures.
3. Will QIS5 be the last QIS exercise?
In its cover note accompanying the QIS5 technical specifications, the European Commission (EC) explicitly states that the exercise is designed to ‘test the impact of the new regime’. The current QIS5 specifications are less onerous than the proposals made by CEIOPS, and were welcomed by the industry, which feared that the proposals made by CEIOPS in its ‘final advice’ would lead to a dramatic increase in required capital (especially for Life-oriented companies). Since its release in mid-April, sharp comments were raised by CEIOPS (threatening the use of capital add-ons), rating agencies, and investment bankers, that the current proposal was too soft. Certainly, the elements defining Own Funds (VIF, deferred tax assets, hybrids and intangibles) and its classification of the different Tiers, were said to be overly generous to the industry, and would increase the volatility of available capital. This would harm the sector since it would not lead to greater transparency, which would have a knock-on effect on the cost-of-capital the industry is valued on.
The EC is trapped with the timeframe of the Level 2 implementation measures which have to be delivered by early 2011. This does not provide any room for future QIS exercises other than to fine-tune or test the Level 2 implementation measures. We assume that in the current QIS5 exercise enough data will be gathered from the industry to test the likely impact not only of the current proposal but also any modifications that the EC might suggest in its final advice. This is why it is extremely important that the participation rate in QIS5 is significant and provides an adequate representation of the market (although the 60% participation rate seems ambitious – 3,000 insurers vs. the 1,061 that participated in QIS4). It does seem likely that CEIOPS or the EC will push for a dry run on Solvency II in 2011 to test the final proposal one year before the legislation is enacted.
4. Can Aon Benfield assist in calibration of the Undertaking Specific Parameters?
Aon Benfield has an impressive market share across Europe and is heavily engaged with many clients on the calibration of Undertaking Specific Parameters, utilising our vast market knowledge in a confidential manner.
5. How will catastrophe reinsurance programmes impact required capital under Solvency II?
Under the Standard Formula approach, the required capital for natural and man-made catastrophe risk will be calculated through standardised catastrophe scenarios per country (based on CRESTA zone exposures or using man-made scenarios) or, if not relevant, by using a factor approach (a function of net premiums).
6

AON BENFIELD
In the first approach, the resulting figures will be gross of reinsurance and so re/insurers can subsequently apply their reinsurance programme to the calculation. The onus will be on the re/insurer to document and explain to the regulator how the net capital figure was derived. In this way, we would expect the mitigating effect of catastrophe reinsurance to be relatively well accounted for.
However, the most accurate approach will be to use an internal model as this will allow the re/insurer not only to reflect their true exposures (based on street level data if available) but also to adequately calculate the mitigating effect of all possible reinsurance programmes.
6. Can ReMetrica be used to build an authorised Solvency II internal model?
ReMetrica is the best platform for building a full or partial internal Non-Life capital model. Using the ReMetrica platform, Aon Benfield has developed S2Metrica – a tool that offers re/insurers insight into the benefits of an internal model at minimal cost. Essentially the tool uses the QIS4 spreadsheet to build the framework for an internal model, allowing the user to change a number of parameters, such as the reinsurance programme and asset mix. Updates on future Standard Formula templates will be taken into account into new releases of S2Metrica.
The output from S2Metrica is very straightforward and highlights the difference in capital requirement under the Standard Formula versus an internal model. The user can also compare results by Line of Business and review Profit & Loss accounts for different return periods. S2Metrica also contains an Economic Scenario Generator (ESG).
The tool allows companies to decide where to focus their efforts in building partial internal models.
7. What solutions are being provided by the reinsurance market for capital relief?
The most capital efficient reinsurance products include non-proportional catastrophe covers and traditional excess of loss contracts. We also see an increased interest in proportional reinsurance (quota share), even though it is not always the most efficient economically. Given that capital is now based on volatility of assets and liabilities and how both sides of the balance sheet interact, re/insurers will also be considering Loss Portfolio Transfers (LPTs), Adverse Development Covers (ADCs), Out-Of-The-Money Stop Loss solutions, and surplus relief transactions for Life insurers, to name but a few. Hedging of asset risk exposure will also gain importance. Aon Benfield has dedicated teams focusing on each of these solutions and their benefits under Solvency II.
8. Will commercial catastrophe models still matter under Solvency II?
They most certainly will, and the role of Aon Benfield as “the” catastrophe modelling expert in the market will become significantly more important for the following two reasons:
(i) Insurers will develop and seek approval for an internal model under Solvency II. Commercial catastrophe models provide a more adequate assessment of the exposure to catastrophe risk, as unlike the Standard Formula, they take more factors into account than just sum assured and CRESTA zones. Varying data quality, adequate damage functions and the specific characteristics of a client portfolio are important factors that can cause significantly different results. Therefore most insurers will seek to develop a tailored model that provides more relevant results.
(ii) Companies will be required to explain the output of their catastrophe models to the regulator, in line with Pillar 2 (quantitative requirements by the regulator). Even if companies do not submit an internal model for natural catastrophe exposure, they will still have to explain their understanding of these risks to the regulator. Aon Benfield’s unsurpassed knowledge around the strengths and weaknesses of each of the commercially available catastrophe models will prove invaluable to our clients in these discussions.
7

SOLVENCY II FOR REINSURANCE MANAGERS
Executive summary These days, the Solvency II Directive seems to be full of contradictions.
Although both CEIOPS and the European Commission (EC) have now proposed their views on the Level 2 guidance, the expected outcome of the Level 2 implementation measures due in Q1 2011 is less clear than ever before.ItisindeeddisappointingtoseethediscrepancybetweentheCEIOPSandECreportsinAprilonhowtheStandardFormulawillimpactcapitalrequirements.We can only hope that the data retrieved from the QIS5 exercise will be of sufficient quality and granularity that it can also be used to test the final Level 2 advice the EC will have to provide by early 2011, since it is everybody’s expectation that the current QIS5 technical specifications will be subject to change.
It is indeed remarkable to see how the EC has taken a much softer stance than CEIOPS on capital requirements, and in particular on capital quality. Solvency II should not be the regulatory system that drives the market to massive capital increases – especially given how the industry proved itself resilient to the recent financial crises – but it should aim to become a regulatory framework that is respected by the financial markets and is used internally to drive capital decisions.
Notwithstanding this controversy, the industry seems to welcome the EC’s ‘QIS5 technical specifications’, which, by just using the average of QIS4’s and CEIOPS’ factors (e.g. for Asset Risk and for Premium and Reserve risk), represents a significant compromise compared to the factors proposed by CEIOPS.
For non-proportional reinsurance, the new Standard Formula looks particularly flawed. CEIOPS and the EC each came up with their own approach to calculate the net-to-gross ratio, and we will prove in this document that both approaches are completely missing the point.
The deadline for implementation is approaching fast, and we see little appetite by the EC to change the current timing. CEIOPS is pushing the industry to participate in QIS5, a major exercise to test the current proposals which takes place between August and November 2010, but there is so much uncertainty that many insurers are reluctant to give it more than their ‘best efforts plus a bit’. There are indeed considerable doubts about the insurance industry’s current readiness for Solvency II, as many companies are apparently adopting a ‘wait and see’ approach at present.Unlike some regulators, few insurers are able to hire an extra 100 people specifically to address the Solvency II regime.
It is not the supervisor’s intention to send a shockwave through the re/insurance industry that could destroy many business plans by imposing extremely onerous capital requirements. Some serious questions come to mind: Will there be sufficient investor appetite to pump more capital into an industry that could deliver substandard returns? Will Solvency II (or rather the Standard Formula) lead to more earnings volatility? Does the current implied market volatility of insurers compare well with the real volatility? If we take just take one example of a Fair Value assessment by the insurance industry – namely the 2009 Market Consistent Embedded Value (MCEV) report by a major European insurer – which should be the best indicator of the ‘fair’ value of the business, the figure doubled in 2009 after being halved in 2008, which makes it very hard to reward management on the value of the business since the change in value that is due to management action is very limited while the volatility is huge. Although the value for Life businesses is largely driven by asset risk, we would expect a matched (and hedged) balance sheet to have less volatility.
The whole Solvency II system hinges on the credibility of the regulators, which should be responsible for training the industry. However, it appears that most of them are seriously struggling to keep up. How many regulators understand the true model and calibration-related issues they are asking from the re/insurance companies they are supervising? Regulators should be staffed and trained to allow for internal model approval within a period of six months. How many regulators in the EU are currently ready to take up this exercise? If regulators go by the book, we cannot see how they will cope with Pillars 1, 2 and 3. The only way forward seems to be a pragmatic approach focusing on what really matters for insurers – namely providing adequate insurance cover to clients at a reasonable price and with sufficient security.
8

AON BENFIELD
Let’s also consider some positives: Solvency II should increase transparency (Pillar 3); it will improve risk management (Pillar 2), and it will create a more solid and underbuilt capital base (Pillar 1). Many companies are planning to use internal capital models, which would be much more representative than the Standard Formula, and which would lead in most cases to significantly lower capital requirements (much more in line with expectations) and thus acceptable solvency ratios. Our S2Metrica software tool can ensure that companies hit the ground running.
In this document we have collected a number of articles written by global experts within the Aon organisation.
The first section precedes this executive summary and provides a good overview of the key points insurers should be aware of with regard to the Solvency II regime.
The second section contains many stand-alone articles that can be read independently of each other:
• Solvency II: Can It Deliver? We show how capital requirements compare under different systems and conclude that volatility is likely to increase under a Fair Value approach.
• Treatment of Reinsurance in the Solvency II Capital Requirement. If you want to get up to speed quickly on Solvency II implications from a reinsurance perspective, this is the article to dive in to.
• Reinsurance Under Solvency II – an Exceptional Source of Capital. Several reinsurance solutions exist to optimise your capital position and earnings volatility in a Solvency II context.
• The Impact of Solvency II on Risk Calibration. An article that appeared in InsuranceERM and that describes the debate between calibrating to ultimate data versus the one-year approach. Auditability of parameters and process is a key concern for regulators.
• Impact of Non-Proportional Reinsurance on Solvency II Capital. This article compares CEIOPS’ net-to-gross ratio with the AMICE proposal from the EC. Neither makes sense, and the solution should be a partial internal model or Standard Formula with Undertaking Specific Parameters that reflects an insurer’s current reinsurance programme.
• S2Metrica – a New Tool for a New World of Regulation. It is possible to simplify building a full or partial internal capital model for Solvency II. Our S2Metrica tool will quickly make that clear.
• The Rating Agency Perspective. Which will be larger, the Solvency II capital requirement or the rating agency version? Rating agencies will surely continue to play their role.
• Challenges for a Captive Audience. Captives can be efficient risk transfer vehicles but they seem to have been forgotten in the progress of Solvency II. Can all captives afford to build internal models?
• IFRS and Solvency II – the Wobbling Road to Divergence? At some point IFRS will also dictate Fair Value liabilities. However, current discussions between the IASB and the FASB seem to be diverging. Will the end result be compatible with the Solvency II Fair Value approach?
We end the document by summarising factual QIS4 information and our recent discussions with regulators on a per country basis, and provide a glossary of Solvency II jargon.
Despite concerns, we believe that Solvency II represents an important step forward for the European Union and the insurers therein, as well as for the global re/insurance industry in general, where individual jurisdictions will be striving to attain Solvency II ‘equivalence’ status in order to maintain a steady flow of business with their EU peers. The re/insurance industry may have been relatively unaffected by the financial crisis compared to the losses suffered by other financial institutions, but this doesn’t mean it should cease to strive for a system that should ultimately enhance its long term stability. A common, risk sensitive platform will provide even greater assurance to the end customer, while allowing enough flexibility for insurers to continue to innovate to the benefit of the industry and their clients.
We see reinsurance, and to some extent the capital markets, playing a more important role as the most efficient way for the re/insurance industry to transfer volatility at an attractive cost of capital.
Enjoy the read.
9

SOLVENCY II FOR REINSURANCE MANAGERS
Solvency II: can it deliver? When Solvency I was introduced in Europe in 1973, capital was not a concern for European insurers – there were enough buffers in the balance sheet to manage earnings and produce stable results. However, accounting rules have since evolved and with the imminent introduction of Solvency II and IFRS Phase II, earnings volatility is now a key concern of most CEOs.
Much has been written over the past few years about the potential ramifications of Solvency II across the European Union, and while some of the text has been conjecture, we are now within touching distance of a solid framework and the reality of what the protocol will mean for thousands of insurers across the continent.
The impact of Solvency II on the reinsurance community has been less well documented, but it is certainly a topic worth exploring. Under Solvency II, reinsurance will no longer be seen as budgeted expense, but as an efficient form of intelligent risk transfer that can significantly benefit insurers’ Return on Equity (RoE), as well as reducing their earnings volatility.
Although the Solvency II Framework Directive was agreed in 2009, the so-called Level 2 implementation measures are still undecided. These implementation measures are extremely important since they will operationalise the Directive and will define the final parameters and methodologies to calculate the required and available capital. CEIOPS conducted a thorough exercise in close collaboration with the insurance industry during 2009 to obtain a first working proposal for these Level 2 implementation levels. This proposal was adjusted by the European Commission (EC) and a new Level 2 document has been created which will form the basis for the QIS5 exercise that will take place from August to November 2010. The conclusions from QIS5 will be published by the end of April 2011, and will be used to make amendments to the final Level 2 proposal that will be delivered by the EC in early 2011.
QIS5 will provide a good insight into the amount of work it will take for insurance companies to become Solvency II compliant by year end 2012, and it is also the first test that will reflect the revised capital charges after the recent financial crisis.
The new proposal from the EC differs from the work produced by CEIOPS in 2009/10, and the following graph compares the effect of all the various proposals that have been discussed so far.
Evolution of capital requirements for a Non-Life insurance company (based on actual case study)
0.050.0
100.0150.0200.0250.0300.0350.0400.0450.0
Solvency I
S&P BBB
QIS 4 SF
QIS 4 SF (USP premium)
SF CP's January 2010
SF CEIOPS 04/10
SF (USP premium) CEIOPS 04/10
QIS 5 04/10
QIS 5 04/10 USP premium
Internal model
Available
Required
Capital reliefthroughreinsurance
Source: Aon Benfield
10

AON BENFIELD
The graph details the various options of calculating Solvency II required capital. Note that the QIS5 available capital, for reasons of practicality, has not been recalculated and is similar to QIS4 although the quality of the available capital (Tier 1 to Tier 3) will be different (e.g. profit from tacit renewals and multi-year contracts can be included). In particular, for Life insurers there are some serious differences in opinion between CEIOPS and the EC in relation to the tiering of capital, e.g. the treatment of Value of In-Force (sometimes known as In-Force Cash Flows). This discussion will also be relevant for Non-Life lines of business with high persistency rates. In this paper we will not dwell on the tiering of capital. For people interested in this discussion, we would refer to equity research by Citi which goes into a lot more detail on this topic.
Solvency I Provided as a reference number S&P BBB Provided as a reference number QIS4 SF Standard Formula result under the 2008 QIS4 conditions QIS4 SF (USP premium) Standard Formula result under the 2008 QIS4 conditions with premium standard
deviations replaced by Undertaking Specific Parameters (pre-described method) SF Consultation Papers January 2010
Standard Formula result using the parameters released by the Consultation Papers prior to January 2010
SF CEIOPS 04/10 Standard Formula result using the parameters from the CEIOPS April 2010 calibration of Non-Life premium and reserve risk standard deviations
SF (USP premium) CEIOPS 04/10
Standard Formula with premium standard deviations replaced by Undertaking Specific Parameters (using Consultation Paper75 method 1)
QIS5 SF Standard Formula result according to QIS5 based on the QIS5 technical specifications
QIS5 SF (USP premium) Standard Formula result according to QIS5 based on the QIS5 technical specifications with premium standard deviations replaced by Undertaking Specific Parameters
Internal model The result of an internal model that fully covers the risk mitigating effects of the reinsurance programme in place and management actions
Under the current Standard Formula proposed for QIS5, the insurer’s solvency ratio would fall significantly, as per our specific example, from about 250% under Solvency I to about 115% under Solvency II (versus an estimated industry average of 140%) – which seems rather punitive given that no pure insurer failed during the financial crisis. While raising additional capital will be one way for insurers to maintain business volumes, a second option is to transfer risk and thus reduce capital requirements significantly. This can be achieved through an effective and appropriate reinsurance programme that would allow insurers to pursue growth opportunities rather than stagnate.
Across Aon’s various divisions we have teams of colleagues analysing the potential impact of Solvency II on our clients’ businesses and offering advice on the most appropriate risk transfer initiatives. We have been looking at how we can simplify their Solvency II workloads, and have created a new tool, S2Metrica, which assists them in creating an internal model in a very short timeframe.
Insurers will also be able to model their existing reinsurance programme, and assess its efficiency under Solvency II. Seeing the QIS5 proposal, it is unclear if non-proportional reinsurance will be adequately reflected in the final Level 2 Standard Formula except for catastrophe risk, and so many insurers may face higher capital requirements than would be a true reflection of their exposures. Therefore, and in addition to our role as a reinsurance intermediary, we are helping our clients with their internal models and simplifying the whole Solvency II universe for them in order to obtain a well-balanced (partial) internal model providing credit in line with the risk that is transferred.
11

SOLVENCY II FOR REINSURANCE MANAGERS
The Solvency II regime will also increase the need for insurers to understand solvency capital relief when valuing reinsurance. It will become more important and more challenging than has been the case historically to purchase the optimal reinsurance structure in line with Solvency II’s balance sheet risk management approach. Chief risk officers will have an important role to manage risks according to the insurer’s risk appetite and risk tolerance, and ensure that the risk risk transfer policy encapsulates all business risks. Across Europe there is a trend of more risk managers appearing, but the formal CRO role is still to be filled for many Continental European insurers.
Solvency II will impact each re/insurer differently. The real value in understanding the regulatory capital saving from particular reinsurance contracts will be from dissecting each individual company’s balance sheet. Although some broad trends have become apparent from the Standard Formula, there will be opportunities for companies to fine tune their balance sheets to optimise capital efficiency.
Catastrophe exposure is often a key driver in the regulatory capital calculation. Under QIS4, Non-Life companies could derive their catastrophe risk capital charge using one of three options: a factor based approach, a scenario based approach based on regional scenarios, and a personalised scenario based approach. This will change under QIS5, and companies will be forced to choose between standardised scenarios and a factor based method. A Catastrophe Task Force has been established to ensure that the calibration of the scenarios is harmonised. Personalised scenarios, which effectively mean using the commercial catastrophe models, can only be taken into account via a partial internal model. We fear that under QIS5, there will still be a discrepancy between the real catastrophe risk exposure and the simulated exposure from the Standard Formula. However, using efficient reinsurance, companies should still be able to manage their catastrophe risk exposure in line with their overall risk appetite. The design of the catastrophe component in the Standard Formula is created in such a way that it will allow for all risk mitigating effects of reinsurance (even multiline stop loss will be allowed) and hence limiting the catastrophe exposure in the capital calculation to the aggregate limit net of reinsurance. Re/insurers will have to explain and document to the regulator how they moved from the gross capital requirement to the net capital requirement.
For other Non-Life risks, non-proportional reinsurance has been introduced in the current proposal of the QIS5 technical specifications, but it is uncertain whether and how this will be the case in the final Level 2 guidance. Where companies have extensive non-proportional reinsurance programmes and want to benefit from the possible capital relief, a (partial) internal model or applying the Standard Formula with Undertaking Specific Parameters can offer an alternative. Although some companies may respond by buying less non-proportional reinsurance when limited credit is given and only buy more where they achieve full regulatory capital benefit, we believe this is a short-term view and not supported by economic risk management principles. Indeed, reinsurance purchasing for many companies will continue to be influenced or even determined by rating agency requirements rather than economic capital views.
In a Fair Value world, both available and required capital will become more volatile. History proves that this has always been the case. The only difference that Solvency II will bring is that the figures will need to be calculated and disclosed. How investors will look at insurance companies in a Solvency II era is still unclear and will depend on whether the volatility disclosed is higher or lower than what is currently assumed by the markets. Solvency II will certainly bring capital – and all the elements that can create or destroy it – to the people in a much more harmonised way than in the past. For sure, this will have an impact on management, the product department, the reinsurance department, the actuaries, and – due to its one-year risk approach – also to accountants who will favour the balance sheet to balance sheet approach. In fact, Solvency II will touch all those involved in the insurance business.
12

AON BENFIELD
Treatment of reinsurance in the Solvency II Capital Requirement The principles behind Solvency II are about understanding the risks inherent in the business and understanding how those risks contribute to the capital requirement.
Reinsurance is a tool for transferring risks and hence reducing overall volatility. Depending on the type of reinsurance and the loss-capacity that is transferred, it can have an effect on the volatility of earnings and on the capital the company should hold in order to maintain a sufficient level of solvency or target an adequate rating.
The various options provided under Solvency II to calculate the Standard Capital Requirement (SCR) do not always encompass reinsurance to its full extent.
Companies using the Standard Formula Under the recent QIS5 disclosure for Non-Life risks, the Standard Formula includes a Premium & Reserve component, a Lapse and a Cat component. All components allow including the risk and capital mitigating effect of reinsurance – but not to the same extent.
The Premium & Reserve risk component is conceptually built on a volume and a risk measure (Standard Deviation). The higher the volume and the more risk, the higher the capital requirement will be:
• The volume measure is defined on the Fair Value of outstanding net claim liabilities and next year’s expected net premiums1. Since reinsurance (through ceded premium or a share in the technical provisions) reduces the net exposure, the volume measure is immediately impacted and hence a direct impact on the required capital is introduced.
• The impact reinsurance might have on the risk measure is less obvious and depends on the type of reinsurance. In the current proposal the risk measure is pre-defined both for reserve risk and for premium risk (based on extensive research on European data) on a gross basis. The reserve risk component is netted down to reflect the risk mitigating effect of reinsurance on the development of reserves. This netting procedure was carried out on an average European basis (assuming an average reinsurance programme is protecting prior year liabilities). The premium risk is netted down with a ratio NCRi/GCRi that is calculated on the companies’ data, and which should reflect the risk mitigating effect of non-proportional reinsurance.
The current proposal therefore recognises that both proportional (by reducing the volume measure) and non-proportional reinsurance (by reducing the volume and the risk measure) have a risk-mitigating effect that should be reflected in the Standard Formula. The methodology that has to be used to calculate NCRi/GCRi is, however, still under discussion. The options provided by CEIOPS and by the European Commission (AMICE proposal) are described later in this section.
Perhaps somewhat less logical is the fact that for two companies with the same risk profile, the higher the reserves (technical provisions), the higher the required capital. Although theoretically there should be no difference in the best estimate reserves of similar companies, in practice we observe ranges of about 20% around the best estimate, primarily due to different views on assumptions. Thus a company that is more conservative in calculating its technical provisions, will have a higher capital requirement. This is also the case under Solvency I.
1 The Net premium definition is considered from a Fair Value perspective and not anymore from an accounting perspective (essentially expected pure premium without profit loading).
13

SOLVENCY II FOR REINSURANCE MANAGERS
The Cat component in the Standard Formula covers both natural and man-made catastrophe scenarios. For various reasons, the calculation process will differ from the one used in QIS4:
• Regional scenarios in QIS4 where not always detailed in the same manner by all regulators, leaving room for cherry-picking. The scenarios focused on individual events rather than a possible accumulation of several medium-sized events. Guidance was required on how to integrate all scenarios (since it is unreasonable to assume that all scenarios would impact the undertaking simultaneously).
• Personalised scenarios were considered to be complex, difficult for regulators to judge, and tailored to individual company needs. These were therefore transferred to (partial) internal models.
The Standard Formula will be based on scenarios provided by the Catastrophe Task Force. The final scenarios will be delivered by June 2010 but a first set of events and perils have already been included in the QIS5 technical guidance. The final aim is to have this list updated once every three years. These scenarios, covering both natural and man-made events, will be detailed per peril or event on a gross basis. In case the event is defined as a market event, the market share will be used to derive the company specific loss.
In order to calculate the net effect, a pre-described method is provided but this methodology will probably be expanded by more practical guidance by the Cat Task Force. In case the catastrophe loss is protected by a pool or national arrangement, the effect of this cover should also be taken into account.
Due to its construction around individual catastrophe events, the Cat risk component in the Standard Formula facilitates the use of proportional and non-proportional reinsurance much more than in the Premium & Reserve component. Aggregate limits & stop loss protections can also be used but the user will have to explain how he has arrived at the net estimation. Clearly, due to the aggregation technique of man-made and natural catastrophes, the possible impact of the scenarios on multiple lines of business, and the introduction of accumulation of events, this net calculation will be a challenging exercise for each reinsurance department that has a aggregate limit protecting their balance sheet exposure.
All these considerations will certainly be welcomed by insurance companies and captives. Due to the inclusion of multiple events in the scenarios, insurers will receive credit for purchasing reinsurance contracts with reinstatements. Solvency II also states that the capital requirement for a particular Line of Business (LOB) cannot exceed the aggregate limit (= net retention, taking into regard the policy limit and the reinsurance limit including the cost of reinstatements). The formula includes, however, a requirement that if one has an aggregate cover in addition to a specific cover for a certain LOB, the aggregate limit cannot always be taken into account to cap the catastrophe event since it might lead to double counting.
In two cases, a factor based method (factors applied on net premium per LOB) will have to be calculated:
• As an interim solution, when there are no standardised scenarios available or are not relevant and a partial internal model is not proportional;
• On a permanent basis, in cases that are clearly specified (e.g. miscellaneous LOB).
Examples of non-relevance of the Standard Scenarios could be:
• Material exposure outside the EU. • Material inwards non-proportional reinsurance. • The scenarios have a footprint (or in general, risk characteristics) which is not applicable
to the company’s exposure (e.g. local risks not corresponding to CRESTA zone aggregates).
Alternatively, higher quality data could be a reason for companies to use a partial internal capital model for calculating the capital requirement in relation to their catastrophe exposure.
14

AON BENFIELD
As part of their ORSA, companies should evaluate whether the standardised scenarios and the range of possible outcomes are applicable to their portfolio. The limitations of such scenarios should be covered as well in the ORSA. In the extent that the risks covered in the scenario deviate significantly from their risk profile, the alternative methods shall be chosen (factor or partial internal model). This will most likely be the case for numerous captives.
Companies using the Standard Formula with Undertaking Specific Parameters Companies with sufficient historical data might conclude that the standard parameters may not fit their portfolio and hence lead to an overstated capital requirement. Under certain conditions, such companies can replace certain parameters from the Standard Formula with Undertaking Specific Parameters (USP):
• Non-Life Premium and Reserve Risk. • Health (not similar to Life) Premium and Reserve Risk. • Health (similar to Life) Revision risk. • Life Revision risk. Indeed, under the Standard Formula approach described above, the (risk) parameters used for calculating companies’ SCR:
• Are calculated on a pan-European basis. • Assume that changes in loss-ratios over time (used in the calibration process) were triggered by
the volatility in losses and not by premium rates (and hence no allowance was made for the possible effects of underwriting cycles).
• Are independent of the size of the company and hence assume that large, medium and small insurance portfolios will all show the same volatility of loss ratios and technical provisions as time goes by.
• Assume an average historical inflation. • Do not always reflect the true impact of reinsurance on the capital (only the effect of working layers
is taken into account for a limited time period of three years under the CEIOPS proposal). In order to be allowed to use USP, supervisory approval is required and supervisors will focus on the quality of data and the (pre-described) techniques used to recalculate the parameters in the Standard Formula based on the company data. The replacement of the standard parameters in the Standard Formula has to be justified by demonstrating that the estimation based on the internal data is more appropriate for the company's risk profile than using the standard market assumptions.
Historical net loss-ratios used in the calculation are allowed to be recalculated on an as-if basis, hence reflecting the current reinsurance programme. At least five years of historical Fair Value calculated loss-ratios have to be available in order to obtain supervisory approval and, in case the data is influenced by a cycle, the full cycle should be included in the calculation. This will certainly limit the use of this technique in the early years when Solvency II becomes active, unless companies begin to prepare themselves.
Large to medium companies with an adequate history of calculating best estimate provisions and a procedure to compare these against experience (as required by the Solvency II Directive), will benefit the most from this USP-approach since the current risk measures in the Standard Formula are probably more tailored to smaller portfolios, which can benefit less from diversification benefit as only best estimates will be allowed in the calculation process.
15

SOLVENCY II FOR REINSURANCE MANAGERS
Companies using partial or full internal models Solvency II encourages companies to understand the true volatility in their balance sheets and the risks that are taken during underwriting. It therefore encourages companies to have (partial or full) internal models. These models should be designed and managed in such a way that risk mitigating techniques (such as reinsurance) can be analysed in terms of their impact on company performance and capital position. By using a partial or full internal model, companies can calculate the full benefit of their reinsurance purchases.
Solvency II goes beyond the pure calculation of the capital required and encourages reinsurance managers to develop and use coherent approaches to analyse reinsurance and implement capital efficient buying strategies that go beyond buying reinsurance according to a pre-defined budget.
Solvency II also encourages considering risk on an enterprise-wide level. This implies that reinsurance managers will be forced to think less in terms of silo based strategies, but more in terms of enterprise-wide capital strategies that can be filtered down to defining capital efficient, class by class, layer by layer reinsurance solutions.
As a result, reinsurers may find they need to become more flexible. The reinsurance market will change and companies will realise that they need more reinsurance in some areas and less in others. If not for regulatory purposes, reinsurance buyers have a strong economic incentive to improve their modeling techniques that will ensure all reinsurance purchases make optimum use of their capital.
This is in line with Aon Benfield’s current integrated capital solutions strategy, and our strategy since 1994 to buy reinsurance as a means of transfering volatility and reducing required (regulatory and rating agency) capital at a cost below a client’s internal cost of capital.
The Consultation Paper (CP) proposals from CEIOPS were never demanding on partial or internal model requirements, but the current QIS5 proposal does require that companies that have material amounts of non-proportional catastrophe inwards reinsurance, or have material amounts of catastrophe exposure outside the EU, apply for partial internal model approval.
Many insurers are enquiring about an internal model. Their nervousness is mostly related to uncertainty about the final Level 2 and Level 3 advice from the EC, and the concern that regulators might not approve the model (because of resource constraints or disagreement on the criteria) so that the Standard Formula would still be the constraint.
16

AON BENFIELD
Reinsurance under Solvency II – an exceptional source of capital In the recent QIS 5 publication of 6 July, the principles below have changed slightly. However, the new text is unclear and the QIS 5 annexes seem to differ at times to the technical specifications.
Risk tolerance Whether reinsurance or capital market covers are bought to cover peak risk for a single line of business, a stop-loss programme protecting the whole book at remote attachment points, or a programme protecting the more frequent losses, they express the risk tolerance the management is (or is not) willing to take on its insurance risks. Those risks that are not in line with the risk tolerance are ceded to the reinsurance market or to the capital markets, and due to the diversification effects the reinsurer or the investors can generate on these risks, it can be done at an attractive price, making it a win-win situation for both parties involved in the transaction.
When the risk is transferred to the external market, the technical insurance risk is replaced by a counterparty risk, but what if the counterparty defaults and it is not able to continue to provide protection?
With this in mind, the regulator has put constrains on the quality of the counterparty and the risk mitigating effects of reinsurance.
Allowance of reinsurance mitigating techniques In the described methodologies to calculate the Solvency Capital Requirement (Standard Formula, Standard Formula with Undertaking Specific Parameters or full/partial internal model), reinsurance is allowed as a risk and capital mitigating technique (reducing the SCR) subject to certain conditions. CEIOPS has chosen to establish a principle-based approach to decide whether a reinsurance contract can be considered in the calculation of the SCR. This should facilitate the ongoing development and evolution of reinsurance risk mitigation techniques.
• Principle 1: Effective risk transfer. The entire relationship between cedant and reinsurer (including legal relationship) should be considered in order to verify whether risk is indeed being transferred. In the case that basis risk is involved (e.g. parametric catastrophe bond), the impact of the cover in the reduction of the SCR shall only be considered when the company is able to demonstrate that the basis risk is not material compared to the mitigation effect. If sufficient risk is transferred then the remaining basis risk shall also be taken into account as an offsetting factor in the SCR calculation.
• Principle 2: Economic effect over legal form. The economic effect of the transaction will be more important than the legal or accounting form. The SCR shall reflect a reduction in capital requirements commensurate with the extent of risk transfer through reinsurance and an appropriate treatment of any corresponding risks that are acquired in the process (e.g. counterparty default risk).
• Principle 3: Legal certainty, effectiveness and enforceability. The risk mitigation should be legally enforceable in all relevant jurisdictions. If reinsurance is used to reduce capital requirements, the SCR should be increased to allow for the possibility that reinsurance protection will not be renewed on expiry or will be renewed on adverse terms. This could be a potential issue for Loss Occurring contracts since they do not always provide protection for the full exposure period that is considered within Solvency II (e.g. in the case of multi-year contracts).
• Principle 4: Valuation. The design of the standard SCR calculation shall recognise reinsurance as a risk mitigation technique in such a way that there is no double counting (e.g. through overlapping local and umbrella covers). Where the reinsurance risk mitigation technique actually increases risk, the SCR shall be increased.
• Principle 5: Credit quality of the provider of the reinsurance risk mitigation instrument. – Reinsurance bought at entities that are Solvency II compliant and which have a solvency ratio
(own funds / SCR) below 100% should not be recognised as risk mitigating.
17

SOLVENCY II FOR REINSURANCE MANAGERS
– Reinsurance bought with entities that are not Solvency II compliant but have an equivalent regulatory system, a likewise approval will be required: reinsurance risk mitigation in the calculation of the SCR is only allowed if the equivalent Solvency ratio of the counterparty is greater than 100%.
– Reinsurance bought with entities that are not Solvency II compliant nor operate under an equivalent regulatory system, will have to have (or demonstrate the capability) at least a BBB (stable) financial strength rating with a regulated rating agency. The rating agency should be compliant with the Regulation on Credit Rating Agencies.
– SPVs will also be subject to limitations, and additional reporting requirements are defined in order to ensure that the supervisor of the SPV has all the information required to make an approval decision in line with Solvency II Level I. Only supervisors can give approval.
It is important to note that for European reinsurers and reinsurers operating in a Solvency II equivalent system, the Solvency ratio will prevail over the financial strength rating.
Counterparty default risk (e.g. introduced by means of reinsurance) Insurance companies can be subject to various forms of counterparty default risk. Most of the default risk is embedded in the investment book (corporate bonds, credit spreads…) but in addition, reinsurance introduces a counterparty default risk to the reinsurer (both to the claims he is covering as to the protection he is providing). Also, policyholders and intermediaries (unpaid premium) cause a counterparty default risk.
The counterparty default capital calculation in the Standard Formula was largely criticised after QIS4 due to the technical difficulties in the calculation approach and the minor effect it had where the portfolio was well diversified with counterparties (both in number of counterparties as well as in their ratings). Many adjustments and simplifications were made in the new formula that will be tested in QIS5 but unfortunately the financial crisis has also shown that counterparty default has characteristics of tail dependency which impacts the framework of the Standard Formula. Both the structure and the scope of the counterparty default calculation have substantially changed in QIS5 compared to QIS4, and the effects of the crisis are clearly visible. New features in the QIS5 counterparty risk module are as follows:
• Some contracts (mostly Life) offer policyholder guarantees that are provided by third parties (e.g. investment bank Lehman Brothers). If the insurance company is held liable for these guarantees, in case of default of the third party the guarantees should be treated like derivatives in the calculation of the counterparty default risk module.
• Off-balance sheet guarantees, letters of credit, and letters of comfort provided by an insurance company which depend on the credit quality of the counterparty, will need to be taken into account. In case the counterparty approaches default, the guarantee will turn into a liability and therefore these instruments are included in the Standard Formula module of counterparty default calculation.
• The model structure also includes a random shock variable that affects all counterparties due to a similar event (e.g. financial crisis, major catastrophe).
• Observed recovery rates of defaulted securities like CDOs are substantially lower than assumed under QIS4.
• The look-through-approach (available in QIS4) is not allowed anymore. Where reinsurance was centralised and risks (partly) retroceded, the operating companies could calculate the counterparty default risk charge using the rating of the retrocessionaires for the share of the recoverables that were retroceded (look-through-approach). Where the risk was fully transferred (100% retroceded) it implied that the operating companies could use the rating of the external counterparties, implicitly assuming that capital flows within the group were unrestricted. The financial crisis has shown that the above is certainly not the case in times of distress and therefore these approaches will not be allowed in QIS5.
18

AON BENFIELD
The new proposed framework makes a distinction between Type 1 and Type 2 exposures:
• Type 1 exposures include all counterparties that can be individualised and where an external rating is likely to be available. These include counterparties from reinsurance arrangements, securitisations, derivatives, cash at bank, deposits, called up but unpaid capital, letters of credit, initial funds, guarantees, and letters of comfort which the company has provided and which depend on the credit standing of the counterparty.
• Type 2 exposures include grouped, diversified counterparties which are usually unrated. These include receivables from intermediaries and policyholder debtors.
Normal counterparty default calculations only focus on the loss that the insurer’s balance sheet would take in the case of counterparty default. However, a defaulting reinsurance company has a double effect on an insurer’s balance sheet. On the one hand, the share that the reinsurer had in the insurer’s outstanding gross claims becomes unrecoverable (if not protected by deposits); on the other hand, the protection he was providing (and its possible reducing effect on the SCR the insurance company had to hold) is not available anymore, which results in an increase in SCR for the insurance company.
The Standard Formula tries to capture all of the above elements in a different approach for Type 1 and Type 2 exposures (less complex for Type 2 than Type 1). Calculations for Type 1 exposures will have to be done per counterparty (or grouped in similar classes with similar probabilities of default), so it will be important for the reinsurance administration to manage counterparty exposures on an individual basis, keeping track of historical commutation (e.g. reinsurance companies that are sold to other reinsurance companies) and whether these belong to the same group. Each Type 1 counterparty will have to be assigned a probability of default and these will be based on information received from rating agencies which will have to detail the accompanying probability of default together with the rating they have given to the counterparty. In instances where a counterparty does not have a rating, it will have to rely on its published Solvency ratio to derive a probability of default. If this is impossible, a probability of default of 10% (corresponding to an S&P rating between B and CCC) will be assigned.
If collateral is provided in relation to the exposure of the counterparty, it can be used to reduce the counterparty default risk under the condition that the custodian holding the collateral is independent from the counterparty and the collateral is valued using a risk-adjusted approach (bearing in mind the market risk attached to the collateral and the credit risk from its exposure to the custodian). As long as the custodian is bankruptcy-removed, it would mean that 85% of the collateral can be used to reduce the counterparty default risk.
Finally, the methodology used to calculate the risk for Type 1 exposures takes into account the number of counterparties involved in the counterparty default risk. Having an exposure to a limited number of counterparties is being penalised in the formula. Without going into detail, one could say that the capital requirement for a well diversified portfolio of recognised capitalised reinsurers can be 40% lower than a portfolio of less diversified counterparties.
The impact of the changing balance sheet on reinsurance under Solvency II In a Solvency II world, reinsurance will not only affect the SCR calculation, but also the balance sheet. Reinsurance assets need to be valued on a Fair Value basis, which includes a best estimate approach for reinsurance recoverables. Given that the reinsurance recoverables might stem from various accident years, all protected by different reinsurance programmes, this calculation will most likely be a non-linear one. The best approach to consider all the options that are embedded in the reinsurance contracts (e.g. stability clause) is to calculate the reinsurance recoverables using a stochastic approach. This is the only approach that will guarantee that the best estimate derived from this approach is truly a best estimate in line with the Solvency II requirements. Practicality and materiality will probably force most companies to use a more simplified approach to calculate the best estimate cash flow of reinsurance recoverables. The Fair Value calculation should also reflect a reduction of the obtained (discounted) best estimate, due to the potential default of the counterparty. Certainly, for long-term liability covers, this might cause a concern if not all historic counterparties have (or no longer have) an adequate rating.
19

SOLVENCY II FOR REINSURANCE MANAGERS
The market value margin will have a direct impact on companies’ net assets. If a company has no proper methodology to calculate the market value margin, it will have to fall back to the simplifications, which have been defined very conservatively (e.g. 8% for MTPL, 10% for GTPL). Companies with an efficient reinsurance programme protecting prior year liabilities should have a much lower MVM since they can use their net exposure in the calculation of the MVM. This will however only be the case if the MVM is calculated in a sophisticated manner taking into account prior year reinsurance programmes.
With Solvency II taking effect in October 2012 as currently planned, some companies will see a step change in the size of the net assets on their Solvency II balance sheet. Rather than looking to raise capital to fund this shortfall, companies may consider reinsurance options to reduce their capital requirement. The types of reinsurance that companies will consider will depend on the specific balance sheet changes that affect them most.
Companies that have been writing particular lines for many years may consider retrospective reinsurance solutions like Loss Portfolio Transfers or Adverse Development Covers on existing reserves to reduce their capital requirement to reduce ‘dead capital’. Other companies that write capital intensive lines may consider purchasing more traditional reinsurance. Also, several companies have been moving towards more enterprise-wide contracts and aggregate reinsurance solutions e.g. Out-Of-The-Money Stop Loss covers.
One thing is for sure, the market is changing.
20

AON BENFIELD
The impact of Solvency II on risk calibration Many companies have invested in building internal models to cover their balance sheet risks over the past few years, sometimes driven by regulatory requirements (e.g. ICA in the UK), and sometimes driven by management or rating. The Solvency II framework introduces the one-year risk framework which might affect the model architecture or the calibration process on these existing models.
Actuaries are puzzled by the one-year risk concept, and existing internal models need to be adjusted to bring them in line with the Solvency II Directive. Meanwhile, managers fear that the theoretical framework will not be in line with the way they have been running their businesses long before Solvency II was spotted on Google.
But is Solvency II actually that different from standard business practices?
Decomposing Article 101 The Fair Value balance sheet is one of the cornerstones of Solvency II, and its impact is not restricted only to the calculation of Fair Value assets and liabilities. The concept of market value margin (MVM), and the related one-year risk approach in the calculation of the Solvency Capital Requirement (SCR), find their origin in this Fair Value-driven approach: re/insurance companies should have enough capital on their balance sheets to cover the risks that can emerge over a 12-month timeframe and allow for a (theoretical) transfer of all (contractual) liabilities at the end of this balance-sheet period. This means that companies have to be able to calculate the impact of such shocks on their end-of-year balance sheets, and value these in such a way that they can be transferred to a third party.
Article 101 of the Solvency II Directive defines the calculation of the SCR and is written in a very concise way, but when one begins to distil the various concepts introduced, it appears to be far more challenging than at first glance. Certainly, for those companies interested in developing a partial or full internal model, a proper understanding of Article 101 and its consequences on model architecture and calibration-related issues is crucial. If one reads carefully, one can separate:
• The ‘shock’ period – this is the period over which a shock is applied to a risk. In Article 101 this is defined as one year. Therefore, only shocks or risks that can occur over the preceding 12 months need to be considered, whether these are shocks that affect the investments (e.g. a change in credit defaults) or shocks that affect the liabilities (e.g. a windstorm).
• The ‘effect horizon’ – the period over which the shock that is applied to a risk will impact the company’s balance sheet. For instance, should a change in legislation become effective during the shock period, this will have a consequence on future claim payments and will impact the valuation of the liabilities. In this case, the effect horizon is the ultimate time horizon of the policy obligations. Likewise, a change in dividend yield will not only have an impact on the dividend expected for the coming 12 months, but will also impact future dividends and hence the valuation of the asset. In Article 101, this definition is included in the valuation of the basic own funds, which are defined as the excess of Fair-Value assets over Fair-Value liabilities.
• The ‘exposure basis’ – this is the exposure that one needs to take into account when applying the shock. In Article 101, this is defined as the existing in-force liabilities at the opening balance sheet, plus the expected exposure from new business written over the subsequent 12 months. In most cases, the exposure basis will include exposure beyond the shock period. This particular exposure does not need to be shocked any more, but the possible impact from the shock occurring during the 12-month period needs to be included in the revaluation of the net assets.
• A ‘risk profile’ – this is the distribution function from which the required capital will be derived. In Article 101, this is defined as the basic own funds. In an internal model it will therefore be crucial to calculate the movement of the basic own funds over a period of 12 months, allowing for a proper valuation at the end of this 12-month period, in line with the exposure the company is expecting to write.
21

SOLVENCY II FOR REINSURANCE MANAGERS
• A ‘risk measure’ – this is the statistical risk measurement applied on the risk profile. This has been set to the value-at-risk approach (VaR).
• The ’risk tolerance level’ – 99.5%.
Impact on internal model kernel When reading the Directive, it would seem that generating an internal model that models excess of assets over liabilities is straightforward, but as soon as one gets into the details, one realises that, among the 80 Consultation Papers (CPs) published so far by the Committee of European Insurance and Occupational Pensions Supervisors (CEIOPS), there is very little guidance on how the requirements can actually be achieved.
A proper understanding of all these elements can make a major difference in the resulting SCR and the way the internal model can be used within the company to define a risk-limit structure and to assist in capital-related issues that management is facing.
The whole idea to focus on a balance-sheet perspective was probably welcomed by those with an accounting background, and it will also facilitate discussions between valuation-related aspects of Solvency II and future International Financial Reporting Standards (IFRS). For most actuaries, however, this approach, and the consequences it brings in terms of calibration of risks, has come as a surprise and is still creating confusion.
Historically, actuaries have calculated premium and reserve-related risks from an ultimate perspective, considering all the shocks that might occur over the lifetime of the liabilities. Now that the regulatory regime becomes truly risk sensitive and regulators’ work becomes more important, does this approach suddenly become less appropriate?
Risk-takers tend to calculate risks not only up to the end of the first year, but until the full development of risks. This is normal since the price should cover the full risk period, not only the first 12 months. The MVM is the glue that combines both visions, but this tends to be so technical that many people lose themselves in over-complicated calculation processes.
Is there actually so much difference between this one-year and ultimate approach? This really depends from which angle you look at the problem. Capital requirements calculated from a one-year risk approach will, in most cases, be lower than when calculated on an ultimate perspective. However, when one looks at the problem from a calculation point of view, the approach taken between a one-year or ultimate basis does not necessarily need to be that different.
The AISAM-ACME study on Non-Life long-tail liabilities in October 2007 raised the alarm that only a few members were aware of the inconsistency that existed between their assessment on an ultimate basis and the Solvency II one-year approach. Since then a number of algorithms have been described in actuarial literature to calculate risks from a one-year perspective. This seems to give the impression that ultimate and one-year are two different approaches. A much more logical approach is to calculate the risks to ultimate and then introduce a second process: How much of the risk (=deviation from the expected value) can be realistically measured over the first 12 months, over the first 24 months, etc., until, at ultimate, all the risk can be measured.
This second process is called the emergence of risk process. Take for example a reinsurer writing long-tail business. The change in the view of the expected ultimate cost of claims over one year could be negligible, but the actual ultimate cost of claims after all liabilities have been extinguished could be very different from the opening view. In this case, the SCR covers the risks emerging during the first 12 months and the implications these might have on the end-of-year valuation, but the MVM covers the risks associated with the settling of liabilities beyond this 12-month period. Or, to be even more precise, the SCR covers the capital required to cushion the risk for the first 12 months, whereas the MVM covers the cost to attract capital to cushion the risk beyond the 12-month period.
22

AON BENFIELD
Example of development table of best estimate ‘ultimate loss ratios’
1993 1994 1995 1996 1997 1998 1999 2000 2001 2002 2003 2004 20051993 107.5% 107.5% 115.0% 115.0% 102.6% 95.3% 78.7% 74.4% 78.4% 70.8% 70.4% 66.6% 64.1%1994 107.5% 100.0% 112.5% 112.5% 93.9% 81.6% 80.7% 79.3% 68.3% 63.4% 61.2% 59.6%1995 107.5% 105.0% 120.0% 110.0% 88.0% 84.5% 82.7% 80.7% 80.1% 76.3% 73.6%1996 107.5% 112.6% 112.5% 105.0% 103.5% 101.9% 93.3% 97.9% 96.8% 92.8%1997 112.5% 115.0% 115.0% 115.0% 115.0% 106.7% 110.3% 112.9% 109.9%1998 115.0% 105.0% 110.0% 122.5% 127.5% 142.5% 150.0% 162.5% σ (U,prem,lob)
1999 110.0% 107.0% 105.0% 105.0% 110.0% 140.0% 145.0% = 19,51%2000 105.0% 100.0% 100.0% 107.5% 115.0% 142.5%2001 107.5% 97.5% 97.5% 92.5% 95.0%2002 σ (U,prem,lob) = 13,97% 75.0% 75.0% 70.0% 67.5%2003 70.0% 70.0% 67.5%2004 72.5% 67.5%2005 80.0%
The above table shows the various ultimate loss ratio calculations (measured at different positions in time) per development period for a reinsurer who writes non-proportional business. When considering only the risk that emerges over the first 12 months, the loss-ratio seems to be quite stable across the various accounting years. This probably finds its reason in the fact that not much information is available, and most is based on estimates. Only through the development, information becomes available and the true ultimate loss-ratio (and its movement over time) becomes visible.
As an example the (premium risk) standard deviation suggested in Consultation Paper75 (method 1) was calculated based on the observed ultimate loss-ratio in its first year of development (13.97%) and based on the last known ultimate loss-ratio (19.51%). Clearly, the risk that emerges over the first 12 months is much lower than when considered from an ultimate perspective. The example clearly demonstrates the importance of the various definitions introduced by the Fair Value concept, not only on the calculation of the SCR but also on the MVM. Needless to say, a proper MVM calculation will be important for those companies writing long-tail re/insurance.
Risk emergence patterns Using risk emergence patterns to bridge the link between one-year and ultimate is probably welcomed not only by actuaries but also by management. Actuaries do not have to change their traditional way of working. In order to come up with one-year risk parameters for reserve or premium calculation they can remain working on an ultimate basis, but an additional process will need to be added to derive appropriate parameter inputs for a Solvency II-type calculation. In their expression of the risk appetite, management might not only be interested in covering the capital for the one-year period, but might also be interested in the level of capital required to cover the full run-off.
Emergence of risk through the development period
t=0
t=1 t=2 t=3 (ultimate)
SCR(t=0|t=0) SCR(t=1|t=0) SCR(t=2|t=0)
The above example shows the emergence of risk at the end of various 12-month periods, each showing the position of the ultimate view of loss given a certain ‘state of the world’.
23

SOLVENCY II FOR REINSURANCE MANAGERS
Impact on calibration The Solvency II framework has been established to protect policyholders, and the one-year SCR + MVM approach is an appropriate way of doing so. Companies should be aware, however, that calculating SCR based on an ultimate perspective will lead to a much higher than required capital requirement that provides greater policyholder protection than the regulator is aiming for. Calibration of insurance risk on a total balance sheet approach itself is a quite challenging exercise – certainly in the case where one tries to cover all aspects of the technical insurance both on a gross and net level:
• Premium modelling: large loss, attritional loss, natural catastrophe loss, man-made catastrophe. • Reserve modelling: large loss, attritional. • Counterparty default modelling. The one-year approach and the implications it has on the calibration process creates an additional requirement. But certainly from a use-test perspective, it is much better to re-use existing processes (which mostly deal with ultimate calculations) and append these to introduce the one-year risk approach. The aspects of risk emergence are not restricted to reserve risk only (as is currently discussed in most actuarial literature) but also have important implications on attritional and large loss premium risk modelling, certainly because the emergence of reserving risk between these different capabilities needs to be undertaken on a consistent basis. The icing on the cake is deriving a proper net-of-reinsurance position of the SCR where a clear link with all ultimate calculations is still auditable.
The impact of reinsurance on the risk profile of a company will therefore need to be reconsidered since it will have an effect on multiple levels:
• The SCR – this will be the effect that will be most visible in future Solvency II related capital calculations.
• MVM – reinsurance can protect the business for the full run-off of the claim, and hence will also have an impact on the MVM calculation.
• ORSA (Own Risk and Solvency Assessment) – management should not only look at the capital required to cover the first 12 months but assume a going-concern point of view. In the end, besides some small examples, the insurer tends to take the risk on its balance sheet until it is settled.
24

AON BENFIELD
Impact of non-proportional reinsurance on Solvency II capital Summary When CEIOPS published its methodology for applying non-proportional reinsurance in the Standard Formula in early April 2010, it raised quite a number of eyebrows since it was not discussed in any Consultation Paper (CP). Even greater was the surprise when a week later, the EC published the draft QIS5 rules containing a different methodology developed in conjunction with AMICE – the Association of Mutual Insurers and Insurance Cooperatives in Europe.
On 30 April, Aon Benfield presented its view on both approaches to CEIOPS and the industry; unfortunately, our conclusion was (and still is) not very encouraging. Based on a real example, we can only deduce that both approaches are completely missing their purpose. Neither approach provides adequate capital benefit for non-proportional reinsurance. Perhaps it is time to return to the approach that Aon Benfield suggested in February 2008 to the EC, which suggested granting capital benefit for non-proportional reinsurance in function of the retentions, limits and reinstatement in relation to the company’s overall risk exposure.
Introduction Whether it is regulatory (required) capital, economic or rating agency capital, all begin with a certain definition. A certain risk transfer mechanism can therefore (once quantification is required) have different results when expressed as a change in capital position. What might be considered an important risk transfer for one definition (since it reduces capital on a material basis), is not always true when using a different definition. The introduction of the one-year concept in the Solvency II required capital calculation does have its impact on the quantifiable effect of risk-mitigation i.e. non-proportional reinsurance. This was also recognised by CEIOPS in its recent ‘Calibration of Non-life Underwriting risk’ paper, where a reference was made to the potential mismatch between the benefits of reinsurance that are (certainly for long-tail business) realised during the run-off of the claim (and are not always fully considered in the first year) and the related costs (that are charged up-front).
The question can therefore be asked whether from a Solvency II perspective, non-proportional reinsurance has an (adequate) impact on the SCR and related to this, how should it be accounted for in the Standard Formula? Both CEIOPS (in the Consultation Paper) and the European Commission (in the QIS5 technical specifications) have provided an approach to introduce the effect of reinsurance in the Standard Formulae premium risk module by means of:
• A reduction in the volume measure (based on net premium). • A reduction/increase in the gross standard deviation for premium risk by means of a net-to-gross ratio.
The first would be applicable to both proportional and non-proportional reinsurance; the second only to non-proportional reinsurance. According to CEIOPS, the net-to-gross ratio would be calculated based on the relation net combined ratio / gross combined ratio, whereas according to the QIS5 proposal, the net-to-gross ratio would be calculated using the AMICE proposal.
In order to gain some clarity in this discussion, a real-world example has been constructed, which highlights the pros and cons of both methodologies for non-proportional reinsurance. We will show the effect that an excess of loss treaty might have on the Solvency II required capital for a Motor Third Party Liability (MTPL) portfolio of a large European insurance company.
Model set up The goal of the exercise is to analyse the impact of non-proportional reinsurance on the Solvency II capital requirement for premium risk. This would provide information about the real value of the net-to-gross ratio (in this individual case). We constructed a model starting from an empty balance sheet and premiums received during the 12-month period. From this exposure, acquisition and administration costs were paid, claims and
25

SOLVENCY II FOR REINSURANCE MANAGERS
possible reinsurance recoverables were generated, investment income (using a fixed risk-free investment income) was introduced, and an end of year valuation was performed using the Solvency II valuation principles (best estimate, discounted and including MVM). All this resulted in a stochastic profit and loss account and an end-of-year balance sheet position from which the required capital could be calculated. Since only premium-related risks were introduced in this approach, the resulting standalone (silo) capital can be compared with its equivalent in the Solvency II Standard Formula.
The loss model was constructed as:
• Attritional losses were modelled from historical observed loss-ratios that were made as-if to reflect the current portfolio characteristics (deductibles, rating…) and were filtered from large losses. Attritional losses were assumed to be lognormal. The mean value was derived from the budget and historical as-if losses. The CoV was derived from the as-if loss-ratios using Method 1 from the USP proposals, and was equal to 9.79% (CoV = StDev/Mean).
• Large losses were generated by means of three frequency/severity models: – Poisson / Empirical distribution [€1.5m; €2.3m] – Poisson / Pareto [€2.3m; unlimited] – Poisson / Pareto [€10m; unlimited]
The first two models were calibrated on historical company data. The last one was added to include the effect of a catastrophe-related loss (material Mont-Blanc or Selby type accidents) and was calibrated on market data.
All losses were modelled from an ultimate perspective since this approach provides the best information about the total risk the company is exposed to. Due to the emergence of reserve risk over the development path of a claim, each ultimate exposure was brought back to various end-of-year valuations using a reserve risk emergence path.
The model was constructed using S2Metrica – Aon Benfield’s proprietary Solvency II modelling tool – and the calibration of parameters was done using Microsoft Excel.
26

AON BENFIELD
Impact of Reserve Risk emergence on the balance sheet When dealing with large losses it is important to highlight the emergence of information over time. The following graph details 185 large individual losses that were reported to the insurer over a timeframe of 10 years. All historical claims were recalculated (as-if process) to a reference year and were projected to ultimate in case the claim was not closed. Each claim could therefore be compared to its ultimate value and compared across the different development years (X).
3.99%
65.91%
74.80%
86.12%90.53% 92.20%
96.92%100.00% 100.00% 100.00%
0.00%
20.00%
40.00%
60.00%
80.00%
100.00%
120.00%
140.00%
1 2 3 4 5 6 7 8 9 10 11 12
Based on the graph, one can read that large claims at the end of their first development year had only 3.99% (median, or 25% average) of their ultimate value recognised. The graph details the min, max, 25th and 75th percentile and the median (curve). The large loss threshold value was set at €1.5m. At the end of the first development year, only 25% of the claims had an incurred value of at least 60% of their ultimate.
Within a one-year timeframe the emergence of reserve risk is an important factor which has to be included in the modelling approach since it shows the amount of information that is available to the insurance company to value the size of the loss at the end of each balance sheet. It is worthwhile mentioning that the only information available in this analysis were historic payments and outstanding case provisions for which we assume that all the information available to the insurer was used to calculate the resulting incurred value.
Also, the attritional loss model (that was calibrated to ultimate) was given a reserve risk emergence pattern (derived from applying a bootstrapping approach).
40,0%
60,0%
80,0%
100,0%
120,0%
140,0%
160,0%
0 1 2 3 4 5 6 7 8 9 10
99,7%
99,5%
99,0%
90,0%
50,0%
10,0%
1,0%
0,5%
0,3%
Reserve risk emergence fanEvolution of ultimate loss through development
27

SOLVENCY II FOR REINSURANCE MANAGERS
In the above graph, one can observe how the expected attritional loss emerges over time to its stochastically drawn ultimate. At t=0, there is no information available and the loss is set equal with the budget. As from t=4, all information is available (although the run-off is not complete) and the loss is set equal to its ultimate value. In between t=0 and t=4, new information becomes available and the attritional loss gradually moves towards its ultimate value. Since the payment pattern for this particular real world example is extremely long, not all information is available at the closing of the first balance sheet, hence leading to only a partly recognition of the ultimate loss. The CoV calculated at ultimate (9.79%) is therefore reduced to 5.57% at the end of the first year. This is in line with the results calculated by CEIOPS for the premium risk of the MTPL Line of Business (LOB) for larger companies. [CEIOPS-DOC-67-10_L2_Advice_Non_Life_Underwriting_Risk]
Model results We now assume that the LOB was protected by an excess of loss reinsurance cover of unlimited XS €2.5m.
The table below details the profit and loss account (and related impact on the Net Asset Value) in four scenarios (ignoring corporate tax and dividends).
In the first scenario, no reinsurance was assumed and the assumption was made that all large losses were recognised immediately to ultimate value. The company would have generated a Fair Value profit at year end of 7% (mean). In a 1/200 year scenario, the profit would have dropped to -3.8%.
In the second column, the same scenarios were generated and the reinsurance programme was applied, hence leading to a reduction of insurance profit in the mean scenario (due to the reinsurance premium which was higher than the expected recoverable) but on the other hand reducing the 1/200 loss as we would expect. Here we can clearly see that under the 1/200 scenario, the excess of loss (XL) reinsurance programme is reducing risk and earnings volatility. These effects will be even bigger in the more remote scenarios (> 1/200).
28

AON BENFIELD
In the third and the fourth columns the same calculations were performed but the emergence of reserve risk for the large losses was introduced (based on the historical observations from the 185 claims). The insurance profit (at the end of the first year) is increased since not all large losses have been recognised to their full ultimate value at the end of the first year (and the downside effect is not symmetrical with the upside effect). Nevertheless, the results after reinsurance show a less negative result in the 1/200 scenario which proves that – for this particular example – even in a one-year timeframe, reinsurance has a risk reducing effect.
Comparing internal model results with the Standard Formula In order to make the internal model and its results (gross and net of reinsurance) for this real world example comparable with the Solvency II Standard Formula, the following two adjustments have to be made:
• The Solvency II Standard Formula covers the premium (and reserve) and catastrophe risk in separate modules. In the above described internal model, the reserve risk from prior years was not included but it did reflect catastrophe risks (possible extremely severe MTPL losses like Selby, Mont Blanc etc.). Therefore the internal model was adjusted by removing the Poisson/Pareto model that was included to cover mega-catastrophe losses (Selby, Mont-Blanc…).
• Excluding any upfront profit so that in a mean scenario, neither profit nor loss was made. This was done by reducing the premium rates with the profit margin: In the Solvency II Standard Formula, the capital is calculated through the cycle which is why no implicit assumption of profit is allowed.
In the next table, the first two columns (‘Unchanged risk profile’) detail the results of the internal model after applying the modifications described above. On a net basis, the expected profit is therefore changed to zero. The ratio of net-to-gross risk equals 0.9391, which indicates that any adjustment factor applied on the gross capital should be greater than this amount since otherwise the capital reduction is not in line with the real risk that reinsurance is transferring. If we assume that the internal model produces a realistic and fair view of the effect of reinsurance under a one-year concept, any simplification (e.g. Standard Formula) that provides a capital reduction lower than this ratio implies an incorrect result.
Applying the Standard Formula’s conceptual logic to the obtained results, one can produce the following equations:
Net Premium x 3 x x ratio net-to-gross = Net Capital for Premium Risk σ grossIM
Gross Premium x 3 x x 1 = Gross Capital for Premium Risk.σ grossIM
2
Using the obtained gross and net capital results from the internal model, one can calculate in the above equations the implicitly applied net-to-gross ratio (=0.951) and the underlying implied (=3.35%) for attritional and large losses combined. The risk profile of the company was not changed and clearly the risk profile is less skewed than the risk profile of an average insurance portfolio used for the Standard Formula calculations (where = 10% according the European Commissions’ proposal for QIS5).
σ GrossIM
σ GrossIM
The example shows that even under the Standard Formula (assuming an unchanged risk profile) the non-proportional reinsurance has a capital reducing effect.
2 3 = Rule of thumb factor to apply to the StDev in a LogNl distribution to derive the 1/200 required capital. Eg. for 100 of premiums, a 10% StDev would require 30 of capital once in 200 years.
29

SOLVENCY II FOR REINSURANCE MANAGERS
So what would happen with the results of the internal model if we would force a companiy’s’ risk profile to equal the average standard deviations provided by QIS5? Where the risk profile of the example portfolio follows the risk profile of the average MTPL LOB, the gross capital requirement would be equal to 3 x
(=10%) x Gross Premium. From this equation we can calculate the gross capital requirement. We can subsequently calculate the internal model assumptions (attritional, large loss etc.) that would lead to a similar capital requirement. Since the large loss models were market consistent calibrated (in line with reinsurance quotes), only the attritional loss model was changed. The CoV of the lognormal distribution (originally set at 5.57%) had to be increased to 17% in the internal model to result in a gross capital requirement in line with Standard Formula approach using a 10% standard deviation assumption. With this new risk profile (shown in the last two columns of the above table), the impact of reinsurance could be calculated. The obtained ratio net-to-gross, using the formulas above, was 1.047, suggesting that due to the introduction of reinsurance, the risk increased. This might seem strange but it is actually a good example of what CEIOPS is referring to in its calibration document about the potential mismatch between the benefits of reinsurance that are realised during the run-off of the claim and the related costs (that are charged up-front) (CEIOPS-DOC-67-10_L2_Advice_Non_Life_ Underwriting_Risk, page 53). Using this approach also demonstrates the sensitivity to the overweight of attritional losses generated in the tail of the distribution which are not impacted by reinsurance.
σ 5GrossQIS
This real case example demonstrates that non-proportional reinsurance has an economic effect (internal model) on the capital required for premium risk, both under an ultimate as well as under a one-year approach. Even if we would force the internal model to follow the Standard Formula concept (keeping the correct CoV, but changing the formula), it would still have a likewise effect. Only if one magnifies the risk profile beyond reality (using the QIS5 figures in our example) does non-proportional reinsurance have a negative impact on the capital requirement, because the downside effect (reinsurance premium) is recognised immediately and the upside effect (recoverable) are immaterial compared to the company’s other risks.
30

AON BENFIELD
The example also demonstrates how companies with lower volatility (due to the size of the portfolio, or underwriting excellence) can be penalised under the Standard Formula concept.
Net-to-gross ratio proposal by CEIOPS From the above example we can learn that, for particular cases, simplification can lead to a net-to- gross capital reduction below the 0.9391 ratio (the higher figure confers less benefit), and thus to incorrect results.
According to the CEIOPS proposal, the net-to-gross ratio has to be calculated based on the three most recent financial years using one-year Fair Value data as a basis, and filtered from historical catastrophe events (and related costs and premiums). In the real case example used in the above internal model result, the net-to-gross ratio would result in 1.03 using the CEIOPS proposal (based on the companies’ previous three years of IFRS reporting). The reinsurance programme that was bought only had non-working layers protecting the capital position of the company. Therefore, over the past three years the accidents that breached the reinsurance attachment point were limited.
This would mean that under the CEIOPS proposal, the company would be penalised for the risk mitigating effect of the reinsurance programme.
Various other scenarios can be provided whereas this ratio is not reflecting the true risk reduction of a non-proportional reinsurance.
• An extreme large historic loss could have a potential impact on the ratio that creates a capital benefit which is not in line with the true risk mitigating effect of the programme.
• Reinsurance programmes that caused the historical recoveries might have changed. • The ratio will change from year to year, possibly causing an SCR breach for reasons that
are not related with the true risk transfer (e.g. different reinsurance programmes covering different LOBs).
• Finally, rating agencies provide adequate credit for efficient non-proportional reinsurance.
AMICE – QIS5 proposal Within the QIS5 proposal, the European Commission suggested the AMICE approach as the methodology to calculate the net-to-gross ratio. This approach assumes that all individual losses are of lognormal distribution and that the frequency follows a Poisson process. Based on these assumptions, the claim costs before and after reinsurance are calculated and the net-to-gross ratio is derived. The main advantage is that the methodology is easy to implement and requires only a limited amount of additional data: besides the details of the reinsurance programme, only the average loss and its standard deviation/CoV are required.
If we take the same real world example for the MTPL LOB detailed above, we observe an internal model net-to-gross ratio of 0.93911. What would be the net-to-gross ratio calculated under the AMICE proposal?
In order to calculate this, we had to rely on market statistics since the necessary company data was not available. The average claim loss for MTPL, according to an official published report (market report), was €3,445. The CoV is unknown but based on the formulae proposed in QIS5 we can reengineer to see what the CoV should be to obtain a net-to-gross ratio of 0.9391 for the specified reinsurance cover (unlimited excess of €2.5m).
31

SOLVENCY II FOR REINSURANCE MANAGERS
The data table above details the modelled individual losses given different VaRs (at the top) and different CoVs (to the left) that are obtained for the company’s MTPL portfolio using the AMICE proposal. The second column shows the corresponding net-to-gross ratio. . All CoV assumptions below or equal to 500% (coloured in green) will result in net-to-gross ratio that will produce a conservative risk transfer metric (below the modelled benchmark of 0.9391). The CoV already needs to be above a ridiculous 500% to produce a modelled risk transfer beyond the real observed one. So it is very unlikely that for this particular example, the AMICE approach would result in a net-to-gross-ratio that is too optimistic. More specifically, we expect to see no effect at all for this particular case.
It is worthwhile taking a deeper look at the underlying assumptions of the proposed model, which is based on a Poisson/lognormal approach. If all claims were assumed to be lognormal, which is a core principle of the AMICE model, it would be very difficult to allow for extreme losses. The second part of the table details the individual VaRs for a single loss in the various CoV assumptions. Under the CoV assumption of 500%, it would require a 1/100,000 event to generate a loss of €1.5m. This is clearly not in line with the company’s historical events. One can argue whether it is suitable to build a metric from a model that only allows one distribution function to cover the severity of all claims losses. Note that in the internal model, the severity function was a mixture of various models in order to capture the real tail of the losses. A second shortcut in the model is the Poisson assumption for frequencies. It is true that this is a common methodology used in reinsurance studies, but here it is applied to analyse the impact of a limited number of large losses that would cause a loss to the reinsurer. In this case, the Poisson assumption covers all losses. For the real-world example used in this study, the average annual number of claims is around 30,000 per year. In a Poisson assumption, that would mean that the variance of the frequency would also be 30,000, which is clearly not the case. If the statistical standards, as required for internal model approval, would also be required for Standard Formula, then this approach would clearly fail the test.
Conclusions The example clearly shows how, for well diversified portfolios in a stable market, the capital requirement from an internal model perspective is very different and much lower than from the current Standard Formula’s proposal. This due to (i) allowing for the actual profitability, (ii) taking into account the diversification resulting from the size of the portfolio and (iii) by applying the reinsurance programme.
The numerical example shows that even in a one-year timeframe, a non-proportional reinsurance programme reduces significantly the Solvency II capital. Finding a proper methodology to introduce the benefit of non-proportional reinsurance in the Standard Formula, which would be practical and theoretically sound at the same time, will be a challenging exercise.
CEIOPS has been requesting to the industry that it comes up with an alternative proposal. This represented a good opportunity to hand over a paper that Aon Benfield wrote in January 2008 on how the effect of non-proportional reinsurance could potentially be taken into account in the Standard Formula by granting capital credit based on retentions, limits and reinstatements in proportion to the overall exposure.
32

AON BENFIELD
The proposed approach defines the capital benefit of excess of loss by using a proportionate exposure curve. Such a curve could relate the retention of an excess of loss programme as a proportion of total exposure to the amount of capital credit that an insurer should receive based on a probabilistic model using 0.5% probability of insolvency. It seems logical that companies with low retentions have a lower probability of insolvency than companies with higher retentions. This is shown in the exhibit below as a graph, where we have used Total Premium Income as the measure of exposure.
Such a model could be calibrated using actual insurance and reinsurance data in a number of countries. Depending on the required resolution of calibration, this exercise could be carried out by line of business and by country, or in aggregate.
The results could be simplified to bands of credit based on bands of retention.
More information on the proposal is available at request.
% Capital Credit
Ret
entio
n as
% o
f Exp
osur
e
Low Retention = High Capital benefit
Med Retention = Med Capital benefit
High Retention = Low Capital benefit
33

SOLVENCY II FOR REINSURANCE MANAGERS
S2Metrica – a new tool for a new world of regulation Internal Capital Model challenges Companies that want to start with an internal model will face various questions when developing the scope and magnitude of the model:
• Which risks do we focus on: Asset related risks vs. liability related risks, reserve risk, operational risk…?
• How should we define ‘required’ capital and how do we model it in order to ensure that it will be Solvency II compliant?
• Which output formats do we need to produce in order to facilitate the use test requirement of P&L attribution? How can we retrieve information for asset liability management (ALM) analysis, defining risk limits, analysing our reinsurance book…?
• Should we start from scratch and build it internally or do we seek external assistance? • If we developed an internal model what would be the impact on our internal process in order to make
it Solvency II compliant: What raw data is required, how does the calibration of risk parameters work and what input data are required?
What is S2Metrica? • S2Metrica is a software tool that uses the QIS4 spreadsheet to replicate the business line structure
of a company and retrieve specific Fair Value balance sheet information. It uses this information to generate a simplified Solvency II-type internal capital model.
• The tool allows you to introduce the company’s reinsurance structure and asset portfolio and uses this information to provide you the SCR, MVM and stochastic end-of-year balance sheets and P&Ls.
• S2Metrica is built on the award-winning ReMetrica platform and is completely transparent.
What do you get? • A simplified Solvency II-type internal capital model that reflects the structure of your business. The
software is tested already and significantly shortens the time for constructing a tailored internal model. • Clear and coherent input workbooks that are tailored to your business. These input workbooks will
detail all the inputs required to run the simplified internal model. • Easy to understand output templates including:
– Required capital derived from the internal model, both on a balance sheet level and per risk type.
– Stochastic income statements and balance sheets. – Calculations of risk margins using the internal capital model.
• An in-built Economic Scenario Generator. • A look-through into the underlying ReMetrica components and the build of the model.
Transparency is key. • Documentation describing the software and the underlying assumptions. • Simple processors that capture market and default risk as well as the more familiar premium,
reserve and catastrophe risks.
34

AON BENFIELD
Where is the added value? • The software is intended as a ‘Solvency II starter kit’ for companies that are struggling with
all the new concepts introduced by Solvency II. The tool is build around the award-winning ReMetrica platform and users have the ability to further develop the model generated by S2Metrica using the ReMetrica platform. By providing a solid and sound basis we hope to simplify Solvency II technical difficulties and make it more accessible to the broader public.
• As long as not all the Level 2 implementation measures are known, each existing model might require adjustments that cost money and occupy internal or external resources for those companies that have already build an internal model. The model generated by S2Metrica is not intended to be a fully compatible Solvency II model (yet). Each release, however, will provide updates that bring the model more in line with the Solvency II standards.
• In many cases the development of an internal model requires a significant amount of internal and/or external resources. By providing this intermediate step we allow companies to spend their valuable time on the calibration process and on fulfilling the use test requirements rather than developing a software tool. The model can then automatically grow in scope and technicality through continued use. Each new version will bring the client closer towards a full or partial internal model.
Who are the target clients? • Companies that want to develop their internal model within the ReMetrica environment (by using
a consultant or via their own efforts) and need a proper start that accelerates the learning curve. • Companies thinking of moving towards internal modelling but for whom the Solvency II priority
is rather in producing the Standard Formula and delivering adequate and timely Fair Value balance sheets. These companies can use the updates of S2Metrica to build knowledge on the internal model data requirements and concepts, and can use the results to generate an initial idea of what the impact of an internal model might have on the required capital.
• Companies who would not move towards an internal model for calculating their capital requirement under Solvency II, but are keen to have an internal model for a risk and solvency analysis of their balance sheet positions.
• Companies that want to use the model to produce an MVM from an internal model perspective and hence try to optimise their available capital position.
35

SOLVENCY II FOR REINSURANCE MANAGERS
The rating agency perspective Rating agency capital will likely remain the capital constraint The rating agencies are increasingly interested in companies’ preparations for Solvency II, including the various quantitative impact studies, although the depth of discussions with rated companies and the amount of detail required differs between the rating agencies. Although the rating agencies will continue to use the various capital tools currently employed in their analysis of capital, including their proprietary capital models, increasing consideration will be given to Solvency II required capital.
While the rating agencies will want to understand meaningful differences between Solvency II capital measures and the rating agencies’ own capital models, companies’ strategies to address the possibility of significant capital shortfalls under QIS5 will come under greater scrutiny. Aon Benfield does not expect the rating agencies’ capital models to be recalibrated as a direct reaction to Solvency II capital requirements and also expects that, assuming Solvency II capital requirements are between QIS4 and what was recently proposed by CEIOPS, rating agency capital requirements will remain the constraint for the foreseeable future, in particular for investment grade companies with a typical risk profile.
Solvency vs. rating agency capital – illustrative example Aon Benfield has analysed the drivers of available and required capital of various regulatory and rating agency models. The analysis used the same dataset for all models for a hypothetical European Non-Life company writing motor, accident, marine, aviation, property and liability business. The company has a conservative investment portfolio, with a small proportion of equities, and well-managed catastrophe exposure. We used the Standard Formula to calculate the capital requirements, but we realise that using the company’s own data has considerable scope to decrease Solvency II capital requirements.
The results of the analysis are extremely sensitive to the lines of business being written. Companies writing certain lines of business, such as marine, aviation, credit and non-proportional reinsurance, require significantly more capital under the proposed QIS5 factors than, say, personal lines insurers.
Exhibit 1: Available and required capital
Available Capital Required Capital
S&PBBB
S&P ABCAR QIS 5 2009 CPs
QIS 4 SI
500
400
300
200
100
0
Exhibit 1 compares the available and required capital for our hypothetical company under various capital regimes. As expected, the level of required capital under QIS4 is broadly consistent with the capital models of A.M. Best (BCAR) and S&P. On the other hand, required capital under the recently proposed QIS5 increases by approximately 29% compared with QIS4. The increased capital requirements are
36

AON BENFIELD
largely driven by (i) an increase in the premium and reserve factors for the marine and aviation lines of business, (ii) an increase in the corporate bond spreads and (iii) an increase in the equity shock scenario. The increase under the proposed QIS5 is not as pronounced as that of CEIOPS’ 2009 Consultation Papers (CP) and, for our hypothetical company, it represents a 16% reduction in the overall capital requirement compared with the 2009 CPs. The percentage contribution of each risk component and the composition of available capital are displayed in Exhibit 2 below.
Exhibit 2: Composition of available and required capital
Components of required capital
0% 20% 40% 60% 80% 100%
SI
QIS4
QIS5
BCAR
S&P BBB
Premium ReserveNet Catastrophe Investment/MarketDefault/Credit Operational
Components of available capital
0% 20% 40% 60% 80% 100%
SI
QIS4
QIS5
BCAR
S&P
Shareholders' fundsHybrid equityMarket value and other adjustments*
*Includes the net of market and other valuation adjustments (e.g. unrealised capital gains/losses on investments, intangible reserves and discounting of loss reserves. These adjustments largely offset each other in the S&P capital model. Under Solvency II, those adjustments would also be considered Tier 1 capital.
Capital solutions Numerous capital sources are available to companies to enhance their Solvency II ratio by either increasing available capital (for example traditional equity or qualifying hybrid equity) and/or decreasing required capital (for example reinsurance or exiting riskier lines of business that require greater amounts of capital). The profile of some companies will restrict the use and availability of some of these capital sources, in particular smaller, less-well diversified companies and those focusing on capital intensive lines of business. These companies will find themselves vulnerable if they cannot meet the onerous Solvency II capital requirements.
The European Commission (EC) has proposed a relaxation in hybrid equity admissibility, including the transitional grandfathering arrangements for hybrids issued before the Solvency II implementation date. At the current time the rating agencies have not reached conclusions on hybrid equity classification where the grandfathering arrangements may reduce the permanency of the hybrid instruments. As is currently the case, however, Aon Benfield expects that the rating agencies will not give hybrid equity credit to individual hybrids that the supervisor excludes from supervisory capital.
What will happen to ratings? The rating agencies view Solvency II as a positive for insurance industry stakeholders as Pillars 2 and 3 will result in an increased focus on risk management and capital management, with greater transparency resulting from improved disclosures. These additional requirements of Solvency II will, to some extent, parallel rating agencies’ existing analysis. While the rating agencies do not intend to make any explicit changes to their analysis in response to Solvency II, companies’ capital requirements and reporting disclosures under Solvency II will not be ignored.
There has been an intense amount of industry attention given to Solvency II capital but this is only one of the areas of analytical focus in the rating process. For those companies facing a Solvency II capital shortfall, whatever approach is taken to improve solvency, it is likely that for many companies
37

SOLVENCY II FOR REINSURANCE MANAGERS
this will require a fundamental change in strategy including a material shift in business profile. As a consequence, the rating agencies will reanalyse companies factoring changes to competitive position, financial flexibility, operating performance etc.. The expectation for smaller and also niche companies, which tend to be more thinly capitalised and have less strong ratings relative to the larger European groups, is a deterioration in overall financial strength which may lead to downgrades.
Conversely, the larger and better capitalised companies, which are generally those with higher ratings, will likely have a competitive advantage and are expected to be able to capitalise on smaller companies exiting certain lines of business. There may also be opportunities to acquire smaller capital-constrained companies at attractive terms. In view of the uncertainty about the policyholder benefits that ultimately materialise and the execution risk of such acquisitions, whether or not these opportunities will result in improved ratings is unclear as each transaction would be analysed on individual merit.
Countdown to Solvency II A number of the rating agencies shortly intend to publish Solvency II questionnaires for discussion with companies in their management meetings about preparations and readiness for Solvency II. The rating agencies expect to publish papers on specific Solvency II matters over the coming months including reaction to the technical parameters for QIS5. In due course, as uncertainty recedes on other issues such as hybrid treatment under Solvency II, Aon Benfield expects that the rating agencies will publish further information detailing their views on specific Solvency II issues.
The future of ratings in Europe Regulatory compliance is the official seal of approval that allows companies to write business, although there are considerable differences in requirements globally. Solvency II approval will require companies to meet quantitative requirements as well as follow governance, market discipline and disclosure principles. Conversely, a rating is an opinion of a company’s relative financial strength and ability to meet ongoing obligations to policyholders. While Solvency II considers a one year time horizon, ratings represent a longer-term view and are also predominantly forward-looking in nature.
Ratings are therefore a global relative which allow users to compare one re/insurance company to another the world over. Furthermore, the qualitative and quantitative analytical focus of the rating agencies differs to that of Solvency II. Disclosure around Solvency II compliance will not provide the insurance industry and capital markets with the same type of information that is provided in the detailed credit reports published by the rating agencies for assigned ratings.
Aon Benfield therefore believes that the rating agencies will continue to play a major role in assessing the capital adequacy of re/insurers, regardless of whether or not Solvency II capital ultimately exceeds rating agency capital, since the aims and objectives of Solvency II and the rating agencies are very different. Ultimately, Solvency II is a European pass/fail test whereas financial strength ratings are a global comparison of relative creditworthiness.
38

AON BENFIELD
Challenges for a captive audience One of the key issues that needs to be debated with regard to Solvency II, is how captives are treated within the new framework. At the time of writing, captive structures have not been sufficiently recognised as separate entities and will be subject to the same capital and governance requirements as traditional insurers. Captives differ from commercial re/insurers in several ways:
1. They are involved in business-to-business relationships and not with end consumers.
2. They write a restricted number of lines of insurance business and generally issue a small number of policies.
3. They re/insure a restricted number of risk units.
4. Captives are designed to add flexibility to the group risk manager in dealing with risk.
5. Captives are easy to control and are subject to simple systems of compliance.
6. Captives often write business in regions outside their domicile.
The captive business model tends to be simple, which means that regulators can quickly access the information they require about the captive in contrast to most other re/insurance entities. Given this, it would make sense that the principle-based approach of the Solvency II Framework Directive should not be applied to insurance entities in an inflexible manner; rather, due to the huge diversity of insurance undertakings, each and every company should be assessed in light of its individual scale, nature and complexity.
The Luxembourg insurance market is driven by re/insurance captives, with more than 250 captives currently licensed to underwrite both Life and Non-Life reinsurance. We also note a current trend of established non-EU reinsurers transferring their operations to Luxemburg to gain direct access to the EU market.
Participation in the QIS4 exercise was very large, with 65 companies responding to QIS4 (compared to a total of 99 in Europe). The recent changes presented in the Consultation Paper (CP) and Level 2 implementing measures, published end of January 2010, and the QIS5 technical specifications published on April 15, have had no negative impact on the positive results from the QIS4 exercise.
• Issues highlighted in QIS4 The Standard Formula is calibrated to the overall insurance industry across Europe and, unsurprisingly, it does not match the specificities of captives. Below are the main issues for the captive industry:
– The Non-Life Premium and Reserve Risk is calibrated on an expected combined loss ratio of 100%, which definitively does not suit the captive business model.
– The Non-Life Cat Risk charge refers to local catastrophe risks, which is not appropriate for captives given their international exposure. The difference between the factor method in the Standard Formula (method 1) and the scenario approach (method 3) was 15:1 on average, leading to possible cherry picking.
– The concentration risk in the Standard Formula is also rather inappropriate as most companies have a privileged exchange of assets with intra-group companies e.g. intercompany loans, or cash pooling, can have an important impact on the Solvency Capital Requirement, in particular when the parent company is not rated.
39

SOLVENCY II FOR REINSURANCE MANAGERS
Despite all these issues, most Luxembourg captive reinsurers had a sufficient level of equalisation reserve, considered as Tier 1 available capital, to match the required capital calculated in 2008 under the QIS4 exercise, based on the 2007 financial accounts.
• Proposed national guidance and future developments With a view to simplifying the approach, propositions have been made in 2008 through the National Guidance in Luxembourg, together with Ireland and Malta, and further developed with propositions for all captives within the publication in January 2010 of the Article 111j as part of the latest Level 2 implementing measures, which is now part of the Technical Specifications of QIS5.
The article defines the simplifications and specifications applicable to captives under Pillar I, and includes a definition of the scope of application, which appears to be very narrow. The proposed simplification entails an alternative calculation, which is more straightforward and includes the Non-Life premium risk, interest rate risk, concentration risk and default risk for a fronting re/insurer.
During QIS4, the industry demonstrated that this alternative simplified approach to the Standard Formula was providing results that corresponded well with the economic results of the QIS4, but following the increase of factors under the Standard Formula for QIS5, the factors have also substantially increased. However, we note that the initially unrealistic factors proposed for captives have finally been excluded from the final proposition.
(see table).
Amount of Cat factors
(1) Amount for proportional reinsuranve cat method. (2) As propose on April 15th
• Pillar II At the end of 2009, the Luxembourg regulator asked the industry to respond to a short questionnaire on the expected intention to apply either the Standard Formula or to develop an internal model, detailing whether it would be a partial or full model, and the timeline for implementation. In early 2010, the questionnaire was followed with a letter requesting that a number of companies decide on an implementation plan, covering both Pillar I and Pillar II.
In line with this requirement, companies have been volunteering to perform a gap analysis for Pillar I, article by article, to demonstrate their degree of preparedness.
40

AON BENFIELD
Table 2: Example of Pillar 1 gap analysis for captives
• Next steps The Luxembourg industry has been very active in Solvency II initiatives across Europe, through participation in the QIS exercises, and also through proposals made to CEIOPS via the local regulator since 2008.
It is worth noting that the average Solvency II ratio decreased to 167% under QIS4, compared to a ratio of 331% under Solvency I. This implies a significant challenge for the Luxembourg re/insurance captives, and we expect that QIS5 will reveal a completely different picture of the financial strength of the industry. It will most likely lead a lot more companies to consider the use of a (partial) internal model.
Such an internal model would address the issues highlighted above and would create an alignment of objectives between the captive re/insurance industry and the Solvency II Directive.
41

SOLVENCY II FOR REINSURANCE MANAGERS
IFRS and Solvency II – the wobbling road to divergence? A common ground between regulatory and accountings’ view of the balance sheet? Although IFRS4 for Insurance Contracts Phase II is not as prominent in the press as Solvency II, both start from an economic view on liabilities and have a more or less similar timetable. Both will have a significant impact on the financial landscape and are driven by a large consultation process within the industry. From the very beginning of IFRS 4 Phase II, it was clear that differences between the projects would exist and that the devil would be in the detail. The project has now become a joint effort between the FASB (US driven) and the IASB (European driven) and both boards have reached different conclusions on important issues such as acquisition costs and margins.
Fair Value in a Solvency II context In the recent Solvency II QIS5 proposal by the European Commission, the balance sheet of an insurer is valued from a Fair Value perspective. Without going into the full details we can highlight a few aspects and implications this will have on the balance sheet:
• All liabilities, Life and Non-Life, will be valued on a pure prospective basis i.e. present value of future cash-flows relating to the existing contracts and a risk margin.
• The discount rate is based upon the swap rate plus a liquidity premium, depending on the nature of the liabilities.
• Non-Life pre-claims liabilities (‘premium liabilities’) will be valued based upon the expected cash flows (premiums, claims and expenses) for the contracts that have already been written or for which there is a contractual obligation.
• The definition of existing contracts or the boundary of an existing insurance contract will therefore become very important in order to decide whether or not the future cash-flows can be considered in the valuation process. For Non-Life this would for instance imply that tacit renewals which have already taken place have to be included in the valuation process.
• The treatment on future premiums is even more important in Life insurance. The possibility of the insurer to amend the premium or benefits will determine the boundary of the existing contracts, which is the criterion for including or excluding future premiums and future value in the solvency calculation.
• The risk margin is added to the best estimate basis to make the liabilities transferable. A (Solvency II regulated) insurer will only agree on a transfer of liabilities if he receives an amount equal to the best estimate of the liabilities plus an additional amount (the risk margin) that will allow him to remunerate his shareholder for the capital that the settlement of the transferred obligations would require.
A Fair Value approach has consequences on the recognition of profits (the difference between the Fair Value of the assets and the liabilities):
• As the liabilities are not subject to minima, any positive difference at inception between the present value of future premiums, future cash-outgo and risk margin will be recognised as profit.
• This is also applicable to Non-Life insurance and the valuation of the pre-claims liabilities results in a profit recognition at the time of writing the contract (disregarding the start of the exposure period of the contract).
Fair Value in an accounting world Although both accounting and regulators are in favour of an economic value approach, each has a different point of view with respect to profit recognition.
The IASB continued to work on the Phase II standard after the publication of the current IFRS4 standard and in May 2007 published the discussion paper ‘Preliminary Views on Insurance Contracts’.
42

AON BENFIELD
In October 2008, FASB decided to participate in the IASB insurance project. The objective of this joint IASB/FASB insurance contracts project is to develop a common high-quality standard that will address recognition, measurement, presentation, and disclosure requirements for insurance contracts. From the start it was clear that it would become challenging to find a common ground, but the goal to aim for common Insurance Accounting Standards between these two players was just too valuable not to give it a try.
Both boards had several meetings during March 2010 and although the target date for publishing an exposure draft is 2Q10, the point of view between IASB and FASB is diverging instead of converging even on points they previously agreed on.
In this article we will highlight the conceptual differences between IASB and FASB and the position Solvency II occupies, based on the latest QIS5 technical specifications.
Scope While Solvency II is applicable for all contracts written by an insurer, IFRS4 Phase II will only apply to insurance contracts as currently defined under IFRS4. Investment contracts (i.e. saving products and also certain reinsurance treaties) with insignificant insurance risk follow the accounting rules for financial instruments.
Decomposition of insurance liabilities In a Solvency II Fair Value balance sheet, the liabilities can be detailed in:
1. The unbiased, probability-weighted average of future cash-flows (‘best estimate’).
2. An incorporation of the time value of money (‘discounting’).
3. A risk margin.
Since this leads to immediate profit recognition, the IASB and FASB have introduced a 4th building block which avoids any profit being recognised up-front: The so-called ‘residual’ margin.
Certainly with respect to the acquisition cost, the exact definition of this residual margin causes different points of view between the IASB and FASB. The easiest approach to detail the differences is to work with an example. Assume the insurer has priced at inception a single premium at 100: 65 to cover expected claims, 15 to cover the risk margin and 20 to cover acquisition costs, leaving no profit. At inception the insurer pays acquisition costs of 20, equal to the part of the premium to cover the acquisition cost.
Case A: The residual margin is defined before taking into account the acquisition costs and amounts to 100-65-15=20. The total liability is 100 equal to a best estimate liability of 65, a risk margin of 15 and a residual margin of 20. After taking into account the paid acquisition costs of 20, the insurer will account at inception a loss of 20.
Case B: The residual margin is defined by taking into account also the acquisition cost paid at inception. In that case the residual margin will be equal to 100-65-15-20=0. The total liability will amount to 80 and this approach will neither lead to a gain nor will it create a loss at inception.
Both IASB and FASB decided in October 2009 that an insurer should expense all acquisition costs when incurred and should not recognise any revenue (or income) to offset those costs incurred. This would mean that in the above example Case A would apply, and the accounting requirement of ‘no gain at issue’ would in fact result in a loss at issue.
Different comments were given on this view. Participants in the field tests carried out in the last quarter of 2009, commented that the decision regarding the treatment of acquisition costs will have significant impact on their business. The IASB staff observed from the figures they received up to a 50% decrease in shareholders’ equity!
43

SOLVENCY II FOR REINSURANCE MANAGERS
• As a result of industry consultation, the IASB revised in March 2010 its decision of October. The IASB decided to exclude from the initial measurement of the residual margin an amount equal to the incremental acquisition costs. This means in our simple example that Case B would apply (‘no result at issue’). By this decision the IASB moves again in the direction of Solvency II, but in practice there will still remain a residual margin for which it is unclear how it will be released over time.
• At the March meeting the FASB moved away from the IASB and Solvency II by deciding to combine the residual margin and the risk adjustment into one composite margin and by reaffirming its decision on acquisition costs. For the above simple example this means that the FASB opts for ‘a loss at issue’ (Case A where it combines the ‘residual margin’ and ‘risk margin’ to a ‘composite margin’).
Discount rate The discount rate and the liquidity premium, which is highly debated under Solvency II, is also a major issue under IFRS. The IASB decided that the accounting standard should not give detailed guidance on how to determine the discount rate but it should conceptually adjust estimated cash flows for the time value of money in a way that captures the characteristics of that liability rather than using a discount rate based on expected return on actual assets backing those liabilities.
The high level guidance of the IASB is in contrast with Solvency II where detailed guidance is given.
Risk margin The risk margin was a major topic in the March meeting of the IASB and FASB. The boards still have concerns on the different methodologies with different outcomes that exist in determining the risk margin. The FASB decided that the measurement of an insurance contract should not include a separate risk margin, but the residual and risk margin will be combined in a composite margin. The IASB reaffirmed its previous decision and requires an explicit risk margin which should be assessed again at each reporting period. The method to use for determining the risk margin has not yet been decided.
This is in contrast with Solvency II which provides detailed guidance on risks and methods that should be taken into account. Solvency II requires for example that the cost of capital method (6%) will be used for the determination of the risk margin.
Future cash flows in life insurance Other topics that might have a significant impact on the accounting results are the treatment of participating features, of future premiums and how assumptions are determined. The IASB and Solvency II expressed an initial preference for including all cash-flows that arise from participating features but the FASB has a more limited view on the participating features that can be taken into account.
The treatment of future premiums, especially the issues of re-pricing and re-underwriting, are further possible points of divergence with Solvency II.
On determining assumptions, there seems to be more convergence between IASB/FASB and Solvency II than in the past. They decided that all available information including, but not limited to, industry data, historical undertaking specific expense data and market inputs, should be considered.
Short duration contracts The IASB decided that the unearned premium provides useful information about the pre-claims liabilities of short-duration insurance contracts. They will require that the pre-claims liabilities are determined based upon the unearned premium, instead of the above described four building blocks. Most, largely Non-Life insurers, participating in the field tests, favoured this requirement. However, some composite insurers were concerned that this requirement would prevent them from using the same single model for both Life and Non-Life insurance contracts.
Solvency II does not require a different treatment for short and long duration contracts and, as explained above, the pre-claims liabilities have to be calculated from a Fair Value point of view.
44

AON BENFIELD
Presentation of the performance statement As Solvency II defines capital requirements, it only treats the balance sheet, while IFRS as an accounting and reporting standard, also focuses on the presentation of the performance statement.
Conclusion Solvency II and the IFRS accounting standards initially followed the same road to the economic value of insurance liabilities, but they are now no longer on the same track. It seems that accounting standards setters will continue to have difficulties in reaching conclusions in the near future as the FASB and IASB have different views on basic issues. They are also struggling with subjects such as ‘gain on issue’ and ‘a methodology of determining a risk margin’ which are no longer debated for Solvency II. It will be fascinating to observe how the accounting standard setters will handle the differences with Solvency II, especially if Solvency II enters into force before they reach a conclusion.
45

SOLVENCY II FOR REINSURANCE MANAGERS
Country overviews 1. Number of insurance companies that will fall under the Solvency II regime? Austria Circa 48 companies were affected of Solvency II
Belgium 82 companies had in 2008 a combined written premium exceeding €5m
Bulgaria 24 companies had in 2008 a combined written premium exceeding €5m
Czech Republic 28 companies had in 2009 a combined written premium exceeding €5m
France 1,420 companies have an insurance activity in France in 2008 1,313 companies in 2009 fall under ACAM’s control 151 companies published a prudential balance sheet @ 31/12/2008 234 companies answered to the QIS4
Germany Circa 359 companies are affected by Solvency II
Greece There are about 100 insurance companies in Greece and 34 insurance companies in Cyprus. About 80% in both markets would fall under the Solvency II regime
Hungary 24 companies had in 2009 a combined written premium exceeding €5m
Italy 149 companies (Life and Non-Life) had in 2008 a combined written premium exceeding €5m
Netherlands 144 Non-Life companies had in 2008 a combined written premium exceeding €5m (including Health)
Norway 55 insurance companies will be Solvency II compliant (10 Life, 30 Non-Life, 13 captives and two run-off)
Poland 39 companies had in 2009 a combined written premium exceeding €5m
Romania 22 companies had in 2008 a combined written premium exceeding €5m
Slovakia 18 companies had in 2008 a combined written premium exceeding €5m
Slovenia 14 companies had in 2009 a combined written premium exceeding €5m
Spain 155 Non-Life companies and 105 Life companies in 2008 meeting the quantitative limits for Written Premiums and Technical Provisions (> €5m in WP and €25m in TP)
Sweden
UK 972 companies are authorised by the FSA to carry out insurance business in the UK. Out of these, 735 carry out Non-Life business, 193 carry out long-term business, and 44 carry out both Non-Life and long term business. The total Non-Life net written premium was £33.8bn in 2008 and long-term business premium was estimated at least at £131bn in 2008
Countries outside Europe
South Africa 31 General Insurers with Gross Written Premium exceeding ZAR53billion. 54 Specialist Insurers with Gross Written Premium exceeding ZAR11billion
46

AON BENFIELD
2. Pre-application process for IMAP started? Austria To date, no company has started the process of an approval
Belgium The CBFA is preparing itself, but so far no companies have indicated that they would apply for internal model approval in 2010. They are participating in a College of Supervisors that are working on the internal model approval process. The Belgian regulator will merge into the National Bank later this year (although this might also depend on whether the government changes or not)
Bulgaria So far there is no indication that CEE companies will apply for internal model approval in 2010
Czech Republic
So far there is no indication that CEE companies will apply for internal model approval in 2010
France The ACAM has already started to initiate a dialogue about internal models with controlled entities, under the existing obligation for them to have a system of risk management. This dialogue is as advanced as the controlled entity is advanced in its modelling. ACAM mentions that ‘it is today an indispensable step to ensure an efficient approval process before Solvency II comes into force’
Germany Three participants started to work on an internal model and were in contact with the BaFin to get the approval prior to the official starting date of Solvency II. It is an extremely time-consuming process
Greece The Greek government announced that it will move the regulation of insurance companies from The Independent Insurance Regulator (EPEIA) to the Bank of Greece. This will create a period of turmoil and perhaps a disruption in the regulation of the insurance sector. No companies will apply for an internal model in Greece or Cyprus
Hungary So far there is no indication that CEE companies will apply for internal model approval in 2010
Italy Italian insurance regulator ISVAP asked companies to indicate before 31/07/2010 if they would like to participate in the pre-approval process for using an internal Solvency II model
Netherlands The DNB is preparing for the pre-application process in cooperation with the German regulator by shadowing the German regulator on a large German insurance company. So far, 10 to 12 companies have indicated they might apply for internal model approval. The DNB expects that the final number will be lower. The situation will be clearer after QIS5.
Poland So far there is no indication that CEE companies will apply for internal model approval in 2010
Portugal Although market leaders are developing their own internal models, there is no indication that any company operating in Portugal will apply for internal model approval in 2010
Romania So far there is no indication that CEE companies will apply for internal model approval in 2010
Slovakia So far there is no indication that CEE companies will apply for internal model approval in 2010
Slovenia So far there is no indication that CEE companies will apply for internal model approval in 2010
Spain The Spanish regulator DGSFP recently carried out a market survey on internal models (full or partial) receiving extensive feedback from companies on their intention to implement internal models in the future. DGSFP will specially focus on validating the parameterisation of internal models. So far there is no indication that any Spanish company will apply for internal model approval in 2010
Sweden Some companies have required the Finansinspektionen to start up the IMAP
UK The UK process has started with six final and six draft submissions for internal model approval. There is a clear project plan and the process will be iterative and collaborative. Three key elements to obtain approval are (i) risk management, use test and governance, (ii) explain mathematics behind the SCR model, and (iii) the six internal model requirements of Articles 120 to 125. The FSA is urging everyone else to submit sooner rather than later as it believes this will be an iterative process and those who enter into discussions with the FSA quickly will benefit most
Countries outside Europe
South Africa The Financial Services Board has already visited some of the major insurers in South Africa to discuss how they are preparing themselves with regard to internal capital models. The application process for internal models has not started yet
47

SOLVENCY II FOR REINSURANCE MANAGERS
3. Country specific QIS 4 summary Austria • 26 companies (four Life, seven Non-life, and 13 composites) and one group participated in
QIS4 (market share of 68%). The overall solvency ratio increased from 227% under Solvency I to 257% under Solvency II. For Non-Life and composites undertakings there were only slight increases from 257% to 271% and from 231% to 254% respectively. For the Life undertakings there was strong increase from 130% to 279%
• The sum of all own funds in QIS4 was €14bn in comparison to the reported Solvency I own funds of €6bn
• Own funds were classified as Tier 1 for 97% of the total, the remainder being classified as Tier 2. 1.6% of the overall own funds were surplus funds and Hybrid capital instruments were represented below average
• Overall, the market risk was the largest risk in the BSCR calculation (77%)
Belgium • 27 companies participated in QIS4 (five Life, nine P&C, and 13 composites) during 2008, based on 31/12/2007 financial accounts. The overall solvency ratio came out slightly higher than the Solvency I ratio (226% compared to 216% currently). This was also the case for Life and composite insurers. For property and casualty undertakings, the surplus ratio was lower. Overall there was no problem regarding coverage of the requirements for eligible capital, with an overall ratio of 226.4% under the Standard Formula. Life undertakings and property and casualty undertakings were slightly above 160% and composites showed a weighted ratio of 280%. The size of the undertaking did not seem to be significant on this particular point
• None of the participating undertakings would have to raise its capital to meet the MCR. Two undertakings needed to raise their capital to meet the SCR. Six undertakings saw their surplus decrease and in the case of 18 undertakings there was considerable improvement in the solvency situation
• Own funds were classified as Tier 1 for 98.5% of the total, the remainder being classified as Tier 2. The eligible elements under Solvency II equalled 214% of the eligible Solvency I capital. Nearly half of the Tier 1 elements were value adjustments (Discount effect on liabilities, property investments valued at Fair Value etc.), a quarter were common equity capital (source: country report QIS4). Hybrid capital instruments represented 4% of total own funds under QIS4
Bulgaria • Five companies participated in QIS4 (two Life and three Non-Life) during 2008. None of the participating undertakings would have to raise its capital to meet the MCR, one undertaking would have to rise its capital to meet the SCR. Three undertakings saw more than 25% surplus decrease and in the case of two undertakings there was considerable (>25%) improvement in the solvency situation
• Own funds were classified as Tier 1 for 100% of the total. The eligible elements under Solvency II (QIS4) equalled 117% of the eligible Solvency I capital
Czech Republic • 14 companies participated in QIS4 (two Life, four Non-Life and eight composites) during 2008. The overall solvency ratio went down compared to the Solvency I ratio (235.4% compared to 335.1%). None of the participating undertakings would have to raise its capital to meet the MCR or SCR. Two undertaking saw its surplus decrease (>25%) and in the case of 7 undertakings there was considerable improvement (>25%) in the solvency situation
• Own funds were classified as Tier 1 for 99.7% of the total, the rest being classified as Tier 2. The eligible elements under Solvency II (QIS4) equalled 187% of the eligible Solvency I capital
Denmark • A total of 60 companies participated in QIS4, being 65% of all Life insurers and 87% of all Non-Life insurers. Six of the 60 participating companies did not hold enough capital to meet the SCR, and one company did not meet the MCR (in both cases, most of these companies were small). Average solvency ratio to MCR = 832%. Average solvency ratio to SCR = 285%. Average solvency ratio under Solvency I = 332%
• The decrease in solvency ratios was highest amongst P&C insurers. No QIS4 participants used partial/full internal models for their QIS4 responses
Finland • 20 companies participated in QIS4: 10 Non-Life, nine composites and one captive
48
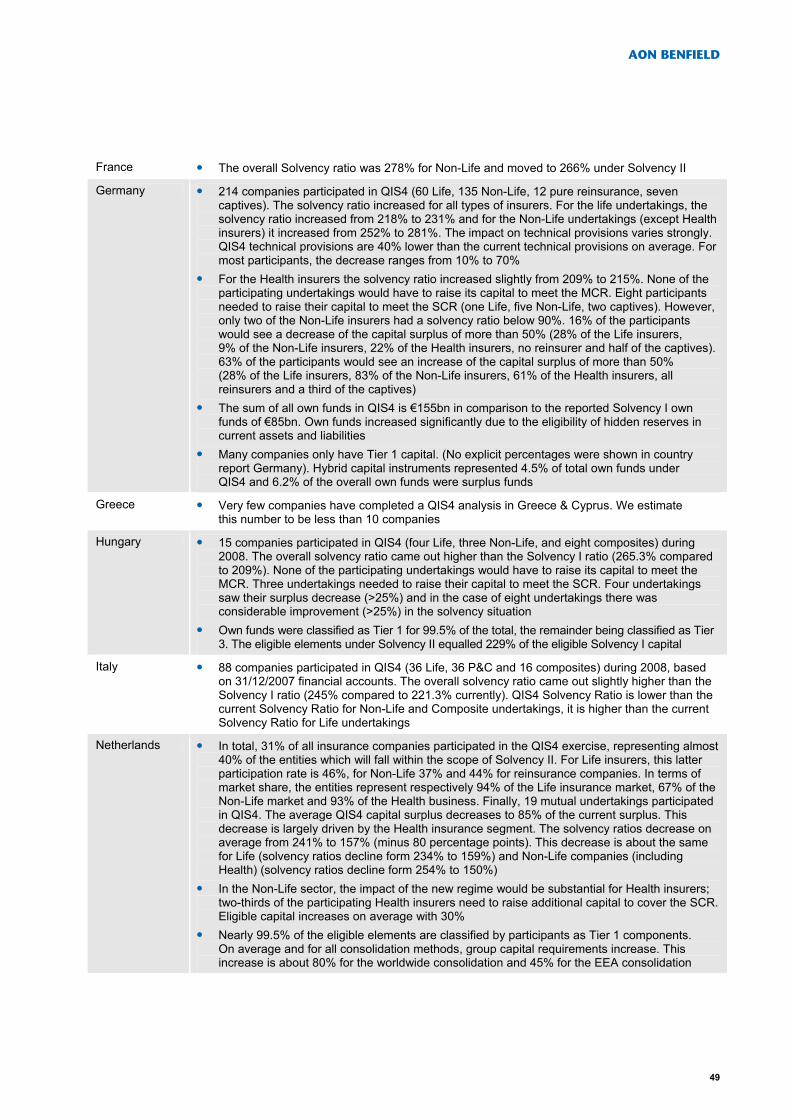
AON BENFIELD
France • The overall Solvency ratio was 278% for Non-Life and moved to 266% under Solvency II
Germany • 214 companies participated in QIS4 (60 Life, 135 Non-Life, 12 pure reinsurance, seven captives). The solvency ratio increased for all types of insurers. For the life undertakings, the solvency ratio increased from 218% to 231% and for the Non-Life undertakings (except Health insurers) it increased from 252% to 281%. The impact on technical provisions varies strongly. QIS4 technical provisions are 40% lower than the current technical provisions on average. For most participants, the decrease ranges from 10% to 70%
• For the Health insurers the solvency ratio increased slightly from 209% to 215%. None of the participating undertakings would have to raise its capital to meet the MCR. Eight participants needed to raise their capital to meet the SCR (one Life, five Non-Life, two captives). However, only two of the Non-Life insurers had a solvency ratio below 90%. 16% of the participants would see a decrease of the capital surplus of more than 50% (28% of the Life insurers, 9% of the Non-Life insurers, 22% of the Health insurers, no reinsurer and half of the captives). 63% of the participants would see an increase of the capital surplus of more than 50% (28% of the Life insurers, 83% of the Non-Life insurers, 61% of the Health insurers, all reinsurers and a third of the captives)
• The sum of all own funds in QIS4 is €155bn in comparison to the reported Solvency I own funds of €85bn. Own funds increased significantly due to the eligibility of hidden reserves in current assets and liabilities
• Many companies only have Tier 1 capital. (No explicit percentages were shown in country report Germany). Hybrid capital instruments represented 4.5% of total own funds under QIS4 and 6.2% of the overall own funds were surplus funds
Greece • Very few companies have completed a QIS4 analysis in Greece & Cyprus. We estimate this number to be less than 10 companies
Hungary • 15 companies participated in QIS4 (four Life, three Non-Life, and eight composites) during 2008. The overall solvency ratio came out higher than the Solvency I ratio (265.3% compared to 209%). None of the participating undertakings would have to raise its capital to meet the MCR. Three undertakings needed to raise their capital to meet the SCR. Four undertakings saw their surplus decrease (>25%) and in the case of eight undertakings there was considerable improvement (>25%) in the solvency situation
• Own funds were classified as Tier 1 for 99.5% of the total, the remainder being classified as Tier 3. The eligible elements under Solvency II equalled 229% of the eligible Solvency I capital
Italy • 88 companies participated in QIS4 (36 Life, 36 P&C and 16 composites) during 2008, based on 31/12/2007 financial accounts. The overall solvency ratio came out slightly higher than the Solvency I ratio (245% compared to 221.3% currently). QIS4 Solvency Ratio is lower than the current Solvency Ratio for Non-Life and Composite undertakings, it is higher than the current Solvency Ratio for Life undertakings
Netherlands • In total, 31% of all insurance companies participated in the QIS4 exercise, representing almost 40% of the entities which will fall within the scope of Solvency II. For Life insurers, this latter participation rate is 46%, for Non-Life 37% and 44% for reinsurance companies. In terms of market share, the entities represent respectively 94% of the Life insurance market, 67% of the Non-Life market and 93% of the Health business. Finally, 19 mutual undertakings participated in QIS4. The average QIS4 capital surplus decreases to 85% of the current surplus. This decrease is largely driven by the Health insurance segment. The solvency ratios decrease on average from 241% to 157% (minus 80 percentage points). This decrease is about the same for Life (solvency ratios decline form 234% to 159%) and Non-Life companies (including Health) (solvency ratios decline form 254% to 150%)
• In the Non-Life sector, the impact of the new regime would be substantial for Health insurers; two-thirds of the participating Health insurers need to raise additional capital to cover the SCR. Eligible capital increases on average with 30%
• Nearly 99.5% of the eligible elements are classified by participants as Tier 1 components. On average and for all consolidation methods, group capital requirements increase. This increase is about 80% for the worldwide consolidation and 45% for the EEA consolidation
49
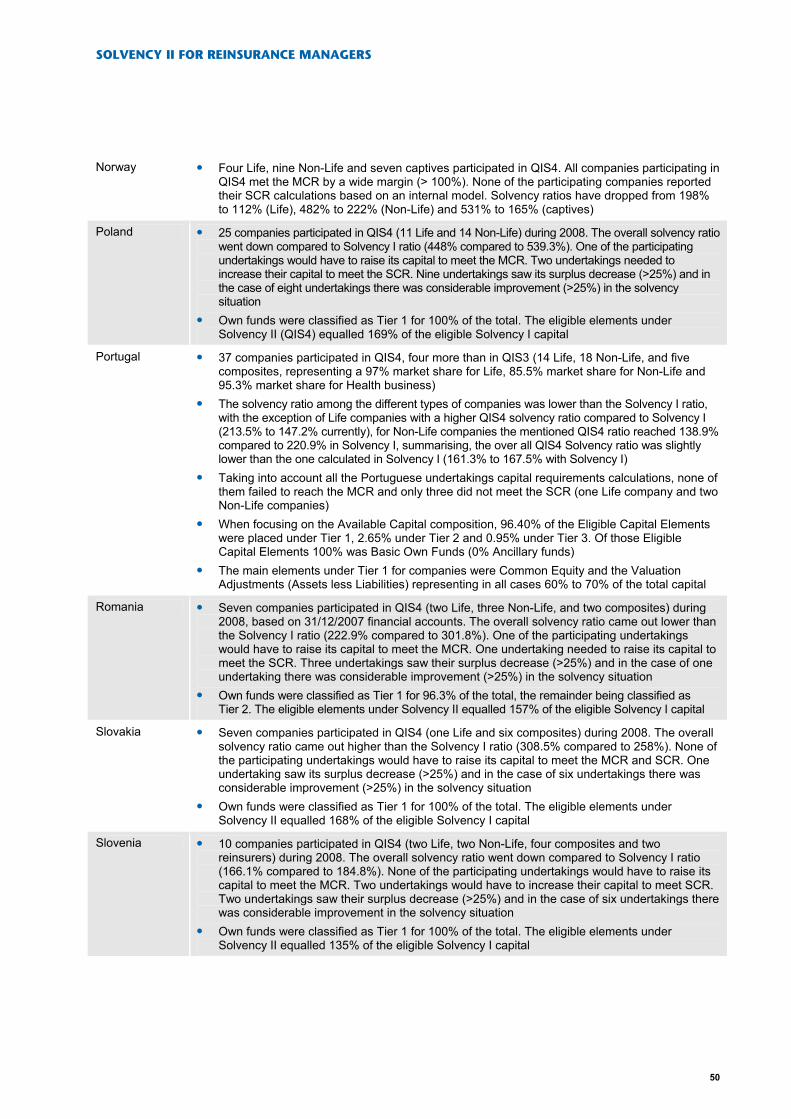
SOLVENCY II FOR REINSURANCE MANAGERS
Norway • Four Life, nine Non-Life and seven captives participated in QIS4. All companies participating in QIS4 met the MCR by a wide margin (> 100%). None of the participating companies reported their SCR calculations based on an internal model. Solvency ratios have dropped from 198% to 112% (Life), 482% to 222% (Non-Life) and 531% to 165% (captives)
Poland • 25 companies participated in QIS4 (11 Life and 14 Non-Life) during 2008. The overall solvency ratio went down compared to Solvency I ratio (448% compared to 539.3%). One of the participating undertakings would have to raise its capital to meet the MCR. Two undertakings needed to increase their capital to meet the SCR. Nine undertakings saw its surplus decrease (>25%) and in the case of eight undertakings there was considerable improvement (>25%) in the solvency situation
• Own funds were classified as Tier 1 for 100% of the total. The eligible elements under Solvency II (QIS4) equalled 169% of the eligible Solvency I capital
Portugal • 37 companies participated in QIS4, four more than in QIS3 (14 Life, 18 Non-Life, and five composites, representing a 97% market share for Life, 85.5% market share for Non-Life and 95.3% market share for Health business)
• The solvency ratio among the different types of companies was lower than the Solvency I ratio, with the exception of Life companies with a higher QIS4 solvency ratio compared to Solvency I (213.5% to 147.2% currently), for Non-Life companies the mentioned QIS4 ratio reached 138.9% compared to 220.9% in Solvency I, summarising, the over all QIS4 Solvency ratio was slightly lower than the one calculated in Solvency I (161.3% to 167.5% with Solvency I)
• Taking into account all the Portuguese undertakings capital requirements calculations, none of them failed to reach the MCR and only three did not meet the SCR (one Life company and two Non-Life companies)
• When focusing on the Available Capital composition, 96.40% of the Eligible Capital Elements were placed under Tier 1, 2.65% under Tier 2 and 0.95% under Tier 3. Of those Eligible Capital Elements 100% was Basic Own Funds (0% Ancillary funds)
• The main elements under Tier 1 for companies were Common Equity and the Valuation Adjustments (Assets less Liabilities) representing in all cases 60% to 70% of the total capital
Romania • Seven companies participated in QIS4 (two Life, three Non-Life, and two composites) during 2008, based on 31/12/2007 financial accounts. The overall solvency ratio came out lower than the Solvency I ratio (222.9% compared to 301.8%). One of the participating undertakings would have to raise its capital to meet the MCR. One undertaking needed to raise its capital to meet the SCR. Three undertakings saw their surplus decrease (>25%) and in the case of one undertaking there was considerable improvement (>25%) in the solvency situation
• Own funds were classified as Tier 1 for 96.3% of the total, the remainder being classified as Tier 2. The eligible elements under Solvency II equalled 157% of the eligible Solvency I capital
Slovakia • Seven companies participated in QIS4 (one Life and six composites) during 2008. The overall solvency ratio came out higher than the Solvency I ratio (308.5% compared to 258%). None of the participating undertakings would have to raise its capital to meet the MCR and SCR. One undertaking saw its surplus decrease (>25%) and in the case of six undertakings there was considerable improvement (>25%) in the solvency situation
• Own funds were classified as Tier 1 for 100% of the total. The eligible elements under Solvency II equalled 168% of the eligible Solvency I capital
Slovenia • 10 companies participated in QIS4 (two Life, two Non-Life, four composites and two reinsurers) during 2008. The overall solvency ratio went down compared to Solvency I ratio (166.1% compared to 184.8%). None of the participating undertakings would have to raise its capital to meet the MCR. Two undertakings would have to increase their capital to meet SCR. Two undertakings saw their surplus decrease (>25%) and in the case of six undertakings there was considerable improvement in the solvency situation
• Own funds were classified as Tier 1 for 100% of the total. The eligible elements under Solvency II equalled 135% of the eligible Solvency I capital
50
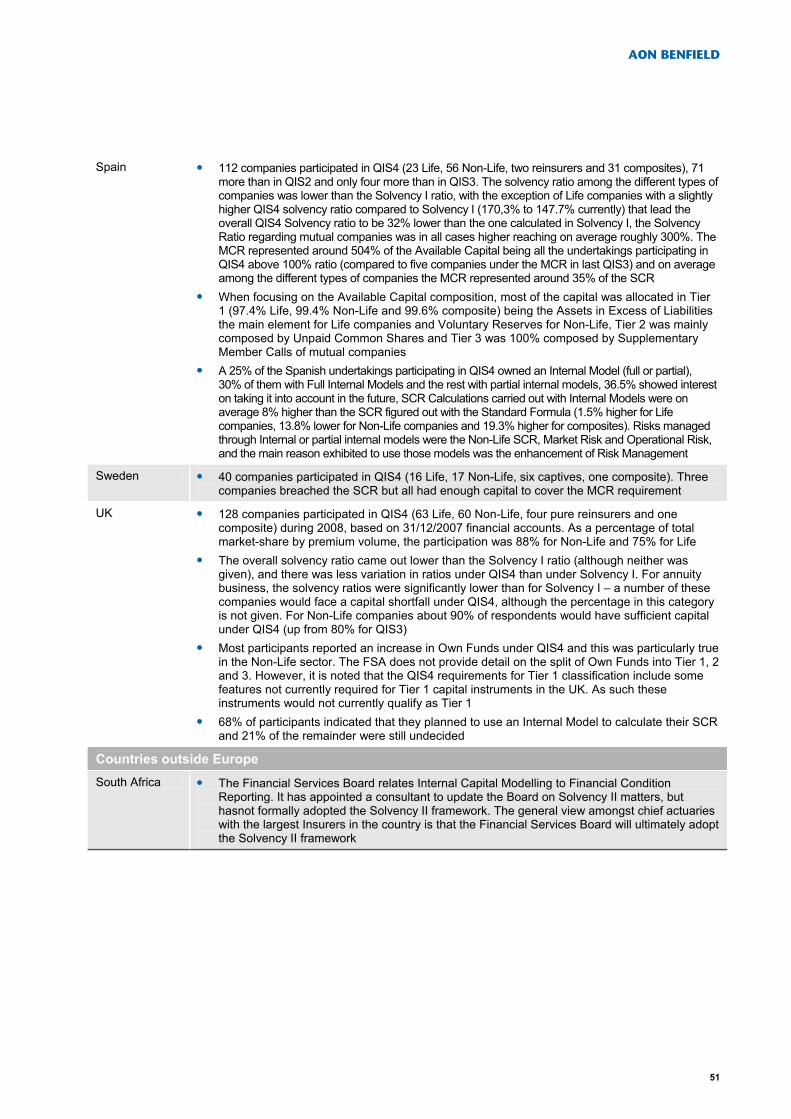
AON BENFIELD
Spain • 112 companies participated in QIS4 (23 Life, 56 Non-Life, two reinsurers and 31 composites), 71 more than in QIS2 and only four more than in QIS3. The solvency ratio among the different types of companies was lower than the Solvency I ratio, with the exception of Life companies with a slightly higher QIS4 solvency ratio compared to Solvency I (170,3% to 147.7% currently) that lead the overall QIS4 Solvency ratio to be 32% lower than the one calculated in Solvency I, the Solvency Ratio regarding mutual companies was in all cases higher reaching on average roughly 300%. The MCR represented around 504% of the Available Capital being all the undertakings participating in QIS4 above 100% ratio (compared to five companies under the MCR in last QIS3) and on average among the different types of companies the MCR represented around 35% of the SCR
• When focusing on the Available Capital composition, most of the capital was allocated in Tier 1 (97.4% Life, 99.4% Non-Life and 99.6% composite) being the Assets in Excess of Liabilities the main element for Life companies and Voluntary Reserves for Non-Life, Tier 2 was mainly composed by Unpaid Common Shares and Tier 3 was 100% composed by Supplementary Member Calls of mutual companies
• A 25% of the Spanish undertakings participating in QIS4 owned an Internal Model (full or partial), 30% of them with Full Internal Models and the rest with partial internal models, 36.5% showed interest on taking it into account in the future, SCR Calculations carried out with Internal Models were on average 8% higher than the SCR figured out with the Standard Formula (1.5% higher for Life companies, 13.8% lower for Non-Life companies and 19.3% higher for composites). Risks managed through Internal or partial internal models were the Non-Life SCR, Market Risk and Operational Risk, and the main reason exhibited to use those models was the enhancement of Risk Management
Sweden • 40 companies participated in QIS4 (16 Life, 17 Non-Life, six captives, one composite). Three companies breached the SCR but all had enough capital to cover the MCR requirement
UK • 128 companies participated in QIS4 (63 Life, 60 Non-Life, four pure reinsurers and one composite) during 2008, based on 31/12/2007 financial accounts. As a percentage of total market-share by premium volume, the participation was 88% for Non-Life and 75% for Life
• The overall solvency ratio came out lower than the Solvency I ratio (although neither was given), and there was less variation in ratios under QIS4 than under Solvency I. For annuity business, the solvency ratios were significantly lower than for Solvency I – a number of these companies would face a capital shortfall under QIS4, although the percentage in this category is not given. For Non-Life companies about 90% of respondents would have sufficient capital under QIS4 (up from 80% for QIS3)
• Most participants reported an increase in Own Funds under QIS4 and this was particularly true in the Non-Life sector. The FSA does not provide detail on the split of Own Funds into Tier 1, 2 and 3. However, it is noted that the QIS4 requirements for Tier 1 classification include some features not currently required for Tier 1 capital instruments in the UK. As such these instruments would not currently qualify as Tier 1
• 68% of participants indicated that they planned to use an Internal Model to calculate their SCR and 21% of the remainder were still undecided
Countries outside Europe
South Africa • The Financial Services Board relates Internal Capital Modelling to Financial Condition Reporting. It has appointed a consultant to update the Board on Solvency II matters, but hasnot formally adopted the Solvency II framework. The general view amongst chief actuaries with the largest Insurers in the country is that the Financial Services Board will ultimately adopt the Solvency II framework
51

SOLVENCY II FOR REINSURANCE MANAGERS
4. Primary NatCat perils Austria Flood then hail Belgium Windstorm then river flood Bulgaria Earthquake then river flood Czech Republic Flood. Denmark Windstorm and coastal flood Finland - France Windstorm and coastal flood, then river flood Germany Windstorm and coastal flood, then river flood Greece Earthquake Hungary Earthquake then river flood Ireland Windstorm and coastal flood Italy Earthquake then river flood Netherlands Windstorm and coastal flood Norway River flood Poland River flood, then windstorm and coastal flood Portugal Earthquake Romania Earthquake then river flood. Slovakia River flood Slovenia Earthquake then river flood and windstorm Spain Windstorm and hail Sweden Windstorm UK Windstorm and coastal flood, then river flood
Countries outside Europe
South Africa Earthquake then river flood and hail
52

AON BENFIELD
5. Aon Benfield engagement with local regulator and clients Austria • Presentation of S2Metrica to clients
• Explanation of the differences between the different QIS studies • Checking of the technical specifications (e.g. counter party default risk) • Comparison of the capital requirements resulting from a reinsurance analysis
and the QIS4 study • Completion of the actuarial practice part in the QIS4 study (among other things,
calculation of the Best Estimates)
Belgium • Meetings have been held to discuss internal modelling and risk-transfer related issues • Demonstration of S2Metrica • Knowledge transfer on catastrophe modelling
France • We had several meetings with the ACAM on specific reinsurance related issues
Germany • Same as for Austria
Greece • We have had various meetings with clients. Most clients are very interested In Solvency II but very little real work is happening
• We have discussed with various clients about Remetrica and S2Metrica. Most are interested • We have discussed with the Cypriot regulator our upcoming Impact Forecasting Earthquake
model. They are very interested in a demonstration of the tool
Italy • Meetings have been set up to discuss model and risk-transfer related issues and S2Metrica
Netherlands • Several meetings have been set up to discuss Solvency II in broader perspective, the Insurance Risk Study and re/insurance issues in general
• Demonstration of S2Metrica • Knowledge transfer on catastrophe modelling
Portugal • Meetings with regulator and industry bodies arranged to discuss S2Metrica and catastrophe modelling
• Most companies in the market (including the insurer association ASP) contacted for ReMetrica demonstrations and S2Metrica presentations
• Support on loss modelling in relation to reinsurance services provided
Spain • Recent meeting to discuss model and risk-transfer related issues with the Spanish regulator • S2Metrica demonstrations and implementation • Support on loss modelling
UK • Regular meetings with the regulator, the Financial Services Authority (FSA), on specific relevant topics, including the treatment of non-proportional reinsurance, the parameterisation of risks (Insurance Risk Study), catastrophe management and external models, S2Metrica, European catastrophe scenarios (testing of the standard catastrophe scenarios)
Countries outside Europe
South Africa • No meetings have been organised with regulator as yet • S2Metrica has been discussed with some clients. First client project aimed towards
the last quarter of 2010
53

SOLVENCY II FOR REINSURANCE MANAGERS
Glossary CEIOPS: Committee of European Insurance and Occupational Pensions Supervisors, the grouping of all European regulators.
EC: European Commission.
AMICE: Association of Mutual Insurers and Insurance Cooperatives in Europe.
SCR / MCR: SCR = Solvency Capital Requirement, MCR = Minimum Capital Requirement. SCR corresponds to the capital requirement for re/insurers in relation to a 1:200 year aggregate event that can occur in the next 12 months. It is based on a comprehensive analysis of risks (market, U/W, default, operational) and should an entity’s available capital fall below the SCR capital level, the regulator will require it to formulate a plan to exceed the SCR capital level. MCR is minimum 25% and maximum 45% of the SCR with also an absolute floor in Euros. If an entity’s capital falls below the MCR it is liable fot its licence to be withdrawn.
ORSA: Own Risk and Solvency Assessment, essentially the qualitative aspect of Solvency II whereby the re/insurer needs to demonstrate to the regulator that it understands the risks within the organisation. It is an internal assessment focussing (from a solvency perspective) on the specific risk profile of the business that the company is underwriting, the approved risk tolerance levels the company is willing to take and the underlying business strategy.
QIS4, QIS5: Quantitative impact studies organised by CEIOPS (Committee of European Insurance and Occupational Pensions Supervisors). These studies are aimed to provide an insight into the effect of new Solvency II capital requirements on the re/insurance industry.
USP: Untertaking Specific Parameters. The Standard Formula approach includes some pre-defined Standard Deviations (calculated on a pan-European basis). Companies are allowed (under certain conditions) to replace these standard deviations with standard deviations calculated from own company specific historical data. The use of USPs is considered as part of the standard approach. Therefore the Use Test criteria are not applicable but supervisory approval will be required (focussing on data quality and methodologies used).
LOB: Line Of Business.
Level 1: framework principles. This involves developing a European legislative instrument that sets out essential framework principles (approved in April 2009), including implementing powers for detailed measures at Level 2.
Level 2: implementing measures. This involves developing more detailed implementing measures (prepared by the European Commission following advice from CEIOPS) that are needed to operationalise the Level 1 framework legislation.
Level 3: guidance. CEIOPS works on joint interpretation recommendations, consistent guidelines and common standards. CEIOPS also conducts peer reviews and compares regulatory practice to ensure consistent implementation and application.
MaRisk: Mindestanforderungen an das Risikomanagement, Minimum Requirement for Risk Management by BaFin.
CRESTA: Catastrophe Risk Evaluation and Standardizing Target Accumulations. CRESTA zones are commonly acknowledged zones (for easier assessment of risks) within a region or country in relation to the distribution of insured values of natural catastrophe risks. The system was founded by and is still managed by Swiss Re and Munich Re.
54

AON BENFIELD
IMAP: Internal Model Approval Process, which is run by local regulators to assess the quality of Internal Models in anticipation of Solvency II.
VIF: Value of In-Force for Life insurers. Sometimes called In-Force Cash Flows. Essentially the Net Present Value of future profits on existing contracts.
Tiering of capital: Under Solvency II there will be three different qualities of capital recognised. The Tier 1 Capital is the highest quality, or in other words it is the most loss absorbing. Tier 1 capital is equivalent to core equity. Tier 2 capital is more senior than Tier 1 Capital, and Tier 3 capital even more so. At least 50% of the SCR needs to be Tier 1 capital, and Tier 3 capital can be maximum 15% of SCR.
CPs: Consultation Papers (1 to 80) as published by CEIOPS with guidance on Solvency II processes and parameterisations.
LPT, ADC: Loss Portfolio Transfer and Adverse Development Cover. An LPT is a reinsurance cover in which the reinsurer commits to pay all the claims of the insurer relating to the existing contracts written in exchange for an upfront premium. Often the reinsurance cover exceeds the original technical provisions on the balance sheet. An ADC is a reinsurance cover whereby the reinsurer commits to pay all the claims of the insurer relating to the existing contracts written if they exceed a certain threshold, in exchange for an upfront premium.
ESG: Economic Scenario Generator, a tool that simulates economic scenarios and generates the corresponding equity yields, bond spreads, yield curves etc. over a predetermined time horizon.
CoV: Coefficient of Variation, defined as the standard deviation divided by the mean. Essentially this corresponds to the volatility of a distribution i.e. of a certain risk.
55

SOLVENCY II FOR REINSURANCE MANAGERS
Table of QIS5 parameters Solvency Capital Requirement calculations QIS5 proposals Operational risk charges Technical provisions - Life (unit linked technical provisions excluded) 0.45%
Technical provisions - Non-Life 3.00%
Premium - Life (unit linked premium excluded) 4.00%
Premium - Non life 3.00%
Unit linked expense factor 25.00%
Operational risk is calculated as max from operational risk sharge for premium and reserve risk with a minimum of 30% of the BSCR. Unit linked expense charge is added on top. Growth in technical provisions and premiums is also charged. Excess growth is penalized.
Market risk – interest rate Maturity Up Down 0.25 70% -75.0% 0.5 70% -75.0% 1 70% -75.0% 2 70% -65.0% 3 64% -56.0% 4 59% -50.0% 5 55% -46.0% 6 52% -42.0% 7 49% -39.0% 8 47% -36.0% 9 44% -33.0% 10 42% -31.0% 11 39% -30.0% 12 37% -29.0% 13 35% -28.0% 14 34% -28.0% 15 33% -27.0% 16 31% -28.0% 17 30% -28.0% 18 29% -28.0% 19 27% -29.0% 20 26% -29.0% 21 26% -29.0% 22 26% -30.0%
56
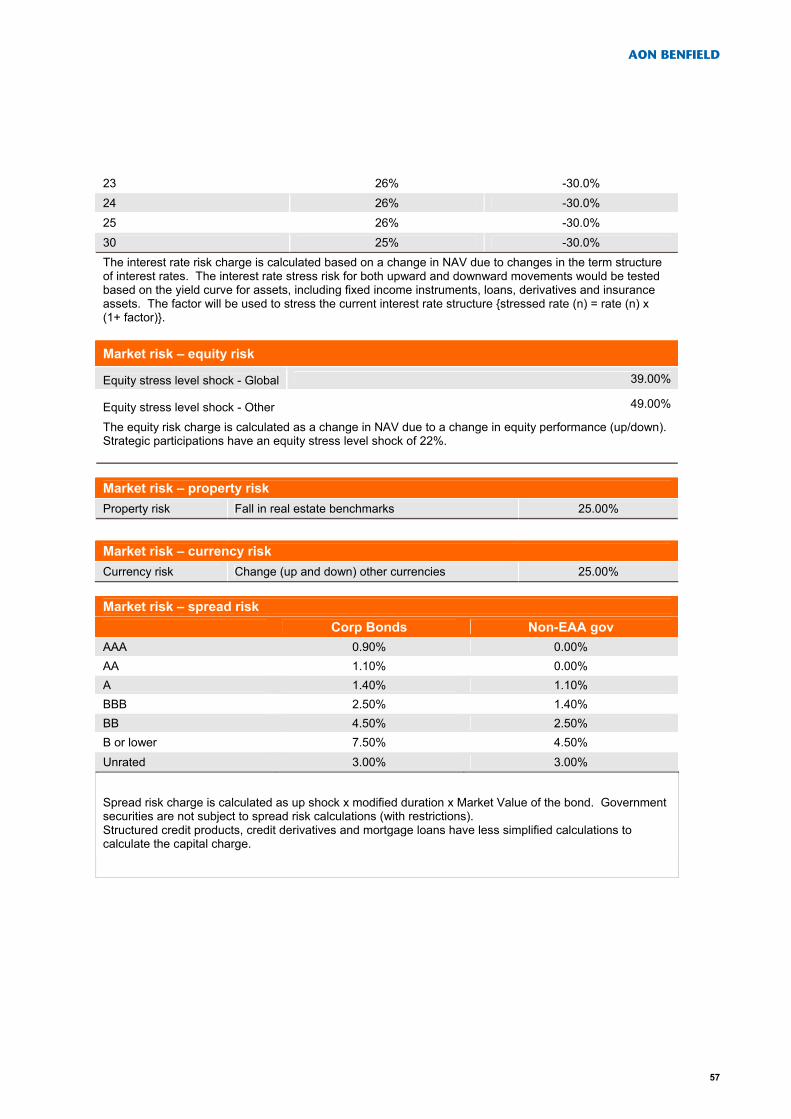
AON BENFIELD
23 26% -30.0% 24 26% -30.0% 25 26% -30.0% 30 25% -30.0% The interest rate risk charge is calculated based on a change in NAV due to changes in the term structure of interest rates. The interest rate stress risk for both upward and downward movements would be tested based on the yield curve for assets, including fixed income instruments, loans, derivatives and insurance assets. The factor will be used to stress the current interest rate structure {stressed rate (n) = rate (n) x (1+ factor)}.
Market risk – equity risk Equity stress level shock - Global 39.00%
Equity stress level shock - Other 49.00%
The equity risk charge is calculated as a change in NAV due to a change in equity performance (up/down). Strategic participations have an equity stress level shock of 22%.
Market risk – property risk Property risk Fall in real estate benchmarks 25.00%
Market risk – currency risk Currency risk Change (up and down) other currencies 25.00%
Market risk – spread risk Corp Bonds Non-EAA gov AAA 0.90% 0.00% AA 1.10% 0.00% A 1.40% 1.10% BBB 2.50% 1.40% BB 4.50% 2.50% B or lower 7.50% 4.50% Unrated 3.00% 3.00%
Spread risk charge is calculated as up shock x modified duration x Market Value of the bond. Government securities are not subject to spread risk calculations (with restrictions). Structured credit products, credit derivatives and mortgage loans have less simplified calculations to calculate the capital charge.
57

SOLVENCY II FOR REINSURANCE MANAGERS
Market risk – concentration risk The calculation is performed for financial concentration risks and properties concentration risks by (a) calculating the excess exposure, (b) the risk concentration charge per 'name' and (c) aggregation. Assets covered in the counterparty default risk charge are excluded from the market risk - concentration risk charge.
Counterparty default risk charges Probability of default for type 1 exposures AAA 0.002% AA 0.01% A 0.05% BBB 0.24% BB 1.20% B 6.04% CC or lower 30.41% not rated 10.00% Recovery rate for reinsurance arrangements 50.00% Recovery rate for financial derivatives 10.00%
Life risk charges Life mortality risk (Permanent) increase in mortality rates 15.00% Longevity risk (Permanent) decrease in mortality rates 20.00% Disability or morbidity risk 35% next year, 25% following Disability or morbidity risk 20% decrease in recovery rates Lapse risk 50% increase/decrease Mass lapse risk 30% retail, 70% non-retail Expense risk 10% increase Revision risk On (exposed) annuities 3% increase Life cat risk 1.5 per mille on capital at risk
NLSLT Health premium and reserve risk Premium risk (gross of reinsurance) Medical expense 4.00% Income protection 8.50% Workers' compensation 5.50% Reserve risk (net of reinsurance) Medical expense 10.00% Income protection 14.00% Workers' compensation 11.00%
58
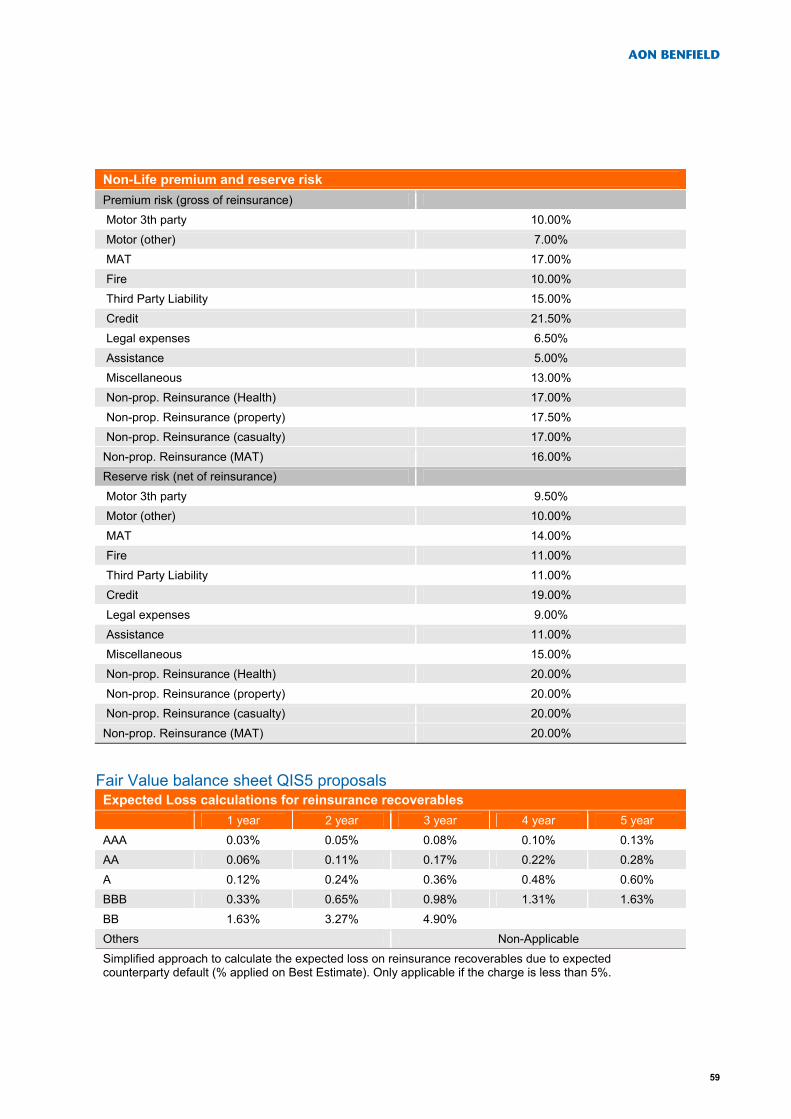
AON BENFIELD
Non-Life premium and reserve risk Premium risk (gross of reinsurance) Motor 3th party 10.00% Motor (other) 7.00% MAT 17.00% Fire 10.00% Third Party Liability 15.00% Credit 21.50% Legal expenses 6.50% Assistance 5.00% Miscellaneous 13.00% Non-prop. Reinsurance (Health) 17.00% Non-prop. Reinsurance (property) 17.50% Non-prop. Reinsurance (casualty) 17.00% Non-prop. Reinsurance (MAT) 16.00% Reserve risk (net of reinsurance) Motor 3th party 9.50% Motor (other) 10.00% MAT 14.00% Fire 11.00% Third Party Liability 11.00% Credit 19.00% Legal expenses 9.00% Assistance 11.00% Miscellaneous 15.00% Non-prop. Reinsurance (Health) 20.00% Non-prop. Reinsurance (property) 20.00% Non-prop. Reinsurance (casualty) 20.00% Non-prop. Reinsurance (MAT) 20.00%
Fair Value balance sheet QIS5 proposals Expected Loss calculations for reinsurance recoverables 1 year 2 year 3 year 4 year 5 year AAA 0.03% 0.05% 0.08% 0.10% 0.13% AA 0.06% 0.11% 0.17% 0.22% 0.28% A 0.12% 0.24% 0.36% 0.48% 0.60% BBB 0.33% 0.65% 0.98% 1.31% 1.63% BB 1.63% 3.27% 4.90% Others Non-Applicable Simplified approach to calculate the expected loss on reinsurance recoverables due to expected counterparty default (% applied on Best Estimate). Only applicable if the charge is less than 5%.
59

SOLVENCY II FOR REINSURANCE MANAGERS
MVM simplifications (% applicable on Net Best Estimate liabilities) QIS5 Medical expenses 8.50% Income protection 12.00% Workers' compensation 10.00% Motor 3th party 8.00% Motor (other) 4.00% MAT 7.50% Fire 5.50% Third Party Liability 10.00% Credit 9.50% Legal expenses 6.00% Assistance 7.50% Miscellaneous 15.00% Non-prop. Reinsurance (health) 17.00% Non-prop. Reinsurance (property) 7.00% Non-prop. Reinsurance (casualty) 17.00% Non-prop. Reinsurance (MAT) 8.50% Cost of Capital rate 6.00%
MVM applicable on BE (claims and premium liabilities). Cat Factors Line of Business Scenario Factor 1 Motor 3th party Motor 3th party liability
scenario 40%
2 Motor (other) Storm 175% Flood 113% Quake 120% Hail 30% 3 MAT MAT disaster 100% 4 Fire Storm 175% Flood 113% Quake 120% Fire, explosion 175% 5 Third Party Liability 3th party liability disaster 85% 6 Credit 139% 7 Legal expenses 0% 8 Assistance 0% 9 Miscellaneous Miscealleous disaster 40% 10 Non-prop. Reinsurance (property) Property disaster 250% 11 Non-prop. Reinsurance (casualty) Casualty disaster 250% 12 Non-prop. Reinsurance (MAT) MAT disaster 250%
60

AON BENFIELD
Aon Benfield: unique forward looking insights for clients Aon Benfield believes it delivers more value to insurers by identifying changes to the reinsurance markets in advance of key industry renewals dates, rather than merely reporting on the varied results of actual renewals following key renewals dates. We work with each of our clients to help them understand how these global market factors will affect their property catastrophe reinsurance renewal. Factors such as insurer underwriting methods, data quality, capacity required, experience, and current modelled margin levels can combine to create a better or worse outcome.
Your Aon Benfield Solvency II contacts: Marc Beckers (EMEA) t: +44 (0)20 7086 0394 e: [email protected]
Jurgen Wielandts (EMEA) t: +32 2 661 71 64 e: [email protected]
Paul Kaye (UK) t: +44 (0)20 7522 3810 e: [email protected]
61

SOLVENCY II FOR REINSURANCE MANAGERS
Notes _____________________________________________________________________________
_____________________________________________________________________________
_____________________________________________________________________________
_____________________________________________________________________________
_____________________________________________________________________________
_____________________________________________________________________________
_____________________________________________________________________________
_____________________________________________________________________________
_____________________________________________________________________________
_____________________________________________________________________________
_____________________________________________________________________________
_____________________________________________________________________________
_____________________________________________________________________________
_____________________________________________________________________________
_____________________________________________________________________________
_____________________________________________________________________________
_____________________________________________________________________________
_____________________________________________________________________________
_____________________________________________________________________________
_____________________________________________________________________________
_____________________________________________________________________________
_____________________________________________________________________________
_____________________________________________________________________________
_____________________________________________________________________________
_____________________________________________________________________________
_____________________________________________________________________________
_____________________________________________________________________________
_____________________________________________________________________________
62

AON BENFIELD
63
Copyright 2010 Aon Benfield Inc.
This document is intended for general information purposes only and should not be construed as advice or opinions on any specific facts or circumstances. The analysis and comments in this paper are based upon Aon Benfield’s general observations of reinsurance market conditions as of January 2009. Forward looking statements are based on existing conditions in the marketplace which are always subject to change, therefore, actual future market conditions may be materially different from the opinions expressed in this paper. The content of this document is made available on an “as is” basis, without warranty of any kind. Aon Benfield disclaims any legal liability to any person or organization for loss or damage caused by or resulting from any reliance placed on that content. Aon Benfield reserves all rights to the content of this document. Members of the Aon Benfield Analytics Team will be pleased to consult on any specific situations and to provide further information regarding the matters discussed herein.

55 Bishopsgate, London, EC2N 3BD t: +44 (0)20 7088 0044 | f: +44 (0)20 7575 7001 | www.aonbenfield.com
Copyright Aon Limited trading as Aon Benfield 2010 | #4130 07/2010