solving sas performance problems: employing host tony brown, sas
TRANSCRIPT

Solving SAS® Performance Problems: Employing Host-Based Tools Tony Brown, SAS Institute Inc., Dallas, TX
ABSTRACT
The SAS® System is composed of a large family of products and solutions, each with varying performance paradigms and machine resource utilization patterns. Today’s greatly increased data scales and heavy use of intensive analytic procedures, coupled with server consolidations placing mixed workloads on shared server and storage are resulting in occasional performance issues.
A previous SAS White Paper, “A Practical Approach to Solving Performance Problems with the SAS System,” detailed the role of the FULLSTIMER option in diagnosing and solving performance problems. It introduced the usage of host-based performance monitors for further investigation. This paper continues with that approach, detailing the use of the most commonly available host-based performance monitors. It will discuss how to employ them in performance testing, interpret them with a SAS mindset, and reconcile them to FULLSTIMER output to determine problem causes.
INTRODUCTION
Performance is crucial, and when performance problems arise, many SAS users do not have a well defined process for dealing with them. In the SAS Performance Lab we regularly help internal and external customers diagnose and correct performance issues. One of the most valuable techniques we utilize is overlaying host performance monitor output with the SAS Logs to understand what resource stresses or bottlenecks exist during the execution of SAS processes.
In the last two years we have seen an increase in the requests for performance help due to several factors: ♦ Very large scales of data or analytic operations now being used ♦ Increased use of heavy statistical procedures for prediction and analytics ♦ Server consolidations driving mixed use communities to share server, OS, and storage environments ♦ Sub-optimal setup of storage arrays (including SANs)
This paper is intended to discuss the value, deployment, interpretation, and use of host monitor output in the performance resolution process; from within the framework of an iterative, disciplined approach.
By using this approach, and employing host-base monitors in the process, you can significantly shorten the problem diagnostic and solution lifecycle. This will allow more time for performing analysis instead of getting jobs to run.
PERFORMANCE RESOLUTION PROCESS
UNDERSTAND THE PROBLEM AND GOAL
In order to begin the Performance Resolution Process, you must first clearly understand the problem itself, and the performance goal that will solve it.
Define the problem in Specific Terms. Consider the following common examples: ♦ My job(s) run well sometimes, at others they take 2 – 10 times as long to finish. ♦ My job(s) cannot fit within the batch window I have to run it in. ♦ My BI applications response time gets very slow at times. ♦ A few jobs run fast, but when many run, or I mix interactive BI work (e.g. Web Report Studio, Enterprise, Cube
Report Studio, etc.) with other SAS jobs, things slow way down, and some things do not finish.
You then have to define the performance/behavior that will resolve the problem.
Consider the following examples: ♦ This job must run within 30 minutes. ♦ Users must get 20 second complex query response from Enterprise Guide on a heavily used system ♦ This job has to run as fast as it used to, from x minutes down to y minutes
Keep in mind that the performance/behavior goals must be attainable. Do not expect a job to finish in 30 minutes if you are processing two terabytes of data serially on an I/O subsystem that only delivers 600 megabytes per second.
1

You must confine your expectations within the abilities of your server and storage system (unless you upgrade), and within the generally accepted realm of physics.
UNDERSTAND ANY CONSTRAINTS YOU MUST WORK WITHIN
The second thing to keep in mind is to understand any constraints you may be placed under. For example, you may not be allowed to upgrade or expand your server or storage system. You may not be able to tune your server or storage system to favor your SAS processes due to mixed workloads with other software (e.g. RDBMS, etc.).
Understanding such limitations up front can immediately direct you to the options you have besides tuning or expansion.
UNDERSTAND THE HARDWARE ENVIRONMENT
Once you understand the problem and what you wish to attain, you must clearly understand the hardware environment you are working in, its performance limitations, and what you are asking of it via SAS.
SERVER
The first thing to do is to capture a detailed definition of the server, network, and I/O subsystem. You need to know: ♦ Model, make and patch-level of server and operating system ♦ In Unix, the kernel parameter settings ♦ The number and speed of processors ♦ The amount of Physical RAM ♦ How much storage is available and the logical and physical configuration of that storage:
Volume/LUN arrangement
Physical Disk layout characteristics (size of disks, stripe characteristic, RAID level, SAN, NAS, DA, etc.)
Your Systems Administrator should be able to help you with this. Some common utilities to run to find out Server information are: ♦ Solaris – prtdiag ♦ AIX – lsattr, lsconf, oslevel ♦ LINUX – /proc/cpuinfo, /proc/meminfo, /proc/slabinfo, /etc/issue ♦ Windows – c:\Program%20Files\Common%20Files\Microsoft%20Shared\MSInfo\msinfo32.exe
STORAGE
Understanding your storage arrangement may require help from your Systems Administrator. They can detail for you how it is set up. This setup will largely dictate I/O performance. The performance aspects of storage concern read and write throughput. Not all storage is created equally, and not all storage is setup optimally for SAS usage. Storage can be architected to favor sequential or random access, or compromised to both.
UNDERSTANDING AVAILABLE THROUGHPUT
Why is understanding all this important? Are we trying to turn you into hardware experts? Not necessarily. But, in today’s environment of large data, complex analytics, and heavy server workload environments, having some understanding of your system, and what it can deliver are crucial to your planning and expectations. This knowledge will help you understand if you are asking more of your system than it can deliver, or if you are not getting the most from your system. It arms you with the intelligence you need to effectively deal with your Systems Administrator to maximize resources.
BEST GENERAL ENVIRONMENT CONFIGURATION – SAS PROCESSING
I/O
Unfortunately, many storage systems default arrangements are set up to favor RDBMS processing. The setup is generally characterized by fewer, larger disks (300 GB), small stripe widths, and fewer disks per RAID group (3+1, 4+1). This setup is okay for most non-SAS work. SAS generally performs a lot of heavy sequential I/O (especially to SAS Work). SAS performance is generally favored by I/O subsystems that favor high sequential throughput. This generally entails <more> smaller disks (e.g. more 73 GB vs. fewer 300 GB disks to get more spindles), stripe widths of 64 or 128K, and high throughput host bus adaptors (two gigabit).
2

Consider separating SAS work and SAS data file systems onto separate mount points, on separate controller channels. Multiple SAS work and utility (UTILLOC) spaces are an effective way to “cool down” hot disks from a large number of users heavily using work and utility space.
Memory
The minimum recommendation for general SAS use is 4 GB per processor for UNIX/LINUX and Windows 64-bit servers. For Windows 32-bit servers, 4 GB RAM is all that needs to go into the entire server. SAS performs many memory intensive operations in some of its procedures, so more memory is better. Consider your workload when you set your memory up.
The MEMSIZE option defaults to 96 MB, and the SORTSIZE to 80 MB for UNIX/LINUX servers. It is not recommended to set the MEMSIZE option to 0 on UNIX/LINUX servers. On Windows systems, MEMSIZE is 0 by default, and SORTSIZE is 64 MB. If you change from the defaults, intelligently set MEMSIZE, SORTSIZE, REALMEMSIZE, etc. to settings that will allow your job to run, without over-allocating. Over-allocating can actually hurt performance in some cases.
Side Note: There is a problem with the AIX operating system before version 5.3 ML3. When SAS allocates memory, AIX allocates twice what was asked for. Be aware of this when you set your memory options!
Swap
When setting SAS swap space it is generally recommended to set a swap space up to 1.5 times the size of the physical memory available to SAS. Some SAS procedures will look to see if this swap space is available and may fail with an “Out Of Resource” error it is not, even if the physical memory is sufficient.
Buffering
SAS generally uses a small buffer allocation, 8 – 16K. If you choose to change the buffer size of a dataset, using a buffer setting that is a multiple of the disk stripe size has shown to generally give the best SAS performance, balancing large-block, sequential I/O with random I/O (heavy index usage) requests.
Data Compression
Data compression can often save twice the disk space as uncompressed data, and alleviate I/O traffic. SAS must uncompress this data at the CPU for processing. If your system is experiencing I/O issues and you have a lot of extra CPU cycles this may be a good trade, if not you may end up binding the CPUs!
CPU
Testing has proven that faster CPU’s do make a difference. In fact when you become CPU bound, the only thing you can do is to get more or faster CPUs. Very rough usage rules of thumb are fewer users should share a CPU for statistically (CPU) intensive operations, and more for general reading and writing of data (up to 25). A big push is on to sell hyper-threaded CPUs, and well as multi-core chips. There are pro’s and cons to using them. SAS long processes typically have not favored hyper-threading CPUs, because the floating point unit is still shared. In addition, multi-core processors still share the same bus, and do not exhibit a 2X performance for example for a dual-core processor. We are seeing more on a 1.5X increase. Consider these things when buying CPU architectures, and don’t “under-allocate”.
SAS USAGE
In addition, knowing something about the throughput demand your SAS process is placing on the system, will help you realize what you are asking of your system, and if it is there to deliver. ♦ What is being done exactly (Job Load Mix)? ♦ By How Many Concurrent Users/Processes? ♦ Single Server or Multi-Tiered Environment? ♦ Outside SAS Products Used (web servers, RDBMS, etc.) ♦ How much does all this add up?
If you are considering deploying an enterprise-level system and are unsure if you are sizing your server correctly, it is worth the minimal expense to engage SAS or SAS Quality Partners to perform a system sizing. This will help you and your Systems Administrator to plan your environment, and expectations more realistically.
TEST PROCESS
Once you understand your environment and what it can deliver in terms of throughput, and your SAS processes and
3

what they are generally demanding, you are prepared to move to the test process.
MONITOR AND MEASURE
The first step in the Test Process is to establish a baseline measure of the problem by monitoring and measuring the process(es) in question.
To accomplish this, do the following:
1. Add the job header in Attachment (A) to the beginning of the job-stream in question. It will turn on FULLSTIMER and other output options to enrich log output. Make sure that no options statements placed under this header over-ride the options it sets!
2. Start the host based monitors (discussed in detail below) before initiating the job.
3. Execute the job stream.
Once the job stream has finished, collect the SAS log(s), and host monitor output described in the attached scripts for the interpretation process.
INTERPRET RESULTS
Once the job stream has completed, examine the SAS log and interpret the findings, along with the findings of the host monitors, and any involved pertinent server logs (e.g. web services providers). Interpretation of the FULLSTIMER information in SAS logs is discussed in detail in the following paper:
http://support.sas.com/rnd/scalability/papers/solve_perf.pdf
The initial effort should be to examine your SAS code and processes. This is where the largest payoffs generally are. Examine your SAS application coding for process efficiency and make sure you cannot make any changes to improve it. Some of the things to look for are: ♦ Read and write data selectively (V-shaped data operations) ♦ Execute only the statements you need, in the order you need them ♦ Take advantage of SAS PROCEDURES ♦ Know SAS System defaults ♦ Control sorting ♦ Know your data and test programs
There are many books and classes available to help with building efficient SAS code on our website.
Once you have determined your code to be efficient, examine the application process. Sometimes breaking up large sequential processes into smaller parallel ones can yield significant performance gains. SAS/CONNECT® for MP has been very successfully employed in this fashion, as well as some of the new threaded PROCEDURES in SAS 9.
Interpretation of the host based monitors is discussed in detail below.
Look for any hotspots and bottlenecks. If any are found, work with your Systems Administrator to determine which corrective tuning actions to take.
MAKE CORRECTIONS
Once you have decided with your Systems Administrator what corrective tuning actions to make, change only one thing at a time. By changing one thing, testing and interpreting results iteratively, you will limit the affect of the outcome to one variable. This is crucial for interpretation in the complex inter-workings of a modern server and storage system!
Document every finding set and change so you can keep track of what you have done. As you progress through what could be several changes, this will help you keep track of where you have been.
Iterate this process until the desired result has been achieved. Compare the FULLSTIMER logs and host monitor output between the test runs for improvement.
To recap, a disciplined process dictates that you establish a well defined baseline measurement to improve upon. Then design and deploy the test, with careful measurement capture. Interpret the measures and take corrective action, changing one thing at a time, documenting your changes. This is an iterative process that is followed until the problem is resolved. (This was been said twice now, so it must be important!)
4

HOW TO EMPLOY HOST-BASED MONITORS
Host-based monitors collect statistics from kernel layer activity. They yield a fairly accurate picture of CPU, memory, I/O, and other resource activity over time.
This information can be collated, overlaid with the SAS process in question, and used to help determine if system resources are getting bottlenecked.
Deploying some of the host-based monitors requires root-level privileges which you may not have. Please work with your Systems Administrator to accomplish this. They can not only help you get the monitors run, but accurately interpret them as well.
At the back of this paper are several attachments. Attachment (A) has been described previously and will turn on enriched SAS log output. The other attachments (B – I) represent monitoring scripts that run basic System V performance monitors: iostat, vmstat, sar, prstat for Solaris, and ps. These monitors were chosen because they are almost universally available on UNIX and LINUX systems.
HOW TO USE THE COMPUTER MONITORING SCRIPTS
The {hostname}monitor.txt files (e.g. aixmonitor.txt) are scripts that will use common UNIX monitoring tools (available with any UNIX system) to gather what computer resources are being used on computer hardware during the execution of a SAS application that you wish to assess performance on.
To use the monitors, copy the code and paste it into a text file. FTP it (ASCII format) to the machine you wish to run it on, and make it executable:
e.g. chmod 777 aixmonitor.txt
Now that the script is ready, this is how you run it:
1) You will need to be root to execute the aixmonitor.txt script since it runs the monitoring tools described in the next section, some of which have to be run from the root id.
2) You will need to have a SAS job ready that can produce log output. Preferably use a batch job with the content of Attachment (A) included at the top as discussed previously. Start the job after the monitoring script has been started.
3) Execute the monitoring script. This script takes three parameters; date, interval, and count. Here is what each of the parameters does so you will know which value is needed.
Date – is the date the information was collected in the DDMMYYYY format.
Interval – tells the monitor how often to collect statistics in seconds
Count – tells the monitor how many collections to make
So if you want to make a collection every 10 seconds for an hour, you would use the following command to gather the information:
nohup ./aixmonitor.txt 15022006 10 360 &
Please note that the above assumes that the script file is in the directory where you currently are and that you have write permission to this directory.
Start the aixmonitor.txt script and then start the SAS job that showcases the performance issue that you are experiencing. In our example above, the SAS job runs in just under an hour, which is why we set the collection interval to capture data for an hour.
After the aixmonitor.txt script finishes, all of the files are immediately readable except for the sar file. It still needs to be parsed into its various output reports. Run the accompanying hostsarsplit.txt script (in this case aixsarsplit.txt) to accomplish this. Read the instruction comments at the top of the script and follow them. They will tell you to invoke the script with the name of the output sar file you just created as a parameter:
nohup ./aixsarsplit.txt 15022006.aixsar &
Once this is all complete, the available sar reports of interest will reside in your directory as sara, sarb, sard, etc. Not all of the hosts will utilize all of the sar reports due to host reporting differences.
If you wish to learn more about the individual monitors and their execution and parameters, please see the man pages on your system. Note: The monitor execution parameter set is different for UNIX/LINUX hosts (e.g. Solaris vs. AIX vs. HP vs. LINUX)! Interpretation of some monitor output measures may differ from host releases (e.g. Solaris 9 to Solaris 10). Please consult the man pages carefully with questions about any measures not covered in this paper.
5

This paper will point out any of the measures it introduces that change meaning within the same UNIX host across os releases.
IOSTAT, VMSTAT, SAR, PS, PERFMON
iostat is a monitor which will yield general I/O information, or down to the device (disk) level depending on which parameters it is run with. It also captures tape, terminal, and some CPU utilization metrics. It is important to work with your Storage Administrator when using iostat if you are using SANs, NAS, or other network storage. The interpretation may not be direct to the physical devices of the networked storage depending on how it is setup (LUNS, Volumes, etc.).
vmstat will monitor virtual memory statistics for kernel thread, virtual memory, disk, trap, and some CPU activity. On systems with more than one CPU, it averages the output from all the CPUs.
mpstat yields per-processor CPU statistics. The first row in the output represents the activity since the last boot of the server and should be ignored. This is also true of iostat.
sar gives reports on a variety of subsystems, and differs from host to host. In general it yields CPU, I/O, memory, swapping, and other reports. It runs, like the previous monitors on a count and interval basis. Every “n” seconds (interval) it collects statistics for the system and averages them over those “n” seconds, for however many collection instances you wish (count). If you choose an interval of less than 5 seconds, sar itself may affect the output because it uses resources to do its job. In general, for long running jobs on heavily loaded systems, the monitors deployed here are not too “invasive” and will not consequentially affect the output results.
The ps monitor can be used to tell what is running on the system at the time of your test, and can be manipulated to produce the top ‘N’ jobs by CPU consumption. This can tell you how much competition your job has while it is running. This monitor is a “run once” monitor. To iterate it to report on the same “counts and intervals” on which the previous monitors run, you must put it into a loop as in the attached scripts.
For Windows servers, Perfmon, or its batch counterparts – Logman and its batch counterpart, Relog, will yield a very broad array of statistics across all subsystems.
It is wise to execute the in a script like those attached, so you only have one command to kick off to run them. That way they all start at about the same time, and can end about the same time. This is much easier to implement and control.
OTHER MONITORS
There are host specific monitors as well as the generics which are extremely useful too. Examples are top, topas, prstat, etc. If you have them, work with your Systems Administrator to use them.
HOW TO INTERPRET RESULTS
SAS®FULLSTIMER RESULTS
Analyze the SAS logs and process for inefficiencies. Look for large disparities between the FULLSTIMER real time and combined system and user CPU time. If the difference is greater than 20 – 25%, and associated complaints about the performance exist, corroborate the SAS log with the host performance monitors. Ideally, you would tie any hotspots in the host monitors to the SAS log. The attached scripts output the system time to the output logs for a beginning time reference.
Once you have identified a problem job or step, the questions is “Can it be alleviated by coding changes, data model changes, application setup, etc.?” Those changes often bring the largest performance payoffs. If the process is efficient and you cannot find room for improvement, turn to hardware and kernel parameter changes as a last resort. Use the host monitors to guide this.
HOST MONITOR RESULTS
The host monitor commands are run with specified parameters that differ from one host to the next (e.g. SUN may be slightly different than AIX, which may be different than LINUX). Most Monitors run with the count and interval specified, some, like ps, have to run in a logic loop for continuous monitoring
MOST COMMON PROBLEMS & METRICS TO CONSIDER
UNIX/LINUX
I/O
6

The most common SAS problems to encounter in performance involve I/O. SAS generally utilizes long sequential reads and writes to disk. You want to look for high average wait queues, I/O wait on the CPU, coupled with disks that stay 100% busy with high average service times. This will likely occur most on your SAS WORK file systems, but also the file systems your permanent SAS data resides on.
Some of the monitor metrics that can help you find this are listed in the following table:
Monitor Metric SOLARIS AIX LINUX HP Note
iostat– these measures are averages of the statistics during the interval.
Average Queue Size
wait
This definition has changed slightly in Solaris 10 – it incorporates sum of avg wait + avg service time.
avgwqsz (wait), avgsqsz (service)
avgqu-sz <use sar *> This generally represents the average queue length, or how many transactions are waiting for service. In general if this number gets above 5 it is a concern and should be watched.
CPU Wait on IO Time
wt %iowait avwait Note that for AIX this is the percentage of time the CPU was waiting on I/O for service, on the others it is the time in milliseconds. Before AIX 4.1.3 this metric may be somewhat inflated – use it only with care. Anything chronically above 0 represents an opportunity for tuning and improvement. Chronically high numbers point can point to a serious bottleneck.
Average Service Time
avgserv
(either read or write report – write a single block of data from disk)
svc_t avwait This time is represented in milliseconds by default. Watch for it to climb high (10’s of milliseconds is not good) in conjunction with the other metrics listed here.
Disk busy %b This is the percentage of time the disk is busy during the interval. If it chronically stays at 100% then look at the other I/O metrics to see if it is possibly to an I/O bottleneck. This often occurs in /saswork.
Service Queue Full
qfull The number of times the service queue fills up and cannot accept more requests. If this happens chronically there is a problem.
sar - these measures are averages of the statistics during the interval.
7

Monitor Metric SOLARIS AIX LINUX HP Note
sar –d (block device activity)
Average Queue Size
avgque
This definition has changed slightly in Solaris 10 – it incorporates sum of avg wait + avg service time
avque avque This generally represents the average queue length, or how many transactions are waiting for service. In general if this number gets above 5 it is a concern and should be watched.
Disk Busy %busy %busy %busy This is the percentage of time the disk is busy during the interval. If it chronically stays at 100% then look at the other I/O metrics to see if it is possibly to an I/O bottleneck. This often occurs in /saswork.
Average Service time
avserv avserv This time is represented in milliseconds by default. Watch for it to climb high (10’s of milliseconds is not good) in conjunction with the other metrics listed here.
Service Queue is Full
sqfull The number of times the service queue fills up and cannot accept more requests. If this happens chronically there is a problem.
sar –q (queue statistics)
Run Queue of run-able processes
%runocc %runocc %runocc If %runocc is continually higher than the number of processors in the server, this could be a problem.
mpstat CPU Wait on IO Time
wt Again, we like to see this as low as possible, 0 preferably. When it gets at or above the 20% range I begin corroborating it with the other I/O measures mentioned here to see if I have an I/O bottleneck.
*(Some iostat and vmstat collectors represent a subset of the sar collectors on HP-UX and Linux and we tend to skip them and rely on sar)
Caution in using the previous and following reference markers.
The caution in using the above reference markers is that they are general, can be individually misinterpreted, and used individually are not always hard evidence. You must consider them collectively, and be careful of using an individual counter to dictate that a problem exists. They are very good indicators, and often, but do not always serve as hard evidence. One of the most important things to note is they are collecting statistics for EVERYTHING running on the computer, including host OS tasks – not just your SAS processes. Please keep this in mind when interpreting results. When in doubt, work with your Systems Administrator on interpretation and determination of issues. Further testing may sometimes be necessary with more detailed monitors based on evidence given by the general monitors above.
CPU
Many SAS PROCEDURES can be very CPU intensive (e.g. PROC REG). If you feel that you are getting undesirable performance, examine the CPU statistics recommended below to determine if you are CPU bound. Remember that many SAS 9 PROCEDURES are threaded and can utilize more than one CPU. Our best results involve utilizing no
8

more than four CPUs for threaded PROCEDURES. Look for CPUS that chronically stay 100 percent busy, or have very high Involuntary Context Switch Rates (too much competition for the CPU time slices), or if compressed data is being uncompressed at the CPU for SAS usage.
Monitor Metric Solaris AIX LINUX HP Notes
iostat Total CPU Busy
us + sy =id us + sy =id %user +
%system=
%idle
User is CPU time spent on executing user’s code. System is CPU time spent executing os tasks that support user-written code. Combined these measures show the total %busy of the CPU (which should equal %idle).
System CPU time should be low compared to User CPU Time. High System CPU time in relation to User CPU Time should be investigated.
sar -u Total CPU Busy
%user +
%sys =
%idle
%user +
%sys =
%idle
%user +
%system =
%idle
%user +
%sys =
%idle
System CPU time should be low compared to User CPU Time. High System CPU time in relation to User CPU Time should be investigated.
vmstat Total CPU Busy
us + sy =id us + sy =id *subset of sar
System CPU time should be low compared to User CPU Time. High System CPU time in relation to User CPU Time should be investigated.
Blocked Threads
b b b This is the average number of kernel threads in the wait queue. It this number stays consistently above 0, CPU performance can degrade.
mpstat Involuntary
Context Switches
Icsw Very high numbers of involuntary context switches may indicate too much stress on the CPUs from too many processes. Work with your Sysadmin to determine what is normal for your system, and what threshold you should look for. Note: Involuntary Context Switches are also in the SAS FULLSTIMER output.
MEMORY/PAGING/SWAPPING
New BI interfaces have made it easier for larger sets of users to request many, memory intensive, simultaneous tasks. Look for a low free list (available virtual memory), anticipated memory shortfalls, and low available swap.
The same goes for paging and swapping. Look for high page-in/page-out rates, high scan rates (Pages scanned by the clock algorithm - looking for pages), coupled with low swap space, or running out of swap space altogether. If you get an “Out of Resource” error in the SAS log, immediately check your swap space allocation.
Monitor Metric Solaris AIX LINUX HP Notes
9

Monitor Metric Solaris AIX LINUX HP Notes
vmstat Free Memory free fre free *subset of sar
Size of the free list (list of available pages) If the free list goes to 0 it is not good. If it chronically goes low it can indicate a need for more memory.
Swap Space si, so Swapped in, swapped out in Kb. Watch the swap out rates. If they are chronically high look at more memory/swap/ paging metrics to see if there is a problem.
Scan Rate Pages scanned by the clock algorithm (looking for a pages)
sr sr If the scan rate goes very high (check w/your Sysadmin) it could indicate memory stress.
Page-Ins/
Page-outs – Not to high, and balanced
pi vs. po pi vs. po KB pages paged-in, vs. paged-out. These should balance somewhat. If both page-ins and page-outs are very high, or if you have very high page-outs with little nor no page-ins, you could have an issue. Examine memory further.
Anticipated
Memory
Shortfall
de Anticipated memory shortfall. If this is chronically above 0 examine memory carefully to see if you need more.
Kthr - w kthr – w w Threads swapped out. If this is very high you may want to examine memory very closely.
sar –g Pages freed by the paging deamon per second
pgfree/s If this is > 1000, it is concerning. Possible paging issue, memory under stress
Pages Scanned by paging deamon/sec
pgscan/s Greater than 200 per second can possibly indicate trouble – check other paging and memory stats for corroboration
The % of inodes taken of f the free list by iget. (igets with page flushes)
%ufs_ipf Ideally you want this to be less than 10%
10

Monitor Metric Solaris AIX LINUX HP Notes
sar –p Virtual Address Translation Page Faults
vflt/s fault/s This should ideally be less than 15/second. If it is very high examine closer.
sar –r Free Memory – Available pages
freemem slots kbmemfree
Vs.
kbmemused
Note this is in kb not in pages!
%memused
Virtual memory available for use. If free memory goes chronically low (down to 10% or less) check with your Sysadmin on your memory tuning
Free Swap Space (disk blocks)
freeswap
(disk blocks)
kbswpfree (kb!)
Vs.
kbswpused
%swpused
If this goes to 0 you are in deep trouble. A SAS “out of resource error” is likely to have resulted. Allocated swap space should be as much as allocated memory, preferably 1.5 x as much
Pages freed by the paging deamon per second
frmpg/s Greater than 200 per second can possibly indicate trouble – check other paging and memory stats for corroboration
Transfers for swapins & swapouts/sec
swpin/s, swpot/s
If swapin/swapout transfers or blocks stay chronically high, check with your Sysadmin to monitor swapping. Get a baseline figure from the Sysadmin to use as a reference.
BUFFER
Watch the Cache hit ratios (%rcache and %wcache). If they go chronically low (less than 40 percent) bring it to the attention of your Systems Administrator for possible file cache tuning, or the need to increase file cache.
PROCESS MONITOR
I usually use ps to determine how many processes are currently running on the system the same time as I am. This can give some relative information as to why my performance may not be good. For example if there are eight other long SAS processes running on the server, sharing the same work and data that I am, and I see a noticeable slowdown in my I/O performance I can understand why.
The command I typically use is:
ps –eo user, pid, ppid, etime, pcpu, args
This will give me the user, process id, parent process, elapsed time the processes been executing, percentage of CPU currently utilized, and the process itself. Since ps is a “one-time snapshot”, I put it in a loop as in the attached scripts with the same interval and count as the other monitors so I can determine throughout the test period what was going on.
WINDOWS MONITORS
There are two primary tools we use to monitor Windows performance, Task Manager, and Perfmon (and its counterparts Logman and Relog). Task Manager can be used much as ps above, to see what processes are running
11

on your Windows system during the time of your testing.
Perfmon is the performance monitor most widely available for Windows systems. There is not room in his paper to give a tutorial on how to use Perfmon, so please see the following Microsoft® tutorial:
http://www.microsoft.com/technet/archive/mcis/perfmon.mspx
The following is a document provided on the internal SAS R&D web that details which Perfmon counters and objects to use, and what performance thresholds to look for in interpreting them.
Recommended Performance Counters for Windows Performance Monitor
SAS users on Windows should start with these Perfmon counters to understand the performance of their system and understand where their memory, CPU, and I/O resources are going. There are numerous counters, many of which have complicated explanations. These counters are among the more intuitive to understand.
Performance Object: Physical Disk (recommended) or Logical Disk. On Windows 2000 or Windows NT, these counters may not be enabled. Ensure that physical disk counters are enabled with the command diskperf –YD and that logical disk counters are enabled with the command diskperf –YV. If counters are not already enabled, you will need to reboot your system. However, on Windows 2003 Server or Windows XP, the disk counters should be enabled by default.
Instances: Available on a per-physical disk (0 C:, 1 D: E:, etc), per-logical disk (C:, D:, E:, etc), or _Total instance basis.
Counter Definition Guidance
Avg. Disk Queue Length
Avg. Disk Queue Length is the average number of both read and write requests that were queued for the selected disk during the sample interval.
This counter is derived from the product of Avg. Disk sec/Transfer and Disk Transfers/sec. If this exceeds 2 for an extended period of time on a disk, that disk may be becoming a bottleneck. You should correlate this with Current Disk Queue Length to be sure. If Current Disk Queue Length is fairly stable over the time in which you observe a high Avg. Disk Queue Length, then you likely have an overloaded disk. If Current Disk Queue Length is not stable, then you are likely to see spikes in Avg. Disk Queue Length that aren’t meaningful.
Recommended Scale: 100.0
Current Disk Queue Length
Current Disk Queue Length is the number of requests outstanding on the disk at the time the performance data is collected. It also includes requests in service at the time of the collection. This is a instantaneous snapshot, not an average over the time interval. Multi-spindle disk devices can have multiple requests that are active at one time, but other concurrent requests are awaiting service. This counter might reflect a transitory high or low queue length, but if there is a sustained load on the disk drive, it is likely that this will be consistently high. Requests experience delays proportional to the length of this queue minus the number of spindles on the disks. For good performance, this difference should average less than two.
The number of waiting I/O requests should be sustained at no more than 1.5 to 2 times the number of spindles making up the physical disk.
Recommended Scale: 10.0
Disk Read Bytes/sec Disk Read Bytes/sec is the rate at which bytes are transferred from the disk during read operations.
Lets you see the disk read throughput on your system. Values less than 10 MB/sec during sustained I/O suggests slow read disk performance.
Recommended Scale: 0.000001
12

Counter Definition Guidance
Disk Write Bytes/sec Disk Write Bytes/sec is rate at which bytes are transferred to the disk during write operations.
Lets you see the disk write throughput on your system. Values less than 10 MB/sec during sustained I/O suggests slow write disk performance.
Recommended Scale: 0.000001
Disk Transfers/sec Disk Transfers/sec is the rate of read and write operations on the disk.
This counter gives you an idea of how many I/O operations are happening on the disk. During sustained I/O you should see a value for this in the hundreds or above. Values above a thousand may indicate a large number of relatively small I/O operations on the disk.
Look at this in conjunction with “Avg. Disk sec/Transfer”.
Recommended Scale: 0.1
Avg. Disk sec/Transfer Avg. Disk sec/Transfer is the time, in seconds, of the average disk transfer.
This counter lets you know how long it is taking for the transfers to and from the disk. The smaller the value of this counter, the better. A small value (0.001 - 0.009) during sustained I/O suggests fast disk performance. A large value (0.01 or greater) during sustained I/O suggests slow disk performance.
Look at this in conjunction with “Disk Transfers/sec”.
Recommended Scale: 10000.0
Performance Object: Memory
Instances: None
Counter Definition Guidance
Available Mbytes Available MBytes is the amount of physical memory available to processes running on the computer, in Megabytes, rather than bytes as reported in Memory\\Available Bytes. It is calculated by adding the amount of space on the Zeroed, Free, and Stand by memory lists. Free memory is ready for use; Zeroed memory are pages of memory filled with zeros to prevent later processes from seeing data used by a previous process; Standby memory is memory removed from a process' working set (its physical memory) on route to disk, but is still available to be recalled. This counter displays the last observed value only; it is not an average.
When the Committed Bytes exceeds the RAM on your system, it will begin paging and sending the most recently used pages to disk. In Perfmon the displayed value is limited to 1E10.though the real value may be higher. Use in conjunction with Memory\% Usage.
Available Bytes and Available Kbytes counters are also available.
Recommended Scale: 1.0
Committed Bytes Committed Bytes is the amount of committed virtual memory, in bytes. Committed memory is the physical memory which has space reserved on the disk paging file(s). There can be one or more paging files on each physical drive. This counter displays the last observed value only; it is not an average.
When the Committed Bytes exceeds the RAM, your system will begin paging and sending the least recently used pages to disk. In Perfmon the displayed value is limited to 1E10, though the real value may be higher. Use in conjunction with Paging File\% Usage.
If you see this value growing during an ongoing job, it may be an indication of a memory leak.
Recommended Scale: 0.0000001
13

Counter Definition Guidance
Pages/sec Pages/sec is the rate at which pages are read from or written to disk to resolve hard page faults. This counter is a primary indicator of the kinds of faults that cause system-wide delays. It is the sum of Memory\\Pages Input/sec and Memory\\Pages Output/sec. It is counted in numbers of pages, so it can be compared to other counts of pages, such as Memory\\Page Faults/sec, without conversion. It includes pages retrieved to satisfy faults in the file system cache (usually requested by applications) non-cached mapped memory files.
If this value is above 100 for long amounts of time write disk performance, then hard page faults may be bottlenecking the system. If you see a consistently high value for this counter, look at Memory\Available MBytes and if that counter is consistently less than 4 MB, then this indicates ongoing paging activity and a possibly thrashing system. In this situation you may see that Processor\%Processor Time goes down close to 0.
Another indicator of paging is the product of Pages/sec and Avg. Disk sec/Transfer on the disk(s) containing the paging file(s). If this product exceeds 0.1 consistently then the system may need more memory.
Recommended Scale: 1.0
Performance Object: Paging File
Instances: _Total or per disk (C:, D:, E:, etc.)
Counter Definition Guidance
% Usage The amount of the Page File instance in use in percent. See also Process\\Page File Bytes.
When this value grows it indicates that Windows is growing the paging file, and possibly that memory demands have exceeded RAM. If the value appears stable and you see that Memory\Available Mbytes is plentiful (above 4) then it indicates that Windows is probably handling the memory demands well.
Recommended Scale: 1.0
Performance Object: Processor
Instances: 1 per CPU and _Total.
Counter Definition Guidance
% Processor Time % Processor Time is the percentage of elapsed time that the processor spends to execute a non-Idle thread. It is calculated by measuring the duration of the idle thread is active in the sample interval, and subtracting that time from interval duration. (Each processor has an idle thread that consumes cycles when no other threads are ready to run). This counter is the primary indicator of processor activity, and displays the average percentage of busy time observed during the sample interval. It is calculated by monitoring the time that the service is inactive and subtracting that value from 100%.
A sustained value greater than 80% where you do not also see substantial activity in disk counters indicates that the processor may be a bottleneck.
Recommended Scale: 1.0
14

Counter Definition Guidance
% Privileged Time % Privileged Time is the percentage of elapsed time that the process threads spent executing code in privileged mode. When a Windows system service in called, the service will often run in privileged mode to gain access to system-private data. Such data is protected from access by threads executing in user mode. Calls to the system can be explicit or implicit, such as page faults or interrupts. Unlike some early operating systems, Windows uses process boundaries for subsystem protection in addition to the traditional protection of user and privileged modes. Some work done by Windows on behalf of the application might appear in other subsystem processes in addition to the privileged time in the process.
This gives an indication of the CPU time being spent in the operating system.
Recommended Scale: 1.0
Performance Object: Process
Instances: Per process name, and _Total. Recommend adding these counters for the SAS instance. Multiple instances of a process are identified with #1, #2, etc.
Counter Definition Guidance
% User Time % User Time is the percentage of elapsed time that the process threads spent executing code in user mode. Applications, environment subsystems, and integral subsystems execute in user mode. Code executing in user mode cannot damage the integrity of the Windows executive, kernel, and device drivers. Unlike some early operating systems, Windows uses process boundaries for subsystem protection in addition to the traditional protection of user and privileged modes. Some work done by Windows on behalf of the application might appear in other subsystem processes in addition to the privileged time in the process.
This counter can go over 100% with a multithreaded application running on a system with more than one CPU. For example, an application maxing all CPUs on a 4-way server should show a value close to 400%.
Compare with Processor\% Processor Time to get an idea of how much User CPU Time this process is taking.
Recommended Scale: 1.0
% Privileged Time % Privileged Time is the percentage of elapsed time that the process threads spent executing code in privileged mode. When a Windows system service in called, the service will often run in privileged mode to gain access to system-private data. Such data is protected from access by threads executing in user mode. Calls to the system can be explicit or implicit, such as page faults or interrupts. Unlike some early operating systems, Windows uses process boundaries for subsystem protection in addition to the traditional protection of user and privileged modes. Some work done by Windows on behalf of the application might appear in other subsystem processes in addition to the privileged time in the process.
This gives an indication of the CPU time being spent in the operating system by the process. This number will probably be higher for processes doing significant amounts of I/O or repeatedly allocating and freeing memory.
Recommended Scale: 1.0
15

Counter Definition Guidance
IO Read Bytes/sec The rate at which the process is reading bytes from I/O operations. This counter counts all I/O activity generated by the process to include file, network and device I/Os.
Compare this with Logical Disk\Disk Read Bytes Sec. If file data is cached in the Windows Cache Manager, many read operations will not physically impact the disk. However, the read operations will still be reflected in IO Read Bytes/sec, so you may see a much lower value for Disk Read Bytes/sec. However, on a stressed system where the cache is being overrun, these values should be closer together.
Recommended Scale: 0.000001
IO Write Bytes/sec The rate at which the process is writing bytes to I/O operations. This counter counts all I/O activity generated by the process to include file, network and device I/Os.
Compare this with Logical Disk\Disk Write Bytes Sec. The Windows Cache Manager lazily writes file data to disk from the file cache. If the file is removed before it is physically written to disk, then you may see a much lower value for Disk Write Bytes/sec. Write operations will still be reflected in IO Write Bytes/sec. However, on a stressed system where the cache is being overrun, these values should be closer together.
Recommended Scale: 0.000001
Working Set Working Set is the current size, in bytes, of the Working Set of this process. The Working Set is the set of memory pages touched recently by the threads in the process. If free memory in the computer is above a threshold, pages are left in the Working Set of a process even if they are not in use. When free memory falls below a threshold, pages are trimmed from Working Sets. If they are needed they will then be soft-faulted back into the Working Set before leaving main memory.
Compare this with Memory\Committed Bytes. If the application is the main consumer of memory, then Working Set will be approach the value of Committed Bytes.
Recommended Scale: 0.0000001
TYING HOST MONITOR RESULTS TO SAS LOGS
If you output the system date and time at the start of your performance logs, those monitors which don’t timestamp each interval entry can be calculated in time by adding the interval amount to the beginning time stamp successively. The same can be done in the SAS output log. The timestamp generated by the header information in Attachment (A) can be roughly added to the real time of each step to yield an approximate beginning and end of each job step.
By doing this you can equate the external monitors intervals with the SAS job steps in the log, and correlate any monitor “hotspots” from the tables above to the SAS FULLSTIMER information in the log. This match-up will tell you what your system was experiencing at the time of the job-step run. This correlation will prove valuable in helping to guide your tuning efforts.
WHEN TUNING ISN’T ENOUGH
If your expectations cannot be met by adding or tuning your host system or storage array, you are left to the gains that can be made via changes to your SAS code and processes as noted above. Go back and look at them again to see if they can be made any more efficient.
If the problem relies on server load, you can work with your Systems Administrator to use nice, kernel parameters, or any employed third-party resource managers to allocate you the maximum resources and business priority that the system can allow you.
RESOURCE MANAGERS
If you find yourself on a very crowded system with a mixed workload, you may need to consider a resource manager. The major vendors provide them, and they can be very effectively used in prioritizing users and workloads, and allocating resources to particular groups to ensure the critical things get done on systems that cannot be expanded. A few examples of resource managers are: ♦ Sun – Solaris Resource Manager ♦ HP – Workload Manager
16

♦ IBM – Workload Manager
Contact your hardware vendor to discuss the options available to you, and their costs and benefits.
SUMMARY
This paper discussed an iterative, disciplined approach to diagnose performance problems with the SAS System. It detailed the employment and interpretation of the most commonly available host-based performance monitors, to help understand what resource bottlenecks existed during the job run. Finally it detailed how to overlay this information with SAS logs to reconcile episodes of bad performance on the host and storage systems to the SAS job steps. This process can help quickly identify the performance restraints with SAS processes, and in doing so, lead to their quick resolution.
ACKNOWLEDGMENTS
This paper is a compilation of the work and experience of SAS R&D personnel, including Leigh Ihnen, Margaret Crevar, myself and others; as well as years of collaboration with our Hardware Vendor Partners, SUN, IBM, HP, Intel, UNISYS, and others.
RECOMMENDED READING
Please see our Hardware Vendor Partner white papers and pages at:
http://www.sas.com/partners/directory/hp/papers.html
http://www.sas.com/partners/directory/ibm/papers.html
http://www.sas.com/partners/directory/intel/papers.html
http://www.sas.com/partners/directory/sun/papers.html
http://www.sas.com/partners/directory/unisys/papers.html
SAS®R&D White Papers:
http://support.sas.com/rnd/scalability/papers/solve_perf.pdf
Microsoft® White Papers:
http://www.microsoft.com/technet/archive/mcis/perfmon.mspx
CONTACT INFORMATION
Your comments and questions are valued and encouraged. Contact the author at:
Tony Brown SAS Performance Lab Host Systems Research & Development SAS Institute Inc., 15455 N. Dallas Pkwy, Dallas, TX 75001 Work phone: (214) 977-3916 Fax: (2214) 977-3921 [email protected]
SAS and all other SAS Institute Inc. product or service names are registered trademarks or trademarks of SAS Institute Inc. in the USA and other countries. ® indicates USA registration.
Other brand and product names are trademarks of their respective companies.
17

18

ATTACHMENT (A) – LOG INFORMATION MACRO
/********************************************************************* * LOG INFO MACRO CODE - DO NOT EDIT * This section controls information printed to the log for * performance analysis. *********************************************************************/ options fmterr fullstimer source source2 mprint notes msglevel=i; Proc options group=memory; Proc options group=performance; Run; Libname _ALL_ list; %macro loginfo; data _null_; temp=datetime(); temp2=lowcase(trim(left(put(temp,datetime16.)))); call symput('datetime', trim(temp2)); %if ( &SYSSCP = WIN ) %then call symput('host', "%sysget(computername)"); %else call symput('host', "%sysget(HOST)"); ; run; %put LOG HEADER BEGIN; %put LOG HEADER os=&sysscp; %put LOG HEADER os2=&sysscpl; %put LOG HEADER host=&host; %put LOG HEADER ver=&sysvlong; %put LOG HEADER date=&datetime; %put LOG HEADER parm=&sysparm; proc options option=MEMSIZE; run; proc options option=SUMSIZE; run; proc options option=SORTSIZE; run; %put LOG HEADER END; %mend loginfo; %loginfo; run;
19

ATTACHMENT (B) – SOLARIS MONITOR SCRIPT
#################################################################### # INSTRUCTIONS: # This script is for SOLARIS systems. Some of these commands # are only available for this operating system. # # To run this script, make sure the permissions on solarismonitor.txt # are an octal that will allow execution - easiest is 777. # after solarismonitor.txt is copied to your host enter on the command line: # chmod 777 solarismonitor.txt # If you do not have permission to do this, have it done as root by the # sysadmin # # To execute solarismonitor.txt # On the command line of your home directory enter: # # nohup ./solarismonitor.txt date interval count # # You must fill the date interval and count variables above. # nohup iostat -csD be in format DDMMYYYY. # # # Interval tells the monitor how often to collect statistics # Count tells the monitor how often to do it # # ##################################################################### # Do NOT EDIT BELOW THIS LINE ##################################################################### # Start the iostat monitor # iostat reports I/O statistics. date > $1.solarisiostat echo 'Interval' $2 >> $1.solarisiostat echo 'Count' $3 >> $1.solarisiostat nohup iostat -cdDemMpsxX $2 $3 >> $1.solarisiostat & # Start the sar monitor # sar is a system activity reporter. In this case we are # collecting all information on all processes running. The # piping to /dev/null is to keep sar from echoing data back # to the terminal screen. # NOTE: YOU MAY HAVE TO BE ROOT TO RUN SAR ON SOLARIS # If so, have your SYSADMIN execute this script nohup sar -A -o $1.solarissar $2 $3 > /dev/null & # Start the vmstat monitor # Output is piped to solarisvmstat.txt date > $1.solarisvmstat echo 'Interval' $2 >>$1.solarisvmstat echo 'Count' $3 >> $1.solarisvmstat nohup vmstat $2 $3 >> $1.solarisvmstat & # Start the mpstat monitor
20

date > $1.solarismpstat echo 'Interval' $2 >> $1.solarismpstat echo 'Count' $3 >> $1.solarismpstat mpstat -p $2 $3 >> $1.solarismpstat & # Start the ps monitor # Use ps to gather information regarding what processes are running # on the server and what resources they are using # Output is piped to solarisps.log date>solarisps.log echo 'Count' $2 >> solarisps.log echo 'Interval' $3 >> solarisps.log i=1 while [ $i -le $3 ] do ps -eo user,pid,ppid,etime,pcpu,args >> solarisps.log sleep $2 i=`expr $i + 1` done echo "All Done..."
21
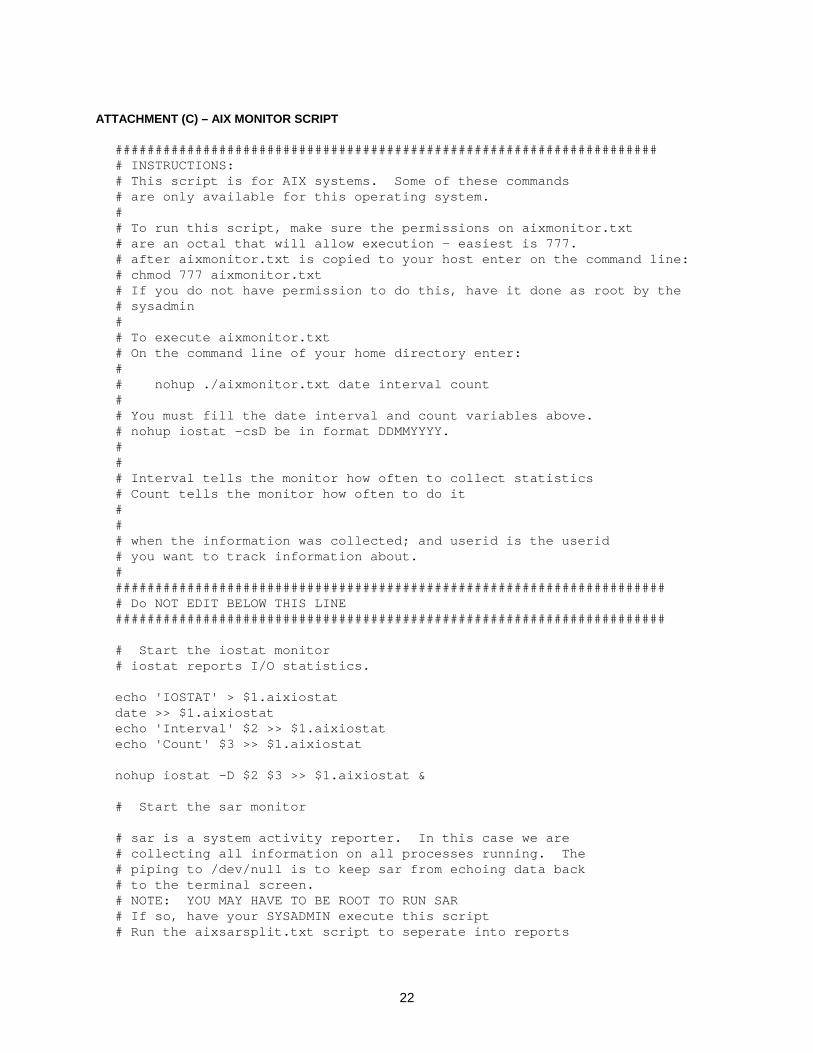
ATTACHMENT (C) – AIX MONITOR SCRIPT
#################################################################### # INSTRUCTIONS: # This script is for AIX systems. Some of these commands # are only available for this operating system. # # To run this script, make sure the permissions on aixmonitor.txt # are an octal that will allow execution - easiest is 777. # after aixmonitor.txt is copied to your host enter on the command line: # chmod 777 aixmonitor.txt # If you do not have permission to do this, have it done as root by the # sysadmin # # To execute aixmonitor.txt # On the command line of your home directory enter: # # nohup ./aixmonitor.txt date interval count # # You must fill the date interval and count variables above. # nohup iostat -csD be in format DDMMYYYY. # # # Interval tells the monitor how often to collect statistics # Count tells the monitor how often to do it # # # when the information was collected; and userid is the userid # you want to track information about. # ##################################################################### # Do NOT EDIT BELOW THIS LINE ##################################################################### # Start the iostat monitor # iostat reports I/O statistics. echo 'IOSTAT' > $1.aixiostat date >> $1.aixiostat echo 'Interval' $2 >> $1.aixiostat echo 'Count' $3 >> $1.aixiostat nohup iostat -D $2 $3 >> $1.aixiostat & # Start the sar monitor # sar is a system activity reporter. In this case we are # collecting all information on all processes running. The # piping to /dev/null is to keep sar from echoing data back # to the terminal screen. # NOTE: YOU MAY HAVE TO BE ROOT TO RUN SAR # If so, have your SYSADMIN execute this script # Run the aixsarsplit.txt script to seperate into reports
22

nohup sar -A -o $1.aixsar $2 $3 > /dev/null & # Start the vmstat monitor # Output is piped to aixvmstat.txt echo 'VMSTAT' > $1.aixvmstat date >> $1.aixvmstat echo 'Interval' $2 >>$1.aixvmstat echo 'Count' $3 >> $1.aixvmstat nohup vmstat $2 $3 >> $1.aixvmstat & # Start the mpstat monitor echo 'MPSTAT' > $1.aixmpstat date >> $1.aixmpstat echo 'Interval' $2 >> $1.aixmpstat echo 'Count' $3 >> $1.aixmpstat mpstat $2 $3 >> $1.aixmpstat & # Start the ps monitor # Use ps to gather information regarding what processes are running # on the server and what resources they are using # Output is piped to ps2.log echo 'PS' > aixps2.log date>>aixps2.log echo 'Count' $2 >> aixps2.log echo 'Interval' $3 >> aixps2.log i=1 while [ $i -le $3 ] do ps -eo user,pid,ppid,etime,pcpu,etime,args >> aixps2.log sleep $2 i=`expr $i + 1` done echo "All Done..."
23

ATTACHMENT (D) – HP MONITOR SCRIPT
#################################################################### # INSTRUCTIONS: # This script is for HP-UX systems. Many of these commands # are only available for this operating system. # # To run this script, make sure the permissions on aixmonitor.txt # are an octal that will allow execution - easiest is 777. # after hpmonitor.txt is copied to your host enter on the command line: # chmod 777 hpmonitor.txt # If you do not have permission to do this, have it done as root by the # sysadmin # # To execute ./hpmonitor.txt # On the command line of your home directory enter: # # nohup ./hpmonitor.txt date interval count # # You must fill the date interval and count variables above. # # Interval tells the monitor how often to collect statistics # Count tells the monitor how often to do it # # # when the information was collected; and userid is the userid # you want to track information about. # ##################################################################### # Do NOT EDIT BELOW THIS LINE ##################################################################### # Start the iostat monitor # iostat reports I/O statistics. The command below is for HP-UX 11.11 and # 11.12. echo 'IOSTAT' > $1.hpiostat echo 'Interval' $2 >> $1.hpiostat echo 'Count' $3 >> $1.hpiostat date >> $1.hpiostat nohup iostat $2 $3 >> $1.hpiostat & # Start the sar monitor # sar is a system activity reporter. In this case we are # collecting all information on all processes running. The # piping to /dev/null is to keep sar from echoing data back # to the terminal screen. # NOTE: YOU MAY HAVE TO BE ROOT TO RUN SAR ON HP nohup sar -A -o $1.hpsar $2 $3 > /dev/null & # Start the vmstat monitor
24

# Output is piped to hpvmstat.txt echo 'VMSTAT' > $1.hpvmstat echo 'Interval' $2 >> $1.hpvmstat echo 'Count' $3 >> $1.hpvmstat date >> $1.hpvmstat nohup vmstat -S $2 $3 >> $1.hpvmstat & # Start the ps monitor # Use ps to gather information regarding what processes are running # on the server and what resources they are using # Output is piped to hpps1.log and hpps2.log echo 'PS' > $1.hpps.log echo 'Interval' $2 >> $1.hpps.log echo 'Count' $3 >> $1.hpps.log date >> $1.hpps.log i=1 while [ $i -le $3 ] do ps -ef >> hpps.log sleep $2 i=`expr $i + 1` done
25

ATTACHMENT (E) – LINUX MONITOR SCRIPT
########################################################################## # INSTRUCTIONS: # This script is only for Linux Redhat Systems. Some of the flags on # these commands are only available for this operating system for this # particular type of output. # # To run this script, make sure the permissions on linuxmonitor.txt # are an octal that will allow execution - max is 777. # After linuxmonitor.txt is copied to your host enter on the command line: # chmod 777 linuxmonitor.txt. # # If you do not have permission to do this , have it done as root by the # systems administrator. # # To execute linuxmonitor.txt, on the command line of your home directory enter: # # nohup ./linuxmonitor.txt data interval count sasworkdir # # You must fill hte date interval and count variables above. # # Interval tells the monitor how often to collect statistics. # Count tells the monitor how often to do it. # # ############################################################################# # DO NOT EDIT BELOW THIS LINE ############################################################################### # Start the IOSTAT Monitor echo 'IOSTAT' > $1.linuxiostat echo 'Interval' $2 >> $1.linuxiostat echo 'Count' $3 >> $1.linuxiostat date >> $1.linuxiostat nohup iostat -kt $2 $3 >> $1.linuxiostat & # Start the sar Monitor - Note: You may have to be root to run sar. nohup sar -A -o $1.linuxsar $2 $3 > /dev/null & # Start the VMSTAT Monitor echo 'VMSTAT' > $1.linuxvmstat echo 'Interval' $2 >> $1.linuxvmstat echo 'Count' $3 >> $1.linuxvmstat date >> $1.linuxvmstat nohup vmstat $2 $3 >> $1.linuxvmstat & # Start the MPSTAT Monitor echo 'MPSTAT' > $1.linuxmpstat echo 'Interval' $2 >> $1.linuxmpstat echo 'Count' $3 >> $1.linuxmpstat date >> $1.linuxmpstat nohup mpstat $2 $3 >> $1.linuxmpstat & # Start the ps monitor - it must run in a loop echo 'PS' > linuxps.log
26

echo 'Interval' $2 >> linuxps.log echo 'Count' $3 >> linuxps.log i=1 while [ $i -le $3 ] do date >> linuxps.log ps -eo user,pid,ppid,etime,pcpu,args >> linuxps.log sleep $2 i='expr $i + 1' done
27

ATTACHMENT (F) – SOLARIS SAR REPORT GENERATION
#################################################################### # INSTRUCTIONS: # This script is for SOLARIS systems. Some of these commands # are only available for this operating system. # # To run this script, make sure the permissions on solsarsplit.txt # are an octal that will allow execution - easiest is 777. # after solsarsplit.txt is copied to your host enter on the command line: # chmod 777 solsarsplit.txt # If you do not have permission to do this, have it done as root by the # sysadmin # # To execute solarismonitor.txt # On the command line of your home directory enter: # # nohup ./solsarsplit.txt sarfile # # You must fill the name of the sar file in above. this name came from # solarismonitor.txt and is a date preceeding a period followed by # 'solarissar' # ##################################################################### # Do NOT EDIT BELOW THIS LINE ##################################################################### # Start the iostat monitor # iostat reports I/O statistics. nohup sar -a -f $1 > solsara.txt & nohup sar -b -f $1 > solsarb.txt & nohup sar -c -f $1 > solsarc.txt & nohup sar -d -f $1 > solsard.txt & nohup sar -g -f $1 > solsarg.txt & nohup sar -p -f $1 > solsarp.txt & nohup sar -q -f $1 > solsarq.txt & nohup sar -r -f $1 > solsarr.txt & nohup sar -u -f $1 > solsaru.txt & nohup sar -w -f $1 > solsarw.txt &
28
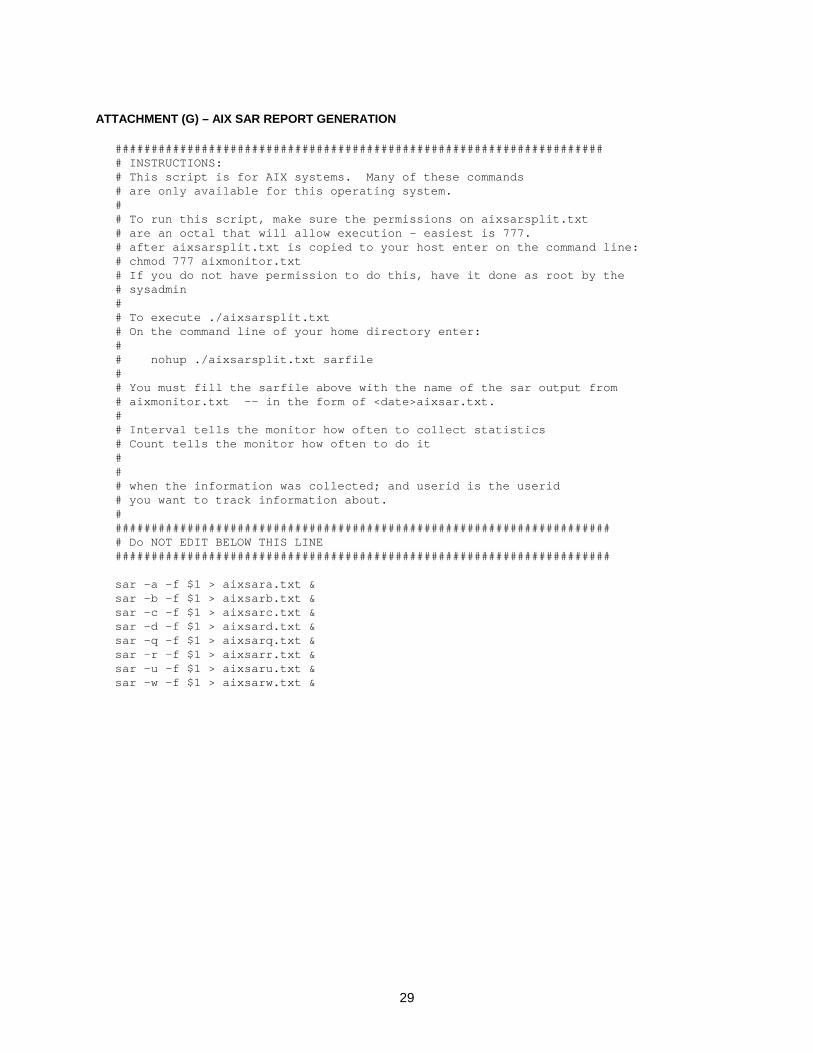
ATTACHMENT (G) – AIX SAR REPORT GENERATION
#################################################################### # INSTRUCTIONS: # This script is for AIX systems. Many of these commands # are only available for this operating system. # # To run this script, make sure the permissions on aixsarsplit.txt # are an octal that will allow execution - easiest is 777. # after aixsarsplit.txt is copied to your host enter on the command line: # chmod 777 aixmonitor.txt # If you do not have permission to do this, have it done as root by the # sysadmin # # To execute ./aixsarsplit.txt # On the command line of your home directory enter: # # nohup ./aixsarsplit.txt sarfile # # You must fill the sarfile above with the name of the sar output from # aixmonitor.txt -- in the form of <date>aixsar.txt. # # Interval tells the monitor how often to collect statistics # Count tells the monitor how often to do it # # # when the information was collected; and userid is the userid # you want to track information about. # ##################################################################### # Do NOT EDIT BELOW THIS LINE ##################################################################### sar -a -f $1 > aixsara.txt & sar -b -f $1 > aixsarb.txt & sar -c -f $1 > aixsarc.txt & sar -d -f $1 > aixsard.txt & sar -q -f $1 > aixsarq.txt & sar -r -f $1 > aixsarr.txt & sar -u -f $1 > aixsaru.txt & sar -w -f $1 > aixsarw.txt &
29

ATTACHMENT (H) – HP SAR REPORT GENERATION
#################################################################### # INSTRUCTIONS: # This script is for HP-UX systems. Many of these commands # are only available for this operating system. # # To run this script, make sure the permissions on hpsarsplit.txt # are an octal that will allow execution - easiest is 777. # after hpsarsplit.txt is copied to your host enter on the command line: # chmod 777 hpmonitor.txt # If you do not have permission to do this, have it done as root by the # sysadmin # # To execute ./hpsarsplit.txt # On the command line of your home directory enter: # # nohup ./hpsarsplit.txt sarfile # # You must fill the sarfile in above with the name of the sar output # file from hpmonitor.txt -- in the form of <date>hpsar.txt # ##################################################################### # Do NOT EDIT BELOW THIS LINE ##################################################################### nohup sar -a -f $1 > hpsara.txt & nohup sar -b -f $1 > hpsarb.txt & nohup sar -c -f $1 > hpsarc.txt & nohup sar -d -f $1 > hpsard.txt & nohup sar -q -f $1 > hpsarq.txt & nohup sar -u -f $1 > hpsaru.txt & nohup sar -w -f $1 > hpsarw.txt &
30

ATTACHMENT (I) – LINUX SAR REPORT GENERATION
########################################################################## # INSTRUCTIONS: # This script is only for Linux Redhat Systems. Some of the flags on # these commands are only available for this operating system for this # particular type of output. # # To run this script, make sure the permissions on linsarsplit.txt # are an octal that will allow execution - max is 777. # After linuxmonitor.txt is copied to your host enter on the command line: # chmod 777 linsarsplit.txt. # # If you do not have permission to do this , have it done as root by the # systems administrator. # # To execute linsarsplit.txt, on the command line of your home directory enter: # # nohup ./linsarsplit.txt sarfile # # You must fill the sarfile above. It is the name of the sar output generated # by linuxmonitor.txt in the form of <date>sar.txt # # ############################################################################# # DO NOT EDIT BELOW THIS LINE ############################################################################### nohup sar -b -f $1 > linuxsarb.txt & nohup sar -d -f $1 > linuxsard.txt & nohup sar -q -f $1 > linuxsarq.txt & nohup sar -r -f $1 > linuxsarr.txt & nohup sar -u -f $1 > linuxsaru.txt & nohup sar -w -f $1 > solsarw.txt & nohup sar -W -f $1 > solsarW.txt &
31