somalia: who and unicef estimates of immunization coverage ... · somalia: who and unicef estimates...
TRANSCRIPT
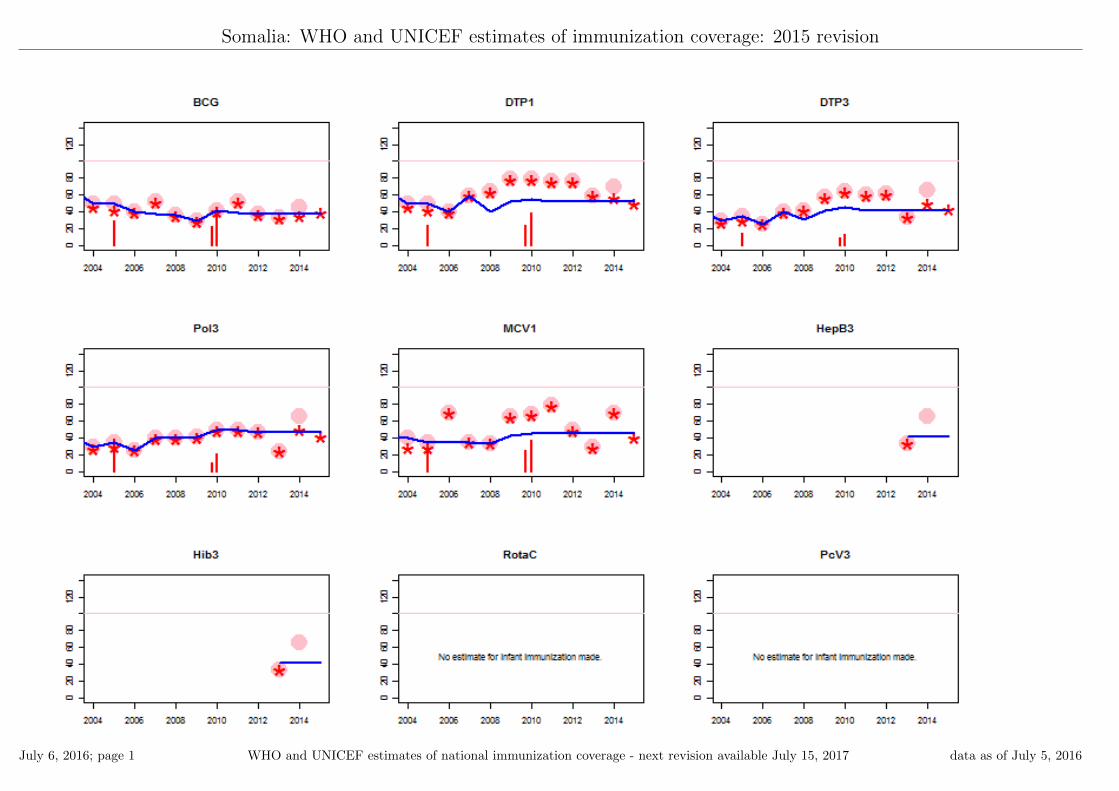
Somalia: WHO and UNICEF estimates of immunization coverage: 2015 revision
July 6, 2016; page 1 WHO and UNICEF estimates of national immunization coverage - next revision available July 15, 2017 data as of July 5, 2016
Somalia - BCG
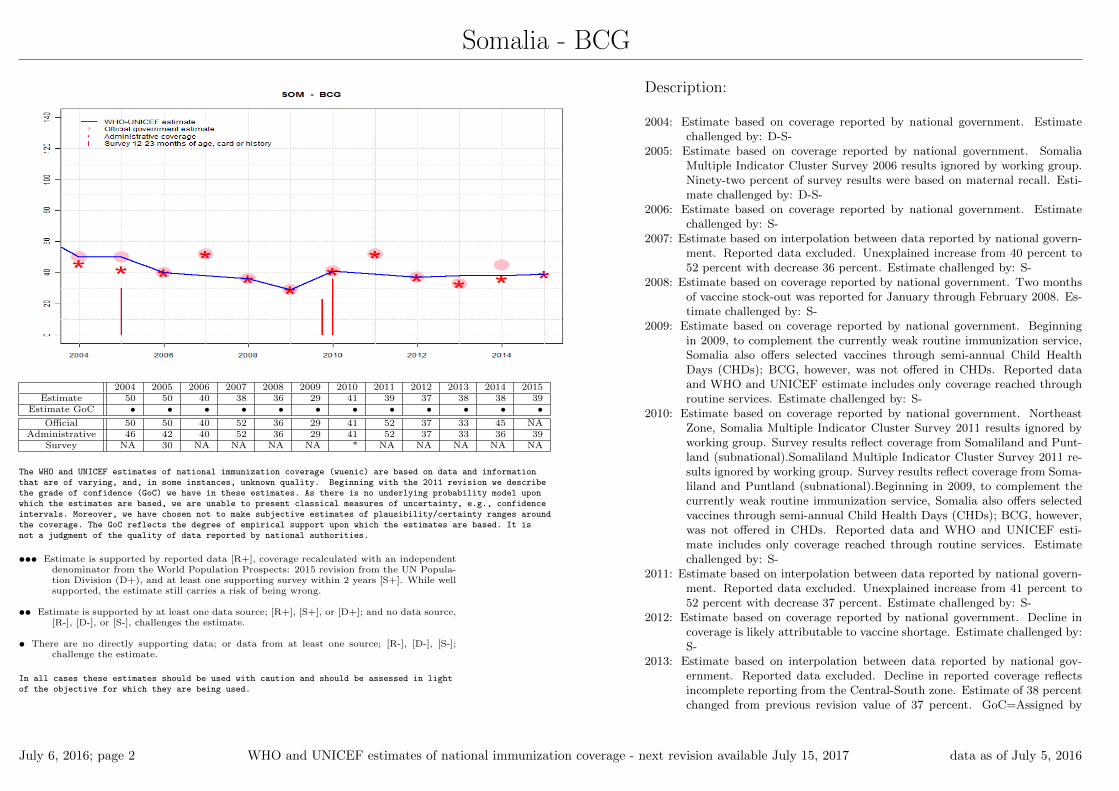
2004 2005 2006 2007 2008 2009 2010 2011 2012 2013 2014 2015Estimate 50 50 40 38 36 29 41 39 37 38 38 39
Estimate GoC • • • • • • • • • • • •Official 50 50 40 52 36 29 41 52 37 33 45 NA
Administrative 46 42 40 52 36 29 41 52 37 33 36 39Survey NA 30 NA NA NA NA * NA NA NA NA NA
The WHO and UNICEF estimates of national immunization coverage (wuenic) are based on data and informationthat are of varying, and, in some instances, unknown quality. Beginning with the 2011 revision we describethe grade of confidence (GoC) we have in these estimates. As there is no underlying probability model uponwhich the estimates are based, we are unable to present classical measures of uncertainty, e.g., confidenceintervals. Moreover, we have chosen not to make subjective estimates of plausibility/certainty ranges aroundthe coverage. The GoC reflects the degree of empirical support upon which the estimates are based. It isnot a judgment of the quality of data reported by national authorities.
••• Estimate is supported by reported data [R+], coverage recalculated with an independentdenominator from the World Population Prospects: 2015 revision from the UN Popula-tion Division (D+), and at least one supporting survey within 2 years [S+]. While wellsupported, the estimate still carries a risk of being wrong.
•• Estimate is supported by at least one data source; [R+], [S+], or [D+]; and no data source,[R-], [D-], or [S-], challenges the estimate.
• There are no directly supporting data; or data from at least one source; [R-], [D-], [S-];challenge the estimate.
In all cases these estimates should be used with caution and should be assessed in lightof the objective for which they are being used.
Description:
2004: Estimate based on coverage reported by national government. Estimatechallenged by: D-S-
2005: Estimate based on coverage reported by national government. SomaliaMultiple Indicator Cluster Survey 2006 results ignored by working group.Ninety-two percent of survey results were based on maternal recall. Esti-mate challenged by: D-S-
2006: Estimate based on coverage reported by national government. Estimatechallenged by: S-
2007: Estimate based on interpolation between data reported by national govern-ment. Reported data excluded. Unexplained increase from 40 percent to52 percent with decrease 36 percent. Estimate challenged by: S-
2008: Estimate based on coverage reported by national government. Two monthsof vaccine stock-out was reported for January through February 2008. Es-timate challenged by: S-
2009: Estimate based on coverage reported by national government. Beginningin 2009, to complement the currently weak routine immunization service,Somalia also offers selected vaccines through semi-annual Child HealthDays (CHDs); BCG, however, was not offered in CHDs. Reported dataand WHO and UNICEF estimate includes only coverage reached throughroutine services. Estimate challenged by: S-
2010: Estimate based on coverage reported by national government. NortheastZone, Somalia Multiple Indicator Cluster Survey 2011 results ignored byworking group. Survey results reflect coverage from Somaliland and Punt-land (subnational).Somaliland Multiple Indicator Cluster Survey 2011 re-sults ignored by working group. Survey results reflect coverage from Soma-liland and Puntland (subnational).Beginning in 2009, to complement thecurrently weak routine immunization service, Somalia also offers selectedvaccines through semi-annual Child Health Days (CHDs); BCG, however,was not offered in CHDs. Reported data and WHO and UNICEF esti-mate includes only coverage reached through routine services. Estimatechallenged by: S-
2011: Estimate based on interpolation between data reported by national govern-ment. Reported data excluded. Unexplained increase from 41 percent to52 percent with decrease 37 percent. Estimate challenged by: S-
2012: Estimate based on coverage reported by national government. Decline incoverage is likely attributable to vaccine shortage. Estimate challenged by:S-
2013: Estimate based on interpolation between data reported by national gov-ernment. Reported data excluded. Decline in reported coverage reflectsincomplete reporting from the Central-South zone. Estimate of 38 percentchanged from previous revision value of 37 percent. GoC=Assigned by
July 6, 2016; page 2 WHO and UNICEF estimates of national immunization coverage - next revision available July 15, 2017 data as of July 5, 2016
Somalia - BCG
working group. Consistency with other antigens.2014: Estimate based on interpolation between data reported by national gov-
ernment. Reported data excluded. Decline in coverage is due in part toincomplete reporting. WHO and UNICEF recommend continued focus onimproved recording and monitoring of immunization service delivery andperiodic independent coverage assessment in addition to improving cover-age of immunization services. Programme reports a 2 month stock-out atnational level. Estimate of 38 percent changed from previous revision valueof 37 percent. GoC=Assigned by working group. Unexplained increase intarget population between 2014 and 2015.
2015: Estimate based on reported administrative data. WHO and UNICEF rec-ommend continued focus on improved recording and monitoring of immu-nization service delivery and periodic independent coverage assessment inaddition to improving coverage of immunization services. Programme re-ports a national level stock-out of two months. GoC=Assigned by workinggroup. Unexplained increase in target population between 2014 and 2015.
July 6, 2016; page 3 WHO and UNICEF estimates of national immunization coverage - next revision available July 15, 2017 data as of July 5, 2016
Somalia - DTP1
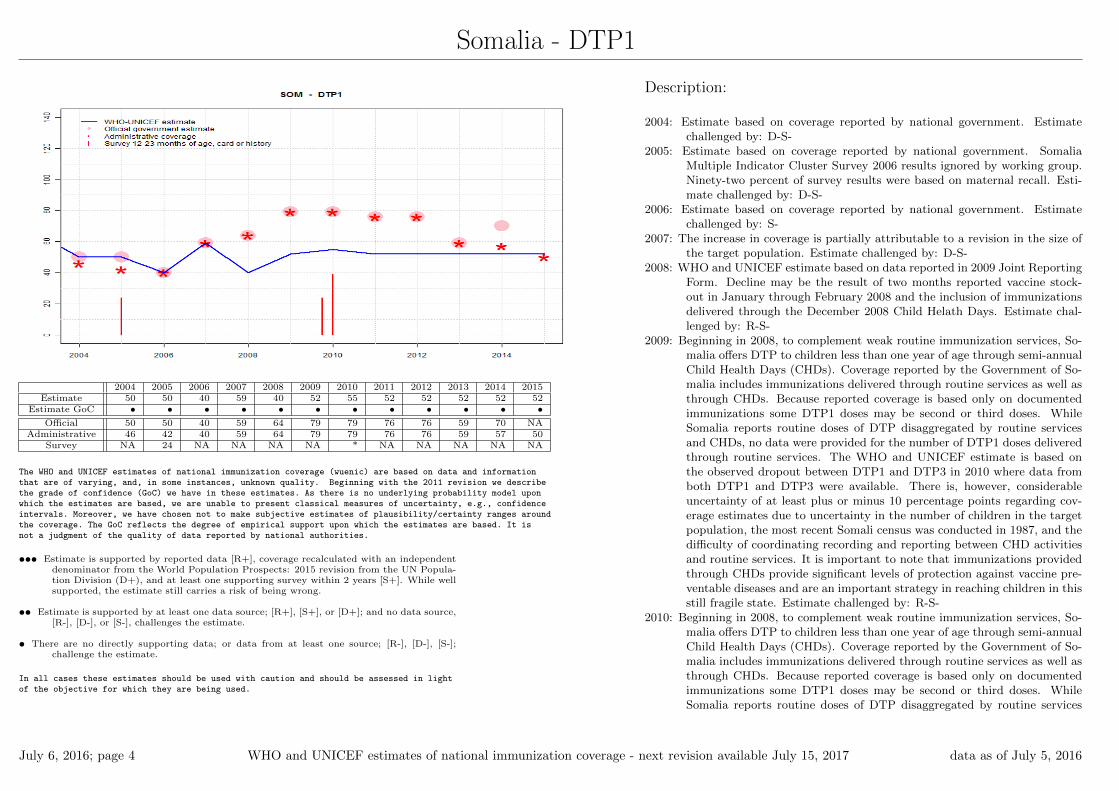
2004 2005 2006 2007 2008 2009 2010 2011 2012 2013 2014 2015Estimate 50 50 40 59 40 52 55 52 52 52 52 52
Estimate GoC • • • • • • • • • • • •Official 50 50 40 59 64 79 79 76 76 59 70 NA
Administrative 46 42 40 59 64 79 79 76 76 59 57 50Survey NA 24 NA NA NA NA * NA NA NA NA NA
The WHO and UNICEF estimates of national immunization coverage (wuenic) are based on data and informationthat are of varying, and, in some instances, unknown quality. Beginning with the 2011 revision we describethe grade of confidence (GoC) we have in these estimates. As there is no underlying probability model uponwhich the estimates are based, we are unable to present classical measures of uncertainty, e.g., confidenceintervals. Moreover, we have chosen not to make subjective estimates of plausibility/certainty ranges aroundthe coverage. The GoC reflects the degree of empirical support upon which the estimates are based. It isnot a judgment of the quality of data reported by national authorities.
••• Estimate is supported by reported data [R+], coverage recalculated with an independentdenominator from the World Population Prospects: 2015 revision from the UN Popula-tion Division (D+), and at least one supporting survey within 2 years [S+]. While wellsupported, the estimate still carries a risk of being wrong.
•• Estimate is supported by at least one data source; [R+], [S+], or [D+]; and no data source,[R-], [D-], or [S-], challenges the estimate.
• There are no directly supporting data; or data from at least one source; [R-], [D-], [S-];challenge the estimate.
In all cases these estimates should be used with caution and should be assessed in lightof the objective for which they are being used.
Description:
2004: Estimate based on coverage reported by national government. Estimatechallenged by: D-S-
2005: Estimate based on coverage reported by national government. SomaliaMultiple Indicator Cluster Survey 2006 results ignored by working group.Ninety-two percent of survey results were based on maternal recall. Esti-mate challenged by: D-S-
2006: Estimate based on coverage reported by national government. Estimatechallenged by: S-
2007: The increase in coverage is partially attributable to a revision in the size ofthe target population. Estimate challenged by: D-S-
2008: WHO and UNICEF estimate based on data reported in 2009 Joint ReportingForm. Decline may be the result of two months reported vaccine stock-out in January through February 2008 and the inclusion of immunizationsdelivered through the December 2008 Child Helath Days. Estimate chal-lenged by: R-S-
2009: Beginning in 2008, to complement weak routine immunization services, So-malia offers DTP to children less than one year of age through semi-annualChild Health Days (CHDs). Coverage reported by the Government of So-malia includes immunizations delivered through routine services as well asthrough CHDs. Because reported coverage is based only on documentedimmunizations some DTP1 doses may be second or third doses. WhileSomalia reports routine doses of DTP disaggregated by routine servicesand CHDs, no data were provided for the number of DTP1 doses deliveredthrough routine services. The WHO and UNICEF estimate is based onthe observed dropout between DTP1 and DTP3 in 2010 where data fromboth DTP1 and DTP3 were available. There is, however, considerableuncertainty of at least plus or minus 10 percentage points regarding cov-erage estimates due to uncertainty in the number of children in the targetpopulation, the most recent Somali census was conducted in 1987, and thedifficulty of coordinating recording and reporting between CHD activitiesand routine services. It is important to note that immunizations providedthrough CHDs provide significant levels of protection against vaccine pre-ventable diseases and are an important strategy in reaching children in thisstill fragile state. Estimate challenged by: R-S-
2010: Beginning in 2008, to complement weak routine immunization services, So-malia offers DTP to children less than one year of age through semi-annualChild Health Days (CHDs). Coverage reported by the Government of So-malia includes immunizations delivered through routine services as well asthrough CHDs. Because reported coverage is based only on documentedimmunizations some DTP1 doses may be second or third doses. WhileSomalia reports routine doses of DTP disaggregated by routine services
July 6, 2016; page 4 WHO and UNICEF estimates of national immunization coverage - next revision available July 15, 2017 data as of July 5, 2016
Somalia - DTP1
and CHDs, no data were provided for the number of DTP1 doses deliveredthrough routine services. The WHO and UNICEF estimate is based onthe observed dropout between DTP1 and DTP3 in 2010 where data fromboth DTP1 and DTP3 were available. There is, however, considerableuncertainty of at least plus or minus 10 percentage points regarding cov-erage estimates due to uncertainty in the number of children in the targetpopulation, the most recent Somali census was conducted in 1987, and thedifficulty of coordinating recording and reporting between CHD activitiesand routine services. It is important to note that immunizations providedthrough CHDs provide significant levels of protection against vaccine pre-ventable diseases and are an important strategy in reaching children in thisstill fragile state. Northeast Zone, Somalia Multiple Indicator Cluster Sur-vey 2011 results ignored by working group. Survey results reflect coveragefrom Somaliland and Puntland (subnational).Somaliland Multiple Indica-tor Cluster Survey 2011 results ignored by working group. Survey resultsreflect coverage from Somaliland and Puntland (subnational). Estimatechallenged by: R-S-
2011: Reported data calibrated to 2010 levels. Routine immunization is deliv-ered through fixed sites complemented by Child Health Days (CHD). Thisstrategy of supplementing the routine immunization has been in place forthe last 4 years; and has contributed to the improvement of immunizationcoverage. Estimate challenged by: S-
2012: Reported data calibrated to 2010 levels. See comment from previous year.Estimate challenged by: S-
2013: Reported data calibrated to 2010 levels. Reported data excluded. Declinein reported coverage reflects incomplete reporting from the Central-Southzone.Reported data excluded. Decline in reported coverage from 76 per-cent to 59 percent with increase to 70 percent. DTP-HepB-Hib pentavalentvaccine introduced in April 2013. Decline in reported coverage reflects areduction in scope of Child Health Days and incomplete reporting from theCentral-South zone. GoC=Assigned by working group. Consistency withother antigens.
2014: Reported data calibrated to 2010 levels. Reported data excluded. De-cline in coverage is due in part to incomplete reporting.Reported data ex-cluded. Unexplained increase from 59 percent to 70 percent with decrease50 percent. WHO and UNICEF recommend continued focus on improvedrecording and monitoring of immunization service delivery and periodic in-dependent coverage assessment in addition to improving coverage of immu-nization services. GoC=Assigned by working group. Unexplained increasein target population between 2014 and 2015.
2015: Reported data calibrated to 2010 levels. Reported data excluded. Changein reported coverage from 70 level to 50 percent. WHO and UNICEF rec-ommend continued focus on improved recording and monitoring of immu-nization service delivery and periodic independent coverage assessment in
addition to improving coverage of immunization services. GoC=Assignedby working group. Unexplained increase in target population between 2014and 2015.
July 6, 2016; page 5 WHO and UNICEF estimates of national immunization coverage - next revision available July 15, 2017 data as of July 5, 2016
Somalia - DTP3
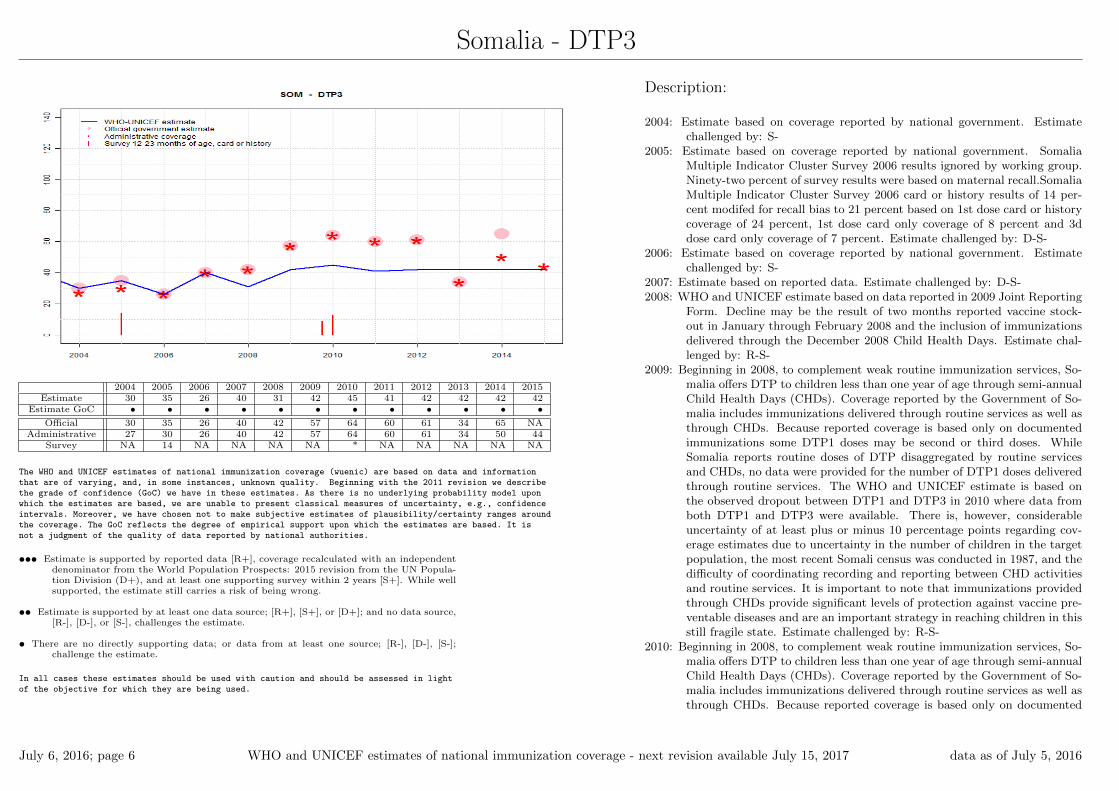
2004 2005 2006 2007 2008 2009 2010 2011 2012 2013 2014 2015Estimate 30 35 26 40 31 42 45 41 42 42 42 42
Estimate GoC • • • • • • • • • • • •Official 30 35 26 40 42 57 64 60 61 34 65 NA
Administrative 27 30 26 40 42 57 64 60 61 34 50 44Survey NA 14 NA NA NA NA * NA NA NA NA NA
The WHO and UNICEF estimates of national immunization coverage (wuenic) are based on data and informationthat are of varying, and, in some instances, unknown quality. Beginning with the 2011 revision we describethe grade of confidence (GoC) we have in these estimates. As there is no underlying probability model uponwhich the estimates are based, we are unable to present classical measures of uncertainty, e.g., confidenceintervals. Moreover, we have chosen not to make subjective estimates of plausibility/certainty ranges aroundthe coverage. The GoC reflects the degree of empirical support upon which the estimates are based. It isnot a judgment of the quality of data reported by national authorities.
••• Estimate is supported by reported data [R+], coverage recalculated with an independentdenominator from the World Population Prospects: 2015 revision from the UN Popula-tion Division (D+), and at least one supporting survey within 2 years [S+]. While wellsupported, the estimate still carries a risk of being wrong.
•• Estimate is supported by at least one data source; [R+], [S+], or [D+]; and no data source,[R-], [D-], or [S-], challenges the estimate.
• There are no directly supporting data; or data from at least one source; [R-], [D-], [S-];challenge the estimate.
In all cases these estimates should be used with caution and should be assessed in lightof the objective for which they are being used.
Description:
2004: Estimate based on coverage reported by national government. Estimatechallenged by: S-
2005: Estimate based on coverage reported by national government. SomaliaMultiple Indicator Cluster Survey 2006 results ignored by working group.Ninety-two percent of survey results were based on maternal recall.SomaliaMultiple Indicator Cluster Survey 2006 card or history results of 14 per-cent modifed for recall bias to 21 percent based on 1st dose card or historycoverage of 24 percent, 1st dose card only coverage of 8 percent and 3ddose card only coverage of 7 percent. Estimate challenged by: D-S-
2006: Estimate based on coverage reported by national government. Estimatechallenged by: S-
2007: Estimate based on reported data. Estimate challenged by: D-S-2008: WHO and UNICEF estimate based on data reported in 2009 Joint Reporting
Form. Decline may be the result of two months reported vaccine stock-out in January through February 2008 and the inclusion of immunizationsdelivered through the December 2008 Child Health Days. Estimate chal-lenged by: R-S-
2009: Beginning in 2008, to complement weak routine immunization services, So-malia offers DTP to children less than one year of age through semi-annualChild Health Days (CHDs). Coverage reported by the Government of So-malia includes immunizations delivered through routine services as well asthrough CHDs. Because reported coverage is based only on documentedimmunizations some DTP1 doses may be second or third doses. WhileSomalia reports routine doses of DTP disaggregated by routine servicesand CHDs, no data were provided for the number of DTP1 doses deliveredthrough routine services. The WHO and UNICEF estimate is based onthe observed dropout between DTP1 and DTP3 in 2010 where data fromboth DTP1 and DTP3 were available. There is, however, considerableuncertainty of at least plus or minus 10 percentage points regarding cov-erage estimates due to uncertainty in the number of children in the targetpopulation, the most recent Somali census was conducted in 1987, and thedifficulty of coordinating recording and reporting between CHD activitiesand routine services. It is important to note that immunizations providedthrough CHDs provide significant levels of protection against vaccine pre-ventable diseases and are an important strategy in reaching children in thisstill fragile state. Estimate challenged by: R-S-
2010: Beginning in 2008, to complement weak routine immunization services, So-malia offers DTP to children less than one year of age through semi-annualChild Health Days (CHDs). Coverage reported by the Government of So-malia includes immunizations delivered through routine services as well asthrough CHDs. Because reported coverage is based only on documented
July 6, 2016; page 6 WHO and UNICEF estimates of national immunization coverage - next revision available July 15, 2017 data as of July 5, 2016
Somalia - DTP3
immunizations some DTP1 doses may be second or third doses. WhileSomalia reports routine doses of DTP disaggregated by routine servicesand CHDs, no data were provided for the number of DTP1 doses deliveredthrough routine services. The WHO and UNICEF estimate is based onthe observed dropout between DTP1 and DTP3 in 2010 where data fromboth DTP1 and DTP3 were available. There is, however, considerableuncertainty of at least plus or minus 10 percentage points regarding cov-erage estimates due to uncertainty in the number of children in the targetpopulation, the most recent Somali census was conducted in 1987, and thedifficulty of coordinating recording and reporting between CHD activitiesand routine services. It is important to note that immunizations providedthrough CHDs provide significant levels of protection against vaccine pre-ventable diseases and are an important strategy in reaching children in thisstill fragile state. Northeast Zone, Somalia Multiple Indicator Cluster Sur-vey 2011 results ignored by working group. Survey results reflect coveragefrom Somaliland and Puntland (subnational).Somaliland Multiple Indica-tor Cluster Survey 2011 results ignored by working group. Survey resultsreflect coverage from Somaliland and Puntland (subnational).NortheastZone, Somalia Multiple Indicator Cluster Survey 2011 card or history re-sults of 9 percent modifed for recall bias to 12 percent based on 1st dosecard or history coverage of 24 percent, 1st dose card only coverage of 8percent and 3d dose card only coverage of 4 percent. Somaliland MultipleIndicator Cluster Survey 2011 card or history results of 13 percent modifedfor recall bias to 18 percent based on 1st dose card or history coverage of39 percent, 1st dose card only coverage of 15 percent and 3d dose card onlycoverage of 7 percent. Estimate challenged by: R-S-
2011: Reported data calibrated to 2010 levels. Routine immunization is deliv-ered through fixed sites complemented by Child Health Days (CHD). Thisstrategy of supplementing the routine immunization has been in place forthe last 4 years; and has contributed to the improvement of immunizationcoverage. Estimate challenged by: S-
2012: Reported data calibrated to 2010 levels. See comment from previous year.Estimate challenged by: S-
2013: Reported data calibrated to 2010 levels. Reported data excluded. Declinein reported coverage reflects incomplete reporting from the Central-Southzone.Reported data excluded. Decline in reported coverage from 61 per-cent to 34 percent with increase to 65 percent. DTP-HepB-Hib pentavalentvaccine introduced in April 2013. Decline in reported coverage reflects areduction in scope of Child Health Days and incomplete reporting fromthe Central-South zone. Estimate challenged by: D-
2014: Reported data calibrated to 2010 levels. Reported data excluded. De-cline in coverage is due in part to incomplete reporting.Reported data ex-cluded. Unexplained increase from 34 percent to 65 percent with decrease44 percent. WHO and UNICEF recommend continued focus on improved
recording and monitoring of immunization service delivery and periodic in-dependent coverage assessment in addition to improving coverage of immu-nization services. GoC=Assigned by working group. Unexplained increasein target population between 2014 and 2015.
2015: Reported data calibrated to 2010 levels. Reported data excluded. Changein reported coverage from 65 level to 44 percent. WHO and UNICEF rec-ommend continued focus on improved recording and monitoring of immu-nization service delivery and periodic independent coverage assessment inaddition to improving coverage of immunization services. GoC=Assignedby working group. Unexplained increase in target population between 2014and 2015.
July 6, 2016; page 7 WHO and UNICEF estimates of national immunization coverage - next revision available July 15, 2017 data as of July 5, 2016
Somalia - Pol3
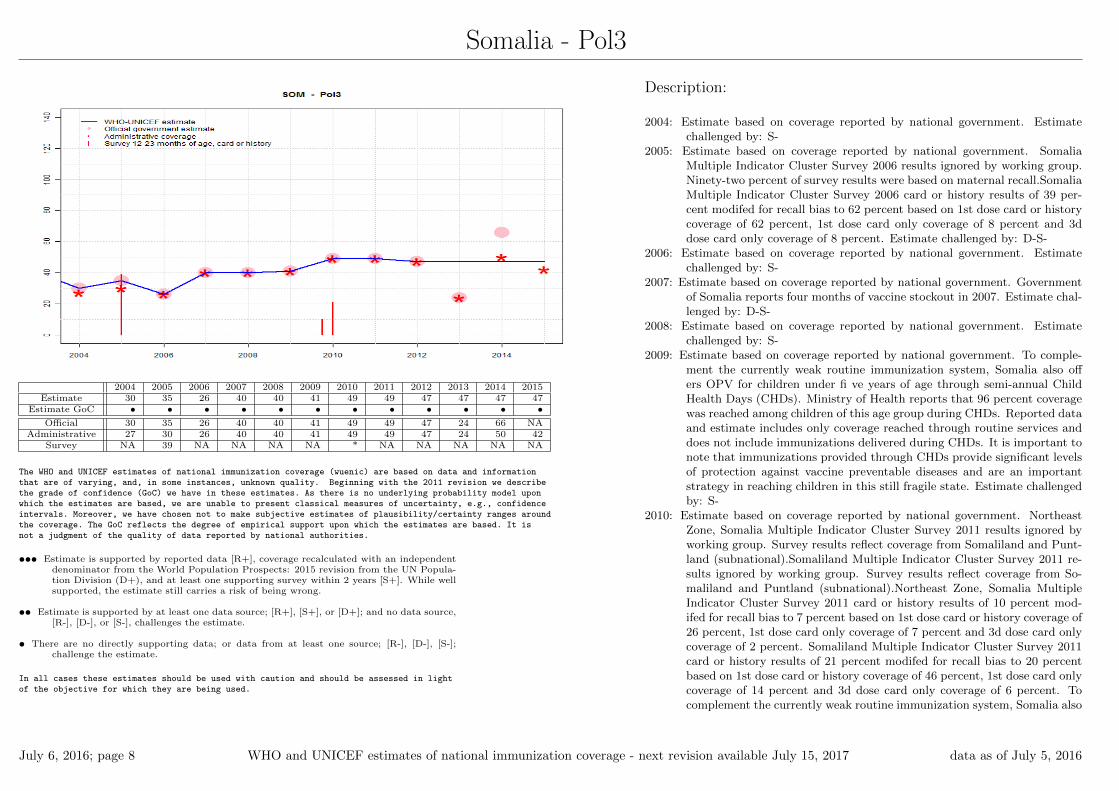
2004 2005 2006 2007 2008 2009 2010 2011 2012 2013 2014 2015Estimate 30 35 26 40 40 41 49 49 47 47 47 47
Estimate GoC • • • • • • • • • • • •Official 30 35 26 40 40 41 49 49 47 24 66 NA
Administrative 27 30 26 40 40 41 49 49 47 24 50 42Survey NA 39 NA NA NA NA * NA NA NA NA NA
The WHO and UNICEF estimates of national immunization coverage (wuenic) are based on data and informationthat are of varying, and, in some instances, unknown quality. Beginning with the 2011 revision we describethe grade of confidence (GoC) we have in these estimates. As there is no underlying probability model uponwhich the estimates are based, we are unable to present classical measures of uncertainty, e.g., confidenceintervals. Moreover, we have chosen not to make subjective estimates of plausibility/certainty ranges aroundthe coverage. The GoC reflects the degree of empirical support upon which the estimates are based. It isnot a judgment of the quality of data reported by national authorities.
••• Estimate is supported by reported data [R+], coverage recalculated with an independentdenominator from the World Population Prospects: 2015 revision from the UN Popula-tion Division (D+), and at least one supporting survey within 2 years [S+]. While wellsupported, the estimate still carries a risk of being wrong.
•• Estimate is supported by at least one data source; [R+], [S+], or [D+]; and no data source,[R-], [D-], or [S-], challenges the estimate.
• There are no directly supporting data; or data from at least one source; [R-], [D-], [S-];challenge the estimate.
In all cases these estimates should be used with caution and should be assessed in lightof the objective for which they are being used.
Description:
2004: Estimate based on coverage reported by national government. Estimatechallenged by: S-
2005: Estimate based on coverage reported by national government. SomaliaMultiple Indicator Cluster Survey 2006 results ignored by working group.Ninety-two percent of survey results were based on maternal recall.SomaliaMultiple Indicator Cluster Survey 2006 card or history results of 39 per-cent modifed for recall bias to 62 percent based on 1st dose card or historycoverage of 62 percent, 1st dose card only coverage of 8 percent and 3ddose card only coverage of 8 percent. Estimate challenged by: D-S-
2006: Estimate based on coverage reported by national government. Estimatechallenged by: S-
2007: Estimate based on coverage reported by national government. Governmentof Somalia reports four months of vaccine stockout in 2007. Estimate chal-lenged by: D-S-
2008: Estimate based on coverage reported by national government. Estimatechallenged by: S-
2009: Estimate based on coverage reported by national government. To comple-ment the currently weak routine immunization system, Somalia also offers OPV for children under fi ve years of age through semi-annual ChildHealth Days (CHDs). Ministry of Health reports that 96 percent coveragewas reached among children of this age group during CHDs. Reported dataand estimate includes only coverage reached through routine services anddoes not include immunizations delivered during CHDs. It is important tonote that immunizations provided through CHDs provide significant levelsof protection against vaccine preventable diseases and are an importantstrategy in reaching children in this still fragile state. Estimate challengedby: S-
2010: Estimate based on coverage reported by national government. NortheastZone, Somalia Multiple Indicator Cluster Survey 2011 results ignored byworking group. Survey results reflect coverage from Somaliland and Punt-land (subnational).Somaliland Multiple Indicator Cluster Survey 2011 re-sults ignored by working group. Survey results reflect coverage from So-maliland and Puntland (subnational).Northeast Zone, Somalia MultipleIndicator Cluster Survey 2011 card or history results of 10 percent mod-ifed for recall bias to 7 percent based on 1st dose card or history coverage of26 percent, 1st dose card only coverage of 7 percent and 3d dose card onlycoverage of 2 percent. Somaliland Multiple Indicator Cluster Survey 2011card or history results of 21 percent modifed for recall bias to 20 percentbased on 1st dose card or history coverage of 46 percent, 1st dose card onlycoverage of 14 percent and 3d dose card only coverage of 6 percent. Tocomplement the currently weak routine immunization system, Somalia also
July 6, 2016; page 8 WHO and UNICEF estimates of national immunization coverage - next revision available July 15, 2017 data as of July 5, 2016
Somalia - Pol3
offers OPV for children under five years of age through semi-annual ChildHealth Days (CHDs). Reported data and estimate include only coveragereached through routine services and does not include immunizations de-livered during CHDs. It is important to note that immunizations providedthrough CHDs provide significant levels of protection against vaccine pre-ventable diseases and are an important strategy in reaching children in thisstill fragile state. Estimate challenged by: D-S-
2011: Estimate based on coverage reported by national government. While OPV isoffered during Child Health Days these doses are recorded as supplementalimmunization doses. Estimate challenged by: S-
2012: Estimate based on coverage reported by national government. See commentfrom previous year. Estimate challenged by: S-
2013: Estimate based on extrapolation from data reported by national government.Reported data excluded. Decline in reported coverage reflects incompletereporting from the Central-South zone.Reported data excluded. Declinein reported coverage from 47 percent to 24 percent with increase to 66percent. Estimate challenged by: D-
2014: Estimate based on extrapolation from data reported by national government.Reported data excluded. Decline in coverage is due in part to incompletereporting.Reported data excluded. Unexplained increase from 24 percentto 66 percent with decrease 42 percent. WHO and UNICEF recommendcontinued focus on improved recording and monitoring of immunizationservice delivery and periodic independent coverage assessment in additionto improving coverage of immunization services. GoC=Assigned by work-ing group. Unexplained increase in target population between 2014 and2015.
2015: Estimate based on extrapolation from data reported by national govern-ment. Reported data excluded. Change in reported coverage from 66 levelto 42 percent. WHO and UNICEF recommend continued focus on im-proved recording and monitoring of immunization service delivery and pe-riodic independent coverage assessment in addition to improving coverageof immunization services. GoC=Assigned by working group. Unexplainedincrease in target population between 2014 and 2015.
July 6, 2016; page 9 WHO and UNICEF estimates of national immunization coverage - next revision available July 15, 2017 data as of July 5, 2016
Somalia - MCV1
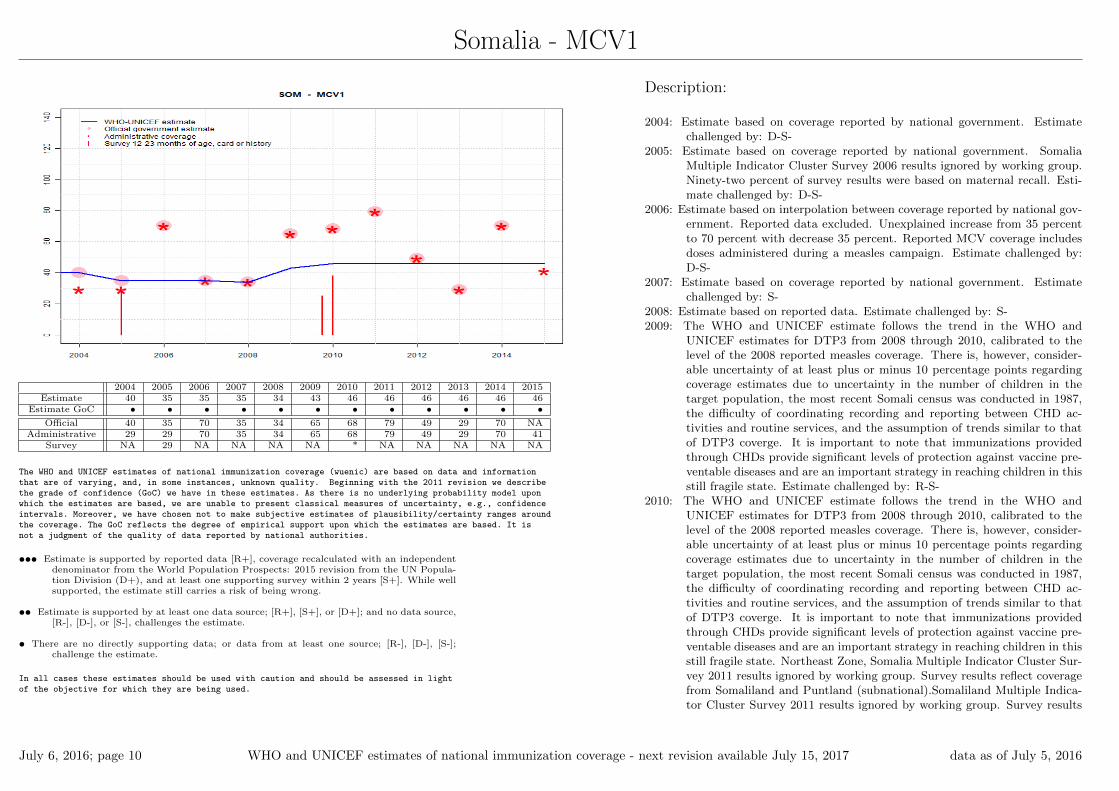
2004 2005 2006 2007 2008 2009 2010 2011 2012 2013 2014 2015Estimate 40 35 35 35 34 43 46 46 46 46 46 46
Estimate GoC • • • • • • • • • • • •Official 40 35 70 35 34 65 68 79 49 29 70 NA
Administrative 29 29 70 35 34 65 68 79 49 29 70 41Survey NA 29 NA NA NA NA * NA NA NA NA NA
The WHO and UNICEF estimates of national immunization coverage (wuenic) are based on data and informationthat are of varying, and, in some instances, unknown quality. Beginning with the 2011 revision we describethe grade of confidence (GoC) we have in these estimates. As there is no underlying probability model uponwhich the estimates are based, we are unable to present classical measures of uncertainty, e.g., confidenceintervals. Moreover, we have chosen not to make subjective estimates of plausibility/certainty ranges aroundthe coverage. The GoC reflects the degree of empirical support upon which the estimates are based. It isnot a judgment of the quality of data reported by national authorities.
••• Estimate is supported by reported data [R+], coverage recalculated with an independentdenominator from the World Population Prospects: 2015 revision from the UN Popula-tion Division (D+), and at least one supporting survey within 2 years [S+]. While wellsupported, the estimate still carries a risk of being wrong.
•• Estimate is supported by at least one data source; [R+], [S+], or [D+]; and no data source,[R-], [D-], or [S-], challenges the estimate.
• There are no directly supporting data; or data from at least one source; [R-], [D-], [S-];challenge the estimate.
In all cases these estimates should be used with caution and should be assessed in lightof the objective for which they are being used.
Description:
2004: Estimate based on coverage reported by national government. Estimatechallenged by: D-S-
2005: Estimate based on coverage reported by national government. SomaliaMultiple Indicator Cluster Survey 2006 results ignored by working group.Ninety-two percent of survey results were based on maternal recall. Esti-mate challenged by: D-S-
2006: Estimate based on interpolation between coverage reported by national gov-ernment. Reported data excluded. Unexplained increase from 35 percentto 70 percent with decrease 35 percent. Reported MCV coverage includesdoses administered during a measles campaign. Estimate challenged by:D-S-
2007: Estimate based on coverage reported by national government. Estimatechallenged by: S-
2008: Estimate based on reported data. Estimate challenged by: S-2009: The WHO and UNICEF estimate follows the trend in the WHO and
UNICEF estimates for DTP3 from 2008 through 2010, calibrated to thelevel of the 2008 reported measles coverage. There is, however, consider-able uncertainty of at least plus or minus 10 percentage points regardingcoverage estimates due to uncertainty in the number of children in thetarget population, the most recent Somali census was conducted in 1987,the difficulty of coordinating recording and reporting between CHD ac-tivities and routine services, and the assumption of trends similar to thatof DTP3 coverge. It is important to note that immunizations providedthrough CHDs provide significant levels of protection against vaccine pre-ventable diseases and are an important strategy in reaching children in thisstill fragile state. Estimate challenged by: R-S-
2010: The WHO and UNICEF estimate follows the trend in the WHO andUNICEF estimates for DTP3 from 2008 through 2010, calibrated to thelevel of the 2008 reported measles coverage. There is, however, consider-able uncertainty of at least plus or minus 10 percentage points regardingcoverage estimates due to uncertainty in the number of children in thetarget population, the most recent Somali census was conducted in 1987,the difficulty of coordinating recording and reporting between CHD ac-tivities and routine services, and the assumption of trends similar to thatof DTP3 coverge. It is important to note that immunizations providedthrough CHDs provide significant levels of protection against vaccine pre-ventable diseases and are an important strategy in reaching children in thisstill fragile state. Northeast Zone, Somalia Multiple Indicator Cluster Sur-vey 2011 results ignored by working group. Survey results reflect coveragefrom Somaliland and Puntland (subnational).Somaliland Multiple Indica-tor Cluster Survey 2011 results ignored by working group. Survey results
July 6, 2016; page 10 WHO and UNICEF estimates of national immunization coverage - next revision available July 15, 2017 data as of July 5, 2016

Somalia - MCV1
reflect coverage from Somaliland and Puntland (subnational). Estimatechallenged by: R-S-
2011: Reported data calibrated to 2010 levels. Reported data excluded. Unex-plained increase from 68 percent to 79 percent with decrease 49 percent.Routine immunization is delivered through fixed sites complemented byChild Health Days (CHD). This strategy of supplementing the routine im-munization has been in place for the last 4 years; and has contributed tothe improvement of immunization coverage. Estimate challenged by: D-S-
2012: Reported data calibrated to 2010 levels. Reported data excluded. Declinein coverage reflects incomplete reporting from Central-South zone. Seecomment from previous year. Estimate challenged by: S-
2013: Reported data calibrated to 2010 levels. Reported data excluded. Declinein reported coverage reflects incomplete reporting from the Central-Southzone.Reported data excluded. Decline in reported coverage from 49 per-cent to 29 percent with increase to 70 percent. Estimate challenged by:D-
2014: Reported data calibrated to 2010 levels. Reported data excluded. De-cline in coverage is due in part to incomplete reporting.Reported data ex-cluded. Unexplained increase from 29 percent to 70 percent with decrease41 percent. WHO and UNICEF recommend continued focus on improvedrecording and monitoring of immunization service delivery and periodic in-dependent coverage assessment in addition to improving coverage of immu-nization services. GoC=Assigned by working group. Unexplained increasein target population between 2014 and 2015.
2015: Reported data calibrated to 2010 levels. Reported data excluded. Changein reported coverage from 70 level to 41 percent. WHO and UNICEF rec-ommend continued focus on improved recording and monitoring of immu-nization service delivery and periodic independent coverage assessment inaddition to improving coverage of immunization services. GoC=Assignedby working group. Unexplained increase in target population between 2014and 2015.
July 6, 2016; page 11 WHO and UNICEF estimates of national immunization coverage - next revision available July 15, 2017 data as of July 5, 2016

Somalia - MCV2
2004 2005 2006 2007 2008 2009 2010 2011 2012 2013 2014 2015Estimate NA NA NA NA NA NA NA NA NA NA NA NA
Estimate GoC NA NA NA NA NA NA NA NA NA NA NA NA
Official NA NA NA NA NA NA NA NA NA NA NA NAAdministrative NA NA NA NA NA NA NA NA NA NA NA NA
Survey NA NA NA NA NA NA NA NA NA NA NA NA
The WHO and UNICEF estimates of national immunization coverage (wuenic) are based on data and informationthat are of varying, and, in some instances, unknown quality. Beginning with the 2011 revision we describethe grade of confidence (GoC) we have in these estimates. As there is no underlying probability model uponwhich the estimates are based, we are unable to present classical measures of uncertainty, e.g., confidenceintervals. Moreover, we have chosen not to make subjective estimates of plausibility/certainty ranges aroundthe coverage. The GoC reflects the degree of empirical support upon which the estimates are based. It isnot a judgment of the quality of data reported by national authorities.
••• Estimate is supported by reported data [R+], coverage recalculated with an independentdenominator from the World Population Prospects: 2015 revision from the UN Popula-tion Division (D+), and at least one supporting survey within 2 years [S+]. While wellsupported, the estimate still carries a risk of being wrong.
•• Estimate is supported by at least one data source; [R+], [S+], or [D+]; and no data source,[R-], [D-], or [S-], challenges the estimate.
• There are no directly supporting data; or data from at least one source; [R-], [D-], [S-];challenge the estimate.
In all cases these estimates should be used with caution and should be assessed in lightof the objective for which they are being used.
July 6, 2016; page 12 WHO and UNICEF estimates of national immunization coverage - next revision available July 15, 2017 data as of July 5, 2016
Somalia - RCV1
2004 2005 2006 2007 2008 2009 2010 2011 2012 2013 2014 2015Estimate NA NA NA NA NA NA NA NA NA NA NA NA
Estimate GoC NA NA NA NA NA NA NA NA NA NA NA NA
Official NA NA NA NA NA NA NA NA NA NA NA NAAdministrative NA NA NA NA NA NA NA NA NA NA NA NA
Survey NA NA NA NA NA NA NA NA NA NA NA NA
The WHO and UNICEF estimates of national immunization coverage (wuenic) are based on data and informationthat are of varying, and, in some instances, unknown quality. Beginning with the 2011 revision we describethe grade of confidence (GoC) we have in these estimates. As there is no underlying probability model uponwhich the estimates are based, we are unable to present classical measures of uncertainty, e.g., confidenceintervals. Moreover, we have chosen not to make subjective estimates of plausibility/certainty ranges aroundthe coverage. The GoC reflects the degree of empirical support upon which the estimates are based. It isnot a judgment of the quality of data reported by national authorities.
••• Estimate is supported by reported data [R+], coverage recalculated with an independentdenominator from the World Population Prospects: 2015 revision from the UN Popula-tion Division (D+), and at least one supporting survey within 2 years [S+]. While wellsupported, the estimate still carries a risk of being wrong.
•• Estimate is supported by at least one data source; [R+], [S+], or [D+]; and no data source,[R-], [D-], or [S-], challenges the estimate.
• There are no directly supporting data; or data from at least one source; [R-], [D-], [S-];challenge the estimate.
In all cases these estimates should be used with caution and should be assessed in lightof the objective for which they are being used.
July 6, 2016; page 13 WHO and UNICEF estimates of national immunization coverage - next revision available July 15, 2017 data as of July 5, 2016
Somalia - HepBB
2004 2005 2006 2007 2008 2009 2010 2011 2012 2013 2014 2015Estimate NA NA NA NA NA NA NA NA NA NA NA NA
Estimate GoC NA NA NA NA NA NA NA NA NA NA NA NA
Official NA NA NA NA NA NA NA NA NA NA NA NAAdministrative NA NA NA NA NA NA NA NA NA NA NA NA
Survey NA NA NA NA NA NA NA NA NA NA NA NA
The WHO and UNICEF estimates of national immunization coverage (wuenic) are based on data and informationthat are of varying, and, in some instances, unknown quality. Beginning with the 2011 revision we describethe grade of confidence (GoC) we have in these estimates. As there is no underlying probability model uponwhich the estimates are based, we are unable to present classical measures of uncertainty, e.g., confidenceintervals. Moreover, we have chosen not to make subjective estimates of plausibility/certainty ranges aroundthe coverage. The GoC reflects the degree of empirical support upon which the estimates are based. It isnot a judgment of the quality of data reported by national authorities.
••• Estimate is supported by reported data [R+], coverage recalculated with an independentdenominator from the World Population Prospects: 2015 revision from the UN Popula-tion Division (D+), and at least one supporting survey within 2 years [S+]. While wellsupported, the estimate still carries a risk of being wrong.
•• Estimate is supported by at least one data source; [R+], [S+], or [D+]; and no data source,[R-], [D-], or [S-], challenges the estimate.
• There are no directly supporting data; or data from at least one source; [R-], [D-], [S-];challenge the estimate.
In all cases these estimates should be used with caution and should be assessed in lightof the objective for which they are being used.
July 6, 2016; page 14 WHO and UNICEF estimates of national immunization coverage - next revision available July 15, 2017 data as of July 5, 2016
Somalia - HepB3
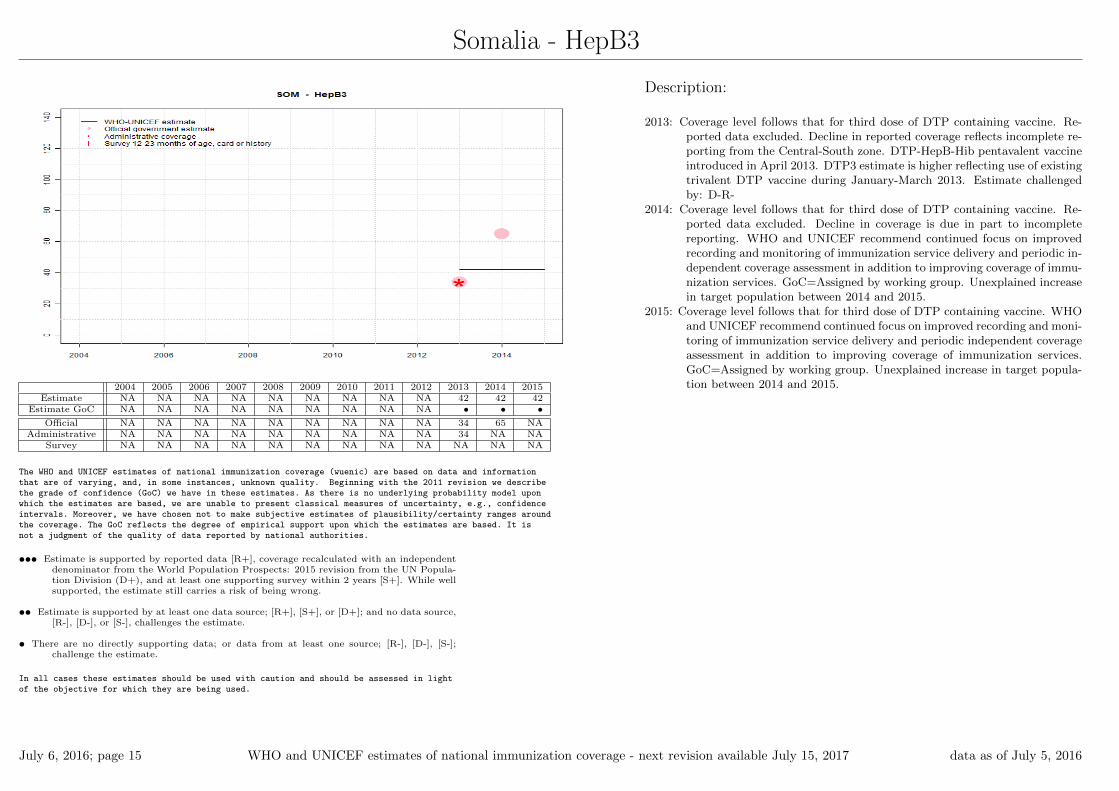
2004 2005 2006 2007 2008 2009 2010 2011 2012 2013 2014 2015Estimate NA NA NA NA NA NA NA NA NA 42 42 42
Estimate GoC NA NA NA NA NA NA NA NA NA • • •Official NA NA NA NA NA NA NA NA NA 34 65 NA
Administrative NA NA NA NA NA NA NA NA NA 34 NA NASurvey NA NA NA NA NA NA NA NA NA NA NA NA
The WHO and UNICEF estimates of national immunization coverage (wuenic) are based on data and informationthat are of varying, and, in some instances, unknown quality. Beginning with the 2011 revision we describethe grade of confidence (GoC) we have in these estimates. As there is no underlying probability model uponwhich the estimates are based, we are unable to present classical measures of uncertainty, e.g., confidenceintervals. Moreover, we have chosen not to make subjective estimates of plausibility/certainty ranges aroundthe coverage. The GoC reflects the degree of empirical support upon which the estimates are based. It isnot a judgment of the quality of data reported by national authorities.
••• Estimate is supported by reported data [R+], coverage recalculated with an independentdenominator from the World Population Prospects: 2015 revision from the UN Popula-tion Division (D+), and at least one supporting survey within 2 years [S+]. While wellsupported, the estimate still carries a risk of being wrong.
•• Estimate is supported by at least one data source; [R+], [S+], or [D+]; and no data source,[R-], [D-], or [S-], challenges the estimate.
• There are no directly supporting data; or data from at least one source; [R-], [D-], [S-];challenge the estimate.
In all cases these estimates should be used with caution and should be assessed in lightof the objective for which they are being used.
Description:
2013: Coverage level follows that for third dose of DTP containing vaccine. Re-ported data excluded. Decline in reported coverage reflects incomplete re-porting from the Central-South zone. DTP-HepB-Hib pentavalent vaccineintroduced in April 2013. DTP3 estimate is higher reflecting use of existingtrivalent DTP vaccine during January-March 2013. Estimate challengedby: D-R-
2014: Coverage level follows that for third dose of DTP containing vaccine. Re-ported data excluded. Decline in coverage is due in part to incompletereporting. WHO and UNICEF recommend continued focus on improvedrecording and monitoring of immunization service delivery and periodic in-dependent coverage assessment in addition to improving coverage of immu-nization services. GoC=Assigned by working group. Unexplained increasein target population between 2014 and 2015.
2015: Coverage level follows that for third dose of DTP containing vaccine. WHOand UNICEF recommend continued focus on improved recording and moni-toring of immunization service delivery and periodic independent coverageassessment in addition to improving coverage of immunization services.GoC=Assigned by working group. Unexplained increase in target popula-tion between 2014 and 2015.
July 6, 2016; page 15 WHO and UNICEF estimates of national immunization coverage - next revision available July 15, 2017 data as of July 5, 2016
Somalia - Hib3
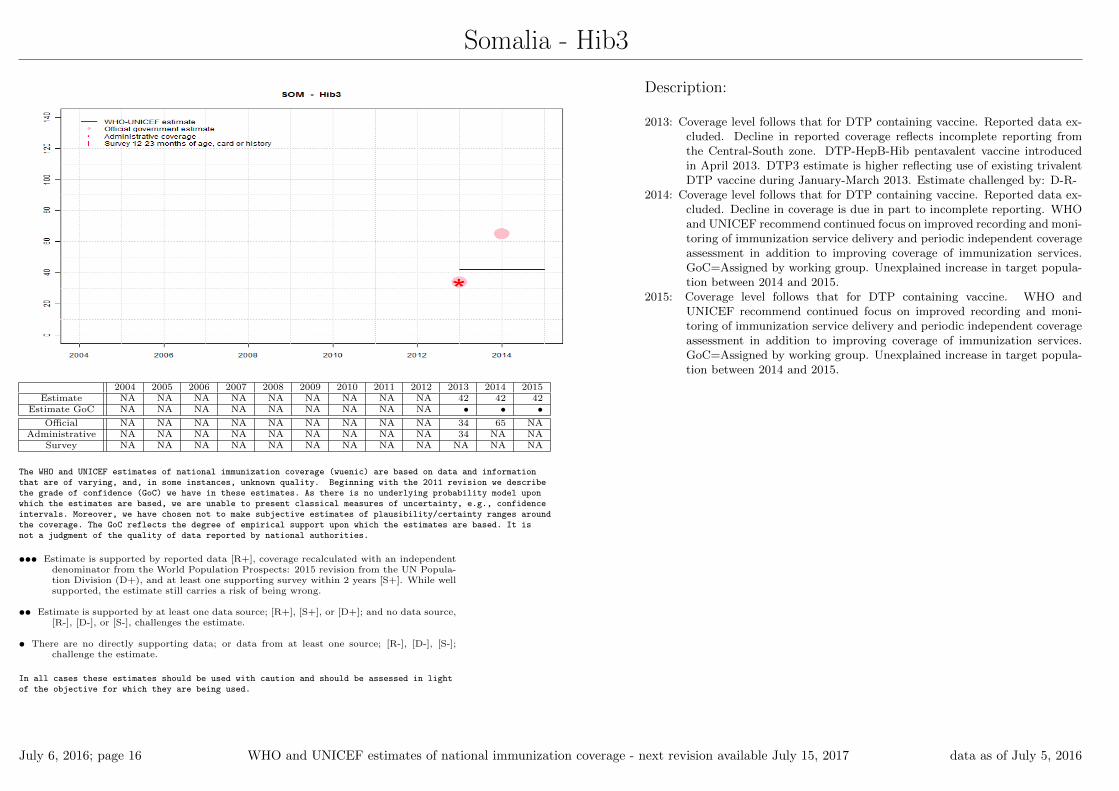
2004 2005 2006 2007 2008 2009 2010 2011 2012 2013 2014 2015Estimate NA NA NA NA NA NA NA NA NA 42 42 42
Estimate GoC NA NA NA NA NA NA NA NA NA • • •Official NA NA NA NA NA NA NA NA NA 34 65 NA
Administrative NA NA NA NA NA NA NA NA NA 34 NA NASurvey NA NA NA NA NA NA NA NA NA NA NA NA
The WHO and UNICEF estimates of national immunization coverage (wuenic) are based on data and informationthat are of varying, and, in some instances, unknown quality. Beginning with the 2011 revision we describethe grade of confidence (GoC) we have in these estimates. As there is no underlying probability model uponwhich the estimates are based, we are unable to present classical measures of uncertainty, e.g., confidenceintervals. Moreover, we have chosen not to make subjective estimates of plausibility/certainty ranges aroundthe coverage. The GoC reflects the degree of empirical support upon which the estimates are based. It isnot a judgment of the quality of data reported by national authorities.
••• Estimate is supported by reported data [R+], coverage recalculated with an independentdenominator from the World Population Prospects: 2015 revision from the UN Popula-tion Division (D+), and at least one supporting survey within 2 years [S+]. While wellsupported, the estimate still carries a risk of being wrong.
•• Estimate is supported by at least one data source; [R+], [S+], or [D+]; and no data source,[R-], [D-], or [S-], challenges the estimate.
• There are no directly supporting data; or data from at least one source; [R-], [D-], [S-];challenge the estimate.
In all cases these estimates should be used with caution and should be assessed in lightof the objective for which they are being used.
Description:
2013: Coverage level follows that for DTP containing vaccine. Reported data ex-cluded. Decline in reported coverage reflects incomplete reporting fromthe Central-South zone. DTP-HepB-Hib pentavalent vaccine introducedin April 2013. DTP3 estimate is higher reflecting use of existing trivalentDTP vaccine during January-March 2013. Estimate challenged by: D-R-
2014: Coverage level follows that for DTP containing vaccine. Reported data ex-cluded. Decline in coverage is due in part to incomplete reporting. WHOand UNICEF recommend continued focus on improved recording and moni-toring of immunization service delivery and periodic independent coverageassessment in addition to improving coverage of immunization services.GoC=Assigned by working group. Unexplained increase in target popula-tion between 2014 and 2015.
2015: Coverage level follows that for DTP containing vaccine. WHO andUNICEF recommend continued focus on improved recording and moni-toring of immunization service delivery and periodic independent coverageassessment in addition to improving coverage of immunization services.GoC=Assigned by working group. Unexplained increase in target popula-tion between 2014 and 2015.
July 6, 2016; page 16 WHO and UNICEF estimates of national immunization coverage - next revision available July 15, 2017 data as of July 5, 2016

Somalia - RotaC
2004 2005 2006 2007 2008 2009 2010 2011 2012 2013 2014 2015Estimate NA NA NA NA NA NA NA NA NA NA NA NA
Estimate GoC NA NA NA NA NA NA NA NA NA NA NA NA
Official NA NA NA NA NA NA NA NA NA NA NA NAAdministrative NA NA NA NA NA NA NA NA NA NA NA NA
Survey NA NA NA NA NA NA NA NA NA NA NA NA
The WHO and UNICEF estimates of national immunization coverage (wuenic) are based on data and informationthat are of varying, and, in some instances, unknown quality. Beginning with the 2011 revision we describethe grade of confidence (GoC) we have in these estimates. As there is no underlying probability model uponwhich the estimates are based, we are unable to present classical measures of uncertainty, e.g., confidenceintervals. Moreover, we have chosen not to make subjective estimates of plausibility/certainty ranges aroundthe coverage. The GoC reflects the degree of empirical support upon which the estimates are based. It isnot a judgment of the quality of data reported by national authorities.
••• Estimate is supported by reported data [R+], coverage recalculated with an independentdenominator from the World Population Prospects: 2015 revision from the UN Popula-tion Division (D+), and at least one supporting survey within 2 years [S+]. While wellsupported, the estimate still carries a risk of being wrong.
•• Estimate is supported by at least one data source; [R+], [S+], or [D+]; and no data source,[R-], [D-], or [S-], challenges the estimate.
• There are no directly supporting data; or data from at least one source; [R-], [D-], [S-];challenge the estimate.
In all cases these estimates should be used with caution and should be assessed in lightof the objective for which they are being used.
July 6, 2016; page 17 WHO and UNICEF estimates of national immunization coverage - next revision available July 15, 2017 data as of July 5, 2016
Somalia - PcV3
2004 2005 2006 2007 2008 2009 2010 2011 2012 2013 2014 2015Estimate NA NA NA NA NA NA NA NA NA NA NA NA
Estimate GoC NA NA NA NA NA NA NA NA NA NA NA NA
Official NA NA NA NA NA NA NA NA NA NA NA NAAdministrative NA NA NA NA NA NA NA NA NA NA NA NA
Survey NA NA NA NA NA NA NA NA NA NA NA NA
The WHO and UNICEF estimates of national immunization coverage (wuenic) are based on data and informationthat are of varying, and, in some instances, unknown quality. Beginning with the 2011 revision we describethe grade of confidence (GoC) we have in these estimates. As there is no underlying probability model uponwhich the estimates are based, we are unable to present classical measures of uncertainty, e.g., confidenceintervals. Moreover, we have chosen not to make subjective estimates of plausibility/certainty ranges aroundthe coverage. The GoC reflects the degree of empirical support upon which the estimates are based. It isnot a judgment of the quality of data reported by national authorities.
••• Estimate is supported by reported data [R+], coverage recalculated with an independentdenominator from the World Population Prospects: 2015 revision from the UN Popula-tion Division (D+), and at least one supporting survey within 2 years [S+]. While wellsupported, the estimate still carries a risk of being wrong.
•• Estimate is supported by at least one data source; [R+], [S+], or [D+]; and no data source,[R-], [D-], or [S-], challenges the estimate.
• There are no directly supporting data; or data from at least one source; [R-], [D-], [S-];challenge the estimate.
In all cases these estimates should be used with caution and should be assessed in lightof the objective for which they are being used.
July 6, 2016; page 18 WHO and UNICEF estimates of national immunization coverage - next revision available July 15, 2017 data as of July 5, 2016
Somalia - survey details
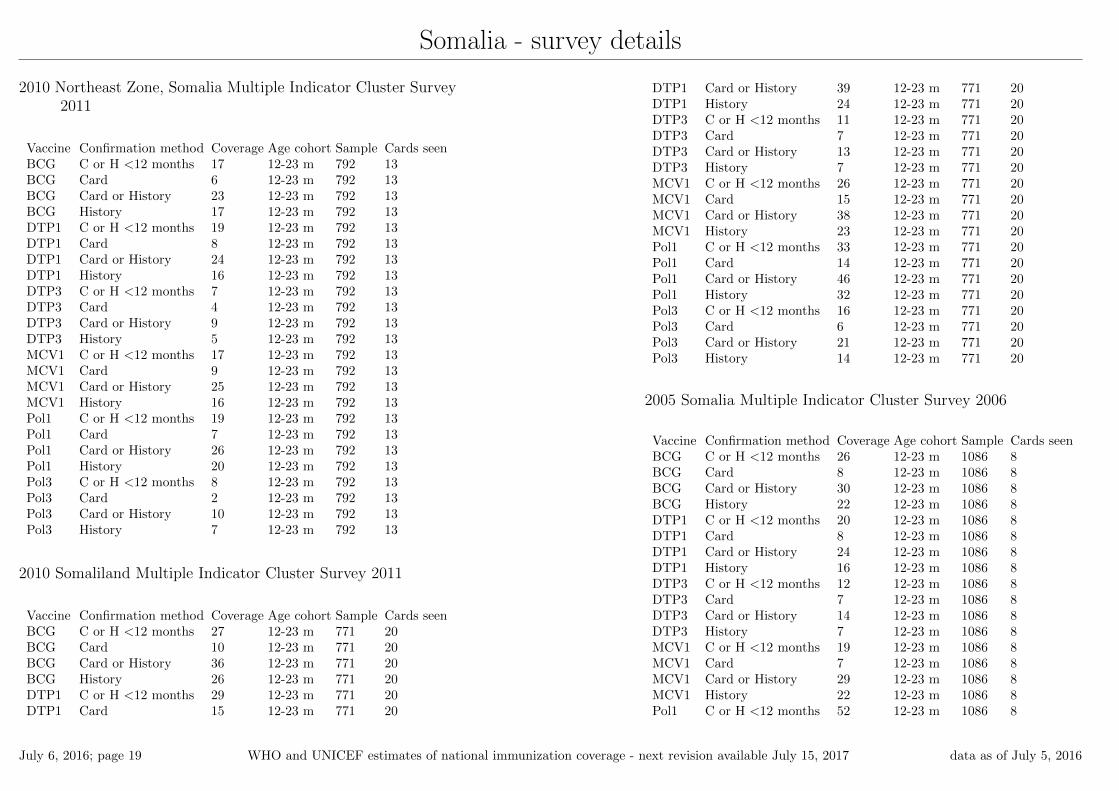
2010 Northeast Zone, Somalia Multiple Indicator Cluster Survey2011
Vaccine Confirmation method Coverage Age cohort Sample Cards seenBCG C or H <12 months 17 12-23 m 792 13BCG Card 6 12-23 m 792 13BCG Card or History 23 12-23 m 792 13BCG History 17 12-23 m 792 13DTP1 C or H <12 months 19 12-23 m 792 13DTP1 Card 8 12-23 m 792 13DTP1 Card or History 24 12-23 m 792 13DTP1 History 16 12-23 m 792 13DTP3 C or H <12 months 7 12-23 m 792 13DTP3 Card 4 12-23 m 792 13DTP3 Card or History 9 12-23 m 792 13DTP3 History 5 12-23 m 792 13MCV1 C or H <12 months 17 12-23 m 792 13MCV1 Card 9 12-23 m 792 13MCV1 Card or History 25 12-23 m 792 13MCV1 History 16 12-23 m 792 13Pol1 C or H <12 months 19 12-23 m 792 13Pol1 Card 7 12-23 m 792 13Pol1 Card or History 26 12-23 m 792 13Pol1 History 20 12-23 m 792 13Pol3 C or H <12 months 8 12-23 m 792 13Pol3 Card 2 12-23 m 792 13Pol3 Card or History 10 12-23 m 792 13Pol3 History 7 12-23 m 792 13
2010 Somaliland Multiple Indicator Cluster Survey 2011
Vaccine Confirmation method Coverage Age cohort Sample Cards seenBCG C or H <12 months 27 12-23 m 771 20BCG Card 10 12-23 m 771 20BCG Card or History 36 12-23 m 771 20BCG History 26 12-23 m 771 20DTP1 C or H <12 months 29 12-23 m 771 20DTP1 Card 15 12-23 m 771 20
DTP1 Card or History 39 12-23 m 771 20DTP1 History 24 12-23 m 771 20DTP3 C or H <12 months 11 12-23 m 771 20DTP3 Card 7 12-23 m 771 20DTP3 Card or History 13 12-23 m 771 20DTP3 History 7 12-23 m 771 20MCV1 C or H <12 months 26 12-23 m 771 20MCV1 Card 15 12-23 m 771 20MCV1 Card or History 38 12-23 m 771 20MCV1 History 23 12-23 m 771 20Pol1 C or H <12 months 33 12-23 m 771 20Pol1 Card 14 12-23 m 771 20Pol1 Card or History 46 12-23 m 771 20Pol1 History 32 12-23 m 771 20Pol3 C or H <12 months 16 12-23 m 771 20Pol3 Card 6 12-23 m 771 20Pol3 Card or History 21 12-23 m 771 20Pol3 History 14 12-23 m 771 20
2005 Somalia Multiple Indicator Cluster Survey 2006
Vaccine Confirmation method Coverage Age cohort Sample Cards seenBCG C or H <12 months 26 12-23 m 1086 8BCG Card 8 12-23 m 1086 8BCG Card or History 30 12-23 m 1086 8BCG History 22 12-23 m 1086 8DTP1 C or H <12 months 20 12-23 m 1086 8DTP1 Card 8 12-23 m 1086 8DTP1 Card or History 24 12-23 m 1086 8DTP1 History 16 12-23 m 1086 8DTP3 C or H <12 months 12 12-23 m 1086 8DTP3 Card 7 12-23 m 1086 8DTP3 Card or History 14 12-23 m 1086 8DTP3 History 7 12-23 m 1086 8MCV1 C or H <12 months 19 12-23 m 1086 8MCV1 Card 7 12-23 m 1086 8MCV1 Card or History 29 12-23 m 1086 8MCV1 History 22 12-23 m 1086 8Pol1 C or H <12 months 52 12-23 m 1086 8
July 6, 2016; page 19 WHO and UNICEF estimates of national immunization coverage - next revision available July 15, 2017 data as of July 5, 2016
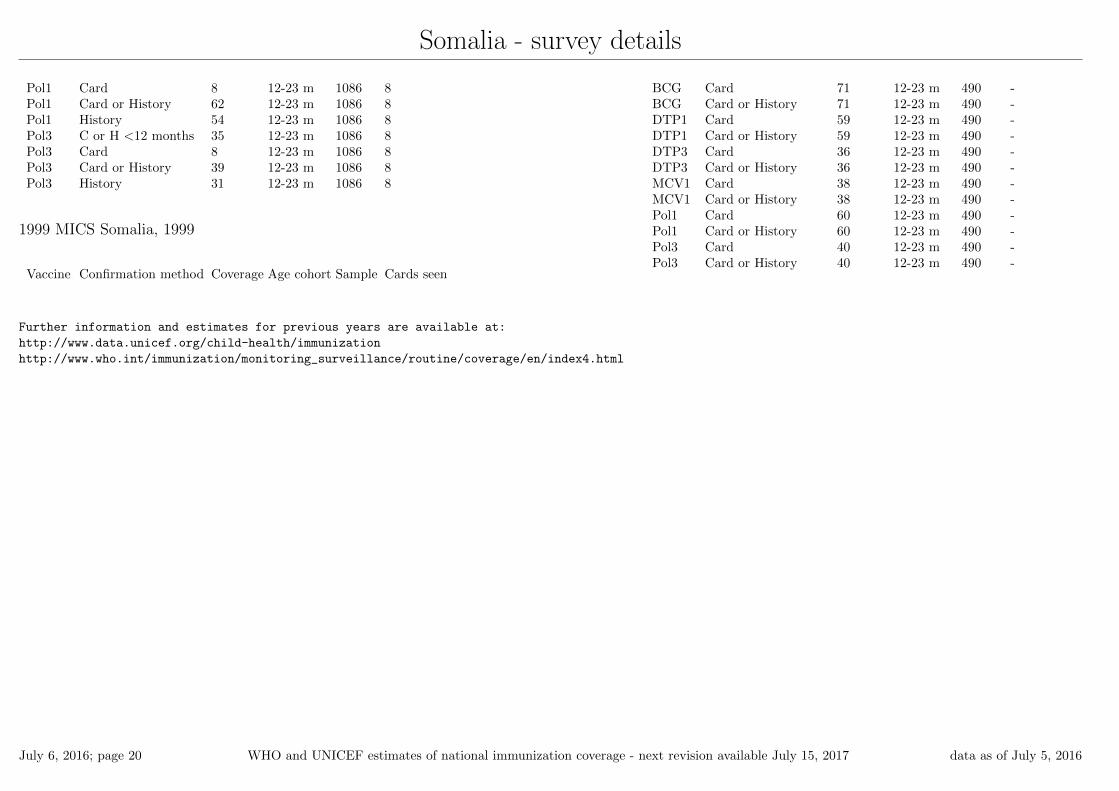
Somalia - survey details
Pol1 Card 8 12-23 m 1086 8Pol1 Card or History 62 12-23 m 1086 8Pol1 History 54 12-23 m 1086 8Pol3 C or H <12 months 35 12-23 m 1086 8Pol3 Card 8 12-23 m 1086 8Pol3 Card or History 39 12-23 m 1086 8Pol3 History 31 12-23 m 1086 8
1999 MICS Somalia, 1999
Vaccine Confirmation method Coverage Age cohort Sample Cards seen
BCG Card 71 12-23 m 490 -BCG Card or History 71 12-23 m 490 -DTP1 Card 59 12-23 m 490 -DTP1 Card or History 59 12-23 m 490 -DTP3 Card 36 12-23 m 490 -DTP3 Card or History 36 12-23 m 490 -MCV1 Card 38 12-23 m 490 -MCV1 Card or History 38 12-23 m 490 -Pol1 Card 60 12-23 m 490 -Pol1 Card or History 60 12-23 m 490 -Pol3 Card 40 12-23 m 490 -Pol3 Card or History 40 12-23 m 490 -
Further information and estimates for previous years are available at:
http://www.data.unicef.org/child-health/immunization
http://www.who.int/immunization/monitoring_surveillance/routine/coverage/en/index4.html
July 6, 2016; page 20 WHO and UNICEF estimates of national immunization coverage - next revision available July 15, 2017 data as of July 5, 2016
___________________________________________
1 This model is described in: Griffiths U., Wolfson L., Quddus A., Younus M., Hafiz R.. Incremental cost-effectiveness of supplementary immunization activities to prevent
neo-natal tetanus in Pakistan. Bulletin of the World Health Organization 2004; 82:643-651.
WHO and UNICEF estimates of national immunization coverage Data as of July 5, 2016
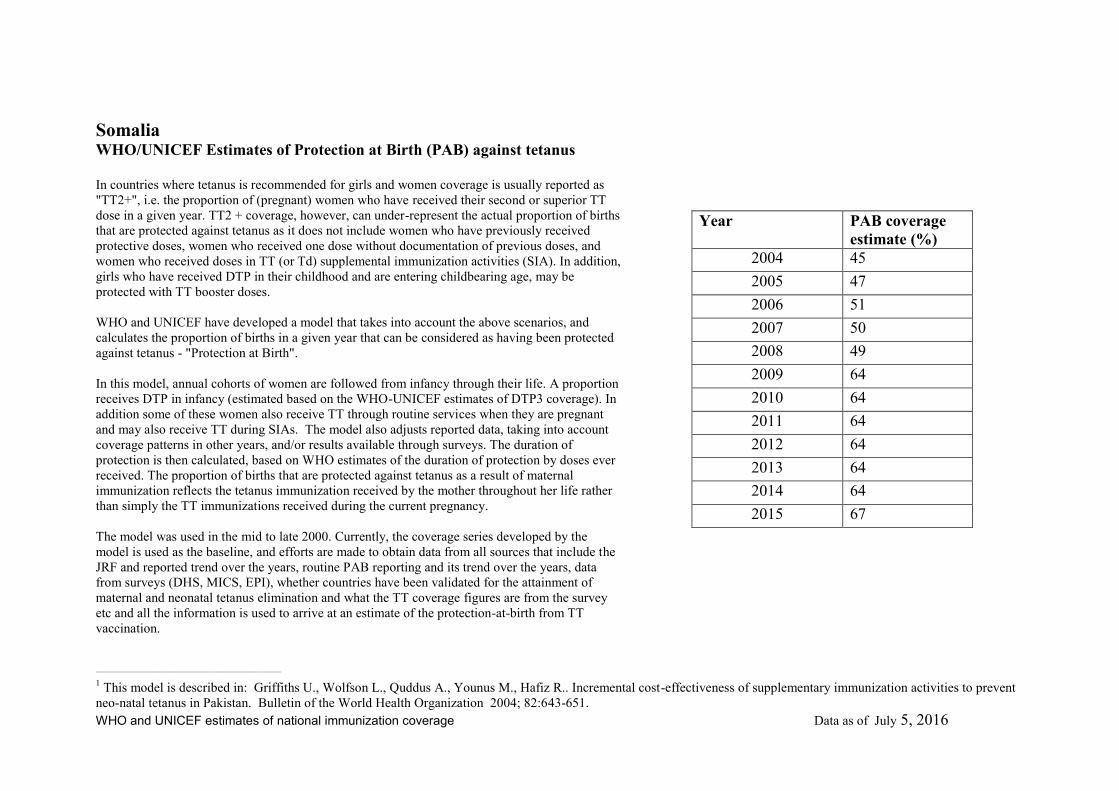
Somalia WHO/UNICEF Estimates of Protection at Birth (PAB) against tetanus
In countries where tetanus is recommended for girls and women coverage is usually reported as
"TT2+", i.e. the proportion of (pregnant) women who have received their second or superior TT
dose in a given year. TT2 + coverage, however, can under-represent the actual proportion of births
that are protected against tetanus as it does not include women who have previously received
protective doses, women who received one dose without documentation of previous doses, and
women who received doses in TT (or Td) supplemental immunization activities (SIA). In addition,
girls who have received DTP in their childhood and are entering childbearing age, may be
protected with TT booster doses.
WHO and UNICEF have developed a model that takes into account the above scenarios, and
calculates the proportion of births in a given year that can be considered as having been protected
against tetanus - "Protection at Birth".
In this model, annual cohorts of women are followed from infancy through their life. A proportion
receives DTP in infancy (estimated based on the WHO-UNICEF estimates of DTP3 coverage). In
addition some of these women also receive TT through routine services when they are pregnant
and may also receive TT during SIAs. The model also adjusts reported data, taking into account
coverage patterns in other years, and/or results available through surveys. The duration of
protection is then calculated, based on WHO estimates of the duration of protection by doses ever
received. The proportion of births that are protected against tetanus as a result of maternal
immunization reflects the tetanus immunization received by the mother throughout her life rather
than simply the TT immunizations received during the current pregnancy.
The model was used in the mid to late 2000. Currently, the coverage series developed by the
model is used as the baseline, and efforts are made to obtain data from all sources that include the
JRF and reported trend over the years, routine PAB reporting and its trend over the years, data
from surveys (DHS, MICS, EPI), whether countries have been validated for the attainment of
maternal and neonatal tetanus elimination and what the TT coverage figures are from the survey
etc and all the information is used to arrive at an estimate of the protection-at-birth from TT
vaccination.
Year PAB coverage
estimate (%)
2004 45
2005 47
2006 51
2007 50
2008 49
2009 64
2010 64
2011 64
2012 64
2013 64
2014 64
2015 67