some aspects in the surface chemistry of metals
TRANSCRIPT

SOME ASPECTS
IN THE
SpiFACE CHEMISTRY,
op
by ,
C J, JLIQii F.1 9 Actlikt
Being a thesis submitted in fuliilment of the .
requirements tor the degree of
MA TER
OF SCIMOE
UNIVeRSITY OF TAOLANIA
HOBART,
41"
October 1956.

INTRODUOTOI
This thesis has been divided into the following
sections:-
Section : The Dehydration of Perrouo Oxalate Dihydrate.
Section III Kinetics of the oxidation of Nickel t,cwdere.
Section III ; Surface Area Measuremente of Nickel Powders.
Section rir Heat of adsorption Lleasurements.
Seetion I is isolated and bears little relation to the
work reported in tht other sections. It is, however, pert of a
larger programme of work on the chemistry of metal oxalates
undertaken in the Department or Ohemietry, Un.vertity of Tasmania.
Sections II and III are related in that the work
described in Section III followed ae a direet consequence the
results of Section II. The work deseribed in both these
sections was commenced. under the direct supervision of
Dr. J.A. Allen, formerlY-Seniorlecturer in Physical ChemietrY,
University of Tasmania.
The choice of a voiumetrie method and the use of
nickel powders in Section II was made because or the following:
(a) A high vacuum apparatus had been constructed for
Previous work and could be used without serious modification as
a volumetric apparatus.

(b) Previous work in the Chemistry Department, qniVertity
of Tasmania had suggested that nickel powders produced by the
thermal decomposition of nickel oxalate would be suitable
material for oxidation studies.
Section 1V has been subdivided into Parts I and II.
Part I describes attempts to design and construct a calorimeter
suitable for the measurement of heats of adsorption Of gases
on finely divided powders. Part II is concerned with actual
measurements of heats of adsorption of several gases on nickel
oxide. The work described in this section was undertaken
without direct supervision and all glass construction work,
described in this section, has been done by the author.
• • 0.

_
SECTION I.

SECTION I
THE DEHYDRATION OF 1ROUS OXALATE DIHYDRATE
•■••0,01611,21.....
INTRODUCTION:-
The equilibrium water vapour pressure of the system
Ni C24 0 4' 2H2 < 0 > NI 02 04 + 211 0 - 2 , had been investigated previously (,) in the OhemistryDepartment,
University of Tasmania. It was desired to extend this investigation
to include the equiliprtam vapour pressure of the system
Fe '2 2H 0 2 4 2 > Fe C2 04 + 21120
at a series •of temgeratures.
EXPERIMENTAL:
(a) Reagents:- Stock solutions of strenbth 0.514 were
prepared from analytioal grade potassium oxalate and ferrous
ammonium sulphate respectively. k:qual volumes of the solutions
at 2500. were mixed and the ferrous oxalate dihydrate allowed to
precipitate overnight. The precipitate was washed free tram
extraneous iono,dried in an air oven at 60°C. and stored in a
desiccator.
(b) AppsTatus:- The apparatus used to measure the
equilibrium water vapour pressure is shown in fig. t. It was
originally designed as a differential tensiometer for comparing
the vapour pressure of nickel oxalate dihydrate with that of
another salt hydrate with a known vapour pressure curve. No
salt hydrate with suitable characteristics (hish temperature of
dihydrution and high heat of dissociation) could be found and
the measurements voere wade absolutely against vacuum.

(a)
(6)
2
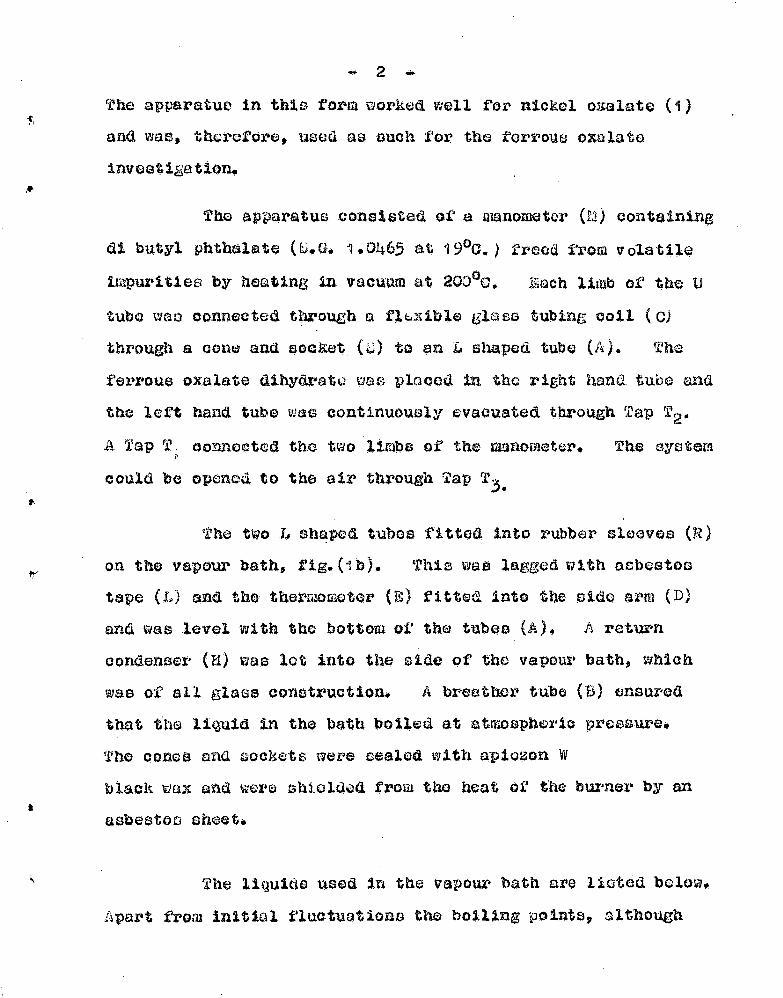
The apparatus in this form worked well for nickel oxalate (1)
and was, therefore, used as such for the forrous oxalate
investigation.
The apparatus oonsisted of a manometer (El) containing .
di butyl phthalate (k4G» 1»0465 at 19°C.) freed from ye/stile
impurities by heating in vacuum at 200 °C. Bach limb of the U
tube was connected through a flexible glass tubing coil (C)
through a cone and socket () to on L shaped. tube (A). The
ferrous oxalate dihydrato was placed in the right hand. tube and
the left hand tube WUG continuously evacuated through Tap T2.
A. Tap T connected the two limbs of the manometer. The system
could be opened to the air through Tap T3,
The two T shaped tubes fitted into rubber sleeves (R)
t-- on the vapour bath, fig.(ib). This vos lagged with asbestos
tape (L) and the thermometer (1) fitted into the side arm (D)
and was level with the bottom or the tubes (A). A return
condenser (11) vas lot into the aide of the vapour bath, which
was of all glass construction. A breather tube (b) ensured
that the liquid in the bath boiled at atmospheric pressure.
The cones and sockets were sealed with apiezon W
black wax and were shielded from the heat of the burner by an
asbestos sheet.
The liquids used in the vapour bath are listed below.
Apart from initial fluctuations the boiling points, although

•
-3 •■•■
different from the literature values due to partial decompoeition
of the organic liquids, remained constant during the measurements.
Liquid
g-Butyl Fermate
Toluene
U-Amyl Alcohol
Acetic Acid
Table I
Boiling Pt. ° C.
105
i10
%15
116.5
D. Pt. ° 0.
Ethyl Carbonate i25
f:.thylene Chloro 127
Isorayl 4,c,:tate
Cyclo Hexane
(c) rrocedare:- The dihydrate was placed in the right hand
tube and loosely packed with glass beads to .ensure uniform heating
and to facilitate out-gassing. If this precaution was not taken
the dihydrate, during the out-gassing, blew up the tube and into
the coils. As a further precaution against material entering
the coils and possibly the manometer, the top of the tube was
loosely pocked with glass wool.
With the appropriate liquid in the bath, the tubes
were slipped into the eleeves and the cones and sockets sealed.
The apparatus was then evacuated for 10-15 hours with Tap T 1 open,
the eample being heated a number of times for short periods to
remove adsorbed gas. The vapour bath was then heated until
the liquid wee distilling freely in the condenser. Tap Ti was
then closed and a plot of manometer reading against time was made.
The equilibrium showed up au a flattening out of this curve.
The heater was turned off, Tap TI opened and the whole ayatem
evacuated for thirty minutea. The heater was turned on again,

14
Tap T1 closed and a second reading of the equilibrium obtained.
The procedure was repeated until the oharge of the *
dihydrate had becowe eshausted. The first equilibrium preseure
was a little high, preaumably due to adsorbed gas. The eecond
and third measurements were readily reproducible with a fresh
charge of dihydrate.
At the highest temporaturea studied, after the first
two or three measurements, decomposition of the salt wae sufficient
to render equilibriuM measurements impossible.
Because the manometer waa at room temperature measurements
could only be carried out up to the saturated vapour pressure of t. water at room temperature.
The possiblity of oorrecting the pressure read at room Pt
temperature for themomelecular flow was investigated. This
correction is zero in the pressure range studied (2) if the glass
wool does not act as a porous plug.
Comparative blanX tests with and without the glass wool
showed that no correction had to be applied.
RESULTS:
The average results over a minimum of three independent
measurements at each temperature are shown in Table II.

5 4.
• TABLE II
Temp.oC. Press. P•mm•Hg•
3 /0 ITK. Log. P.
10 ,*
105.0
190.0
115.0
3.13 ± 0.1
3.98 t 0.1
5.10 -L0.05
2.644
2.609
2.576
0.495
0.599
0.707
116.5 5.40 t 0.05 2.566 0.733
125.0 8.11 It 0.1 2.511 0.909
127.0 8.81 -± 0.1 2,499 0.945
134.0 10 74 t0.1 2.474 1.030.
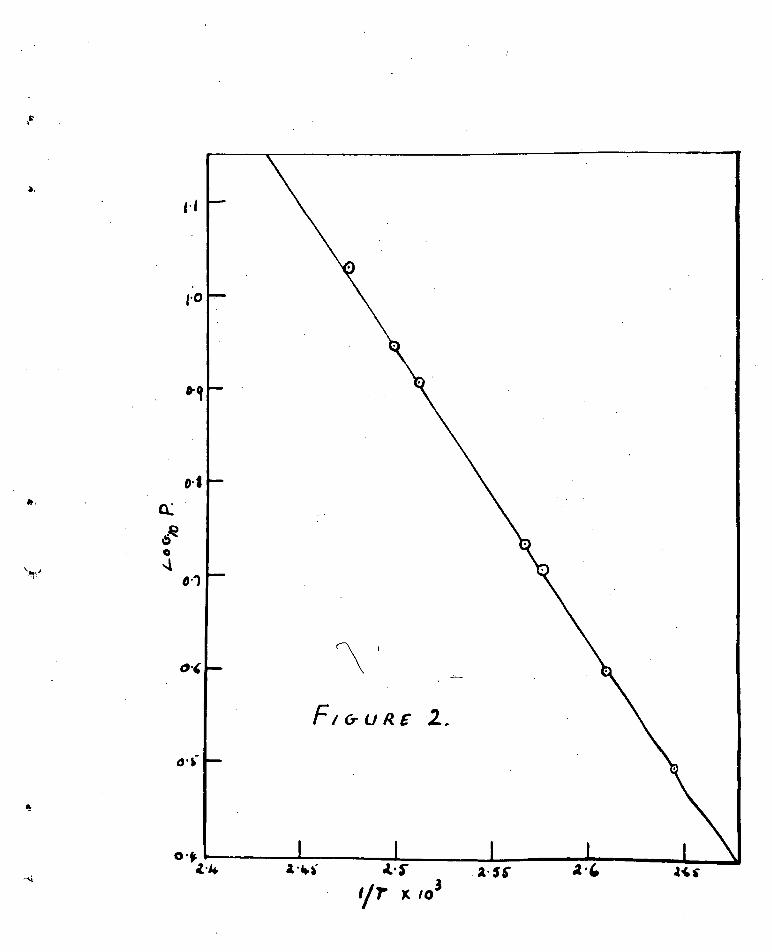
The results tabulated above were plotted in Pig. (2)
where log lop.mm•Hg. is plotted against the reciprocal of the
absolute temperature. '4".•
The equilibrium vapour pressure over the temperature range
investigated is expressed by the equation -
log?. 31,93_ A- 8.690 Jam.Hg.
from which the heat of dehydration is 14,200 cols./mole.
DISCUSS ior
The high heat of dehydration is comparable with the
value of 14,050 cals./thole found for the dehydration of nickel
oxalate dihydrate (1). This is interpreted to moan that the
water molecules are associated with the oxalate groups possibly
through hydrogen bonding.
et:
0-‘
0•$
1
1.1
F. / cryRe 2.
a-SS I x 10 3
1 .4 a•h.i atf
111■1■

, REPARATION OF ANHYDROUS FERROUS OXALATE
ILIMMETIO: It can readily be shown that some decomposition
(apart from dehydration) takes place when ferrous oxalate
dihydrate is heated for several days at temperatures greater
thall 105°C. The colour of the sample changes from
yellow to brown, presumably duo to the formation or iron oxides.
If it is assumed that equation (1) holds for' temperatures lower
than the temperature range over which measurements were made,
then the calculated vapour pressure at 87 00. is less than i mm.Hg.
It was decided, therefore, to conduct a vacuum dehydration at 87 0C,
on the dihydrate in the hope of preparing anhydrous ferrous oxalate,
Ci...P. ..11-3111a2a - (a) aperatus:- The vacuum pistol was of the usual design (3)
containing phosphorus pentoxide as the dehydrating agent. The
pistol was connected to a "Como Hyvac" rotary oil pump via a
liquid air trap.
(b) Procedure:- Ferrous oxalate dihydrate was weighed
directly from the desiccator into a weighing bottle and then
placed in the vacuum pistol* A 70-30% mixture of n-propyl
alcohol and water was heated to give a vapour temperature of 87 00.
The salt was continously evacuated at 87°C. for several days until
constant weight was obtained. This weight, was, however, greater
than thetcorresponding to anhydrous ferrous oxalate and was
presumably due to traces of water which could not be removed at
that temperature, If any decomposition

IOW 7
of the oxalate had taken place then the final weight would have
been less than that corresponding to anhydrous ferrous oxalate.
The procedure was repeated at 95 0C. and again constant
weight obtained, nowever, this weight was, within experimental
error, identical with that expected for anhydrous ferrOus oxalate.
(c) Analysis:- Ferrous oxalate dihydrate and the product
formed by dehydration of the salt at 950C. were analysed fov '
ferrous iron and oxalate composition. The details o: the
analytical procedure are given in an appendix to this section.
RMILTS:
Table 3 gives the average ,results of four independent
analyses on both the dihydrate and anhydrous salts.
Table III
Ferrous Oxalate Dihydrate Fe C2 04 . 2H20
Percentage Composition
, e
-1-4- CI 0 ' ' 2 4
31.05 48,93 20.01 Calculated
30,92 48.90 - Observed
Anhydrous Ferrous Oxalate Pe C2 04
Percentage Composition

8
DIWOSSION:
The analytical results are sufficiently - close to the
theoretical values to state that anhydrous ferroua oxalate can
be prepared by vacuum dehydration of the dihydrate at 95 °G.
The material so prepared is a brownish yellow amorphous solid.

APPENDIX
Yerrous oxalate dihydrate and the product formed by
dehydration of the salt at 95°C. were analysed for ferrous
iron and oxalate composition by the following procedure.
A weighed sample was dissolved in dilute HO e 4 and
made up to 250 ml. with boiled out distilled water. An
aliquot of this stoc% solution was evaporated with concentrated
H2804 to decompose the oxalate present. Dilute UM was added
and the iron reduced to the ferrous state by stannous chloride.
Eercuric chloride was added to react with the excess Sn012
and "Zimmerman Rhinehare solution added. The solution was
titrated against lihn04 standardized against A.R. Na2 0204,
This titre gave the total iron present in the maple.
A further aliquot of the stock solution was titrated
directly with potassium permanganate at 60c, thx 0 oxidizing
both the ferrous iron and the oxalate present. The latter
titre was exactly three times the titre required to oxidize
the iron alone, indicating that no decomposition or either the
ferrous oxalate dihydrate or the anhydrous material had taken
place prior to analysis.
To check this result an aliquot of the stook solution
was titrated directly with standard potassium dichromate.
It was thought that only the ferrous iron would be oxidized
leaving the =elate unaffected. The rosults were inconsistent.
To test whether this was due to the IndicatWused (diphenylamine)
repeat titrationo were followed poteniometrically, using a nullard
magic eye poteniometer titration unit' Oaturated calomel and

(Appendix.. Cont.) 2
and a bright platinum electrodes were used throughout. The
results were ,,gain inconsistent.
In order to prove that the inconsistencies were due
to partial oxidation of the oxalate ions, teat titrations were
done on solutions of ferrous ammonium sulphate containing
increasing amounts of oxalic acid. The results are shown in
Fig. (3). This clearly indicates that partial oxidation of
the oxalic acid takes place, the degree of oxidation being
function of the total oxal2te concentratiOn. In addition, the
reaction vas slow In cold solution, the value of the titre being
function of the time taken to conduct the titration.
Titrstionsof the stook solutions with potassium
permanganate were also followed potoniomatrically. The
increased steadily up to the point corresponding to
the comp4ete oxidation of the ferrous iroa. Further additbna
of the reagent caused a very sharp increase in E. -ral.Y., character
istic of an end point, but on standing this fell to almost the
original value. further addition of potassium permanganate
caused gradual increases in n.u.r. until all the oxalate was
oxidized. At this point further addition of the reagent
caused o large increase In 8X.P., indicating that oxidation
was complete.

0 10 2.0 30 So VOL-UM e OXALIC 14c1). (c.c.)
21
e.

ZW,TIO-71 II

SECTION II
KINETICS OF THE OX DATION OF NICKEL POWDERS
LITERATURE REVIEW:-
In recent years the immense technical uses of metals
subject to strong oxidizing conditions has led to considerable
research into the extent, .rate and possible theories of oxidation
of metals. until 1953 there existed a large mass of unoorrelated
literature, but in that year a comprehensive review was palished(4).
While it is desirable from the author's point of view
to summarise the existing publications, these have been covered
so adequately in the above review that no detailed summary will
be attempted. Rather, certain ideas and theories which form a
background for the present work, together with some recent
pertinent publications, will be mentioned.
Several impirical oxidation laws have been found to
hold for pure Metals. These are most conveniently given in terms
of weight increases Ara and time t*
They are -
4. Linear Law:
,6m =t 1 .
where k1 is a constant.
2. The Power Laws: (4m) 2 k. t (2) simple
parabolic.
00 2 = k . t (3) modified parabolic.
(1 )

kb.t (4) quadratic.
0 10 3 = ke .t - -(5) oubic.
Of these the parabolic are the more important.
3. The Logarithmic: Lawa:
a (a ke . log. (a .t +1)
where a ana ke are constants.
The oxidation time relationships are shown in pig. (4).
A given metol may follow (1117ferent equations depending
on the conditions. 'Cietels which form protective oxide coatings
usually follow some logarithmic plot at low temperatures, but at
higher temperatures this usually givee way to one or more of the power
laws, Vernon et al (6) have shown, for example, that the oxidation
of iron follows the equation -
LI m k.log (a.t +1) + b below 20000. but follows the
parabolic equation
(a m) 2 k.t above this temperature.
Oimilarly, copper has been shown to follow logarithmic,
cubic and parabolic laws in succession (7) (8), while aluminuim
follows a logarithmic law below .A0-500 °C. (9) (10) 0 but a
parabolic law above this temperature.
Various logarithmic equations have been etaployed to tit
experimental data. Theee may be simple, as found by Vernon at al
(ii) for zinc, Or more complex, as suggested by Lustman and Mehl (12).

444
3
It may be pointed out however, that almost any proceea
which tends to come to a standstill after a while would
approximately conform to some kind of logarithmic equation, the
degree of fit depending on the number of constants involved in
the equation,
There are several factors which play an important
part lu influencing the type of oxidation law which a given metal
will follow. These have been adequately covered elsewhere (4)
and will only be briefly mentioned.
One factor invelved is the type of compound which the
metal can form under the given set of conditions or temperature,
pressure and composition or the gas phase. The possible
compounds will not only be those that are thermodynamic -811Y
stable, but also those metastable compounds that have small
positive tree energies or formation. These must be included
because the energy states at the interface differ considerably
from those in the bulk material. Thus metallic- compounds which
are normally Unstable in the bulk or standard state may be
formed on suitable surfaces. Nickel l for example, forms only
one stable oxide Ni 01 but Ni2 Q3 may be grown on surfaces Of
AL2 03 and V102 on TiO2 (13), Wustito PO is normally unstable
below 57000. but Gulbransen (14) has detected it 4n film at
temperatures as low as 400 000. In this regard it. may he noted
that the nickel powders used in this investigation are quite
different from nickel in its standard state.

4'
The rates of most surface oxidation reactions vary
with temperature according to an equation analagous to the
Arrhenius equation -
- QAT Ac
where the term activation energy is retained for Q and A is a
constant of dimensions depending on the dimensions of k.
The equation is al:plioable to reactions following parabolic (15),
linear (16) and loganthmic (17) equations. In some cases there 1 Is a break or bend in the graph of log k•L , tr corresponding to
an equation of the form k A e gil/RT 4-A 0 - Q2411: 2
suggesting that two processes of different activation energies
are rate determining in two different temperature ranges.
;312ch is the ease An the oxidation of copper (18).
Gulbransen (19) has attempted to apply the Eyring
reaction rate theory (20) to oxidation processes and in the
case of parabolic oxidation Obtained the following equation - X A
2kT 68/Rm irT e .• • 4 . .e
where 1c13
is the parabolic rate constant,
k
is the Boltzman constant:
h is.Plank's constant
and d is theclosest cation distance in the oIlde l asauming
cation diffusion is the rate determining step.
86 and &H are the entropy and heat of activation
respectively.

A X Moore (21) has evaluated values for andinL
for some pure metals6 However, the interpretation of the
fluctuations in 63* is confusinR and it is debatable whether
this more detailed approach lo at present warranted.
The effect of pressure on the rate of oxidation has
Yielded some information on the mochonism of oxidation (22 1 23,
24 25) but generally speaking the position is confused, especially
at low pressures* No satisfactory explanation exists for the
"critical pressure" of Wilkins and Rideal (26) (27)*
The preparation of surfaces prior to oxidation is
of special importance. The effect of contamination or the
• surface by polishing agents, the influence of annealing
temperature and the effect of repeated reduction with hydrogen
on the oxidation of metals to well known and is adequately
discussed elsewhere (4,)* The effect of pores ' cracks and
blisters on oxidation rates 'lac been noted by many workers,
but little systematic work on this aspect of the subject has
been undertaken because the effects are hard to reproduce*
The texture, structure and orientation of surface
films hao received considerable attention in recent years.
However, the experimental observations are not always in
agreement (28)(29). A more detailed investigntiOn in this
aspect is required before theoretical and practical results
can be correlated.
Disagreement also exists between results on the rate
of growth of oxide films on different crystal faces.

Thus Rhodin (50),and Gwathmey and Young (31) have observed
different rates on different faces of copper, but B lo einka
polling and CharlesbY (32) do not observe this difference in
the case of aluminItm. Hgwever, no satisfactory correlation
of the variation (if any) ie possible in the absence of
essential data on interfac1:11 energies.
The purity of the metal has been shown to have a
pronounced effect on the oxidation rates.
Hubaschowsky and Von Goldbec (33), in reviowing
the publications on the oxidation of nickel, note a difference
of one power of ten in the oxidation rates, the lees pure
41" qualities giving the higher rates. They suggest that
manganese an.& to a looser extent iron as impurities are
responsible for deoreasing the resistance to oxidation.
Wagner and Z.imens (34) have altered the oxidation rate of
nickel by adding impurities of difference valence.
Such experiments have verified the prediction or Wagner, for
metals forming layers of metal deficit semi-conductors.
On the othor hand, the mechanism involved in the
oxidation of zinc is the reverse of that of nickel. Hauffe ()5)
has predicted and obeerved that high purity zinc is oxidized
faster than material of lower quality. Generally speaking
impurities that are chemically similar to the base metal have
a smaller effect than chemically different iEgpuritiez. Thee
latter impurities, even in small amounts, may have a pronounced
effect.

MOP
The theoretical position, with regard to the
ozidation laws, is far from complete.
The parabolic law to which most metals conform at
high temperatures hae been accounted for by the Wagner theory (36),
At low temperatures the Mott bra theory (37) has beep
partially successful, but in some respects has been shown to be
incorrect (38). At intermediate temperatures different metals
Obey various rate equations but no comprehen*lve theory exists
for this temperature range. Gome aspects of the major theories
will be briefly discussed, but no detailed sumary has been
attempted.
MODIBM-.3 THEORY
WeSher's theory (36)(39) of oxidation of metals is
confined to surface reactions that obey the parabolic time law,
and for which consequently a true diffusion PrOcess of ions
in the oxide lattice is rate determining. The theory, summaries
of which are given in several papers (40 Xi ) (42), is based on
the model of ionic and semi-conductors, which is discussed at
length in the review previously mentioned (4). 17agner derived
rate equations involving known or mesaorable quantities
(transport numbers, decreases in free en6orgy etc.) and was able
to calculate rate constants. The agreement between the
calculated and Observed results iu excellent (4), indicating the
essential correctness of the Wagner model. In recent years
the basic qagner theory has. been extended and improVed, the

8
most notable contributions being those of Eauffe (43) and
GrimleY (44). Radio tracer studies have recently provided
further confirmation of the Wagner model (45). Various
experiments have been conducted to test the validity of the
theory by adding impurities of different valence to that of
the base metal and observing the change in the rate of
oxidation. :without exception the reaulM) have been in
agreoamnt with the theoretical predictions (46)(47))(48).
It has been shown experimentally, that many metals
when exposed to oxygen or air at room temperature oxidize
very rapidly, but after a few minutes the rate drops to very
low values when a film 20-.50 R thick has been formed: The region of thin film formation in whioh a limiting thickness
is not exceeded may extend to higher temperatures. At low
temperatures metal oxides, in general are good insulators,
and if the film grows as a result of diffusion of Metallic
ions and electrons, then the Wagner model cannot explain the
oxidation at low temperatures. Mott (37)(49) has provided
an explanation which accounts for some but not all of the
results* Mott suggests that as the ions cannot diffuOe
through the filal at low temperatures, the electrons pasa from
the metal to the oxygen adsorbed on the surface of the film
either by thermionic omission or more probably by the tunnel
offect.

By a development of this idea Lott and C4brera have
Qualitatively accounted for the growth up to a limiting
thickness. These authors have also extended the theory
to consider what happens at somewhat higher teiaperaturec
when oxidation laws other than parabolic have been found
to bold. Allen (50) summarising published and unpublished
work writes %'everal aspects of the Uott Cabrera theory were
subjected to experimental test:- the limiting thickness
critical temPorature for growth without limit and saturation
pressure were in satisfactory aveemcnt with the theory",
Recently Orimley and Trapuoll (51) bave suEgested
corrections to DOM of the assumptions embodied in the
Lott-Cabrera theory. These authors have shown that certain
extensions of the Lott theory, to account for the different
growth laws found at higher temperatures, are incorrect and
have given alternative equations. These modified equations
arc in better agreement with recently pUbliehod work (52)
(53) than the original Mott equations.
The tunnel effect mechanism ProPneed by i:!ott 'has
recently teen revived in a new form by nauffe and Ilschner
(54). The work of 2chewble4 (55) on nickel and, Hart (56)
on aluminium provide experimental proof of the predictions
of Hauffe and Ilschner,
The approach to the problem instigated by Mott
certainly deserves attention and further elaboration should

-Or contribute zcne16embly to tho gill/ theory or oAidation oV
mtalc*
Elvanz (57) h3n „;,ropo4.3e'd a sclera' es*ation tAion
r4he onicbtion rate $e, controllyR )1,weity by' covemnt thro8h
th fcoU. limltik; Caoet,' of ttbo General eWation oxict o
the c± 4i pallabolle lEo. Qua tir4c invovz.e lo8a1M4ic law.
when othQr factort) ouch ao bounaary a'cractiono IlaNO puvtiol
or eOmpicte control* tLece cqvationb are iaoolfirza to cive
t icorabollo and w;gAilinw,=, 2,MIZ l'CQVCIOtiVOlro -Awn
the etreotive ore variao with tiar:,1 tiqe2 ,41 urc otb,cr choacoe
loadith. to voriouo logarithmIc lprme The '..A.faaa approach
i) cmticraotory in exp4aininki uom or the uzperim4mUl
reaulta ty4t iu inadequate In othtw cooee.
-=y aumware the pnt potAtion co felloo#
„at high, tev.rpc:;:tin tare etepareAbolio itw
alauwt Cal IOC tala• Thc:oyntioul, argar4lcnto ) otartiin from
(4111%-aocint tv,4gcniiwa t, viz. (ma '?-,ttffvarA, provide au
interprotntion at the; =041.1111o%
:A /ow teaperaturee the )1iott Uabrera zauorY,
tof3Qthda, with the wodiilecl fora Cita;,ZQ WA by Critaley trna
Tmpnotl k (1,1eacriti,a moyza but not ull We the f;xweiwpntal
z--Goidiltcz• approaen Ivalnl• olzo vzolointi oo.7740
uzr4riglatal goc;tores
intcx-iagliate terapGrat,reeerøgteatioien, esiatOs

The Wagner mechanism does not hold end the Mott theory,
together with modifications, is inadeQuate in a number or
cases, Lvans can account for some results and has even
suSgested theoretical equations for which there are no
experimental results (58). In other cases no sati ractorY
theoretical explanation exists (59).
Further work, both theoretical and experimewola,
is required, especially in the moderate temperature range..
It was hoped that the result* of this investigation, as well
as being an addition to the experimental data, weuld thro
some light on the mechanism by which metals are oxidized at
moderate temperaturee.

12 -
F.XPERIMENTAL:
1. RegAento
(a) Nickel:-
Reagent grade nickel oxalate dillY4rate was
decomposed in situ at 330 °0. to yield finely divided nickel
powders. Previous work had shown that the only other detectable
product of decomposition was carbon dioxide (60). The actual
procedure used will be described elsewhere.
(b) 0A0la: - •
This was was prepared by the thermal decomposition
of . potassium permanganate. The salt was packed into a lone
A
thick Walled tube connected to the vacuum system vie a liquid
air trap. The tube was evaouat•d for one hoar, beIng gently
heated during this time to remove adsorbed fcaei Oxygen generation
was then commenced until a pressure of 20 cm. lig. was developed in
the systeilk This flushing gas was then pumped away and keneration
Continued until th storage bulb was filled to a. pressure of
approximately 70 cms.lig.
2, 14ppratuo
A diagram of the apparatus is shown in fig, (6).
During the investigation the aPparstue was modified considerably.
A description of the modified apparatus will he given under a
separate heading,
The oxidation apparatus was similar to that used
to study the thermal decomposition of nickel oxalate. It

t•
g.41 /
fi11% A

4 ,
13
consisted of a wide bore glass tube, the lower end of whioh was
fitted with a cone and socket (8). The upper portion of the
tube was surrounded by a ten inch furnace, decribed under a
separate heading. l'he sample was suspended in a glass
ampoule (A) by a thin platinum wire wound round a winch 011)
at the top of the chamber.
The volume of Oxygen used in an oxidation run
was measured at constant pressure by a 0-53 ecs. water jacketted
burette (13), The level of mercury in the burette could be
varied by means oV n mercury reservoir(R) suspended by a cord
pausing over a pulley () to a winch(H) attached to the bench.
This winch could b,a kept in any position by a pin which
inuarted into anw one of a series of holes bored into the winch
axis.
The pressure in the system was kept constant by
using the levelling device in conjunction with a differential
oil manometer CO containing apeizon oil, The system could
be evacuated through tap T by a pumping system consisting of
a rotary oil pump, mercury diffusion pump and a trap cooled
in liquid air. This system was capable of attaining a vacuum
of at least 10 "a5 ual4i1g. A Wcioeod gauge and a Pirani gauge
were eloo inaorporated in the system.
The volume or oxygen admitted to the reaction
chamber could be variod by means of a small bulb (0) which
could be isolated from the rest of the system by tapsT3 and Tie

The volume of this bulb was mcaeured before attaching to the
system by weighing the volume or mercury it contained* This
volume of oxygen at a preesure recorded On a mercury manometer
could be expanded into the oxidation apparatus.
The volume Of the oxidation apparatus was
calculated by allowing a known volume or nitrogen a a
measured pressure to expand into the evacuated system, tLe
final pressure being recorded. The volume averaged ovi_rton
determinations was 2921t1 ceo.
a.43-401-
Oeveral difeerent types or ampoules were developed
;la the war.1;, proipoused but victual y they reinainod the same.
They consisted of thin walled pyrex tubing drawn down into a
strong oapillary at ono end, which was then bent in the form
of a hoOX. A loose plug of glass wool was packed into this
constricted end, the sample weighed into the tube and shaken
down towards the constricted end. The walls of the tube
were then cleaned with a pipe cleaner and the open end sealed.
In later experiments the gleaui wool wat omitted and au a further
modification the ampoule size was incased arid the bottom face
blown flat. Fig, (5) illustrates the ampoules developed.
Fu„, _____Id Control. Unit : •
The ten inch furnace (SP) (fig.(6)) consisted of
a nichrome winding on a wide bore Silica tube. In later
experiments the silica tube was replaced by a steel tube of

(a) ( 4)
(d)
Ff C/ IrCE

larger diameter. The furnace could be raised or lowered around
the reaction chamber by means of two clamps rigidly attached to
the furnace and sliding vertibally on a metal bar attached to
the framework of the vacuum system.
The temperature Of the fUrnacc was controlled by
means of a platinum resistance control unit. Mc platinum
resistance wire (D) of 20 Chms, resistance at room temperature
was non inductively wound on a oled strip, protected by two
further miba strips and placed in the furnace tube. The
Control unit was designed and constructed by the acctrical
:GngineerinE Department of the University of Trisw5nia. The
operation was satisfactory for several uouthii, at a time, but
occasionelly the unit broke down with drastic resalta, A .
Ounvic Ccintrol Unit was used in later expsriments, ith
either control unit the temperature inside the furnace could
be maiatsined at ±- 1 ° C. over the an TOO-800°G,
The temperature gradient inside the furnace was
measured with a thermometer suspended at various heights up
a wide ;ore glass tube placed in the furnace tube. Fig. (7) '
illustrates the results. At a point about.mid-way up the
furnace the tevxrature gradient was less than 1 °C. over a
length of one inch.
During an oxidation experiment, when the furnace
we raised up into poltion, tho ampoule vas wound up inside
the tube such that it was in that section of the furnace where

■
13 0
12.
/0
A./crone 7
0
3/0 3z0 330 340 TE An P€RATu RG
16.

- 16 -
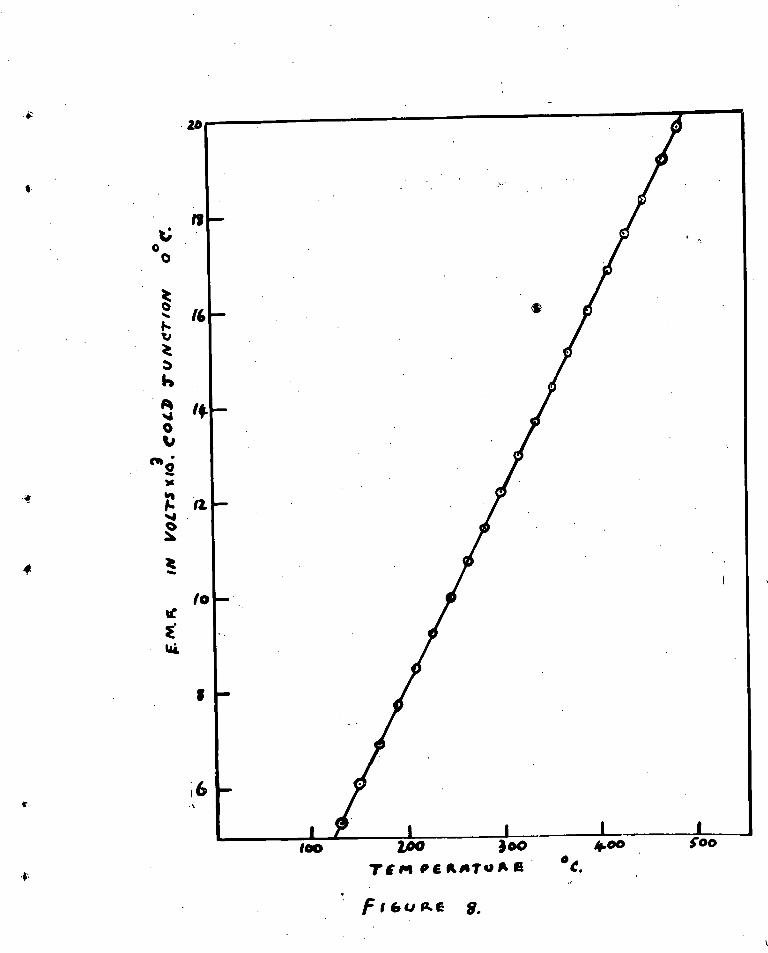
the temperature gradient was least. The temperature at thi,
level was measured 4'a chromel p alumel thermocouple
pushed up inside the furnace tube. The thermocouple !) with
cold junction immersed in a dower vessel containing crushed leo
was connected to a Cambridge Vernier potonloaetero
The could be road to 0.00001 volts. '
The thermocouple was calibrated against an accurate
thermomotorit the calibration graph being shown in fig.().
Modified Apparatus :
Because or the Inconsistency of the results
obtained with the apparatus just described it as decided to
modify the apparatus and techniqueo It was desirable to
construct an apparatus capable of surface arca measurements aa
well so kinetic work. .Therefere the following modified
apparatus was constructed.
Fig.(9) illustrates the apparatus. It consisted
essentially of a saelPle bulb (A) of approximatelY 10 cos.
capacity sealed to the end of o capillary tube. Two burettee
Bi and B2 were included in the ayetem, B i being required for
surface area measurements and B 2 replacing the 0-50 cos. burette
lr used in the kinetic work. lurotto 1102 wao calibrated before
connecting to the system by weighing the voluae of morcurY
contained between enrke on a graduated scale attached to the
rear face of the burette. The mercury level in the burette
could be Varied by the winch and PulleY gYstem described earlier.
6
100 2.00 300 TEM VElliiVrellE
Ft6ume 8.
400 • c. foo
4
4
I.

•

- 17 -
The differential oil manometer was replaced by
a mercury manometer (M). This manometer, which was designed
primarily or surface area measurements, was fitted with two
platinum contacts (C 1 and C2 ) spot welded on to tungsten-
seals through the walls'Of the manometer. These contacts were
wired to a 2 voilt supply such that when the mercury was in contact
with the top platinum wire a 61,1811 lamp (L) was illuminated.
The volume of mercury 'in the manometer could be
varied-from . the reikTvOir0.9 1.Alth Such an.arrangement the
mercury level in the left hand limb'of the manometer could be
adjusted to exactly the sawe level each . time a pressure
reading was made.
The volume- of tWtubingeOnneeting the burettes
and-
ample bulb was'deterMined ka6before, by measuring the
drop in pressure when nitrogen' alloed to expand into
the evacuated system.
Expe imrital2rocedurq.:
The, aCtual procedure adopted was different for
the modified apparatus and , therefore will be discussed under
a separate sub-heading.
)- Ampoule A4A.EAUs
The ampoule coiiain1ng,a ,v;eighed amountor nidkel
oxalate (=C405 was attached to the platinum wire and
would up into the lower .section or tubs. The cone and socket Were sealed with apiezon grease and the apparatus evacuated
18 As
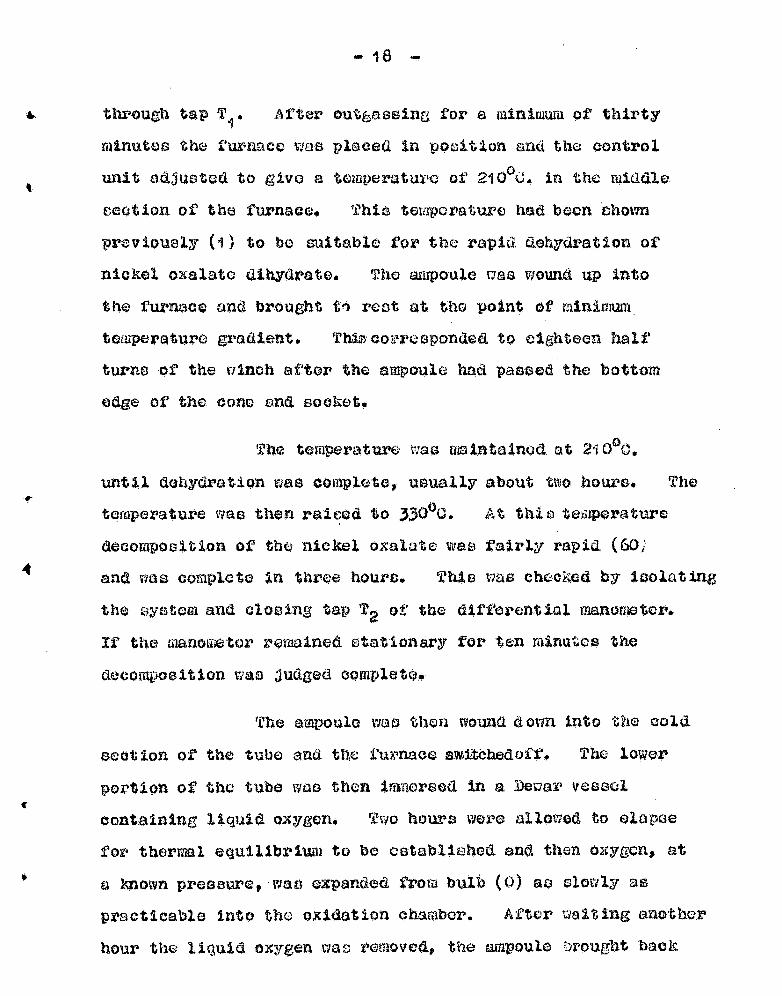
through tap Ti . After outEaseine for a minimum of thirty
minutes the furnace was placed in position and the control
unit adjusted to give a temperature of 210°C. in the middle
motion of the furnace. This temperature had been ohown
proviouely (1) to by suitable for the rapid dehydration of
nickel oxalate dihydrate. The ampoule rtes wound up into
the furnace and brought te root at the point of minimum
temperature gradient. Thizcorresponded to eighteen half
turn° of the winch after the ampoule had paSeed the bottom
edge of the cone and socket.
The temperature was maintained, at 210 C.
until dehydration was complete, usually about two hours. The
temperature was then raieod to 330 00. At this temperature
decompoeition of the nickel oxalate was fairly rapid (60;
and was complete in three hours. This was checked by isolating
the system and closing tap T 2 of the differential manometer.
If the manometer remained etationary for ten minutes the
decomposition was judged complete.
The ampoule wee then wound down into the cold
section of the tube and the furnace switcbedoft. The lower
portion of the tube was then immersed in a Devar vessel
containing liquid oxygen. Two hours were allowed to elapse
for thermal equilibrium to be established and then oxygen, at
a known pressure, wan expanded from bulb (0) as slowly as
practicable into the oxidation chamber. After waiting another
hour the liquid oxygen was removed, the ampoule brought back

to room temperature and the eguilibriumexygen pressure recorleA
4., Since all volumes and pressures were known the voila= of oxygeL
absorbed by the nickel sample as readily calculated.
Tho oxygen pressure in the system was then adjusted
to 5 cmo.lig., this figure being used in all runs. The
furnace van placed in position and its temperature controlled
to 300°C. The ampoule was wound up into the furnace and tile
time when the ampoule entered the furnace was notod. The
reaction commenced Immediately as indicated by a rice in the
level of the left hand arm of the differential manometer.
The mercury level in the burette was raised a notch or two
on the winch until the manometer fell to below its equilibrium
level. The time when the manometer level again reached the
zero mark was noted and simultaneously the volume reading
taken from the burette. The oil manometer could be read 1 to about n. oil, i.e. about 0.01 mm.Hg. Readings were
continued for about one hour, the reaction rate being very
slow after this time had elapsed.
(b) idodified_j2A A weighed amount of nickel oxalate dihydrate ( 4 gm.)
was placed in the unsealed bulb (capacity 10 cc.) attached to
the end of a capillary tube. A glees bead was inserted in the
capillary entrance thus preventing the powder falling into the
capillary. The sides of the bulb were then cleaned and the
blab sealed. The bulb was then righted, the glass bead fulling
back into the mass of powder and the capillary attached to
the apparatus at point X fig.(9). The sample was outgaseed
4r,
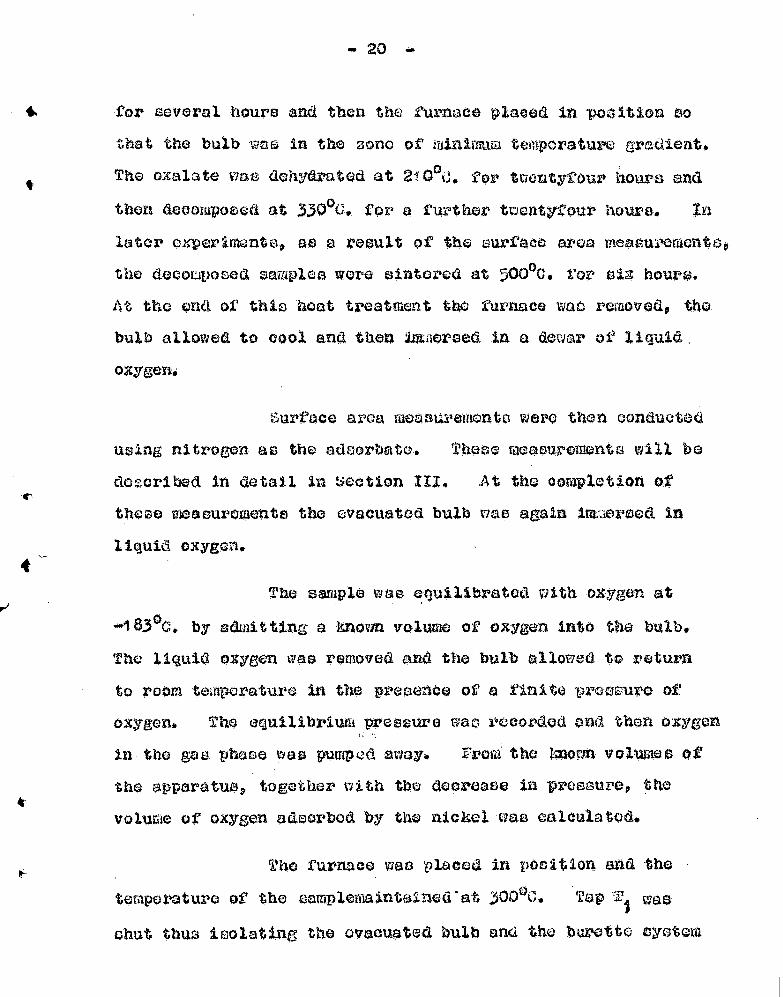
- 20
for several hours and then the furnace placed in position so
that the bulb was in the sone of minimuw temperature gradient.
The oxalate was dehydrated at 210 °d. for twentyfOur hours and
then decomposed at 330 00. for a further twenty-four hours. In
later experiments, as a result of the surface area measurements,
the decomposed saNples were sintered at 500°C. for six hours.
At the end of this heat treatment the furnace waa removed, the
bulb allowed to cool and then imaersed in a dower of liquid
oxygen.
Surface area measurements were then conducted
using nitrogen as the adsorbate. These meaourements will be
de2cribed in detail in Section III. At the completion of
these measuroments the evacuated bulb was again Maraersed in
liquid oxygen.
The sample was equilibrated with oxygen at
-183°0. by admitting a known volume of oxygen into the bulb.
The liquid oxygen was removed and the bulb allowed to return
to room temperature in the presence of a finite pressure of
oxygen. The equilibrium pressure was recorded and then oxygen
in the gas phase was pumped away. rrom the known volumes of
the apparatus, together with the decrease in pressure, the
volume of oxygen adsorbed by the nickel was calculated.
The furnace was placed in position and the
temperature of the semplomaintained*at 300 °C. Tap 1'1 WEIS
shut thus isolating the evacuated bulb and the burette system
4

21 -
was filled with oxygen at about 5 em.fig. pressure. The
mercury level in the Manometer was adjusted such that the
light (L) was flicking On an off due to the vibration of
the mercury surface in contact with the platinum wire.
Tap Ti was opened and the time noted. The pressure in the
system fell, but this waticoUnteratted by raising the mercury
level in the burette. The level Was raised until the light
Was julat extinguished. The time when the lamp again became
illuminated,together with the burette reading, was noted.
The level in the burette was then raised by another notch On
the winch and the procedure repeated.
In later experiments the fUrnace was replaced by
e vapour bath similar to that shown in fig.(ib) and kinetic
measurements were undertaken at 180 °C., the boiling point of
aniline*
ustga.s. The results have been divided into two groups:-
' (a) Kinetic Results,
(b) Modified Apparatus Results.
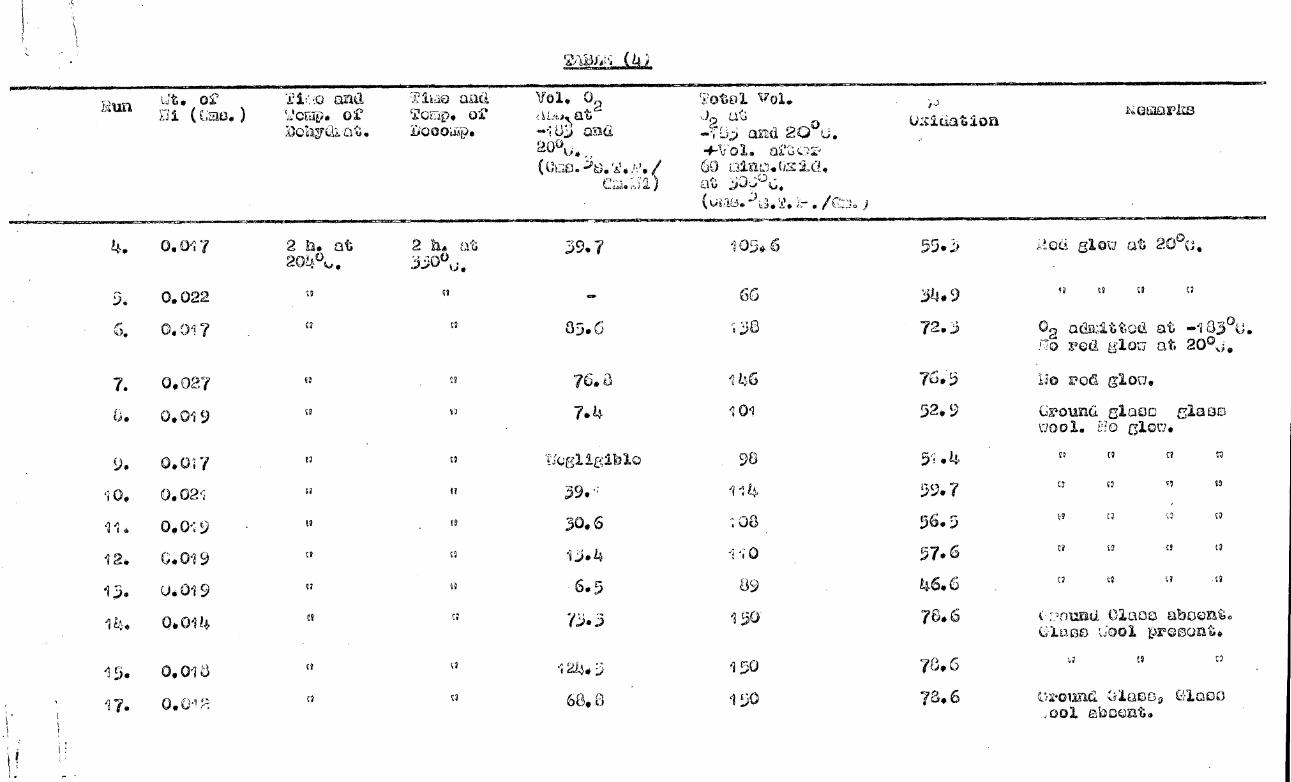
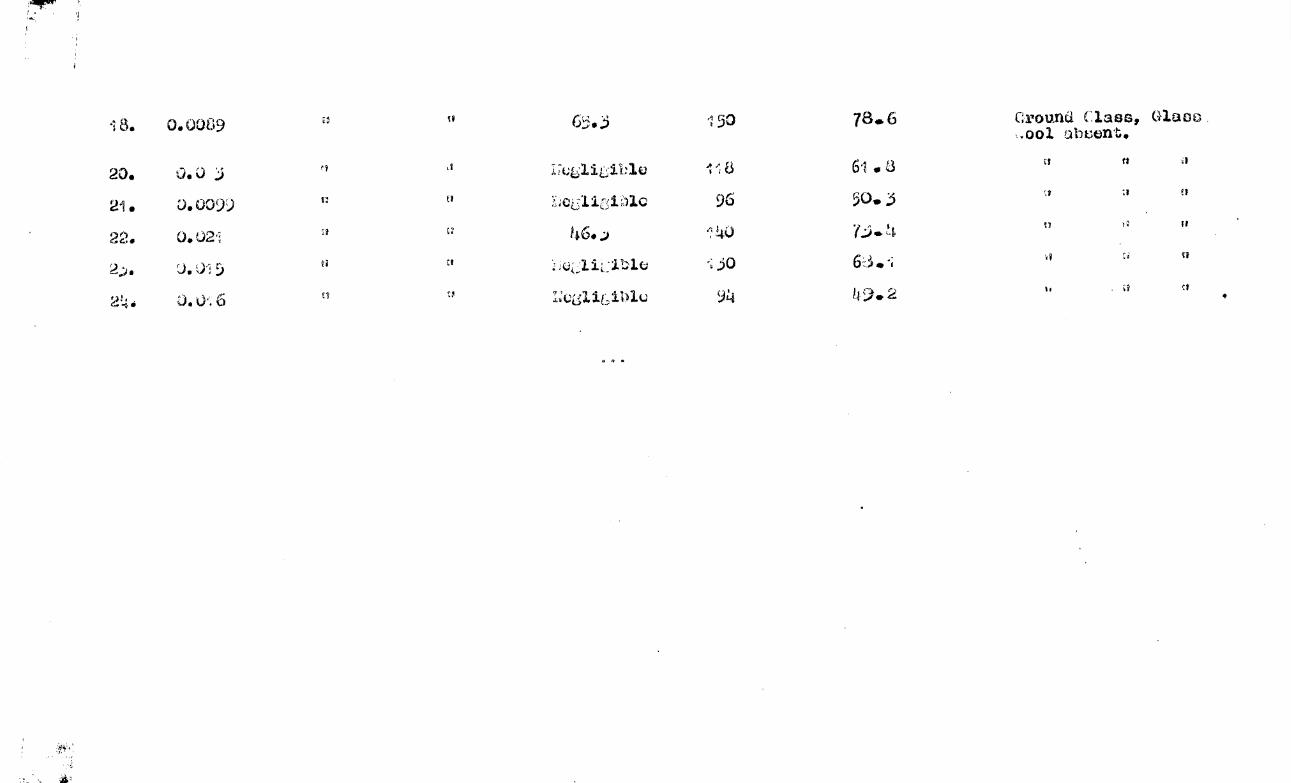
,Kitnetio Result
Table (4) lists data relevant to some twenty
kinetic runs. . The results are plotted in fig.(10) and fig.(11).
2,42(21...fLedjsza...........atua Results
These results have been further subdivided into
two groups :-
4.
Run o0 (Cau.)
Tiida aad ToElp.
and r2oup. ok :aohya/at.
Vol. 02 412,J, at
c.
and 2(Pu.
KotoarLs Total vol. J u"6
and 20 L. 4-1,1 01. a;( -,- 60 Dino. Os Lb2, at
L.34) • t'--zo 110..1.0111P.131.10c .106111.6.10.01.01014
105. 6
66
i46
101
98
114
; 03
89
150
i50
150
55..3
34.9
72.)
76.5
52.9
5.4
59.7
37.6
L6.6
76.6
73.6
78.6
sloy at 20°o,
0
02 adill.ttod at -133 °0, FTo rod glon. at 20°,
Lo pod glous
Cround slaoc slaws L?o slow.
0 0 Cl Cl
0 0 c.9 0
0 0 0 Cl
Cl 0 Cl Cl
Cl 0 0 .0
tounO elapo aboonto ClnooOOlproount.
uouna la33 1 Clcoo ,00l ebooxt.
7.
6.
9.
;O.
11.
12.
1,5.
15.
17.
0.0ei 7
0.022
04 017
0.027
0.019
0.0i 7
0.021
0,019
0.019
0.019
0.0i
0.013
0.01',-;
2 h. at 204°
0
0
2 b. tAt 3j0° U.
0
H
0
0
C ■7
39.7
35.6
76,3
7.4
k,E)12z4ble
39..
30.6
6.5
7.... 3
va4.)i;
680 0
1 8. 0.0089
20. O. j
21. 0.009)
22. 0. 0ai
5
244 O. Ue. 6
150 78.6 Ground Class, Glaso ,wool abeent,
ITQLlicible 118 61 • 3
'?1•;0612.4Ac 96 50. 3
I;c“1 it; il)1(..1 94 49.2
a • 0

•

01.
3 • ?N vine4 •)•., 3 w ioA

-22 -
(1) fjurface Area Result
(2) Oxidation :Results.
( 1 ) Svface Area kcsults
Details of the surface area •amasuremente are
Kiven in k;ection III but some relevant results will be mentioned
here.
(i) The thermal decomposition of nickel oxalate at
330°C, yielded nickel powders the surface areas
of which varied in the range 22 -11 m2/gm.Nis
(ii)An increase in the time of decomposition at constant
temperature resulted in a decrease in surface area.
(iii) n incr age in the temperature of decomposition
reduced the surface area.
(iv)Identical runs as far asweight of nickel oxalate,
time and temperature of dehydration and decomposition
failed to yield identical surface areas.
(v)After sintering the nickel powders at 500 ,J. for
six hours the surface area was reduced to 2m2/gm.141,
a figure which was reproducible from run to run.
(2) Oxidation Results
Acourate kinetic measurements were not obtained
with the modified apparatus because the reaction was too fast at
300%. The temperature of oxidation was reduced to 180 °0., but
the rate was still excessive. The volumcv of oxygen used

2
together with other data, includinu some surface area results,
are given in Table (5).
IMOUSUION
The discussion of the results has boon subdivided
under the following headings:-
(a) Lodifications made to improve the Reproducibility,
(b) Surface Area Results.
(c) 4roIhorie Character of the A'owders. •
(a) ao ialtic„no . ,,-/up_tc..2.1.miatm.s.ppl. 9,:ibility
A glance at Tablo (4) and fig. (10) and fig(1i)
Indicates immediately the inconsistency of the results. Various
steps were taken from run to run to sta.rUardize or eliminate
factors thought to be effeoting the rate of oxidations. These
steps have been summnrised under the heading "Remarks" in
Table (4) but will be discussed in greater detail.
Admission of oxYgen at room tewperature to the fresh
nickel powder produced a bright red glow in the material*
This vigorous oxidation varied in extent and intensity
from run to run. In an effort to stondardlie this
Irregularity the nickel was saturated with oxygen 4
at -1 83°C. and then brought to room remporature
under a finite pressure of oxygen. This treatment
apparently masked the pyrophoric character

S. A.
a fpr 20 0. Oxid.
Vol. 02 180°0. per Om. Ni
Remarks Run - Time No. and
Temp. of
Dehyd.
Wt. • Wt. iC2 04 Ili
. 2H20
A- s. A. °xi& oxid.
N
'Tot. Ox id. 02 at. per
180°C. Oni. NI
S.A. S.A. Ni
Before After Sinter. uinter.
Time ' Time
and ' - and
Temp. Temp. of . of
Dec omp. Sinter.
a.* 1.085
3.906 1. 2513 go. 7
19.7 4.056 1.303
6. 22 h. at 216Pc.
58.9 1514.2 80.8
22.69 59.63 31.24 194
103.8 54.4 13.2
114.35 33.91 17.77 16..7
7.57 -1,7.43 9.13 .
7.38 16.99 8.90 1 '
117,07 36.19 18.536
AIM
WO
S
TABLD ( 5)
••■■
MID
2.0
2. i
39.0
16.34
21 17
:6.5;4
2...50
2. 89
20. 7
_ 3.66
114.09 •
3.42•
1.56
i 1.52
1.79
19.63
17.28
15:83
2
112.5
43,3
82.63.
27.39
14.44
14.09
32.77
41•1111. 3.34,
4.07
2.86
1.75
2. 1 3
1.33
78:4
556
- 107. 68
89.11 -
13i.09
29.15
56.42
46. 68
<,
83. 9
58.99
1i.7
92.6
43.9
30..91
58.56
48. 5
•■•■
_ -
.
.
21 h. at 203oc.
4. 22 h. at .1 . 96°C.
7. 24 h. at 210°C.
8. 24 h. at 212°C.
$6 23 h. at 208°G,
24 h. at 33000.
30h. at 330°c.
12 h. at 345°c.
23 h. at 346°C.
6 h.. at 500°C.
6 h. at 500°C.
3 h. at 50000.
6 h. at 505oc.
3.
• 4.299 i .380 45.0
4.50 1.445, : ....
4.28 : 1.37 2. 0
136. -0.37
10. 8 h. at 210°C.
.1. 21 h, at 220°C .
12.. 24 ho. at . 220°e.
24 h. at 345°G.
24 h. at 352°C.
24 h. at 33490.
6 h. at 505°0.
6 h. at 503°C.
6 505°C.
1.15 0.374
1.165 0.374
1.137 0.365
Burette Bi off .
02 admitted in two lots. 1 min. between admissions.
Bi off. 02 admitted in two lots. 30 min. between. .
Bi and B2 opened together. Thermo-couple rise 150°0.
B1 admitted Thermo-couple rise 100PQ. B2 admitted after ( 10 min. No temp. change.
1, 24 h. at 202°C.
2.. 21 h. at 20300
24 h. at 3300. 16:1. h. at . 31200.
16 h. at 323°C;
16 h. at 286°(7. 4.115 1.321 15.3 24 h. a t 3300C.

*MUT MOJ V 49140 peuopueqe sem loom
93el2 pue sseT3 punoa2 r4oq jo esn eql os uoT4eoTjTpcm ammo
caTm pouTn4qo EM S3U848T9U00 uT wouleiloadtuT om
is2n/d
loon sse/2 om4 uoom4eq uT po2pam EIVM • 6sse1)2 puno22 tolm poxTu:
401dumo ma a 0 4 013,T vTx14 ezTparpuels o4 4acjja ue u/ sum o4 una
incaj nemplarA sem ftwoupe vino= TJI 'PozTpTxo AAe4o/1moo
sem anoIoo uT oatetto oti4 Aq SUT?pur pue posaedsTp .AlauTj
sem Tomi oti4 o4 RuTacame aopmod TogoTu at goInodwe eq4
uT poen sem loom eseT2 jo 2nd auo Awe uorW
.:toot 8au/2 Jo s2n/d omI fq)
•uomsodm000p o4 aoTad 04eapINTIP o4eTuxo 10X0Tu ota.
M4Tm Poxpri sum ser/3 punoa2 10 ownIoA 'turbo uV
,:sseI2 punoa2 114Tm 2UTxTrl (s)
-poTa4 oaam spo1.4em
aoata •ue2Ax0 ott4 aoj ssepoe aoTseo 2uTmo//e snq4 aopmod aq4
esaodsTp 04 popToop sem 4 /. 'spa. uet14 see/ tIonw RI/ensn pue
Qe ulna J04 199,2 JOA°U 8em uoTUIPT:co eftwepaod oql 4 11%44 loeJ
ma Act Pa4aocVno sT 3Tqa, TozIPTx0 STonTsualx1 2uTaq sem
uoT4aod do 4 aq4 Svc leql p04oa2Rn9 3TqI *Xoviq A/Tenan sem
wo44cq ott4 mum ‘anoToo uT qoT40a9 uoTwod do 4 ot44 pemoqs
uoTleppro aetTe saopmod ou4 jo uoT4euTwexg
T2P-27-3775-"Fr i.10 4:08,ff (TT )
'ound II0 uT Poldope sea oanpaooad oTqa,
•o/dwes pe4ean4esoad 4po4enoeAo ott4 ol pal4Tuipe sem '000Z 412
uoafto jo AIddne tisea5 r uotim poilaosqo sem moI2 plea ou esneoeq

. 25 .
(e) Larger ampoule:-
The size of the ampoule as increased by a
factor of three and the powder was spread out in a thin
layer on the floor of the ampoule. Although the dieperoion
of the powder was good no increase in reproducibility was
evident.
(a) Surface Area , Results
It had been assumed that the thermal decomposition
of nickel oxalate under identical conditions would yield nickel
powders possessing the same properties. However, becauee
efforts to improve the consistency of the run had been
futile it was necessary to check whether such an aaeumption
was justified. Thus, the apparatus wae modified and the
surface areas determined.
Although the surface areas could not be
reproduced exactly from run to run it is doubtful if the variation
is sufficient to account for the poor kinetic results. In the
case of the sintered samples, although no signitbant kinetic
results were obtained the variation in the percentage oxidation
(Table (5)) Would euggest that kinetic plots would be variable.
It may be seen from Table (5) that the volumQeof
oxygen consumed per gramme of sintered nickel at -183 0 and 200 0.
are approximately of the same order of magnitude. This may be
contrasted with the results shown in Table (4), where the samples
were not sintered. This improvement in consistency may be

due in part to theviimillation of the surface area variable
in the sintered samples,
(c) Pognhpric Character of the i'owders
Two Important facts may be seen from the resUlts
shown in Table (5) especially rune 9 - 12.
(1) The extent of oxidation was a function of the volume
of oxygen which could be , dmitted in the first instant.
(11) If two burettes containing oxygen were opened to the
sample together, then a greater volume was adsorbed than if
the second burette was opened one minute aftor the first.
These results suggested that the presaturation
of the nice. at -183 and 20 °c. did not eliminate the vigorous
oxidation due to the Pyrophoric nature or the powders. In
order to test this suggestion a crude calorimeter was built to
measure the temperature rise of the sample when oxygen woe
admitted at 300°C. A copper constantan thermocouple, made
from fine wire, was esmeated to the bottom face of the
adsorption bulb. When a large volume of oxygen was admitted
at 3000C. to the Presaturated sample the thermocouple indicated
a rise in temperature of 150 0C. The temperature rise Was
proportional to the volume, of oxygen admitted in the first
instant. Because or the poor thermal contact, the temperature
rise in the sample was probably much greater than indicated
by the thermocouple.

sb.
- 27 -
These few experiments clearly indicate that
although presaturation at - 183 ° and 200 % did reduce the
effect due to the pyrophileic nature of the powders it did
not eliminate this factor. Further more, the elimination
or control of the other factors thought to influence the
rote of oxidation did not enhance the consistBncy of the
results. These .facts suggested that the pyrophoric nature
of the powders played a donlmting role in influencing the
rate of oxidation.
In view of this evidence, there ia little
need to cowaient on the kinetic plots given in fig. (10) and
fig. (11). i'resumably in the cane of rune 7 and 17, whore
a fast reaction occured, the oxygen was readily available to
the majority of the maple and the temperature rise was
probably considerable. In the other runs where slower rates
and somewhat similar plots were obtained the controlling
factor was probably the passage of oxygen into the wise of
the powder.
As no method of eliminating or controlling
this pyrophoric factor was evident it was decided to
terminate the kinetic otudie0.

MOTION III.
I- .

SECTTOU III
IUTRODUCTION:
AB indicated in Section I/ at a etas in the oxidation
inveatigation it wee decided to measure the surface areas of the
nickel powders. These powders were produced in situ by the
thermal decomposition of nickel oxalate. It was deeiralae that
the surface area measurements would not centaminate the powders
rendering them unsuitable for subsequent oxidation. The
obvious method was gas adsorption at low teuli:oraturea. Deforo
describing the experimental procedure a discussion of the
various iaotherms will be given. The literature devoted to
this subject is, however, so vast that a detailed review will
not be attempted* Instead an examination of some of the more
important papers will be made, with a view to aseessing the
relative merits of the several isetherms.
:
At the 'Um of writinu there are four generally
accepted acourate methods for the determination or the areas
of finely divided solids by gas adsorption* They are:-
1. The absolute method of Harkins and Jura which is based
on sound thermodynamics (6i).
2. The method of 8runauer, Emmett and Teller
based on kinetics (62)*
3. The huttig method based on kinetics (63).

2
4. The relative method or Harkins and Jura based on the
oteristica of condensed films (64).
Of these uothods the absolute mothed of Harkins and
Jura is perhaps the most accurate and has a sound theoretical
basis, However, it is experimentally the most difficult and
cannot be used with porous or coarse powders. Its useful\sess
lies in the fact that it can be and is used to 2tandardi'4e the
other methods. Vor oxample, the Tand Huttig methods
tbemseivos cannot give the area of any solid whatever, since
from the adsorption isotherm only the number N of molecules in
what 10 supposed to be a complete monolayer can be obtained
The area of any solid is given by -
c
wherodrthe mean area occupied per molecule in the complete
monolayer is unknown.
Emmett end Brunauer (65) have given a geomtctrieal
method for calculating the value of or. They assume that the
molecules are spherical and that the packing in the mom:1.-i-
molecular film is the same as the molecules of the solidified
gas in their plane of closect packin& The equation which
they use is -
A = AVagadro's 'lumber S G = density of the solidified gas.
2/3 cr.4 ( 6. 866) (4ri-Pliv. 6-s )
whore U the molecular might

:In Ocrtain caeoe Ss is replacod by (Si tho tif-meity
ot the izie bOVO eVidCrilgo tellaC to ouivec.n the
ikiea ti4t tho fili5 16 con‘Aenwei. and not oolid
Conclonaca,
all/. (C6) givpo on aIi:,err, tiveiI1O O 4alculc3ine
tr tooca on 'clau cr;;8.41 4 i7.3 OctUfr4 ion, ;̀":00 several az...i*ec.1. the
/atUr actbeti tVivet;) valui:s , acreeuicnt 7itti the itioxie
natiellr accepte 3UO rtt Valucc.4
garitinc and_ jera on the other head proWor to
calcul4te the value oCeby coworinz the nuriace•cIeao
with thooe meacured by their abcoluto k,ethed. They have •
calculoted the "correct" aur4ace area of a eample oz onattwo
Uoing, Zpheir oboolU;e method* iWgorytien isothemo eV
evorel 41 -47fercu tt re then detcranod anti tho aurrnoo
areas ealOuItua by the -0.T. mthoe* Thoervaluosnoenoarr
to cave acrecw.int faith the 94 col?rect" eurfoce arca we've
calculcIted aad coiapared with tho valuo6 cbtaincd by tiX
EcouklVkical mothed of il;runauer and Zwal4tt. 141ey conclude
tLt tilt; 3runauer ZaaAutt value° beotwa Llowe 0:;octiw crrar
tha velour ora th tho oace ol' nitro6cn
the i.o4;;t ogaaolly ucca ouviacc amo :i“,aaurcucinte l tito
valuer.; are th1/4; saiAe oithor c.iethoao
E'laxvirlis and .2.;c1ta,,ron (57) ham 1i:ow:laved tho
tallwAegl, odooretlon of $ 4 11 $ i,_;C) and (Y,.$,9 on a emaplo
anateae havine a ouretaao area ot,' ao aQtca.4Lii ed by

4
the absolute method. From tho result° they calcultateder
values Which are in poor agreement with liquid density
measuremento in contrast to the roaulta of flarkins and Jura.
Livingston (68) has measured the adsorption
icothorms of nitrogen, water, propane and heptane on four
finely divided solids. He calculatedcrvalueo for water,
propane and heptane to give agreement with the nitrogen
surface area, however, in order to obtain values which were
in agreement with values determined by density, X ray and
film balance techniques it was necessary tp choose a value
of 15.2 X 2 instead of 16,2 R 2 (the value usually accepted)
• for the man area occupied per nitrogen molecule.
The uncertainty in accepting the Drunauer Ealeett e method or calculatingevaluee is further emphasized by the
reaulto of Doobe, Beckwith and Honig (69). In a paper in
which they introduce the use of krypton adsorption for
surface areameasuremente on materials of low adsorbive
capacity, Beebe*et al find it necessary to assume a value
for the mean area per molecule of krypton greatly in excess
of that calculated by the Brunauer lsett method, in order
to obtain agreement with the results obtained by the liarkino
Jura absolute method, Thla result ia supported by later
work: of Davis and Dewitt (70).

■IbMWINYWN.1.0.6.160040411111111.111010 ,0
v(P0 -0 G Po:
• 41-
46. ■ffla,
The B.:T.T. theory or physical adsorption was the
first and la till probably the best and most oaeful theory of
multimoleculer adsorption, covering the complete range of
pressure. This is not to say, however, that It is really
a satisfactory theory. The assumptions upon which it is
based are wrong in some cases and crude in others lbut' they
are still sufficiently goodto contain a number of important
qualitative features actually obssrV eX.PerlmelltallY0
Brunauer Bmmett and Teller gave a kinetic
derivation (62) of the B.E.T. equation which to really a
generalization of Eangmuir t s kintetic derivation of the
Langmuir isotherm (70. The derivation Involves a
balancing of the evaporation and condensation phenomena in
adjacent layers with the assumption that only the energy of
adsorption of the firet layer differs from the energy of
condensation. The final equation is -
In which V is the amount of gas adsorbed at the equilibrium
pressure 14, Po is the saturation pressure and Vm the quantity
of gas required to form a monolayer. C is a constant which
is a function of the difference between the energy of
adsorption in the first layer and the energy of condensation.
A plot of aspinot 'IP should give a straight line V(Vo Po

4
from the intercept and slope of which the conotant V and C
can be calculated. If the average areacroccupied per
molecule in the monolayer is known the specific area of the
solid may be calculated.
Cassie (72) and Hill (73) have provided a statistical
deduction of the B.S.T, equation. The usefulness of a
statistical mechanical treatment lice in its explicit
provision of all constants, paramters etc* In terms or
molecular properties. In addition the question of paPticular
kinetic mechanisms can be avoided, it being necessary to
consider only the various possible accessible states of the
system.
Theoretical Consid rations
The B.Z.T. theory hoe been severely criticised
because of the several_ unsound assumptions upon which it has
been based. Harkins (74) lists five unsound assumptions.
1. The lateral interaction between molecules in the
first layer can be neglected*
2. Inhoo:.itios of the surface of the solid have a
negligible effect.
3. The energy of interaction or the second layer with
the material underneath it does not differ from that or the th n Layer with the n -I layer where n ia large*

7 4..
Z., The surface energy of the film can be neglected.
5. The energy of adaorption in a layer is independent
of the amount already adsorbed in that layer4
Harkins has also pointed out that it is possible to
describe the solubility of ammonia La water at 20 0U, by a
equation; A fit of experimental data to a B.N.T.
equation le not evidence that the phenomena under discussion
is even one of adsorption.
Hill (75) has attempted to compensate for the
neglect in the theory of the horizontal Interaction especially
in the first layer, but has met with only limited success.
Ualsey (76) has discussed the imperfections of the
B.LT. theory to some Length. He concludes, however, that
refinements to the actual theory appear to destroy rather than
enhance the ability of the B.E.T. equation to fit isotherm
data.
Smith and Pearce (77) have suggested that the whole
basic model of the theory is incorrect. They believe
that instead of being essentially of uniform activity, the
surface of a solid is composed of regions or varying activity.
This approach gains support from oaorimetry studies on heats
Of adsorption.
Pierce, Tilley and Smith• (78) support the idea that

capillary condensation plays a much larger role in adsorption
at low relative pressures than is generally accepted. They 4
base this concluoion on adsorption measurements of several
vapours on charcoal. If this is so then the Vm values are
incorrect and the ourface area values as generally given
'are-much too large.
EEtaLkellS.00.41tratio)la
Despite the theoretical limitation the
equation has achieved conoiderable practical ouccess in
recent years. Nevertheless a number of modifications to
the basic B.E.T. equation have been suggested. In all cases,
however, they are designed to extend the range over which the
equation will fit experimental data, The original B.L.T.
equation is only operative in the range 0.05 4, 0.35. Po
Outside this range the neglect of various factors in its
derivation appear to render the 13.'0.T. equation invalid*
Anderson (79) has modified the'13.2.T. equation by mutiplying
the relative presoure P/po by a factor less then one. When
this factor lies between 0.6 - 0.7 the equation is found to
give a straight line up to a relative pressure of 0.7. The
constant, although impirioal, has been interpreted to mean
that the free energy of adsorption in the second to tenth
layers is lees than the free energy of liquefaction.
Picket (80) has also suggested modifications to
the B.E.T. equation in order to extend the range of fit •of

/ 1 V k
1•111
9
experimental data. The modification necessary is found by
trial and error and once found does not alter the values of
Vm or 0, but simply extends the number of points through
which the straight line way be drawn,
Cooke and Dole (61) amongst others have made seol-
impirical modifications which have led to On improvement in
agreewent with experimental data. Provided a straight line
is obtained for a portion of the isotherm (0.05<PA, ( 0 0 :55) - o
the B.E.T. equations either as such, or modified, gives values
for Vm which arc reproduciblq) and self-consictont with different
gases. if a reasonable value of d' le used the surface areal
calculated from the VIII results are in good agreement with
other methods.
THE IILITTIG130,WyrION
Uuttig (63) has derived an.adeorption isotherm -
where 0 is the D.E.T. constant, by a fundamental modification
or the 13.2.T. argument (62)._ Huttig assumes that the rate at
which the nualber of molecules in the second layer increase°
is proportional to the number of uncovered first layer molecules
(in agreement with the 13.:6.T. derivation) and the rate at which
this number decreases :lb proportional to the total number of
molecules in the second layer (in disagreement with the B.E.T.
theory which uses instead the number or uncovered second layer
molecules). Other-wise the Assumptions of the two theories are
identical.

Ross (82) has examined the theory in some detail
and rergusson and Barrer (83) hav given a statistical
mechanical derivation: Hill (84) has criticised the
equation on theoretical grounds and hae also pointed out the
fallacy in the statiEitical argument of Fergusson and Barrer:
The numerous criticiewo of the B.T;.T. theory can equally well
ho applied to the Mattis isotherm.
Prom the practical point of view the Buttig equation
10 successfUl: Roes (82) hap shown that the Huttig equation
will. give a linear graph up to a relutive pressure or 0.85,
which may be compared with the B:D.T. upper limit of 0.35:
This means that more points are available and hence a line
can be fitted with greater ease and sucuraoi. The
and Huttig equations yield Sim values which are approximately
equal for a given set of isotherm data (85):
Corrin (86) has compared the B.M.T. and Huttig
eguationafor the case of nitrogen and argon at -195 °C. on
several carbon blacks, The author concludes that the
equation is superior to the Huttig giving more self consistent
results for different gases on the same adsorbents'
'Schreiner and XembalI (87) have found, on the whole,
good agreement between the Huttig and b:S.T. surface areas
of eeVeral metallic oxides using different adsorbates:
Barrer, MoRenzio and 11cLeod (88) have compared the

Ii -
D.E.T. and Huttig surface areas using a value for the mean area
per molecule of nitrogen derived from the Harkins Jura absolute
method. In addition these workers have developed a aeries of
type multilayer isotherms which have also been tested.
Agreement between all methods is only fair, a result which
raises the question of absolute as against comparative accuracy
of surface area measurements through adsorption. The authors
conclude that it is not enough to determine the surface area
always by a single type isotherm, but rather to employ a group
of isotherms to check the areas obtained with each against those
obtained with the others. This could give a better idea of
the probable absolute accuracy of such deter nations.
TH4 J3LATIVE hoffli01) OP 1 Y,I/S AND Jii;
This method is similar to both the Buttig and .
B.B.T. methods in that it must be standardized by the absolute
Harkins Jura method. Its success depends on the properties
of conaensed films. A film le uaid to be condensed whenever
It exhibits a linear relation between surface pressure tr
and the mean area a' occupied per molecule,
i.e. IT b ad' where s and b are constants.
This may be transformed with sufficient accuracy into -
log. P40 72'
If, therefore, log. Pie() is plotted against h a linear grao
is obtained when the film is condensed. It .. was shown by
Earkino and Jura (64) that as the area of the solid increased

- 12 -
the numerical value of A also increased. They were able to
show that the surfaee area E was related to A by the equation -
E k A+
The value of A is computoi fro4 the linear plot of log. P/P 0
Ja2 . and k is calculated. Harkina and Jura have • V
calculated a value of k for four adsorbates, but these have
been extended by other inveetigatorai With different
adsorbates or different temperatures the value of k le different.
The major difficulty in the Harkins Jura relative
method lies in evaluating the constant k. The Harkins Jura
absolute method has been confined to a sample of anatase
and the "correct" surface area computed. A value of k to give
the same area by the relative method is chosen and the ascumption
is made that IC is constant and indepenaent of the adsorbent.
In a number of cases with different adsorbenta it was found
necessary to alter the value of a- with k constant to obtain
surface areas which would agree with B.L.T. and Buttig values,
these latter methods having previously been standardized
against the absolute method. Thie aapect has been investigated
at length by (;orrin (89). He concludes that the mlue of the
constant k is not always the same, espeeially in those cases
where the plot log ;;; gives two or more linear portions
of different elopes. Under these circumotancee it is necessary
to take the ratio of the square root of the olopcs of the different

linear portione to decide vyhich value of k to use* 'Olen
. only one straight line is obtained it is impossible to doeide •
which value to take. To overcome this it is necessary to
calculate the surface area by either the absolute method or
the D.B.T. or Nuttig equations and choose the appropriate
value of k to give akrceocnt.
Harkins and Jura (90) have considered in detail
the unnner in which the area occupied by a molecule of
nitrogen varies for different adsorbents* In this treatment
they have assumed that 4 has lwaya the value obtained from
the absolute method on the anatsse saople. For over ninety
4r different adsorbents the constants for the Uarkins Jura
relative and B.B.T. equations were determined. The specific
surface 27 was calculated from the equation -
ueing a constant vae of andarwas calculated from the
equation - Z vm
where N is Avagodre l s number and V the volume occupied per mole.
As immett (91) and Livingston (92j have pointed
out there is no need to assume k constant and ( - variable. It
seems plausible that k may vary from substanco to substance and
yet cr remain constant. This latter alternative, however, does
not gain support from the fact that frequently it is necessary
to assume different values of for the same as on different

14 -
adsorbents in order to obtain agreement b•tweon B.E.T.
computed surface areas.
Joyncr and 2mmett (9i) have compared the B..
and Harkins Jura relative methods for nitrogen on several
carbon blacks at - 205, -.195 and -183°C. respectively, They
have used the Harkins Jura value of k at -195 and from the
results calculated the correct value of k to give consistent
areas
at the other temperatures. The variation of k with
temperature is in approxiwte agrecmant with the prediction
of Davis and Dewitt (94), that for a given adsorbate the
constant k should be proportional to --r
Joyner and Lmnott (95) hove carried out similar
calculations for X on porous glass but do not obtain agreement
between the k values at .-205 0 on porous und non-porous
materials. This suggests that the temperature coefficient
al k may be different for porous and non-porous substances.
Comarision of the 8B.' I and Relative Etothods
. Despite the uncertainty in the choice of Constants
the agreement between the surface areas calculated by the
lieT41A0 iZelstivc.; ad tb,t . aiethode is geed (93)
(94), (95), (96). As Livingston (97) points out, however,
this is to he expected eince when the constant C. is
in the rake 25 - 250 the two tions both give astisfactOry
fits to the eame adsorption data (98) 0 (99). (92) and 4arlilins

-15 -
and Jura (64) have chosen their k values to be consistent with
the 13, -&3.T. adsorption results obtained with anatace.
Agreement, however, is not always observed. Porous
adcorbent3that form multi layers only a few moleculeo thick
do not give adsorption data that agree with the standard
1M:1.T. equation,. However, they do agree with the B.E.T.
"n" equation which is similar to the ordinaryB.E.T. equation
but contains exponential n termo in which n equals the
maximum number of molecules in the monolayer at P = p o .
Joynero Wienborger and Llontgomery (100) found, that when n
was omen the Harkins Jura method could not be used. •Gmith
and Dell (101) have shown that this result would have been
predicted from a mathematical treatment of the "IV equation.
The relative merits of the methods which have boon
discussed appears to depend largely on the significance
placed on the surface area values. It is doubtful if any
of the methods will give the absolute surface area. This
is unlikely because of the following points:-
1. The uncertainty in allotting a value for o- at a
definite temperature for a particular adsorb to.
2. The unknown influence of capillary condensation and
active centres on the formation of a monomolecular film with
a subsequent uncertainty ia the value of V .
•
3. The unsound assumptions upon which the B.E.T. theory

e
ie based and the fact that the theory deviates more widely
from experimental data when refinements to the basic
assumptions are incorporated in the final equation.
Similar arguments apply in the case of the Huttig equation
because the basic assumptions are identical to those in
the B.R.T. equation with one exception.
In the case of the Harkins Jura relative method
the uncertainty involved in the value of k renders the
complete acceptance of surface areas by this method open
to doubt.
Only in the case of the Harkins Jura absolute
method can complete reliance be placed in the valuea obtained.
Unfortunately the experimental difficulties are such that
only a few measurements on a single aample of anatase have
been completed. As indicated, both the Harktne Jura constant
R and the value or used in the B.:6.T. equation have been
selected to give agreement with the absolute result.
This agreement has not always been found with come
other adsorbenta. In the first place Harkins Jura absolute
results are lacking and secondly the B.E.T. and Harkins Jura
relative results vary from one adsorbate to another for
given adsorbent. This variation has been attributed to a
change in the values of k and either singly or together,
but it may in fact be due to capillary condensatio;

- 17 -
It
active centres or some other complioating factor, It is
desirable that the absolute measurements be extended to other
adsorbents and the results compared with the B.E.T.Outtig
and Harkins jure relative values. By this means it would
be possible to determine whether or not the values of
and X are in fact different for various adsorbents.
In the absence of ouch comparisons one is drawn
to the conclusion that complete acceptance of surface area
values by any one method is unwise. or coratAx-ative studies,
especially with adsorbents of identical or similar chemical
composition, the values obtained by the three methods taken
together should indicate differences or changes in surface
area.
b,449T.13_ 0,
Little mention has been made of the type of adsOrbate
used in surface area measuremente. The most eonvenienr are
nitrogen, argon, krypton and carbon monoxide at -195 ° or 183°0.
Other vapours, including carbon dioxide, water, propane,
butane, ethylene, etc., have been used at various temperatures
but generally speaking these vapours require a more
complicated adsorption apparatus.
Beeck (102) has criticized the use of nitrogen as
an adsorbate following heat of adsorption measuremnts on
evaporated metal films. He showed that soilio chemisorption
of nitrogen took place and therefore Vm values as usually

4. 18
determined would be in error. Such criticism has not been
substantiated in surface area results, suggesting that the
effect is of minor significance In most cases. . Kevertheless l,
the adsorption of krypton and argon appears now to be more
generally favoured.
Brunauer and Emmett (103) have indicated that it
is possible to obtain agreement in surface area measurements
despite chemisorption. They have investigated the case of
carbon monoxide adsorption on an iron ammonia catalyst and
provided the volume of chemisorbed gas is subtracted from the
total volume of gas adsorbed, then satisfacgory agreement
is obtained with 6Urface area results using gases in which
chemisorption is absent,
In the present investigation On nickel powders
it was decided to include measurements with gases where
ohoraloorption was absent, slight and appreciable. The
apparatus was designed for nitrogen adsorption but was
equally suitable for the adsorption of argon and carbon
monoxide at -183°S. It was hoped that the results could be
plotted according to the various isotherms thus allowing a
Sc comparison of the methods to be made.
- 19
PERIMENTAL:
(a) Reagent()
1;
These powders were prepared by the thermal
decomposition of nickel oxalate. Details of the preparation
are given in Section U.
2. Iiitrogent-
In the initial surface area measurements "pure
cylinder nitrogen containing about 1% oxygen was purified by
passing through pyrogellol and over hot freshly reduced
copper gal4w. This system was satisfactory for preliminary
meapurements during the oxidation studies, but was inconvenient
and subject to leakge. It was decided therefore to
incorporate an all glass purification train in the apparatus.
It was similar to that used by Hvrington and Martin (104) and
is shown diagramatically in fig.(12) and in the ph0to8raph
fig. (i3).
It consisted of four adsorption towers, each
about 40 ems. in height and 30 mm. in diameter. The first
two contained a 1:1 solution of concentrated ammonia
(d = 0.88) and saturated ammonium carbonate ablution with
a bed of tightly Packed fine copper gauze s seParated from
the lower part of the tower containing the solution by gloss
rods. These first two towers were to absorb oxygen. The
next two towers contained packed beds ofRaschig rings with

ad* •■•
%.;
ft
T4
M4
N•M
ETE
el.
04 4.4


- 20 -
a solution of 25;:, H2U04 to adsorb amwonia in the third tower
and a to. solution of NaOH to absorb carbon dioxide in the last tower. The gas leaving the towers wae then bubbled
through concentrated sulphuric acid and then through
drying tubes containing calcium chloride, silica gel
and lastly phosphorus pentoxide. The nitrogen was stored
in a little reeemoir, the pressure being recorded by a mercury
manometer or the atmospheric "blow off" type. The system
worked extremely well and wee easy to operate. Tap T2 was
used to isolate the drying agents from the wet towers when
the system was not in use.
3. Carbon Monoxide:-
Carbon monoxide was prepared by dropping air
free formic acid on to concentrated sulphuric acid at
120 - 150°C. The purification train is shown, in fig. (14).
Flask A contains concentrated sulphuric acid heated by a
glycerol bath not shown, /3 is a dropping funnel containing
formic acid, freed from much of its diosolved air by shaking
in a flask which was continuously evacuated. D and E are
scrubbing towers filled with 501it KOH and a mixture of one
part _Ai: PYrogallol and two parts 50,:, KOH. P and G are
drying towers containing CaCl 2 and P205 respectively. H
is a liquid air trap.
The train was evacuated for one hour before
gas generation was commenced, the glycerol bath on A being
heated to 150°C. during the evacuation. Gas generation was

41.
If!

- 21 -
then commenced and the pressure allowed to build up to about
2) oms.Hg. This fluehing gas was then pumped away and the
generation continued until the storage bulb was filled to a
. pressure of about 70 emseHg, The only impurities leaving A
in the carbon monoxide are carbon dioxide, acid spray and a
little air. The adsorption towers will remove the carbon
monoxide, acid spray and moisture together with the trace
of oxygen present from the dissolved air.
4. Inert Gasev-
KPYPton and argon were supplied in sealed flasks
from the British Oxygen Company Ltd. They were labelled
spectroscopically pure.
5. OxYgen:-
This was prepared as described in 6ection II by
the thermal decomposition of potassium permanganate.
(b) Apparatus
The odsorption apparatus, a photograph of which Ic
given in fig. (15), was almost identical to that ueed in the
kinetic studies. As indicated in fig.(9) two gas burettes
were incorporated in the system. 41turing kinetic measurements
burette B1 was isolated, all measuremente being done with
burette B2# However, an the surface area measurements burette
B2 was isolated.
Burette B1 consisted of six bulbs joined by short
lengths of capillary tubing, mounted vertically In order of

*
r
•
•
•

..
•
I
•

-- 22 -
decreasing volume, the whole being water jacketted. The volume
of each bulb was determined before attaching to the apparatus
by weighing the volume of mercury it contained. IAlplicate
measurements of the volume of each bulb agreed to 0.005 ace.
The mercury manometer, with platinum contacts
C and C21 has been described previously. The level in the
manometer was adjusted so that the mercury in the left hand arm
was just touching the upper contact (iy. The difference in
height of the two armo was measured by means af a cathetometer.
The average deviation of a given height when a series of readings
were taken was found to be lees than 0,005 nue The ayperatue
is similar to that deccribed by Harkins (74) Offering only in
the manometer arrangement.
The volume of the tubinu connecting the burette
and the adsorption bulb was determined by measuring the change
in pressure In the system when ouccessive bulbs in B were
filled with mercury from the reservoir. or one system the
volume of the tubing was 16.25 t 0.05 cce.
The dead space in the adsorption bulb was doubly
checked, It was first determined by measuring the drop in
pressure in the syetem when nitrogen was allowed to expand into
tho bulb. It is more usual to use helium as the expanding gas
but this was not available. It was felt that the use of nitrogen
was open to error owing to the possibility of chemisorption at
room temperature. As a second check the dead space wee

•
ea* 23 Sin
measured by cutting down the evacuated bulb above tap T o
weighing, filling with water and reweighing. From the increase
in weight the volume of water filling the dead space was
calculated. The two measurements were in good agreement.
(0) Procedure for Nitrogen;
The adsorption bulb, sealed to the end of capillary
tubing, was filled with nickel oxalate using the glass bead
technique previously described. The tube was sealed to the
apparatus at point X in fig. (9). Care was necessary in the
initial 'evacuation of the bulb to prevent the powder blowing
up into the capillary.
The sample was outgassed for two haura at room
temperature and then the furnaee doecribed inection II was
placed in position and ito temperature controlled to 210 °C,
Dehydration of the sample was allowed to proceed for twentyfour
hours, after which time the temperature eaa increased to 330°P.
and decomposition allowed to continue for a further twentyfour
hours, this time usually being sufficient for complete
decompo sit ion
The adsorption bulb was imuersed in a large dewar
vessel containing liquid oxygen and two hours allowed to o/aPoe
for thermal equilibrium to be establisbed. Tape T2 , Ty T5
and T (fig,(9)) were then shut and the mercury adjueted to the 1 mark at the base of the lavgeat bulb in the burette. The

-21k -
• burette system was then filled with nitrogen via tap T
6 to
a pressure of approximately 115 ems.lig. The wercury in the
manometer was adjusted until the loft hand level was just
touching the platinum contact 0 1 and the pressure WEIO
accurately measured with the cuthetometer. Tap T 1 was then
opened and mercury forced up into the burette until it was
level with the mark at the bottom of the second bulb. At
least one hour was allowed to elapse and the equilbrium pressure
recorded, The mercury was then forced up into the second bulb
another hour allowed to elapse and a second equilbrium pressure
recorded. This procedure was repeated until an equilbrium
pressure of 50 cms. had been reached, this being the maximum • measurable with the cathetometer.
The liquid oxygen dower was then removed and the
sample evacuated overnight at room temperature. The adsorption
measurements were then repeated at -183°C. At the completion
of the adsorption measurements the evacuated bulb Was cat down,
filled with water and from the increase in weight the dead spacL
calculated.
From the known volumes of 4i,
(a) the bulbs in the burette,
(b) the connecting tubing and
• (c) the dead space,
together with the equilbrium pressures it was possible to
calculate, from tW. gas laws, the volumes of nitrogen adsorbed
at each pressures The volumes were not corrected for deviations

- 25
from the gas laws as suggested by Brunauer and Enett (105),
klaggNall-11114.Alonoxide
The experimental precedure in the oase or carbon
monoxide was identical to that described except in one aspect.
Carbon monoxide was first admitted to the sample at room
temperature. Chewleorption was allowed to proceed and, when
complete, the adsorption bulb ws evacuated for one hour.
The bulb was then immersed in liquid oxygen and the physical
adsorption determined as for nitrogen.
cedure fo Inert G s
Unfortunately the argon storage bulb wee; broken
while attaching to the apparatus. Rather than delay the
surface area measurements while waiting for a replaoement it
was decided to use krypton instead a flask Or this gas being
The saturation vapour pressure of krypton at
. au approximately RO mm411.g. (69)4 In order to obtain P
experimental data in the range 0.0 <5 Po 0.J5 (suitable for
13,14.T0 plots) it is necessary to measure equilbrium pressures
in the range 0.'i0 4P <0.70 ems. Hg. This pressure range is
above the upper limit measurable with the pirani gauge avtilable
and almost below values which can be measured accurately with
the mercury manometer. The McLeod gauge attached to the
vacuum system was not suitable to measure pressures higher than
3 X 10 4-1 ma
r11"

-26 -
The solution to the problem was to construct a
UcLeod gauge of suitable dimensions ouch that pressure
measurements could be made in the desired range. It was
decided, however, to deter construotion to a later stage. A
few measurements, using the mercury manometer as the pressure
indicator, were conducted. These measurements, however, lay
outside the range suitable for the 13.k.I.T. equation but they
were plotted according to the Huttig equation and the surface
areas calculated. The experimental procedure was identical
to that described for nitrogen.
RESULTS,
The results have been divided into two groups.
The results in the first group ,which are pertinent to the
kinetic studios described in Section II, were obtained with
nitrogen alone. Those in the second group are for the
three adsorbates studied on the same adsorbent sample.
Table (6) gives thelesulte of the first group
and indicates the variation of surface urea of the nickel
powders with the time and temperature of decomposition of
the nickel oxalate.
Table (7) lists the results of the adsorption
of nitrogen, carbon monoxide and krypton on a single sample
of nickel powder. After these measurements wore completed
the nickel sample 'ORS oxidized at 300°0. and the surface area

1ioLat iv
;AIrtrace i)rect,
E.T. Iitattig
3•10 :20 7-1 30:30 160 114.26 1t1.41 oo
t a IAA*
_ :k"owaer
- 27 -
=c-lotimaczato goveoted, reau.11;;a or to J.,atter moacattrealkdate are oleo room'aed tri Tetb141 tn. In all ceoes tho mcuIto vcu arc the averaca3 c'i" 1Q.aet dupllr,:atc laceoureuento.
smearrOvorioneDeothithevomosisienwOlom..*.,;*
15 taro, at 31R.°C. 16 bra). at
24 Urz. at 48 two. at
:,j4,906
Lt. 05.6 21.60
4. 299 i 6.67
16.93
. u1itlac•
g
n24A4
2140 77
16# 50
160.86 16'29
14.69
Time aDd Temp. of Decoopeoltion
.N

-28
Table (8) gives the values of the constants used in
evaluating the surface areas. These values are based on the
results of Pic:kering and Eckstrom (67).
TABLE (*I
GAS TEMP, 1111111 .4r
N2
-183 4.33 17.72
00 -1 1;33 4407 16.25
Er -183 6.23 21 73
Pig.(16) •snd (17) show the Harkins jure relative and
the 13.E.T. plots respectively of the results given in Table (6).
Vigo.(i8), (19) and (20) illustrate some of the
B.E,T., Huttig and Harkins Jura plots respectively, corresponding
to the results given in Table (7).
DISCUEISION
Examination of Table (6) reveals that the surface area
of the nickel powders decreases with an increase in both the
time and temperLitWof decomposition of the parent salts This
change is evident in all three methods and therefore can be
accepted without qualification. In the case of the !Jerkins
Jura relative method two linear portions were •obtained in the

"It
/.7
/.4
1•3 "-
0
-
pow
274.
_ Lt
1 30
-L. /0 3
Fl&UR E
54
16. 4.

p4 I.) o 9 O (d/d -1)A o
°d Ad
0

let
in 9
4
Of X
0.4 , 00
CVM ) A
°d/d

ev) " (1 +1)41 ,,„
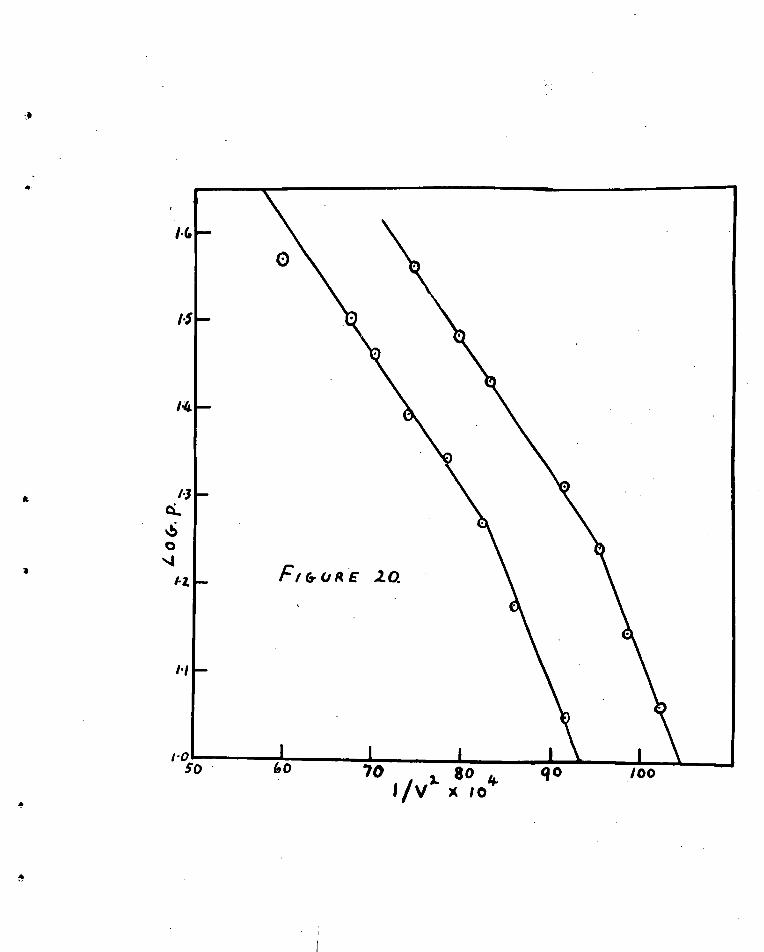
So• 60 70 3. 8o 4 qo liV x to
•

-29..
plot log.1)",72 shown in fig.(16). is suggested by Corrin (89)
the slopes which gave the closest agreement with the B.E.T.
results were chosen as the correct values. The significance
of the variation in surface area with the history of the sample
has been discussed previously.
Examination of the results given in Table (7) reveal°
the following points:-
1. Agreement between the three methods is good.
2. Chemisorption has little effect on the final result
provided it is allowed to proceed prior to the low temperature
physical adsorption.
3. The krypton results are not in acreement with those
of nitrogen and carbon monoxide.
L. The Harkins Jura relative results are the least
satisfactory.
51 The surface area of the nickel powders decreased as
the result of oxidationa
6. The surface areas values for nickel oxide are somewhat
higher in the case of carbon monoxide than the nitrogen values.
7. The agreement between duplicate measurements as shown
in fig.(21) is good.
cie may examine these points in greater detail.
4

•0
•02.
•osS
•00S
0 .01 '10 .04 .06 •OR
P/P0 .16 44.

1. This reault requires little comment as fair agreement
wao anticipated in acoordance with moot published work.
2. This result confirms the findings of Brunauer and
Emmett (103) on the iron ammonia catalyst. Chemieorption in
the case of nitrogen has a negligible effect upon the final
result. The error involved in ignoring ouch chemioorption is
Probably less than the experimntal errors
The poor result in the caoo of krypton may be due to:-
(a) Inaccurate pressure measurements usinz the
mercury manometer. This is supported by the inability to
obtain a straight line in the case of the Harkins Jura method.
A linear plot in the eaee of the B.E.T. method was not expected
as the preoeure meeeuremento vere outside the range accepted for
the B.E,T. ieotherm.
(b) Insuffiolant time between pressure measurements
to allow true equilibrium to be estekbliehec:,, . The relative
pressures used wore much higher than tboae usually accepted and
it has been noted by many authors that equilibrium is attained
slowly when approaching the saturation prescure:
(o) The value ofeesuggested by ilckering and
Scketrom (67) and used in the calculation° i considerably larger
than the values suggested by either Davie et al (70) or Beebe
et al (69). If the value zuggeeted by P4ebe et al wee used
much closer agreement with the other results would be obtained.

4.0 Of the three methods, that of Harkins and Jura is
the least satisfactory. Agreement between different adsorbates
is poor and the spread of the points about the straight line
(fig1(20)) is greater than either the B.E.T. or Huttig plots.
As already indicated there is some doubt in accepting a given
value of k as ,a constant independent of adsorbents. For
example L'Ickering and Eckstrom (67) suggest a value of
k 4.33 for nitrogen at .-183 while Joyner and Emmett (93)
duggest a value of 4447.
5. The results clearly indicate that the surface areas
decreased as a resat or oxidation, This is in contrast to
that found by Dell and Stone (106) on sintered samples.
It is suggested that during oxidation at 300 ° a certain degree
of sintering tal-fes place. This is supported by the earlier
results showing a decrease in surface area with prolonged
heating at 3300C. ,urthermore it is probable' that upon
admission of oxygen the temperature riuu in the sample, is
considerable, thus enhancing the degree of eintering.
6. The somewhat larger result obtained with carbon
monoxide adsorption on nickel oxide may be due to incomplete
compensation for chemisorption, It has been shown (=07)
that the room temperature chomisorption of carbon monoxide is
slow, It isprobahle that insufficient time was allowed for
complete equitbrium to be established before proceeding to
the physical adsortion.

TABU (9)
Surface Area m /gm, B.S.T. Harkins/Jura SAMPLF
02 04 .2 2 4 0
Anhydrous in 02 04. • 114.9 (rig. (23))
- 32..
7. The good agreement between duplicate measurements
is a generally accepted fact and needs litte comment.
. Before concluding this section a few results of
surface area measurements on nickel oxalate dihydrate and
anhydrous nickel omalate are included. These are shown
in Table (9) and the corresponding B./4.T. and Harkins Jura
plots of some results are given in figs. (22) and (23).
The results obtained for nickel oxalate dihydrate
are in agreement with values found using air permeability
and photo extinction techniques (;08). The high value found
for anhydrous nickel oxalate is in keeping with surface areas
of samples prepared by dthydration of parent mite (107).
4

•
•
(*V
Os •
0
•
t■I
4 9
4
c)E ' X
t) A

alb
ffl r.4 49 07
•
•

*NOTION IV.

SECTION IV
BRAT OF ADORPTION MEA-aRMINTQ
INTRODUCTION
In recent years the advances in solid state physics has
intensified the research in heterogenous catalysis. The effect
of semi-conductiOn on catalytic activity has receiVed considerable
attention and several excellent reviews hove been published
(109) (110)4 The adsorption of simple electron donor and
electron acceptor gases on transition utotal oxides is intimately
connected with their semi-conducting prop ties and hence with
catalytio aotivity4
iteoently Teichner and Itorrison (107) have investigated
the adsorptiOn of oxygen and carbon monoxide on bulk nickel oxide.
The results obtained are in contrast with the work or Dell and
3tone (106) on nickel oxide films formed on underlying nickel
powders. The results are also difficult to reconcile with
those of Hauffe and Lngell (iii) and hrauso •(i12).
In order that a complete comparison of the adsorption
Properties of bulk nickel oxide on the one hand and nickel oxide
films on the ether can be made, it is necessary to possess data
on heats of adsorptions The data exists for nickel oxide films h`k
(106) but is absent in the case of bulk nickel oxido, The aim
of' this investigation was to correct this anomaly. i.

PART I
DESIGN AND TESTING OF CALORIMETERS
LIMATURE eliRVEY:
A eurvey of the literature revealed that both isothermal
and adiabatic calorimeters have been uzed with varied success to
measure differential heats of adsorption of gasea on powdered
adeorbents. The isothermal ones are limited to adsorption at
one temperature and the adiabatic type have proved the more
popular. This brief review will be confined to adiabatic
Calorimeters.
The adsorption of gaae such as nitrogen, argon and
hydrogen at .-i8 na —195 GO. one many finely divided sollda has
been extencively investigated in recent years (113, ';14, 115,
116, 117, 118), It is now generally accepted that differential
heats of adsorption fall steadily with an increase in the volume
of gas adsorbed. In much of the older literature maxima occur
In the curves. These maeima have been attributed to the following:
(a) Poor thermal contact between adeorbent and the tempevature
sensitive element.
(b) Poor thermal transference through the adeorbent.
(c) Non uniform adsorption.
The last factor la the moot serious when differential
heat measurements are required, but is not of such importance when
a large volume or gas ie admitted at one instant and the average

- 2 -
heat of adsorption is recorded.
Two types of errors are encountered In non uniform
adsorption. The first type occurs when beat is liberated in
a restricted area rather than uniformly. This can be avoided
by providing effective mane of beat distribution. ,Alternatively,
it may be overcome by having the powder aufficiently dispersed
to allow the whole mass or powder to react at the one instant.
The eecoad error arises bocauee of the presence of
active centres. If the powder is not aufficiently dispersed,
then the firet addition of gas will react with centres of
\ i differing activity-over a limited region, rather than with the
most active centres throughout the material. The heats thus
measured are then integral heats of successive layers rather
than differential heats for the whole sample. The only way
in which this error can be eliminated is to have the adsorbent
in a layer infinitely thin. The nearest approach to this ideal
is in the case of evaporated metal films. In the ease of
powders the effect can only be minimised by the use of perforated
tubes down the centre of the powders or similar methods of
inereeeing the dieperelone Hence, for powders, in the initial
measurements of a series, adsorption le probably not uniform
and the first valuee represent integral heato over a limited
region rather than differential heatsover the whole maee of
poeder. The initial heat arc not entirely due to eduorption
on the meet active sites and are thorefaro lower than would be

truo if the adsorption process were uniform.
In this regard it is interesting to note that Beeck (113)
obtained umah higher initial values for heats of adsorption of
nitrogen on evaporated metal films than previously found with
powders. This was attributed to chemisorption or the nitrogen.
It is probable that the lower values obtained with powders were
due to non -uniform adsorption which would result in lower initial
values but would not greatly effect later values. The lack of
cleanliness of the powders compared with evaporated metal films
would be a contributing factor.
eoveral workers have devised calorimeters to eliminate sr) or minimise the effects mentioned.
Bull, Hall and Garner (i14) Placed the powder in a A.
gauze vessel suspended in a glass bulb. They used a thermocouple
placed in the middle of the powder as the temperature sensitive
device. The results were faand to vary with the depth of
immersion of the thermoucouple (115). In later experiments the
gas distribution was improVed by incorporating a central gauze
tube.
Beebe and gildner (i16) have investigated the variation
in the heat of adsorption with the depth of imaersion of the
thermocouple. As a result of this investigation, together with
research extending over twenty years Deebe and co-workers (117)
have developed an adiabatic calorimeter which eliminates as far
as possible errors involved in earlier designs, The powder is
placed in a silver container to which is oldered a single
junction copper constantan thermocouple. The middle of
the container holds a perforated platinum tube and to aid
heat distribution there are several vertical vanes of copper
foil placed inside the silver cylinder. Fine copper shot
was intermixed with granules of the adsorbent. The silver
cylinder which was joined to the glasa inlet tube by a glass to
metal seal was completely surrounded by a glass bulb which was
continuously evacuated during a heat measurement. Beebe and
co-workers have used several calorimeters of this basic design
and they work extremely well.
Garner and Veal (119) have devoted considerable time
to the study of calorimetry design and the elimination of errors
in earlier models. ttecently Garner and co-workers (120) have
used a calorimeter similar in design to that developed by
Beebe (117). The work of Worrisou and Los (118) in ealrimetry
design in recent years has been outstanding. However, the
elegant calorimeter used by these workers is beyond the
technical capabilities of the Chemistry Department, University
of Tasmania and will not bo considered further.
Beeck (121) has devised an ingenious calorimeter for
heat of adsorption measurements on evaporated metal films.
This calorimeter incorporates a platinum resistance winding
as the temperature sensitive element. Taylor and Kistiakowski
(122) also used a Platinum resistance thermometer, but their
results were later shown to be incorrect due to poor thermal
•
ft
contact between the adsorbent and the thermometer' However,
most of the more recent calorimeters using powdered adsorbents _A- Use a thermocouple as the temperature sensitive device'
?ACTORS AeSOCIATED WITH TI E Kai Dan itrkfriarIGATio
With regard to the present investigation it was
necessary to design a calorimeter which could be used in the
firot instant for the decomposition of nickel oxalate and
nickel hYdroxide. It was hoped to carry out heat of adoorption
measurements at -183°C. as well as 20 00. Therefore, the
calorimeter would have to withstand temperatures in the range
7 -1830 to 3000e. It was desirable to use a calorimeter of
the 3eebe design (iii) because these have been shown to work
extremely well.
The great disadvantage of such calorimeters lies in
the glass to metal seals. In the lbsence of experience in the
fabrication of such seals it was decided to dispenee with this
complication and to construct the inner calorimeter bulb of glass.
This procedure immediately raised the problem of where
or how to place the thernoceaple. It could not be attached to the
outeide of the inner bulb because of the decreace in sensitivity,
due to poor conductivity through the glass" The bare
thermocouple could not be immersed directly into the powder
because of the possible reaction with the adsorbateo and
also the conductivity of the powers. An alternative lay in
the construetion of a Vain walled pyrex finger dipping into the

.0* 6
the powder and sealed through the calorimeter bulb.
However, the major objection to the use of thermoeouples
liec in the reduced sensitivity at -16 03 0. In the case of the
neebe type oalorimeter this is partially compensated by the
increaae in cenductivity and reduction in heat capacity of the
=tal cinder. However, thece effects are not of the smne
magnitude in the ease of pyrex glace.
Another objection to the type of calorimeter used by
Beebe and co-wor. ,:ers to the introduction of foreign material
such as copper foil and shot. Thee() materials were introduced
primarily to transfer heat from the granules of the adsorbent
to the metal cylinder and thus to the thermocouple. In the
absence or a metal cylinder the presence of this foreign
material is not of such importance.
Calorimeter Desipns:-
Three calorimeter models were construoted. They were
of similar design having a platinum reeistance winding as the
temperature sensitive element. Bach calorimeter was tested in
turn by measuring the heat of adsorption of nitrogen on nickel
powders at -183°C. As a result of those tests a fourth
calorimeter was constructed, but this will be discussed ili
Port II of this section.
atia14219.4-22 This Calorimeter is Illustruated in rig. ( 24s). It

ri(ru E 24'.
(c)
(d)
co)

• 7
consisted essentially of two bulbs ; A and B. Bulb Ap which
was thin walled, was sealed to the end of the capillary
inlet tube and housed the adsorbent. Bulb B o which
surrounded bulb A, was continuously evacuated during a
heat measurement,
The platinum resistance thermometer consisted of
0.004 inch. diameter platinum wire wound in the form of a
long fine coll. The coil was threaded through a very thin
walled class tube which was then bent in the form of a spiral
rig. ( 20). The spiral was sealed into bulb A and the
platinum leads sealed directly thro4Oh the well or both
bulbs. The adsorbent was placed in the calorimeter via pip P.
_Calorimeter No 2
This calorimeter illustrated in fig•(240) was similar
4n design to that used by Beeck for evaporated metal films (1i21).
The platinum wire wound around the outside or the inner bulb
was held in position by a coating or sodium silicate,
The essential difference between this oalorimeterp
shown in fig. (24d). and No. 2 was in the central inlet tube,
The gas entering the calorimeter travelled down the tube, passed
through a plug of class wool at the bottom and then travelled
up through the adsorbent. The force required to send the gas
up through the powder resulted from the dead space vacuum on
top of the powder.

8
Temperature 111,0811ringDOViee
The pletinum leads from the calorimeter were. pealed
to copper wires leading to a Cambridge Vernier poteniometer.
The following circuit was set up
S and B are 2 volt -batteries. a b R is the thermometer resistance coil (40 ohms.).
R is a resistance to regUlate the measuring current through 2 the thermometer (500 ohla.).
Rg
is the resistance of the abort period 'galvanometer (21 ohms.).
mall are the arms of the Cambridge Vernier Potenlometer. 4
The circuit is identical to that used by Beeck (i2i)
except that a variable resistance across Bo vas eliminatcd.
The resistance was used to equalise swell drifts of the two
batteries to allow the alms poteniometer setting to be used for
all measurements, This was gound unnecessary for the present
requirements,'
Beeck (121) gives the folloWing final equation for
Calculating the heat of adsorption.

•
- 9
11. a R2 n U
where 11 ,; heat of adsorption in cals./mole.
0 = heat capacity of the calorimeter
n = number of molecules adsorbed X 10 -18
a = temPeraturo coefficient of the platinum
and S = the sensitivity of the balanced circuit, i.e. the
galvanometer deflection d in m.m. caused by changing the
poteniometer 10 - volts off balance.
such a definition of the sensitivity is misleading.
The following Proof of the formulae is given. In this proof S
is rigidly defined.
Proof;
Let B volts be the poteniometer reading when the
circuit is balanced initially -
then E = rt 1 Ea 1 2
Let S' be the deflection (m.m.) of the galvanOmeter when the
balance is shifted by e volts, 1.e. when the poteniometer is
o volts off balance and rends (B4-e) in place all. Further
let k mm/amp. be the sensitivity of the galvanometer.
Now the current which flows as a result of the circuit being
e volts Out of balance is e. R R where R = l' 2 ..,_ R 2' R4+R ' R +R , 2 2 3
and further S' = ko

A
10 —
The poteniometer is again balanced on reading E.
The adsorption experiment is performed, heat is evolved
and the resistance R i increased by41R1 . Thg circuit is
out of balance and the current which flows through the galvanometer
is Given by
E R AR a 2 1 R (0-.T272
Now if this flow of current gives a deflection of d
on the galvanometer scale then
k.E :11. 8R d
R (R 14-R2)2 d Yia. 142'A lli .... = S' 0 6l i+R2?
E R 1 a .1 , • .... (R itR2 ) e
(rz i-f- R2 )
S pE CI 1
(R i +R2 ) i
01"2)
8 . 14 Rn 1141 ,... • —4- • . , ..: e 4 (11+ i SIB put S = ___
•
•

Rq /JR * - 1
(R i+-112 )
(Ei+R2) a2
Now 8T dR1 • ....—...
a •
where 61* is the teoperature increase an a is the tvaiperature
coefficient of platinum
, fr
a.
d S.a.R2
0.d. (Rf+11 2 )
asti.R2
It n the number of molecules adeorhed then the
heat evolved per mole of gas is
23 to,w 6.06 x 10 u a km.1-102) = • 2
then d
p cz
14,

- 12 -
This formulae is exactly equivalent to that given by Beeck except
that the sensitivity is fully defined and unambiguous.
• Such a circuit has several advantages.
1. It is extremely sensitive.
2. The poteniemeter need not be standardized against a
standard cell.
3. Ea and Eb can be any batteries within a safe range
and do not have to be equal.
In order to take a measurement the following procedure
was adopted.
1. Balance the poteniometer so that the galvanometer
deflection was zero.
2. Admit the adsorbate noting the time.
3. Record the galvanometer deflection every 10 seconds.
L. Plot galvanometer deflection against time and extrapolate
back to zero time.
5. Cheek the sensitivity of the circuit by putting the
poteniometer 2 x 10⁻⁵ volts out of balance and noting the
galvanometer deflection.
Fig.(25) is a typical galvanometer deflection plot.
This method of measuring the heat of adsorption was
sensitive and satisfactory. In later experiments average
rather than differential heat measurements were made.

•
• •
kr;
• •
a •
• • mod
• •
• •
• •
a.
I .
=MN ••
•
• •
/ Ak..(3 a vt m o il ) 37 a 9 lull
8 M
=we

13 -
."* In such cases a larger volume Of gas was adsorbed and the heat
evolved was considerably larger. In such experiments it
was found impossible to keep the galvanometer deflection on
the scale without altering the poteniometer setting. Therefore
instead of recording the galvanometer deflection with time it
was found more Convenient to record the potenlometer reading
required to keep the.golvanometer deflection on the zero mark.
This poteniometer reading was plotted, against time, extrapolated
to zero time and the difference between extrapolated and
initial reading caleulated. This difference in volts x 1075
was multiplied by the galvanometer deflection caused by Changing
the poteniometer readint10 7 Volta Off balance. Thus the
actual procedure in recording the increase in resistance of the
platinum winding was the same in principle as before except
that the sensitivity was reduced. Fig.(26) is a typical
plot of pOteniometer setting against time. The graph is
Similar to that shown in Fig.(25) and was easily .extrapolated
back to zero time.
At -183oC. thid method of recording the heat of
adsorption was entirely satisfactory. however, at 20 °C. some
difficulty was encountered owing to the heating effect of the
measuring current.
For example with calorimeter lio.4 a negative heat of
adsorption was recorded when nitrogen was admitted to the
evacuated sampae. This anomalous result on readily be

o .
4
amml
f
8 a o v,
.14/19

14
explained. Before admission of the nitrogen thermal
ecuiIibrium exists in the calorimeter. A steady state
is reached in which the rate of heat loss from the inner
calorimeter bulb is exactly counteracted by the heating
effect of the currant flow through the platinum winding.
Upon admission of nitrogen the thermal conductivity of the
mass of powder is increased. Thue the rate of cooling is
enhanced but the rate of energy dissipation from the current
flow is constant. Therefore, the temperature of the
Powder will. decrease until a new equilibrium Is established.
This lowering of the temperature causes a decrease in the
resistance of the platinum which is interpreted as a
negative heat of adsorption.
In order to Overcome this effect a tapping key
was placed in the circuit to prevent the flow of current
when measurements were not being taken. Alan taking a
measurement the circuit was momentarily closed and the
galvanometer deflection noted. This meaOure was most
effective in controlling the heating effect and no further
trouble was encountered.
ad.222L9j.lay ja tbe Oorimte
The heat capacity C can be calculated from the
known weights of materials comprising the calorimeter.
This was the method used by Peeck (121). However, in the
calorimeters used in this investigation it is impossible to
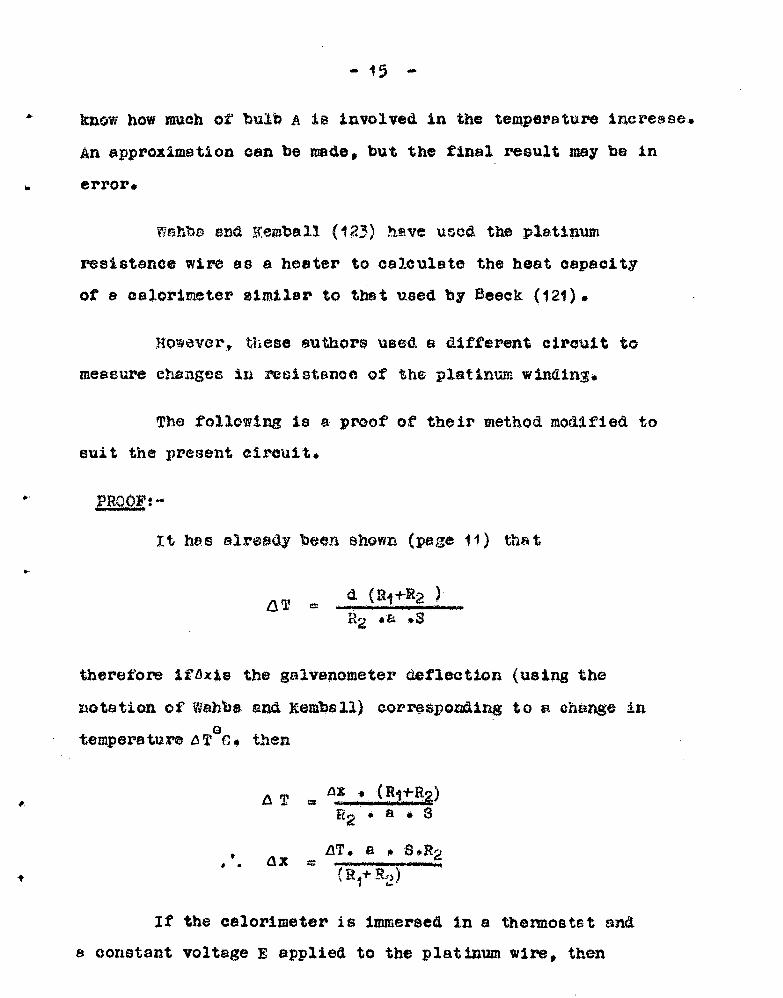
- 5
know how much of bulb A is involved in the temperature increase.
An approximation can be made, but the final result may be in
error.
wehbe and Kemball (123) heve used the platinum
resistance wire as a heater to calculate the heat capacity
of a calorimeter similar to that used by Beeck (121).
However, these authors used a different circuit to
measure changes in reeistance of the platinum windiree.
The following is a proof of their method modified to
suit the present circuit*
nag It has already been shown (page 11) that
tr-
8T = d ,(R1-412 R2 'a, wS
therefore ifbxis the galvanometer deflection (using the
notation of Wahba and Nemball) corresponding to a change in
temperature LITCo then
itt22) T R2 • a
a x LT. a • S0R2 •••••••■••••■ -.••••••
R 1
If the calorimeter is immersed in a thermostat and
a constant voltage E applied to the platinum wire, then

after some time a steady state will be reached when the loss
of heat from the calorimeter at Tf2 C to the thermostat at
T: 0, is balanced b the rate of input or electrical energy.
2, i.e. /4.18 14,t = r(To - To )•
where E ro the voltage, R i the resistance of the platinum wire
and r = the rate of loss of heat in cals./deg./see.
After allowing eufficient time for a steady state
to be reached the heating current Is switched off and the
platinum wire switched back to the measuring circuit and the
galvanometer deflection followed with time.
• Newton's law of cooling states that -
-kt
e eoe
where e the excess temperature at time t
and 190 = the excess temperature at time t
Tt To, and 0
o
(xt 2
R 4+R and (Ta f4) = (xo . I)
a. e.R 2
Ifew in 0 = lneo -kt
.. lnP= kt
-k e dt

-
(x,„ • .1n , -
kxt x.) 0 kt
t
where r = rate of cooling in cals./deg./sec.
0 heat caPaeity in calc./deci.
and t = time whenthe heating current ia switched of
Therefore a plot of in (x x0 )-‘, t should be linear
if Newton's Law of cooling is obeyed. The slope of c;uch a
line is r and the intercept ,szikree (x0 -
Now To •
0 418 .1z i
2 •
R
v2
E2. a, . • tr i 8
2 • 8 * • R2 C
4 4 0 " l'4-77-37:71277727( )

- 18 -
All the terms in this expressiOn are known or
measurable and therefore C can be evaluated.
If the above expression for the heat capacity is
included in the formulae derived for the heat of adsorption
then the following expression is obtained -
2 E 6. 02 xiO23 408 R (x x) n
1 o ()
This erpression does not contain, a e, or Thus
it is not necessary to know accurately these constants.
Fig.(27) illustrates a plot of log.(x t *Nit for
calorimeter Nest. This graph was reproducible and gave a
value of C which was in agreement with a value calculated
from the weights of materials comprising the calorimeter.
This method or evaluating C was good at -183 °C. but less
satisfactory at 20°C. At this latter temperature difficulty
was exp•rienced in adjusting the applied voltage 13, so that
when the platinum winding was switched back to the measuring
circuit no adjustment or the poteniometer setting was necessary
to keep the galvanometer deflection on the Scale. This
difficulty was overcome by making 2 somewhat larger. awn
the platinum resistance was switched back to the weaeuring
circuit the poteniometer setting was altered to keep the
galvanometer deflection on zero:). A plot was made of
log. (pot. t pot) against t where pot. indicates the
pot eniometer setting required to keep the galvanometer deflection
v.
tVI
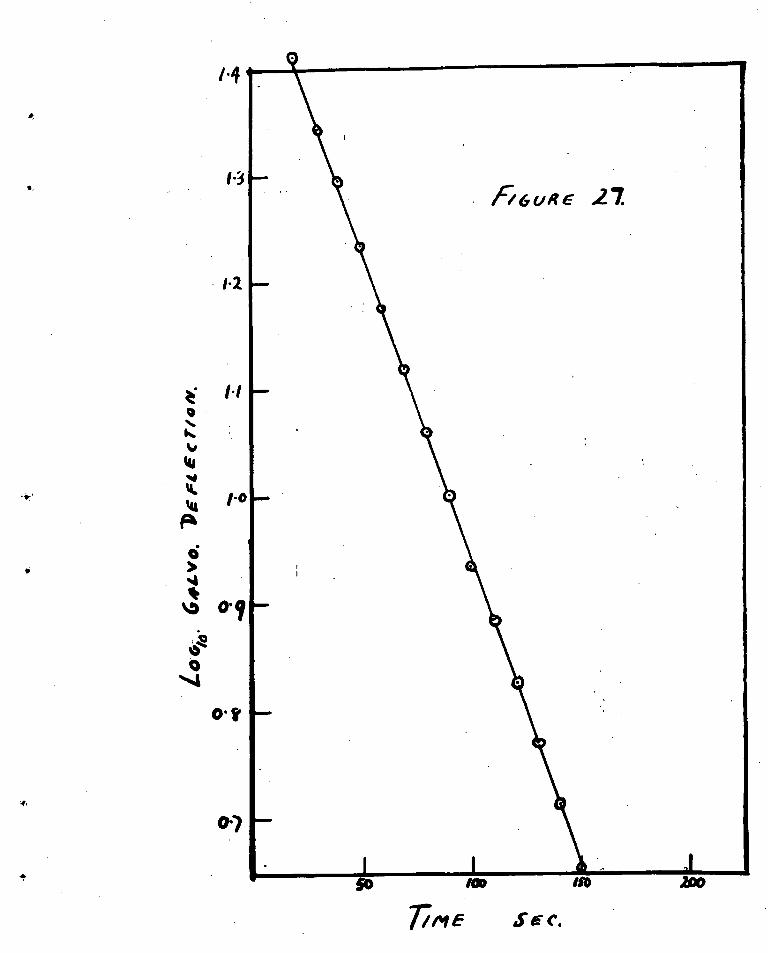
/.4
f/ 6 u R E 2 7 1.3
1•2
1)0
FIE
cTio
iv, 1. 1
1.0
sio ISO IOD
77M E Sec. zoo

4. 19 ..
Fig.(28) illustrates three typical plots for calorimeter No.4.
Prom the intercept the value of (pot. ° pct.) was calculated. .5
This figure expressed in volts x 10 was multiplied by the
galvanometer deflection caused by putting the poteniameter .5
10 volts out of balance and this value was used in the
calculation of C. As =dictated in Fig. (28) excellent
agreement in the calculation of C was obtained for three
Independent runs.
EXIARATU§
The apparatus used was almost identical to that
already described in :-,ection III. A minor difference was the
inclusion of a Pirani gauge head at a point above tap T i in
Fig. (9). A large storage bulb and a di butyl phthalate
manometer, both of which could be isolated when not in use
were attached to the eirani head. The calorimeters were
sealed to the syatem at point x in fig. (9) in place:: of the
adsorption bulbs.
ExPRImarim, agaeents:e
(1)Nickel eowders:
These were prepared in the calorimeter by the
thermal decompositiOn of nickel oxalate dihydrate. The
actual conditions were identical to those previoueia described.
(2) Nitrogen
This gas wee purified as deecribed in ection III.

0 o
Q.
1
'4)07 •■■■
Ib`

(3) HryPton;
British Oxygen Company labelled spectroscopically
pure.
PROCEDURE:
The following is the procedure used to test eaeh of
the calorimeters.
A weighed amount of nickel oxalate dihydrate (%10 ems.)
was placed in the calorimeter through the filling pip P and the
calorimeter attached to the vacuum syetem. The sample was
decomposed as previously described and then the calorimeter was
immersed in a bath of liquid oxygen. Three hours were allowed
to elapse and then the outside bulb B was connected to the
vacuum lino and continuously evacuated. The firani head
(volume = 30 tee.) was filled to a known pressure(0. 5 eme.lig.)
with nitrogen, isolated from the system and this volume of gas
admitted to the sample. The galvanometer deflection with time
was recorded and a graph drawn. From the extrapolated value
the actual heat evolved was calculated. The final equilibrium
pressure in the ealorimeter was measured with the ?Irani gauge.
From the known volumes of the bulbs and connectilig tubing the
voluae of gas adsorbed was calculated.
Several admissions of nitrogen were made in this manner.
When eomplete the liquid oxygen was removed, the ample evacuated
and than heat of adsorption measurements of krYpton at -183 °0.
were determined in a eimilar tanner.

- 21 -
The equilibrium pressures recorded by the Pirani gauge
were corrected for thermemolecuiar flow where necessary (2).
The dead space in the calorimeters was determined by the methods
previously described.
R438ULTS
14 (340rImeter.ft.. 1 -
Table (i0) lists the heat of adsorption, volume of gas
adsorbed 'and extrapolated galvanometer deflections for nitrogen
and krypton on nickel powders. The heat of adsorptions values
are plotted against volume adsorbed in fig,(29),
2, Calorimeter. Not ,
seat of adsorption results for this calorimeter are
listed in Table (11) and Plotted in fig, (30), 4
3. 2.9.22.1.10.12.21.214.1; -
The result q for this calorimeter are given in Table (12)
and plotted in fig.(1).
RIERMIE
Before discussing the resAtts in detail mention will
be made of the method adopted to improve the consistency of the
results.
Examination of fig. (29) shows that there is considerable
scatter of points in duplicate measurements. This scatter may
be due to errors in reading the initial pressure in the
Pirani bulb with the mercury manometer. A slight error in

TABLE (10)
CALORIMETER NO .1
Extrapolated Galvanometer
• Deflection
Volume of Gas Adsorbed
CMS••3 Se T.P./Gm•Ni
Total Volume of Gas
Adsorbed OMB•38.T.Pdlln.14;
Heat of Adsorption
'E.cals./kole
N2 263
184
218
117
100
381
.1 1.43 x 10
1.49 "
1.21 "
1.06 I'
1.05 "
3.05 "
1.43 x 10-,
2.92 "
4.13 "
5.21
6.26 "
9.31 "
7.75
5.19
7.69
4.73
4.17
5.42
'
N2 Repeat
200
160
104
156
123
80
.1 1.34 x 10
1.32 "
1.25 "
1 .58 It
1.31 "
1.38 "
•
1.34 x 10⁻¹
2.66 "
3.91 "
5.49 "
6.80 "
8.18 "
6.84
5.35
3.56
4.19
4.17
2.49
-.
•
Kr
,
214
462
257
195
136
116
447
1.54
1.15
1.89
2.03
1.95
1.05
1.90 .
'
1.54
2.69
4.56
6.61
8.56
9.61
11.51
5.96
6.14
.5a5
4 19
3.06
4.79
3.36
•
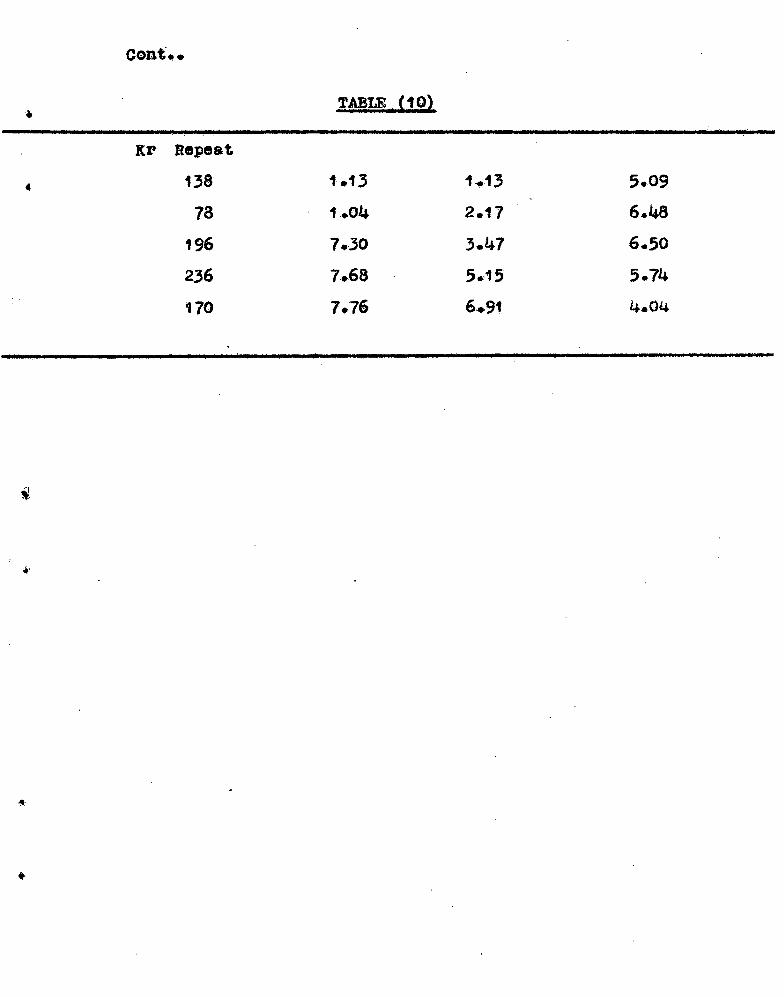
4
Cont..
TABLE (101
Kr Repeat
4 138 1.13 14.13 5.09
78 1.04 2.17 6.48
196 7.30 3.47 6.50
236 7.68 5.15 5.74
170 7.76 6.91 4.04
4

FO°Z
LC°Z
17C°E
Wez
L6 11 1.
99°1
. 55•I
arip
god's,
ter6*-0
009°0
0;9°.0
. 00-5°0
6CC°0
?Lt°0
cWo
9CI°0
tftwo
Ocl°0
&gvo
tp3I°0
991°0
, 32.1 410
911
LCI v,
ECI
tiSI
3CI
OcI
CCI
RCS,
14'3
L5°E
tIC°a
50°Z
t9°Z
06G°0
L0:4°0
UM
Z5Z°0
PEI 0
0II°0
911-4'0
6II°0
,13.1.°0
0?1°0
el&
9,71
9C1
GZI
591,
60°C
Co°C
liteT
CC*3
cF•F
iI1)°?
cI6'0
69L.°0
099°0
ggc°0
99C°0
ttm°0
tin°0
6ZI°0
SCI•0
6E1°0
10/1'0
OM
901
691
091
091
9;1
99a za
-0Tompstoo-u noT4daospv
Jo 18011
Taamprevwse°m seo
onto, TeloI
a.mpistiwu womo
Env omn-E8A jc7A:=0 * poq.otodEuprg
z 7nif.:1;7711Tar-7O 777) maw!,

TAB/1_1112i 0A1,01111_____LUMZ
Extrap. Vol., or Gas Total Vol, Heat of Galwa:cometer ems. U. T. F. /Gm. Ni Ads9r bed Adsorption Deflection eras.' 3. T.?./OmJi K. cols/mole
208
1 44
121
181
202
0.127
0.109
0.104
0.101
0,099
0. 1 27
0.236
0.341
0,14142
0.5142
3.8
3.15 2,70
4.09
4.8
180
150
180
200
76
76
Itr 176
156 i 64
209
228
252
0.132
0.131
0.128
0.123
0.121
0,118
0.254
O.2!9
0.2143
0.237
0.4126
0. 2214
Q,12
0.2614
0.392
0,516 0.637
0. 755
0,255
0, 504
0,7147
0. 984
1.211
14 43
3. 2
2. 69
.3i 3.83
3.41
3.53
i .63
i.48
1.59
2.03
2.38
2.66
4

xleityprorf. NITRoo Iv,
X
FICsURE 2q.
0
0)(94
0
/2
VOLUME A Diost BED CA Arun I fol.
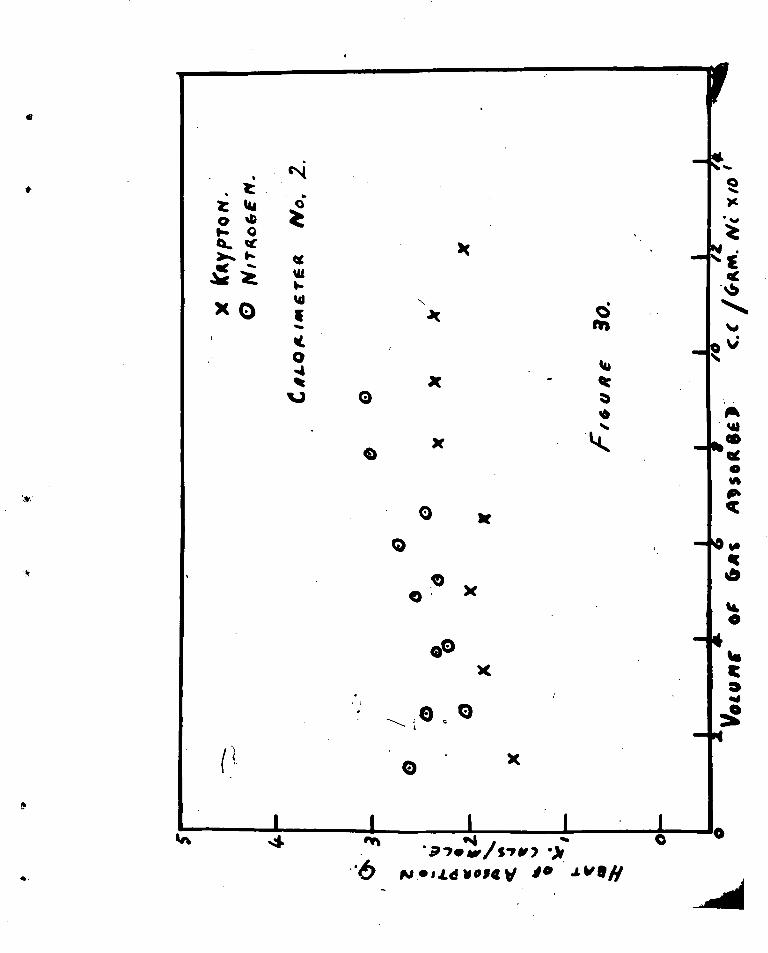
X
0
X
—A6
X 0
1 4 rvt . 37•/S,,2
•••6 Nooldvont/ 10 4.V.#
to.
00 X
9 o 0
• X 11‘ 0 40 1.• 0 O. VC
X 0 e sLo A tin a ra a

4i
eel
CA
L O
K I
NI E
rEik
••
A )S
oft
Ss P
0
0
0
0 0
1 1 1 31 -70W/.3711,11
NoJdvosav lo 4.v1N

603eTtlxo Toq0Tu mt14 Jo uoT4Toodwoopp
VuTanp awnloA uT uoT4D•4uos sq4 o4 onp Jopflod eta Jo aan4uu
pal-loud ifilasoo/ sq4 Jo ssneoaq i..xessoOmun sem uoToTAoad •9 g0110
4sq4 pawnsse usaq peq 4/ *uoTqnqTa4sTp 4sTsse o4 u2Tcap
as4aulTdoino atm uT spew, usaq peg uoTeTAoad ou'4eql pe4eTosaddr
orm 4T uoT4daosp3 ma0JTun Um 03 Padloa 114 -M
gJoJsuvat 40oli 4004 *a
uoT4dJoape maoJTun uog
saT/ Zmoqoad uoT4nue/dra aqI -uo4dAa.17
Jo osvo sql uT WilapT AP ATTVTOOd00 eT OTuI mnwprom ltIVTTo
e Jo sousesad sq4 siermsa (6)4 ,915 Jo uoT4nuTrIazg
aa4MUTZoit40 JO 94TDMH 1Yr-14, ' 30 trOToeno
*og J94smaolvo q4Tm
1suTe4qo tOQ4 UTpuTox s4uomsanevam /Tr uT paan onpA poq4am
*3Jolalu0ugim Sdnoama 0144 Pus a4v/eq4qd /.44nq Tp sq4 wog 4suTs3e
P 03100110 Sea UOT4C21043PU o4 aoTad Traci Tue.TT 9143 uT aJnessad
Teu4ov 4satesaJd TeT4TuT cum sum qeome 4e aq o/nom
uoT4daocpe 10T4usJeJJTP qora 4eM4 4usam ova *sanssaad
TIvazmo
4 4osJiTa Pl4no./.9 4ou PIP u 0T4daoeP reT4u0a0JJTP
goes ./05 pailamoJ se2 Jo amnloit rows oq4 lvq4 os S4Toedeo
4unToTuns Jo $nm canq 0232Oze on .canq TuvaT4 ag4 04
paundo pue aanscoad paanseam e 4v sag tIlTm PaITTJ eum curno
iims4sAs eqq. uT A4Toodv3 u1:i01.q Jo canq a9eaols aae/ v opmouT (34.
PePToap sem 4T uoT4ewe4 sTu4 eitoadm 04 4.1oITs ue ur
ewan/vAlmoT4d4ospe Jo lesq sql uo 400ms , palyaem
v eAnq p/nom R'stuo g'0 Jo JoWo oql Jo) axnessad 9Tq4 2uTpusa

- 23 -
If poor heat transfer is the explanation then the
results should vary depending on the position of the platinum
coil. It was decided to test this explanation by placing
the platinum wire on the outside of the inner bulb and
observing the effeet. It was for this reason that
calorimeter No. 2 was constructed and tested.
Discussion of the Results of Calorimeter No.
Table (II) and fig.(30) show several interesting
feature a.
1. The spread of the results in duplicate measurements
is much less than those obtained with calorimeter No.i. This
indicates that inaccuracies in initial pressure measurements
were in part at least responsible for the inconeistencies
previously mentioned.
2, The overall values are considerably smaller
(especially the first few 'points) than those obtained with
calorimeter No. .
3. The values are approximately constant but there
exists a definite tendency to increase, the larger the volume
adsorbed.
4. The shape of the plots are in complete contrast
with those generally accepted for physical adsorption.
The probable explanations of these results are:-

-24—
is Poor thermal conduction through the glees walls
of the inner bulb.
2. Poor heat transfer through the powder.
3. Non uniform adsorption due to the inability of the
gas to penetrate easily and quickly to the bottom of the
powder mass.
It was decided to test the third explanation by
improving the gas distribution with a central inlet tube.
Calorimeter No.3 was therefore constructed.
amesion of the Results . of Cd'aloricacter 17O.3
The results shown in fig.(31) are very similar to
those obtained with calorimeter IJo.2. This means that an
improvement in gas distribution is of minor consequence in
this type of calorimeter. This would suggest that the
dominating factor le the poor thermal conductivity of the
glass wall of the inner bulb.
General Conclusions
The results obtained with calorimeters no.. 1, 2 and
3 are not good. No satisfactory differential heat measurements
were obtained at -183°C. Of the throe calorimeters tooted
PC.1 was the most promising. An obvious improvement in design
ould bo the inclusion of a perforated inlet tube to improve
gas distribution. he design and testing of a calorimeter possessing thia addition will be discussed in part II.
•

-25
PART II
THE ADSORPTION OP OASES OD EICMI. OXIDE
INTRODUCTION
As mentioned ln the introductory Paragraph to this
Section the aim of this investigation was to measure the
differential heat of adsorption of oxygen and carbon monoxide
on bulk nickel oxide at 20°C. Now the investigations described
in Part I have indicated that non uniform adsorption of nitrogen
at -183°0. on nickel powders plays an important role. It is
doubtful if this effect could be completely eliminated in the
the type of calorimeters designed.
Now from th,s2 results of Dell and Utone (106) on
nickel oxide films, it was anticipated that caoh small addition
of either oxygen or carbon monoxide on bulk nickel oxide
would react with the upper layers of the powder whatever
provisions were made for uniform as distribution. It was
decided, therefore, to restrict measurements to integral or
average heat of adsorption rather than differential values.
aakaawalu_111 ,A
This caloriMoter,illustrated in fig.(52), woo similar
in design to No.1 but in addition possessed a central inlet
tube. This inlet tube was perforated with a number of holes
and loosely packed with glass wool to prevent blockage during
outgassing and decomposition. The platinum loads entered the

ficreRE 32.

- 26 -
calorimeter bulb by way of small diameter capillary tubing of
sufficient length to allow the ends to remain clear of the
liquid oxygen bath. With such an arrangement a satisfactory
seal could be accomplished with aPiezen black wax.
EXPiR IKENTAZ:
ROaRePto
(a)Nickel Oxide:-
Bulk nickel oxide was prepared by the thermal
decomposition of nickel hydroxide, The parent salt was
prepared by treating a volution of reagent grade nickel nitrate
with an exceos of ammonia followed by steam distillation.
This method has been shown to yield nickel hydroxide in a state
of high purity (124). Teichner and Morrison (107) report o. that decomposition of nickel hydroxide at 210 C. iv rapid / the
product or decomposition having the composition 14 i 0 . 016H 20.
However, continued heating of the produot at 250 0C. or higher
at pressures of the order of 10 ."6 mal6Hg. led to a black oxide
which had lines characteristic of metallic nickel in its
x ray pattern.
In this investigation the nickel hy4roxide ( 10 ems.)
was placed in the calorimeter and decomposed'at 230 °c.
However, several days continued decomposition were necessary
before gas evolution fell off appreciably.
(b)0 Carbon Uonoxide and Nitro n:-
The preparation and purification of these gase
been described elsewhere in this thesis,
4''••

27 -
a2RETAIR2
r- The apparatus used was identical to that described
in Part I.
Procedurv
(a) Testing Calorimeter No. 4
The oalorimeter containing nickel hydroxide wae
sealed in position and evacuated continuously for seventytwo
hours at 23000, Vlhen cold the calorimeter was immersed in a
bath of liquid oxygen and after three hours the outside bulb
continuously evacuated. Nitrogen was admitted in large doses
so that the equilibrium pressure in the calorimeter could be
measured with a mercury manometer. The temperature rise of
the powder was recorded and from the known volume of the burette
system the volume of nitrogen adsorbed was calculated.
(b)' o en and U rbon Eonoxide Adso t on at 200
The calorimeter containing the freshly prepared
nickel oxide was placed in a large water bath maintained at
room temperature (200e.). The adsorption of both oxygen and
carbon monoxide was then studied, the heat of adsorption being
recorded. The gases were admitted, in most epees with
evacuation at 20°C. in between admission in large amounts from
the burette system so that the equilibrium pressures were
measured with the mercury manometer.
The nickel oxide was evacuated at 2000. and the
measurements repeated. The measurements were also repeated

on fresh samples of nickel oxide.
ICSULTS
(a) 1"---12.1rini_hoterilo.Teatil
The results of the heat of adsorption measurements
of nitrogen at -183 °C, on nickel oxide are given in Table (13)
and plotted in fig,() ..
(b) Th Adsor on of Ox on na carbon onozide on .-01cel OxLtl
These results have been divided into four groups
given in Tables (14), (15), (16) and (17).
Table (14) gives the results of successive additions
of oxygen, to the pressure listed, with intervening evacuations
where indicated,
Table (15) gives the results of similar experiments
with carbon monoxide,
Table (16) shows the consequence of adding successively
oxygen, carbon monoxide and then oxygen, with intervening
evacuations as indicateao
The final results given in Table (47) are for the
sequence carbon monoxide, oxygen and carbon monoxide.

TABLE (13)
TESTING ciALoRImmajmitA Wt. nickel oxide
9.51 Vs.
aurtace area 140 UP/gm,
Total Volume N2 Adsorbed
ems. 3
Hest of adsorption K
cal./mole.
2.82 2.71
8.65 I .98
13.72 1.81
i9.77 1.73
23.01 -1.70
26,24
32.66 1.25

0
.mm.4 •■■•
0
0
t qt m #44 "
'?"70W/S11,0
No/ jd10,fd te I* J. VON AL

tr6 e
sganou 0 JO.; "0009c qu uo -menouilF
6f7 .0
weallo JOJ '0000Z 411? 1101:491109Ar 014
eCio ta•c
-sanoti JOJ . 0000Z 42 UOT49nOUtog
WO 09'9 9 gC*0 99 .c
*4q? JOAO '0003 49 uoT4en3oil1 .9
gC °01-
10'9 Sc
. 9c'c 4.e
(R0) TR jo uoT4Tandmoolm •
otow/istuo'R ITV cd"I"
e mulato
.2twomo soura 01
aoute esso, dalr3
gq;
9'17
9't?
9' 17
6°47
5'6
nalem 01. m "W 'S .swR 1.6°6 = OTWV
7177M— in

t-0-*
,
9C
tWO
j 'n 419 uo uT1jAt"
1,Z •O
cl-"O
90'0
OT•Z so oT4
nog e
7—
7 "t-
wrou/ Pv‘ 1-1
sios ciamo) 0
00 glont 0A
,141:*.swo "Inal OI
494jv oanego da4s
"male otii, • Vs .872 1.5 6
ottj•ith
Wrr."----019Y1

TABLE (16)
Wt.N10 9,51 gm. 140 m /a
Step xiess.atter Volume
10 min. (0116-7 8.T.P.) ems. 1g. CO 02
A II
1.
2,
3.
4,
5.
6.
7. 8,
9.
10,
11.
Evacuatlon of N10 at 360°c. for 48 hours.
2.94 . 1 25
-t;vacuation at 20°C. for 12 hours.
3.85 . 23
Evacuation at 20°C. for 1 hour. 1•11.
0.16 4.07
0.74 4.93 Woe
2.47 2,65
Evacuation at 20°C. for 12 hours.
Sera
2.33 1.85
4.41 6
17.78
5.4
52.9
24.6
35.6
8.9
v.

TABU (17)
Wt. NW = 9.51 gms, 140 in2/gm,
Step Press. after VOlume 10 min, (cm, cms.Hg. 00
) 02
ati K*cals./mole
1 Evacuation of Ii10 at 2000.° for 12 houra.
2 0t,06 3.31 52,9
3 0.13 2.64 ••■ 27.2
0.92 3.34 17.8
5 Evacuation at 2000, for 12 hours.
6 ow, lei° 2.87 41.3
7 nVecuation at 2000, for 1 hoar.
8 5.38 0 4 5 6.33
9 Evacuation at 20°0. for 1 hour.
10 0,32 3. 69 29.2
'T\

w* 29 a.
DISCUOSION
(a) Testing_ 0alorime,ter No. L.
It is difficult to compare the results given in Table
(14) and fig.(33) because of the absence of suitable published
data. Most investigations on heats of adsorption have been
confined to evaporated metal films. Following a suggestion
by tiesok (113) these films are Oln,Posed to be aompletelY
covered at a preseure of 0,1 and all measurements
have been confined to pressures below thia figure ( 1 13)(
(125). In all such cases the Values fall from initial ht &i
values at low °overage to approach the heat of liquifaction E
as the coverage
regard to powdered materials Beebe and co-workers
(117) have studied variouS adsorbents but not nicicel oxide.
In all these investigations, hoer, the heats of adsorption
fell to approach L as V.-,-) 14 Trapnell (126) has recently V- '
compared results for powdered metals and evaporated filMe and
has noted that the powdered results arc invariably lower*
The nearest approach to the present work is that of
4ingaton and Aston (127) on the adsorption of nitrogen on
anatase at -i95°G. They found that the heat or adsorption
fell from 5 K cal./mole. down to a value close to 1:.; at V = 1.5 Vm
In the present investigation, it should be noted that
the values are integral and not differential heats of adsorption

- 30 -
and are therefore lower. It may be seen from fig. (3)
that the values approach the value of t as V—,
The fact that value° of the right order were
obtained indicates that the calorimeter was satisfactory
in its operation at
Oxygen and pa rbon Lionoxido Adqorption
Before discussing the results in detail a few
soncral points may be made.
1. The majority of both the oxygen and carbon monoxide
admitted to the oxide at 20°Q. was adsorbed rapidly but in
each case there was a swaller plow uptake extending over
several hears. The carbon monoxide adsorptiOn was
somewhat slower than that of oxygen. The pressures listed
in the Tables are those recorded after ten minutes adsorption
and do not represent equilibriuw values, neat of adsorption
readings uerc taken for ten minues andakter this time the
pressure was measured in order to calculate the volume of
gas adsorbed up to this time, a figure necessary in
evaluating the OH values.
2. Carbon monoxide was adsorbed to a =eh greater
extent than was oxygen. This is in contrast to the results
of fJel1 and Acme (i06) on nickel ogide film but in general
adrecmcnt pith Teichner and iorrison (107)4
3. The nickel oxide contaminated by several

d i
"7 4
adsorptions could be regeOtated by heating in %men°
at 200°0. Thie observation to in accord with the results
of Teichner and i.:orrison. However the extent of regerRa.t.A9n
vas found to be dependent on both the time and temperature
of evacuation.
ggraL012,:j1.1,10N.
(a) Oxygpn kisorption
Mt: results given in Table (4) pessess several
interesting features.
The integral heat of adsorption of the first oxygen
admitted is 9.5 K cals. ./mole, vhieh may be compared with a value of 43 h. cals./mole found by Dell and ;Acme (106).
This lover value was, wever expected because in the case
of nickel oxide films there is almost certainly come reaction
between the adsorbed gas and the underlying nickel metal.
This suggestion is confirmed by an observation made during the
kinetic studios described in '.:ection III. It was noted
that nickel powders supposedly saturated with oxygen at 300 °C.
after some days standing n vacuel reacted with further
oxygen at room temperature. Presumably, during evacuation
fresh nickel metal became exposed•
TUls exPlanation is confirmed by stops 13 and 14
in Table (V4). Teichner and Morriaon (107) have noted the
appearance of metallic nickel when the bulk oxide was o, e. Presumably in step evaeusted at temperatures above 250

-32-
13 this occurred so that when oxygen was admitted in alto 14.
the nickel was oxidized giving rise to u higher integral heat
of adsorption.
2. The effect or time on the regeneration of the oxide
by evacuation at 200 QC. is shown in steps 9 - 13 in Table (14).
Owing to the largo maos of oxide used (:= i) gms.) it was
difficult to completely remove adsorbed as oven with
evacuation overnight.
3. It is difficult to compare the volume of oxigen
adsorbed with the results of Teichner and 14orrison because
these authors foiled to record the equi/ibrium presbures.
They state that each gae was adsorbed to saturation,
In the present investigation the udsorvtion of oxygen
was studied up to an equilibrium pressure Of 40 cms.ag., but
this was not the saturation pressure. The values have not
been given in detail as they do not conform to any or the
well known isotherms. The nagnitutie of the effect of
pressure on the volume of oxygen adsorbed at 20°0. can be
gauged, howeVer, from steps 1- 5 in Table (14i. It must be
realised, however, that the pressures listed are those
Measured after ten minutes adsorption and are somewhat higher
than the equilibriuw values.
(b) Carbon Uonoxide Adsorption
The rapid adsorption of carbon monoxide giving an
integral heat of 53 4 cals./mole was reproducible to 1.
-9'

33
However, the hoat evolved in the slew reaction (extenDin9
over several hours as judged by the pressure drop) was
difficult to evaluate. This slow exothermic roaction slowed
down the normal rate of cooling. Thus the gulvsno:deter plots
were flatter than those usually obtained and hence the
elitrepolated values and, therefore, the heats of adsorption
are lower than would be expected in the absence of this
secondary reaction. The values of 36 found
for latter additions are probably low because of this factor.
The value of 53 X.cals./mole is double the value
found by Dell and 6tone (106).
(a) M2294a19.-ZSWIltals—Wakta i*Isnsxige OW.01, 11
The results obtained for this sequence are in
4
contrast to those found by Dell and stone (106).
14 The second let of oxygen (step 10 Table (16))
was adsorbed with a heat of 36 K.cals./moie which is
considerably larger than that found for the first adsorption.
Bell and atone (106) found, howoverp similar values (43 h.cals./
mole.)
tvi 2. TOe heat of adsorption of carbon monoxide
Is the same (53 4,calsamole.) whether the oxide is clean
or presaturated with oxygen. This is in contrast to Dell
and lAone who found a higher value for the prcsaturated uith
oxygen run. The present results seem more ligoly because it
has been shown (107) ('i12) that freshly prepared niehel oxide

• 34,
contains an excess of oxygen. Therefore the conditions with
regard to the preeence of oxygen are the same in either. ease.
In the case of nickel oxide films on underlying
nickel metal, when freshly Prepared, onY excess oxYgen would
react with the underlYing nickel. Therefore the conditions,
at least in rewrd to the presence of adsorbed oxygen, would
be different in the two cases and hence the difference in the
heat of adsorption of carbon monoxide observed by Dell and
Stone is not surprising.
(d) bon to n Carbn Monoide
The results are again different in m gnitude to those
found for oxide films but certain features are common, thus
1. The heat of adsorption of oxygen on the
oxide saturated with carbon monoxide is considerably higher
than on the clean surface. This same effect wae noted by
Dell and stone (106).
2. A further lot of carbon monoxide could he
adsorbed (step 10 Table (17)) as the result of adsorption of
oxygen on the oxide saturated with carbon monoxide. The
heat evolved, however, Was less than previouslY found and
possibly is in error owing to the effect of thesacondary slow / reaction discussed previously.

-35-
OREWILEManal
The results of this investigation while at variance
with some findinqs of Dell and Stone (106) substantially support
the work of Teichner and Morrison (107). &mover, in the
absence of equilibrium pressures in the latter publication a
complete comparision is impossible.
The present work has ehoun that the adsorption at
20°C 0 is a function of the pressure. This finding is in
greement with the work of Vmgell and ilauffo (111 ) 1 but would
appear to be contrary to the work of Teichner and gorrieon
who mention adsOrption up to saturation. In the present
investigation no saturation was observed up to au oxygen
pressure of 40 01141.
The Arability to thoroughly out-gas the large mass
of powder used in this investigation may be an explanation of
the fact that the volumes of gases adsorbed iere smaller
than those previously reported (107). However, the lack
of equilibrium presoures confuses this issue. It may be
noted, however, that the present results are more in accord
with the work of Rrause (112) than are those of Teichner and
Morrison (107)o
The present investigation has confirmed the findings
of 2ngell and Hauffe (111) that two rate processes are
involved in the adsorption of oxygen and Carbon monoxide.
However, in both cases the heat associated with the fast reaction
only was measured.
Although the present roma a differ somewhat in
•magnitude from those of Teichner and Morrison (107) there are
two features in common:a ,
(1) Carbon monoxide is adsorbed to a greater extan t
is oxygen.
(2) Botu oxygen and carb u monoxide can be removed and
the oxide regenerated by evacuation at 200°0, Both these
flndinge are in contrast to the results cf Dell and •Stone (106)
on nickel oxide rams. An exPlanation might be the probable
presence of metallic nickel in the oxide films. This could
also explain the differences found in the beats of adsorption.
With regard to theregeneration of the oxide by
evacuation at 20000. it is doubtful if the carbon monOxide
adsorbed with a heat of 53 R.cals ,p/mole.cauld be removed at
this temperature. This is supported by the fact that
regeneration was slow at 20000. but enhanced at higher temperatures.
It is Probable that at 20000. or higher the carbon monoxide may
enter the bulk of the oxide, thus effectively regenerating tho
surface. This aspect requirce further investigiation before
definite conclusions can be made,

4
Dell and Utone (106) suggest the forMation of o.
complex of the type CO but this is challenged bY the work 3' of Teichner and Morrison (107). The present investigotlen
would tend to support the contention that a complex exists,
but direct proof as to the formulae is not available.
A criticism of the present work, is that the nickel
oxide could not be completely outgassed at 200°0. Such a
criticism can, however, be levelled at all investigations
involving powdered materials, whatever the temperature of
out-gassing.
A further criticism 10• the non-inclusion of a
liquid air trap between the adsorbent and the burette system.
Owing to the particulaedesign of the apparatus
used the inclusion of such a trap was impossible and therefore
the present results may heve b en affected by the presence of
mercury vapour.

ACKNOP ",DOWINTS
I would like to gratefully acknowledge the help and
advice of Professor B,E. Kurth throughout my COUr80 at this
University. I wish also to xPress my eratitude to VI'''. Lenahon
of tho PhotographY DePartmento ;3an6y Day, tor tho preparation
of the figures for this thesis and to Ur. B. Richardson for
the photographs of the apparatus.
I also wish to record my gratitude to Ur. G. ijewstead,
formerly of the Laectrical .i.ngineerinE Lopartment, for tho
construction and maintenance of tho temperature control unit.
Finally I wish to express my indebtedness to
Dr. J.A. Allen, formerly Senior Lecturer in Physical (Auras- try
at this University, whose help 8nd advice have been invaluable
and without whose highly competent glass-blowing much of this work
would have been impossible.

BaBLIGumArnY
(1) Bonito, D.E.
(2) Dushman, Se
(3) Callenkamp & Co. Ltd.
Kubasohewski, 0. and Hoplcins„
(6) Vernon, W.H.J., Calnan, E.A„ Clew, G.J.B. and Nurse, J.T.
(7) Campbell, 4E. and Thomas, U. B.
(6) _ Mitchell, J.W. and Allen, J.A.
(9) Cabrera, N. and Hamon, J .
(10) Oulbransen i Z.A. and Wysong„
(41) Vernon, W.R.J.„ Akeroyd, E.I. and ritroud,
(12) Lustman B. and Meh1,114E«
(13) 4clwood, P.
(14) Oulbrans n, LA. and Ruka, R.
(15) Tylecote, R.F.
(16) Leontis, T.:Vs and Rhine4VM
(17) BradsX7, LB. and Cublociatti, D.
Honours Thesis, University of Tasmania 1953:
"Scientific Foundations or Vacuum Technique".
Wylie & Sons 1949 p.65«
• Catalogue 12th. Bd. vo1.1 P.243 No.4i52.
"Oxidation of Metals and Alloys". Butterwortha 1953.
qv°. Roy. Soc. (London). A 216 375 (1953).
Trans. Electrochem Li 623 (1 947)
Unpublished results.
Compt. rend. gia 1 713 (1947)
j. Phys. and Coll•Chem. i087 (1947).
3. Inst.ioetals ga 319 (1939)
Trans.Am.Instakining Met.Engra. .1.41 246 (1944).
Paper presentad to .146Chem.Soc. Meeting 19/14/48:
Metals. 188 1500 (1950).
J«Inst.Metals. a 259 (1950). Trans.Am.Inst«Mining Met.Engre. ..116., 265 (1946).
Am Chem: ,Soo., ZZ, 3497 (1951 )

.17
a
(18)
Moore, W.J. and Castellan o G. W.
(1 9 )
Gulbransen, B.A.
(20) Glasstone, S., Laidler, K.J. and Eyring, H.
(21) Moore, W. J.
(22)
(23)
(24) Gunderman, J. Hauffe K. and Wagner, C.
(25) Wagner, C. and Grunewald,
(26) • Wilkins, F.J. and Rideal, - -
(27) Wilkins, P.S.
(28) Feitkneoht,
(29) Dravnieks, A.,
(30) Rhodin, T. N.
(31) Gwathrney, A.T. and Young, F. W.
(32) Bosinka, 5.3. Mrs., Polling„J.,3*. and Charlesby, A.
(33) Kubaschewski, 0. and Goldbeck, 0. von.
(34) Wagner, C. and Zirnens,
(35) Hauffe, K. and Gensch,C.
(36) Wagner, C.
J. Chem. Phys. .1.1 41 (191j.9)
Trans. Electrochem Soc. SI 301 (1943)
The Theory of Rate Processes, New York 1941.
J. Cheni.Phys. j_ (1950).
ibid 148 (1937)•
ibid 242 455 (1938).
Proe.Roy. Soc. Al28 394 (1930).
Ibid. Al28 1407 ,(1 930) .
Z.Eleetroehem. .15, 142 (1929).
J.Am.Chern. See. ig 3761 (1950) 3.Phys.Chera. 5140 (1951 ).
J.Arn.Chern. 60e. 510 (1950) ibid. 21 3143 (1 951 ).
Rev.Metall. 4L3 434 (11951 )
Acta.Met. 2 313 (1954).
Z.Mettallk. 158 (1 948 ).
Acta. chem.. Seand. 1 547 (1947) "
Z.phys,Chern. 12g 427 (1951):
z, phys.Cheme 132i 25 (1933).
Hauffe, K. and Rahmel, A. Z.Phys.Chem. 122 1 52 (1952 ).
Dun-ald, H. and Wagner, G. Z.Phys.Chern. B22 21 2 (1 933).

400. :5
. and Liott t, VLF. Reports on Progress in Physics. 12 163 (1949),
Proc.tioy. ace. A 2.34,. 398 (1956).
(37) Cabrera,
(36 ) Grimley, T.13,. and Trapnell, Borri.ri.
(39) wagner, C.'
(40) Roar, T.P. and Price L.E.
(41) Jost, W. .
(42) Hauffe. R.
(43) Baufte.
ft
(40 GItisilley, T.B.
(45) Ai 'nal * Lo o and B1rebenali 0 C.R.
(46) Each, and Wagnero G.
(47) ilauffo, K. and Ciensoh Q.
(48) Va1=1 2 00
(49) Cabrera t iN. , Oes also Ref.371
(50) Allen, <LA.
(51) See
(52) Lamton, M.A. and Trapne 11, B. IL i.
Cbemische Reaktionen deX Metall° Leipzig, 1940.
Trans. Faraday, 4.4 667 0930* Diffusion If.chera,Reaktion in festen Stoffen Leipzigr 1937.
Z,Letallk ta. 34 (1951).
a.tiikuna L. 576 (1953),
i,11c/kLetoffs U, 4orrosion 6 1 17 (1955),
Proc...Intern.41ymposium on Reactivlty of Zelda, Cothenburg 823 ('1952).
410h,ernistry of the oUd State o E.D. aarner. Butterworthe I 56 Chapt p.336.
J.Letale, 827 (i 95:j).
Zephys.Chern., 295 ( 1 938) ,
a. phys. Mica. 12,!,?7, Yi6. (1950)
113ctailure.1tal 42. 77 0 1014 (1950).
Phil.Mag. 4,2 175 (1949).
Revra.Pure Avpi.tabora. ; 33 (1954).
Procrtioy. 60e. tL2.22, 387 (1955).

6 (Z,C6t)
. ( 17t76i.) 99ct, 9 00I1 1111CM Mt!'
"(CM t, ) LLL T 411e4 emit!
`(60 60c 09 PTA1:
(17% ) I,. 7 ', .0,3t-tuotto...t1yo.r
*V.1. 4 "CT TN
!If .neetilo
!I'arnmeurrl
4 4.1T inoCt pw gErPmg.
117 tr ‘3'5u011 Pue fr 4q4Itelooil 4 actooq
(a)
(a)
(4)
(OL)
(69)
°Txtlqi.l`ArgArl
tH ettumg
(99)
Ptre gtet4 ,1011 0T4 (L9) "Pet un (99)
caormtnoir pun ,134 olivig (69)
gtatip pixio ifcf .#petartvart ( 119)
040%4. VIM (c9)
*a lawtvl, tms d 4- soma 4 •r,,, ‘Jorteuriact (a9)
an Pure *VA iForM6tell (I-9)
oxfa ioxl80,1 Due ov.e luartv
vn
;•1- )1,101,1 coS
feuvag
4 H 4n tivAg
clatql
titA gOltIrt*U0F.1
lieJaUgotra Pus 6M 4 043m44
ir*z 4unzlotts
(09)
(65)
(95)
(Lc)
(95)
(5g)
(llK)
(C.c)
`( 176 I.) L rrPTcr;
(9% I.) r maid: itim40
(5t764.) O't? 1.t/ ,00s Sepucjvz leue41
* (9 1,6 1-) 9ç 5F PTerr,
, (07-60 Cic:1, 1, a PI cUr
'( t160 rirpTcyr
•(trfitt-) . 69.C;•
•(61..) cull h"L `009 ''tuotiOattltrt
(9t761, ) !rg mttltinu91,10!
01166 L99 'fc qual!,0•9Atta .2
, (5560 t. nowq0#1ddy *JAVEIAOU
(Lti6 ) trig TC • gaovaleitooalootveusaa,
tiesejtot eor: 4euigiia 0%. uo.culoTuntiwoo (next .14
. (GG6$.) Get- 77 5ITstiteV7
" (tic.176i.) age; g meq00.149.5Tatrz
(056 ) E0 1.5 nnot10 *Inv

(74) liarkins o
(75) fIll, T.L.
(76)
(77) Smitb,R.E. and Piaree $ 0.
(78) Pierce,Ce„ and Smith„R,BT,
(79) Anderson,R.B. qlsa
Anderson,R.b. and Hall,
(80) Pickett, 0,
(81) Dole,M.
(82) Ross 0 6,
(83) Perguawn,R.R. and Barrar,R.O.
(84)
(85) itoss„S.
(86) Carrill o 14.14
(87) Schreiner, 0, D. L. and Ltoibal1 ,C..
(88) Barrer,R.M., McKenzie, N. and ideLeod,D.
(8C? 0Orrint iliaL.X.
(90) See Ref. 64.
(91) Emmett,P.11.
4PhYsiael Chemistry of aurtaeo Alma". Rianhold 1952. P.231.
Chera,Phys.; 1.2 767 (1947).
ibid j. 9$1 (1948), also Advances in Catalysis
IV, p.263.
3,Phys.and Coll.Chem. 1115 (1948).
ibid .572 669 (1949).
J. Aru. ahem, 8oc. 68 686 (1946),
ibid 72. 1727 (1948).
ibid :1 958 (1945).
3. Chem. PhYs. i6 25 (1 948
Sahys.and Coll.Chem. .51 383 (1949).
Trans. Faraday Soc. LIE. 400 (1950).
J . A in. Chem.Soc. za 5347 (1 959 ) Phys.and Call.Chem.
383 (1949).
ibid 612 (1951 ). .
Trans. Faraday doe ,, 90 (1953).
34 Chem. Sao. 1 736 (1952).
a. Am. chem. Soo. it 4061 (1 951 ),
ibid 68 1784 (1 9)46).
42
4--
( 92) Livingston,
(93) Joyner, L. G. and flimett P.1-4
(94) D*viø,R.T. and Dew itt„ T. a.
(95) Joyner, L. G. and Emme tt, P611.
( 96) Ju.ra, G. and Harkins, W. D.
(97) LiVingston, K.
(98) Li v ingston,11.
(99) See Ref. 91 •
(100) Joyner,L.G., iienberger, S. B. and Montgomery, G.,
(i01 ) sraith.„T. D. and Bell„R.
(102 ) See Rer.113,
(103) Brunauer, S. and L'raaett, P.,
(104) rington, Silo. G. and Mart in, J. P.
(105) See Ref..103.
(06) Dell,R.M. and tone, F. f3.
(i07) Teichne r, 8,4,- and Morrison , J. A.,
(108) Allen., J. A • and Haigh', 0.3.
(109) Parravano f O. and Boudart Ai
(110) liauffe 0 X4
(114) i.J, and Efauffe ,
(112) Xrauss, W,
3:Chem.:Phys. 11 617 (1 9k7), 34 Aitio C hem. SOCs n 2353 •(1948 ) ibid 2s4 1135 (1948),,
/bid 2,c) 2359 (1948).
ibid at 1941 (1946).
Goll• Go. 4 447 (1949). J. Cben,4hy. '; 2 466 (1944).
Trana.Paraday boo. 4,2 154
Trans, Faraday Soc. :5(2 501 (1954).
ibid 96ii (1955 )
J, km. Chem. Soc. lk 5245 (1954). _Advance° in Catalysis Vol.VII (i955) P. 47, caderale .rreas. New York.
ibid p. 213#
Z. ElektrechoM r4 773 ( 953). ibid la 320 (i 948 ).
J. A m, Chem. W. a 2182 (1945).
Nature 102 109 (19k8).
Chem. soc. 52 1553 (1937).

6
(113) Seeolt, O.
(114) Bul1,11. I. „Hall,r1 R. and Carner t vi.E.
(115) Marehall,LI.J. and Cook, 11.M.
Advances in Catal,yeis VoI.II •(1950). 1,4151.
J.Cbam.Soc. 837 (931).
J.Am,Chem.Soc, 51 20i 9 ( 1 929).
(116) Beebe,N.A. and Wildner,E.L. ibid lk 642 (i934).
(117) Beebe,R.A. and Orfield, 12' 1627 (1937). H.N.
Beebe $ 11.A. and Ztevena,N.P. ibid 62 2,34 (1940)1
Beebe, R.A. and, Dowden, Ali ibid. 60 2912 (1938).
Beebc,R.A., Briscoe,J. Smitb4W.1. and Wendell,
C.B.
Beebe, R.A.
lbw fa 22% (1947) • - 2 40 (1950)
1775 (1950).
Transo Faraday Eloc. la 761 (1932h
41
(118) Ar
(119)
(120)
(121)
(122)
(123)
(124)
Morrison,J.A. and Los,
Garner, 'N. and Veal„10 .
Merlin, A. and Teichner, S.
13eeok0 0.1 Oole,J.A. and inecler, A.
Taylor, H.S. and El a t iakowaki, G. B.
Watiba, M. and itemball g ei
earneri W.E., ttone 9 F.$. Proc.Roy. Soc. A 211 0.116
and Tiley 472 (1952).
Discuss. ParadaY 300 . No. 8 314 (1950).
3„ Am, Chem. 1,loo. .42 2200 (1927).
i)iseusts. Faraday tioa•' No. 8 321 (1950).
<7.0bern. Soc. 1437 (1935).
•
Trans. Paraday Ooc.4 42
'' 351 (1933).
Compt, rend, afi 1892 (1953) Bull..u,oc. Warn. 914 (1953).
416

41%
(125) Trapnell * B.O. W.
(I 26) Trapnell * B* W.,
ro Roy. 'Joe. A218 566 (1953) .
"Cheat sorption" Butterviortbs I 955a
(127) IciriBErt0110G4,14. and 4AI/10011cm. fioo oton, J. Gto 929) (1 95/ ).
411-
111