some experiences in the development and application of soil … web page/nsf workshop...
TRANSCRIPT

Some Experiences in the Development and Application of
Soil Models
Andrew J. WhittleMassachusetts Institute of Technology
NSF Workshop on Nonlinear Modeling of Geotechnical Problems: From Theory to Practice; Johns Hopkins University, November 2005
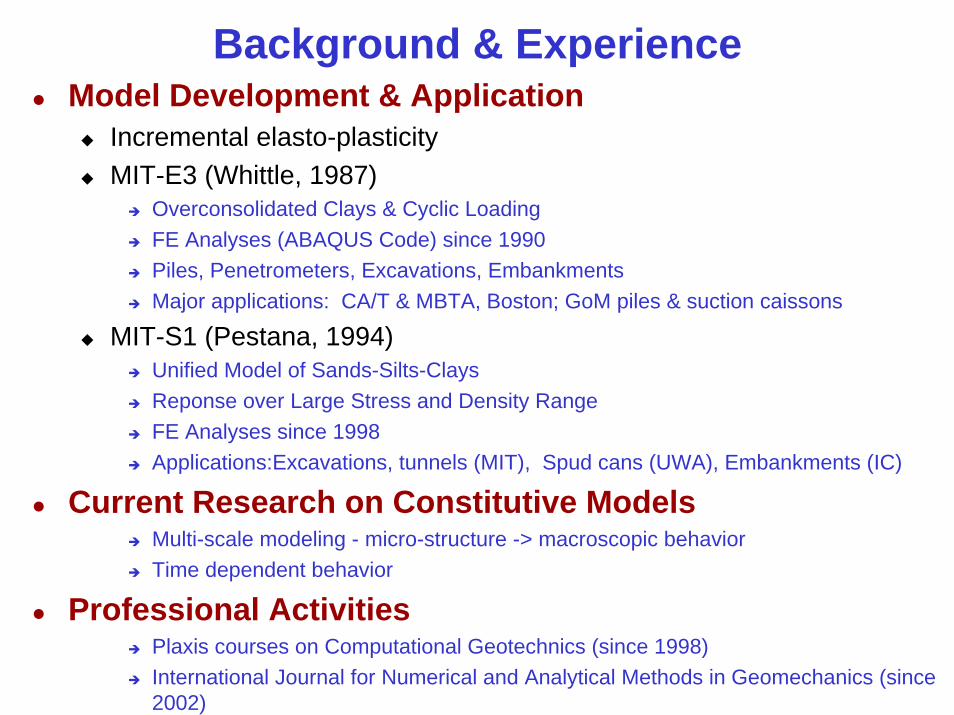
Background & ExperienceModel Development & Application
Incremental elasto-plasticityMIT-E3 (Whittle, 1987)
Overconsolidated Clays & Cyclic LoadingFE Analyses (ABAQUS Code) since 1990Piles, Penetrometers, Excavations, EmbankmentsMajor applications: CA/T & MBTA, Boston; GoM piles & suction caissons
MIT-S1 (Pestana, 1994)Unified Model of Sands-Silts-ClaysReponse over Large Stress and Density RangeFE Analyses since 1998 Applications:Excavations, tunnels (MIT), Spud cans (UWA), Embankments (IC)
Current Research on Constitutive ModelsMulti-scale modeling - micro-structure -> macroscopic behaviorTime dependent behavior
Professional ActivitiesPlaxis courses on Computational Geotechnics (since 1998)International Journal for Numerical and Analytical Methods in Geomechanics (since 2002)
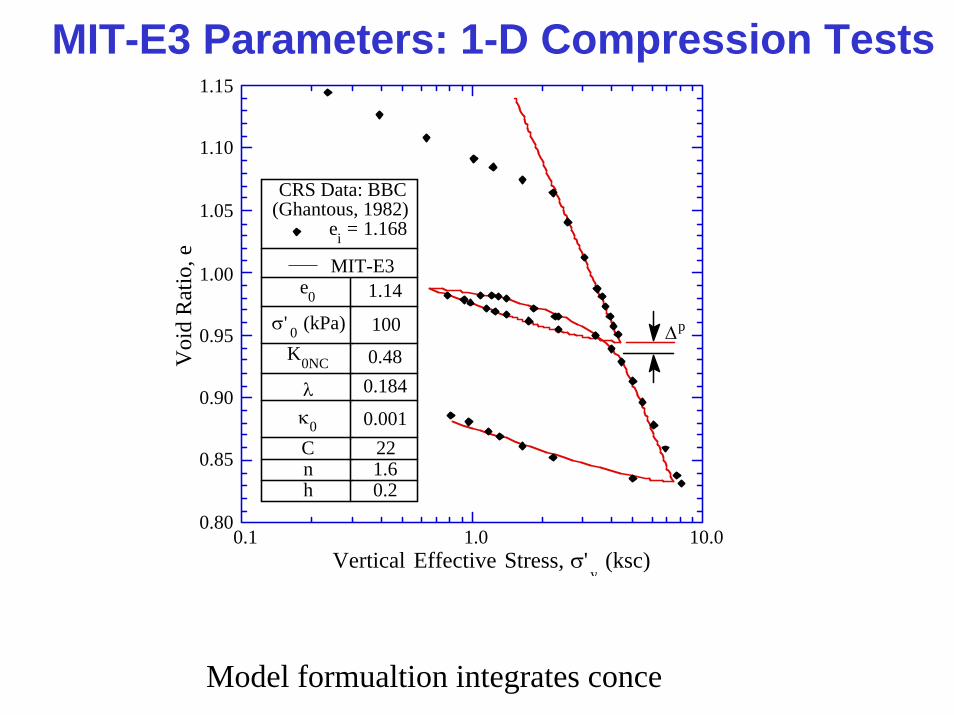
MIT-E3 Parameters: 1-D Compression Tests
0.80
0.85
0.90
0.95
1.00
1.05
1.10
1.15
Voi
d R
atio
, e
0.1 1.0 10.0Vertical Effective Stress, σ'
v (ksc)
∆p
CRS Data: BBC(Ghantous, 1982)
ei = 1.168____ MIT-E3
1.14e0
100σ' 0 (kPa)
0.48K0NC
0.184λ0.001κ0
22C1.6n0.2h
Model formualtion integrates conce

MIT-E3 ParametersUndrained Triaxial Shear Tests
3 K0-consolidated undrained shear tests (automated stress path triaxial equipment)Small strain nonlinearity (local strains measurements, bender elements etc.)Model calibrated in standard method (database of more than 20 clays)

Further Laboratory ValidationUndrained Strength Anisotropy
Conventional: Direct Simple Shear(DSS)Research: Directional Shear Cell (DSC); Torsional Shear Hollow Cylinder (TSHC)

Calibration of MIT-S1: Toyoura Sand(Pestana, 1994; Pestana et al., 2002)

Toyoura Sand - CSL & LCC Behavior(Pestana & Whittle, 1993; Pestana et al., 2002)

Parameter Selection: Berlin Sand(Nikolinakou, Whittle & Savvidis, 2003)
Measured Triaxial Data ; End of ShearingFarCloseProximity to Critical State:
DilatingDrainedContracting
∆us < 0Undrained
∆us > 0
0.40
0.45
0.50
0.55
0.60
0.65
0.70
100 1000 10000
Voi
d R
atio
, e
Mean Effective Stress, σ' (kPa)
p = 2.7, m = 0.42, φ'
mr = 12.5°
p = 2, m = 0.5, φ'
mr = 16°
p = 3, m = 0.3, φ'
mr = 12°
p = 3, m = 0.6, φ'
mr = 8°
p = 2.7, m = 0.4, φ'
mr = 14°
Critical state of sand - very difficult to measureCompomises needed in parameter selection
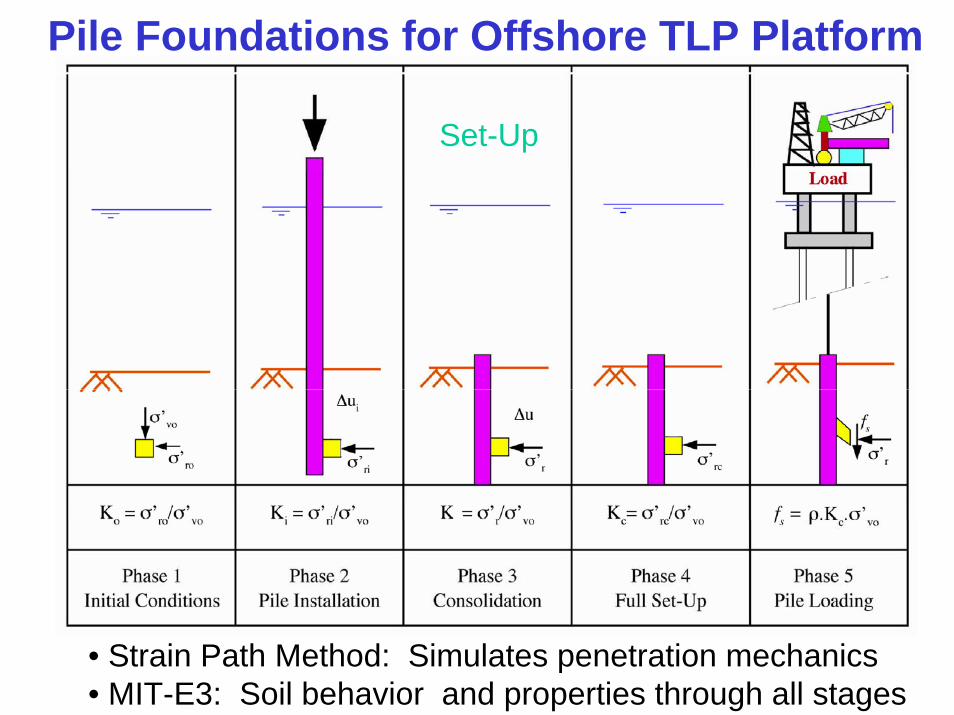
Pile Foundations for Offshore TLP Platform
• Strain Path Method: Simulates penetration mechanics• MIT-E3: Soil behavior and properties through all stages
Set-Up

Comparison with IC Instrumented Pile(Whittle & Sutabutr, 1999)

Design Charts for TLP Piles: Gulf of Mexico(Whitle, Sutabutr & Germaine, 1999)

Non-Linear Consolidation: Penetrometers(Whittle et al., 2001)
Installation modeled by Strain Path Method

Numerical Experiments - Deep Excavation(Hashash, 1992; Hashash & Whittle, 1992)
-20 0 20 40
ElasticDiaphragm Wall
Rigid BracingL = 10 - 60m0.9m Thick
dB = 30 - 100m
SupportSpacingh=2.5m
H
CL
Distance from Diaphragm Wall, x (m)
dB
0
10
20
30
40
50
60
0 50 100 150 200
Undrained Shear Strength, s u (kPa)
Dep
th, z
(m)
suPSPsuDSS
suPSA
Boston Blue ClayOCR = 1.0K0NC =0.53
γt = 18.0 kN/m 3

Effect of Soil Model: Wall Deflections(Hashash & Whittle, 1994, 1996)
0 50 100 150 200
0
10
20
30
40
Lateral Wall Deflection, δw (mm)
Depthz (m)
MCCElastic2.5
5 10 15 20 22.5
hu=
050100150200
0
10
20
30
40= H (m10
2.5
5
152022.5
MIT-E3

Effect of Soil Model: Settlements(Hashash & Whittle, 1994, 1996)
-80
-60
-40
-20
0
20
40
6004080120160
MCCElastic
Distance from Diaphragm Wall (m)
Settlementw0 (mm) 22.5
10
-100
-80
-60
-40
-20
0
20
400 40 80 120 160
Settlementw0 (mm)
Distance from Diaphragm Wall (m)
MIT-E322.5 = H (m)
10Su
rfac
e D
ispl
acem
ent (
mm
)

CA/T Project Boston (“Big Dig”)
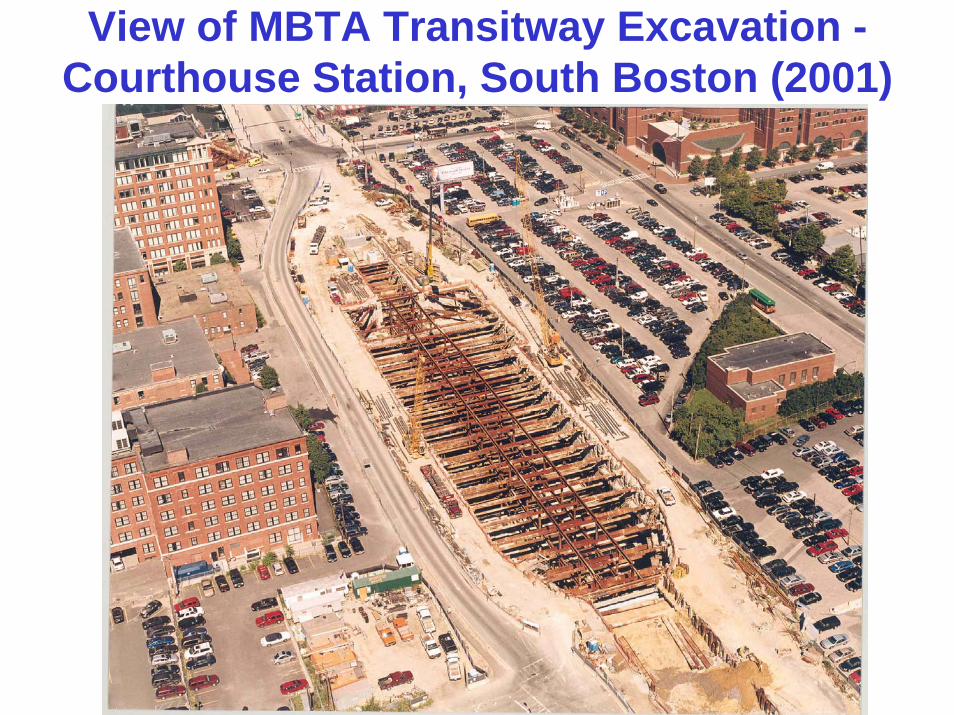
View of MBTA Transitway Excavation -Courthouse Station, South Boston (2001)

MBTA Transitway(lab data - Ladd et al., 1998; analyses - Jen, 1998)
• Very low margin of safety on basal stability
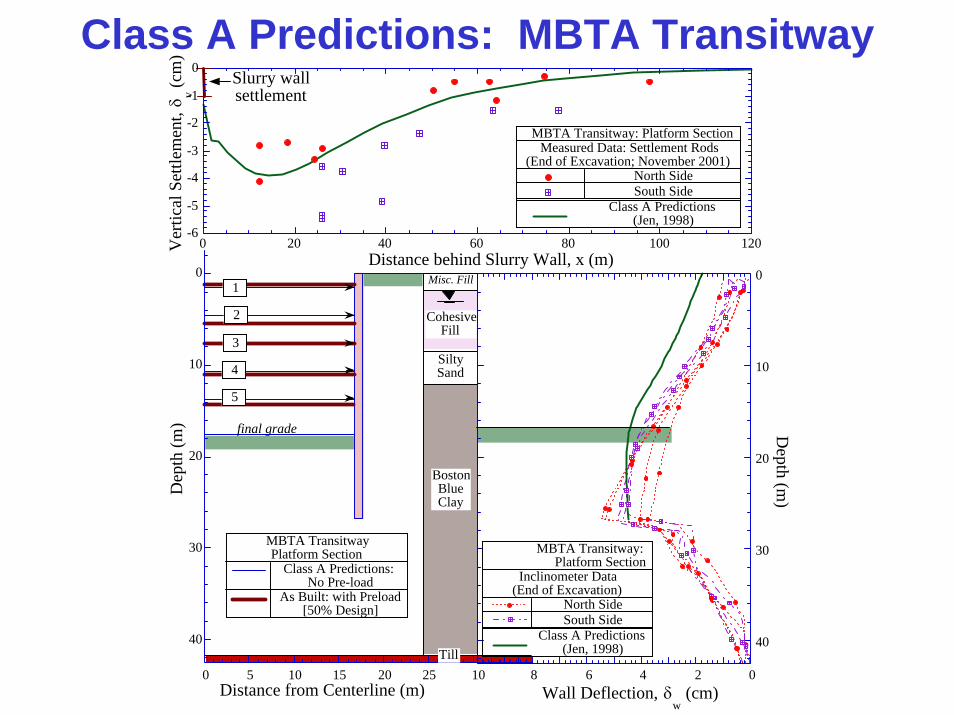
Class A Predictions: MBTA Transitway
0
10
20
30
40
0 5 10 15 20 25
Dep
th (m
)
Distance from Centerline (m)
BostonBlueClay
SiltySand
CohesiveFill
Misc. Fill
Till
1
2
3
4
5
final grade
MBTA TransitwayPlatform Section
Class A Predictions: No Pre-load
As Built: with Preload[50% Design]
0246810
0
10
20
30
40
Depth (m
)
Wall Deflection, δw
(cm)
MBTA Transitway: Platform Section
Inclinometer Data(End of Excavation)
North Side South Side
Class A Predictions (Jen, 1998)
-6
-5
-4
-3
-2
-1
0
0 20 40 60 80 100 120
Ver
tical
Set
tlem
ent,
δ v (cm
)
Distance behind Slurry Wall, x (m)
MBTA Transitway: Platform SectionMeasured Data: Settlement Rods
(End of Excavation; November 2001)North Side South Side
Class A Predictions (Jen, 1998)
Slurry wallsettlement

Analysis of VZB Project, Berlin
Lehrter Bahnhof siteUnderwater excavation - 1 row of tiebacksBase slab anchored with tension piles
MIT-S1 Model (Pestana, 1994)clays-sands-silts
Predictions for drained triaxial shear tests

Model Evaluation - VZB Project(Nikolinakou et al., 2004)
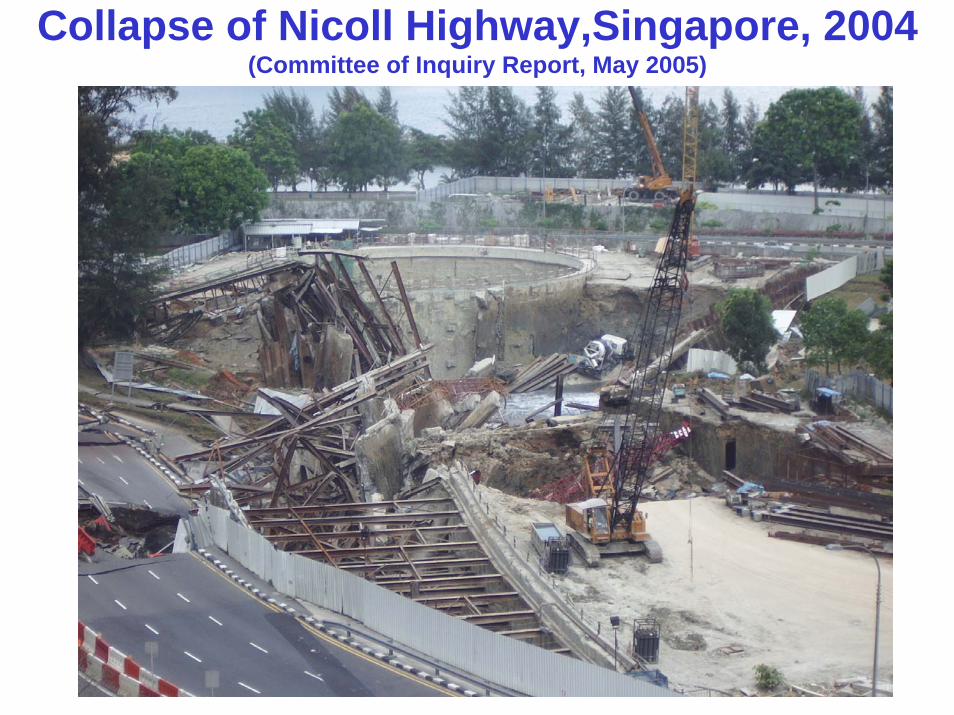
Collapse of Nicoll Highway,Singapore, 2004(Committee of Inquiry Report, May 2005)

FE Analysis of Nicoll Highway
Design of support system - based exclusively on FE analysesConstititutive model: Linearly Elastic-Perfectly Plastic (M-C)

Mohr Coulomb Model & Undrained Soil Behavior‘Method A’ (c’, φ’ - input parameters)- Used in Design
Effective StressPath, ESP
A’
B’
a’=
c’co
sφ’
su
tanα’ = sinφ’
σ1 − σ3( )2
σ' 1 +σ' 3( )2
, σ1 + σ 3( )
2
su
σ' v0
= c' cosφ'σ' v0
+ 12
1 + K0{ }sinφ'Outcome:
Doesn’t fit empirical knowledge (SHANSEP) or measured data

Undrained Shear Strength Profile in Marine Clay
0 20 40 60 80 10060
70
80
90
100
Undrained Shear Strength, su (kPa)
Red
uced
Lev
el, R
L (m
)
Section M3Piezocone Data
NKT
= 14Profile: ABH-32
TestLineAC-3AC-23007 3008
Best Estimate
0.21σ'v0
OriginalDesign Used in
FE Analyses
Upp
er M
arin
e C
lay
Low
er M
arin
e C
lay
F2
F2
OA
Consequence: Wall deflections underestimated (factor of 2)Diaphragm wall bending capacity underestimated (factor of 2)Under-design of bracing system

Mobilization of Jet Grout Pile Layers(Whittle, 2005)
Design & modeling of soil improvement techniques - big challenge

Stacked Drift Tunnel- Río Piedras, PR(Bernal & Whittle, 2003)
Very large cavern - in weathered Old Alluvium (Residual Soil; spatial variability)
Modeling of complex construction (massive FE models) (Hsieh, 2004)
Simulation of grouting activities (Kim, 2005)
Complex material behavior (Zhang, 2003; Nikolinakou, on-going)

Inter-aggregate pore
Cementation
Aggregates
Aggregation and cementation within and between clay
platelets
Intra-aggregate pore
Occasionally a silt/sand grain
50-100µmMacroscopic observation:
Dramatic change in permeability →
inter-aggregate pores get sealed off
Thin coating of goethite
Clay flakes
5-10µm
Tapped water of probably different chemistry than pore water
Conceptual Model of Microstructure(Zhang et al., 2004a, b; 2003)

1-D Compression & Consolidation
Initial stiff, elastic responseBreak down of soil structureVery large swelling following breakdown of micro-structure
Very large reduction in coefficient of consolidation Large reduction of the overall hydraulic conductivity Hydraulic conductivity further decreases during unloading

Some ConclusionsRole of Advanced Soil Models
Targeted high level applicationsValidation of Predictive Capabilities & Limitations
Laboratory tests[Physical models]Field Applications [Well instrumented]
Development of design methodsHigh level skills needed for use [R&D environment]
Research Challenge ContinuesComplexity of natural materials Modeling of construction activities & ground improvement methodsSpatial variability - stochastic FE methods More complex problems (liquefaction, localization etc.)
PracticeFE convenience & powerNeed for competence in basic principles of soil mechanicsHigh quality soil property data needed for model calibrationSOP - Mohr Coulomb (… Hardening Soil)

“what can be done with fewer assumptions is done in vain with more”
William of Occam (1285-1349)


Modeling of Undrained Shear Behavior: K0-Normally Consolidated BBC
Triaxial Direct Simple Shear
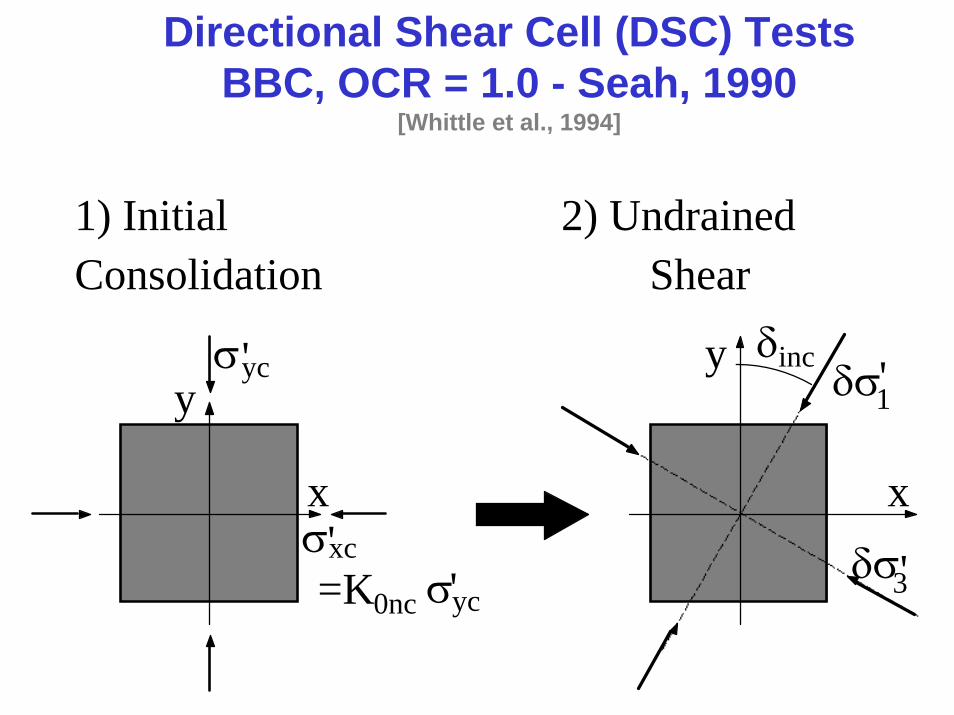
Directional Shear Cell (DSC) TestsBBC, OCR = 1.0 - Seah, 1990
[Whittle et al., 1994]
y
x
σyc'
σyc'=K0nc
σxc'
1) Initial Consolidation
y
x
δincδσ1'
δσ3'
2) Undrained Shear

MIT-E3 Predictions - DSC Tests

MCC Predictions DSC Tests

Comparison of Models: Secant Shear Stiffness - DSC Tests

MIT-E3: Conceptual Framework for ClaysTypical Behavior: A-B-CComponents of Model:1. NC Clay (VCL)
Anisotropic yield due to K0-historyPlastic strains dominate
2. Perfect Hysteresis (A-B-A)Small strain non-linearityPath independence
3. Bounding Surface PlasticityPlastic strains during reload (∆p)Relate to behavior of NC clay
VCL
Voi
d R
atio
, e
B A
log σ’
∆pA
Voi
d R
atio
, e B
C
log σ’

TLP Pile History

MIT Test Site at SAUGUS, MA
Basic Soil Properties and Stresses

Undrained Shear Behavior of Singapore Marine Clay(Data from Kiso-Jiban, Post-Failure Site Investigation)
-0.3
-0.2
-0.1
0.0
0.1
0.2
0.3
0.4
0.0 0.2 0.4 0.6 0.8 1.0
Shea
r Stre
ss, (
σ'v -
σ'h)/2
σ'vc
Effective Stress, (σ'v + σ'
h)/2σ'
vc
Singapore Marine ClayK
0-Consolidated Triaxial Shear Tests
SynbolDepth (m)Unit 12.1Upper (P8)
10.4Upper (P9)25.4Lower (P24)29.8Lower (P26)
φ' = 32.4° 27.0° = φ'
33.8° = φ'
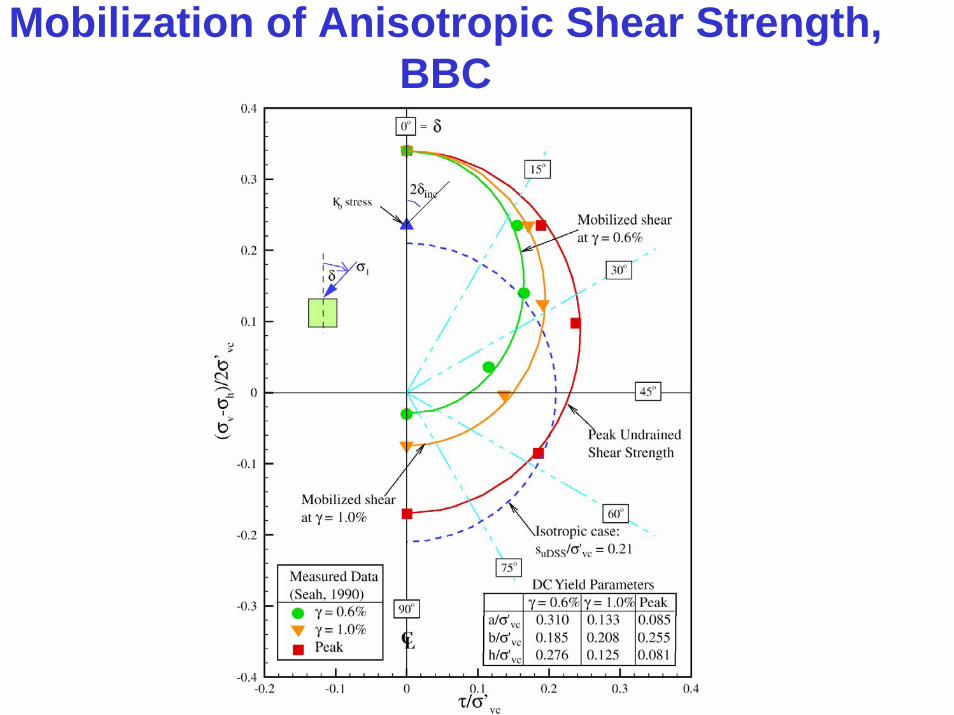
Mobilization of Anisotropic Shear Strength, BBC

EFFECT OF METHOD A vs. METHOD B

5-10µm
50-100µm
Scaling of Deformation PropertiesMicrostructure: Need elastic properties of composing mineralsLarge range of reported values
Upscaling to platelets (5-10µm):Homogenization methodsMatrix: iron oxidesInclusions: clay minerals and interstitial water
Upscaling to aggregates (50-100µm): Matrix: iron oxidesInclusions: clay platelets and intra-aggregate water
Macrostructure: cemented aggregatesElastic properties of granular cemented materials

Double Layer Swelling Mechanism: Thermodynamic Approach
Dormieux et al. (2001) Model:Microscopic scale: ion concentration, chemical potentialMacroscopic scale:Uniform equivalent solutionLink to macroscopic:inter-tactoid distance ↔ porosity
Free water in connected porosity
Interstitial water in isolated porosity with different chemical composition
Stress - strain
εσ &: + wwee mgmg && + 0≥Ψ
−dt
dThermodynamic couples:
Mass - chemical potential

1-D Model:Dual Porosity System(Nikolinakou, 2003)
σm
Coupling of solid matrix and porous system, K0
p1φ01
(φ1−φ01) +(φ2−φ02)
εCompressibility of skeleton, Ks
Coupling between porosities, H
p2φ02
φ2−φ02Coupling, M, initiated after destructuring
εp Breakdown of cementation
Inter/intra aggregate porosity: Bulk water
Intra-platelet porosity: structural water
Chemical link established after destruction of cementation