some kinetic and steady-state properties of sodium - rockefeller
TRANSCRIPT

Some Kinetic and Steady-State Properties of Sodium Channels after Removal of Inactivation
GERRY S. OXFORD
From the Department of Physiology, University of North Carolina, Chapel Hill, North Carolina 27514, and the Marine Biological Laboratory, Woods Hole, Massachusetts 02543
ABSTRACT To study the kinetic and steady-state properties of voltage-depen- dent sodium conductance activation, squid giant axons were perfused internally with either pronase or N-bromoacetamide and voltage clamped. Parameters of activation, ~'m and gNa(V), and deactivation, r were measured and compared with those obtained from control axons under the assumption that gNa or rnah of the Hodgkin-Huxley scheme. "rm(V) values obtained from the turn-on of INa agree well with control axons and previous determinations by others, q'Na(V) values derived from Na tail currents were also unchanged by pronase treatment and matched fairly well previously published values. "rm(V) obtained from 3 x ~'N,(V) were much larger than 1"re(V) obtained from INa turn-on at the same potentials, resulting in a discontinuous distribution. Steady-state In (gNa/gNm~ ~ - - gNa) VS. voltage was not linear and had a limiting logarithmic slope of 5.3 mV/e-fold gNa. Voltage step procedures that induce a second turn-on of IN, during various stages of the deactivation (Na tail current) process reveal quasiexponential activation at early stages that becomes increasingly sigmoid as deactivation progresses. For moderate depolarizations, primary and secondary activation kinetics are superimposable. These data suggest that, although m a can describe the shape of INs turn-on, it cannot quantitatively account for the kinetics ofgNa after repolarization. Kinetic schemes for gN, in which substantial deactivation occurs by a unique pathway between conducting and resting states are shown to be unlikely. It appears that the rate-limiting step in linear kinetic models of activation may be between a terminal conducting state and the adjacent nonconducting intermediate.
INTRODUCTION
T h e events responsible for the vo l tage-dependent open ing and closing of sod ium channels in the exci table m em b ran es o f nerve an d muscle cells have been classified into exper imenta l ly observable categories of ac t iva t ion and inac t iva t ion behavior . T h e na tu re of the relat ionship be tween act ivat ion and inac t iva t ion propert ies o f sodium channels has received m u ch a t tent ion, lately cen ter ing pr imar i ly on the quest ion of whe the r the two p h e n o m e n a represent i ndependen t mechanisms (e.g., Hodgk in and Hux ley [1952 b]) or are coupled
J. GEN. PHYSIOL. �9 Rockefeller University Press �9 0022-1295/81/01/0001/23 $1.00 1
Volume 77 January 1981 1-22
on January 10, 2019jgp.rupress.org Downloaded from http://doi.org/10.1085/jgp.77.1.1Published Online: 1 January, 1981 | Supp Info:

2 THE JOURNAL OF GENERAL PHYSIOLOGY. VOLUME 77 �9 1981
to each other in some manner (Goldman, 1976; Bezanilla and Armstrong, 1977; Gillespie and Meres, 1980).
The discovery of asymmetry currents (gating currents) related to the voltage-dependent gating of sodium channels allowed comparisons between the kinetic and steady-state properites of these gating currents and both the activation and inactivation properties of the sodium conductance (Armstrong and Bezanilla, 1977; Keynes and Rojas, 1974 and 1976; Schauf et al, 1977; Neumcke et al., 1976). The failure, on the one hand, to observe asymmetry currents exhibiting kinetics corresponding to the time-course of sodium inac- tivation, while, on the other, gating currents are "immobilized" by procedures that promote sodium conductance inactivation has led to the postulation of activation-inactivation coupling in which most of the apparent voltage de- pendence of inactivation is derived from the activation process (Armstrong and Bezanilla, 1977). Attempts to quantitatively correlate the voltage depen- dence and time dependence of gating current with the predictions of the Hodgkin-Huxley activation parameter, m, have met with moderate (Keynes and Rojas, 1976) or negligible (Neumcke et al., 1976; Bullock and Schauf, 1978) success.
Analyses of sodium conductance activation and associated intramembrane charge movements are complicated by the presence of the temporarily over- lapping inactivation process(es). Previous descriptions of sodium conductance activation have, therefore, necessarily relied upon assumptions concerning the relation between activation and inactivation. The selective destruction of sodium inactivation in squid axons internally perfused with either pronase (Armstrong et al., 1973) or N-bromoacetamide (Oxford et al., 1978) offers the opportunity to "study Na activation directly, without interference from inactivation" (Armstrong et al., 1973). Thus far the results of such an investigation have not appeared. Rather, the use of pronase has been limited to characterization of both natural (Bezanilla and Armstrong, 1977) and pharmacologically induced (Yeh and Narahashi, 1977; Cahalan, 1978) inac- tivation of open sodium channels.
The aim of the present study is to compare direct experimental measure- ments of the voltage dependence and time dependence of sodium conductance activation after removal of inactivation with activation behavior expected from the assumption of independent processes (Hodgkin and Huxley, 1952 b). Also, more detailed information on activation in the voltage region close to the action potential threshold will be provided, and experimental protocols will be introduced that perhaps provide more insight into the nature of the transitions between closed and open channel states than can be obtained from simple changes in conditioning and test-pulse magnitudes. A preliminary account of portions of this work has appeared (Oxford and Yeh, 1977).
M E T H O D S
Experiments were performed on single giant axons isolated from Lol,go pealei at the Marine Biological Laboratory, Woods Hole, Mass. Axons were cleaned of most adhering tissue, and the axoplasm was squeezed out with a tiny rubber roller and

(~. S. OXFORD Properties of Na Channels after Removal of Inactivation 3
replaced with an artificial internal solution introduced via a micrometer syringe. Axons were then mounted in a Plexiglas chamber, continuously perfused both internally and externally, and voltage clamped with conventional axial wire tech- niques as previously described (Wu and Narahashi, 1973; Oxford et al., 1978).
Certain technical problems arise, or are amplified, in experiments in which the membrane sodium conductance is allowed to remain high for relatively long periods. In this regard, several details of the apparatus and procedures are particularly relevant to the data presented in Results and are mentioned here briefly: (a) The diameter of the axial Pt-Ir wire that injects the voltage control current was increased to 100 or 125 /xm to reduce polarization. (b) The Pt-plated silver electrode assemblies for measuring membrane current and electrically guarding that measurement from nonradial current flow were positioned on two sides of the axon as close as possible to the membrane. At very small depolarizations from the holding potential (-80 mV), the small inward transient current was occasionally observed to follow an irregular, notched time-course when only a single guard electrode assembly was employed. Such patterns were never observed with double electrode assemblies. (c) The two ends of each axon located outside the electrically guarded region of the chamber were suspended in air. During experiments in which sodium inactivation was removed, the ends were moistened with tetrodotoxin solution (TTX, 1 #M) to prevent the genera- tion of prolonged action potentials in the unguarded, unclamped regions. In the absence of this precaution, electrical activity in the end regions results in substantial increases in holding current that can last for several tens of seconds. The increases were most often triggered by very small step depolarizations of the space-clamped region of membrane and were eliminated by TTX treatment. (d) All experiments described here were performed on axons bathed in artificial seawater containing one- third to one-fourth normal sodium concentration to reduce artifacts arising from residual series resistance (see below) and to further minimize the "end effects" mentioned above. (e) Voltage offsets arising from the various liquid junction potentials in the measuring system were eliminated for each axon by nulling the potential measured between the internal and external voltage electrode when the former was placed in a pool containing the particular internal perfusion solution, which was connected via a 3 M KC1 agar bridge to the external solution pool containing the latter electrode. The inverse of the corresponding junction potential between the internal and external solution was measured just before the axial electrode assembly was inserted in the axon and after withdrawal of the electrode at the end of the experiment. The "drift" in potential during the course of an experiment was never more than 4.3 mV, and typically less than 1 mV.
The response time of the voltage-clamp circuit was 2 #s (10-90% of a voltage step). Leakage and capacitative currents were reduced by an analogue transient bridge (see Armstrong and Bezanilla [1975]). Series resistance was determined by current-step methods and optimally compensated by positive feedback under voltage clamp. The compensation was usually enhanced by feeding the output of the transient bridge to the feedback potentiometer rather than the direct output of the current-to-voltage converter. This procedure greatly reduces the contribution of the early capacitative transient to the feedback, thus reducing ringing in the membrane voltage step and allowing higher feedback gain to achieve satisfactory compensation. A compromise resulting from this procedure is that series resistance compensation is less than adequate for the first 10-30 p.s of the voltage step; however, conductance changes are normally difficult to quantify at such early times, rendering such data questionable in any event.

4 T H E J O U R N A L O F G E N E R A L P t t Y S I O L O G Y �9 V O L U M E 77 �9 1 9 8 1
Experimental Solutions
Axons were externally perfused with a potassium-free, low-sodium artificial seawater containing ions in the following concentration (raM): Na +, 100-150; tetramethyl- ammonium (TMA+), 350-300; Ca ++, 50; CI-, 566; HEPES buffer, 5. External pH was adjusted to 8.0, and the osmolarity was ~ 1,010 mosM. At the beginning of each experiment axons were internally perfused with a standard internal solution (SIS) that consisted of (raM): Na +, 50; K +, 350; glutamate-, 320; F- , .50; phosphate buffer, 15. Sucrose was added to adjust the osmolarity to ~1,040 mosM, and the pH was adjusted to 7.3. During data collection, axons were internally perfused with a K-free internal solution in which 250-275 mM Cs replaced the potassium and the osmolarity was maintained by the addition of sucrose.
N-Bromoacetamide (NBA) was obtained from Sigma Chemical Co., St. Louis, Mo., and pronase from Calbiochem, San Diego, Calif. Temperature in all experiments was maintained at 6-10 4" 0.1 ~ by a Peltier device and electronic feedback circuitry.
Data Acquisition and Analysis
Membrane currents were photographed from oscilloscope traces using multiple ver- tical gains and time bases to optimize the graphical analysis of different kinetic components. In some experiments, currents resulting from voltage steps of equal amplitude and opposite polarity were averaged with an 8-bit signal averager kindly loaned by Dr. Howard Wang. In later experiments, currents were recorded with a 12- bit analogue-to-digital transient averager with dual sample rate capabilities similar to those of a design described elsewhere (Bezanilla and Armstrong, 1977). Currents could be sampled at a maximum rate of 10 #s/point. The averager was interfaced directly to a PDP 11/03 computer (Digital Equipment Corp., Maynard, Mass.) for data storage and analysis.
Activation kinetics were derived from sodium currents with intact inactivation behavior according to the assumptions of the Hodgkin-Huxley scheme for the sodium conductance. Details are presented in Results. After removal of inactivation with pronase or NBA, activation kinetics were derived by curve fitting procedures detailed in Results.
For convenience the following terminology is adopted here: "Activation" refers to the turn-on of sodium conductance as channels open after a step depolarization (more positive internal potential). "Inactivation" refers to the decay of sodium current (or conductance) as a step depolarization is maintained. "Deactivation" describes the decay of sodium current after a step repolarization (more negative internal potential), often referred to as a "Na tail." The time constants characteristic of activation, inactivation, and deactivation of the sodium conductance are r ~'h, and rNa, respectively. None of these terms is meant to imply any particular mechanism with which they may have been associated in previous literature. Their use here is simply to provide a familiar reference terminology.
R E S U L T S
Activation Kinetics of Na Channels with Intact Inactivation
T h e ex t rac t ion of sodium conduc tance ac t iva t ion kinetics f rom sodium current records exhib i t ing bo th act ivat ion and inact iva t ion behav io r is clearly model dependen t with regard to the inact iva t ion process. Models in which act ivat ion- inac t iva t ion coupl ing are proposed (e.g., Bezanil la and Arms t rong [1977]) as

G. S. OXFORD Properties of Na Channels after Removal of lnactivation 5
yet lack a quanti tat ive description of the voltage dependence of such coupling that is independent of knowledge about activation behavior alone. Thus, for convenience as well as for comparison with previous measurements, sodium activation is here assumed to obey kinetics of the type described by the Hodgkin-Huxley m parameter. The time-course of activation was determined from records of sodium current turn-on at various step depolarizations from a holding potential o f - 8 0 mV according to
IN,(t) ---- I~ -- e- t / " ' )a ' [ f + (1 --f)e-t / 'h], (1)
where a -- 3 a n d f i s the ratio of steady-state residual IN, (commonly observed in perfused squid axons) to I ~ (see also Eq. 3 of Cahalan and Almers, 1979). IN, and ~'n were determined by fitting an exponential to the late phase of inactivation of IN,(t) and extrapolating to the beginning of the voltage step
-20 rnV 072276b
E 0.5 c ~
b
+5 mV 072076 b
6 ires FIOURE 1. Comparison of experimental IN, kinetics with INa computed from m3h. Dotted lines represent tracings of sodium-current records at the indicated potentials taken at random for axons with inactivation present (top record) or after NBA treatment (bottom record). Solid lines are solutions to Eq. 1 with the following parameter values: (top record) f ffi 1, ~'m ffi 468 ~ , I~, = 0.75 mA/ cm2; (bottom record)f ffi 0.08, rm = 253 ~ , r h ffi 2.33 ms, I~a -- 1.28 mA/cm 2.
(t ---- 0). The activation time constant, ~'m, was then determined by one of two methods. (a) The exponential fit to the inactivation time-course was vertically scaled by one-half, replotted (semilogarithmic) along with IN,(t), and the time coordinate of their intersection was used to compute ~'m after the method of Hille (1967). (b) Alternatively, /N,(t) was divided b y f + (1 - f ) exp ( - t / r ^ ) to yield IN,'(t). ~'m was then determined from the slope of a straight line fit to a plot of In (1 - (IN,'(t)/I~,) 1/3) vs. time (Keynes and Rojas, 1976). Both methods yielded comparable values of ~'~ at the same membrane potential. The values extracted for I~, , ~'m, and ~'̂ as well as the choice of a -- 3 were routinely tested by computing IN,(t) from Eq. 1 and visually comparing the fit with the raw data (see Fig. 1).

(5 T H E J O U R N A L O F G E N E R A L P H Y S I O L O G Y �9 V O L U M E 77 �9 1 9 8 1
Deviations of the computed INa(t) from the raw data at the beginning of the voltage step probably represent the contr ibution of asymmetrical charge movement (gating current), which can easily be seen in a single sweep when the transient bridge is properly adjusted or in averaged records from voltage steps of equal ampl i tude but opposite polarity. Furthermore, the possibility that activation and inactivation are coupled can alter this early time-course and render the quality of fit meaningless. The presence of a small delay in the onset of activation was detected (e.g., Keynes and Rojas [1976]), but, at the present holding potential o f - 8 0 mV, the m a x i m u m delay was 70 ~ (test pulse, 40 mV; temperature, 6~ resulting in an error of only ~15% in I',,,. Prel iminary observations of the test-pulse dependence of this delay agree with the data of Keynes and Rojas (1976) and result in an approximately constant error in "rm as a function of voltage if the delay is neglected. The magni tude of this error is negligible with regard to the objectives of the present paper; however, further investigation of these delays will yield important clues concerning details of the activation kinetic scheme.
Values of cm determined as described above are shown for several different membrane potentials in Fig. 2 A. The data points (filled circles) are scaled to a tempera ture of 6.3~ by assuming a O~0 of 3.0. The dashed line represents ~',~ = 1~(am + tim) of the Hodgkin-Huxley model as derived from their original measurements. Fairly good agreement is obtained for potentials more positive than - 2 0 mV, whereas I",, values are slightly larger than expected for more negative potentials.
Na Activation Kinetics with Inactivation Removed
Internal perfusion with either pronase (0.2 mg/ml ) or NBA (0.2-1 mM) selectively removes the inactivation behavior of the sodium conductance (Armstrong et al., 1973; Oxford et al., 1978). The extent of removal was moni tored at two voltages during either t reatment and could be reasonably controlled by changing to normal internal solution or lowering the tempera- ture to slow the rate of reaction. Both treatments are usually quite difficult to carry to completion. The peak sodium conductance is almost always reduced in these cases and its sensitivity to these manipulat ions varies greatly among axons. Removal of >90% of the inactivation behavior while retaining suffi- ciently large currents (in reduced external sodium) was the objective for each axon. After removal of inactivation I~ was set equal to the steady-state level oflN~(t); t h u s , f = 1 and Eq. 1 reduce to
I~q~(t) = I~ - e-t/~m) a. (2)
This expression adequately fits the data points after determinat ion of "r~, as indicated above (Fig. 1, top). At very low depolarizations a somewhat greater lag in the activation of the conductance could be observed. This could correspond either to an increase in the value of a or to an addit ional delay, as ment ioned above. The small ampl i tude of current at these potentials precludes a choice between the two possibilities inasmuch as both gave approximately equal fits to the records. The values of ~'m chosen in the two cases were slightly

G. S. OXVORD Properties of Na Channels after Removal of Inactivation
A o Inactivation �9 �9 Intact
�9 0
0 �9
�9 W �9 | 600
0 �9 0 �9 �9
o,/" ......... *',; 400 ; I !
o 0
O ~ 8 . , . . 0 0"/ ~
- ~ o ' - ~ ' - 4 ~ ' - ~ o ' o ' 2'0 Membrane Potential (mV)
B Inactivation
Removed 0 0
~ o & �9 �9
0 ~149 Q,"" "'A �9
(7"
~ o ~ 8 ..... / .
o/../"
6 0 0
4 0 0 '-,,, �9
2 ' I i
' ' ~0 0 4o ' ~ -go -~o Merrbrane Potential (mY)
FIcuRE 2. Time constants for sodium activation and deactivation as a function of membrane potential. ~'m values (filled circles) and ~'Na values (open circles) are shown for axons before (A) and after (B) pronase treatment. Data points from NBA-treated axons are represented by triangles in B. All data points are scaled to 6.3~ assuming a 0.,10 of 3. Dashed lines computed from the Hodgkin- Huxley model as (am + tim)-" at 6.3~ Equations for the voltage dependence o fa , , and fir, were taken from Pahi (1971).
different, however, and so I report here those determined by assuming a -- 3 and a small addi t ional delay.
~',~ values obta ined from axons after removal o f inact ivat ion are shown in Fig. 2 B at several membrane potentials . Data points after either pronase

T H E J O U R N A L O F G E N E R A L P H Y S I O L O G Y �9 V O L U M E 77 �9 1981
t reatment (filled circles) or NBA treatment (filled triangles) agree well with the values from axons with intact inactivation behavior and with 1/(or,, + tim) of the Hodgkin-Huxley model. The close correspondence between "rm values before and after removal of inactivation indicates the relative insensi- tivity of such measurements to the relationship between activation and inactivation mechanisms embodied in contemporary models of the sodium conductance (see also Fig. 9).
Deactivation Kinetics before and after Inactivation Removal
Deactivation kinetics were obtained from sodium tail currents after repolari- zation from a depolarizing prepulse that activated the sodium conductance to various degrees. The prepulse and postpulse potentials, as well as the prepulse duration, were variable. Tile most common experiment involved depolarizing to the reversal potential (ENa) and repolarizing to various potentials at the peak of the sodium conductance. This value of prepulse minimized polariza- tion of the current electrode immediately before the tail current.
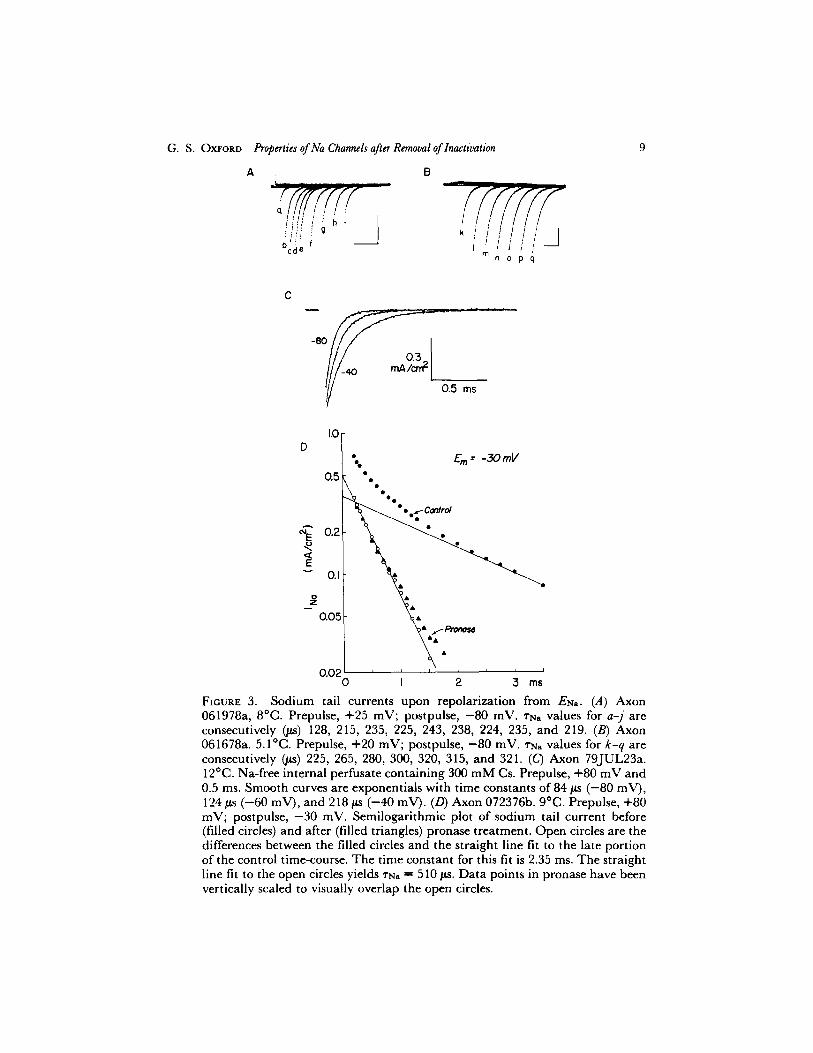
Deactivation proceeded as a single exponential at potentials more negative than ~ - 4 0 mV. Tail currents at - 8 0 mV that follow prepulses of various durations are shown in Fig. 3 A for a control axon and in Fig. 3 B for another axon after NBA treatment. These currents were well fit by single exponentials, and the corresponding time constants for each are given in the legend. Fig. 3 C shows tail currents at three different potentials obtained digitally and signal averaged (three sweeps each). Single exponentials fit to each record are superimposed on the currents. At more positive potentials, a second, slower component was observed. This component was removed after internal perfu- sion with pronase or NBA, suggesting that it represents inactivation kinetics (Fig. 3 D). At potentials at which a significant second slow exponential could be distinguished, the time constant ~'Na was determined by first fitting an exponential to the slow component and then peeling this fit away from the total current to reveal the faster exponential (Fig. 3 D).
In Fig. 2 the time constants for deactivation ('rNa) are plotted as a function of voltage from axons with intact inactivation (2 A, open circles), after pronase perfusion (2 B, open circles), and after NBA perfusion (2 B, open triangles). Again, the time constants determined in the presence of inactivation agree well with those obtained after removal of inactivation. The I"N~ values coincide well with the "rm values derived from sodium conductance turn-on to form nearly symmetrical bell-shaped distributions. This finding is very surprising, however, in view of the prediction of the Hodgkin-Huxley model that ~'r~ = 3"rN~! Multiplying the averaged "rN~ values from all experiments by three as dictated by the Hodgkin-Huxley formulation yields the values of I',~ derived from deactivation shown in Fig. 4 A. The result is a discontinuous ~',, vs. Em curve, with %,, values at negative potentials much larger than expected from the Hodgkin-Huxley model.
The observation of such markedly slower turn-off of gN~ curiously is not unique to the present data. In Fig. 4 B, the average "rNa and "rm values from Fig. 2 A are replotted along with a variety of "rN~ values taken from the
G. S. OXVORD Properties of Na Channels after Removal of Inactivation
A B .,? ,
hod ~ f
,(4J#5// n o p q
-80 0.3
~ 0.5 ms
D 1.0
�9 E m = -30mV
0.5 ~
~ ~ 1 7 6 1 7 6 1 7 6 _~-C~lfrol
} E
v 0.1
O.O5
\ - � 9
0.02 , , ~ k �9 . . . . 0 I 2 3 ms
FIouRE 3. Sodium tail currents upon repolarization from ENa. (A) Axon 061978a, 8~ Prepulse, +25 mV; postpulse, -80 raM. l"Na values for a- j are consecutively (#s) ]28, 215, 235, 225, 243, 238, 224, 235, and 2]9. (B) Axon 061678a. 5.I~ PrepuLse, +20 mV; postpulse, -80 mV. ~'N, values for k-q are consecutively (#s) 225, 265, 280, 300, 320, 315, and 32]. (C) Axon 79J'UL23a. 12~ Na-free internal perfusate containing 300 mM Cs. Prepulse, +80 mV and 0.5 ms. Smooth curves are exponentials with time constants of 84/Is (-80 mV), ]24/~s (-60 mV), and 218 ~ (-40 raM). (D) A~on 072376b. 9~ Prepulse, +80 mV; postpulse, -30 mV. Semilogarithmic plot of sodium tail current before (filled circles) and after (filled triangles) pronase t reatment . Open circles are the differences between the filled circles and the straight line fit to the late port ion of the control time-course. The t ime constant for this fit is 2.35 ms. T h e straight line fit to the open circles yields ~N. = 510 #s. Da ta points in pronase have been vertically scaled to visually overlap the open circles.

10 T H E J O U R N A L O F G E N E R A L P H Y S I O L O G Y �9 V O L U M E 77 �9 1 9 8 1
l i te ra ture and symbol ized as letters. Details o f the sources for these points are p rov ided in the legend. T h e average da ta repor ted in this pape r agree qui te well wi th the previously repor ted values. Curiously, even the average value of CN. from the original exper iments o f Hodgk in and Hux ley (1952 b) (assuming
6 0 6
-80 '
& &
@
@
A
@ A
@
A X &@
@
o
2
L
I| II
o
J
K
H F G L
l o
o o 400C~600
200
4.
- ~ ' -4o -2b 2'0 -8o -~'o -~ -2'o o
Membrane Potential Membrane Potential (mV)
FIGURE 4. Mean ~',, and ~'N. values as a function of membrane potential. (A) Mean values of ~',, from Fig. 2 A (filled circles) and B (filled triangles) and mean values of ~'N. from Fig. 2 A (open circles) and B (open triangles). Open symbols are scaled • 3 and replotted as half-filled symbols. • represents the average of SNa values at --20 mV from two pronase-treated axons. (B) Mean values of ~',~ and l"Na symbolized as in A. Letters repressent ~'N. values adjusted to 6.3~ (O~0 = 3) obtained from the literature as follows: (A) average value from Table 1 of Hodgkin and Huxley (1952 a), assuming a resting membrane potential o f - 5 8 mV; (B) ~'N. in 22 mM external Ca, assuming a resting potential o f - 5 8 mV from page 231 of Frankenhaeuser. and Hodgkin (1957); (C) ~'Na at --60 mV from Table III of Armstrong et al. (1973); (D) rNa at --80 mV from Fig. 10 B of Meves (1974); (E) average ~'N~ at --70 mV after 1-ms prepulses, from Table IV of Armstrong and Bezanilla (1977); (F) average ~'N~ at --70 mV from Table 1 of Bezanilla and Armstrong (1975 a); (G) present study, WN, at --60 mV for axon 79JUL23a; (H) ~'N. at --76 mV computed from (~.)-1 given on page 684 of Chandler and Meves (1970); ( J ) values from Table III of Yeh and Narahashi (1977); (K) ~'N, from Fig. 7 a of Armstrong and Gilly (1979); (L) rNa from Fig. 9 of Cahalan and Almers (1979). The solid line represents a
B V D V 1 least-squares fit of the equation z = (A exp + C exp )- , where V is the membrane potential and A = 0.0095/~s, B -- 0.080 mV -1, C = 0.0001/~s -1, and D = -0.080 mV -1.
a resting m e m b r a n e potent ia l o f - 5 8 mV) agrees well with the values repor ted here. T h e diversi ty of laboratories represented by these da ta and that bo th Loligo pealei and Loligo forbesi were used suggest tha t ne i ther systematic er ror nor species differences apprec iab ly co n t am in a t e the values. Fur the rmore , the

G, S, OXFORD Properties of Na Channels after Removal of Inactivation 11
precautions outlined in the Methods section minimized errors arising from series resistance properties in the present experiments. Accordingly, changing the magni tude of gN, as much as fourfold, by either changing the external sodium concentration or the value of the prepulse, did not significantly affect the measured 'rN, values at a given potential.
Attempts were made to extend "rN, measurements after pronase treatment to more positive voltages to compare with "r,,, which becomes increasingly smaller with depolarization. The expected small differences in steady-state activation (m) between prepulse and postpulse levels in this voltage range yielded only small, slow tail currents during transition to relatively large steady-state currents. Such small changes could be appreciably contaminated
~ ~ 3.8
, : ~176 0.6
//o ' :% O~
'& 02 l@
L .......
- 6 0 - 4 o - 2 o o 6o Membrane Potential
FmURE 5. Normalized steady-state sodium conductance ( g N d g ~ as a func- tion of membrane potential before (filled circles) and after pronase treatment (open circles). The solid line represents m a of the Hodgkin-Huxley model. The dotted line is a least-squares fit of a Bohzmann distribution to the data points below -10 mV with a midpoint potential of -23.4 mV and a slope of 7.38 mV/e-fold gNa. The dashed line results from a simulation of gN, via Scheme 3 using Hodgkin-Huxley rate constants, as done previously (Cahalan and Almers, 1979).
by any residual inactivation gating not removed by pronase or NBA, making estimates of ~'N. ambiguous in this range. Despite this uncertainty, it appeared as though ~'N~ values continued to increase (see • in Fig. 4 A) at more positive potentials, whereas "rm measured from g~, turn-on decreased. The large possible errors involved in such measurements will have to be further dealt with before this trend is established.
Steady-State Properties of Sodium Activation Steady-state sodium conductances were determined from values of I ~ ob- tained at various potentials as described above, g O was calculated by dividing ~ . by the driving force on sodium (Era - ENa) and normalized with respect to the maximum value for each axon. In Fig. 5, 0 , m - - gN./gN, is plotted as a function of Em for three axons before and after treatment with pronase. The steady-state voltage dependence is not significantly different in the two cases and corresponds closely to that observed after NBA treatment (Oxford et al.,

1 2 T H E J O U R N A L O F G E N E R A L P H Y S I O L O G Y �9 V O L U M E 77 �9 1 9 8 1
1978). At first glance, the Hodgkin-Huxley m a parameter appears to describe the data adequately (solid line). However, the scatter is such that it is not possible to discriminate between this fit and others, such as a least-squares fit of a Boltzmann distribution of two-state gating particles to the data below - 10 mV (dotted line) or a curve predicted from a sequential kinetic activation scheme terminated by an inactivation step (dashed line).
It has been pointed out that some sequential models can be discriminated from two-state constant dipole moment gating models by careful examination
I00
I
\
I0
0.1
O.OI " / ' 0
L i
-60
9 = ~
0
5.3 mV/e-fold gNo
0
0 �9 0
0
4o -2o o E m (mV)
FIGURE 6. gNa ( g ~ -- gN.) -1 VS. membrane potential. Data points from axons before (filled circles) and after (open circles) pronase treatment. Solid line is a least-squares fit to the data points for potentials more negative than -35 mY.
of the voltage dependence of activation in the region of negative membrane potential where channels just begin to activate (Almers, 1978). By replotting the data in Fig. 5 with additional data as gNa/(g~ --gNa) VS. Em (Fig. 6), the data points above ~ - 3 0 mV deviate from a least-squares line fit to the points for voltages more negative than - 3 5 mV. The straight line is expected from a gating model in which each channel exists in only one of two states, open or closed, with a constant dipole moment involved in the transition between states. The discrepancy between the data points and the line at more positive

G. S. OxfoRD Properties of Na Channels after Removal of Inactivation 13
potentials is consistent with the prediction of a linear sequential activation scheme as depicted below (Almers, 1978).
A ~ B ~ C - ~ D* (Scheme 1) kba keg kde
A is the initial resting state, B and C are nonconducting intermediates, and D* is the conducting state. The fit at lower potentials reveals a limiting logarithmic potential sensitivity of 5.3 mV/e-fold gN~ which corresponds to a lower limit of approximately five equivalent electronic charges required to open a single sodium channel at potentials near the resting membrane potential.
Are Activation and Deactivation Separate Mechanisms?
Comparisons between the kinetics of sodium tail currents and "OFF gating currents" upon repolarization have led to conflicting observations. The Hodg- kin-Huxley model suggests that OFF gating current (proportional to dm/dt) should decay with a time constant (roer) equal to I-,,, thus predicting a ratio of ~'og/~'tq~ of 3. In squid axons observed ratios have ranged between values only slightly greater than 1 (Bezanilla and Armstrong, 1975 a and 1975 b; Arm- strong and Gilly, 1979) and values close to 3.5 (Keynes and Rojas, 1976). The different ratios may be partially attributable to a dependence of 1"ofr on prepulse potential at a fixed pulse duration (Keynes and Rojas, 1976) and a dependence of the ratio on holding potential (Keynes and Rojas, 1976; Schauf et al., 1977). In any event, in the physiological voltage range (i.e., that encompassed by a normal action potential) the time-courses of gating-current and sodium-current deactivation in squid axons are quite similar, at variance with the Hodgkin-Huxley prediction.
To account for "roff/~'Na ratios close to l, Bezanilla and Armstrong (1975 a and 1975 b) initially proposed that sodium channels might activate by a linear sequence of transitions through several closed states to the open conformation, but that channel closure (deactivation) proceeded by a direct route between the open state and the initial resting state.
A ~ B ~ C ~ D *
t a d (Scheme 2)
If kad is made negligible at all membrane potentials while kda is larger than kdc at very negative voltages yet smaller than kcd at more positive potentials, the scheme could qualitatively account for both sodium activation and deactivation as well as for making "tort and TNa identical. Comparison of Schemes 1 and 2 reveals an important difference in their predictions of what happens during the activation process.
If gN~ turn-off occurs by a reverse sequence of transitions to the activation process (Scheme 1), then a brief period can exist during the deactivation of

1 4 T H E J O U R N A L O F G E N E R A L P H Y S I O L O G Y �9 V O L U M E 77 �9 1 9 8 1
gN~ when a closed in te rmedia te state (e.g., C) is the most popula ted . Dur ing this period, early in the t ime-course o f a sodium tail current , a re turn of the m e m b r a n e potent ia l to the original test-pulse level would result in a near ly exponent ia l increase in gNa inasmuch as most o f the channels have only to make the t ransi t ion C --~ D*. As the second depolar iz ing step is fur ther delayed, states A and B become increasingly popula ted , and the conduc tance activates with a more sigmoid t ime-course. I f deact iva t ion proceeds to its s teady state at the hold ing potent ial , ano the r step depolar iza t ion would result in a gN~ t ime-course identical to the original ac t iva t ion (Fig. 7 A).
A i
iX/
V \ rr
-I
-3
.~ MS/CM
i i
B I
: []
r~ - I v \ rr
m i ~. . i
t r
: ; ;
�9 ~ MS/CM
' , ,"..3)(),... '"-.,
-3
FIGURE 7. Discriminative model predictions for secondary sodium conduct- ance activation. Computer simulations of INa response to a voltage step to 0 mV from a holding potential o f - 8 0 mV followed by a transient repolarization to - 6 0 mV. The duration of the brief repolarization is progressively increased from 100 ps to 1.8 ms. (A) Prediction of Scheme 1, where kab = hoe = ked = am (Palti, 1971), and kba = /feb = k d c ~ - tim/3 (Pahi, 1971). (B) Prediction of Scheme 2 with rate constants the same as above except kad = 0.003 ms -1, kd~ = tim/3, and kdc = 0.003 ms -1
In the a l ternat ive proposal (Scheme 2) gNa deact iva t ion does not lead to a significant change in the popu la t ion of closed in te rmedia te states�9 Ra ther , the initial resting state (A) is filled direct ly from the conduc t ing state (D*). Thus , if a depolar iz ing pulse is reappl ied dur ing any stage of gNa turn-off, the ac t ivat ion kinetics will always be sigmoid inasmuch as most of the channels are d is t r ibuted between states A and D* and fur ther increases in the popula- tion of D* must occur via the two intermediates in the sequence (Fig. 7 B).

G. S. OXFORD Properties of Na Channels after Removal of Inactivation 15
I a t tempted experimental discrimination between these two schemes by applying twin depolarizations to perfused squid axons and varying the interval between steps. Typical results are shown in Fig. 8 A and B for two axons before pronase treatment. When the interval between pulses was very short (i.e., when only a small fraction of open channels had closed) the second activation of INa proceeded without significant delay. As the interval was progressively increased, the turn-on kinetics developed a sigmoid appearance similar to the prediction of Scheme 1. In all such determinations a secondary activation initiated early in the deactivation process proceeded approximately as a single exponential, regardless of test voltage. Comparable observations were made after pronase treatment.
An alternative protocol to demonstrate the same phenomenon involves a brief fixed-duration repolarization to different membrane potentials near the time of peak gNa. Since the rate of deactivation is highly voltage dependent,
A
-80
. . . . . . . . . . . . .
0.4 ms
B
O l - - - - 1 t - f - - f - - f . . . . ,_ . . . . . . - 8 0 J - ~ 0 ~ I , , ,
I ms
C
_80QI ~ -20 -60 -BO - 120
I ms
i
FIouRr 8. Secondary activation of sodium conductance in squid axons. So- dium current responses to the indicated voltage protocols for axons perfused externally with one-half normal Na concentration and internally with 250 mM Cs. A and B from axon 072577a; C is from axon 072577b. 5~
the second depolarization would occur during different stages of the turn-off process, depending on the speed of deactivation. For repolarizations to poten- tials increasingly more positive than the normal holding potential, more of the channels would be expected to populate state C of Scheme 1; thus, the subsequent gNa turn-on would be less and less sigmoid. This pattern is verified in Fig. 8 C.
D I S C U S S I O N
The goal of the present work is to provide kinetic and steady-state information about the activation of squid axon sodium channels from direct measurements of sodium currents that fail to inactivate and to compare this data with that previously obtained under the assumption that activation and inactivation are independent. Although the comparison yields some clear differences, they are, with only one exception, very small, suggesting that previous experimental

1(3 THE JOURNAL OF GENERAL PHYSIOLOGY �9 VOLUME 77 �9 1 9 8 1
determinations of activation parameters under pharmacological influence or some previous neural modeling attempts utilizing the Hodgkin-Huxley scheme for gN, have not been in significant error, resulting from uncertainty about the voltage dependence and time dependence of activation.
The voltage dependence ofgN, measured from steady-state sodium currents agrees well with that determined from extrapolation of current-time curves with normal inactivation in the same axons. The limiting logarithmic voltage sensitivity of 5.3 mV/e-fold gN, allows us to revise the lower limit on the number of equivalent charges that must be transferred across the membrane's electric field to open each sodium channel from six (Almers, 1978) to approx- imately five. It is interesting to note that Keynes and Rojas (1976) also found a shallower voltage dependence for gN, (6.5 mV/e-fold gN.) in Cs+-perfused axons from Loligo forbesi than had been originally observed by Hodgkin and Huxley (1952 b).
The voltage dependence of the rate of sodium activation after pronase or NBA treatment is reasonably close to that previously described for intact axons (Hodgkin and Huxley, 1952 b) and untreated Cs+-perfused axons (Keynes and Rojas, 1976). Within the measurement resolution an exponential raised to the third power and delayed by 70/~s or less is an adequate fit to the time-course of sodium conductance turn-on. This approximate fit should not be taken as evidence for a gating mechanism involving three homogenous two-state gating particles, a common interpretation of the Hodgkin-Huxley rn 3 parameter. The presence of the delay and its apparent voltage dependence suggests a more complicated scheme or a totally different approach and deserves further study. Furthermore, the sequential kinetic equivalent of rn a with forward rate constants in the ratio 3:2:1 is not a requirement, because a scheme with all forward rate constants set equal produces an approximate fit to sodium activation kinetics (Fig. 7; see also Bezanilla and Armstrong [1977]).
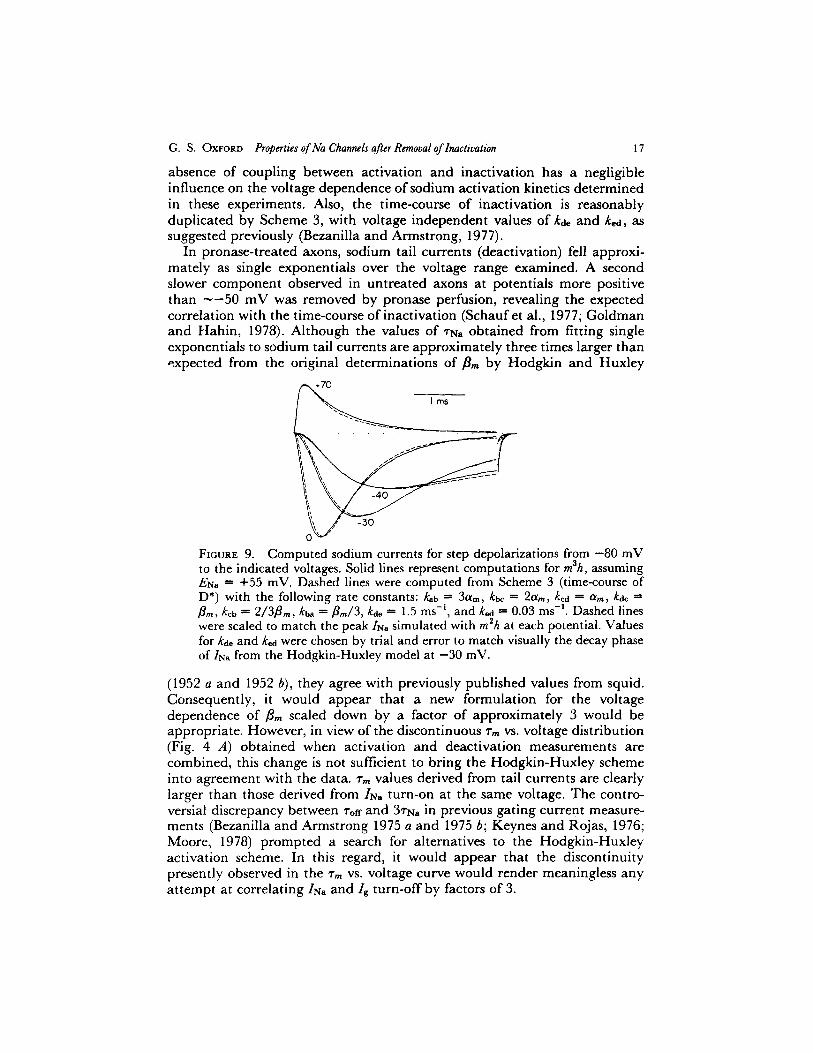
Kinetic schemes of gN, in which inactivation is directly coupled to the conducting state (e.g., Bezanilla and Armstrong [1977] and Goldman and Hahin, [ 1978]) predict delayed inactivation kinetics as opposed to the purely exponential time-course of the h parameter. It might be expected that this difference should yield different kinetics for early gN, activation in the presence of inactivation. Fig. 9 illustrates, however, that the predicted differences are actually quite small and also voltage dependent. The solid lines represent IN. computed from the Hodgkin-Huxley model, with gN, proportional to mSh. The dashed lines derive from a linear sequential scheme (equivalent to m a) with the addition of a terminal inactivated state (E).
A,~- B ~--- C ~ D* ~ E (Scheme 3) ked
gN, is proportional to D*, and the inactivation rate constants are made voltage independent and chosen to provide a good fit to the inactivation time-course of mah at - 3 0 inV. Activation according to Scheme 3 is only slightly delayed relative to m3h and only over a particular voltage range. Thus, the presence or
G. S. OXFORD Properties of Na Channels after Removal of Inactivation 17
absence of coupling between activation and inactivation has a negligible influence on the voltage dependence of sodium activation kinetics determined in these experiments. Also, the time-course of inactivation is reasonably duplicated by Scheme 3, with voltage independent values of kd, and k~, as suggested previously (Bezanilla and Armstrong, 1977).
In pronase-treated axons, sodium tail currents (deactivation) fell approxi- mately as single exponentials over the voltage range examined. A second slower component observed in untreated axons at potentials more positive than - - 5 0 mV was removed by pronase perfusion, revealing the expected correlation with the time-course of inactivation (Schaufet al., 1977; Goldman and Hahin, 1978). Although the values of "rNa obtained from fitting single exponentials to sodium tail currents are approximately three times larger than expected from the original determinations of iS= by Hodgkin and Huxley
I ms
FIGURE 9. Computed sodium currents for step depolarizations from -80 mV to the indicated voltages. Solid lines represent computations for mah, assuming EN. ---- +55 mV. Dashed lines were computed from Scheme 3 (time-course of D*) with the following rate constants: k,b ---- 3am, kbe -'~ 2Olin, kcd ffi am, kdc --~ ~ m , kcb ~ 2~3tim, kba ~ Bin~3, kd~ = 1.5 ms-', and k~d = 0.03 ms -1. Dashed lines were scaled to match the peak Its. simulated with m2h at each potential. Values for kde and k~d were chosen by trial and error to match visually the decay phase of/Na from the Hodgkin-Huxley model at -30 mV.
(1952 a and 1952 b), they agree with previously published values from squid. Consequently, it would appear that a new formulation for the voltage dependence of tim scaled down by a factor of approximately 3 would be appropriate. However, in view of the discontinuous ~'m vs. voltage distribution (Fig. 4 A) obtained when activation and deactivation measurements are combined, this change is not sufficient to bring the Hodgkin-Huxley scheme into agreement with the data. ~'m values derived from tail currents are clearly larger than those derived from IN. turn-on at the same voltage. The contro- versial discrepancy between %~ and 3~'N. in previous gating current measure- ments (Bezanilla and Armstrong 1975 a and 1975 b; Keynes and Rojas, 1976; Moore, 1978) prompted a search for alternatives to the Hodgkin-Huxley activation scheme. In this regard, it would appear that the discontinuity presently observed in the ~,~ vs. voltage curve would render meaningless any at tempt at correlating/N, and h turn-off by factors of 3.

18 THE JOURNAL OF GENERAL PHYSIOLOGY �9 VOLUME 77 �9 1981
One possible interpretation of this finding in terms of Scheme 1 is that the corresponding rate constants for activation (or deactivation) are probably not in a ratio of 3:2:1 (or 1:2:3) as derived from m 3. Sufficiently slow deactivation can be achieved by making the transition D* ~ C rate limiting for deacti- vation while retaining reasonable kinetics of activation at the same potentials. At more positive potentials, as the experimental rate of activation becomes faster and the apparent rate of deactivation is slower, such adjustments are insufficient to explain the data. In view of the uncertainty of Tl~a values at potentials more positive than - 3 0 mV, even after removal of inactivation, the validity and nature of this difference will have to await further experiments.
Recently sodium tail currents in voltage-clamped Myxicola axons have been reported to exhibit several exponential components (Schauf et al., 1977; Goldman and Hahin, 1978). These experiments were conducted on intact axons in which overlapping inactivation is expected to contribute to tail- current decay. Accordingly, Goldman and Hahin found a slow component of sodium tails with time constants approximating ~'h at relatively positive
2 0
-J~ 0.Tms ,,[ -70
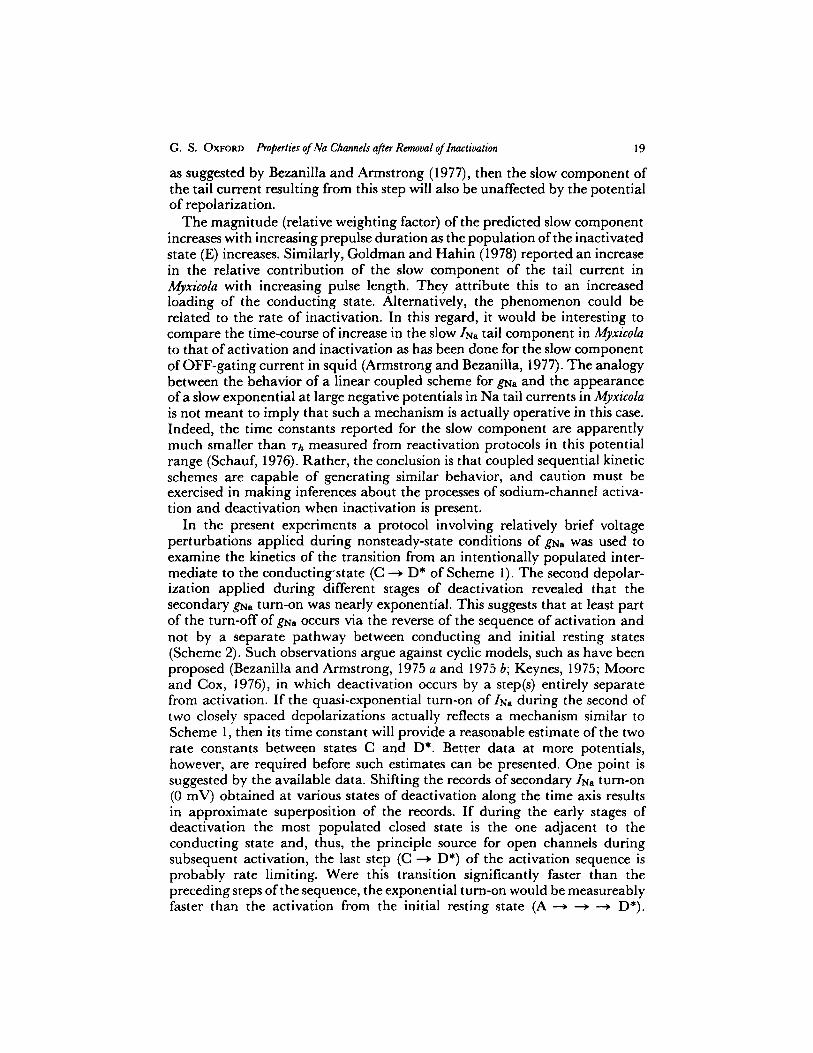
FIouRE 10. Simulation of a slow component in sodium tail current by a coupled linear kinetic scheme for gNa (Scheme 3). Rate constants were identical to those of Fig. 9 except kea, which was 0.03 ms -1 for curve I and 3 ms -1 for curve II
potentials. The slow component extended to more negative potentials, where it had little voltage dependence between -128 and - 3 8 mV. Schauf et al. (1977) report a second slow component only for potentials more negative than - - 5 0 mV, whereas at more positive potentials the current decays as a slow single exponential, a prediction just opposite to that of the Hodgkin-Huxley model. Again, the slow component is relatively independent of voltage. In a linear coupled scheme for gNa (Scheme 3) a second slow exponential is also expected in sodium tail currents at negative voltages. This component arises from the coupling between states D* and E rather than from a property of the activation sequence itself. The inactivated state (E) is loaded from the conducting state (D*) during a depolarizing voltage step. Upon repolarization to negative potentials the inactivated state will depopulate through the conducting state, resulting in a current with a time constant similar to inactivation at that potential. When the rate constant for the transition E D* is made large enough, tail currents similar to those reported by Schauf et al. (1977) can be simulated (Fig. 10). If the rate constants governing this transition are relatively voltage independent (at least at negative potentials),
G. S. OXFORD Properties of Na Channels after Removal of Inactivation 19
as suggested by Bezanilla and Armstrong (1977), then the slow component of the tail current resulting from this step will also be unaffected by the potential of repolarization.
The magnitude (relative weighting factor) of the predicted slow component increases with increasing prepulse duration as the population of the inactivated state (E) increases. Similarly, Goldman and Hahin (1978) reported an increase in the relative contribution of the slow component of the tail current in Myxicola with increasing pulse length. They attribute this to an increased loading of the conducting state. Alternatively, the phenomenon could be related to the rate of inactivation. In this regard, it would be interesting to compare the time-course of increase in the slow INa tail component in Myxicola to that of activation and inactivation as has been done for the slow component of OFF-gating current in squid (Armstrong and Bezanilla, 1977). The analogy between the behavior of a linear coupled scheme for gNa and the appearance of a slow exponential at large negative potentials in Na tail currents in Myxicola is not meant to imply that such a mechanism is actually operative in this case. Indeed, the time constants reported for the slow component are apparently much smaller than ~'̂ measured from reactivation protocols in this potential range (Schauf, 1976). Rather, the conclusion is that coupled sequential kinetic schemes are capable of generating similar behavior, and caution must be exercised in making inferences about the processes of sodium-channel activa- tion and deactivation when inactivation is present.
In the present experiments a protocol involving relatively brief voltage perturbations applied during nonsteady-state conditions of gN~ was used to examine the kinetics of the transition from an intentionally populated inter- mediate to the conducting'state (C ~ D* of Scheme 1). The second depolar- ization applied during different stages of deactivation revealed that the secondary gila turn-on was nearly exponential. This suggests that at least part of the turn-off of gNa occurs via the reverse of the sequence of activation and not by a separate pathway between conducting and initial resting states (Scheme 2). Such observations argue against cyclic models, such as have been proposed (Bezanilla and Armstrong, 1975 a and 1975 b; Keynes, 1975; Moore and Cox, 1976), in which deactivation occurs by a step(s) entirely separate from activation. If the quasi-exponential turn-on of INa during the second of two closely spaced depolarizations actually reflects a mechanism similar to Scheme 1, then its time constant will provide a reasonable estimate of the two rate constants between states C and D*. Better data at more potentials, however, are required before such estimates can be presented. One point is suggested by the available data. Shifting the records of secondary IN~ turn-on (0 mV) obtained at various states of deactivation along the time axis results in approximate superposition of the records. If during the early stages of deactivation the most populated closed state is the one adjacent to the conducting state and, thus, the principle source for open channels during subsequent activation, the last step (C --* D*) of the activation sequence is probably rate limiting. Were this transition significantly faster than the preceding steps of the sequence, the exponential turn-on would be measureably faster than the activation from the initial resting state (A --* ~ ~ D*).

20 T H E J O U R N A L OF G E N E R A L P H Y S I O L O G Y �9 V O L U M E 77 �9 1 9 8 1
Armstrong and Gilley (1979) have reached a similar conclusion from analysis of gating current records. It should be noted that the present observations were made over a limited voltage range and that the final step may not always be rate limiting. The use of similar protocols in examining g~a and gK will hopefully lead to better estimates for rate constants in kinetic schemes with several nonconducting states.
As noted above, several technical precautions were observed in the present experiments to minimize contributions to the kinetics of I~a by errors involving series resistance, spatial voltage inhomogeneity, and electrode polarization. Despite these attempts to ensure that experimental records reflect the true behavior of gnu, one further consideration precludes at this time a more quantitative analysis of the data in terms of the exact number of states in a linear kinetic scheme or rate constants governing their transitions. The ionic environment on both sides of the axon membrane has a profound influence upon the gating behavior of sodium channels. In addition to the well-known effects of external divalent cations upon the voltage sensitivity o f g ~ (see Hille et al. [1975]), the commonly used changes in the internal monovalent cation composition can modify the kinetics of sodium channel gating (Schauf and Bullock, 1978; Oxford and Yeh, 1979). In view of the differences in solution compositions presently used by investigators examining voltage-dependent gating, a clearer picture of the contributions of ion-channel interactions to the observed kinetic behavior of ionic conductances is required to distinguish aspects of model schemes that reflect ion properties from those that represent inherent properties of the channel gating machinery. Such work is now in progress, x
The author wishes to express his appreciation to Dr. J. Z. Yeh, who participated in early portions of this work, providing corroborative experimental data and stimulating, critical discussion. Thanks are also due to Drs. J. W. Moore and G. Baumann for critical reading of the manuscript, to David Smith and his associates in the Physiology Department Electronics Facility for providing the transient recorder and interface, to Cliff Burgess for construction of the experimental chamber, and to Sue Wilburn for secretarial assistance. This work was performed with the support of the National Science Foundation (BNS77-14702) and was aided in part by a grant from the Alfred E. Sloan Foundation to the Neurobiology Program (University of North Carolina).
Received for publication 7 April 1980.
R E F E R E N C E S
ALMERS, W. 1978. Gating currents and charge movements in excitable membranes. Rev. Physiol. Biochem. Pharmacol. 82:96-190.
ARMSTRONG, C. M., and F. BEZANXLLA. 1975. Currents associated with the ionic gating structures in nerve membrane. Ann. N. Y. Acad. Sci. 264:265-277.
ARMSTRONG, C. M., and F. BEZ^NILLA. 1977. Inactivation of the sodium channel. II. Gating current experiments.J. Gen. Physiol. 70:567-590.
1 Oxford, G. S., and J. Z. Yeh. Modulation of sodium channel gating kinetics by internal monovalent cations. In preparation.

G. S. OXFORD Properties of Na Channels after Removal of Inactivatwn 21
ARMSTRONC, C. M., F. BEZANILLA, and E. RojAs. 1973. Destruction of sodium conductance inactivation in squid axons perfused with Pronase.J. Gen. PhysioL 62:375-391.
ARMSTRONO, C. M., and W. F. G~LLY. 1979. Fast and slow steps in the activation of sodium channels. J. Gen. Physiol. 74:691-711.
BEZANILLA, F., and C. M. ARMSTRONG. 1975 a. Kinetic properties and inactivation of the currents of sodium channels in squid axons. Philos. Trans. R. Soc. Lord. B BioL Sci. 270:449- 458.
BEZANILLA, F., and C. M. ARMSTRONO. 1975 b. Properties of the sodium channel gating current. Cold Spring Harbor Symp. Quant. Biol. 40:297-304.
BEZANtLLA, F., and C. M. ARMSTRONO. 1977. Inactivation of the sodium channel. I. Sodium current experiments.J. Gen. Physiol. 70:549-566.
BULLOCK, J. O., and C. L. SCI4AUV. 1978. Combined voltage-clamp and dialysis of Myxicola axons: behavior of membrane asymmetry currents. J. Physiol. (Lond.). 278:309-324.
CAHALAN, M. D. 1978. Local anesthetic block of sodium channels in normal and pronase- treated squid giant axons. Biophys. J. 23:285-311.
CAHALAN, M. D., and W. ALMERS. 1979. Block of sodium conductance and gating current in conductance in axons perfused with sodium fluoride.J. Physiol. (Lord.). 211:679-705.
FRANKENHAEUSER, B., and A. L. HODCKtN. 1957. The action of calcium on the electrical properties of squid axons. J. Physiol. (Lord.). 137:218-244.
GILLESPIE, J. I., and H. MEVES. 1980. The time course of sodium inactivation in squid giant axons. J. Physiol. (Lord.). 299:289-307.
GOLDMAN, L. 1976. Kinetics of channel gating in excitable membranes. Q. Rev. Biophys. 9:491- 526.
GOLDMAN, L., and R. HAHIN. 1978. Initial conditions and the kinetics of the sodium conductance in Myxicola giant axons. II. Relaxation experiments.J. Gen. Physiol. 72:879-898.
HILLE, B. 1967. A pharmacological analysis of the ionic channels of nerve. Ph.D. Thesis. The Rockefeller University, New York.
HODCKIN, A. L., and A. F. HUXLEY. 1952 a. The components of membrane conductance in the giant axon of Loligo. J. Physiol. (Lord.). 116:473-496.
HODGKIN, A. L., and A. F. HUXLEY. 1952 b. A quantitative description of merhbrane current and its applications to conduction and excitation in nerve. J. Physiol. (Lord.). 117:500-544.
KEYNES, R. D. 1975. Organization of the ionic channels in nerve membranes. In the Nervous System, V01. 1, The Basic Neurosciences. D. B. Tower, editor. Raven Press, New York. 165- 175.
KEYNES, R. D., and E. ROJAS. 1974. Kinetics and steady-state properties of the charged system controlling sodium conductance in the squid giant axon.J. Physiol. (Lord.). 239:393-434.
KEYNES, R. D., and E. ROJAS. 1976. The temporal and steady-state relationships between activation of the sodium conductance and movement of the gating particles in the squid giant axon. J. Physiol. (Lord.). 255:157-189.
MEVES, H. 1974. The effect of holding potential on the asymmetry currents in squid giant axons. J. Physiol. (Lond.). 243:847-867.
MOORE, J. W. 1978. On sodium conductance gates in nerve membranes. In Physiology and Pathology of Axons. S. G. Waxman, editor. Raven Press, New York. 145-153.
MOORE, J. W., and E. B. Cox. 1976. A kinetic model for the sodium conductance system in squid axon. Biophys. J. 16:171-192.
NEUMCKE, B., W. NONNER, and R. STAMPFLI. 1976. Asymmetrical displacement current and its relation with activation of sodium current in the membrane of frog myelinated nerve. Pfluegers Arch. Eur. J. Physiol. 363:193-203.

2 2 THE JOURNAL OF GENERAL PHYSIOLOGY �9 VOLUME 77 �9 1981
OXFORD, G . S.~ C. H. W g ~ and T. NARAHASHI. 1978. Removal of sodium channel inactivation in squid giant axons by N-bromoacetamide.J. Gen. Physiol. 71:227-247.
OXFORD~ G. S.~ and J. Z. YEH. 1977. Observations on sodium channel activation gating in squid axons internally perfused with Pronase or N-bromoacetamide. Biophys. J. 17:207 a (Abstr.).
OXVORD, G. S., and J. Z. YEH. 1979. Interference with sodium inactivation gating in squid axons by internal monovalent cations. Biophys. J. 25:(2, Pt. 2): 195 a. (Abstr.).
PALTI, Y. 1971. Digital computer solutions of membrane currents in the voltage clamped giant axon. In Biophysics and Physiology of Excitable Membranes. W. J. Adelman, editor. Van Nostrand Reinhold Co., New York. 183-193.
SCHAUV, C. L. 1976. Comparison of two-pulse sodium inactivation with reactivation in Myxicola giant axons. Biophys. J. 16:245-248.
ScnAuv, C. L., and J. O. BULLOCK. 1978. Internal cesium alters sodium inactivation in Myxicola. Biophys. J. 23:473-477.
ScnAuV, C. L., J. O. BULLOCK, and T. L. PENCEK. 1977. Characteristics of sodium tail currents in Myxicola axons. Comparison with membrane asymmetry currents. Biophys..]7. 19:7-28.
YEn, J. Z., and T. NARAHASL 1977. Kinetic analysis of pancuronium interaction with sodium channels in squid axon membranes.J. Gen. Physiol. 69:293-323.
Wu, C. H., and T. NARAHASHI. 1973. Mechanism of action of propranolol on squid axon membranes.J. Pharmacol. Exp. Ther. 184:155-162.