some macro-data on the regionalisation/globalisation ... · some macro-data on the...
TRANSCRIPT
Some Macro-Data on the Regionalisation/Globalisation Debate: A Comment on theRugman/Verbeke AnalysisAuthor(s): John H. Dunning, Masataka Fujita and Nevena YakovaSource: Journal of International Business Studies, Vol. 38, No. 1 (Jan., 2007), pp. 177-199Published by: Palgrave Macmillan JournalsStable URL: http://www.jstor.org/stable/4540409 .
Accessed: 15/12/2014 23:45
Your use of the JSTOR archive indicates your acceptance of the Terms & Conditions of Use, available at .http://www.jstor.org/page/info/about/policies/terms.jsp
.JSTOR is a not-for-profit service that helps scholars, researchers, and students discover, use, and build upon a wide range ofcontent in a trusted digital archive. We use information technology and tools to increase productivity and facilitate new formsof scholarship. For more information about JSTOR, please contact [email protected].
.
Palgrave Macmillan Journals is collaborating with JSTOR to digitize, preserve and extend access to Journal ofInternational Business Studies.
http://www.jstor.org
This content downloaded from 202.114.65.236 on Mon, 15 Dec 2014 23:45:43 PMAll use subject to JSTOR Terms and Conditions
This content downloaded from 202.114.65.236 on Mon, 15 Dec 2014 23:45:43 PMAll use subject to JSTOR Terms and Conditions

* Some macro-data on the regionalisation/globalisation debate John H Dunning et al 178
data; and part on the observation (the source of which they do not give; Rugman and Verbeke, 2004: 3) that the largest 500 MNEs account for 90% of the world's FDI stock.4
While appreciating much of the analysis and conclusions contained in the Rugman and Verbeke paper, we think it useful to see how far, and in what ways, the macro-data on FDI stocks and flows support or contradict the key contention of the authors that the great majority of the international sales by MNEs is either home region or bi-regional oriented. However, in doing so, one immediately runs into a definitional problem. In their article, Rugman and Verbeke allocate sales originating from the home region of the firms analysed (whether these are intended to serve domestic or foreign markets) to the home region. Inevitably, in the case of companies originating from large and richer countries such as the United States (US) and Japan, this noticeably lowers their (relative) pro- pensity for globalisation.5 Yet most macro-data are concerned with the geographical distribution of that part of the investment, sales, or employment of firms undertaken or originating outside their national boundaries. Indeed, because of statistical limitations, in only a few cases (notably the US) is it possible to directly compare equivalent ratios for countries with those identified by Rugman and Verbeke for firms.
In this contribution, we shall divide our analysis into two parts. First, we shall examine the data we have on (what we shall term) the outward and inward transnationality of countries. As we shall see, such data, although useful for comparing the transnation- ality of different countries, and of the same countries over time, are not as appropriate as their firm-level counterpart.6 The second part of our analysis exam- ines the regional distribution of both outward and inward FDI stock in a way similar (but not identical) to that undertaken by Rugman and Verbeke.
Basically, the thrust of this paper is twofold. First, it is to establish the extent to which (the totality of) firms from the leading inward and outward direct investing countries replicate the pattern set out by Rugman and Verbeke. Second, by comparing the relevant data for 1990 and 2003 (or nearest year for which data are available), it examines the extent to which, over the intervening period, the foreign operations (i.e., excluding the domestic operations) of MNEs have become more or less globalised.
In undertaking this exercise, we shall produce three sets of indices, each of which is country based. The first is a transnationality index (TNI),
which is designed to assess the degree to which a particular country engages in outward, or inward, FDI. This index is defined in the following section. The second consists of two variants of a globalisation index (GI), which attempts to assess the extent to which the geographical spread of inward and outward FDI is concentrated or dispersed - the assumption being that the greater the dispersion, the more a country's international direct invest- ment is globalised.
The third index is a revealed investment compara- tive advantage (RICA) or investment intensity index. This is intended to measure the extent to which, relative to its share of the world direct investment stock, a country's outward investment in a number of culturally different geographical regions is above or below that average. This last index widens the classification of regions adopted by Rugman and Verbeke to incorporate various elements of psychic or institutional distance, as identified by such writers as Ronen and Shenkar (1985), Shenkar (2001), Thrift (2000) and Xu and Shenkar (2002).
Data and methodology
Data The data we use for this particular exercise are as follows:
1. Outward and inward FDI stocks for the years 1990 and 2003, as provided by the United Nations Conference on Trade and Development (UNCTAD).7
2. Outward and inward FDI flows as a percentage of gross fixed capital formation (GFCF), for two periods, viz. 1990-1996 and 1997-2003, as provided by UNCTAD, and published in the World Investment Report (2004, 2005).
3. Gross domestic product (GDP) data for the period 1990 to 2002/2003, as compiled by UNCTAD, drawing upon the data from the IMF, World Bank and OECD, and from national sources (e.g., Taiwan).
4. The above data are used to assess the ratios calculated and presented in Appendix A for some 25 countries" that, between them, accounted for 80% of the inward and 89% of the world's outward FDI stock in 2003 (UNCTAD, 2004). In the case of the TNIs and GIs, four geographical regions, which are the home or host to the value- added activities of MNEs, to and from the 25 countries, are identified. These are: (a) the Americas (that embracing North, South and Central America); (b) Europe (including Central
journal of International Business Studies
This content downloaded from 202.114.65.236 on Mon, 15 Dec 2014 23:45:43 PMAll use subject to JSTOR Terms and Conditions

Some macro-data on the regionalisation/globalisation debate John H Dunning et al 179
and Eastern Europe); (c) Asia; and (d) Other. In the case of RICA variables, we have used a modified version of the cultural-related country clusters identified by Ronen and Shenkar (1985) and Shenkar (2001), which, as Oesterle and Fisch (2000) have observed, depict the 'soft' side of globalisation. By classifying the geographical distribution of FDI in this way, we take account of cultural and institutional diversity as a loca- tional determining variable (Sullivan, 1994; letto-Gillies, 1998). Further details are set out in the Appendix. We consider six such clusters: an Anglo cluster, a Germanic/Nordic cluster, a Latin American cluster, a Latin European cluster, a Far Eastern cluster, and an 'Other' or 'Mixed' cluster, which includes all other countries.
Statistical methodology The methodology we used for evaluating the extent, pattern, and changes in the TNI, GI, and RICA indices is very simple and straightforward, and is described in more detail in the sections that follow. Here, we would simply observe that the main differences between our approach and that of Rugman and Verbeke are: first, we normalise the geographical distribution of MNE activity by size of country (as proxied by GDP); second, we have computed RICA or investment intensity indices;9 and third, we have added a cultural diversity component to our classification of home and host regions in order to estimate both the RICAs and the path followed by our 25 countries between 1990 and 2002, towards regionalisation or globalisation.
The international (transnational) direct investment position of countries It is an unfortunate fact that macro-data do not allow us to directly relate the proportion of the global sales or value-added of firms from particular home countries that is undertaken outside their
national boundaries.10 Estimates by UNCTAD (2005: 17) set out in Table 1 suggest that, in 2003, some 54% of the global sales, 50% of the global assets and 50% of the global employment of the worlds leading 100 TNCs - ranked by foreign assets - were accounted for by their foreign affiliates.11 Table 1 also shows that these ratios increased quite markedly between 1990 and 2003, although more so for some countries than others. These figures, however, are very skewed. Other data reveal that the majority of MNEs do not record such high ratios of transnationality. According to UNCTAD (2005: 15), in 2003 the 100 largest MNEs accounted for only 18% of foreign sales, 12% of foreign assets,12 and 14% of the foreign employment of all MNEs.13
The most comprehensive data on the relative significance of the transnationality of countries are provided by relating the stock of their inward and outward FDI to GDP, and the ratio between their inward and outward investment flows and their gross fixed capital formation.14 Table 2 sets out these ratios for 1990 and 2002 in the case of the former, and an average of the ratios for the years 1990-1996 and 1997-2003 in the case of the latter. 15
Columns 3 and 4 of Table 2 suggest that in 2003, on average, outward FDI stocks accounted for 23.0% of world GDP and inward FDI stocks for 22.9% of world GDP. Both figures represent a large increase over their 1990 counterparts of 8.6 and 9.3%, respectively (see columns 1 and 2). This shows a sharp upward movement in the degree of the TNI (the extent to which the 25 countries engage in, or are engaged by, MNE activity) over the intervening years.
The trends shown in the above data are broadly confirmed by our second set of data set out in columns 5-8 of Table 2. These show that, on average, the ratio of the outward FDI flows of a country to its gross domestic fixed capital
Table 1 Degrees of transnationality of the 100 largest non-financial MNEs,a1l990 and 2003
Variable 1990 (%) 2003 (%) % change 2003 cf. 1990
Assets 37.8 49.8 31.7 Sales 48.4 54.1 11.8
Employment 43.0 49.5 15.1 TNI 43.1 51.1 18.6
Source: UNCTAD (1993: 28, 1994: 9, 2005: 17). Note: Figures for assets, sales and employment in columns 1 and 2 represent the share of foreign in global operations. TNI is the transnationality index. See the text for the definition. aLargest defined in terms of foreign assets.
Journal of International Business Studies
This content downloaded from 202.114.65.236 on Mon, 15 Dec 2014 23:45:43 PMAll use subject to JSTOR Terms and Conditions

* Some macro-data on the regionalisation/globalisation debate John H Dunning et al 180
Table 2 Outward and inward FDI stock as a percentage of gross domestic product, and outward and inward FDI flows as a percentage of
gross fixed capital formation, 1990-2003
Country Stock as a % of GDP Flows as a % of GFCF
1990 2003 Average 1990-1996 Average 1997-2003
Outward Inward Outward Inward Outward Inward Outward Inward
Europe France 9.1 7.1 36.7 24.7 9.5 6.6 30.0 14.9
Germany 8.8 7.1 25.8 22.6 5.9 1.0 11.7 12.3 Ireland 24.0 71.5 22.5 129.7 4.4 14.0 14.9 69.2
Italy 5.2 5.3 16.2 11.8 3.1 1.7 5.6 4.5 Netherlands 36.3 23.3 75.0 65.6 25.7 14.0 52.8 42.2 Poland 0.2 0.2 0.9 24.9 0.1 10.1 0.4 15.8
Spain 3.0 12.8 24.7 27.4 3.2 8.7 20.2 15.0 Sweden 21.3 5.3 62.7 47.5 17.0 14.0 46.0 48.7 Switzerland 28.9 15.0 111.2 49.7 16.3 4.2 42.7 20.7 UK 23.2 20.6 62.7 37.4 14.9 10.2 43.9 23.4
America Brazil 8.8 8.0 11.0 25.8 0.5 3.1 1.0 19.7 Canada 14.7 19.6 35.5 31.8 7.1 6.1 21.4 19.1 Mexico 0.4 8.5 2.2 26.5 0.4 11.6 1.5 14.2 US 7.5 6.9 18.8 14.1 6.4 4.9 7.6 8.8
Asia China 0.7 5.8 2.6 35.6 1.2 12.2 0.7 11.9
Hong Kong 15.9 269.6 211.9 236.5 44.3 16.8 49.2 51.4 Indonesia 0.1 34.0 1.3 27.5 2.0 5.9 0.3 -2.2
japan 6.6 0.3 7.8 2.1 2.0 0.1 2.6 0.6 Korea 0.9 2.1 5.7 7.8 1.6 0.7 2.5 3.4
Malaysia 6.1 23.4 28.8 57.2 5.3 18.4 6.2 13.5
Singapore 21.3 83.1 99.5 161.3 15.0 30.8 27.9 44.4 Taiwan 8.0 6.1 22.8 11.9 5.8 2.5 8.6 3.9
Other Australia 9.8 23.7 23.0 34.3 4.4 8.8 6.9 8.5 New Zealand 14.7 18.2 11.3 49.1 3.8 23.2 2.9 16.1 South Africa 13.4 8.2 14.8 18.5 4.8 1.8 2.2 10.5
World 8.6 9.3 23.0 22.9 5.0 4.5 11.5 12.2
Source: Compiled by the authors based on data supplied by UNCTAD.
formation (GFCF) rose from 5.0% in the1990-1996 period to 11.5% in the 1997-2003 period. The corresponding ratios for inward FDI were 4.5 and 12.2%. Finally, we might mention a composite outward and inward TNI compiled by UNCTAD for the year 2002 (UNCTAD, 2005: 16). This consists of an average of four sets of ratios. The first two have just been described for the year 2003. The third is an estimate of the value-added of all foreign affiliates as a percentage of the GDP of their home and host countries in 2002; and the fourth is an estimate of the employment of all foreign affiliates
as a percentage of the total employment of their home and host countries in that same year.16 The relevant data are set out in Table 3.17 The outward TNIs range from 0.3 in the case of Poland to 100.6% in the case of Hong Kong. The inward TNIs likewise vary a great deal, from 1.0% in the case of Japan to 81.6% in the case of Hong Kong. The average outward and inward TNIs are, respectively, 22.2 and 23.0. However, whereas in the case of the outward FDI, and in line with expectations, the TNI are considerably higher in (most) developed countries than in (most) developing countries, in the case of
Journal of International Business Studies
This content downloaded from 202.114.65.236 on Mon, 15 Dec 2014 23:45:43 PMAll use subject to JSTOR Terms and Conditions

Some macro-data on the regionalisation/globalisation debate John H Dunning et at 181
Table 3 Composite outward and inward TNI for selected countries, 2002
Country Outward Inward
Europe France 21.7 13.2
Germany 18.4 19.7 Ireland 20.4 69.4 Italy 10.1 6.0 Netherlands 52.3 38.4 Poland 0.3 15.6
Spain 18.2 21.3 Sweden 41.9 28.3 Switzerland 55.6 19.3 UK 38.1 17.5
America Brazil 5.4 14.5 Canada 21.9 20.5 Mexico 1.3 15.3 US 8.9 7.7
Asia China 1.4 16.6
Hong Kong 100.6 81.6 Indonesia 0.1 11.0
Japan 4.9 1.0 Korea 3.6 4.9
Malaysia 7.1 16.5
Singapore 77.8 60.2 Taiwan 16.1 9.8
Other Australia 10.4 18.9 New Zealand 3.8 27.6 South Africa 15.7 19.6
Average above 22.2 23.0
Source: Data supplied by UNCTAD. See also text for explanation of how these indices were compiled.
inward FDI the two regions record on average very similar TNIs.
The main reason why these macro-data reveal lower TNIs than the micro-data set out by Rugman and Verbeke is that the former embrace those of all firms, both private and public, and not just large MNEs. In fact, since by far the greater part of the value-added activities of most economies is domes- tically oriented, we would argue that the UNCTAD data provide a better indication of the extent to which an economy (taken as a whole) is inter- nationalised. On the other hand, we accept that if one chooses to focus on the wealth-creating activities of a country, then, since most of these
are undertaken by the larger and medium-sized firms in the private sector, the micro-data may well give a more realistic approximation of the signifi- cance of 'outward' globalisation to a nation's competitiveness and its long-term economic pros- perity.
As is shown in Tables 2 and 3, the TNIs vary enormously between countries. As far as outward FDI is concerned, the degree of transnationality would appear to be negatively related to the size of the investing country but positively related to its income levels and to the (global) competitive advantages of its firms. However, mergers and acquisitions (M&As), which accounted for such a high proportion of FDI outflows in the 1990s,18 are more likely to reflect firm-specific strategies and the growth rates of countries than are the other variables.19 Similarly, indices for asset exploiting FDI are likely to reflect the size of domestic (or adjacent regional) markets, labour, production and spatial transaction costs; and, for asset-augmenting FDI, exchange rates, profitability and the techno- logical and managerial competences of marketing opportunities offered by indigenous firms.
What then, in summary, do these disparate data show? First, for the leading MNEs, their interna- tional, or transnational, operations are an impor- tant part of their global activities. For all firms, they are less important, but still significant, while macro measures suggest that both inward and outward TNIs average one quarter of the GDPs of home and host countries.
Second, between 1990 and 2002 all transnational indices - at both the macro and micro level - have increased, and, in most cases, quite substantially.20 Third, the outward and inward TNIs vary conside- rably between countries, as does the balance between the two indices. This is illustrated in Figure 1, which sets out the relationship between these variables for the year 2002. Countries in the top-right quadrant (which record above average outward and inward TNIs)21 include Canada, Germany, the Netherlands, Singapore, and Sweden; those in the top-left quadrant (with above average outward and below average inward TNIs) include France, Taiwan, and the United Kingdom (UK). Those in the bottom right-hand quadrant (with below average outward and above average inward TNIs) include Australia and South Africa;22 and those in the bottom left-hand quadrant comprise (with below average outward and inward TNIs) all the rest, including Brazil, China, Italy, Japan, Korea, and the US.
Journal of International Business Studies
This content downloaded from 202.114.65.236 on Mon, 15 Dec 2014 23:45:43 PMAll use subject to JSTOR Terms and Conditions

* Some macro-data on the regionalisation/globalisation debate John H Dunning et al 182
France, Taiwan and the United Canada, Germany, Hong Kong,
High KingdomIreland, Netherlands, Singapore,
TNIO Spain, Sweden and Switzerland
Brazil, China, Indonesia, Italy, Australia, New Zealand and South
Low Japan, Malaysia, Mexico, Poland, Africa
Korea and the United States
Low High
TNII
Figure 1 Classification of countries by outward and inward TNIs, 2002. The dividing line between high and low is the median value of the indices. Source: Compiled by the authors based on data supplied by UNCTAD.
Globalisation and transnationality indices
A set of CGIs We first consider the regional distribution of outward FDI stocks for each of the 25 countries in 2002. As the following six tables are quite detailed and the text describing them relatively short, we have placed them together in Appendix A as Tables A1-A6. In Table Al (for 23 countries only because of unavailability of data for Indonesia and Mexico) in lines designated as (a) we set out the percentage distribution of FDI stocks accounted for by each of the four regions, and also calculate the standard deviation (s.d.) of the distribution. The presump- tion is that the nearer the s.d. approaches zero (which would mean the distribution of FDI is 25% for each region), the more the FDI stock is globalised. We refer to this measure as the crude globalisation index (CGI). Taking France as an example, line (a) of column 1 of Table Al reveals that the largest share of that country's outward FDI stock is concentrated in Europe (its home region) around an (unweighted) average of 56.6%. Adding the next region with the highest share (which in France's case is the Americas) gives a cumulative figure of 91.6%. Adding the third largest region - the Rest of the World - gives a share of 97.4%; and adding a fourth - Asia - raises it to 100%.
The data in Table Al suggest that the majority of FDI by MNEs tends to be of a uni- or bi-regional kind, and this largely accords with Rugman and Verbeke's findings. However, the home region is not always first choice of outward MNEs. In the case of the largest capital exporter, namely the US, Europe is seen to account for the largest share of the outward FDI stock (52.4%), whereas only 19.1% of Japanese FDI was directed elsewhere in Asia. In all,
seven of the 23 countries recorded the largest share of their MNE activity outside their home regions.23
These observations are confirmed by the s.d. indices. Among the least globalised of the 23 countries (i.e., those with the highest s.d.s) are Sweden and Italy from developed countries, and Brazil, South Africa and Taiwan from developing countries. Among the most globalised are Japan, the US, Australia and Switzerland from developed countries, and Malaysia, Korea and Singapore from developing countries. Rather surprisingly, there is no evidence to suggest that MNEs from developing countries are less globalised than those from developed countries; nor, indeed, that small coun- tries are more globalised than their larger counter- parts.24
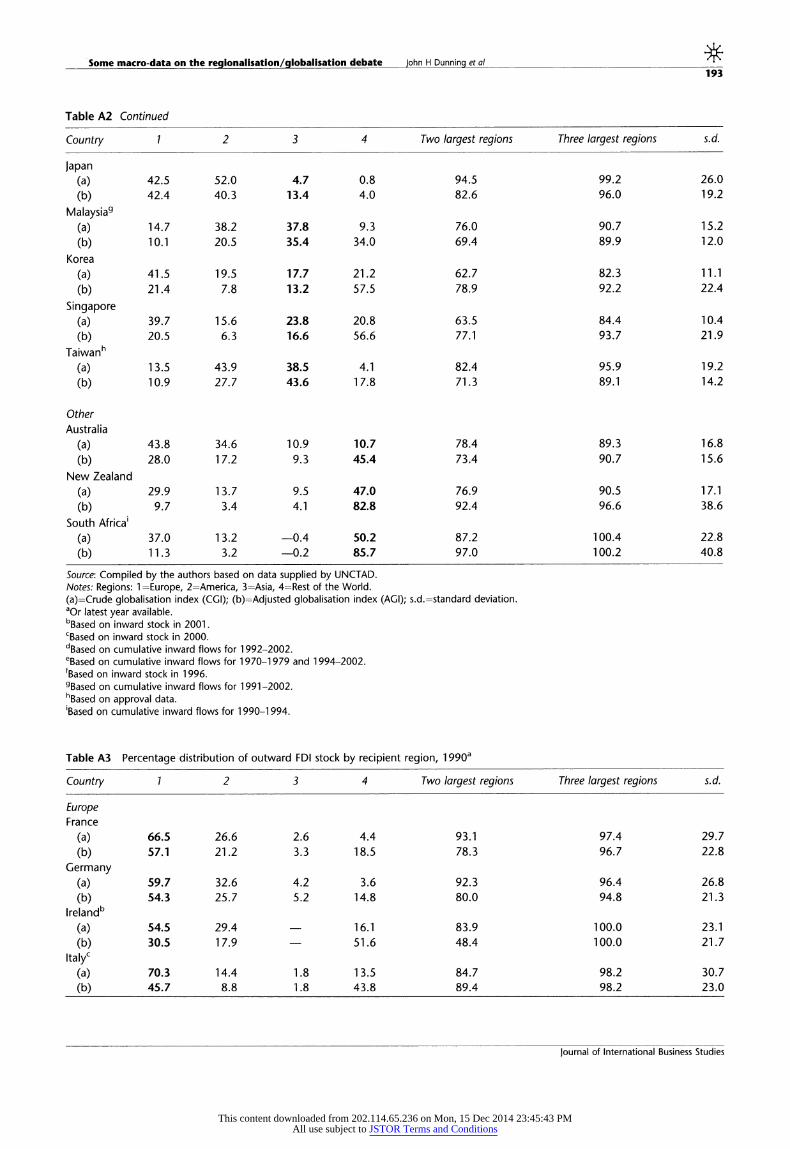
Table A2 presents details on the spatial origins of the inward geographical FDI stock of the 25 countries. Here, among European countries and Canada, there would seem to be a greater regional concentration than in the case of outward FDI. However, for the majority of developing and other countries, the reverse appears to be the case. Some 10 countries recorded the largest share of that investment from outside their home regions. Inbound FDI was the least geographically diversi- fied in the case of Poland, France, Italy, Germany and Sweden, and most diversified in the case of most of the developing Asian countries, Australasia, South Africa and the UK.
A set of AGIs One of several problems with CGIs and their respective s.d.s is that they take no account of the size of the host and home regions receiving or generating FDI stocks. Moreover, the regions, as defined, include the countries that are home and host to MNE activities. Consider the outward FDI stock of the US as an example. In 2002, only 28.4% of its outward stock was directed to (the rest of) the Americas, as compared with 52.4% to the European region (Table Al). But if one normalises for the size of the GDP of these regions (excluding the GDP of the US in the case of the Americas25) these percentages change to 54.6 and 24.3%, respectively. Lines designated as (b) in Tables Al and A2 present the adjusted globalisation indices (AGIs) for the inward and outward FDI stock of countries, which, we believe, better reflect the relative importance of particular regions to home or host country inves- tors. The final column of Tables Al and A2 sets out the respective s.d.s.
Journal of International Business Studies
This content downloaded from 202.114.65.236 on Mon, 15 Dec 2014 23:45:43 PMAll use subject to JSTOR Terms and Conditions

Some macro-data on the regionalisation/globalisation debate John H Dunning et a 183
Comparing the AGIs with the CGIs in Tables Al and A2 reveals the following two conclusions. First, in the majority of cases, AGIs demonstrate a reduced significance of the region of the home country as a generator for outward FDI, and of the host country as a recipient of inward FDI. In respect of outward FDI this is particularly noticeable for Ireland, Italy, China, and Singapore; and in respect of inward FDI for Ireland, Italy, Sweden, Indonesia, Korea, and Singapore. These data largely reflect the omission of the country being considered in calculating the GDP of its home region. Second, relative to the CGIs, the AGIs reveal a lower s.d. (i.e., a higher globalisation index) in the majority of countries (16 out of 23 countries in the case of outward FDI and 18 out of 25 countries in the case of inward FDI).26 The average s.d. for the outward AGIs in 2002 was 22.9 compared with that of 25.3 for the CGI. The corresponding inward globalisa- tion s.d.s were 25.2 and 26.2.27
Changes since the 1990s In Tables A3 and A4, we set out details of the outward and inward CGIs and AGIs for the same countries in 1990. Comparing these data with those in Tables Al and A2 enables us to assess the extent to which the globalisation of TNC activity might have increased between that year and 2002. The findings we draw are as follows:
(1) The extent to which extra-regionalism has increased during this period is somewhat differ- ent in the case of inward FDI as compared with that of outward FDI. To give some examples, with respect to inward AGIs, only eight coun- tries (Australia, Canada, China, Hong Kong, Korea, Malaysia, Mexico, and Taiwan) out of 24 (one country less in 1990 owing to unavailabil- ity of data) recorded an increase in their degree of globalisation (i.e., a fall in their s.d.s). By contrast, in the case of outward FDI - which, of course, is the main interest of Rugman and Verbeke - 14 countries (France, Poland, Spain, Brazil, Canada, US, China, Hong Kong, Japan, Malaysia, Korea, Taiwan, Australia, and South Africa) out of 23 countries (for which the data are available) showed increases in their degrees of globalisation, as proxied by a fall in their s.d.s.
(2) The average s.d.s for inward FDI rose marginally from 22.5 in 1990 to 25.2 in 2002, whereas those for outward FDI fell slightly from 24.2 to 22.9. None of these figures suggests any marked trend towards geographical diversification over the
past decade. It is nevertheless true that the majority of non-European countries have increased the share of their inward and outward FDI stocks outside their home regions.
(3) The countries that became less globalised, or more regionalised, between 1990 and 2002, were mainly European. Whereas only three of 10 European countries (France, Poland, and Spain) increased their outward AGIs between these years (i.e., their s.d.s fell), 10 of the 13 countries from other regions did so. The corresponding figures for inward AGIs were zero and eight. The opportunities offered by the completion of the European internal market, and the opening up of Central and Eastern Europe to inbound FDI, was almost certainly one of the main reasons for the continued regionalisation of European MNEs in the 1990s (Dunning, 2002).
(4) In the Americas, while the share of intra- regional outward and inward FDI of Canada and Mexico remained high between 1990 and 2002, there is little evidence to suggest that the formation of NAFTA has caused a divergence of that FDI from other regions. Indeed, the s.d.s for both countries fell over that period.
(5) In Asia, while China, Hong Kong, Korea, Malaysia, and Taiwan increased their AGIs (or reduced their s.d.s) between 1990 and 2002 (despite the growing attraction of China to foreign TNCs) in respect of both inward FDI and outward FDI, the opposite is true for Singapore.
Combining transnational with globalisation indices Combining the two sets of data set out in the sections 'The international (transnational) direct investment position of countries' and 'Globalisa- tion and transnationality indices' of the paper, we are able to demonstrate the relationship between the extent of inward and outward transnationality and that of globalisation. We shall illustrate our point by considering outward TNIs and AGIs for 2002. Figure 2 plots this relationship by classifying countries into four quadrants. The first relates to the group of countries with below average TNIs and below average AGIs. These countries may be regarded as the least globalised. In this quadrant, we place seven of the 23 countries. These include Australia, Brazil, China, Ireland, Italy, New Zealand, and South Africa. The second quadrant identifies
journal of International Business Studies
This content downloaded from 202.114.65.236 on Mon, 15 Dec 2014 23:45:43 PMAll use subject to JSTOR Terms and Conditions

S
Some macro-data on the regionalisation/globalisation debate John H Dunning et al 184
High Singapore and Sweden Hong Kong, Netherlands, Switzerland and United Kingdom
TNIo Australia, Brazil, China, Ireland,
Canada, France, Germany, Japan,
Low Italy, New Zealand and South Arica Malaysia, Poland, Korea, Spain,
Taiwan and United States
Low High
AGI
Figure 2 Relationship between outward TNI and AGI of selected countries, 2002. Covers 23 countries for which data for both transnationality index (TNI) and the adjusted globalisa- tion index (AGI) are available. Data for AGI refer to 2002 or latest
year available. Please see notes for Table Al. High (low) AGI means low (high) standard deviation. Source: Compiled by the authors based on data supplied by UNCTAD.
countries with below-average TNIs and average or above-average AGIs. This quadrant comprises 10 countries, among which are France, Germany, Japan, Korea, Taiwan, and the US. The third quadrant identifies countries with average or above-average TNIs and AGIs. These countries may be considered the most globalised. Four countries - Hong Kong, Netherlands, Switzerland, and the UK - are assigned to this quadrant. The final quadrant identifies countries with low TNIs and average or above-average AGIs. Only two countries - Singapore and Sweden - are classified in this quadrant.
A similar classification to that just described may be used to relate inward TNIs and AGIs. Figure 3 illustrates the position of 23 countries (for which both indices are available) for 2002. It can be seen that, although the classification of the larger developed countries broadly matches that set out in Figure 2, there are some significant differences. Perhaps the most noticeable of these is the UK, which switches position from being among the least to being among the most globalised countries. The differences are, however, more marked in the case of the smaller developed and developing countries. Sweden, for example, switches from being in the top left-hand quadrant to the top right-hand quadrant, whereas Hong Kong does the reverse. China switches from the bottom left-hand quadrant to the bottom right-hand quadrant, while Korea and Taiwan join the US in transposing from the bottom right-hand quadrant to the bottom left- hand quadrant. More generally, however, the combined indices of TNI and AGI show less extra- regional diversification in the case of inward FDI than in that of outward FDI.
High Hong Kong, Ireland and Singapore Netherlands, New Zealand and
Sweden
TNI, Australia, Brazil, Canada, China, France, Germany, Italy,
Indonesia, Japan, Malaysia, Low Poland, South Africa, Spain and
Mexico, Korea, Taiwan, United Switzerland
Kingdom and United States
Low High
AGI
Figure 3 Relationship between inward TNI and AGI of selected countries, 2002. Covers 23 countries for which data for both transnationality index (TNI) and the adjusted globalisation index (AGI) are available. Data for AGI refer to 2002 or latest year available. Please see notes for Table A2. High (low) AGI means low (high) s.d. Source: Compiled by the authors based on data
supplied by UNCTAD.
Comparative advantages in regionalisation or globalisation: an investment intensity ratio The final set of data we wish to present is intended to reflect the comparative advantage of our 25 countries in investing in, or being invested by, particular regions. Here, our hypothesis is that countries tend to most heavily invest in, or be invested by, their home regions, and least in regions most far removed in terms of physical, cultural, or institutional distance. Similarly, inward FDI is most likely to be made by firms originating in the same region. A caveat to this hypothesis is that natural-resource-seeking and some kinds of effi- ciency- and strategic-asset-seeking FDI tends to be more cross-regional in character.28
For this exercise, as we indicated in the introduc- tion to this paper, we widened our classification of regions to embrace six, which Ronen and Shenkar (1985) and Shenkar (2001) have identified as being culturally distinctive. These are described in Appen- dix B, and are set out in Tables A5 and A6. For each of the 23 countries (24 for Table A6) for the year 2002, we computed regional RICAs, or FDI intensity ratios for each of the six regional clusters in respect of both their outward and inward investment stocks.
Our formula for RICAo is
(Oai/Oat) RICAo wi/Owt) (1)
and for RICA1 is
RICA It) (2) (Iwt/Iwt)
where 0 and I represent the outward and inward stock of FDI, a=a particular country, i=a particular
journal of International Business Studies
This content downloaded from 202.114.65.236 on Mon, 15 Dec 2014 23:45:43 PMAll use subject to JSTOR Terms and Conditions
Some macro-data on the regionalisation/globalisation debate John H Dunning et al 185
region, t=all countries invested in (or by) a particular region or countries, and w=all making or receiving FDI.
Taking the outward FDI intensity ratios first, Table AS shows that, whereas in nine of the 23 countries the RICAo was the highest for their home regional clusters, this was not the case for some of the leading source countries of MNE activity, namely the US, UK, and Japan. The highest RICAos for these countries were recorded in clusters other than their home clusters.
The picture for RICA, set out in Table A6 is broadly comparable. In seven of the 25 countries, this ratio was the highest for firms investing in their home regional clusters. These data suggest that the pattern of extra regional FDI activity is very similar to that set out in earlier tables, except that there tends to be more inter-regional clustering of out- ward FDI within developing countries than there is in the case of inward FDI.
Table AS compares the RICAos for our sample countries in 2002 with those in 1990. The data suggest that there was a decline in the intra- regional RICAo in 18 countries - including all the major originators of FDI - and an increase in the case of five countries. There was also a similar fall in the intra-regional RICAI. Again, this trend is consistent with the data on CGI and AGIs for 16 countries, and an increase in RICAI in the case of eight countries (out of 24 countries identified in Table A6). In the case of five countries - Germany, the Netherlands, Switzerland, the UK, and Brazil - a positive intra-regional RICAo (greater than 1) in 1990 turned into a negative (less than 1) in 2002; whereas China and South Africa recorded RICAo below 1 in 1990 and above 1 in 2002. The corresponding figures for RICA, were 2 (Ireland and the Netherlands) and 0.
Analysis and conclusions The macro-data presented both on the internatio- nalisation of value-added activity by countries and on the regional distribution of such activity broadly confirm the micro-data contained in Rugman (2000) and Rugman and Verbeke (2004). The fact that our data show that the geographical distribu- tion of outward FDI is somewhat more dispersed than that found by Rugman and Verbeke is, we think, due to two main reasons. The first is that our data exclude the activities of firms in their home countries: hence the intra-regional ratios are bound to be smaller, and significantly so in the case of large countries such as the US. The second is that, in their
calculation of the proportion of foreign to total sales of the 382 leading MNEs, exports from the home, as well as the sales of foreign affiliates, were included (hence raising the intra-regional share of total sales); whereas using direct investment data, such exports are excluded from the TNI ratios.
In addition, in this paper we have been able to add three further dimensions to firm-level analyses of the geography of MNE activity. The first is the incorporation of inward MNE activity as part of the regionalisation/globalisation debate. In doing so, we have pinpointed some of the differences between the geography of countries recipient to FDI and that of investing countries. The second dimension is that we have normalised our data on FDI to take account of the size of the GDPs of the regions identified.29 In examining the regional distribution of the inward and outward FDI stock, we have also omitted the country making or receiving any intra-regional investment.
Third, we have extended the Rugman/Verbeke analysis to include an additional measure that, we believe, helps shed light on the regionalisation/ globalisation debate, namely a revealed compara- tive (FDI) index (RICA). For this exercise we chose six main regions based more on their common cultural characteristics than on geographical advantage. Our proposition here is that the closer the RICAs in respect of regions identified are to 1, the more globalised is the FDI stock of countries. In doing so, we attempted to assess the extent to which the geographical pattern of FDI was related to psychic or cultural distance, and how this has changed over the 1990s and early 2000s. In doing so we found that, in 2002, both sets of RICA ratios were highest in the case of culturally similar countries, but that in the last decade these ratios had fallen.
What, then, do these data imply for our theoris- ing about the geography of MNE activity and FDI? To what extent is such a geography driven by the strategies of MNEs, and to what extent by exogen- ous changes in the global economy?
We believe that it is a mixture of both determi-
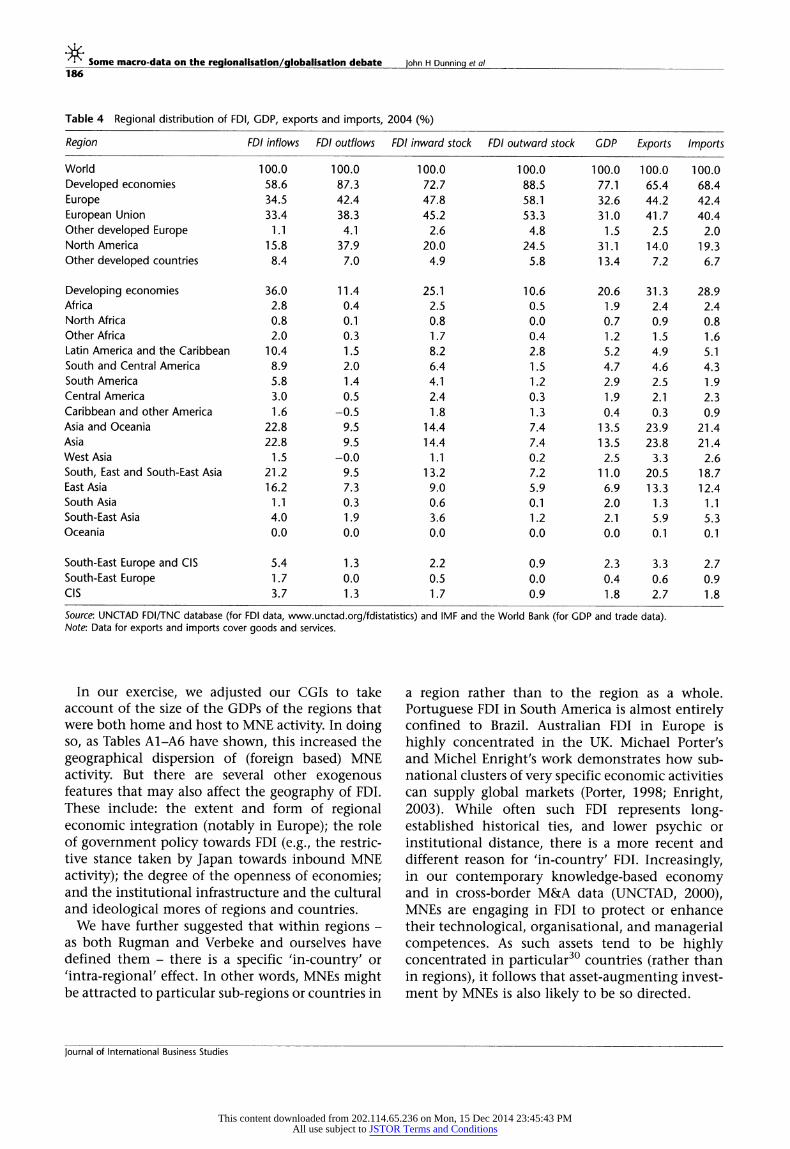
nants, but that it is primarily a reflection of the latter. This is essentially because, as Table 4 reveals, the world's distribution of output and trade is very uneven across regions. Therefore, it is not surpris- ing that the geography of FDI is quite concentrated (UNCTAD, 2001). However, because of their sig- nificant and growing contribution to world output and trade, the strategy of MNEs is, itself, an influence on these variables.
Journal of International Business Studies
This content downloaded from 202.114.65.236 on Mon, 15 Dec 2014 23:45:43 PMAll use subject to JSTOR Terms and Conditions
I Some macro-data on the regionalisation/globalisation debate John H Dunning et al
186
Table 4 Regional distribution of FDI, GDP, exports and imports, 2004 (%)
Region FDI inflows FDI outflows FDI inward stock FDI outward stock GDP Exports Imports
World 100.0 100.0 100.0 100.0 100.0 100.0 100.0 Developed economies 58.6 87.3 72.7 88.5 77.1 65.4 68.4 Europe 34.5 42.4 47.8 58.1 32.6 44.2 42.4 European Union 33.4 38.3 45.2 53.3 31.0 41.7 40.4 Other developed Europe 1.1 4.1 2.6 4.8 1.5 2.5 2.0 North America 15.8 37.9 20.0 24.5 31.1 14.0 19.3 Other developed countries 8.4 7.0 4.9 5.8 13.4 7.2 6.7
Developing economies 36.0 11.4 25.1 10.6 20.6 31.3 28.9 Africa 2.8 0.4 2.5 0.5 1.9 2.4 2.4 North Africa 0.8 0.1 0.8 0.0 0.7 0.9 0.8 Other Africa 2.0 0.3 1.7 0.4 1.2 1.5 1.6 Latin America and the Caribbean 10.4 1.5 8.2 2.8 5.2 4.9 5.1 South and Central America 8.9 2.0 6.4 1.5 4.7 4.6 4.3 South America 5.8 1.4 4.1 1.2 2.9 2.5 1.9 Central America 3.0 0.5 2.4 0.3 1.9 2.1 2.3 Caribbean and other America 1.6 -0.5 1.8 1.3 0.4 0.3 0.9 Asia and Oceania 22.8 9.5 14.4 7.4 13.5 23.9 21.4 Asia 22.8 9.5 14.4 7.4 13.5 23.8 21.4 West Asia 1.5 -0.0 1.1 0.2 2.5 3.3 2.6 South, East and South-East Asia 21.2 9.5 13.2 7.2 11.0 20.5 18.7 East Asia 16.2 7.3 9.0 5.9 6.9 13.3 12.4 South Asia 1.1 0.3 0.6 0.1 2.0 1.3 1.1 South-East Asia 4.0 1.9 3.6 1.2 2.1 5.9 5.3 Oceania 0.0 0.0 0.0 0.0 0.0 0.1 0.1
South-East Europe and CIS 5.4 1.3 2.2 0.9 2.3 3.3 2.7 South-East Europe 1.7 0.0 0.5 0.0 0.4 0.6 0.9 CIS 3.7 1.3 1.7 0.9 1.8 2.7 1.8
Source: UNCTAD FDI/TNC database (for FDI data, www.unctad.org/fdistatistics) and IMF and the World Bank (for GDP and trade data). Note: Data for exports and imports cover goods and services.
In our exercise, we adjusted our CGIs to take account of the size of the GDPs of the regions that were both home and host to MNE activity. In doing so, as Tables A1-A6 have shown, this increased the geographical dispersion of (foreign based) MNE activity. But there are several other exogenous features that may also affect the geography of FDI. These include: the extent and form of regional economic integration (notably in Europe); the role of government policy towards FDI (e.g., the restric- tive stance taken by Japan towards inbound MNE activity); the degree of the openness of economies; and the institutional infrastructure and the cultural and ideological mores of regions and countries.
We have further suggested that within regions - as both Rugman and Verbeke and ourselves have defined them - there is a specific 'in-country' or 'intra-regional' effect. In other words, MNEs might be attracted to particular sub-regions or countries in
a region rather than to the region as a whole. Portuguese FDI in South America is almost entirely confined to Brazil. Australian FDI in Europe is highly concentrated in the UK. Michael Porter's and Michel Enright's work demonstrates how sub- national clusters of very specific economic activities can supply global markets (Porter, 1998; Enright, 2003). While often such FDI represents long- established historical ties, and lower psychic or institutional distance, there is a more recent and different reason for 'in-country' FDI. Increasingly, in our contemporary knowledge-based economy and in cross-border M&A data (UNCTAD, 2000), MNEs are engaging in FDI to protect or enhance their technological, organisational, and managerial competences. As such assets tend to be highly concentrated in particular30 countries (rather than in regions), it follows that asset-augmenting invest- ment by MNEs is also likely to be so directed.
Journal of International Business Studies
This content downloaded from 202.114.65.236 on Mon, 15 Dec 2014 23:45:43 PMAll use subject to JSTOR Terms and Conditions

Some macro-data on the regionalisation/globallsatlon debate John H Dunning et al 187
The 'in-country' effect is also likely to vary between sectors. For example, the UK is very much the financial centre of Europe. In Asia, 90% of the region's innovatory capacity is centred in Japan. In North America almost all of the pharmaceutical R&D is carried out in the US. As we have already indicated, there is also a great deal of clustering or agglomeration of particular activities intended to serve international markets within countries. Many minerals and other natural resources are also not only location bound, but are very unevenly spread across countries.
The point we wish to stress is that, even if the sales or FDIs of MNEs are shown to be located in only one or two regions, it cannot be inferred that MNE decision-makers deliberately or consciously choose a regional, rather than a global, strategy towards their transactions and value-added activ- ities. To our way of thinking, a MNE's strategy towards its locational profile is demonstrated less by the actual distribution of its sales and FDI, and more by the extent to which these are relatively more or less geographically concentrated than that of a country or region's share of world GDP or trade. Here, the data do suggest that this is marginally the case, although how far regionalisation may be interpreted as an alternative to globalisation and how far as a step towards it remains unresolved.
In the light of these data, do theories of the determinants of MNE activity need to be modified? Our answer would be 'generally no', but our findings do throw up some interesting hypotheses worthy of more research. Thus, while much of the geographical pattern of MNE activity is consistent with received locational theory - and particularly that of the Uppsala School - there are emerging trends that do not fit entirely comfortably into that theory. For example, the data offer little guidance as to whether firms undertake less investment in more distant regions because of falling ownership or firm-specific advantages, or because of the increased spatial or transaction costs involved. Another concerns the role of institutions in affect-
ing the competitive advantages both of firms and of countries (Dunning, 2006). For example, Ozawa, in his recent book (Ozawa, 2005), has shown that the transfer of institutional advantages by US firms has helped make Japan a more open and desirable country in which to invest. Another relatively neglected area, as identified by Buckley and Ghauri (2004), relates to the geographical implications of the increasing variety and complexity of the non-equity cross-border economic relationships
involving MNEs, which do not come within the scope of either the Rugman and Verbeke or our own data analyses. Yet often these are an integral part of the strategy of MNEs and national governments, to both exploit and augment the amount and quality of their resources and capabilities within their jurisdiction. A final challenge to traditional FDI analysis is the recent rapid growth of cross-border investment by private equity firms.31
As far as the impact of globalisation and related events of the 1990s on the location of MNE activity is concerned, we think the main conclusion of Tables A1-A4 is that it is the extension and deepening of European economic integration that has been the main factor leading to more rather than less FDI by European firms in their home regions. Again, we do not believe this is evidence of a less globalising strategy on the part of the MNEs, any more than we would aver that the increasing FDI now being directed to China and India is making for a more globalised strategy. What both are doing is to affect the conditions under which firms can choose to better exploit their ownership advantages and locational strategies (Dunning, 1998).
On the other hand - and perhaps rather surpris- ingly - there is little suggestion that the wave of intra-Triad M&As in the 1990s has affected the geographical pattern of either outward or inward FDI. Nor, except in the case of Korea and Japan, is there much evidence of any asset-augmenting FDI affecting the locational profile of Third World MNEs (UNCTAD, 2006). Perhaps, with the growing attractions of Chinese and Indian economies to foreign investors, and the fact that the main thrust of European integration has been completed, this will show itself in the coming decade. Certainly we would hypothesise that current trends in the world economy are likely to lead to a more dispersed rather than a geographical distribution of MNE activity and FDI, and to a realisation of more globally oriented transactions and valued added by MNEs.
There remains much more macro-level data
mining that could be done. This is a rich avenue for further research into the globalisation/regiona- lisation debate. The role of increasing regional integration (particularly concerning an enlarged EC, and plans to extend NAFTA and ASEAN) is one such area of research. Another concerns splitting the FDI data by activities and functions, by forms (M&As versus greenfield), by type (vertical and horizontal), and by motive for FDI. Better use might
journal of International Business Studies
This content downloaded from 202.114.65.236 on Mon, 15 Dec 2014 23:45:43 PMAll use subject to JSTOR Terms and Conditions

S Some macro-data on the regionalisation/globalisation debate John H Dunning et al
188
also be made of the data for examining differences in the geography of FDI by different groups of countries, for example, developing compared with developed, and so on (Dunning, 2004).
In short, although we agree with Rugman and Verbeke that a great part (although we would find it difficult to accept a figure of 90%) of FDI is currently undertaken by the world's leading 500 MNEs, and also that the data on sales provide one of the most useful measures of the geographical distribution of economic activity, we consider that such micro-data or firm-level data need to be supplemented by the kind of macro- or country- level data set out in this paper and in the publications of national governments and supra- national entities, and most noticeably those of UNCTAD.32 Although still imperfect, the coverage and quality of such data are improving all the time. We believe IB scholars should make much more use of them than they do.
Acknowledgements Arie Y Lewin and two anonymous reviewers provided helpful comments on an earlier version of this article. The authors are also grateful to Lizanne Martinez for statistical assistance. The views expressed in this article are those of the authors and do not necessarily reflect the views of their respective organisation.
Notes 1Rugman and Verbeke note that not all these 500
firms are multinational, but claim the majority produce and/or distribute products and/or services across national boundaries.
2The three regions were North America (US, Canada, and Mexico), Europe (including Central and Eastern Europe), and Asia-Pacific. The difference between the share of sales accounted for by these three regions and 100% represents that accounted for by other regions, for example,Latin America, Africa, and the Middle East. In their analysis, Rugman and Verbeke did not consider this group of regions as comprising a fourth, that is,'other' region. Yet in the case of some of the firms identified, they recorded more of their sales in this region than in some of the three identified.
3Rugman and Verbeke defined global firms as those with at least 20% of their sales in all three regions but less than 50% in any one region.
4Apart from that, see one of the authors (Rugman, 2000). Drawing upon their own figures of the global sales of the largest 500 firms and relating these to the estimates of UNCTAD (2005), we believe this is a considerable exaggeration of the true figure.
5To give just two examples, the export propensity of parent firms of US and Japanese MNEs was 9% (1999) and 22% (2001), respectively (United States Depart- ment of Commerce, 2004; Japan, Ministry of Econo- my, Trade and Industry, 2004).
6Based on the proportion of the global sales, assets, value-added, or employment of firms accounted for by their foreign affiliates.
7Most of the data on FDI and activities of MNEs collected by UNCTAD are available from www.uncta- d.org/fdistatistics. UNCTAD collects these data directly from national governments. For detailed explanation on sources and methodologies of data, see the definitions and sources in the World Investment Reports (www.unctad.org/wir) and country profiles contained in the World Investment Directories (www.unctad.org/ fdistatistics). See also the pioneering work undertaken at Erasmus University on both firm and country data (Van Tulder et al., 2001; Van den Berghe and Van Tulder, 2002).
8Occasionally, where data are not available for 23 or 24 countries.
9Which, in essence, are gravity indices (Petri, 1994).
10The few exceptions include the US and Japan. 11In their analysis Rugman and Verbeke (2004) did
not calculate this particular ratio. 12The foreign assets of the largest 100 MNEs
accounted for approximately 46% of the total outward FDI stock in 2004 (UNCTAD, 2005).
13The concentration of MNE activity among the largest firms would appear to have fallen since 1990. The corresponding transnationality values reported by UNCTAD for that year were 27, 21, and 21%, respectively.
14This latter is by no means an ideal measure, as it relates a financial flow to capital expenditure, but it is the best measure we have. Data from the US on the ratio of foreign to total capital expenditure of US firms confirm that all the ratios are similar.
15We chose to take an average of a 7-year period, primarily to help even out fluctuations caused by 'lumpy' (e.g.,M&A) FDIs.
16Both of which are extrapolations of the actual data supplied by some of the leading world international investors.
171t should be observed that such multiple measures have two drawbacks. The first is that the different elements of internationalisation represent different dimensions. The second is that they are assumed to be equally important.
18Estimated by UNCTAD at two-thirds between 1990 and 2004, with the assumption that one dollar
journal of International Business Studies
This content downloaded from 202.114.65.236 on Mon, 15 Dec 2014 23:45:43 PMAll use subject to JSTOR Terms and Conditions

Some macro-data on the regionalisatonalaton/globalsation debate John H Dunning et al 189
of cross-border M&As is equivalent to one dollar of FDI flows as reported in respective statistics.
19See EIU (2003) for an analysis of the significance of these determinants.
20Exceptions are where firms and countries that recorded lower-than-average TNI ratios have increased their participation in the global economy faster than those that record higher-than-average ratios. On the other hand, a rising average TNI ratio might conceal the cases of firms and countries whose ratios have not risen at the same rate.
21As a result of the wide spread of both TNIos and TNlis, we have calculated the median rather than the arithmetic mean as the average.
22South Africa is a large recipient in Africa for FDI. Thus this country is selected for the analysis and included together with Australia and New Zealand under the 'other' category.
231n the case of exports from 25 countries, the home region was the largest destination of exports from all 25 countries except two (Australia and New Zealand) in 2002.
24The export data also suggest a similar pattern for globalisation and regionalisation. Japan, Korea, New Zealand, and the US are the most globalised (lowest SDs) and Mexico, Poland, and Canada the least globalised (highest s.d.).
25By weighting the share of outward FDI stock in particular regions by their GDPs less that of the
investing recipient county and recalculating their share of total adjusted FDI stock.
26More particularly, each of the major European and North American outward and inward foreign investors recorded either a lower or the same AGI as compared with their CGI.
27A similar pattern is also observed for exports from these major host/home countries. The average s.d. is 25.1 for CGI and 24.3 for AGI in 2002.
28Especially vertical FDI in the case of developed/ developing country FDI and asset acquiring FDI in the case of intra-Triad M&As.
29We accept that this could be done in any explanation of the extent of globalisation by countries, but we consider it useful to do so in the description of the data. By contrast, we would consider the particular features of the investing or recipient countries (e.g., their size income levels) as an explanatory variable.
30Although, as UNCTAD (2005) shows, such capa- city is becoming more dispersed.
3'According to UNCTAD (2006) private equity and hedge funds accounted for 24% of the value of all cross-border M&As in 2004 and 2005.
32See their various World Investment Reports (www.unctad.org/wir) and World Investment Direc- tories as well as other data-related publications (www.unctad.org/fdistatistics).
33A modified version of those identified by Ronen and Shenkar (1985).
References Buckley, P.J. and Ghauri, P.N. (2004) 'Globalisation, economic
geography and the strategy of multinational enterprises', journal of International Business Studies 35(2): 81-98.
Dunning, J.H. (1998) 'Location and the multinational enterprise: a neglected factor', Journal of International Business Studies 29(1): 45-66.
Dunning, J.H. (2002) 'Globalising europe: the overall picture', in T.L. Brewer, P.A. Brenton and G. Boyd (eds.) Globalising Europe, Edward Elgar: Cheltenham, pp. 43-61.
Dunning, J.H. (2004) 'Determinants of foreign direct invest- ment: globalisation induced changes and the role of policies', in World Bank (ed.) Proceedings of Annual World Bank Conference on Development Economics (Europe 2003) World Bank: Washington, pp. 279-290.
Dunning, J.H. (2006) 'Towards a new paradigm of develop- ment: implications for the determinants of international business activity', Transnational Corporations 15(1): 173-227.
Economist Intelligence Unit (EIU) (2003) World Investment Prospects: The Future of FDI: Globalisation or Regionalisation, EIU: London.
Enright, M. (2003) 'Regional clusters: what we know and what we should know', in J. Brocker, D. Dohse and R. Soltwedel (eds.) Innovation Clusters and Inter-regional Competition, Berlin: Springer-Verlag, pp. 99-129.
letto-Gillies, G. (1998) 'Different conceptual frameworks for the assessment of the degree of internationalisation: an empirical analysis of various indices for the top 100 transnational corporations', Transnational Corporations 7(1): 17-35.
Japan, Ministry of Economy, Trade and Industry (2004) Dai 32- kai Wagakuni Kigyo no Kaigai Jigyo Katsudo, METI: Tokyo.
Oesterle, J.-j. and Fisch, J.H. (2000) 'Globalisation Can Be Measured: Unveiling Tales of Mystery and Globalisation with a New Integrative and Metric Measurement Concept', Paper presented to the 26th Annual Conference of the European International Business Academy, Maastricht.
Ozawa, T. (2005) Institutions, Industrial Upgrading and Economic Performance in Japan, Edward Elgar: Cheltenham.
Petri, P.A. (1994) 'The regional clustering of foreign and direct investment and trade', Transnational Corporations 3(3): 1-24.
Porter, M.E. (1998) On Competition, Harvard Business School Press: Boston.
Ronen, S. and Shenkar, 0. (1985) 'Clustering countries on attitudinal dimensions: a review and synthesis', Academy of Management Review 10(3): 435-454.
Rugman, A.M. (2000) The End of Globalisation, Random House: London.
Rugman, A.M. and Verbeke, A. (2004) 'A perspective on regional and global strategies of multinational enterprises', journal of International Business Studies 35(1): 3-19.
Journal of International Business Studies
This content downloaded from 202.114.65.236 on Mon, 15 Dec 2014 23:45:43 PMAll use subject to JSTOR Terms and Conditions

* Some macro-data on the regionalatioalisation/globalsation
debate John H Dunning et al 190
Shenkar, O. (2001) 'Cultural distance reconsidered: towards a more rigorous conceptualisation and measurement of cultural differ- ence', Journal of International Business Studies 32(3): 519-535.
Sullivan, D. (1994) 'Measuring the degree of internationalisation of a firm', Journal of International Business Studies 25(2): 325-342.
Thrift, N. (2000) 'Pandora's box? Cultural geographies of economics', in G.L. Clark, M.P. Feldman and M.S. Gertler (eds.) The Oxford Handbook of Economic Geography, Oxford: Oxford University Press, pp. 689-704.
UNCTAD (1993) World Investment Report 1993: Transnational Corporations and Integrated International Production, UN: New York and Geneva.
UNCTAD (2000) World Investment Report 2000: Cross-border Mergers and Acquisitions and Development, UN: New York and Geneva.
UNCTAD (2001) World Investment Report 2001. FDI Policies for Development, National and International Perspectives, UN: New York and Geneva.
UNCTAD (2004) World Investment Report 2004: The Shift Towards Services, UN: New York and Geneva.
UNCTAD (2005) World Investment Report 2005: Transnational Corporations and the Internationalization of R&D, UN: New York and Geneva.
UNCTAD (2006) World Investment Report 2006, FDI from Developing and Transition Economics: Implications for Devel- opment, UN: New York and Geneva.
United States Department of Commerce (2004) US Direct Investment Abroad: Final Results from the 1999 Benchmark Survey, US Government Printing Office: Washing- ton, DC.
Van den Berghe, D. and Van Tulder, R. (2002) 'The geography of foreign direct investment: a tripartite approach', Journal of International Business and Economy 3(1): 1-24.
Van Tulder, R., Van den Berghe, D. and Muller, A. (2001) Erasmus (Scoreboard) of Core Companies: The World's 20 Largest Firms and Internationalisation, Rotterdam School of Management/Erasmus University: Rotterdam.
Xu, D. and Shenkar, 0. (2002) 'Institutional distance and the multinational enterprise', Academy of Management Review 27(4): 608-618.
Appendix A
Table Al Percentage distribution of outward FDI stock by recipient region, 2002a
Country 1 2 3 4 Two largest regions Three largest regions s.d.
Europe Franceb
(a) 56.6 34.9 2.6 5.8 91.6 97.4 25.6
(b) 51.9 21.3 2.8 24.0 75.9 97.2 20.3
Germany (a) 51.1 41.1 5.7 2.1 92.2 97.9 24.8
(b) 55.8 28.0 6.7 9.5 83.8 93.3 22.6 Ireland
(a) 58.0 18.3 - 23.8 81.7 100.0 24.2
(b) 29.6 7.2 - 63.2 92.8 100.0 28.4
Italy (a) 71.3 13.2 0.6 15.0 86.3 99.4 31.5
(b) 47.4 6.0 0.4 46.2 93.6 99.6 25.3 Netherlandsb
(a) 58.5 33.5 4.7 3.3 92.1 96.7 26.3
(b) 55.2 23.6 5.7 15.6 78.8 94.3 21.4 Polandc
(a) 57.8 10.3 22.4 9.5 80.2 90.5 22.7
(b) 40.0 5.4 20.4 34.1 60.4 94.6 15.4
Spaind (a) 45.0 46.5 0.1 8.4 91.5 99.9 24.2
(b) 37.4 28.2 0.1 34.3 71.7 99.9 17.0
Sweden
(a) 75.0 20.5 1.3 3.2 95.5 98.7 34.4
(b) 68.9 14.3 1.5 15.2 84.1 98.5 29.9
Switzerland (a) 51.8 36.9 8.5 2.8 88.6 97.2 23.2
(b) 49.1 26.5 10.6 13.8 75.6 89.4 17.5
UK (a) 62.0 27.1 4.4 6.4 89.2 95.6 26.7
(b) 54.7 15.7 4.4 25.2 79.9 95.6 21.5
journal of International Business Studies
This content downloaded from 202.114.65.236 on Mon, 15 Dec 2014 23:45:43 PMAll use subject to JSTOR Terms and Conditions

Some macro-data on the regionalisation/globalisation debate John H Dunning et al 191
Table Al Continued
Country 1 2 3 4 Two largest regions Three largest regions s.d.
America Brazil
(a) 13.4 86.0 0.2 0.4 99.4 99.8 41.1
(b) 15.7 81.3 0.3 2.7 97.0 99.7 38.1 Canada
(a) 27.3 62.9 5.7 4.1 90.2 95.9 27.4
(b) 25.2 47.9 7.1 19.8 73.1 92.9 17.1 US
(a) 52.4 28.4 14.2 5.0 80.8 95.0 20.6 (b) 24.3 54.6 8.8 12.3 78.9 91.2 20.8
Asia Chinae
(a) 2.8 18.8 55.3 23.1 78.4 97.2 22.0
(b) 1.2 6.4 39.1 53.3 92.4 98.8 25.2
Hong Kong (a) 0.8 54.9 38.0 6.2 92.9 99.2 25.8
(b) 0.7 33.2 40.5 25.6 73.8 99.3 17.3
Japan (a) 23.9 52.1 19.1 4.9 76.0 95.1 19.8
(b) 16.5 28.0 37.7 17.7 65.7 83.5 9.9
Malaysia (a) 13.6 25.7 43.1 17.5 68.8 86.4 13.1
(b) 7.4 10.8 31.7 50.1 81.8 92.6 19.9 Korea
(a) 18.4 37.8 38.3 5.5 76.1 94.5 16.0
(b) 13.9 22.2 41.8 22.0 64.1 86.1 11.9
Singapore (a) 9.5 5.5 42.3 42.7 85.1 94.5 20.3
(b) 3.2 1.4 19.4 76.0 95.4 98.6 34.9 Taiwane
(a) 2.8 68.0 26.4 2.8 94.4 97.2 30.8 (b) 2.6 49.3 34.2 14.0 83.5 97.4 20.8
Other Australia
(a) 28.8 51.9 3.7 15.6 80.7 96.3 20.7 (b) 16.2 22.7 2.8 58.4 81.1 97.2 23.8
New Zealand (a) 18.6 14.2 4.4 62.9 81.5 95.6 26.0
(b) 4.9 2.9 1.5 90.6 95.5 98.5 43.8 South Africa
(a) 75.1 12.2 2.0 10.6 87.3 98.0 33.7 (b) 51.2 6.5 1.9 40.4 91.7 98.1 24.5
Source: Compiled by the authors based on data supplied by UNCTAD. Notes: Regions: 1 =Europe, 2=America, 3=Asia, 4=Rest of the World. (a)=Crude globalisation index (CGI); (b)=Adjusted globalisation index (AGI); s.d.=standard deviation. Figures in bold in this and subsequent tables represent the share of FDI directed to or from the home region of the foreign investors. aOr latest year available. bBased on outward stock in 2001. CBased on outward stock in 2000. dBased on cumulative outward flows for 1992-2002. eBased on approval data.
Journal of International Business Studies
This content downloaded from 202.114.65.236 on Mon, 15 Dec 2014 23:45:43 PMAll use subject to JSTOR Terms and Conditions

* Some macro-data on the regionalisation/globalisation debate John H Dunning et al 192
Table A2 Percentage distribution of inward FDI stock by investing region, 2002a
Country 1 2 3 4 Two largest regions Three largest regions s.d.
Europe Franceb
(a) 81.4 15.0 1.6 2.0 96.4 98.4 38.1 (b) 79.6 9.8 1.8 8.8 89.4 98.2 36.6
Germany (a) 77.1 17.6 3.8 1.5 94.7 98.5 35.4 (b) 78.2 11.2 4.1 6.5 89.4 95.9 35.6
Ireland (a) 65.3 27.7 - 7.0 93.0 100.0 29.3 (b) 53.1 17.3 - 29.6 82.7 100.0 22.3
Italy (a) 78.2 13.3 1.9 6.6 91.5 98.1 35.8 (b) 65.1 7.6 1.9 25.4 90.5 98.1 28.6
Netherlandsb (a) 65.4 29.6 4.0 1.0 95.0 99.0 29.8 (b) 67.0 22.7 5.2 5.1 89.6 94.9 29.2
Polandc (a) 87.7 9.8 2.1 0.4 97.5 99.6 42.0 (b) 87.7 7.5 2.8 2.0 95.2 98.0 41.9
Spaind (a) 73.5 23.3 0.0 3.1 96.9 100.0 34.0 (b) 69.4 16.0 0.0 14.6 85.4 100.0 30.5
Sweden (a) 74.6 21.1 - 4.3 95.7 100.0 34.3 (b) 66.1 14.2 - 19.7 85.8 100.0 28.6
Switzerland
(a) 57.9 40.0 0.6 1.5 97.9 99.4 28.6 (b) 59.9 31.4 0.9 7.8 91.3 99.1 26.7
UK (a) 48.3 42.6 5.7 3.4 90.8 96.6 23.7 (b) 49.3 28.5 6.6 15.5 77.8 93.4 18.5
America Brazilc
(a) 49.6 43.6 3.2 3.6 93.2 96.8 25.1 (b) 46.0 32.6 4.0 17.4 78.6 96.0 18.2
Canada (a) 29.3 65.7 4.1 0.9 95.0 99.1 29.9 (b) 31.2 57.8 5.9 5.2 89.0 94.8 25.0
Mexicoe (a) 19.7 64.2 4.8 11.3 83.8 95.2 26.8 (b) 14.2 38.0 4.7 43.2 81.1 95.3 18.5
US (a) 72.8 12.3 11.9 3.0 85.1 97.0 32.1 (b) 46.8 32.7 10.3 10.2 79.5 89.8 18.0
Asia China
(a) 7.6 15.9 72.2 4.3 88.2 95.7 31.9 (b) 4.8 7.8 73.3 14.1 87.4 95.2 32.4
Hong Kong (a) 9.9 49.0 30.9 10.2 79.8 90.1 18.7 (b) 6.9 26.4 29.3 37.3 66.7 93.1 12.9
Indonesiaf (a) 16.1 10.4 54.4 19.1 73.5 89.6 19.9 (b) 8.0 4.1 37.4 50.5 87.9 95.9 22.6
Journal of International Business Studies
This content downloaded from 202.114.65.236 on Mon, 15 Dec 2014 23:45:43 PMAll use subject to JSTOR Terms and Conditions
Some macro-data on the regionalisation/globalisation debate John H Dunning et al 193
Table A2 Continued
Country 1 2 3 4 Two largest regions Three largest regions s.d.
Japan (a) 42.5 52.0 4.7 0.8 94.5 99.2 26.0
(b) 42.4 40.3 13.4 4.0 82.6 96.0 19.2
Malaysiag (a) 14.7 38.2 37.8 9.3 76.0 90.7 15.2
(b) 10.1 20.5 35.4 34.0 69.4 89.9 12.0
Korea (a) 41.5 19.5 17.7 21.2 62.7 82.3 11.1
(b) 21.4 7.8 13.2 57.5 78.9 92.2 22.4
Singapore (a) 39.7 15.6 23.8 20.8 63.5 84.4 10.4
(b) 20.5 6.3 16.6 56.6 77.1 93.7 21.9 Taiwanh
(a) 13.5 43.9 38.5 4.1 82.4 95.9 19.2
(b) 10.9 27.7 43.6 17.8 71.3 89.1 14.2
Other Australia
(a) 43.8 34.6 10.9 10.7 78.4 89.3 16.8
(b) 28.0 17.2 9.3 45.4 73.4 90.7 15.6
New Zealand (a) 29.9 13.7 9.5 47.0 76.9 90.5 17.1
(b) 9.7 3.4 4.1 82.8 92.4 96.6 38.6
South Africa' (a) 37.0 13.2 -0.4 50.2 87.2 100.4 22.8
(b) 11.3 3.2 -0.2 85.7 97.0 100.2 40.8
Source: Compiled by the authors based on data supplied by UNCTAD. Notes: Regions: 1 =Europe, 2=America, 3=Asia, 4=Rest of the World. (a)=Crude globalisation index (CGI); (b)=Adjusted globalisation index (AGI); s.d.=standard deviation. aOr latest year available. bBased on inward stock in 2001. cBased on inward stock in 2000. dBased on cumulative inward flows for 1992-2002. eBased on cumulative inward flows for 1970-1979 and 1994-2002. fBased on inward stock in 1996. gBased on cumulative inward flows for 1991-2002. hBased on approval data. 'Based on cumulative inward flows for 1990-1994.
Table A3 Percentage distribution of outward FDI stock by recipient region, 1990a
Country 1 2 3 4 Two largest regions Three largest regions s.d.
Europe France
(a) 66.5 26.6 2.6 4.4 93.1 97.4 29.7
(b) 57.1 21.2 3.3 18.5 78.3 96.7 22.8
Germany (a) 59.7 32.6 4.2 3.6 92.3 96.4 26.8
(b) 54.3 25.7 5.2 14.8 80.0 94.8 21.3 Irelandb
(a) 54.5 29.4 16.1 83.9 100.0 23.1
(b) 30.5 17.9 51.6 48.4 100.0 21.7
Italyc (a) 70.3 14.4 1.8 13.5 84.7 98.2 30.7 (b) 45.7 8.8 1.8 43.8 89.4 98.2 23.0
Journal of International Business Studies
This content downloaded from 202.114.65.236 on Mon, 15 Dec 2014 23:45:43 PMAll use subject to JSTOR Terms and Conditions

S Some macro-data on the regionalisation/globalisation debate John H Dunning et al
194
Table A3 Continued
Country 1 2 3 4 Two largest regions Three largest regions s.d.
Netherlands (a) 52.1 40.8 4.1 3.0 92.9 97.0 25.2 (b) 44.0 36.2 5.7 14.1 80.2 94.3 18.0
Polandd
(a) 61.8 7.1 26.7 4.5 88.4 95.5 26.4 (b) 43.7 5.4 32.6 18.2 76.3 94.6 16.7
Spaine (a) 40.9 39.7 0.1 19.3 80.6 99.9 19.3 (b) 22.0 21.8 0.1 56.2 78.1 99.9 23.2
Swedend
(a) 75.2 17.9 2.1 4.9 93.0 97.9 34.1 (b) 60.0 15.1 2.8 22.1 82.1 97.2 24.7
Switzerlandf (a) 50.0 40.3 6.0 3.7 90.3 96.3 23.6 (b) 40.4 34.6 8.2 16.7 75.0 91.8 15.1
UK (a) 28.7 52.4 6.7 12.1 81.2 93.3 20.6 (b) 19.1 33.3 6.8 40.8 74.1 93.2 15.1
America Brazilb
(a) 12.4 86.5 0.2 1.0 98.8 99.8 41.4 (b) 10.4 84.6 0.3 4.7 95.0 99.7 40.0
Canada (a) 22.4 69.5 4.9 3.2 92.0 96.8 30.9 (b) 17.1 62.5 6.4 14.0 79.6 93.6 25.4
US
(a) 49.7 32.7 10.8 6.7 82.5 93.3 20.1 (b) 18.8 59.3 7.1 14.8 78.1 92.9 23.4
Asia Chinag
(a) 5.7 38.9 18.1 37.3 76.2 94.3 16.0 (b) 1.9 14.2 11.5 72.4 86.6 98.1 32.0
Hong Kongh (a) 4.2 55.3 35.8 4.7 91.1 95.8 25.0 (b) 2.7 38.9 40.8 17.6 79.7 97.3 18.2
Japand (a) 18.1 42.5 30.6 8.9 73.1 91.1 14.7 (b) 6.7 17.2 57.0 19.0 76.0 93.3 22.0
Malaysia (a) 11.5 8.3 65.3 15.0 80.2 91.7 27.0 (b) 5.2 4.1 51.7 39.0 90.7 95.9 24.1
Korea (a) 5.0 54.4 30.0 10.5 84.4 95.0 22.3 (b) 2.8 32.9 30.6 33.7 66.6 97.2 14.9
Singapore (a) 8.0 5.1 48.6 38.3 86.9 94.9 21.7 (b) 2.5 1.7 26.6 69.1 95.8 98.3 31.6
Taiwan (a) 3.7 60.0 35.0 1.3 95.0 98.7 27.9 (b) 2.7 46.9 45.2 5.3 92.0 97.3 24.3
Journal of International Business Studies
This content downloaded from 202.114.65.236 on Mon, 15 Dec 2014 23:45:43 PMAll use subject to JSTOR Terms and Conditions

Some macro-data on the regionalisation/globalisation debate John H Dunning et al 195
Table A3 Continued
Country 1 2 3 4 Two largest regions Three largest regions s.d.
Other Australia'
(a) 31.2 30.1 15.3 23.4 61.3 84.7 7.3
(b) 11.8 12.4 10.1 65.7 78.1 89.9 27.1 New Zealandf
(a) 16.3 44.1 -4.2 43.9 88.0 104.2 23.5
(b) 5.1 15.1 -2.3 82.1 97.2 102.3 38.7 South Africa
(a) 92.9 2.0 5.1 98.0 100.0 45.3
(b) 73.1 1.7 25.3 98.3 100.0 34.1
Source: Compiled by the authors based on data supplied by UNCTAD. Notes: Regions: 1=Europe, 2=America, 3=Asia, 4=Rest of the World. (a)=Crude globalisation index (CGI); (b)=Adjusted globalisation index (AGI); s.d.=standard deviation. aOr latest year available. bBased on outward stock in 2001. cBased on outward stock in 1994. dBased on outward stock in 1996. eBased on outward flows in 1992. fBased on outward stock in 1993. gBased on approval data. hBased on outward stock in 1998. 'Based on outward stock in 1992.
Table A4 Percentage distribution of inward FDI stock by investing region, 1990a
Country 1 2 3 4 Two largest regions Three largest regions s.d.
Europe France
(a) 70.1 21.5 3.1 5.2 91.7 96.9 31.2 (b) 58.3 16.6 3.8 21.3 79.6 96.2 23.4
Germany (a) 59.7 31.7 7.7 0.8 91.5 99.2 26.7
(b) 58.8 27.0 10.5 3.6 85.9 96.4 24.6 Irelandb
(a) 42.3 48.1 8.1 1.6 90.4 98.4 23.6
(b) 36.0 44.4 11.9 7.7 80.4 92.3 18.0
Italyc (a) 76.2 16.0 1.9 5.9 92.2 98.1 34.7 (b) 61.7 12.2 2.3 23.7 85.4 97.7 26.0
Netherlands (a) 56.4 38.4 4.9 0.3 94.8 99.7 27.0 (b) 52.9 37.9 7.7 1.5 90.8 98.5 24.5
Polandd (a) 77.9 14.5 3.0 4.6 92.3 97.0 35.6 (b) 62.2 12.5 4.2 21.1 83.3 95.8 25.7
Spaine (a) 73.7 9.9 0.0 16.3 83.6 100.0 33.2
(b) 42.8 5.9 0.0 51.3 94.1 100.0 25.8 Sweden
(a) 71.8 9.9 - 18.3 90.1 100.0 32.1
(b) 38.8 5.6 - 55.5 94.4 100.0 26.6
Switzerlandf (a) 67.0 25.2 6.2 1.7 92.2 98.3 29.8
(b) 59.0 23.5 9.2 8.2 82.6 91.8 23.7 UK
(a) 38.3 47.0 5.7 8.9 85.4 94.3 20.8 (b) 27.9 32.8 6.4 32.9 65.7 93.6 12.6
Journal of International Business Studies
This content downloaded from 202.114.65.236 on Mon, 15 Dec 2014 23:45:43 PMAll use subject to JSTOR Terms and Conditions

* Some macro-data on the reginalatoalisation/globalisation
debate John H Dunning et al 196
Table A4 Continued
Country 1 2 3 4 Two largest regions Three largest regions s.d.
America Brazil
(a) 49.5 38.7 9.5 2.3 88.3 97.7 22.7 (b) 39.9 36.3 13.3 10.5 76.2 89.5 15.2
Canada (a) 27.9 65.7 5.4 1.1 93.6 98.9 29.6 (b) 23.0 64.2 7.7 5.1 87.2 94.9 27.3
Mexicog (a) 24.1 65.9 3.6 6.4 90.0 96.4 28.7 (b) 17.0 52.6 4.4 26.0 78.6 95.6 20.4
US (a) 62.6 12.6 21.8 3.0 84.4 97.0 26.2 (b) 35.2 33.8 21.3 9.7 69.0 90.3 12.0
Asia Chinah
(a) 4.5 9.8 79.8 5.9 89.6 95.5 36.6 (b) 2.3 5.3 75.3 17.1 92.4 97.7 34.2
Hong Kong' (a) 18.4 55.6 23.0 3.0 78.7 97.0 22.1 (b) 13.4 44.3 29.7 12.6 74.0 87.4 15.1
Indonesiaj (a) 17.1 9.2 56.5 17.2 73.7 90.8 21.4 (b) 7.5 4.4 44.4 43.7 88.1 95.6 22.0
Japand (a) 28.4 53.6 2.0 16.1 81.9 98.0 21.9 (b) 15.0 30.8 5.3 48.9 79.8 94.7 19.1
Malaysiak (a) 15.0 6.0 71.3 7.7 86.3 94.0 31.1 (b) 7.9 3.4 65.5 23.3 88.7 96.6 28.3
Korea (a) 15.2 28.2 53.9 2.6 82.1 97.4 21.9 (b) 9.5 19.2 61.8 9.5 81.0 90.5 25.0
Singapore (a) 29.1 22.5 33.3 15.1 62.4 84.9 8.0 (b) 14.6 12.3 29.4 43.7 73.0 87.7 14.6
Taiwan (a) 12.0 35.4 47.4 5.2 82.8 94.8 19.8 (b) 7.3 23.3 51.5 18.0 74.7 92.7 18.9
Other Australiaj
(a) 33.8 32.7 15.0 18.5 66.5 85.0 9.6 (b) 14.5 15.3 11.2 59.0 74.3 88.8 22.7
New Zealandf (a) 19.5 23.5 15.4 41.7 65.2 84.6 11.6 (b) 6.1 8.0 8.3 77.6 85.9 93.9 35.1
Source: Compiled by the authors based on data supplied by UNCTAD. Notes: Regions: 1= Europe, 2=America, 3=Asia, 4=Rest of the World. (a)=Crude globalisation index (CCI); (b)=Adjusted globalisation index (AGI); s.d.=standard deviation. aOr latest year available. bBased on cumulative inward flows for 1986-1990. CBased on inward stock in 1994. dBased on inward stock in 1996. eBased on inward flows in 1992. fBased on inward stock in 1993. gBased on cumulative inward flows for 1970-1979. hBased on inward stock in 1997. 'Based on inward stock in 1998. iBased on inward stock in 1992. kBased on approval data.
Journal of International Business Studies
This content downloaded from 202.114.65.236 on Mon, 15 Dec 2014 23:45:43 PMAll use subject to JSTOR Terms and Conditions

Some macro-data on the regio the reionalisation/globalisation debate John H Dunning et al * 197
Table A5 Outward RICA: outward FDI stock by six regional clusters based on cultural characteristics, 1990 and 2002a
Home country Year 1 2 3 4 5 6 s.d.
Europe France 1990 0.84 1.70 2.09 0.50 0.14 0.77 0.74
2001 1.29 1.64 1.03 0.52 0.16 0.73 0.54
Germany 1990 0.92 2.17 1.23 1.17 0.23 0.44 0.69 2002 1.39 1.50 0.78 0.42 0.29 0.83 0.49
Ireland 2001 1.13 0.02 0.86 - - 5.40 2.10
2002 1.07 0.02 0.60 - - 4.88 1.90
Italy 1994 0.39 2.13 2.31 1.14 0.11 1.87 0.93 2002 0.61 2.14 1.73 0.45 0.03 1.44 0.82
Netherlands 1990 1.05 1.65 1.27 0.43 0.23 1.07 0.53 2001 1.18 2.00 0.82 0.56 0.24 0.81 0.61
Poland 1996 0.41 0.97 1.12 - 1.40 3.99 1.41 2000 0.58 1.18 1.02 -0.01 0.84 2.93 0.99
Spainb 1992 0.18 1.87 0.19 1.74 - 7.58 2.89 2002 0.10 1.68 0.88 7.18 0.01 1.80 2.68
Sweden 1992 0.71 0.37 3.31 - - 2.49 1.41
2002 0.86 0.64 2.79 0.24 0.08 0.85 0.98 Switzerland 1993 0.79 1.41 1.36 1.30 0.34 2.08 0.59
2002 0.94 1.23 0.85 0.51 0.48 2.25 0.65 UK 1990 1.28 0.88 1.02 0.40 0.36 1.40 0.44
2002 0.88 1.37 1.97 0.22 0.22 0.96 0.68 America Brazil 2001 0.11 0.46 0.12 1.03 0.01 11.27 4.48
2002 0.14 0.66 0.07 0.69 0.01 7.72 3.04 Canada 1990 1.84 0.23 0.28 0.56 0.28 0.95 0.62
2002 1.77 0.21 0.42 0.75 0.33 1.62 0.68 US 1990 0.91 0.86 1.35 1.72 0.59 1.69 0.47
2002 0.87 0.85 1.26 1.40 0.79 1.37 0.28 Asia Chinac 1990 1.49 0.08 0.09 0.76 0.92 2.01 0.77
2002 0.56 - 0.03 0.97 2.85 2.48 1.23
Hong Kong 1998 0.16 0.01 0.04 - 2.03 7.90 3.14 2002 0.06 - - - 2.25 5.72 2.33
Japan 1996 1.16 0.24 0.44 0.38 1.70 1.39 0.61 2002 1.63 0.32 0.56 0.40 1.01 0.78 0.49
Malaysia 1990 0.68 - 0.03 - 3.80 0.75 1.47
2002 1.01 0.18 0.18 0.02 2.41 1.65 0.97 Korea 1995 0.82 0.22 0.33 0.36 2.34 2.12 0.95
2002 0.93 0.15 0.50 0.54 2.05 1.76 0.76
Singapore 1990 0.49 - 0.35 - 2.80 3.56 1.56 2002 0.35 - 0.04 - 2.45 4.31 1.80
Taiwanc 1990 1.04 0.02 0.05 0.30 2.02 2.52 1.07 2002 0.65 - 0.05 0.06 1.33 5.08 1.97
Other Australia 1992 1.62 0.06 0.10 - 0.89 1.77 0.81
2002 2.19 0.07 0.14 0.15 0.20 1.34 0.88 New Zealand 1993 2.27 - -1.26 - 0.25 3.35 1.74
2002 1.89 - 0.03 - 0.26 2.60 1.15 South Africa 2001 0.98 2.33 1.08 - 0.08 1.11 0.85
2002 1.04 2.31 1.12 - 0.12 0.85 0.83
Source: Compiled by the authors based on data supplied by UNCTAD. Notes: Regional clusters are as follows: 1 =Anglo; 2=Latin European; 3=Nordic and Germanic; 4=Latin American; 5=Far Eastern; 6=Other. For details, see appendix. s.d.=standard deviation. The regions of the home countries are in bold. Data for Indonesia and Mexico are not available. aOr latest year available. bData for 1992 are based on outward flows. Data for 2002 are based on cumulative flows for 1992-2002. CBased on approval data.
Journal of International Business Studies
This content downloaded from 202.114.65.236 on Mon, 15 Dec 2014 23:45:43 PMAll use subject to JSTOR Terms and Conditions

* Some macro-data on the regilonalisation/globalisation debate John H Dunning et al 198
Table A6 Inward RICA: inward FDI stock by six regional clusters based on cultural characteristics, 1990 and 2002a
Host country Year 1 2 3 4 5 6 s.d.
Europe France 1990 0.80 1.09 1.70 0.03 0.23 4.19 1.52
2001 0.71 1.30 1.87 0.02 0.14 0.75 0.70 Germany 1990 0.83 0.89 1.73 0.12 0.54 1.57 0.61
2002 0.63 1.60 1.70 0.02 0.30 0.99 0.68 Irelandb 1990 1.47 0.50 0.72 - 0.52 1.34 0.56
2002 0.78 0.50 1.77 - - 5.74 2.19
Italy 1994 0.57 1.83 1.75 0.07 0.14 4.84 1.79 2002 0.57 1.61 1.65 0.10 0.17 2.62 1.00
Netherlands 1990 0.91 1.15 1.09 -0.02 0.34 8.50 3.22 2001 0.99 1.41 0.96 0.06 0.34 2.14 0.75
Poland 1996 0.41 1.40 2.37 0.02 0.08 4.48 1.74 2000 0.32 1.25 2.49 0.02 0.04 2.55 1.18
Spainc 1990 0.31 2.50 1.04 0.25 - 17.90 7.03 2002 0.41 1.60 1.04 1.09 - 9.85 3.73
Sweden 1992 0.40 0.89 2.95 - - 1.26 1.11 2002 0.79 0.57 2.23 - - 1.76 0.92
Switzerland 1993 0.64 2.34 1.35 - 0.45 2.00 0.92 2002 0.98 1.05 1.53 - 0.06 1.09 0.62
UK 1990 1.17 0.74 1.21 - 0.42 1.91 0.67 2002 1.02 0.93 1.31 - 0.44 1.37 0.53
America Brazil 1990 0.89 0.96 1.27 0.06 0.69 4.84 1.71
2000 0.62 1.58 0.90 0.73 0.26 7.1 3 2.61 Canada 1990 1.70 0.29 0.46 0.04 0.38 1.43 0.68
2002 1.65 0.69 0.42 0.26 0.35 0.50 0.51 Mexicod 1990 1.63 0.07 0.62 -0.02 0.27 3.91 1.51
2002 1.47 0.19 0.57 0.05 0.38 4.83 1.82 US 1990 0.75 0.54 1.31 0.17 1.62 3.52 1.20
2002 0.62 1.13 1.49 0.67 1.01 2.37 0.65 Asia China 1997 0.25 0.07 0.05 - 5.56 6.39 3.05
2002 0.27 0.12 0.14 - 5.87 5.08 2.77 Hong Kong 1998 0.35 0.06 0.37 - 1.63 32.09 12.92
2002 0.25 - 0.35 - 2.67 1 7.04 6.77 Indonesia 1992 0.29 0.67 0.26 - 3.92 11.27 4.43
1996 0.44 0.20 0.33 - 4.39 6.47 2.76 Japan 1996 1.34 0.12 0.70 - 0.14 11.49 4.53
2002 1.20 0.96 0.96 0.01 0.38 1.46 0.54 Malaysiae 1990 0.26 0.20 0.30 - 5.03 6.20 2.83
2002 0.89 0.06 0.29 0.01 3.20 5.44 2.21 Korea 1990 0.66 0.14 0.43 - 3.95 2.27 1.56
2002 0.50 0.30 1.31 - 1.54 8.55 3.25 Singapore 1990 0.88 - 0.60 - 2.43 7.54 2.90
2002 0.70 - 0.87 - 2.00 9.00 3.46 Taiwanf 1990 0.70 0.05 0.30 - 3.47 7.86 3.13
2002 0.68 0.03 0.31 - 3.29 8.32 3.29
Other Australia 1992 1.31 0.14 0.34 - 1.09 9.28 3.59
2002 1.26 0.22 0.56 - 0.92 5.84 2.19 New Zealand 1993 1.65 0.04 0.16 - 1.13 2.82 1.13
2002 1.45 - 0.60 - 0.82 4.46 1.68
Source: Compiled by the authors based on data supplied by UNCTAD. Notes: Regional clusters are as follows: 1=Anglo; 2=Latin European; 3=Nordic and Germanic; 4=Latin American; 5=Far Eastern; 6=Other. For details, see appendix. s.d.=standard deviation. The regions of the host countries are in bold. Data for Mexico are not available. aOr latest year available. bData for 1990 are based on cumulative inward flows for 1986-1990. CData for 1990 are based on inward flows in 1992. Data for 2002 are based on cumulative inward flows for 1992-2002. dData for 1990 are based on cumulative inward flows for 1970-1979. Data for 2002 are based on cumulative inward flows for 1970-1979 and 1994- 2002. eData for 1990 are based on approval data. Data for 2002 are based on cumulative inward flows for 1991-2002. 'Based on approval data.
journal of International Business Studies
This content downloaded from 202.114.65.236 on Mon, 15 Dec 2014 23:45:43 PMAll use subject to JSTOR Terms and Conditions

Some macro-data on the regionalisation/globalisation debate John H Dunning et al/ 199
Appendix B: Regional clusters used in Tables A5 and A633
(1) Anglo: Australia, Canada, Ireland, New Zeal- and, South Africa, US, UK. (2) Latin European: Belgium, France, Italy, Portu- gal, Spain. (3) Nordic and Germanic: Austria, Denmark, Finland, Germany, Netherlands, Norway, Sweden, Switzerland. (4) Latin American: Argentina, Brazil, Chile, Colombia, Mexico, Peru, Venezuela. (5) Far Eastern: China, Hong Kong, India, Indo- nesia, Japan, Korea, Malaysia, Philippines, Singa- pore, Taiwan, Thailand. (6) Other (all the rest).
About the authors John H Dunning is Emeritus Esmee Fairbairn Professor International Investment and Business Studies at the University of Reading and Emeritus State of New Jersey Professor of International Business at Rutgers University. For more than 50 years his main research interests have been in the
area of international direct investment and multi- national enterprises. His latest book (jointly with Sarianna Lundan) is Multinational Enterprises and the Global Economy, and is to be published by Edward Elgar in the summer of 2007.
Masataka Fujita is Chief of the Investment Trend Section in UNCTAD at Geneva. His main interests are the analysis of trends in FDI, and the compila- tion of data on the structure and significance of TNCs in the global economy.
Nevena Yakova received her PhD from Rutgers University in 2004. The title of her dissertation was Foreign Direct Investment and Structural Change: a Study of Central and Eastern European Economy. She also contributed an article to JIBS Vol. 37(21), 2006 on standardization preferences, culture, work interdependence and local embeddedness. Her research interests focus on foreign direct investment, economic development and the transi- tion economies.
Accepted by Arie Y Lewin, Editor-in-Chief, 14 April 2006. This paper has been with the authors for three revisions.
journal of International Business Studies
This content downloaded from 202.114.65.236 on Mon, 15 Dec 2014 23:45:43 PMAll use subject to JSTOR Terms and Conditions