sonic automotive, inc. analyst report
TRANSCRIPT
2016 CFA Institute Research Challenge SAH
1
Appalachian State University Student Research
SONIC AUTOMOTIVE, INC. (SAH) Industry: Large Dealership Groups in the US
HIGHLIGHTS One Sonic-One Experience (OSOE) & EchoPark - SAH’s risky and capital intensive projects, OSOE and EchoPark,
will not provide the competitive advantage that the company currently lacks. Both of SAH’s initiatives have a long
timeline for completion, and we do not have faith that current management will stay on schedule due to their record of
delays and missed earnings. To date, these initiatives have not shown definitive evidence of profitability and we believe
SAH will have continued difficulty implementing these strategies because of delays, stiff competition, and weak brand
power.
Cyclicality of Industry - SAH is vulnerable to an economic downturn due to the cyclical nature of automotive sales,
expense burdens from key initiatives, and their performance during the last recession. Based on historic trends in the
industry, a slowdown of automotive sales is likely in the near future. Since beginning development of EchoPark and
OSOE the industry has been recovering from a downturn in automotive sales caused by the Great Recession. Since then,
record high industry-wide sales have helped offset the negative near-term effects of SAH’s high capital expenditures.
We believe that when the next industry slowdown occurs, the reductions in automotive sales and large depreciation
charges will have a compounding impact that will cause a significant reduction in EPS.
Valuation - We believe SAH is a SELL with a target price of $18.19. This provides a -1.12% total price reduction from
the January 22, 2016 closing price of $18.40. Our target price was calculated using an equal weighting of discounted
cash flow and P/E valuation metrics.
($ in 000s) 2012A 2013A 2014A 2015E 2016E 2017E 2018E 2019E 2020E
Revenue 8,365,468 8,843,168 9,197,099 9,655,493 9,919,062 10,193,298 10,481,377 10,802,199 11,127,415
EBIT 240,402 234,603 233,613 215,904 245,483 262,883 280,481 290,527 306,296
Net Income 89,101 81,618 97,217 85,859 100,902 100,116 102,795 104,452 112,272
EPS 1.48 1.54 1.85 1.71 2.08 2.12 2.20 2.24 2.41
Dividends 0.10 0.10 0.10 0.11 0.15 0.14 0.15 0.15 0.16
Return on
Assets (%) 3.21 2.67 3.05 2.61 2.91 2.77 2.73 2.68 2.79
Return on
Equity (%) 16.92 13.30 14.58 12.34 13.39 12.26 11.50 10.52 10.16
-
Recommendation
Price as of
1/22/2016
12 Month Price
Target
Price
Reduction
SELL $18.40 $18.19 -1.12%
This report is published for
educational purposes only by
students competing in the CFA
Institute Research Challenge.
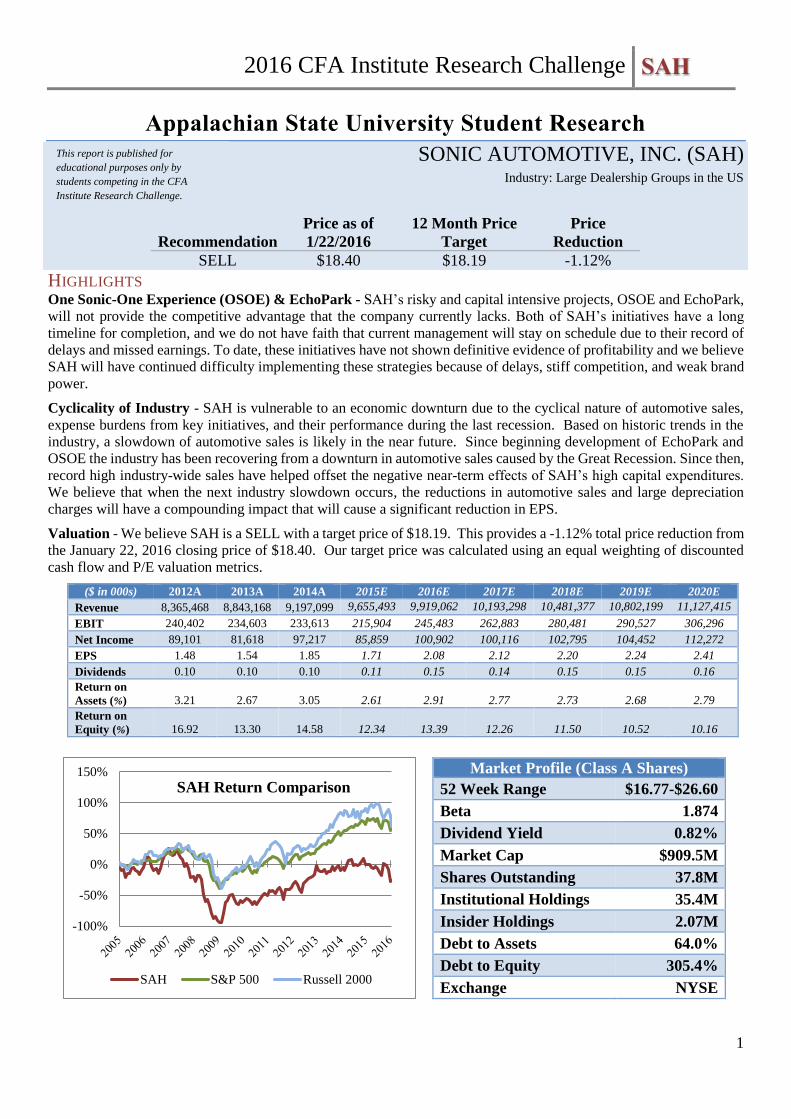
-100%
-50%
0%
50%
100%
150%
SAH S&P 500 Russell 2000
Market Profile (Class A Shares)
52 Week Range $16.77-$26.60
Beta 1.874
Dividend Yield 0.82%
Market Cap $909.5M
Shares Outstanding 37.8M
Institutional Holdings 35.4M
Insider Holdings 2.07M
Debt to Assets 64.0%
Debt to Equity 305.4%
Exchange NYSE
SAH Return Comparison

2016 CFA Institute Research Challenge SAH
2
BUSINESS DESCRIPTION Sonic Automotive, Inc. (SAH) was founded in 1997 and is headquartered in
Charlotte, NC. SAH is the fifth largest automotive retailer in the United States
offering a wide range of products including new and used vehicles, parts and
repair services, and the sale of finance and insurance products. The company
operates in the United States primarily in the Southeast, the Midwest, and
California (Appendix C: Store Distribution). SAH operates 117 franchised
dealerships in 13 states, sells 25 different brands of vehicles, and operates three
stand-alone used car dealerships called EchoPark.
Corporate Strategy
SAH has historically only operated standard franchised dealerships that are
primarily focused on selling new cars. Moving forward SAH plans to introduce
a more consumer-centric buying experience, improve brand awareness, increase
technological prominence, and shift more focus to used vehicle sales. These
goals are exemplified in SAH’s OSOE and EchoPark initiatives. We believe that
the implementation of these strategies will not benefit SAH for the next few years
because we are doubtful that the initiatives will stay on schedule. This will put
SAH further behind and keep their net profit margin trailing the industry as it has
since 2008 (Figure 1).
One Sonic-One Experience
OSOE is the name of SAH’s plan to focus on customer experience with a
technology driven, no-hassle process. The traditional dealership model is
notorious for high-pressure sales from commissioned associates, lengthy
transaction times, and a negotiation process that is often unpleasant for
customers. In contrast, OSOE aims to provide a consumer-centric experience,
offering reduced transaction times, more transparency in all phases of the buying
process, and a no-haggle pricing system. All of this is accomplished by offering
a fair and non-negotiable price, reducing paperwork, and having one associate
complete the entire transaction at the customer’s desired pace. The initiative
began in response to a more informed consumer and is similar to CarMax’s
(KMX) transaction process. The original plan of implementation was far too
aggressive. SAH tried to move forward in one massive effort, putting in a
completely different customer relationship management system and new
technology platforms. The push was too much change for dealerships to bear all
at once and thus, initial results were unsuccessful. Now, SAH plans to roll out
the initiative in three separate phases after using their five Charlotte dealerships
as a test market. Results provided by management indicate improved market
share for each of these dealerships, but no information about the profitability of
OSOE has been released to shareholders. After implementation of all three
phases, each of their dealerships will be armed with an efficient pricing tool,
finance and insurance tool, new customer relationship management process,
appraisal tool, and a centralized inventory management system (Appendix D:
OSOE – Phased Rollout). Starting Q1 2016, phase one will be put in place at the
remaining dealerships and full integration is scheduled to occur by 2018.
EchoPark
EchoPark, SAH’s stand-alone used car dealership model was introduced in
Denver, Colorado with three dealerships during Q4 2014. Through their first
year of operations revenue growth was promising, but they have yet to generate
positive net income (Figure 2). EchoPark stores are still in their beginning
stages, and there is not enough financial evidence to support definitively saying
that they will be successful with further expansion. The overall EchoPark
initiative is similar to KMX and Asbury Automotive Group’s (ABG) models
where customers can buy, sell, and service their used cars in one location. SAH
Source: Sonic Automotive
Figure 1:
Net Profit Margin (%)
Source: Bloomberg
Figure 2: EchoPark Revenues
and Net Income ($ in millions)
Source: Company Filings
(10)
(8)
(6)
(4)
(2)
0
2
4
'06 '08 '10 '12 '14
Competitor Average
SAH US
(10)
(5)
-
5
10
15
20
25
Q1
'14
Q2
'14
Q3
'14
Q4
'14
Q1
'15
Q2
'15
Q3
'15
EchoPark Net Loss
EchoPark Revenue

2016 CFA Institute Research Challenge SAH
3
plans to utilize a hub-and-spoke model when constructing EchoPark stores. They
will first establish a large centralized hub dealership, and then surround the hub
with smaller locations. The hub dealerships will maintain an inventory level of
over 500 vehicles while the surrounding locations will have approximately 100.
In addition, EchoPark fully incorporates all aspects of OSOE and provides the
same level of customer service. The centralized inventory management system
from OSOE is particularly important to EchoPark. This system allows the
smaller neighborhood dealerships to draw inventory from a larger base, while
maintaining a lower cost structure. We believe EchoPark is a risky investment
because other companies have tried to copy KMX’s model in the past with little
success, one of them being AutoNation (AN), a leading industry operator.
Segments of Operation
New Vehicles
As of FY 2014, new vehicle sales accounted for 56.7% of total revenue and had
a gross profit margin of 5.6%. Across their franchised dealerships, SAH sells 25
different brands with an emphasis on luxury and mid-line imports (Figure 3). In
the most recent year, 56.1% of total new vehicle revenue came from luxury and
31.1% from mid-line imports.
Used Vehicles
SAH acquires used vehicles through wholesale auctions and trade-ins. In FY
2014, used vehicle sales accounted for 25.6% of total revenue and had a gross
profit margin of 6.8%. Along with many of their competitors, SAH is moving
toward a more transparent buying process for used vehicles where customers are
presented with a detailed breakdown of each product offering. The goal of this
process is to guide the customer to a purchase by providing them with pertinent
information, rather than the traditional method of simply pushing a sale. The shift
to more used sales is seen primarily in their new EchoPark stores, and should
also be helped by OSOE.
Wholesale Vehicles
Vehicles that SAH cannot retail to consumers are sold at wholesale auctions.
Typically, these cars are lesser quality and hold less value than retail
automobiles. In the most recent year, wholesale vehicles provided 1.8% of total
revenue and had a gross profit margin of -2.2%. Over the last two years
wholesale vehicle revenue has decreased by 9.4% as part of a strategic move to
retail a larger percentage of trade-in vehicles.
Fixed Operations
Fixed operations is comprised of parts and service orders, warranty repairs,
wholesale parts, and collision repairs. Customer pay repairs make up 43.6% of
fixed operations revenue and 48.1% of its profit. Total revenue from fixed
operations has increased by more than 5% for the past two years. In 2014, fixed
operations made up the largest percent of SAH’s gross profit (Figure 4).
Finance, Insurance, and Other Aftermarket Products
Finance, Insurance, and Other Aftermarket Products (F&I) is a high profit margin
area for automotive dealerships. SAH does not have a captive finance arm and
therefore they generate revenue on a commission basis for bank and insurance
company originations. Management wants to grow this area aggressively
because all F&I revenue translates directly to gross profit (Figure 5) and related
expenses fall under SG&A. For the year ended Dec. 31, 2014, F&I constituted
3.3% of total revenue.
Figure 3:
SAH New Car Revenue by
Brand 2014
Source: Company Filings
Figure 4: SAH Revenue and
Gross Profit 2014 by Segment*
*Wholesale included in Used Vehicles
Source: Company Filings
Figure 5:
2014 Gross Profit Margins (%)
Segment Margin
New 5.6
Used 6.8
Wholesale (2.2)
Fixed Ops. 48.1
F&I 100.0
Source: Company Filings
BMW
22%
Honda
15%
Toyota
10%
Mercedes
10%
Ford
7%
GM
6%Lexus
5% Audi
5%
Other
20%
56.7
21.1
25.6
11.5
14.4
45.5
3.3
21.9
0%
10%
20%
30%
40%
50%
60%
70%
80%
90%
100%
Revenue Gross Profit
New Vehicles Used Vehicles
P&S F&I

2016 CFA Institute Research Challenge SAH
4
MANAGEMENT & GOVERNANCE B. Scott Smith is the co-founder of SAH along with his father, O. Bruton Smith,
and currently serves as CEO, President, and a Director. Bruton Smith is the
Executive Chairman and a Director for SAH. The Smith family and related
entities currently hold 76.8% of all voting rights. Bruton Smith’s age, 88, is
reason for concern, because he has been a major figure since its inception
(Appendix E: Corporate Governance).
The key executives in SAH have all been with the company for at least eight
years. During this same time period management has missed earnings projections
17 times (Appendix F: Missed Earnings). These letdowns combined with the
slow progress of OSOE leave us with the impression that management of SAH
is underperforming, and the family’s control of voting makes changes unlikely.
INDUSTRY OVERVIEW Large Dealership Groups in the US The industry has grown significantly, with a 13% five-year compound growth
rate in aggregate revenue (Figure 6). Automotive sales have recently benefitted
from low interest rates, low oil prices, and higher consumer confidence. Industry
performance is closely tied to consumer activity and as a result, profits are
vulnerable.
Increasing Importance of Technological Reach
According to the 2015 Automotive Buyer Influence Study conducted by Polk
and Autotrader.com, 76% of consumers for both new and used vehicles used the
internet to shop. This is an increase from 75% in 2013 and 71% in 2011. Due
to consumer reliance on the internet, we believe an online presence is a key
success trait. Before customers visit a dealership, they prefer to shop online and
gather the information they need for a purchase. Having a strong online selling
tool reaches customers first and can be an important factor for consumers in
determining which dealership they will visit. We believe the EchoPark website
is effective, although SAH’s main website pales in comparison to the most
successful industry operators such as KMX and AN (Appendix G: Internet
Presence). This allows competitors to gain a distinct advantage in establishing
connectivity with the consumer.
Susceptibility to Economic Downturn
Historically, large dealership groups in the US have performed poorly in
economic downturns. From 2007 to 2008, the industry saw an average decline
in revenue of -17.3% (Appendix H: Revenue by Company) and posted an
average net profit margin of -5.9%. SAH’s revenue declined -22.9% and their
net profit margin fell to -9.9%. The only company to sustain positive net profit
margins in 2008 was KMX at 2.2% (Appendix I: Historical Net Profit Margins)
and this is because KMX is the only large dealership group that has always made
the majority of their revenue with used vehicles. This demonstrates the
cyclicality of the industry and how new vehicle sales are more prone to
weakening economic conditions than used cars. In 2008, 58.0% of SAH’s
revenue came from new vehicles and for the year ended Dec. 31, 2014, 56.7%
was from new vehicles. With a majority of their revenue still being generated by
new vehicle sales, we believe their earnings and the timeline for implementation
of their initiatives are at risk in the event of a downturn.
Surging Off-Lease Supply Creates Gap Between New and Used
Recent conditions in the automotive retailing market have supported demand
for leasing new vehicles. High valuations for used vehicles (Figure 7) and
record high new vehicle transaction prices have led consumers to seek more
affordable solutions. Based on the current environment, favorable leasing
Figure 6:
Industry Revenues 1997-2014
($ in billions)
Source: Bloomberg
Figure 7: Manheim Used
Vehicle Value Index
Source: Manheim Consulting
0
5
10
15
20
25
199
7
199
9
200
1
200
3
200
5
200
7
200
9
201
1
201
3
SAH
AN
KMX
Others (Average)
116.1
113.5
110.2
98
117.5
124.4
125.1124.1
121.7
123.9
125.7
80
85
90
95
100
105
110
115
120
125
130
200
5
200
6
200
7
200
8
200
9
201
0
201
1
201
2
201
3
201
4
201
5

2016 CFA Institute Research Challenge SAH
5
conditions have provided them with that affordable option. The combination of
low interest rates and higher residual values has reduced lease payments and
has made leasing an attractive alternative to purchasing a new or used vehicle,
which are both priced higher than they have been previously. Consumer
preference for leasing is reflected by increases in average annual lease
penetration rates for the past five years, rising from 21.4% in 2010 to 28.6% in
2015 (Figure 8). Over the next several years, the spike in leasing activity
should provide the used car market with an increasing amount of high quality,
late-model used vehicles as leases mature. As the used car market is flooded
with the increased supply from maturing leases, used vehicle pricing should
decline. In turn, this makes used cars more affordable relative to new vehicles
and lowers residual values that have been supporting lower lease payments.
We believe elevated amounts of leasing activity have propped up new vehicle
sales. As leasing becomes less attractive due to lower residual values, and new
vehicles become less attractive because used vehicles become cheaper, we
believe performance in the used vehicle market is set to outpace that of the new
vehicle market. We believe this will put top-line pressure on dealership groups,
including SAH, which gain a majority of their revenue from new vehicles.
Competitive Positioning
This industry is highly competitive, primarily due to low switching costs and the
bargaining power of consumers. Thus, sustainable competitive advantages are
hard to come by. Dealership groups can outperform others through proper
management of brand mix, minimizing operating expenses, improving scale
through acquisitions of smaller dealerships, and by offering a unique experience
that surpasses what’s expected at a traditional dealership. We do not believe
SAH currently has a sustainable competitive advantage, and do not see OSOE
and EchoPark as viable ways to create one. These approaches, while effective
in theory are not truly unique, and when combined with sluggish execution,
minimize the advantage SAH could gain over competitors.
AutoNation
AutoNation (AN) is the largest of all seven dealership groups in the US, with
$19B in revenue in 2014 (Figure 9). In 2013, AN underwent extensive re-
branding where all of their franchises, except for luxury dealerships, were rid of
their local dealer name and replaced with only the AutoNation moniker (Figure
10). We believe this has provided them with an advantage over most other
franchised dealerships in the US due to the benefits of a unified brand. A unified
brand benefits them because customers can associate the positive experiences
they have with a single name instead of a particular dealer location. Furthermore,
brand association increases the effectiveness of online operations by giving
customers a specific company to search for. Recently, they introduced
“AutoNation Express,” which allows a consumer to shop and nearly complete
trade-in transactions online. They are ahead of SAH in terms of online
interaction, brand presence, and scale. We believe SAH’s move to sub-brand
their dealerships will not have the same positive impact as AN has had with
completely rebranding their stores. In addition, the online presence of AN will
continue to grow and SAH will fall further behind if they do not overhaul their
online experience.
CarMax
CarMax (KMX) is a dealership group unlike any other with which SAH
competes. While other major dealership groups gain a majority of their revenue
from new vehicle sales, KMX gained approximately 96% of revenue from used
vehicles in FY 2014, including wholesale. The combination of stand-alone used
car dealerships and quality customer service differentiates them from
Figure 8: Lease Penetration
Rates (%)
Source: Bloomberg
Figure 9: Market Share
Source: Company Filings
Figure 10: AN Branding
Pictured: AutoNation Chrysler Dodge
Jeep Ram, Roseville, CA
Source: www.kbb.com
Figure 11: CarMax Branding
Pictured: CarMax, Hickory, NC
Source: www.yelp.com
21.4
22.1
22.2
25.8
27.0
28.6
20
22
24
26
28
30
2010 2011 2012 2013 2014 2015
AN
23%
PAG
21%
GPI
12%
SAH
11%
ABG
8% LAD
7%
KMX
18%
2016 CFA Institute Research Challenge SAH
6
competitors and has proven to be a successful model in the past. We believe
SAH has based EchoPark and OSOE on KMX’s successful business model.
They have an advantage over SAH because they are the innovator of the industry
and have been operating their dealerships in this manner since 1993, cultivating
a strong brand presence (Figure 11). KMX has over 150 locations established
and is planning to open between 13-16 stores per year through at least 2017. This
is a strong headwind to EchoPark’s growth because KMX operates in many of
the same locations EchoPark should seek out.
Other Competition
In addition to AN and KMX, SAH also faces competition from Asbury
Automotive Group (ABG), Penske Automotive Group (PAG), Lithia Motors
(LAD), and Group 1 Automotive (GPI). However, due to ABG’s smaller size,
PAG’s much heavier focus on luxury/import, LAD’s niche in rural markets, and
GPI’s pursuit of international sales and largely undifferentiated dealerships, we
believe KMX and AN pose the largest threats to SAH’s future success. SAH is
also impacted by independent service shops, smaller franchised dealers, and
internet-based used vehicle retailers.
INVESTMENT SUMMARY We issue a SELL recommendation on Sonic Automotive, Inc. with a target price
of $18.19. This demonstrates a -1.12% price reduction from the January 22, 2016
closing price of $18.40.
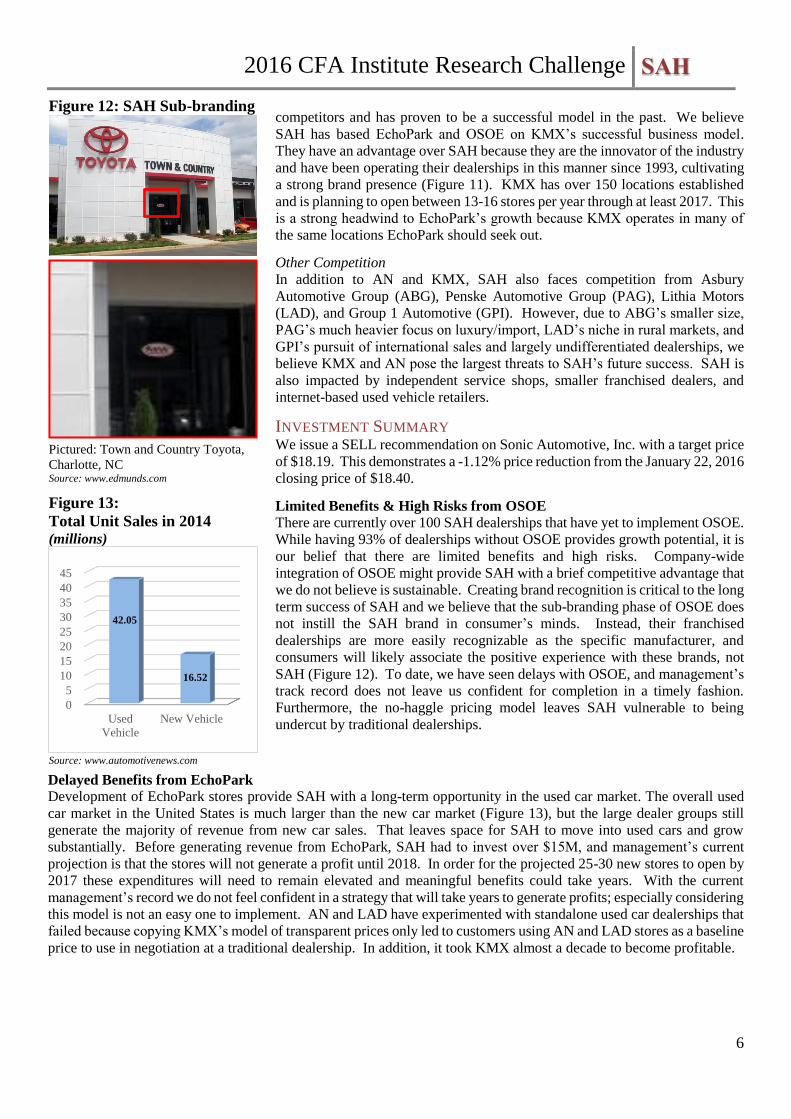
Limited Benefits & High Risks from OSOE There are currently over 100 SAH dealerships that have yet to implement OSOE.
While having 93% of dealerships without OSOE provides growth potential, it is
our belief that there are limited benefits and high risks. Company-wide
integration of OSOE might provide SAH with a brief competitive advantage that
we do not believe is sustainable. Creating brand recognition is critical to the long
term success of SAH and we believe that the sub-branding phase of OSOE does
not instill the SAH brand in consumer’s minds. Instead, their franchised
dealerships are more easily recognizable as the specific manufacturer, and
consumers will likely associate the positive experience with these brands, not
SAH (Figure 12). To date, we have seen delays with OSOE, and management’s
track record does not leave us confident for completion in a timely fashion.
Furthermore, the no-haggle pricing model leaves SAH vulnerable to being
undercut by traditional dealerships.
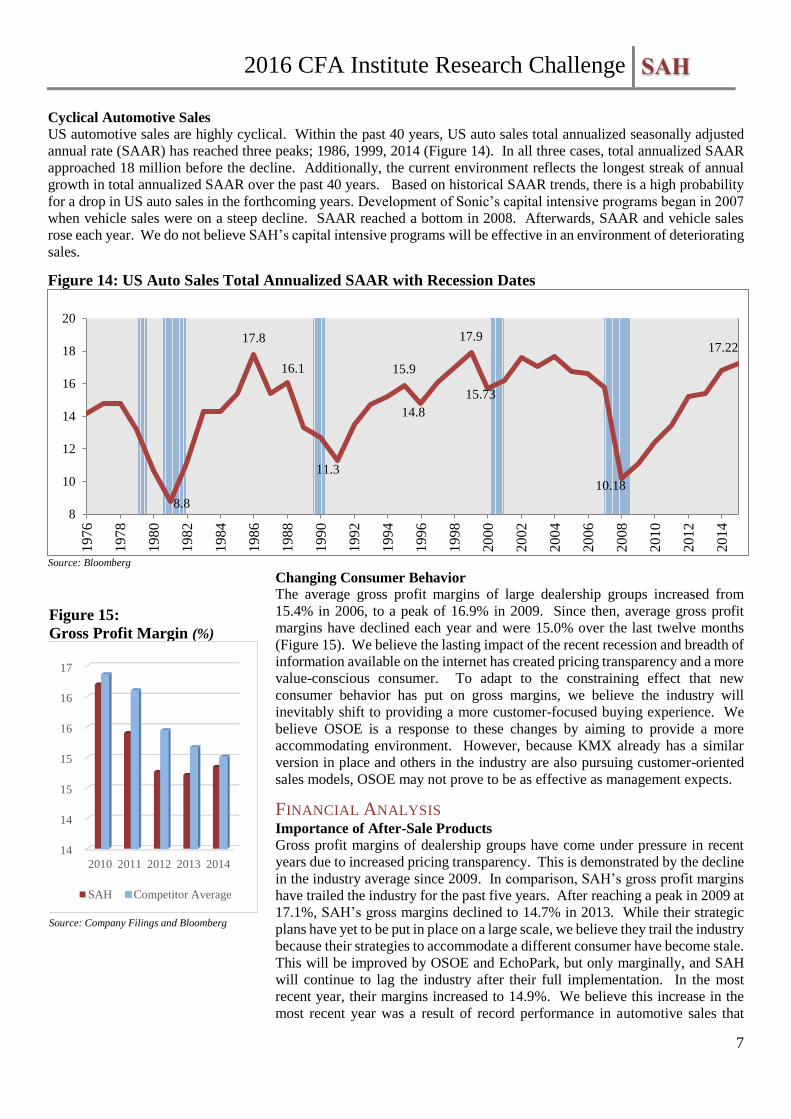
Delayed Benefits from EchoPark
Development of EchoPark stores provide SAH with a long-term opportunity in the used car market. The overall used
car market in the United States is much larger than the new car market (Figure 13), but the large dealer groups still
generate the majority of revenue from new car sales. That leaves space for SAH to move into used cars and grow
substantially. Before generating revenue from EchoPark, SAH had to invest over $15M, and management’s current
projection is that the stores will not generate a profit until 2018. In order for the projected 25-30 new stores to open by
2017 these expenditures will need to remain elevated and meaningful benefits could take years. With the current
management’s record we do not feel confident in a strategy that will take years to generate profits; especially considering
this model is not an easy one to implement. AN and LAD have experimented with standalone used car dealerships that
failed because copying KMX’s model of transparent prices only led to customers using AN and LAD stores as a baseline
price to use in negotiation at a traditional dealership. In addition, it took KMX almost a decade to become profitable.
Figure 12: SAH Sub-branding
Pictured: Town and Country Toyota,
Charlotte, NC Source: www.edmunds.com
Figure 13:
Total Unit Sales in 2014 (millions)
Source: www.automotivenews.com
0
5
10
15
20
25
30
35
40
45
Used
Vehicle
New Vehicle
42.05
16.52
2016 CFA Institute Research Challenge SAH
7
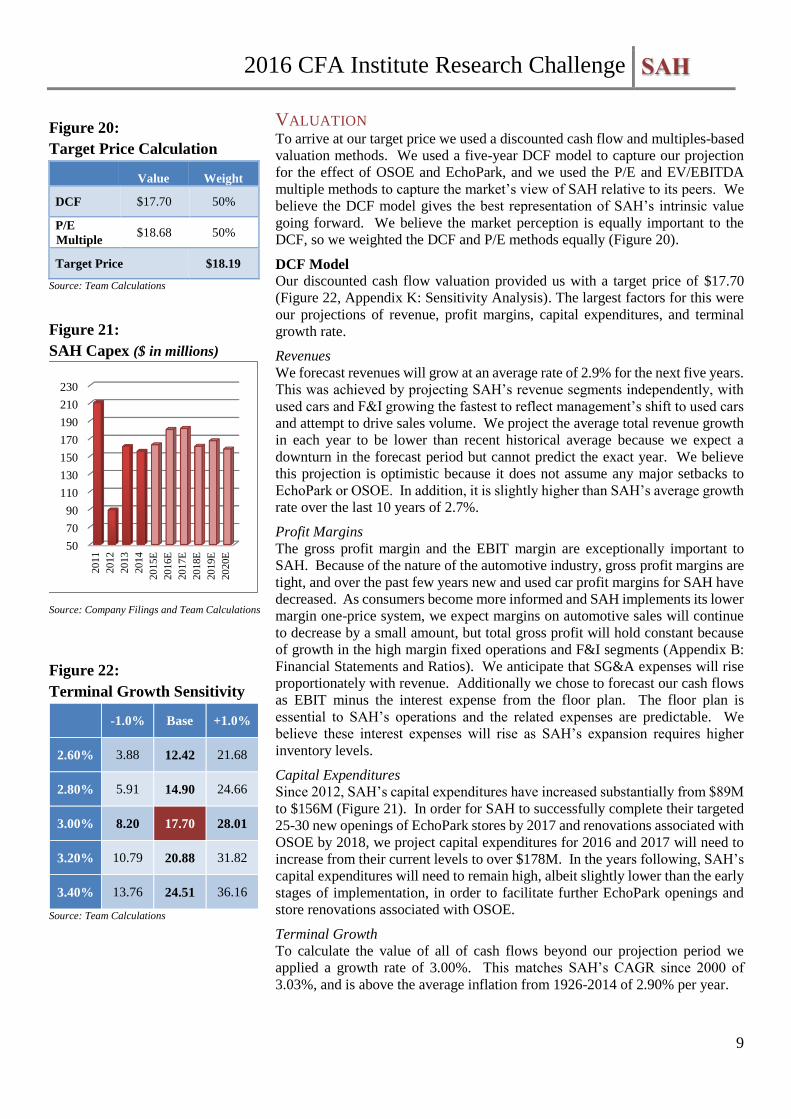
Cyclical Automotive Sales
US automotive sales are highly cyclical. Within the past 40 years, US auto sales total annualized seasonally adjusted
annual rate (SAAR) has reached three peaks; 1986, 1999, 2014 (Figure 14). In all three cases, total annualized SAAR
approached 18 million before the decline. Additionally, the current environment reflects the longest streak of annual
growth in total annualized SAAR over the past 40 years. Based on historical SAAR trends, there is a high probability
for a drop in US auto sales in the forthcoming years. Development of Sonic’s capital intensive programs began in 2007
when vehicle sales were on a steep decline. SAAR reached a bottom in 2008. Afterwards, SAAR and vehicle sales
rose each year. We do not believe SAH’s capital intensive programs will be effective in an environment of deteriorating
sales.
Figure 14: US Auto Sales Total Annualized SAAR with Recession Dates
Source: Bloomberg
Changing Consumer Behavior
The average gross profit margins of large dealership groups increased from
15.4% in 2006, to a peak of 16.9% in 2009. Since then, average gross profit
margins have declined each year and were 15.0% over the last twelve months
(Figure 15). We believe the lasting impact of the recent recession and breadth of
information available on the internet has created pricing transparency and a more
value-conscious consumer. To adapt to the constraining effect that new
consumer behavior has put on gross margins, we believe the industry will
inevitably shift to providing a more customer-focused buying experience. We
believe OSOE is a response to these changes by aiming to provide a more
accommodating environment. However, because KMX already has a similar
version in place and others in the industry are also pursuing customer-oriented
sales models, OSOE may not prove to be as effective as management expects.
FINANCIAL ANALYSIS Importance of After-Sale Products
Gross profit margins of dealership groups have come under pressure in recent
years due to increased pricing transparency. This is demonstrated by the decline
in the industry average since 2009. In comparison, SAH’s gross profit margins
have trailed the industry for the past five years. After reaching a peak in 2009 at
17.1%, SAH’s gross margins declined to 14.7% in 2013. While their strategic
plans have yet to be put in place on a large scale, we believe they trail the industry
because their strategies to accommodate a different consumer have become stale.
This will be improved by OSOE and EchoPark, but only marginally, and SAH
will continue to lag the industry after their full implementation. In the most
recent year, their margins increased to 14.9%. We believe this increase in the
most recent year was a result of record performance in automotive sales that
8.8
17.8
16.1
11.3
15.9
14.8
17.9
15.73
10.18
17.22
8
10
12
14
16
18
20
1976
1978
1980
1982
1984
1986
1988
1990
1992
1994
1996
1998
2000
2002
2004
2006
2008
2010
2012
2014
Figure 15:
Gross Profit Margin (%)
Source: Company Filings and Bloomberg
14
14
15
15
16
16
17
2010 2011 2012 2013 2014
SAH Competitor Average

2016 CFA Institute Research Challenge SAH
8
drove 10.2% growth in their highest margin segment, F&I, rather than internal
strength. Because we are forecasting solid performance for vehicle sales in 2016,
we believe that continued growth in front-end sales will drive growth in after-
sales products, thus benefitting gross profit.
Asset Management and Profitability
Over the past five years, SAH has managed assets more efficiently than
competitors, as shown by their total asset turnover (Figure 16) and days inventory
outstanding ratios (Figure 17). However, they have been unable to translate this
effective asset management into profit growth. In 2014, SAH’s return on assets
of 3.1% lags far behind the industry average of 4.4% (Figure 18). We believe
there are two primary factors responsible for their reduced profitability, those
being a lack of an established competitive advantage and relatively high SG&A
expenses attributed to development of strategic initiatives. Since the recession,
SAH’s performance, along with the rest of the industry, has been boosted by a
continuous surge in automotive sales. In particular, we believe industry strength
has allowed SAH to pursue expensive initiatives designed to benefit them in the
future while not currently having a significant competitive advantage over
competitors. As we do not see strength of the same magnitude in automotive
sales over the next several years based on historical cyclicality, SAH’s inability
to generate profitability despite having efficient asset management poses some
concern. In the absence of strong revenues, high SG&A expenses could have a
larger impact on earnings, especially if OSOE and EchoPark do not pan out as
expected.
Capital Management
SAH’s return on invested capital for 2014 was 5.3%, which is below their WACC
of 6.2%. This difference demonstrates unproductive uses of capital and indicates
their need for OSOE and EchoPark to generate future returns. Their current
ROIC trails the industry average of 6.5% (Figure 19). We believe this is because
they have spent significant time and capital developing new initiatives that have
yet to come to fruition. We believe they lack any competitive advantages, and
as a result, ROIC will continue to lag behind the industry.
Leverage SAH’s largest sources of debt are their floor plan arrangements used to finance
90% of their inventory and current bond issuances of $500M outstanding with a
credit rating of BB. Since 2012, their total debt ratio has declined from 81.0%
to 79.1%, and is slightly above the industry average of 77.1%. Because high
levels of debt are common throughout the industry due to the reliance on
floorplan financing and other short term borrowings as sources of liquidity,
SAH’s level of debt is not a concern. In addition, as we do not foresee any
additional long-term debt borrowings, we believe this declining trend in long-
term debt will continue.
Liquidity SAH’s quick ratio of 0.23x is slightly above the industry average of 0.22x.
These low levels of liquidity are characteristic of large dealership groups due to
the large dependence on floor plan financing to cover most of their fixed costs
and short-term borrowings for a supplemental source. As SAH rolls out their
new initiatives, we forecast their quick ratio to remain relatively flat going
forward. We expect a minor decline as execution of new initiatives weighs on
their liquidity situation; however, we do not believe it is enough to represent a
concern.
Figure 16:
Return on Assets (%)
Source: Bloomberg and Company Filings
Figure 17:
Total Asset Turnover
Source: Bloomberg and Company Filings
Figure 18:
Days Inventory Outstanding
Source: Bloomberg and Company Filings
Figure 19: ROIC (%)
Source: Bloomberg
2
3
4
5
6
2010 2011 2012 2013 2014
SAH Competitor Average
0x
1x
2x
3x
4x
2010 2011 2012 2013 2014
SAH Competitor Average
0 days
20 days
40 days
60 days
80 days
SAH Competitor Average
4
5
6
7
8
9
10
2010 2011 2012 2013 2014
SAH Competitor Average
2016 CFA Institute Research Challenge SAH
9
VALUATION To arrive at our target price we used a discounted cash flow and multiples-based
valuation methods. We used a five-year DCF model to capture our projection
for the effect of OSOE and EchoPark, and we used the P/E and EV/EBITDA
multiple methods to capture the market’s view of SAH relative to its peers. We
believe the DCF model gives the best representation of SAH’s intrinsic value
going forward. We believe the market perception is equally important to the
DCF, so we weighted the DCF and P/E methods equally (Figure 20).
DCF Model
Our discounted cash flow valuation provided us with a target price of $17.70
(Figure 22, Appendix K: Sensitivity Analysis). The largest factors for this were
our projections of revenue, profit margins, capital expenditures, and terminal
growth rate.
Revenues
We forecast revenues will grow at an average rate of 2.9% for the next five years.
This was achieved by projecting SAH’s revenue segments independently, with
used cars and F&I growing the fastest to reflect management’s shift to used cars
and attempt to drive sales volume. We project the average total revenue growth
in each year to be lower than recent historical average because we expect a
downturn in the forecast period but cannot predict the exact year. We believe
this projection is optimistic because it does not assume any major setbacks to
EchoPark or OSOE. In addition, it is slightly higher than SAH’s average growth
rate over the last 10 years of 2.7%.
Profit Margins
The gross profit margin and the EBIT margin are exceptionally important to
SAH. Because of the nature of the automotive industry, gross profit margins are
tight, and over the past few years new and used car profit margins for SAH have
decreased. As consumers become more informed and SAH implements its lower
margin one-price system, we expect margins on automotive sales will continue
to decrease by a small amount, but total gross profit will hold constant because
of growth in the high margin fixed operations and F&I segments (Appendix B:
Financial Statements and Ratios). We anticipate that SG&A expenses will rise
proportionately with revenue. Additionally we chose to forecast our cash flows
as EBIT minus the interest expense from the floor plan. The floor plan is
essential to SAH’s operations and the related expenses are predictable. We
believe these interest expenses will rise as SAH’s expansion requires higher
inventory levels.
Capital Expenditures
Since 2012, SAH’s capital expenditures have increased substantially from $89M
to $156M (Figure 21). In order for SAH to successfully complete their targeted
25-30 new openings of EchoPark stores by 2017 and renovations associated with
OSOE by 2018, we project capital expenditures for 2016 and 2017 will need to
increase from their current levels to over $178M. In the years following, SAH’s
capital expenditures will need to remain high, albeit slightly lower than the early
stages of implementation, in order to facilitate further EchoPark openings and
store renovations associated with OSOE.
Terminal Growth
To calculate the value of all of cash flows beyond our projection period we
applied a growth rate of 3.00%. This matches SAH’s CAGR since 2000 of
3.03%, and is above the average inflation from 1926-2014 of 2.90% per year.
Figure 20:
Target Price Calculation
Value Weight
DCF $17.70 50%
P/E
Multiple $18.68 50%
Target Price $18.19
Source: Team Calculations
Figure 21:
SAH Capex ($ in millions)
Source: Company Filings and Team Calculations
Figure 22:
Terminal Growth Sensitivity
-1.0% Base +1.0%
2.60% 3.88 12.42 21.68
2.80% 5.91 14.90 24.66
3.00% 8.20 17.70 28.01
3.20% 10.79 20.88 31.82
3.40% 13.76 24.51 36.16
Source: Team Calculations
50
70
90
110
130
150
170
190
210
230
20
11
20
12
20
13
20
14
20
15E
20
16E
20
17E
20
18E
20
19E
20
20E

2016 CFA Institute Research Challenge SAH
10
P/E Multiple
For our relative P/E valuation we applied a P/E multiple of 9.0. This is slightly
below their current P/E of 9.28 and it is not as far below the industry average of
10.48 as normal. Since 2000, SAH’s P/E has never been higher than the
industry’s and on average the difference is 30% (Figure 23). SAH’s P/E moves
cyclically and is coming off of a recent high so it will likely continue to trend
lower. Additionally, we believe that the Smith family having total voting control
lowers the values of SAH stock relative to the industry (Appendix J: Valuation
Summary). Combining this P/E with our projected base EPS of $2.08, we
reached a target price of $18.68 (Figure 24, Sensitivity Analysis).
We also calculated an EV/EBITDA value. However, given SAH’s level of
investment, we believe that EBITDA is not a good measure of free cash flows.
INVESTMENT RISKS Operational Accelerated Timetable for EchoPark
We believe EchoPark could provide SAH with growth opportunity in the used
car market; however, management has stated they expect EchoPark stores won’t
be profitable until 2018 and project 25-30 store openings by FY 2017. As a
result, we believe that any positive impact on the company’s bottom-line will
take significant time. In the event that the timeline for EchoPark profitability
would accelerate, company performance would improve accordingly.
OSOE Provides Unexpected Value
We believe OSOE will not provide as much value as management expects and
that a down year in consumer demand for automobiles will lead to consumers
valuing price over service quality. Additionally, sub-branding will not be
immediately effective and a stiffening competitive environment will minimize
the effectiveness of OSOE. If SAH is able to seamlessly establish OSOE and
create a recognizable brand, the resulting increased sales volume could bolster
profitability more than anticipated.
Economic Prolonged Strength in Auto Sales
Post-recession, automotive sales have grown each of the past seven years,
reaching a peak in 2015 of approximately 17.5 million new vehicles sold. We
believe this historic strength in consumer demand for vehicles has allowed SAH
to pursue expensive strategic plans without significant earnings deterioration. If
the current growth cycle in automotive sales were to last longer than any other
cycle over the past 40 years, prolonged growth in SAH’s revenue could cover
high expenditures better than anticipated. This would increase the effectiveness
of both initiatives relative to our forecast and lead to profitability exceeding our
expectations.
RECOMMENDATION Sonic Automotive, Inc. is a SELL at the January 22, 2016 closing price of $18.40.
Our DCF and multiples valuations resulted in a target price of $18.19. SAH lacks
a sustainable competitive advantage and the OSOE and EchoPark initiatives will
provide only minor, delayed benefits. This combined with the possibility of an
industry wide slowdown and poor management leave us doubtful that the
company will have sufficient growth going forward.
Figure 23:
SAH P/E vs Industry
Source: Bloomberg
Figure 24:
P/E Sensitivity
-1.0% Base +1.0%
8.00 14.17 16.61 19.10
8.50 15.05 17.65 20.29
9.00 15.94 18.68 21.49
9.50 16.82 19.72 22.68
10.00 17.71 20.76 23.88
10.50 18.60 21.80 25.07
Source: Team Calculations
0
5
10
15
20
SAH Competitor Average

2016 CFA Institute Research Challenge SAH
11
Works Cited
1. AutoNation, Inc. Form 10-K [PDF Document]. United States Securities and Exchange Commission. Retrieved from http://www.sec.gov/cgi-bin/browse-
edgar?action=getcompany&CIK=0000350698&type=10-K&dateb=&owner=exclude&count=40
1997-2015
2. Bloomberg Finance L.P.
3. CarMax, Inc. Form 10-K [PDF Document]. United States Securities and Exchange Commission. Retrieved from http://www.sec.gov/cgi-bin/browse-
edgar?action=getcompany&CIK=0001170010&type=10-K&dateb=&owner=exclude&count=40
2005-2015
4. IHS Automotive, AutoTrader.com (2015). 2015 Automotive Buyer Influence Study [PDF document]. Retrieved from
http://agameautotrader.com/files/insights/pdf/2015AutomotiveBuyerInfluenceStudyBrochure.pdf
5. Manheim Used Vehicle Value Index. (December, 2015). Retrieved from http://www.manheim.com/services/consulting#monthlyIndex
6. Morningstar, (2015). Ibbotson® SSBI® 2015 Classic Yearbook: Market Results for Stocks, Bonds, Bills, and Inflation 1926-2014. Chicago, IL: Morningstar, Inc.
7. Sonic Automotive, Inc. Form 10-K [PDF Document]. United States Securities and Exchange Commission. Retrieved from http://www.sec.gov/cgi-bin/browse-
edgar?action=getcompany&CIK=0001043509&type=10-K&dateb=&owner=exclude&count=40
1997-2015
8. Sonic Automotive, Inc. Form 10-Q [PDF Document]. United States Securities and Exchange Commission. Retrieved from http://www.sec.gov/cgi-bin/browse-
edgar?action=getcompany&CIK=0001043509&type=10-Q&dateb=&owner=exclude&count=40
Q1 2010 –Q3 2015
9. http://www.similarweb.com/webstite/sonicautomotive.com
2016 CFA Institute Research Challenge SAH
12
Appendix A: Glossary
Retail Floorplan: a source of inventory financing used by retailers such as SAH, to purchase high cost inventory. The inventory purchased is used as collateral.
The financing costs associated with floorplans are factored into the price of the automobiles. Manufacturers often service the floorplans, but floorplans can vary
by issuer. Schedules can range from 5%-20% for each vehicle every 30-60 days. When each piece of inventory is sold by the dealer, the loan advance against the
inventory is repaid.
Seasonally Adjusted Annual Rate (SAAR): a rate that is adjusted to take into account fluctuations of values which occur due to seasonality. SAAR factors
make adjustments for seasonal changes in sales and annualize data, and thus is a better sales forecasting tool than simply observing month-to-month sales figures.
While the automobile industry is not a seasonal industry, there are strong seasonal trends for automotive companies. Sales are typically highest for automotive
retailers in October, and are about 30% higher than sales in January, which has historically been the slowest sales month. The SAAR is calculated by taking the
unadjusted sales rate for a specific month, dividing it by its seasonality factor, and then multiplying that result by twelve.
Manheim Used Vehicle Value Index: the Index is drawn from a database of over five million used vehicle transactions annually. Manheim developed a
measurement of used vehicle prices, which is independent of shifts in the specifications of vehicles being sold. Macro-Economic and industry factors contribute
to the overall stability of the used car market, but it can also be stated that more efficient remarketing strategies create minimal swings in vehicle pricing. The
Manheim Index is a good indication of pricing trends in the used vehicle market. In December, the overall value increased to 125.7, which is the highest level
since July 2011. On an annual basis, the Manheim Index rose 1.2% in 2015, 1.5% in 2014, and declined in 2013 and 2012 by 1.8% and 1.0% respectively.
Days Inventory Outstanding (DIO): a measure for the average number of days a vehicle sits in inventory.
2016 CFA Institute Research Challenge SAH
13
Appendix B: Financial Statements and Ratios
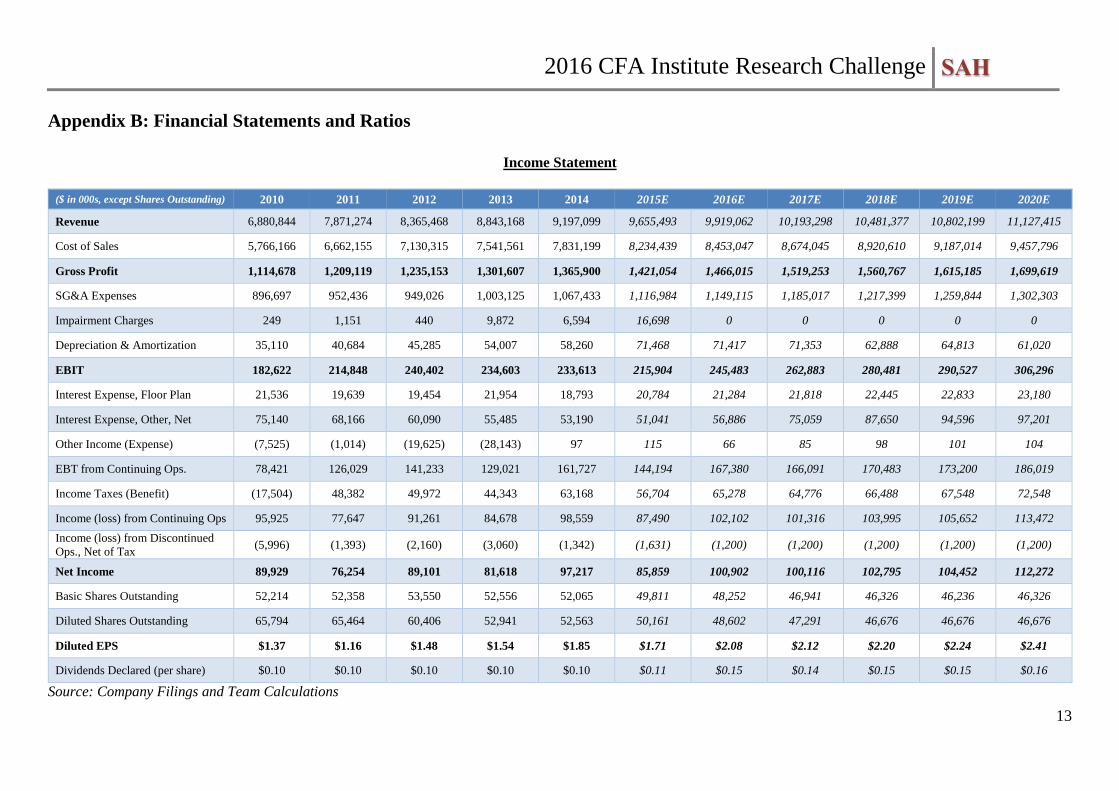
Income Statement
($ in 000s, except Shares Outstanding) 2010 2011 2012 2013 2014 2015E 2016E 2017E 2018E 2019E 2020E
Revenue 6,880,844 7,871,274 8,365,468 8,843,168 9,197,099 9,655,493 9,919,062 10,193,298 10,481,377 10,802,199 11,127,415
Cost of Sales 5,766,166 6,662,155 7,130,315 7,541,561 7,831,199 8,234,439 8,453,047 8,674,045 8,920,610 9,187,014 9,457,796
Gross Profit 1,114,678 1,209,119 1,235,153 1,301,607 1,365,900 1,421,054 1,466,015 1,519,253 1,560,767 1,615,185 1,699,619
SG&A Expenses 896,697 952,436 949,026 1,003,125 1,067,433 1,116,984 1,149,115 1,185,017 1,217,399 1,259,844 1,302,303
Impairment Charges 249 1,151 440 9,872 6,594 16,698 0 0 0 0 0
Depreciation & Amortization 35,110 40,684 45,285 54,007 58,260 71,468 71,417 71,353 62,888 64,813 61,020
EBIT 182,622 214,848 240,402 234,603 233,613 215,904 245,483 262,883 280,481 290,527 306,296
Interest Expense, Floor Plan 21,536 19,639 19,454 21,954 18,793 20,784 21,284 21,818 22,445 22,833 23,180
Interest Expense, Other, Net 75,140 68,166 60,090 55,485 53,190 51,041 56,886 75,059 87,650 94,596 97,201
Other Income (Expense) (7,525) (1,014) (19,625) (28,143) 97 115 66 85 98 101 104
EBT from Continuing Ops. 78,421 126,029 141,233 129,021 161,727 144,194 167,380 166,091 170,483 173,200 186,019
Income Taxes (Benefit) (17,504) 48,382 49,972 44,343 63,168 56,704 65,278 64,776 66,488 67,548 72,548
Income (loss) from Continuing Ops 95,925 77,647 91,261 84,678 98,559 87,490 102,102 101,316 103,995 105,652 113,472
Income (loss) from Discontinued
Ops., Net of Tax (5,996) (1,393) (2,160) (3,060) (1,342) (1,631) (1,200) (1,200) (1,200) (1,200) (1,200)
Net Income 89,929 76,254 89,101 81,618 97,217 85,859 100,902 100,116 102,795 104,452 112,272
Basic Shares Outstanding 52,214 52,358 53,550 52,556 52,065 49,811 48,252 46,941 46,326 46,236 46,326
Diluted Shares Outstanding 65,794 65,464 60,406 52,941 52,563 50,161 48,602 47,291 46,676 46,676 46,676
Diluted EPS $1.37 $1.16 $1.48 $1.54 $1.85 $1.71 $2.08 $2.12 $2.20 $2.24 $2.41
Dividends Declared (per share) $0.10 $0.10 $0.10 $0.10 $0.10 $0.11 $0.15 $0.14 $0.15 $0.15 $0.16
Source: Company Filings and Team Calculations
2016 CFA Institute Research Challenge SAH
14
Appendix B: Financial Statements and Ratios (continued)
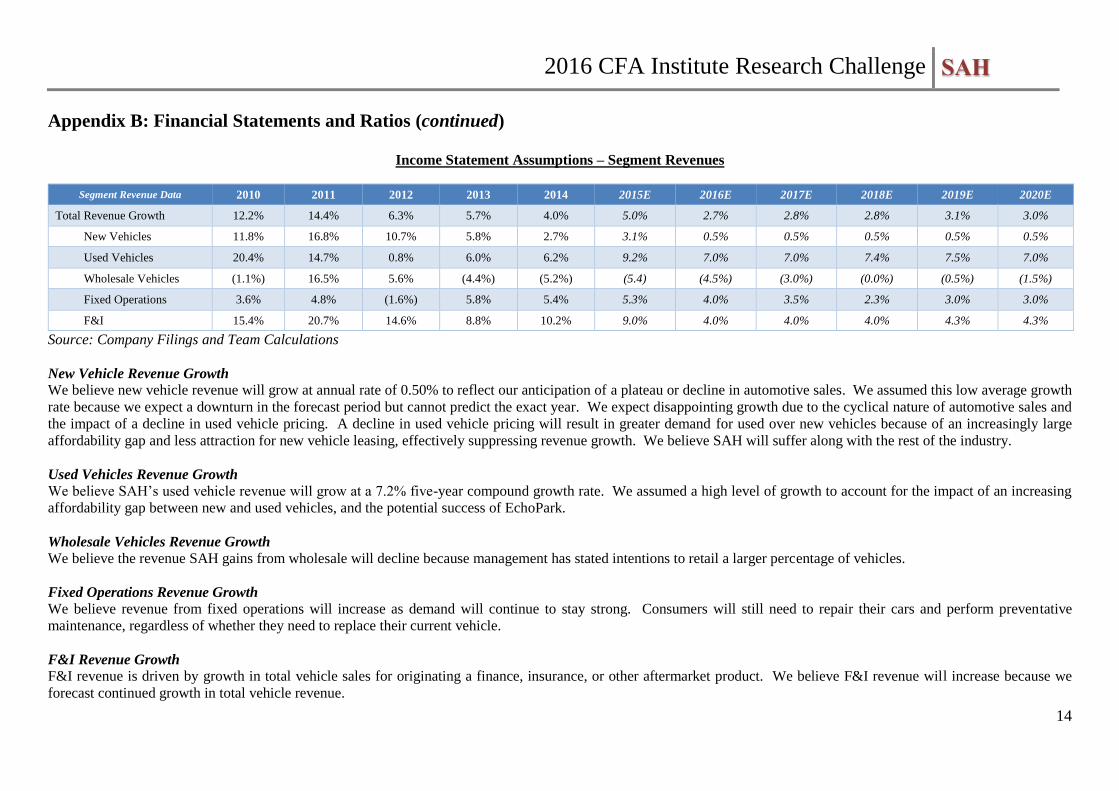
Income Statement Assumptions – Segment Revenues
Segment Revenue Data 2010 2011 2012 2013 2014 2015E 2016E 2017E 2018E 2019E 2020E
Total Revenue Growth 12.2% 14.4% 6.3% 5.7% 4.0% 5.0% 2.7% 2.8% 2.8% 3.1% 3.0%
New Vehicles 11.8% 16.8% 10.7% 5.8% 2.7% 3.1% 0.5% 0.5% 0.5% 0.5% 0.5%
Used Vehicles 20.4% 14.7% 0.8% 6.0% 6.2% 9.2% 7.0% 7.0% 7.4% 7.5% 7.0%
Wholesale Vehicles (1.1%) 16.5% 5.6% (4.4%) (5.2%) (5.4) (4.5%) (3.0%) (0.0%) (0.5%) (1.5%)
Fixed Operations 3.6% 4.8% (1.6%) 5.8% 5.4% 5.3% 4.0% 3.5% 2.3% 3.0% 3.0%
F&I 15.4% 20.7% 14.6% 8.8% 10.2% 9.0% 4.0% 4.0% 4.0% 4.3% 4.3%
Source: Company Filings and Team Calculations
New Vehicle Revenue Growth We believe new vehicle revenue will grow at annual rate of 0.50% to reflect our anticipation of a plateau or decline in automotive sales. We assumed this low average growth
rate because we expect a downturn in the forecast period but cannot predict the exact year. We expect disappointing growth due to the cyclical nature of automotive sales and
the impact of a decline in used vehicle pricing. A decline in used vehicle pricing will result in greater demand for used over new vehicles because of an increasingly large
affordability gap and less attraction for new vehicle leasing, effectively suppressing revenue growth. We believe SAH will suffer along with the rest of the industry.
Used Vehicles Revenue Growth We believe SAH’s used vehicle revenue will grow at a 7.2% five-year compound growth rate. We assumed a high level of growth to account for the impact of an increasing
affordability gap between new and used vehicles, and the potential success of EchoPark.
Wholesale Vehicles Revenue Growth We believe the revenue SAH gains from wholesale will decline because management has stated intentions to retail a larger percentage of vehicles.
Fixed Operations Revenue Growth We believe revenue from fixed operations will increase as demand will continue to stay strong. Consumers will still need to repair their cars and perform preventative
maintenance, regardless of whether they need to replace their current vehicle.
F&I Revenue Growth F&I revenue is driven by growth in total vehicle sales for originating a finance, insurance, or other aftermarket product. We believe F&I revenue will increase because we
forecast continued growth in total vehicle revenue.
2016 CFA Institute Research Challenge SAH
15
Appendix B: Financial Statements and Ratios (continued)
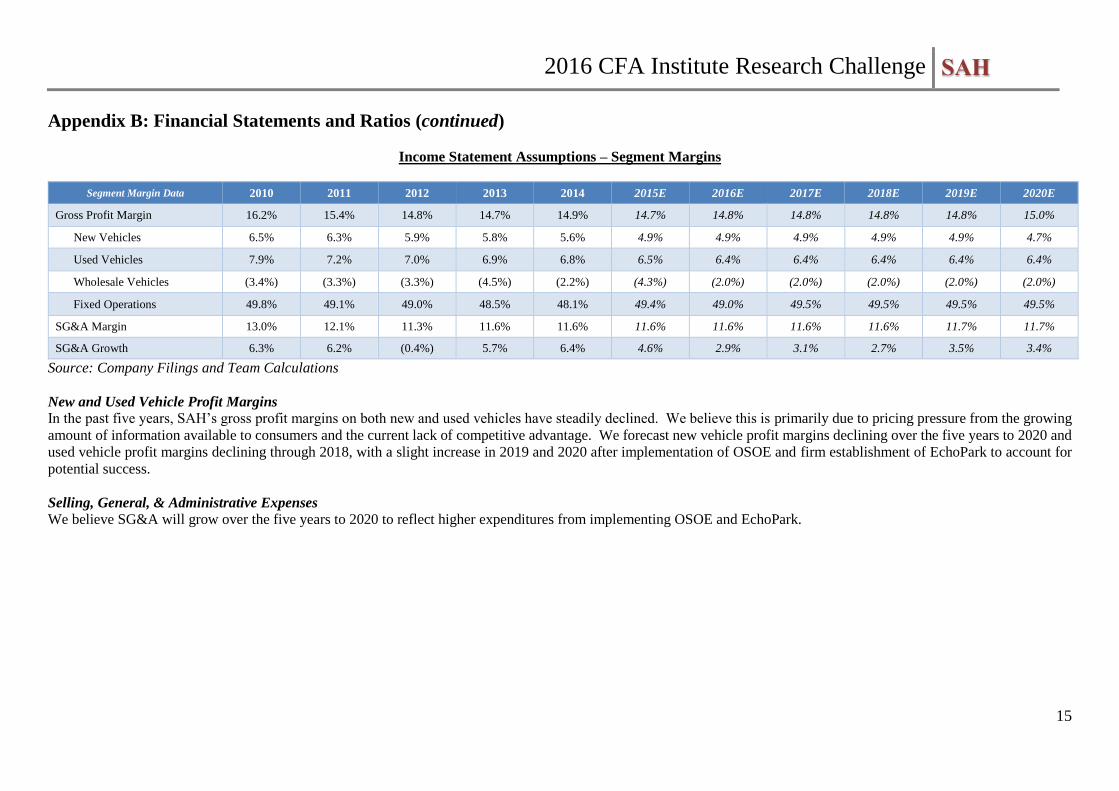
Income Statement Assumptions – Segment Margins
Segment Margin Data 2010 2011 2012 2013 2014 2015E 2016E 2017E 2018E 2019E 2020E
Gross Profit Margin 16.2% 15.4% 14.8% 14.7% 14.9% 14.7% 14.8% 14.8% 14.8% 14.8% 15.0%
New Vehicles 6.5% 6.3% 5.9% 5.8% 5.6% 4.9% 4.9% 4.9% 4.9% 4.9% 4.7%
Used Vehicles 7.9% 7.2% 7.0% 6.9% 6.8% 6.5% 6.4% 6.4% 6.4% 6.4% 6.4%
Wholesale Vehicles (3.4%) (3.3%) (3.3%) (4.5%) (2.2%) (4.3%) (2.0%) (2.0%) (2.0%) (2.0%) (2.0%)
Fixed Operations 49.8% 49.1% 49.0% 48.5% 48.1% 49.4% 49.0% 49.5% 49.5% 49.5% 49.5%
SG&A Margin 13.0% 12.1% 11.3% 11.6% 11.6% 11.6% 11.6% 11.6% 11.6% 11.7% 11.7%
SG&A Growth 6.3% 6.2% (0.4%) 5.7% 6.4% 4.6% 2.9% 3.1% 2.7% 3.5% 3.4%
Source: Company Filings and Team Calculations
New and Used Vehicle Profit Margins In the past five years, SAH’s gross profit margins on both new and used vehicles have steadily declined. We believe this is primarily due to pricing pressure from the growing
amount of information available to consumers and the current lack of competitive advantage. We forecast new vehicle profit margins declining over the five years to 2020 and
used vehicle profit margins declining through 2018, with a slight increase in 2019 and 2020 after implementation of OSOE and firm establishment of EchoPark to account for
potential success.
Selling, General, & Administrative Expenses We believe SG&A will grow over the five years to 2020 to reflect higher expenditures from implementing OSOE and EchoPark.

2016 CFA Institute Research Challenge SAH
16
Appendix B: Financial Statements and Ratios (continued)
Common-Size Income Statement
($ in 000s, except Shares Outstanding) 2010 2011 2012 2013 2014 2015E 2016E 2017E 2018E 2019E 2020E
Revenue 100% 100% 100% 100% 100% 100% 100% 100% 100% 100% 100%
Cost of Sales 83.8% 84.6% 85.2% 85.3% 85.1% 85.3% 85.2% 85.1% 85.1% 85.0% 85.0%
Gross Profit 16.2% 15.4% 14.8% 14.7% 14.9% 14.7% 14.8% 14.9% 14.9% 15.0% 15.0%
SG&A Expenses 13.0% 12.1% 11.3% 11.3% 11.6% 11.6% 11.6% 11.6% 11.6% 11.7% 11.7%
Impairment Charges 0.0% 0.0% 0.0% 0.1% 0.1% 0.2% 0.0% 0.0% 0.0% 0.0% 0.0%
Depreciation & Amortization 0.5% 0.5% 0.5% 0.6% 0.6% 0.7% 0.7% 0.7% 0.6% 0.6% 0.5%
EBIT 2.7% 2.7% 2.9% 2.7% 2.5% 2.2% 2.5% 2.6% 2.7% 2.7% 2.8%
Interest Expense, Floor Plan 0.3% 0.2% 0.2% 0.2% 0.2% 0.2% 0.2% 0.2% 0.2% 0.2% 0.2%
Interest Expense, Other, Net 1.1% 0.9% 0.7% 0.6% 0.6% 0.5% 0.6% 0.7% 0.8% 0.9% 0.9%
Other Income (Expense), Net 0.1% 0.0% 0.2% 0.3% 0.0% 0.0% 0.0% 0.0% 0.0% 0.0% 0.0%
EBT from Continuing Ops. 1.1% 1.6% 1.7% 1.5% 1.8% 1.5% 1.7% 1.6% 1.6% 1.6% 1.7%
Income Taxes 0.3% 0.6% 0.6% 0.5% 0.7% 0.6% 0.7% 0.6% 0.6% 0.6% 0.7%
Income from Continuing Ops 1.4% 1.0% 1.1% 1.0% 1.1% 0.9% 1.0% 1.0% 1.0% 1.0% 1.0%
EBT from Discontinued Ops., Net
of Tax 0.1% 0.0% 0.0% 0.0% 0.0% 0.0% 0.0% 0.0% 0.0% 0.0% 0.0%
Net Income 1.3% 1.0% 1.1% 0.9% 1.1% 0.9% 1.0% 1.0% 1.0% 1.0% 1.0%
Source: Company Filings and Team Calculations
2016 CFA Institute Research Challenge SAH
17
Appendix B: Financial Statements and Ratios (continued)
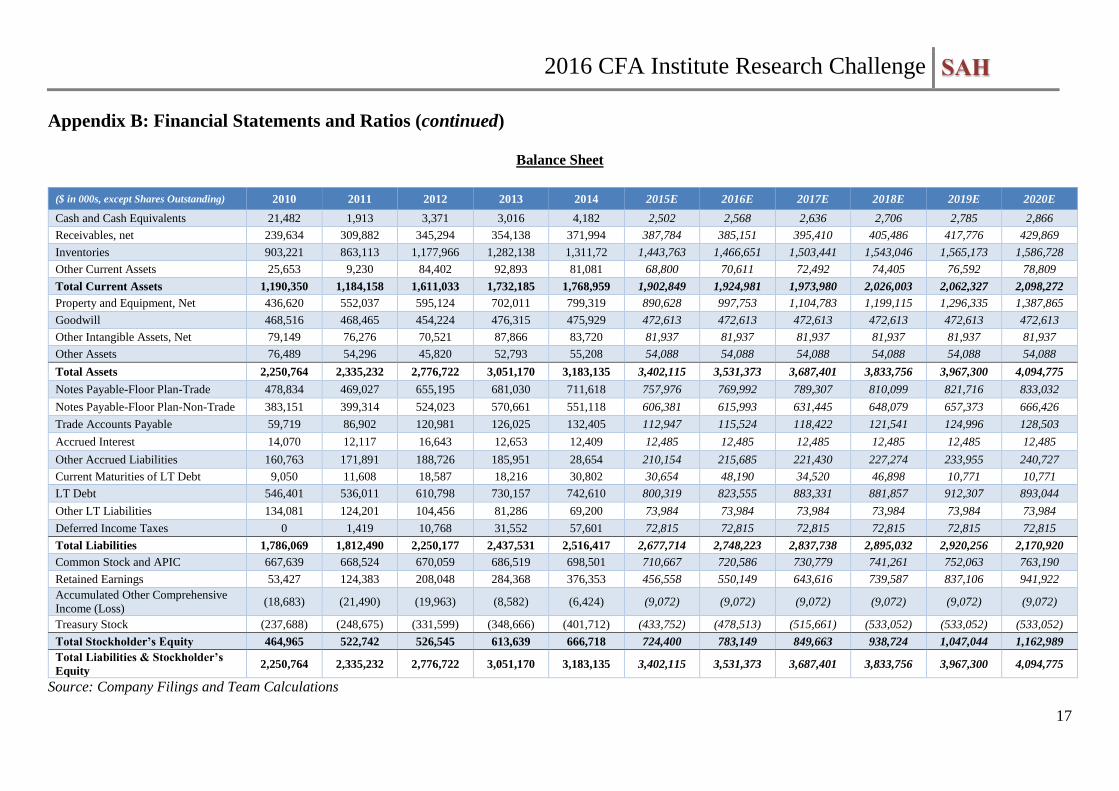
Balance Sheet
($ in 000s, except Shares Outstanding) 2010 2011 2012 2013 2014 2015E 2016E 2017E 2018E 2019E 2020E
Cash and Cash Equivalents 21,482 1,913 3,371 3,016 4,182 2,502 2,568 2,636 2,706 2,785 2,866
Receivables, net 239,634 309,882 345,294 354,138 371,994 387,784 385,151 395,410 405,486 417,776 429,869
Inventories 903,221 863,113 1,177,966 1,282,138 1,311,72 1,443,763 1,466,651 1,503,441 1,543,046 1,565,173 1,586,728
Other Current Assets 25,653 9,230 84,402 92,893 81,081 68,800 70,611 72,492 74,405 76,592 78,809
Total Current Assets 1,190,350 1,184,158 1,611,033 1,732,185 1,768,959 1,902,849 1,924,981 1,973,980 2,026,003 2,062,327 2,098,272
Property and Equipment, Net 436,620 552,037 595,124 702,011 799,319 890,628 997,753 1,104,783 1,199,115 1,296,335 1,387,865
Goodwill 468,516 468,465 454,224 476,315 475,929 472,613 472,613 472,613 472,613 472,613 472,613
Other Intangible Assets, Net 79,149 76,276 70,521 87,866 83,720 81,937 81,937 81,937 81,937 81,937 81,937
Other Assets 76,489 54,296 45,820 52,793 55,208 54,088 54,088 54,088 54,088 54,088 54,088
Total Assets 2,250,764 2,335,232 2,776,722 3,051,170 3,183,135 3,402,115 3,531,373 3,687,401 3,833,756 3,967,300 4,094,775
Notes Payable-Floor Plan-Trade 478,834 469,027 655,195 681,030 711,618 757,976 769,992 789,307 810,099 821,716 833,032
Notes Payable-Floor Plan-Non-Trade 383,151 399,314 524,023 570,661 551,118 606,381 615,993 631,445 648,079 657,373 666,426
Trade Accounts Payable 59,719 86,902 120,981 126,025 132,405 112,947 115,524 118,422 121,541 124,996 128,503
Accrued Interest 14,070 12,117 16,643 12,653 12,409 12,485 12,485 12,485 12,485 12,485 12,485
Other Accrued Liabilities 160,763 171,891 188,726 185,951 28,654 210,154 215,685 221,430 227,274 233,955 240,727
Current Maturities of LT Debt 9,050 11,608 18,587 18,216 30,802 30,654 48,190 34,520 46,898 10,771 10,771
LT Debt 546,401 536,011 610,798 730,157 742,610 800,319 823,555 883,331 881,857 912,307 893,044
Other LT Liabilities 134,081 124,201 104,456 81,286 69,200 73,984 73,984 73,984 73,984 73,984 73,984
Deferred Income Taxes 0 1,419 10,768 31,552 57,601 72,815 72,815 72,815 72,815 72,815 72,815
Total Liabilities 1,786,069 1,812,490 2,250,177 2,437,531 2,516,417 2,677,714 2,748,223 2,837,738 2,895,032 2,920,256 2,170,920
Common Stock and APIC 667,639 668,524 670,059 686,519 698,501 710,667 720,586 730,779 741,261 752,063 763,190
Retained Earnings 53,427 124,383 208,048 284,368 376,353 456,558 550,149 643,616 739,587 837,106 941,922
Accumulated Other Comprehensive
Income (Loss) (18,683) (21,490) (19,963) (8,582) (6,424) (9,072) (9,072) (9,072) (9,072) (9,072) (9,072)
Treasury Stock (237,688) (248,675) (331,599) (348,666) (401,712) (433,752) (478,513) (515,661) (533,052) (533,052) (533,052)
Total Stockholder’s Equity 464,965 522,742 526,545 613,639 666,718 724,400 783,149 849,663 938,724 1,047,044 1,162,989
Total Liabilities & Stockholder’s
Equity 2,250,764 2,335,232 2,776,722 3,051,170 3,183,135 3,402,115 3,531,373 3,687,401 3,833,756 3,967,300 4,094,775
Source: Company Filings and Team Calculations
2016 CFA Institute Research Challenge SAH
18
Appendix B: Financial Statements and Ratios (continued)
Balance Sheet Assumptions
Inventories We expect inventories will increase in the near future as suppliers produce more vehicles to accommodate current demand. However, we believe this represents a threat to
automotive retailers. Downturns in automotive sales are characterized by oversupply and low demand as retailers struggle to push cars off lots to consumers unwilling to replace
their current vehicle. The resulting impact on large dealership group financials is lower revenue and lowered profit margins, especially for new vehicles.
Property and Equipment Property and equipment is forecasted to grow as SAH rolls out their initiatives. Significant capital expenditures will be incurred for new openings of EchoPark stores and
renovations associated with OSOE.
Treasury Stock We assumed that in the current quarter there would be no more treasury stock repurchases given the $16.9M purchase completed in January. For each quarter after we predicted
SAH would maintain its average quarterly buy back from the past 5 years until the remaining $82.4M of repurchases have been completed.
2016 CFA Institute Research Challenge SAH
19
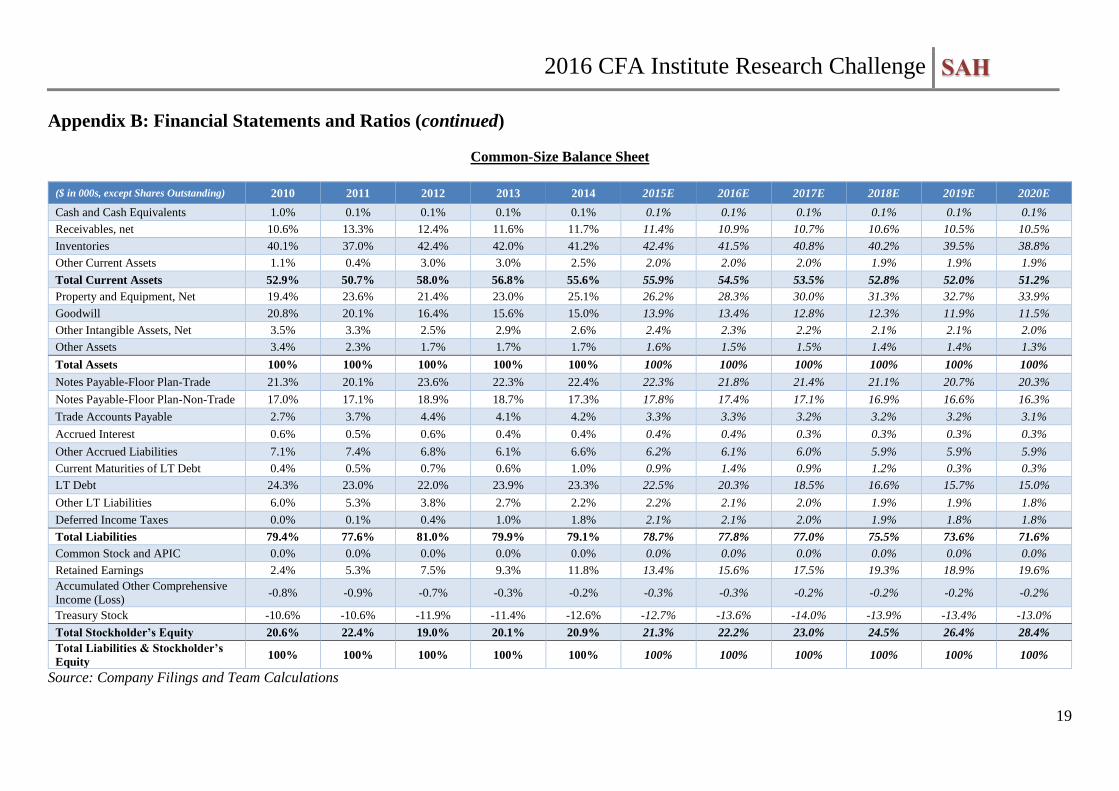
Appendix B: Financial Statements and Ratios (continued)
Common-Size Balance Sheet
($ in 000s, except Shares Outstanding) 2010 2011 2012 2013 2014 2015E 2016E 2017E 2018E 2019E 2020E
Cash and Cash Equivalents 1.0% 0.1% 0.1% 0.1% 0.1% 0.1% 0.1% 0.1% 0.1% 0.1% 0.1%
Receivables, net 10.6% 13.3% 12.4% 11.6% 11.7% 11.4% 10.9% 10.7% 10.6% 10.5% 10.5%
Inventories 40.1% 37.0% 42.4% 42.0% 41.2% 42.4% 41.5% 40.8% 40.2% 39.5% 38.8%
Other Current Assets 1.1% 0.4% 3.0% 3.0% 2.5% 2.0% 2.0% 2.0% 1.9% 1.9% 1.9%
Total Current Assets 52.9% 50.7% 58.0% 56.8% 55.6% 55.9% 54.5% 53.5% 52.8% 52.0% 51.2%
Property and Equipment, Net 19.4% 23.6% 21.4% 23.0% 25.1% 26.2% 28.3% 30.0% 31.3% 32.7% 33.9%
Goodwill 20.8% 20.1% 16.4% 15.6% 15.0% 13.9% 13.4% 12.8% 12.3% 11.9% 11.5%
Other Intangible Assets, Net 3.5% 3.3% 2.5% 2.9% 2.6% 2.4% 2.3% 2.2% 2.1% 2.1% 2.0%
Other Assets 3.4% 2.3% 1.7% 1.7% 1.7% 1.6% 1.5% 1.5% 1.4% 1.4% 1.3%
Total Assets 100% 100% 100% 100% 100% 100% 100% 100% 100% 100% 100%
Notes Payable-Floor Plan-Trade 21.3% 20.1% 23.6% 22.3% 22.4% 22.3% 21.8% 21.4% 21.1% 20.7% 20.3%
Notes Payable-Floor Plan-Non-Trade 17.0% 17.1% 18.9% 18.7% 17.3% 17.8% 17.4% 17.1% 16.9% 16.6% 16.3%
Trade Accounts Payable 2.7% 3.7% 4.4% 4.1% 4.2% 3.3% 3.3% 3.2% 3.2% 3.2% 3.1%
Accrued Interest 0.6% 0.5% 0.6% 0.4% 0.4% 0.4% 0.4% 0.3% 0.3% 0.3% 0.3%
Other Accrued Liabilities 7.1% 7.4% 6.8% 6.1% 6.6% 6.2% 6.1% 6.0% 5.9% 5.9% 5.9%
Current Maturities of LT Debt 0.4% 0.5% 0.7% 0.6% 1.0% 0.9% 1.4% 0.9% 1.2% 0.3% 0.3%
LT Debt 24.3% 23.0% 22.0% 23.9% 23.3% 22.5% 20.3% 18.5% 16.6% 15.7% 15.0%
Other LT Liabilities 6.0% 5.3% 3.8% 2.7% 2.2% 2.2% 2.1% 2.0% 1.9% 1.9% 1.8%
Deferred Income Taxes 0.0% 0.1% 0.4% 1.0% 1.8% 2.1% 2.1% 2.0% 1.9% 1.8% 1.8%
Total Liabilities 79.4% 77.6% 81.0% 79.9% 79.1% 78.7% 77.8% 77.0% 75.5% 73.6% 71.6%
Common Stock and APIC 0.0% 0.0% 0.0% 0.0% 0.0% 0.0% 0.0% 0.0% 0.0% 0.0% 0.0%
Retained Earnings 2.4% 5.3% 7.5% 9.3% 11.8% 13.4% 15.6% 17.5% 19.3% 18.9% 19.6%
Accumulated Other Comprehensive
Income (Loss) -0.8% -0.9% -0.7% -0.3% -0.2% -0.3% -0.3% -0.2% -0.2% -0.2% -0.2%
Treasury Stock -10.6% -10.6% -11.9% -11.4% -12.6% -12.7% -13.6% -14.0% -13.9% -13.4% -13.0%
Total Stockholder’s Equity 20.6% 22.4% 19.0% 20.1% 20.9% 21.3% 22.2% 23.0% 24.5% 26.4% 28.4%
Total Liabilities & Stockholder’s
Equity 100% 100% 100% 100% 100% 100% 100% 100% 100% 100% 100%
Source: Company Filings and Team Calculations

2016 CFA Institute Research Challenge SAH
20
Appendix B: Financial Statements and Ratios (continued)
Balance Sheet as a Percentage of Revenue
($ in 000s, except Shares Outstanding) 2010 2011 2012 2013 2014 2015E 2016E 2017E 2018E 2019E 2020E
Cash and Cash Equivalents 0.3% 0.0% 0.0% 0.0% 0.0% 0.0% 0.0% 0.0% 0.0% 0.0% 0.0%
Receivables, net 3.5% 3.9% 4.1% 4.0% 4.0% 4.0% 3.9% 3.9% 3.9% 3.9% 3.9%
Inventories 13.1% 11.0% 14.1% 14.5% 14.3% 15.0% 14.8% 14.7% 14.7% 14.5% 14.3%
Other Current Assets 0.4% 0.1% 1.0% 1.1% 0.9% 0.7% 0.7% 0.7% 0.7% 0.7% 0.7%
Total Current Assets 17.3% 15.0% 19.3% 19.6% 19.2% 19.7% 19.4% 19.4% 19.3% 19.1% 18.9%
Property and Equipment, Net 6.3% 7.0% 7.1% 7.9% 8.7% 9.2% 10.1% 10.8% 11.4% 12.0% 12.5%
Goodwill 6.8% 6.0% 5.4% 5.4% 5.2% 4.9% 4.8% 4.6% 4.5% 4.4% 4.2%
Other Intangible Assets, Net 1.2% 1.0% 0.8% 1.0% 0.9% 0.8% 0.8% 0.8% 0.8% 0.8% 0.7%
Other Assets 1.1% 0.7% 0.5% 0.6% 0.6% 0.6% 0.5% 0.5% 0.5% 0.5% 0.5%
Total Assets 32.7% 29.7% 33.2% 34.5% 34.6% 35.2% 35.6% 36.2% 36.6% 36.7% 36.8%
Notes Payable-Floor Plan-Trade 7.0% 6.0% 7.8% 7.7% 7.7% 7.9% 7.8% 7.7% 7.7% 7.6% 7.5%
Notes Payable-Floor Plan-Non-Trade 5.6% 5.1% 6.3% 6.5% 6.0% 6.3% 6.2% 6.2% 6.2% 6.1% 6.0%
Trade Accounts Payable 0.9% 1.1% 1.4% 1.4% 1.4% 1.2% 1.2% 1.2% 1.2% 1.2% 1.2%
Accrued Interest 0.2% 0.2% 0.2% 0.1% 0.1% 0.1% 0.1% 0.1% 0.1% 0.1% 0.1%
Other Accrued Liabilities 2.3% 2.2% 2.3% 2.1% 2.3% 2.2% 2.2% 2.2% 2.2% 2.2% 2.2%
Current Maturities of LT Debt 0.1% 0.1% 0.2% 0.2% 0.3% 0.3% 0.5% 0.3% 0.4% 0.1% 0.1%
LT Debt 7.9% 6.8% 7.3% 8.3% 8.1% 7.9% 7.2% 6.7% 6.1% 5.8% 5.5%
Other LT Liabilities 1.9% 1.6% 1.2% 0.9% 0.8% 0.8% 0.7% 0.7% 0.7% 0.7% 0.7%
Deferred Income Taxes 0.0% 0.0% 0.1% 0.4% 0.6% 0.8% 0.7% 0.7% 0.7% 0.7% 0.7%
Total Liabilities 26.0% 23.0% 26.9% 27.6% 27.4% 27.7% 27.7% 27.8% 27.6% 27.0% 26.3%
Common Stock and APIC 0.0% 0.0% 0.0% 0.0% 0.0% 0.0% 0.0% 0.0% 0.0% 0.0% 0.0%
Retained Earnings 0.8% 1.6% 2.5% 3.2% 4.1% 4.7% 5.5% 6.3% 7.1% 7.7% 8.5%
Accumulated Other Comprehensive
Income (Loss) -0.3% -0.3% -0.2% -0.1% -0.1% -0.1% -0.1% -0.1% -0.1% -0.1% -0.1%
Treasury Stock -3.5% -3.2% -4.0% -3.9% -4.4% -4.5% -4.8% -5.1% -5.1% -4.9% -4.8%
Total Stockholder’s Equity 6.8% 6.6% 6.3% 6.9% 7.2% 7.5% 7.9% 8.3% 9.0% 9.7% 10.5%
Total Liabilities & Stockholder’s
Equity 32.7% 29.7% 33.2% 34.5% 34.6% 35.2% 35.6% 36.2% 36.6% 36.7% 36.8
Source: Company Filings and Team Calculations
2016 CFA Institute Research Challenge SAH
21
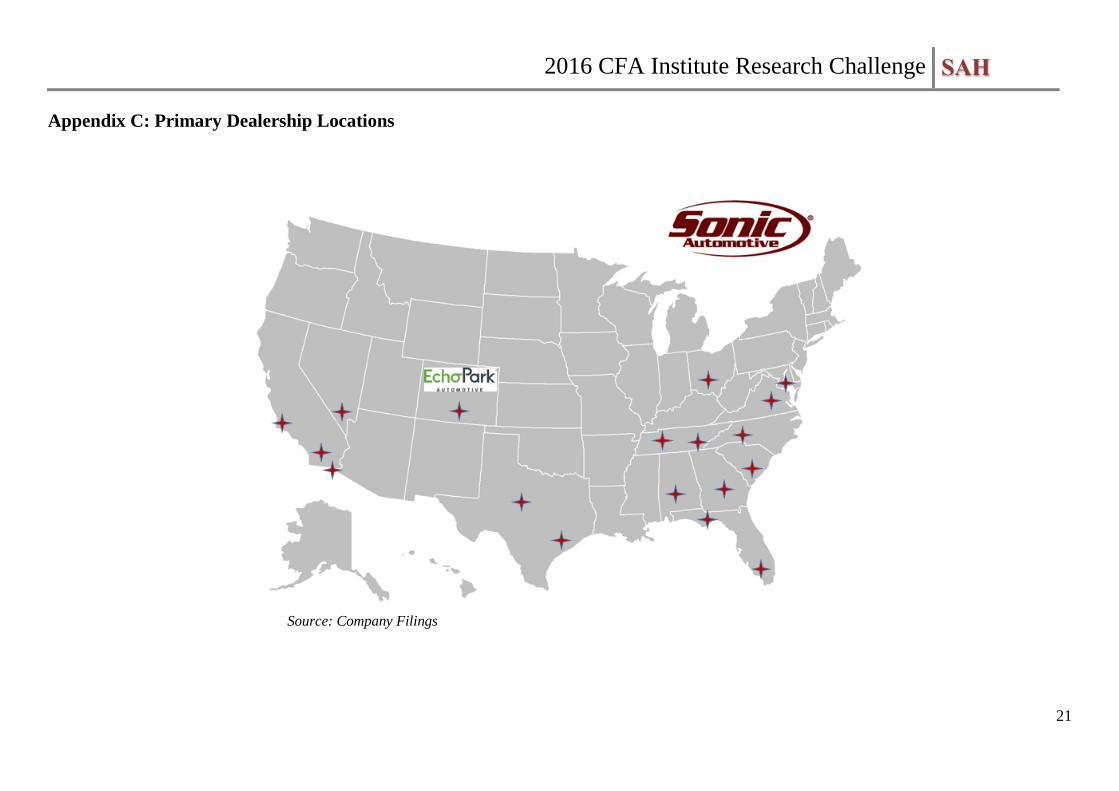
Appendix C: Primary Dealership Locations
Source: Company Filings
2016 CFA Institute Research Challenge SAH
22
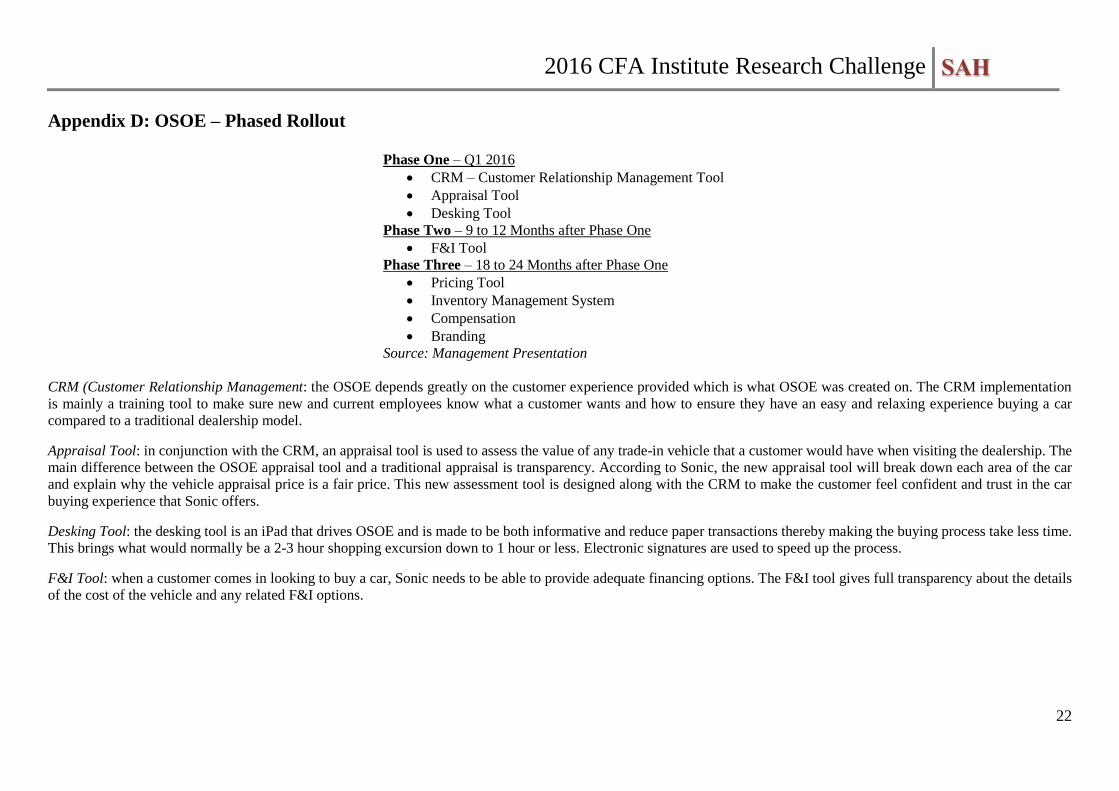
Appendix D: OSOE – Phased Rollout
Phase One – Q1 2016
CRM – Customer Relationship Management Tool
Appraisal Tool
Desking Tool
Phase Two – 9 to 12 Months after Phase One
F&I Tool
Phase Three – 18 to 24 Months after Phase One
Pricing Tool
Inventory Management System
Compensation
Branding
Source: Management Presentation
CRM (Customer Relationship Management: the OSOE depends greatly on the customer experience provided which is what OSOE was created on. The CRM implementation
is mainly a training tool to make sure new and current employees know what a customer wants and how to ensure they have an easy and relaxing experience buying a car
compared to a traditional dealership model.
Appraisal Tool: in conjunction with the CRM, an appraisal tool is used to assess the value of any trade-in vehicle that a customer would have when visiting the dealership. The
main difference between the OSOE appraisal tool and a traditional appraisal is transparency. According to Sonic, the new appraisal tool will break down each area of the car
and explain why the vehicle appraisal price is a fair price. This new assessment tool is designed along with the CRM to make the customer feel confident and trust in the car
buying experience that Sonic offers.
Desking Tool: the desking tool is an iPad that drives OSOE and is made to be both informative and reduce paper transactions thereby making the buying process take less time.
This brings what would normally be a 2-3 hour shopping excursion down to 1 hour or less. Electronic signatures are used to speed up the process.
F&I Tool: when a customer comes in looking to buy a car, Sonic needs to be able to provide adequate financing options. The F&I tool gives full transparency about the details
of the cost of the vehicle and any related F&I options.

2016 CFA Institute Research Challenge SAH
23
Appendix D: One Sonic-One Experience – Phased Rollout (continued)
Pricing Tool: to create trustworthiness and faith between the dealership and the customer, Sonic created a True Price® new car pricing model. This no haggle and transparent
pricing allows Sonic to offer a competitive price compared to their competitors. Management has stated that this pricing tool will differ from competitors because it uses 90-
day selling data to provide a real-time approximation of what price point at which SAH can effectively sell a car.
Inventory Management Tool: SAH has its own proprietary inventory management system that makes use of data analytics. Centralized inventory management system allows
for dealerships to benefit from all vehicles under the SAH brand, not just vehicles on their lots.
Compensation Tool: traditional dealerships base employee compensation on type and amount of vehicles sold while the OSOE compensates employees on a salaried basis.
Branding: sub-branding of all dealerships.

2016 CFA Institute Research Challenge SAH
24
Appendix E: Corporate Governance
O. Bruton Smith - Executive Chairman and Director
Age: 88
Founder of SAH
Appointed Executive Chairman and Director of SAH in July 2015
Served as Chief Executive Officer of Sonic Automotive, Inc. from January 1997 to July 2015
Chief Executive Officer, Executive Chairman, Director, and Controlling stockholder of Speedway Motorsports, Inc. (TRK), a publicly traded company on the New
York Stock Exchange
Experience in the automobile industry since 1966
Years with SAH: 18
B. Scott Smith – Chief Executive Officer, President, and Director
Age: 47
Co-Founder of SAH
Appointed Chief Executive Officer of SAH in July 2015
Served as Chief Strategic Officer of SAH from October 2002 to July 2015
President of SAH since March 2007
Vice Chairman from October 2002 to March 2007
President and Chief Operating Officer from April 1997 until October 2002
Director of SAH since January 1997
Son of O. Bruton Smith and the brother of David B. Smith
Over 20 years of experience in the automobile industry
Years with SAH: 18
David B. Smith – Vice Chairman and Director
Age: 40
Appointed Vice Chairman in March 2013
Executive Vice President and Director since October 2008
Senior Vice President of Corporate Development until October 2008
Vice President of Corporate Strategy from October 2005 to March 2007
Has served as Dealer Operator of several SAH dealerships prior to 2005
Son of O. Bruton Smith
Years with SAH: 17

2016 CFA Institute Research Challenge SAH
25
Appendix E: Corporate Governance (continued)
Heath R. Byrd – Executive Vice President and Chief Financial Officer
Age: 48
Chief Financial Officer since March 2013
Vice President and Chief Information Officer from November 2007 to March 2013
Director, President, Chief Operating Officer, Chief Financial Officer, and Chief Information Officer for HRAmerica, Inc.
Years with SAH: 8
Jeff Dyke – Executive Vice President of Operations
Age: 47
Vice President of Operations since October 2008
Division Chief Operating Officer - Southeast Division from March 2007 to October 2008
Division Vice President – Eastern Division from April 2006 to March 2007
Vice President of Retail Strategy from October 2005 to April 2006
Served positions in divisional, regional, and dealership management for AutoNation, Inc. from 1996 to 2005
Years with SAH: 10
Executive Team:
Position Total Compensation
O. Bruton Smith Executive Chairman, Director $3,791,078
B. Scott Smith Chief Executive Officer,
President, Director $3,298,560
David B. Smith Vice Chairman, Director $2,221,412
Heath R. Byrd Executive Vice President,
Chief Financial Officer $2,856,913
Jeff Dyke Executive Vice President,
Operations $3,683,224
Source: Company Website, www.morningstar.com

2016 CFA Institute Research Challenge SAH
26
Appendix F: Earnings History
Source: Bloomberg
Note: chart shows differences between management’s guidance and reported earnings for each quarter since 2008. In addition, reported EPS was -16.9 in Q4 2008.
-1
-0.8
-0.6
-0.4
-0.2
0
0.2
0.4
0.6
0.8
1
Q1
08
Q1
09
Q1
10
Q1
11
Q1
12
Q1
13
Q1
14
Q1
15
EPS History ($)
Reported Estimated

2016 CFA Institute Research Challenge SAH
27
Appendix G: Internet Presence
To be competitive in the automotive industry, a company must incorporate a strong online presence to effectively reach customers. Quality websites and efficient technological
platforms allow the customer to browse through inventory for multiple dealership locations. We believe SAH’s website provides the basic capabilities of shopping for vehicles,
but lacks sound functionality and user friendliness compared to its competitors. AN, KMX, and ABG are examples of automotive retailers that provide more effective websites
than SAH. While it is our belief that SAH’s main company website lacks what their competitors have already achieved, the EchoPark website provides a much easier and more
informative layout and structure.
Source(s): www.autonation.com, www.sonicautomotive.com, www.carmax.com
In comparison to SAH (center), AN’s (far left) and KMX’s (far right) websites are shown above. Aesthetically, AN and KMX are more appealing and offer a wider variety of
navigational options through both their home pages, services, vehicle information, as well as a company overview. While SAH does incorporate navigational tools to move
throughout their website, we believe AN and KMX take further steps to create a more effective layout. Time is essential when shopping for vehicles on the internet, and if an
automotive retailer can cut the steps it takes to get to a destination on the web, reaching the customer becomes simpler.
2016 CFA Institute Research Challenge SAH
28
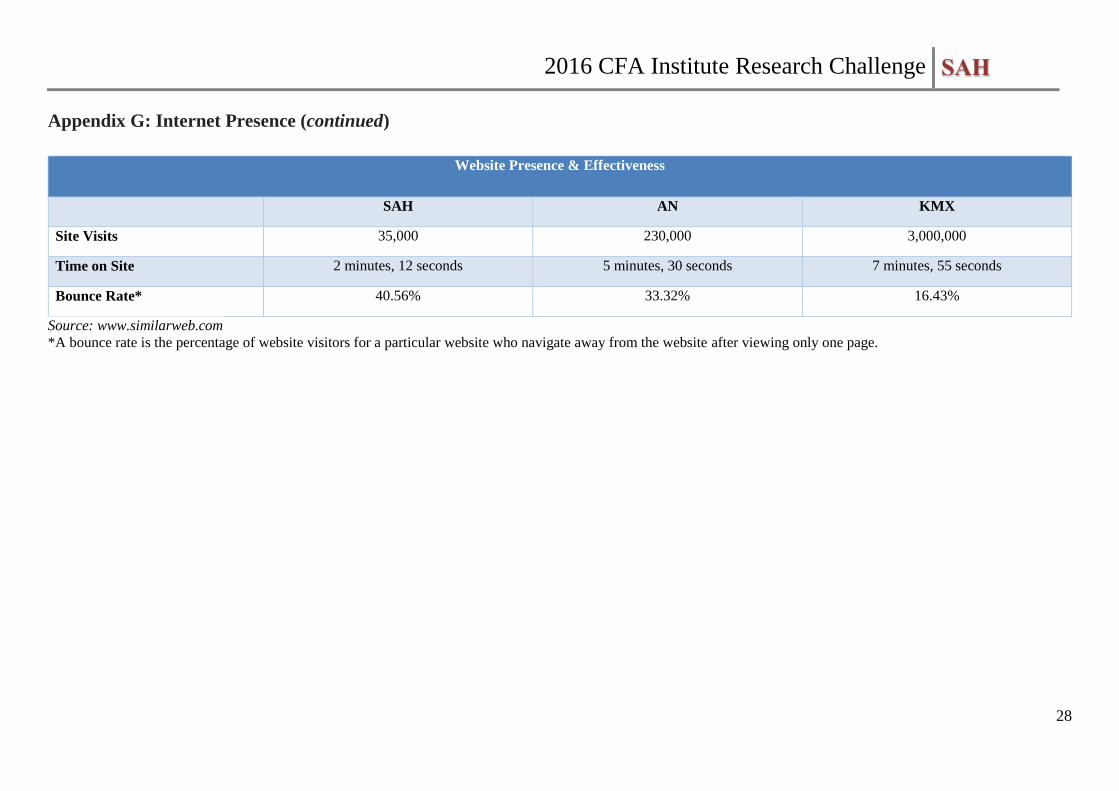
Appendix G: Internet Presence (continued)
Website Presence & Effectiveness
SAH AN KMX
Site Visits 35,000 230,000 3,000,000
Time on Site 2 minutes, 12 seconds 5 minutes, 30 seconds 7 minutes, 55 seconds
Bounce Rate* 40.56% 33.32% 16.43%
Source: www.similarweb.com
*A bounce rate is the percentage of website visitors for a particular website who navigate away from the website after viewing only one page.

2016 CFA Institute Research Challenge SAH
29
Appendix H: Revenue by Company
Year SAH AN KMX GPI LAD ABG PAG
2006 7.99 18.56 7.47 6.08 3.05 5.70 11.13
2007 6.76 17.28 8.20 6.26 2.62 5.47 12.79
2008 7.01 13.32 6.97 5.65 2.06 4.40 11.29
2009 6.01 10.62 7.47 4.53 1.78 3.41 9.33
2010 6.88 12.41 8.98 5.51 2.07 3.90 10.33
2011 7.52 13.78 10.00 6.08 2.63 4.14 11.13
2012 8.37 15.60 10.96 7.48 3.32 4.64 13.08
2013 8.84 17.35 12.57 8.92 4.01 5.34 14.29
2014 9.20 18.93 14.27 9.94 5.39 5.87 16.60
Source: Bloomberg
Note: figures are in billions of dollars.
Percentage Decline in Revenue from 2007 to 2008
Source: Bloomberg
Company % Decline
SAH -22.94%
AN -19.57%
KMX -20.78%
GPI -25.64%
LAD -1.79%
ABG -14.62%
PAG -15.91%
Industry Average -17.32%
2016 CFA Institute Research Challenge SAH
30
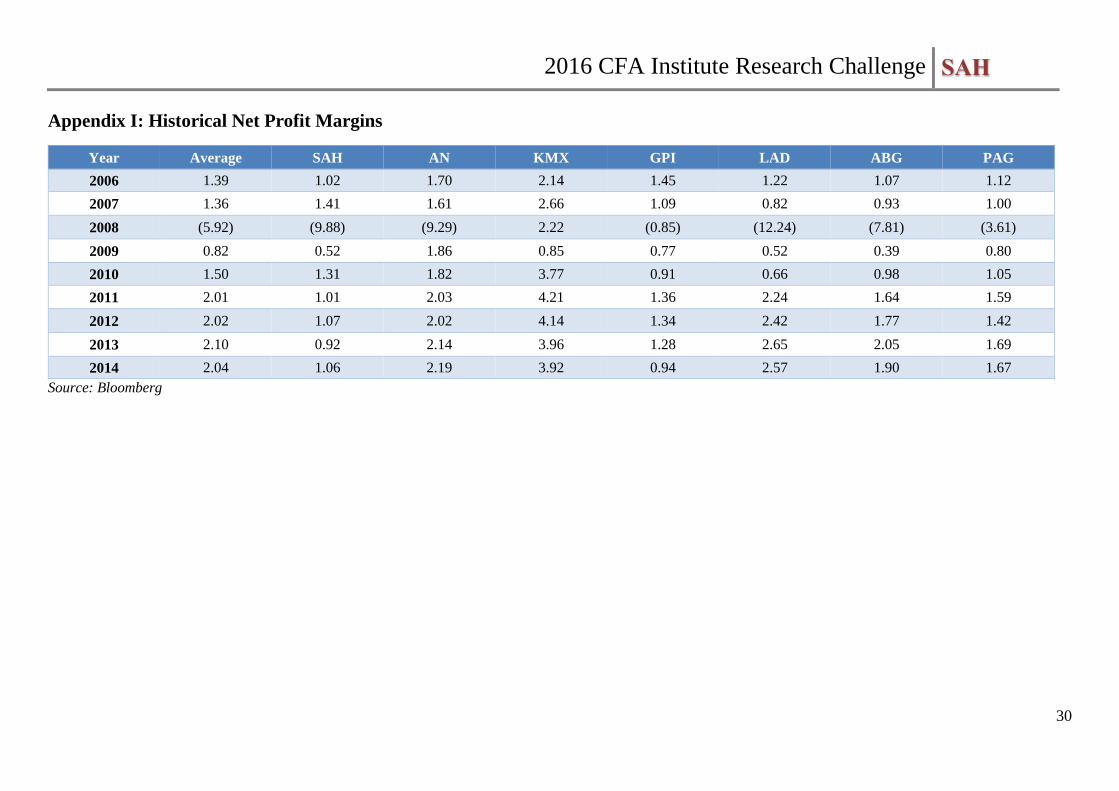
Appendix I: Historical Net Profit Margins
Source: Bloomberg
Year Average SAH AN KMX GPI LAD ABG PAG
2006 1.39 1.02 1.70 2.14 1.45 1.22 1.07 1.12
2007 1.36 1.41 1.61 2.66 1.09 0.82 0.93 1.00
2008 (5.92) (9.88) (9.29) 2.22 (0.85) (12.24) (7.81) (3.61)
2009 0.82 0.52 1.86 0.85 0.77 0.52 0.39 0.80
2010 1.50 1.31 1.82 3.77 0.91 0.66 0.98 1.05
2011 2.01 1.01 2.03 4.21 1.36 2.24 1.64 1.59
2012 2.02 1.07 2.02 4.14 1.34 2.42 1.77 1.42
2013 2.10 0.92 2.14 3.96 1.28 2.65 2.05 1.69
2014 2.04 1.06 2.19 3.92 0.94 2.57 1.90 1.67
2016 CFA Institute Research Challenge SAH
31
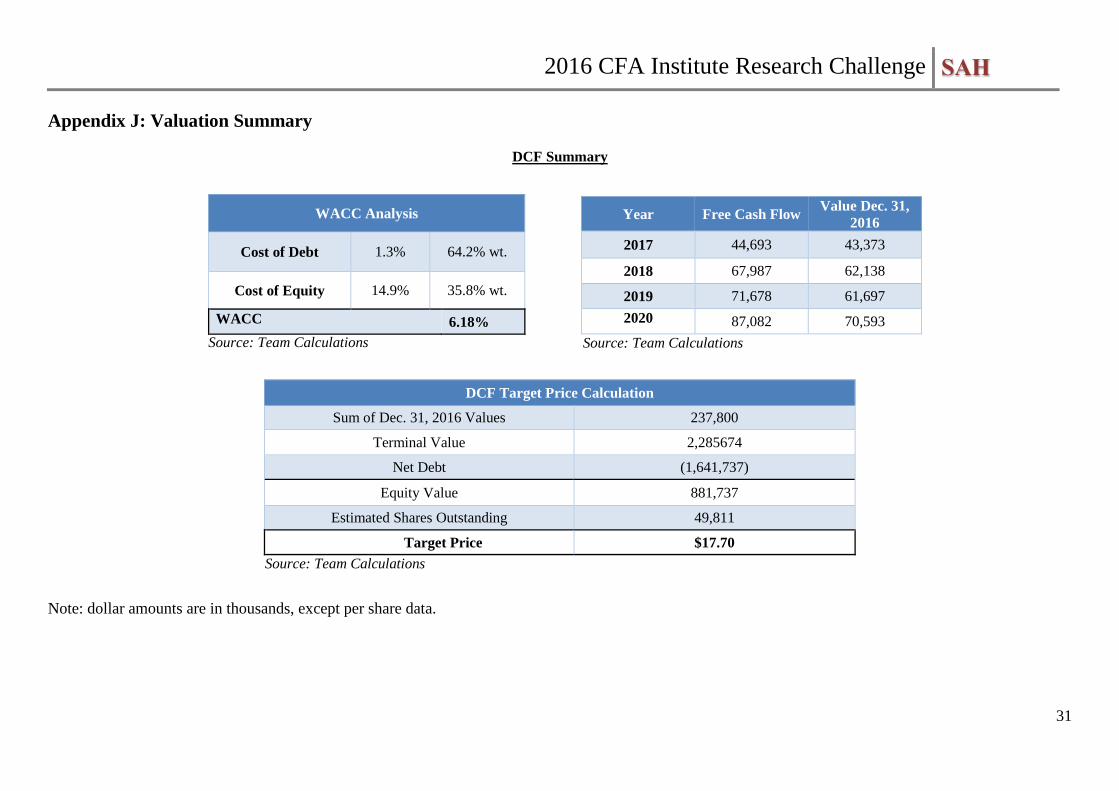
Appendix J: Valuation Summary
DCF Summary
Note: dollar amounts are in thousands, except per share data.
WACC Analysis
Cost of Debt 1.3% 64.2% wt.
Cost of Equity 14.9% 35.8% wt.
WACC 6.18%
Year Free Cash Flow Value Dec. 31,
2016
2017 44,693 43,373
2018 67,987 62,138
2019 71,678 61,697
2020 87,082 70,593
DCF Target Price Calculation
Sum of Dec. 31, 2016 Values 237,800
Terminal Value 2,285674
Net Debt (1,641,737)
Equity Value 881,737
Estimated Shares Outstanding 49,811
Target Price $17.70
Source: Team Calculations
Source: Team Calculations Source: Team Calculations

2016 CFA Institute Research Challenge SAH
32
Appendix J: Valuation Summary (continued)
P/E Multiple Summary
Historic P/E Industry AN KMX SAH
TTM 10.48 11.52 15.24 9.28
5yr Average 14.85 16.91 20.51 10.45
10yr Average 14.07 17.51 22.89 10.02
Maximum (10yr) 53.59 39.85 61.94 23.84
Minimum (10yr) 6.76 8.05 8.05 2.13
Estimated 9.00
Source: Bloomberg and Team Calculations
SAH’s P/E has trailed the industry by 30% and it has not been higher than
the industry average since before 2000. SAH’s P/E moves cyclically and is
coming off of a recent high so it will likely continue to trend lower. We believe
that a contributing factor to SAH lagging the industry in stock
performance is the negative impact of corporate governance due to the
Smith family having complete voting control. We believe this devalues all
other voting shares. Taking all of this into account, we reached our target
P/E of 9.00.
Note: gap from 1/09 – 1/10 represents negative EPS.
P/E Target Price
2016 EPS Estimate 2.08
Estimated P/E 9.00
2016 Target Price 18.68 Source: Team Calculations
P/E since 2000
Source: Bloomberg
0
10
20
30
40
50
60
SAH Competitor Average
2016 CFA Institute Research Challenge SAH
33
Appendix K: Sensitivity Analysis
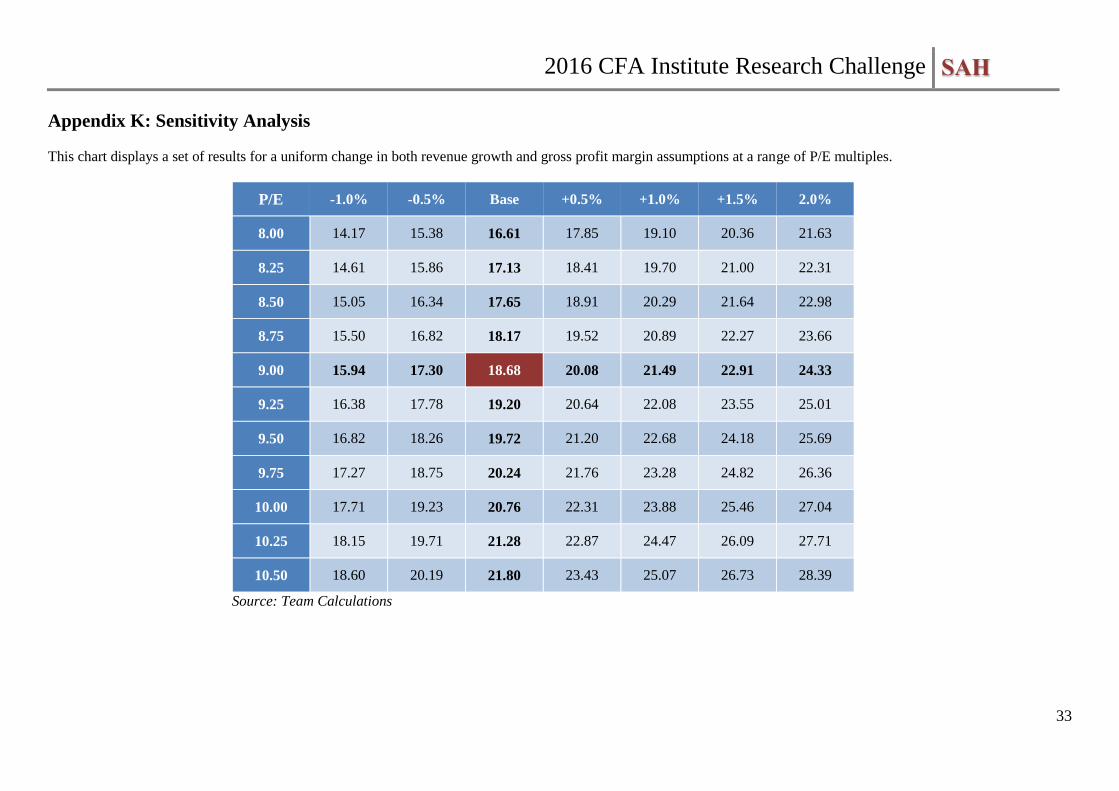
This chart displays a set of results for a uniform change in both revenue growth and gross profit margin assumptions at a range of P/E multiples.
P/E -1.0% -0.5% Base +0.5% +1.0% +1.5% 2.0%
8.00 14.17 15.38 16.61 17.85 19.10 20.36 21.63
8.25 14.61 15.86 17.13 18.41 19.70 21.00 22.31
8.50 15.05 16.34 17.65 18.91 20.29 21.64 22.98
8.75 15.50 16.82 18.17 19.52 20.89 22.27 23.66
9.00 15.94 17.30 18.68 20.08 21.49 22.91 24.33
9.25 16.38 17.78 19.20 20.64 22.08 23.55 25.01
9.50 16.82 18.26 19.72 21.20 22.68 24.18 25.69
9.75 17.27 18.75 20.24 21.76 23.28 24.82 26.36
10.00 17.71 19.23 20.76 22.31 23.88 25.46 27.04
10.25 18.15 19.71 21.28 22.87 24.47 26.09 27.71
10.50 18.60 20.19 21.80 23.43 25.07 26.73 28.39
Source: Team Calculations

2016 CFA Institute Research Challenge SAH
34
Appendix K: Sensitivity Analysis (continued)
This chart displays a set of results for a uniform change in both revenue growth and gross profit margin assumptions at a range of terminal growth possibilities.
Terminal
Growth -1.0% -0.5% Base +0.5% +1.0% +1.5% 2.0%
2.50% 2.95 7.02 11.28 15.71 20.32 25.11 30.10
2.60% 3.88 8.06 12.42 16.96 21.68 26.60 31.72
2.70% 4.87 9.15 13.63 18.28 23.13 28.18 33.42
2.80% 5.91 10.31 14.90 19.68 24.66 29.84 35.23
2.90% 7.02 11.54 16.26 21.17 26.29 31.61 37.14
3.00% 8.20 12.85 17.70 22.75 28.01 33.49 39.18
3.10% 9.45 14.24 19.24 24.44 29.85 35.49 41.35
3.20% 10.79 15.73 20.88 26.24 31.82 37.62 43.66
3.30% 12.23 17.32 22.63 28.16 33.91 39.90 46.13
3.40% 13.76 19.02 24.51 30.22 36.16 42.35 48.78
3.50% 15.41 20.85 26.52 32.43 38.58 44.98 51.63
Source: Team Calculations