sonic healthcare limitedinvestors.sonichealthcare.com/formbuilder/_resource/_module/t8ln_c... ·...
TRANSCRIPT
Sonic Healthcare Limited ABN 24 004 196 909 Annual Report – 30 June 2017
Contents
Corporate Directory 1
Chairman’s Letter 2
CEO Report 3
Financial History 4
Directors’ Report 5
Corporate Governance Statement 35
Financial Report 46
Directors’ Declaration 112
Independent Auditor’s Report to the Members 113
Shareholders’ Information 118
Corporate Responsibility Report 2017 - Please refer to the Sonic Healthcare website at: http://investors.sonichealthcare.com/corporate-responsibility/?page=corporate-responsibility
Sonic Healthcare Limited and controlled entities
1
Corporate Directory
Directors Prof M.R. Compton Chairman Dr C.S. Goldschmidt Managing Director
Mr C.D. Wilks Finance Director Dr P.J. Dubois Mr L.J. Panaccio Ms K.D. Spargo Dr E.J. Wilson Company Secretary Mr P.J. Alexander Principal registered office in Australia 14 Giffnock Avenue, Macquarie Park,
New South Wales, 2113, Australia.
Ph: 61 2 9855 5444 Fax: 61 2 9878 5066 Website: www.sonichealthcare.com
Share registry Computershare Investor Services Pty Limited
Level 5, 115 Grenfell Street, Adelaide, South Australia, 5000, Australia.
Ph: 1300 556 161 (Within Australia) Ph: 61 3 9415 4000 (Outside Australia) Fax: 1300 534 987 (Within Australia) Fax: 61 3 9473 2408 (Outside Australia) Website: www.computershare.com Email: www.investorcentre.com/contact
Auditor PricewaterhouseCoopers Solicitors Allens
Bankers Australia and New Zealand Banking Group
BNP Paribas Citibank Commerzbank Commonwealth Bank of Australia Crédit Industriel et Commercial DNB Asia HSBC JPMorgan Chase Bank Mizuho Corporate Bank National Australia Bank The Bank of Tokyo-Mitsubishi UFJ Westpac Banking Corporation
Stock exchange listings Sonic Healthcare Limited (SHL.AX) shares are listed on the Australian
Securities Exchange.
Sonic Healthcare Limited and controlled entities
2
Chairman’s Letter Dear Fellow Shareholders, On behalf of the Board of Sonic Healthcare, I am delighted to present to you the company’s 2017 Annual Report. This year Sonic celebrates its 30th year as an Australian Securities Exchange (ASX) listed company. Over that time Sonic became an ASX Top 50 company, and has been one of the best performing stocks on the ASX, with a total shareholder return of over 15,000%. Sonic acquired its first laboratory practice in 1987, Sydney based Douglass Hanly Moir Pathology (then known as Douglass Laboratories). It would have been hard to imagine in 1987 that in 2017 Sonic would provide medical services to over 108 million patients, and would be a critical part of the healthcare infrastructure of eight countries. However, the company’s unwavering commitment to provide exceptional patient care and outstanding service to doctors would have been evident even at that early time. Sonic reported a net profit for the 2017 financial year of A$428 million, on revenues of A$5,122 million. Strong underlying organic revenue growth and margin improvements in the Laboratory and Imaging divisions were further enhanced by synergistic business acquisitions and the formation of joint ventures during the year, which will be further accretive in 2018 and beyond. Despite some currency translation headwinds impacting statutory profit in 2017, the Board determined to reward shareholders with a 4.1% increase in total dividends per share for the year, continuing our progressive dividend policy. Sonic’s 30 year anniversary brings to mind one of the many positive features of our company, being its ability to retain and develop dedicated and highly experienced senior staff, fostered by the binding effect of our unique corporate culture of Medical Leadership. This is perhaps best demonstrated by the many pathologists, radiologists, managers and scientific staff around the group who have sold their practices to Sonic in the past, but who have been enthusiastic to continue to work within Sonic, in some cases for more than two decades afterwards. Sonic’s strong, positive and highly professional culture, centred on Medical Leadership, has continued to motivate them and made them very much part of the global Sonic family. I would like to recommend that all shareholders take time to read Sonic’s 2017 Corporate Responsibility Report, which you can find on our website. The environmental, social and governance activities described in the report are key elements of Sonic, and I believe that Sonic shareholders can be very proud of their company and its efforts in these areas. The report highlights our contributions to education, the steps we take to minimise our environmental impact, and our support for local communities. It also describes our support for communities in developing countries through our Catalyst Program, which involves using our medical expertise and resources to directly address the dire medical needs in some of the most disadvantaged regions in the world. Sonic’s standing as a socially responsible company continues to be evidenced by our ongoing inclusion (since March 2008) in the FTSE4Good Index Series. To be included in the Series, Sonic has been independently assessed to have met stringent environmental, social and governance criteria. Looking towards 2018 and beyond, Sonic expects ongoing strong organic revenue and earnings growth, bolstered by further acquisitions, joint ventures and contract opportunities. We have the talent, market positions, reputation and financial strength to capitalise on growth opportunities as they arise, whilst always looking to enhance our existing businesses, all focused on generating returns to shareholders through excellent service to our doctors, other clients and those for whom they care. I wish to thank our talented management teams and all of Sonic’s 33,000 plus hardworking fantastic staff for making the company what it is today, and I also thank you, our shareholders, for continuing to support us on the incredible journey that is Sonic Healthcare.
Mark Compton AM Chairman
Sonic Healthcare Limited and controlled entities
3
CEO Report Sonic’s results for the 2017 financial year demonstrated again the stability and strength of the company, its culture, and its people. Underlying revenue, EBITDA and Net Profit growth for 2017 were 5.8%, 5.3% and 4.4% respectively. Operating cash flow grew 4.0%, with 103% conversion of EBITDA to gross (pre-interest and pre-tax) operating cash flow. 2017 statutory results were impacted by foreign currency headwinds of ~4%. Comparisons of the statutory results to the prior year were also impacted by non-recurring items, the most significant of which was a gain of A$34.8 million (pre and post-tax) on the sale and leaseback of properties in 2016. Perhaps the most pleasing aspects of the results were the improvement in margins in both our Laboratory and Imaging divisions, and in particular, the return to earnings growth and margin enhancement in our Australian laboratory business, which had been impacted by abnormal cost growth due to industry issues for several years. Our strategies to manage these costs are now in full effect and we are confident of ongoing earnings growth. On an underlying constant currency basis, the Laboratory division revenue grew 6% (~4% organic growth) and EBITDA rose 8% with 25 basis points of margin accretion. Imaging division revenue grew 5% (~4% organic), with EBITDA climbing 7% with 30 basis points of margin accretion. Our German and Swiss laboratory businesses once again performed exceptionally, with strong organic revenue growth and focussed cost control. The acquisitions we completed in the year, including Staber in Germany and West Pacific Medical in the USA, have performed to expectation and integration projects are well advanced. Since year end we have also welcomed Medical Laboratory Bremen into the Sonic family, and our pipeline of further acquisition prospects remains robust. Sonic’s strategy to partner with hospital networks in the USA to provide laboratory services is proving highly successful, with our joint ventures with Western Connecticut Health Network and Baptist Memorial Health Care underway since April and running smoothly, and with the recent signing of agreements with the New York University hospital system (NYU Langone Health) as partner to offer enhanced outreach laboratory services for NYU’s more than 2,000 affiliated physicians and healthcare providers. We also have a strong pipeline of additional opportunities in prospect, as Sonic’s reputation as a medically led, high quality, flexible partner spreads through the hospital systems in the USA. Sonic’s reputation has been further enhanced by our recent selection as the pathology partner for the Australian Government’s National Bowel Cancer Screening Program. This appointment reflects our commitment to quality pathology and our deep experience in cancer prevention, testing and diagnosis. We look forward to partnering with the Australian Government in helping to deliver and enhance this important community health program. Sonic Healthcare is in a prime position to continue our strategy of leading the consolidation of fragmented international laboratory markets and capitalising on attractive healthcare dynamics, underpinned by our:
Medical Leadership culture, which unifies the company, augments our services and provides competitive advantage; Strong market positions, including market leadership in four major Western countries; and Stable, experienced and passionate global management teams.
I express my sincere thanks to Sonic’s entire global team of over 33,000 people, for their support of Sonic’s culture and goals, and their expertise and passion to offer the best possible healthcare services to our patients and medical colleagues. Dr Colin Goldschmidt CEO and Managing Director
Sonic Healthcare Limited and controlled entities
4
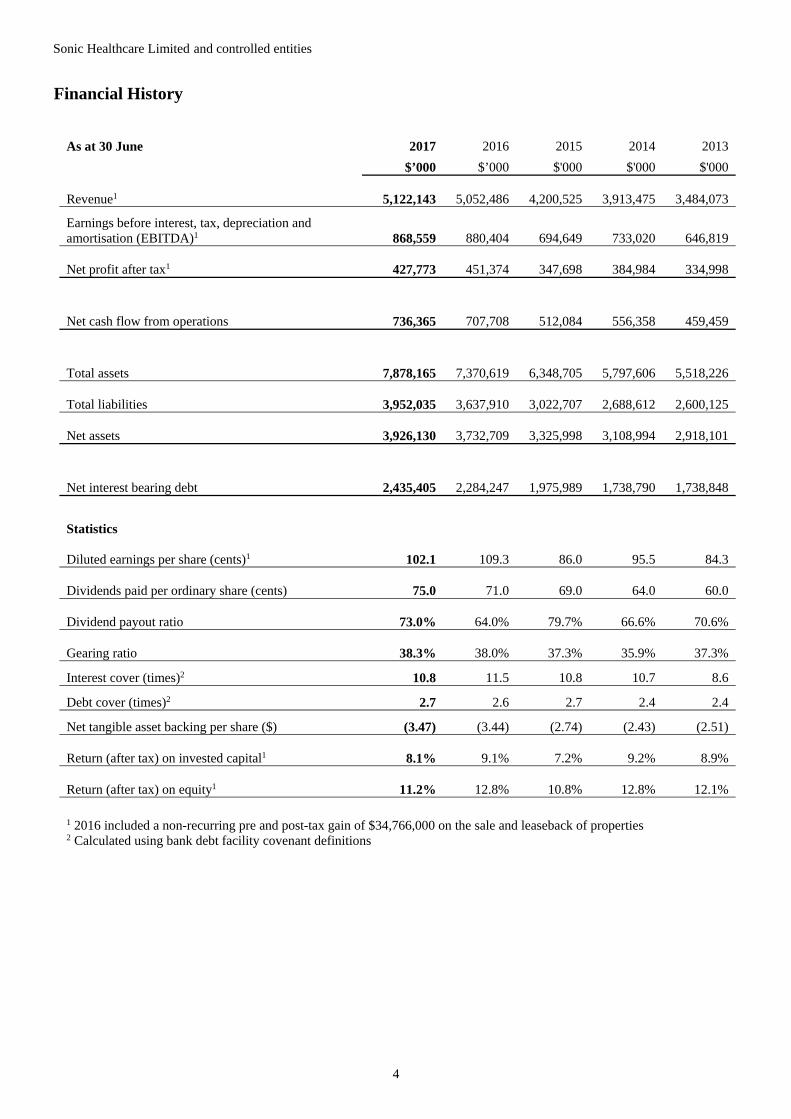
Financial History
As at 30 June 2017 2016 2015 2014 2013
$’000 $’000 $'000 $'000 $'000
Revenue1 5,122,143 5,052,486 4,200,525 3,913,475
3,484,073
Earnings before interest, tax, depreciation and amortisation (EBITDA)1 868,559 880,404 694,649 733,020 646,819
Net profit after tax1 427,773 451,374 347,698 384,984
334,998
Net cash flow from operations 736,365 707,708 512,084 556,358
459,459
Total assets 7,878,165 7,370,619 6,348,705 5,797,606
5,518,226
Total liabilities 3,952,035 3,637,910 3,022,707 2,688,612
2,600,125
Net assets 3,926,130 3,732,709 3,325,998 3,108,994
2,918,101
Net interest bearing debt 2,435,405 2,284,247 1,975,989 1,738,790
1,738,848
Statistics
Diluted earnings per share (cents)1 102.1 109.3 86.0 95.5
84.3 Dividends paid per ordinary share (cents) 75.0 71.0 69.0 64.0 60.0 Dividend payout ratio 73.0% 64.0% 79.7% 66.6% 70.6%
Gearing ratio 38.3% 38.0% 37.3% 35.9%
37.3%
Interest cover (times)2 10.8 11.5 10.8 10.7 8.6
Debt cover (times)2 2.7 2.6 2.7 2.4 2.4
Net tangible asset backing per share ($) (3.47) (3.44) (2.74) (2.43) (2.51) Return (after tax) on invested capital1 8.1% 9.1% 7.2% 9.2% 8.9% Return (after tax) on equity1 11.2% 12.8% 10.8% 12.8% 12.1%
1 2016 included a non-recurring pre and post-tax gain of $34,766,000 on the sale and leaseback of properties 2 Calculated using bank debt facility covenant definitions
Sonic Healthcare Limited and controlled entities
5
Directors’ Report Your Directors present their report on the Group consisting of Sonic Healthcare Limited and the entities it controlled at the end of, or during, the year ended 30 June 2017. Directors The following persons were Directors of Sonic Healthcare Limited during the whole of the financial year and up to the date of this report: Prof M.R. Compton Chairman Dr C.S. Goldschmidt Managing Director Mr C.D. Wilks Finance Director Dr P.J. Dubois Mr L.J. Panaccio Ms K.D. Spargo Dr E.J. Wilson Principal activities During the year the principal continuing activities of the Group consisted of the provision of medical diagnostic services and the provision of administrative services and facilities to medical practitioners. Dividends Details of dividends in respect of the current year and previous financial year are as follows: 2017
$’000 2016
$’000 Interim dividend paid on 11 April 2017 (2016: 6 April 2016) 129,385 124,008 Final dividend payable on 11 October 2017 (2016: 27 September 2016) 193,176 182,963 Total dividend for the year 322,561 306,971
On 15 August 2017, the Board declared a final dividend in respect of the year ended 30 June 2017 of 46 cents per ordinary share, 20% franked (at 30%), payable on 11 October 2017 with a record date of 11 September 2017. An interim dividend of 31 cents per ordinary share, 20% franked (at 30%), was paid on 11 April 2017. These dividends included no conduit foreign income. A final dividend of 44 cents per ordinary share was paid on 27 September 2016 in respect of the year ended 30 June 2016, out of profits of that year. The interim dividend in respect of the year ended 30 June 2016 was 30 cents per ordinary share, paid on 6 April 2016. These dividends included no conduit foreign income. Dividend Reinvestment Plan (“DRP”) The Company’s Dividend Reinvestment Plan is in operation for the FY2017 final dividend, with a discount of 1.5%. The pricing period for DRP purposes will be 10 trading days, starting on 14 September 2017 and concluding on 27 September 2017 (inclusive).
Sonic Healthcare Limited and controlled entities
Directors' Report (continued)
6
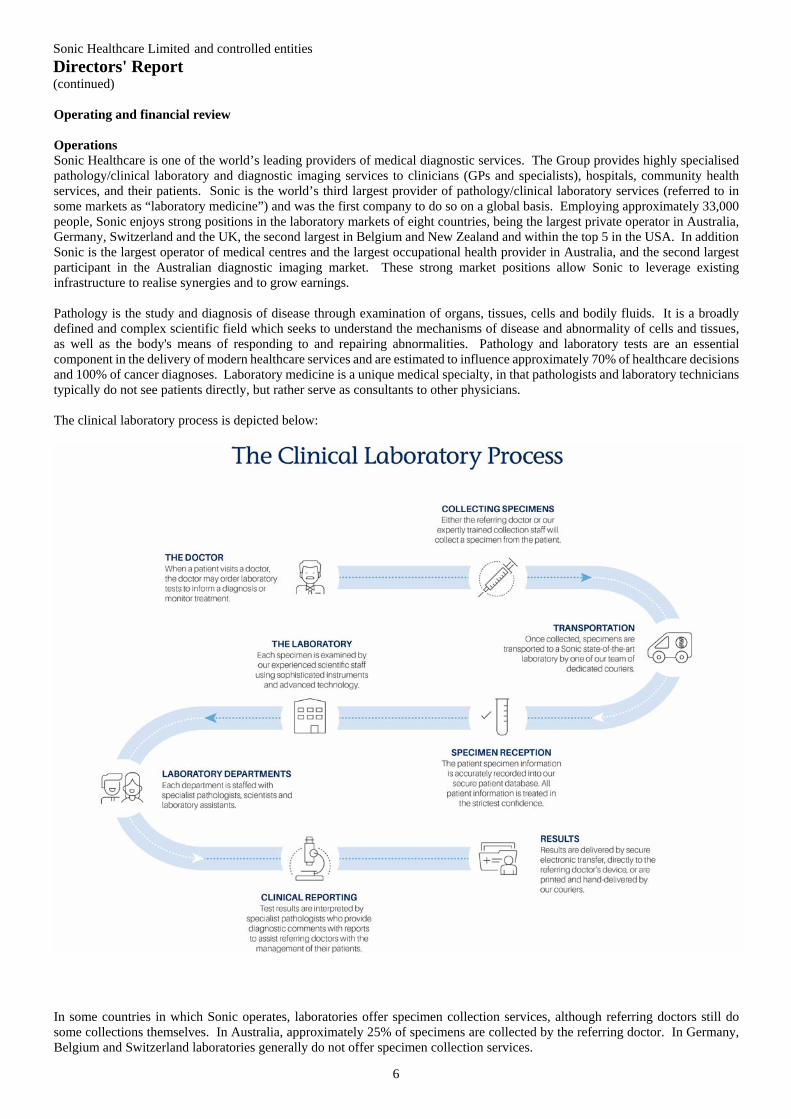
Operating and financial review Operations Sonic Healthcare is one of the world’s leading providers of medical diagnostic services. The Group provides highly specialised pathology/clinical laboratory and diagnostic imaging services to clinicians (GPs and specialists), hospitals, community health services, and their patients. Sonic is the world’s third largest provider of pathology/clinical laboratory services (referred to in some markets as “laboratory medicine”) and was the first company to do so on a global basis. Employing approximately 33,000 people, Sonic enjoys strong positions in the laboratory markets of eight countries, being the largest private operator in Australia, Germany, Switzerland and the UK, the second largest in Belgium and New Zealand and within the top 5 in the USA. In addition Sonic is the largest operator of medical centres and the largest occupational health provider in Australia, and the second largest participant in the Australian diagnostic imaging market. These strong market positions allow Sonic to leverage existing infrastructure to realise synergies and to grow earnings. Pathology is the study and diagnosis of disease through examination of organs, tissues, cells and bodily fluids. It is a broadly defined and complex scientific field which seeks to understand the mechanisms of disease and abnormality of cells and tissues, as well as the body's means of responding to and repairing abnormalities. Pathology and laboratory tests are an essential component in the delivery of modern healthcare services and are estimated to influence approximately 70% of healthcare decisions and 100% of cancer diagnoses. Laboratory medicine is a unique medical specialty, in that pathologists and laboratory technicians typically do not see patients directly, but rather serve as consultants to other physicians. The clinical laboratory process is depicted below:
In some countries in which Sonic operates, laboratories offer specimen collection services, although referring doctors still do some collections themselves. In Australia, approximately 25% of specimens are collected by the referring doctor. In Germany, Belgium and Switzerland laboratories generally do not offer specimen collection services.
Sonic Healthcare Limited and controlled entities
Directors' Report (continued)
7
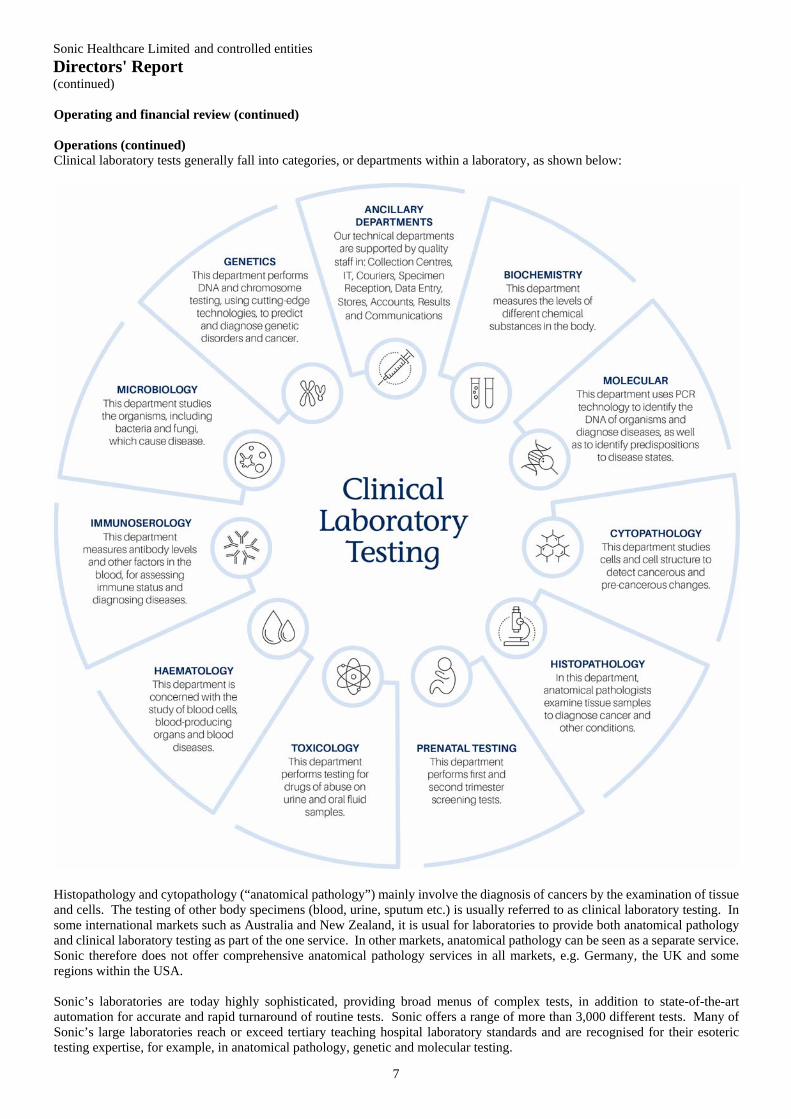
Operating and financial review (continued) Operations (continued) Clinical laboratory tests generally fall into categories, or departments within a laboratory, as shown below:
Histopathology and cytopathology (“anatomical pathology”) mainly involve the diagnosis of cancers by the examination of tissue and cells. The testing of other body specimens (blood, urine, sputum etc.) is usually referred to as clinical laboratory testing. In some international markets such as Australia and New Zealand, it is usual for laboratories to provide both anatomical pathology and clinical laboratory testing as part of the one service. In other markets, anatomical pathology can be seen as a separate service. Sonic therefore does not offer comprehensive anatomical pathology services in all markets, e.g. Germany, the UK and some regions within the USA. Sonic’s laboratories are today highly sophisticated, providing broad menus of complex tests, in addition to state-of-the-art automation for accurate and rapid turnaround of routine tests. Sonic offers a range of more than 3,000 different tests. Many of Sonic’s large laboratories reach or exceed tertiary teaching hospital laboratory standards and are recognised for their esoteric testing expertise, for example, in anatomical pathology, genetic and molecular testing.
Sonic Healthcare Limited and controlled entities Directors' Report (continued)
8
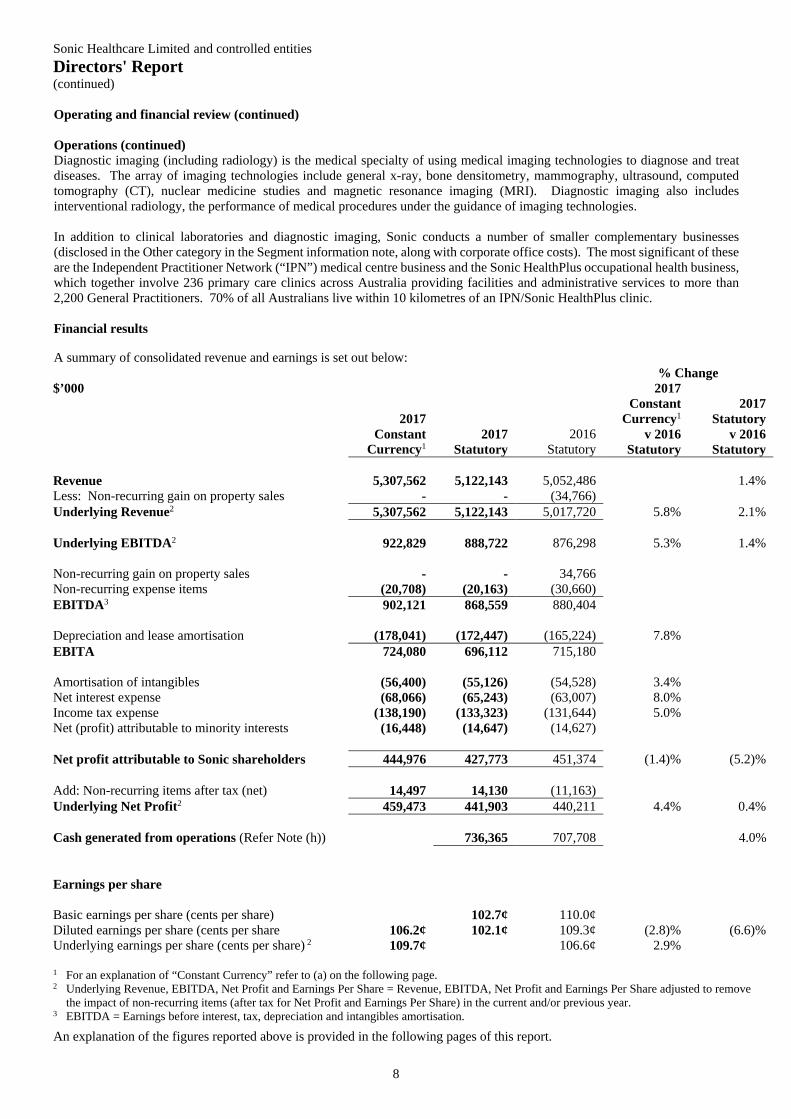
Operating and financial review (continued) Operations (continued) Diagnostic imaging (including radiology) is the medical specialty of using medical imaging technologies to diagnose and treat diseases. The array of imaging technologies include general x-ray, bone densitometry, mammography, ultrasound, computed tomography (CT), nuclear medicine studies and magnetic resonance imaging (MRI). Diagnostic imaging also includes interventional radiology, the performance of medical procedures under the guidance of imaging technologies. In addition to clinical laboratories and diagnostic imaging, Sonic conducts a number of smaller complementary businesses (disclosed in the Other category in the Segment information note, along with corporate office costs). The most significant of these are the Independent Practitioner Network (“IPN”) medical centre business and the Sonic HealthPlus occupational health business, which together involve 236 primary care clinics across Australia providing facilities and administrative services to more than 2,200 General Practitioners. 70% of all Australians live within 10 kilometres of an IPN/Sonic HealthPlus clinic. Financial results A summary of consolidated revenue and earnings is set out below:
% Change $’000
2017
Constant Currency1
2017 Statutory
2016 Statutory
2017 Constant
Currency1 v 2016
Statutory
2017
Statutory v 2016
Statutory
Revenue 5,307,562 5,122,143 5,052,486 1.4% Less: Non-recurring gain on property sales - - (34,766) Underlying Revenue2 5,307,562 5,122,143 5,017,720 5.8% 2.1% Underlying EBITDA2 922,829 888,722 876,298 5.3% 1.4% Non-recurring gain on property sales - - 34,766 Non-recurring expense items (20,708) (20,163) (30,660) EBITDA3 902,121 868,559 880,404 Depreciation and lease amortisation (178,041) (172,447) (165,224) 7.8% EBITA 724,080 696,112 715,180 Amortisation of intangibles (56,400) (55,126) (54,528) 3.4% Net interest expense (68,066) (65,243) (63,007) 8.0% Income tax expense (138,190) (133,323) (131,644) 5.0% Net (profit) attributable to minority interests
(16,448)
(14,647)
(14,627)
Net profit attributable to Sonic shareholders 444,976 427,773 451,374 (1.4)% (5.2)% Add: Non-recurring items after tax (net) 14,497 14,130 (11,163) Underlying Net Profit2 459,473 441,903 440,211 4.4% 0.4% Cash generated from operations (Refer Note (h)) 736,365 707,708 4.0% Earnings per share Basic earnings per share (cents per share) 102.7¢ 110.0¢ Diluted earnings per share (cents per share 106.2¢ 102.1¢ 109.3¢ (2.8)% (6.6)% Underlying earnings per share (cents per share) 2 109.7¢ 106.6¢ 2.9% 1 For an explanation of “Constant Currency” refer to (a) on the following page. 2 Underlying Revenue, EBITDA, Net Profit and Earnings Per Share = Revenue, EBITDA, Net Profit and Earnings Per Share adjusted to remove
the impact of non-recurring items (after tax for Net Profit and Earnings Per Share) in the current and/or previous year. 3 EBITDA = Earnings before interest, tax, depreciation and intangibles amortisation.
An explanation of the figures reported above is provided in the following pages of this report.
Sonic Healthcare Limited and controlled entities Directors' Report (continued)
9
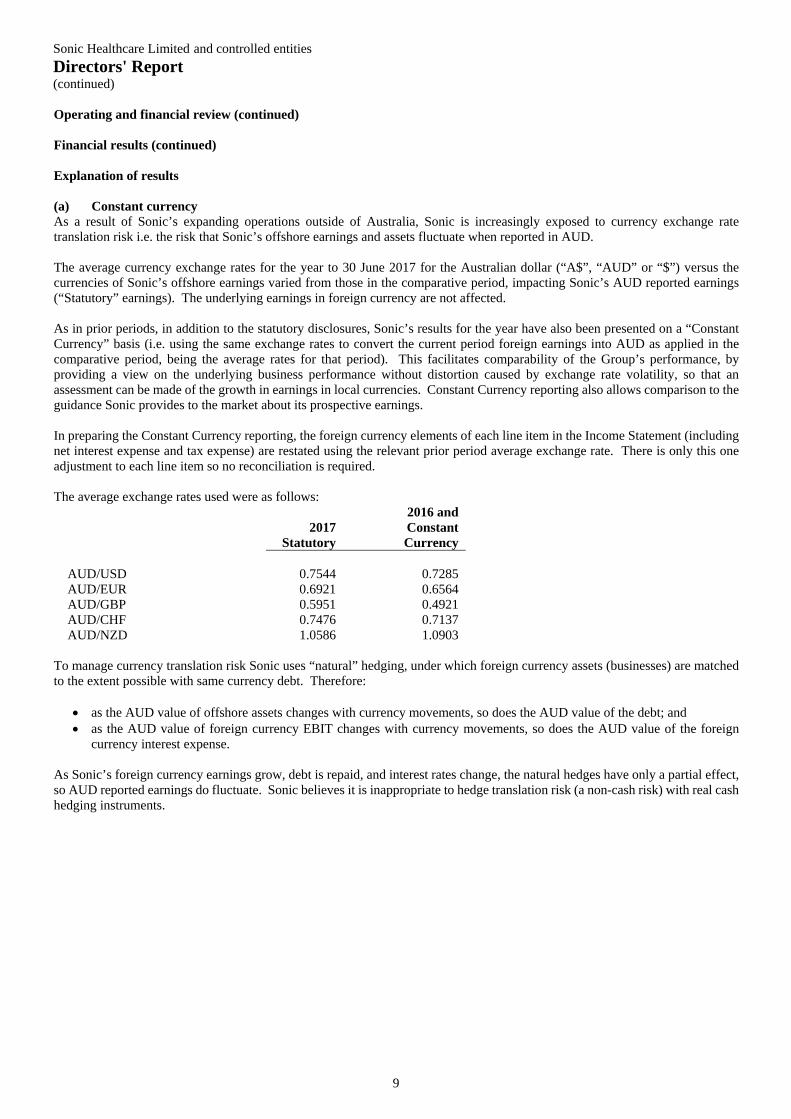
Operating and financial review (continued) Financial results (continued) Explanation of results (a) Constant currency As a result of Sonic’s expanding operations outside of Australia, Sonic is increasingly exposed to currency exchange rate translation risk i.e. the risk that Sonic’s offshore earnings and assets fluctuate when reported in AUD. The average currency exchange rates for the year to 30 June 2017 for the Australian dollar (“A$”, “AUD” or “$”) versus the currencies of Sonic’s offshore earnings varied from those in the comparative period, impacting Sonic’s AUD reported earnings (“Statutory” earnings). The underlying earnings in foreign currency are not affected. As in prior periods, in addition to the statutory disclosures, Sonic’s results for the year have also been presented on a “Constant Currency” basis (i.e. using the same exchange rates to convert the current period foreign earnings into AUD as applied in the comparative period, being the average rates for that period). This facilitates comparability of the Group’s performance, by providing a view on the underlying business performance without distortion caused by exchange rate volatility, so that an assessment can be made of the growth in earnings in local currencies. Constant Currency reporting also allows comparison to the guidance Sonic provides to the market about its prospective earnings. In preparing the Constant Currency reporting, the foreign currency elements of each line item in the Income Statement (including net interest expense and tax expense) are restated using the relevant prior period average exchange rate. There is only this one adjustment to each line item so no reconciliation is required. The average exchange rates used were as follows:
2017
Statutory
2016 and Constant Currency
AUD/USD 0.7544 0.7285 AUD/EUR 0.6921 0.6564 AUD/GBP 0.5951 0.4921 AUD/CHF 0.7476 0.7137 AUD/NZD 1.0586 1.0903
To manage currency translation risk Sonic uses “natural” hedging, under which foreign currency assets (businesses) are matched to the extent possible with same currency debt. Therefore:
as the AUD value of offshore assets changes with currency movements, so does the AUD value of the debt; and as the AUD value of foreign currency EBIT changes with currency movements, so does the AUD value of the foreign
currency interest expense.
As Sonic’s foreign currency earnings grow, debt is repaid, and interest rates change, the natural hedges have only a partial effect, so AUD reported earnings do fluctuate. Sonic believes it is inappropriate to hedge translation risk (a non-cash risk) with real cash hedging instruments.
Sonic Healthcare Limited and controlled entities Directors' Report (continued)
10
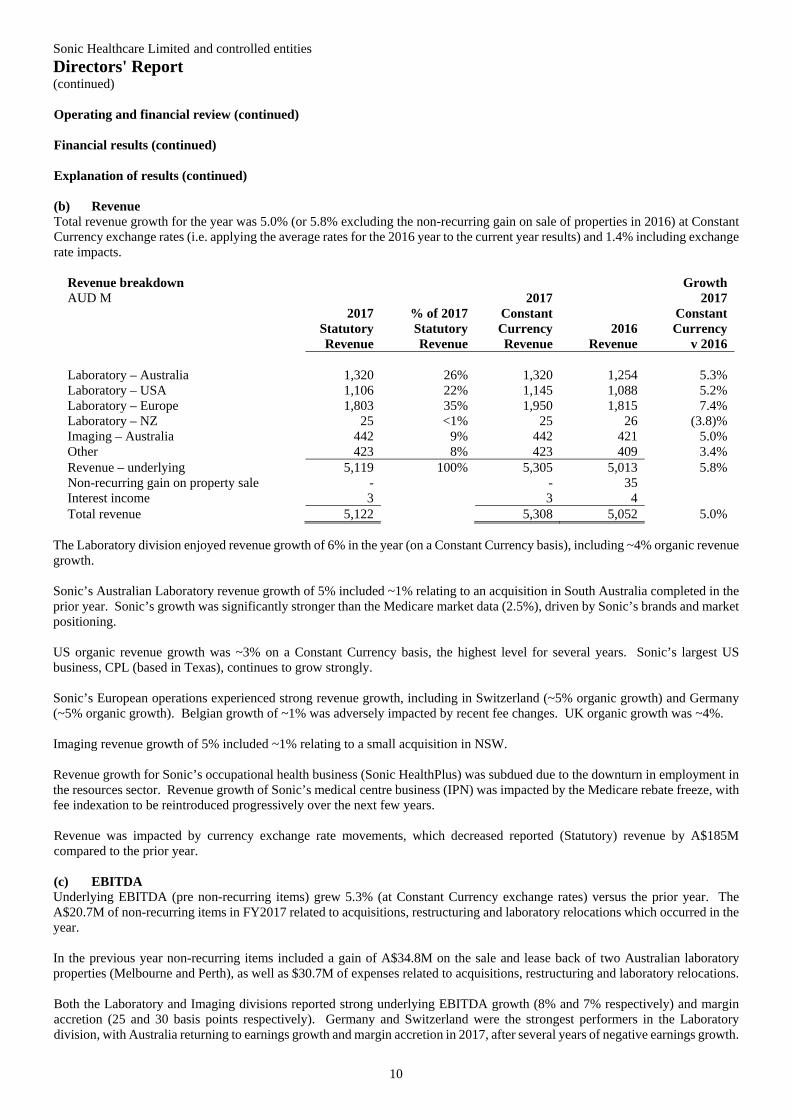
Operating and financial review (continued) Financial results (continued) Explanation of results (continued) (b) Revenue Total revenue growth for the year was 5.0% (or 5.8% excluding the non-recurring gain on sale of properties in 2016) at Constant Currency exchange rates (i.e. applying the average rates for the 2016 year to the current year results) and 1.4% including exchange rate impacts.
Revenue breakdown AUD M
2017 Statutory Revenue
% of 2017 Statutory Revenue
2017 Constant Currency Revenue
2016 Revenue
Growth 2017
Constant Currency
v 2016 Laboratory – Australia 1,320 26% 1,320 1,254 5.3% Laboratory – USA 1,106 22% 1,145 1,088 5.2% Laboratory – Europe 1,803 35% 1,950 1,815 7.4% Laboratory – NZ 25 <1% 25 26 (3.8)% Imaging – Australia 442 9% 442 421 5.0% Other 423 8% 423 409 3.4% Revenue – underlying 5,119 100% 5,305 5,013 5.8% Non-recurring gain on property sale - - 35 Interest income 3 3 4 Total revenue 5,122 5,308 5,052 5.0%
The Laboratory division enjoyed revenue growth of 6% in the year (on a Constant Currency basis), including ~4% organic revenue growth. Sonic’s Australian Laboratory revenue growth of 5% included ~1% relating to an acquisition in South Australia completed in the prior year. Sonic’s growth was significantly stronger than the Medicare market data (2.5%), driven by Sonic’s brands and market positioning. US organic revenue growth was ~3% on a Constant Currency basis, the highest level for several years. Sonic’s largest US business, CPL (based in Texas), continues to grow strongly. Sonic’s European operations experienced strong revenue growth, including in Switzerland (~5% organic growth) and Germany (~5% organic growth). Belgian growth of ~1% was adversely impacted by recent fee changes. UK organic growth was ~4%. Imaging revenue growth of 5% included ~1% relating to a small acquisition in NSW. Revenue growth for Sonic’s occupational health business (Sonic HealthPlus) was subdued due to the downturn in employment in the resources sector. Revenue growth of Sonic’s medical centre business (IPN) was impacted by the Medicare rebate freeze, with fee indexation to be reintroduced progressively over the next few years. Revenue was impacted by currency exchange rate movements, which decreased reported (Statutory) revenue by A$185M compared to the prior year. (c) EBITDA Underlying EBITDA (pre non-recurring items) grew 5.3% (at Constant Currency exchange rates) versus the prior year. The A$20.7M of non-recurring items in FY2017 related to acquisitions, restructuring and laboratory relocations which occurred in the year. In the previous year non-recurring items included a gain of A$34.8M on the sale and lease back of two Australian laboratory properties (Melbourne and Perth), as well as $30.7M of expenses related to acquisitions, restructuring and laboratory relocations. Both the Laboratory and Imaging divisions reported strong underlying EBITDA growth (8% and 7% respectively) and margin accretion (25 and 30 basis points respectively). Germany and Switzerland were the strongest performers in the Laboratory division, with Australia returning to earnings growth and margin accretion in 2017, after several years of negative earnings growth.
Sonic Healthcare Limited and controlled entities Directors' Report (continued)
11
Operating and financial review (continued) Financial results (continued) Explanation of results (continued) (d) Depreciation and lease amortisation Depreciation and leased asset amortisation has increased 7.8% on the comparative period (at Constant Currency rates) as a result of business acquisitions and growth of the Company, including the recent completion of several significant laboratory building projects. The relatively high levels of capital expenditure on property, plant and equipment in 2017 and 2016 relate to spend on laboratory building projects in London, Brisbane, Hawaii and Ingelheim. Capital expenditure is expected to be significantly lower in 2018. (e) Intangibles amortisation Intangibles amortisation relates to software (both internally developed and purchased) and contract costs (including doctor contracts in IPN). Investments in innovative software tools have been made over recent periods, leading to an increase in amortisation expense. (f) Interest expense Net interest expense has increased 8.0% on the prior year (at Constant Currency rates) mainly as a result of:
Higher margins on Swiss franc (CHF) debt, which in 2016 was drawn from a low margin short term bridge facility. From July 2016 this debt was drawn from a new 5 year CHF bank debt facility.
Favourable interest swaps which expired in 2016. Business acquisitions completed in January 2017.
The majority of Sonic’s debt is drawn in foreign currencies as “natural” balance sheet hedging of Sonic’s offshore operations (see (a) Constant currency above). Interest rate risk management arrangements are in place in accordance with Sonic’s Treasury Policy. (g) Tax expense The effective tax rate of 23% is in line with the prior year but lower than previous guidance of approximately 25% due to an over-provision in the prior year, higher than forecast deductions, including for Australian research and development, and strong earnings performance in lower tax rate jurisdictions (mainly Switzerland). Corporate income tax rates have recently been reduced in the UK and are proposed to be reduced in Belgium. In the UK, the corporate tax rate reduced from 20% to 19% from 1 April 2017. It has been announced that a further reduction in the UK rate to 17% will occur from 1 April 2020. In Belgium, agreement has been reached to reduce the corporate income tax rate from 33.99% to 29.58% from 1 January 2018 and to 25% from 1 January 2020. The Belgian changes are subject to the enabling legislation being passed in the Belgium Parliament. (h) Cash flow from operations Cash generated from operations grew 4.0% over the previous year, significantly higher than earnings growth, due to improvements in working capital. Gross operating cash flow equated to 103% of EBITDA.
Sonic Healthcare Limited and controlled entities Directors' Report (continued)
12
Operating and financial review (continued) Financial position Net assets at 30 June 2017 of A$3,926M increased by A$193M, or 5.2%, on the prior year. The main components of this increase were:
A$80M from the issue of ordinary Sonic shares under the Company’s dividend reinvestment plan and exercise of employee options and rights.
A$125M due to retained earnings (operating profit less dividends paid). Net (of cash) interest bearing debt increased A$151M (6.6%) from the prior year level to A$2,435M. This increase comprised A$268M relating to payments for business acquisitions, offset by A$43M of currency exchange rate impacts and by cash generated during the year. Business acquisitions completed in the year (none of which were material to Sonic) included:
Majority interest in a German laboratory automation technology developer, GLP Systems, on 14 December 2016. US laboratory business, West Pacific Medical Laboratory, on 12 January 2017. German laboratory business, Staber Laboratory, on 25 January 2017. A number of other small healthcare businesses.
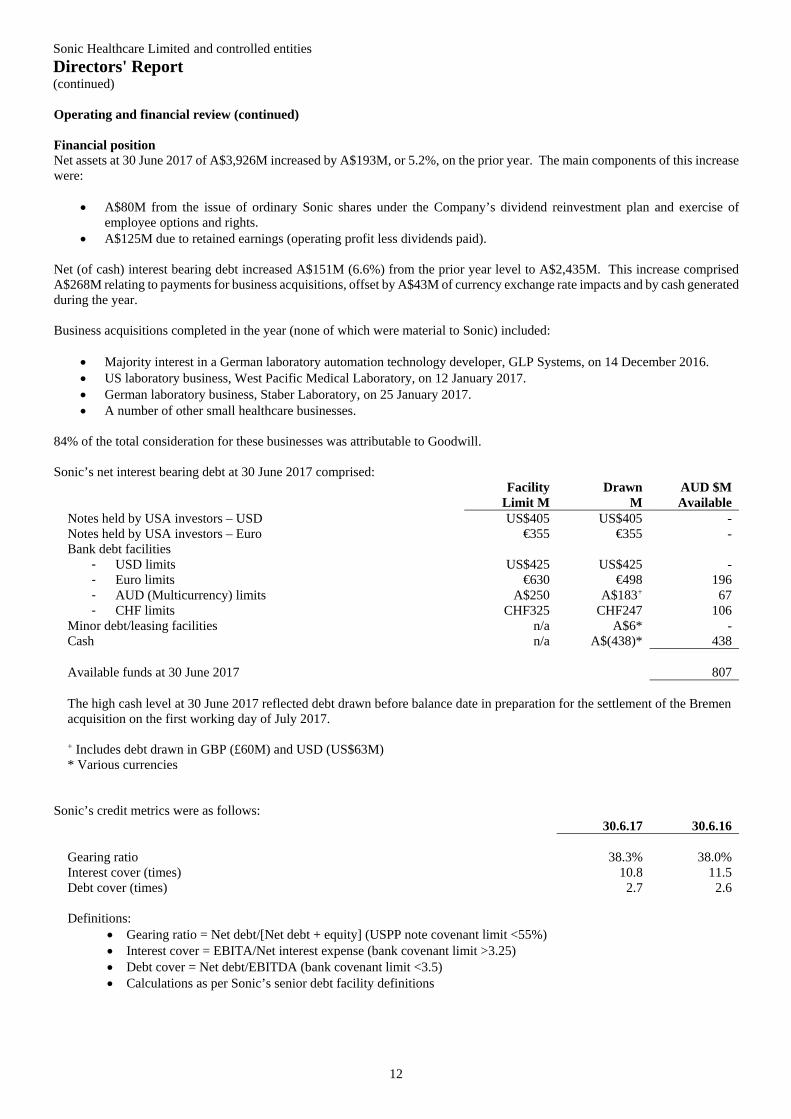
84% of the total consideration for these businesses was attributable to Goodwill. Sonic’s net interest bearing debt at 30 June 2017 comprised:
Facility Limit M
Drawn M
AUD $M Available
Notes held by USA investors – USD US$405 US$405 - Notes held by USA investors – Euro €355 €355 - Bank debt facilities
- USD limits US$425 US$425 - - Euro limits €630 €498 196 - AUD (Multicurrency) limits A$250 A$183+ 67 - CHF limits CHF325 CHF247 106
Minor debt/leasing facilities n/a A$6* - Cash n/a A$(438)* 438 Available funds at 30 June 2017 807 The high cash level at 30 June 2017 reflected debt drawn before balance date in preparation for the settlement of the Bremen acquisition on the first working day of July 2017.
+ Includes debt drawn in GBP (£60M) and USD (US$63M) * Various currencies
Sonic’s credit metrics were as follows:
30.6.17 30.6.16 Gearing ratio 38.3% 38.0% Interest cover (times) 10.8 11.5 Debt cover (times) 2.7 2.6 Definitions:
Gearing ratio = Net debt/[Net debt + equity] (USPP note covenant limit <55%) Interest cover = EBITA/Net interest expense (bank covenant limit >3.25) Debt cover = Net debt/EBITDA (bank covenant limit <3.5) Calculations as per Sonic’s senior debt facility definitions
Sonic Healthcare Limited and controlled entities Directors' Report (continued)
13
Operating and financial review (continued) Financial position (continued) As at 30 June 2017, Sonic’s senior debt facility limits were due to expire as follows (note that the figures shown are the facility limits, not drawn debt):
Calendar Year
AUD M
USD M
Euro M
CHF M
2017 (26 October) 200 - 130 - 2018 50 65 230 - 2019 - 230 145 - 2020 - 285 125 - 2021 - 250 - 200 2022 - - - 125 2024 - - 110 - 2026 - - 245 - 250 830 985 325
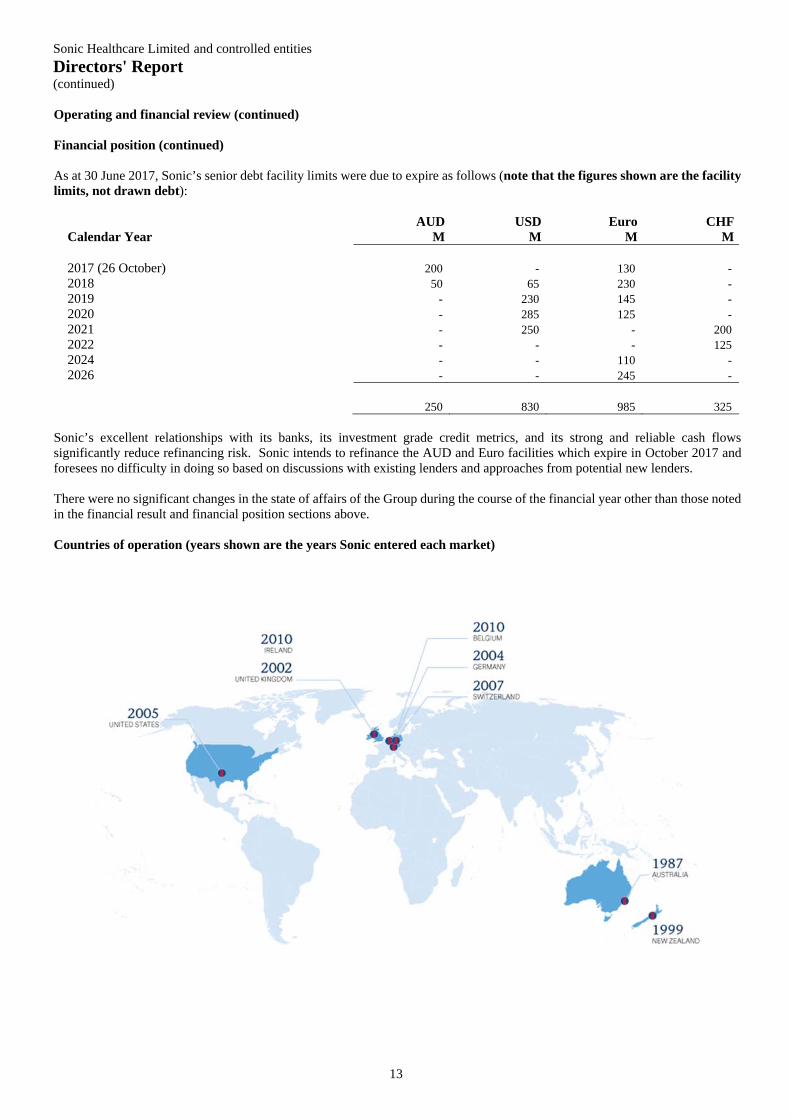
Sonic’s excellent relationships with its banks, its investment grade credit metrics, and its strong and reliable cash flows significantly reduce refinancing risk. Sonic intends to refinance the AUD and Euro facilities which expire in October 2017 and foresees no difficulty in doing so based on discussions with existing lenders and approaches from potential new lenders. There were no significant changes in the state of affairs of the Group during the course of the financial year other than those noted in the financial result and financial position sections above. Countries of operation (years shown are the years Sonic entered each market)
Sonic Healthcare Limited and controlled entities Directors' Report (continued)
14
Operating and financial review (continued) Business model and strategies For over two decades, Sonic Healthcare has pursued and promoted a management and operational philosophy of Medical Leadership. The impact of this approach has been to develop a company whose services are optimally aligned with the needs of physicians and their patients. Medical Leadership encompasses a management commitment to the maintenance of professionalism and “good medicine” at all times. It fosters an understanding of the doctor-patient relationship and it puts quality first. Sonic’s operations are structured as a “federation”, with individual subsidiaries or geographical divisions working in a synergistic network to achieve best practice outcomes in terms of service and business excellence. The structure reinforces the identity and management autonomy of each local operation. Each operation has its own CEO or President and management team. When Sonic acquires businesses, they generally maintain their management autonomy, brand, and consequently their local "flavour". This is the structure which is most resonant with local medical communities and which best preserves acquired goodwill. However, Sonic’s operations work in a collaborative way within the structure, via central executives and widespread inter-company communication, to achieve synergies. Detailed benchmarking leading to best practice, group purchasing, IT, E-health, quality system sharing and centralisation of testing are all examples of continuous synergy activity within the Group. Sonic’s Medical Leadership philosophy and federation structure have resulted in significant “brand” differentiation in the market place. The Company’s operations are viewed as specialist medical practices, rather than as “businesses”. This market differentiation has not only fostered strong organic revenue growth (including hospital pathology outsourcing contracts) over the years but has often made Sonic the preferred acquirer when laboratory or imaging practice founders and owners wish to realise the value of their practices without seeing their focus on the medical nature of the business lost to a more “corporatised” acquirer. Sonic’s culture and structure have also served to attract and retain top pathologists, radiologists, scientific staff and managers, with staff turnover at this important senior level consistently at very low levels. Sonic’s strategy is to utilise its unique culture, values and structure to grow revenue organically and to make value enhancing acquisitions, so as to achieve and build upon leading positions in targeted geographic laboratory markets. These positions provide sufficient size and infrastructure to facilitate synergies and economies of scale to drive margin improvements, earnings growth and increasing returns on capital invested. Sonic has a successful track record of consolidating fragmented markets in Australia, Europe and the USA, using its market differentiation to drive both organic revenue growth and to attract like-minded laboratories for acquisition. Sonic is also well placed to benefit from the increasing trend for governments and others to outsource their diagnostic testing to the private sector in order to address growing healthcare costs.
Sonic Healthcare Limited and controlled entities Directors' Report (continued)
15
Operating and financial review (continued) Prospects for future years Sonic operates in attractive and growing global healthcare markets, carefully chosen based on a range of factors including political, legal and financial stability, reliable and stable healthcare funding systems, fragmentation of the market, and cultural understanding. Within these markets there is increasing demand for diagnostic services arising from growing and ageing populations, new tests and preventative medicine. Against this favourable backdrop Sonic expects to continue for the foreseeable future to grow revenue, earnings and returns on investment organically, including through outsourcing contracts, and further enhanced by synergistic business acquisitions. Laboratory operations offer many levers which can be adjusted to optimise individual processes and Sonic’s managers are constantly seeking efficiency gains within their businesses, aided by the early adoption of new technologies and the sharing of experiences with colleagues from around the globe. Whilst the present focus for acquisitions is on Sonic’s existing markets, a “watching brief” is maintained to identify opportunities that arise for further prudent and strategic international laboratory expansion. Sonic has no current intention to expand its diagnostic imaging or other businesses outside Australia. Sonic intends to maintain a solid investment grade profile with conservative leverage, to preserve Sonic’s culture and Core Values, and to ensure the attraction and retention of the best people to drive the business forward, including retaining key staff from acquisitions. With regard to more short term prospects, on 16 August 2017 Sonic provided guidance in relation to forecast results for the 2018 financial year as follows:
Sonic expects EBITDA growth of 6-8% for 2018 on a Constant Currency basis (applying 2017 average currency exchange rates to 2018) over the 2017 underlying EBITDA of A$889M, excluding any future business acquisitions or regulatory changes.
Net interest expense is expected to increase by 10-15% from the 2017 level of A$65M on a Constant Currency basis (excluding future business acquisitions), as a result of acquisitions completed in January 2017 and July 2017, recent increases in USD base rates, and likely higher margins (due to market movements) on debt facilities to be refinanced in October 2017 and April 2018. Underlying floating interest rates are assumed to remain at current levels.
The effective tax rate is expected to be approximately 25%. Given Sonic’s size and global market presence, opportunities present themselves from time to time that are not necessarily part of Sonic’s core strategies. These opportunities are assessed by management and the Board to determine whether their pursuit is in the best interests of shareholders. Further information on likely strategic developments has not been included in this report because the Directors believe it would be likely to result in unreasonable prejudice to the interests of the Group. Risks The major risks to consider in assessing Sonic’s future prospects are:
Sonic’s reported revenue and earnings will fluctuate with changes in the currency exchange rates between the Australian dollar (Sonic’s reporting currency) and the currencies of Sonic’s offshore operations. As previously noted, Sonic uses foreign currency borrowings as a partial (natural) hedge.
In most of Sonic’s markets the majority of revenue is priced based on fee schedules set by government or quasi government bodies and, especially in the USA, insurance companies. As a result of the strong underlying volume growth drivers, healthcare funders will sometimes use fee cuts or other adjustments to curb growth in their outlays. Sonic mitigates this risk through its geographic and line of business diversification, by seeking diversified sources of revenue for its services within markets, and by being one of the largest, more efficient operators and therefore less impacted by adverse market changes than smaller, less efficient players. In general, fee pressures drive further market consolidation, feeding into Sonic’s core strategy of growth both organically and by acquisition, with attendant synergy capture and economies of scale.
Healthcare businesses are subject to significant levels of regulation. Changes in regulation can have the impact of increasing costs or reducing revenue (through volume reductions). Sonic attempts to mitigate this risk by using its market leadership positions to help shape the healthcare systems in which it operates. Sonic takes active roles in industry associations, and encourages its people to take leadership positions in colleges and other professional and craft organisations. In addition, Sonic’s size and efficiency allows it to benefit from market consolidation driven by the impacts of regulatory changes on smaller players.
Sonic Healthcare Limited and controlled entities Directors' Report (continued)
16
Operating and financial review (continued) Risks (continued)
Loss of a licence or accreditation required to operate one or more of Sonic’s businesses could impact revenue both directly
and through damage to Sonic’s reputation. The likelihood of this risk having a material impact is considered low given the focus on quality within Sonic.
Sonic’s strategies include the acquisition of businesses and entering into long term contracts to provide diagnostic testing. There is a risk that an acquisition or contract may not achieve its expected financial performance, or give rise to an unexpected liability. Sonic seeks to mitigate these risks through thorough due diligence, and through warranties and indemnities in acquisition and contract documentation.
There is always the risk of heightened competition in Sonic’s markets, whether from more aggressive behaviour of an existing competitor, or from a new competitor. This could include a competitor introducing a new development in testing or introducing new tests that result in less demand for Sonic’s services. A change in competition could impact revenue and/or costs. Sonic’s leadership is alert to potential changes in the market place and reacts swiftly when threats are perceived. Technological changes in diagnostic testing tend to happen more slowly than in industries such as consumer goods, as for a testing technology to reach the point of widespread use, it must first be proven to be “good medicine”, including obtaining regulatory approvals and through peer review, and secondly, healthcare funders must be willing to pay for it (for example, by inclusion on government or quasi-government fee schedules). These inherent delays allow competitors and other market participants to revise their own strategies to address the competitive threat.
Relationships with referring physicians (including general practitioners, surgeons and other specialists), hospital groups and other parties with whom Sonic contracts to provide services are important to Sonic’s businesses. If, for any reason, Sonic failed to maintain strong relationships with these parties, there would be a risk that it could lose business to competitors.
Sonic’s businesses rely on information technology systems. A disruption to a core IT platform, including as a result of a cyber security breach, could have significant operational, financial and/or reputational impacts, particularly if confidential patient data were to be obtained by unauthorised persons. Sonic has implemented strategies which management believes significantly reduce this risk.
Sonic uses prudent levels of debt to reduce its cost of capital and to increase earnings per share. It is therefore subject to the risk of rising interest rates (either on floating rate debt or when existing facilities expire), the future availability of funding, and potential breach of a term or condition of its debt facilities. Sonic has a sophisticated Treasury Policy in place to manage these risks, developed and overseen by Sonic’s Treasury Management Committee, which includes a renowned expert external consultant.
With operations in eight jurisdictions, Sonic is potentially exposed to changes in taxation legislation or interpretation which could increase its effective tax rate.
Sonic’s Board does not believe the Company has any material exposure to environmental or social sustainability risks. The above list should not be taken to be a comprehensive list of risks associated with Sonic. In particular it excludes risks relating to the general economic environment and other generic risk areas that affect most companies. Sonic’s geographic, business line and branding diversification, plus our federation structure, broad menu of tests offered and low customer concentrations mean that few, if any, of the usual operating risks faced by a healthcare business would have a material impact on Sonic as a whole. Matters subsequent to the end of the financial year Since the end of the financial year, the Directors are not aware of any matter or circumstance not otherwise dealt with in these financial statements that has significantly or may significantly affect the operations of the Group, the results of those operations or the state of affairs of the Group in subsequent financial years.
Sonic Healthcare Limited and controlled entities Directors' Report (continued)
17
Information on Directors (a) Directors’ profiles Professor Mark Compton, AM Chairman B.Sc., M.B.A., F.A.I.C.D., F.C.H.S.M, F.A.I.M. Non-executive, independent Director, appointed October 2014 (Chairman from 19 November 2015)
Prof. Compton has extensive senior executive experience in healthcare services. He is currently Adjunct Professor in Management (Healthcare Leadership) at Macquarie University (Macquarie Graduate School of Management), non-executive Director of Macquarie University Hospital and Macquarie University Clinical Associates Ltd, Chairman and Chancellor of St John Ambulance Australia (having served as a volunteer for over 40 years) and a non-executive Director of St Luke's Care. His previous experience includes Chief Executive Officer of St Luke’s Care, Immune Systems Therapeutics Limited, the Royal Flying Doctor Service of Australia and Chief Executive Officer and Managing Director of the formerly ASX listed companies SciGen Limited and Alpha Healthcare Limited. He has also held a number of non-executive director roles including for formerly ASX-listed Independent Practitioner Network Limited (2004 to 2008), and as Chairman of the Woolcock Institute of Medical Research. In recognition of his work in the healthcare sector and his service to the community, he was awarded the Centenary Medal of the Commonwealth of Australia, appointed a Knight in the Order of St John in 2004 and Bailiff Grand Cross in 2017 and was appointed as a Member of the Order of Australia (AM) in January 2010. He is a member of the Audit Committee and the Remuneration and Nomination Committee. Dr Colin Goldschmidt CEO and Managing Director M.B.B.Ch., F.R.C.P.A., F.A.I.C.D. Executive Director, appointed January 1993 Dr Goldschmidt is the CEO and Managing Director of Sonic Healthcare. He is a qualified medical doctor who then undertook specialist pathology training in Sydney, before gaining his qualification as a specialist pathologist in 1986. Dr Goldschmidt became CEO of Sonic in 1993 and has led Sonic’s global expansion by committing the Company to a model of Medical Leadership, which incorporates unique operational and cultural attributes. He is a member of Sonic’s Risk Management Committee and holds memberships with numerous industry, medical and laboratory associations.
Christopher Wilks Finance Director B.Comm. (Univ Melb), F.A.I.C.D. Executive Director, appointed December 1989
Mr Wilks became Finance Director and Chief Financial Officer of Sonic Healthcare in 1993. He has a background in chartered accounting and investment banking and was previously a partner in a private investment bank. Mr Wilks has held directorships in a number of public companies and is currently a non-executive Director of Silex Systems Limited (since 1988), a listed company divested by Sonic in 1996. Dr Philip Dubois M.B., B.S., F.R.C.R., F.R.A.N.Z.C.R., F.A.I.C.D. Executive Director, appointed July 2001 Dr Dubois is CEO of Sonic’s Imaging Division and Chairman of the Sonic Imaging Executive Committee. A neuroradiologist and nuclear imaging specialist, he is currently an Associate Professor of Radiology at the University of Queensland Medical School. He has served on numerous government and craft group bodies, including the councils of the Royal Australian and New Zealand College of Radiologists and the Australian Medical Association, and as Vice-President of the Australian Diagnostic Imaging Association. He is a non-executive Director of Magnetica Limited (since December 2004).
Sonic Healthcare Limited and controlled entities Directors' Report (continued)
18
Information on Directors (continued) (a) Directors’ profiles (continued) Lou Panaccio B.Ec., C.A., M.A.I.C.D. Non-executive, independent Director, appointed June 2005 Mr Panaccio is a Chartered Accountant with extensive executive management experience in business and healthcare services. Mr Panaccio is currently on the boards of ASX listed companies Genera Biosystems Limited (non-executive Chairman from July 2011, non-executive Director from November 2010) and Avita Medical Limited (non-executive Chairman from July 2014). He is also non-executive Director of Unison Housing Limited and Rhythm Biosciences Limited. Mr Panaccio was executive Chairman of Health Networks Australia and was the Chief Executive Officer and executive Director of Melbourne Pathology (acquired by Sonic in 1999) for ten years to 2001. Mr Panaccio is Chair of the Audit Committee, a member of the Remuneration and Nomination Committee, and a member of the Risk Management Committee. Kate Spargo L.L.B. (Hons), B.A., F.A.I.C.D. Non-executive, independent Director, appointed July 2010 Ms Spargo has gained broad business experience as both a legal advisor, having worked in private practice and government, and as a Director. Ms Spargo has been a director of both listed and unlisted companies over the last twenty years and her current directorships include the ASX listed companies Fletcher Building Limited (non-executive Director from March 2012), Adairs Limited (non-executive Director from May 2015), Sigma Healthcare Limited (non-executive Director from December 2015) and Xenith IP Group Limited (non-executive Director from April 2017). She is also a non-executive Director of CoInvest Limited and Geelong Football Club Limited. Ms Spargo was a non-executive Director of UGL Limited from October 2010 (non-executive Chairman from October 2014) until January 2017. Ms Spargo is Chair of the Remuneration and Nomination Committee and is a member of the Audit Committee. Dr Jane Wilson M.B.B.S., M.B.A., F.A.I.C.D. Non-executive, independent Director, appointed July 2010 Dr Wilson is an independent non-executive Director with a background in finance, banking and medicine. She is a registered General Medical Practitioner and a Fellow of the Australian Institute of Company Directors (F.A.I.C.D.) with over 20 years of experience as a director of public companies, government-owned corporations and not-for-profit organisations. Dr Wilson is currently a Guardian of the Future Fund, non-executive Director of ASX-listed Transurban (since January 2017), a non-executive Director of Opal Aged Care and a non-executive Director of the General Sir John Monash Foundation. She was previously Deputy Chancellor of the University of Queensland, inaugural Chairman of Horticulture Australia, Chairman of IMBcom Ltd, a non-executive Director of Universal Biosensors Ltd, Energex Ltd, WorkCover Qld, and other smaller biotechnology companies. She served on the Prime Minister’s Business Advisory Council, the Premier’s Smart State Council and Biotechnology Task Force in Queensland. Dr Wilson has also served on the boards of a number of cultural and charitable institutions. She was named in the inaugural 2012 AFR/Westpac Top 100 Women Awards in the Board/Management category and was awarded the 2016 Australian Institute of Company Directors Queensland Gold Medal for contribution to business and the wider community. She has a Masters degree in Business Administration from the Harvard Business School and a medical degree from the University of Queensland. Dr Wilson is Chairman of the Risk Management Committee and is a member of the Remuneration and Nomination Committee. (b) Company Secretary Paul Alexander B.Ec., C.A., F.Fin. Mr Alexander has been the Deputy Chief Financial Officer of Sonic Healthcare Limited since 1997 and Sonic’s Company Secretary since 2001. Prior to joining Sonic, Mr Alexander gained 10 years experience in professional accounting practice, mainly with Price Waterhouse, and was also Financial Controller and Company Secretary of a subsidiary of a UK headquartered multinational company for two years.
Sonic Healthcare Limited and controlled entities Directors' Report (continued)
19
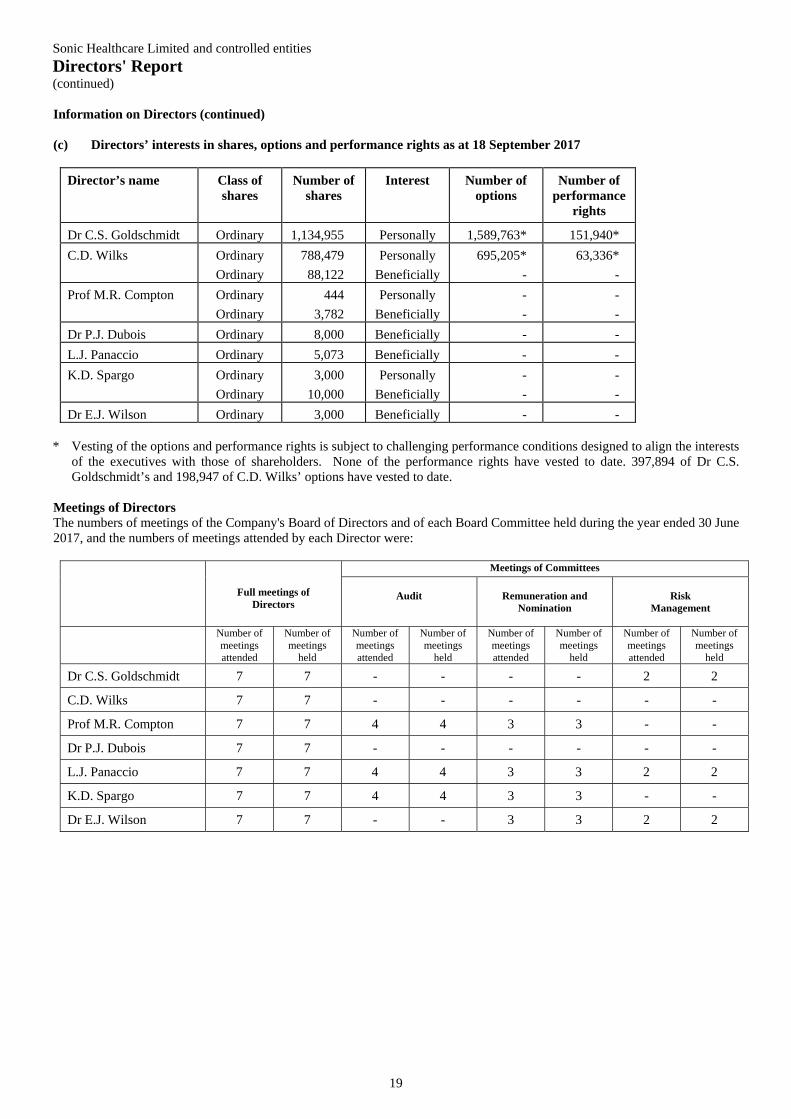
Information on Directors (continued) (c) Directors’ interests in shares, options and performance rights as at 18 September 2017
Director’s name Class of shares
Number of shares
Interest Number of options
Number of performance
rights
Dr C.S. Goldschmidt Ordinary 1,134,955 Personally 1,589,763* 151,940*
C.D. Wilks Ordinary
Ordinary
788,479
88,122
Personally
Beneficially
695,205*
-
63,336*
-
Prof M.R. Compton Ordinary
Ordinary
444
3,782
Personally
Beneficially
-
-
-
-
Dr P.J. Dubois Ordinary 8,000 Beneficially - -
L.J. Panaccio Ordinary 5,073 Beneficially - -
K.D. Spargo Ordinary
Ordinary
3,000
10,000
Personally
Beneficially
-
-
-
-
Dr E.J. Wilson Ordinary 3,000 Beneficially - - * Vesting of the options and performance rights is subject to challenging performance conditions designed to align the interests
of the executives with those of shareholders. None of the performance rights have vested to date. 397,894 of Dr C.S. Goldschmidt’s and 198,947 of C.D. Wilks’ options have vested to date.
Meetings of Directors The numbers of meetings of the Company's Board of Directors and of each Board Committee held during the year ended 30 June 2017, and the numbers of meetings attended by each Director were:
Full meetings of Directors
Meetings of Committees
Audit
Remuneration and
Nomination
Risk
Management
Number of meetings attended
Number of meetings
held
Number of meetings attended
Number of meetings
held
Number of meetings attended
Number of meetings
held
Number of meetings attended
Number of meetings
held
Dr C.S. Goldschmidt 7 7 - - - - 2 2
C.D. Wilks 7 7 - - - - - -
Prof M.R. Compton 7 7 4 4 3 3 - -
Dr P.J. Dubois 7 7 - - - - - -
L.J. Panaccio 7 7 4 4 3 3 2 2
K.D. Spargo 7 7 4 4 3 3 - -
Dr E.J. Wilson 7 7 - - 3 3 2 2
Sonic Healthcare Limited and controlled entities Directors' Report (continued)
20
Insurance of officers The Company has entered into agreements to indemnify all Directors of the Company that are named above and current and former Directors of the Company and its controlled entities against all liabilities to persons (other than the Company or related entity) which arise out of the performance of their normal duties as Director or executive officer unless the liability relates to conduct involving lack of good faith. The Company has agreed to indemnify the Directors and executive officers against all costs and expenses incurred in defending an action that falls within the scope of the indemnity and any resulting payments. The Directors’ and officers’ liability insurance provides cover against costs and expenses, subject to the terms and conditions of the policy, involved in defending legal actions and any resulting payments arising from a liability to persons (other than the Company or related entity) incurred in their position as a Director or executive officer unless the conduct involves a wilful breach of duty or an improper use of inside information or position to gain advantage. The insurance policy does not allow disclosure of the nature of the liabilities insured against or the premium paid under the policy. Environmental regulation The Group is subject to environmental regulation in respect of the transport and disposal of medical waste. The Group contracts with reputable, licensed businesses to dispose of waste. The Directors believe that the Group has complied with all relevant environmental regulations and there have been no investigations or claims during the financial year. Non-audit services The Company may decide to employ the auditor on assignments additional to their statutory audit duties where the auditor’s expertise and experience with the Group are important. Details of the amounts paid or payable to the auditor of the Group (PricewaterhouseCoopers) for non-audit services provided during the year are set out below. The Board of Directors has considered the position and, in accordance with the advice received from the Audit Committee, is satisfied that the provision of the non-audit services is compatible with the general standard of independence for auditors imposed by the Corporations Act 2001. The Directors are satisfied that the provision of non-audit services by the auditor did not compromise the auditor independence requirements of the Corporations Act 2001. In the opinion of the Directors none of the services provided undermine the general principles relating to auditor independence as set out in APES 110 Code of Ethics for Professional Accountants, including reviewing or auditing the auditor’s own work, acting in a management or a decision-making capacity for the Company, acting as advocate for the Company or jointly sharing economic risk and rewards. A copy of the auditors’ independence declaration as required under section 307C of the Corporations Act 2001 is set out on page 34. During the year the following fees were paid or payable for non-audit services provided by the auditors of the Group. Consolidated Group 2017
$ 2016
$ PricewaterhouseCoopers – Australian firm and related practices (including overseas PricewaterhouseCoopers firms)
Taxation and accounting services 279,480 139,669 Remuneration of auditors is detailed in Note 32. Share options Information on share options is detailed in Note 33 - Share based payments. Rounding of amounts The Company is of a kind referred to in the ASIC Corporations (Rounding in Financial/Directors’ Reports) Instrument 2016/191, relating to the “rounding off” of amounts in the Directors’ Report. Amounts in the Directors’ Report have been rounded off in accordance with that Instrument to the nearest thousand dollars, or in certain cases, to the nearest dollar.
Sonic Healthcare Limited and controlled entities Directors' Report (continued)
21
Remuneration Report The Directors of Sonic Healthcare Limited present the Remuneration Report for the year ended 30 June 2017 in accordance with section 300A of the Corporations Act 2001. Sonic Healthcare’s remuneration packages are structured and set at levels that are intended to attract, motivate and retain Directors and executives capable of leading and managing the Group’s operations, and to align remuneration with the creation of value for shareholders. Remuneration of Non-executive Directors is determined by the Board within the maximum amount approved by the shareholders. At the Annual General Meeting (“AGM”) on 19 November 2015 shareholders approved a maximum amount of $1,500,000 for remuneration of Non-executive Directors, of which $955,000 was paid in 2017. In 2017 (and 2016) the Chairman’s annual remuneration was $380,000 inclusive of all Board Committee work and the base Non-executive Director fee was $150,000. Board Committee fees were as follows: Fees per annum Chair Members Audit $30,000 $15,000 Risk Management $25,000 $10,000 Remuneration and Nomination $25,000 $10,000
Options or performance rights are not issued and bonuses are not payable to Non-executive Directors. The Remuneration and Nomination Committee, consisting of four non-executive independent Directors, makes specific recommendations to the Board on remuneration packages and other terms of employment for the Managing Director, Finance Director and Non-executive Directors and advises the Board in relation to equity-based incentive schemes for other employees. The Remuneration and Nomination Committee and Board also seek and consider advice from independent remuneration consultants where appropriate. Remuneration consultants are engaged by and report directly to the Remuneration and Nomination Committee, after consideration of any potential conflicts. Sonic Healthcare’s remuneration policy links the remuneration of the Managing Director and the Finance Director to Sonic’s performance through the award of conditional entitlements. These conditional entitlements relate to the performance of the Group and thus align reward with the creation of value for shareholders. Remuneration and other terms of employment for other executives are reviewed annually by the Managing Director having regard to performance against goals set at the start of the year, performance of the entity or function of the Group for which they have responsibility, and relevant comparative information. As well as a base salary, remuneration packages may include superannuation, fringe benefits, performance related bonuses and share and option grants. These bonuses and equity grants reward the creation of value for shareholders. Other than contributions to superannuation funds during employment periods and notice periods under applicable employment laws and in certain executive service contracts, the Group does not contract to provide retirement benefits to Directors or executives. (a) Key management personnel (i) Directors The following persons were Directors of Sonic Healthcare Limited during the financial year and were therefore key management personnel of the Group: Non-executive Directors Prof M.R. Compton (Chairman) L.J. Panaccio K.D. Spargo Dr E.J. Wilson
Sonic Healthcare Limited and controlled entities Directors' Report (continued)
22
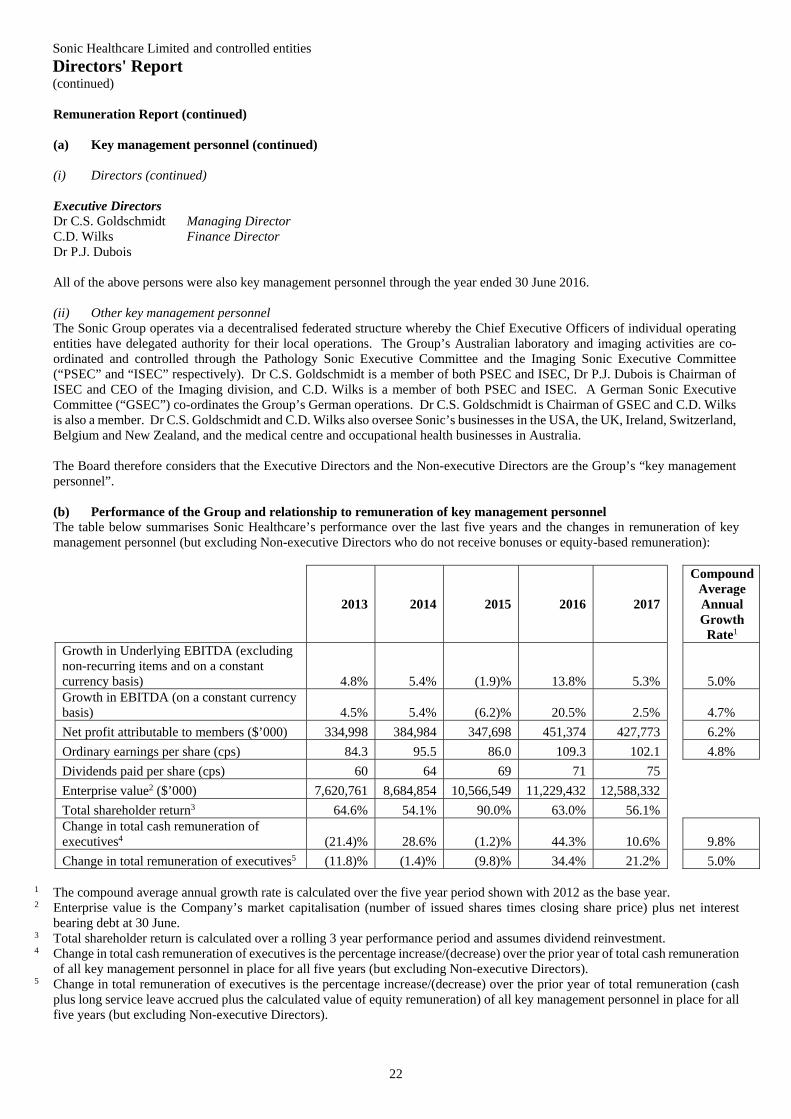
Remuneration Report (continued) (a) Key management personnel (continued) (i) Directors (continued) Executive Directors Dr C.S. Goldschmidt Managing Director C.D. Wilks Finance Director Dr P.J. Dubois All of the above persons were also key management personnel through the year ended 30 June 2016. (ii) Other key management personnel The Sonic Group operates via a decentralised federated structure whereby the Chief Executive Officers of individual operating entities have delegated authority for their local operations. The Group’s Australian laboratory and imaging activities are co-ordinated and controlled through the Pathology Sonic Executive Committee and the Imaging Sonic Executive Committee (“PSEC” and “ISEC” respectively). Dr C.S. Goldschmidt is a member of both PSEC and ISEC, Dr P.J. Dubois is Chairman of ISEC and CEO of the Imaging division, and C.D. Wilks is a member of both PSEC and ISEC. A German Sonic Executive Committee (“GSEC”) co-ordinates the Group’s German operations. Dr C.S. Goldschmidt is Chairman of GSEC and C.D. Wilks is also a member. Dr C.S. Goldschmidt and C.D. Wilks also oversee Sonic’s businesses in the USA, the UK, Ireland, Switzerland, Belgium and New Zealand, and the medical centre and occupational health businesses in Australia. The Board therefore considers that the Executive Directors and the Non-executive Directors are the Group’s “key management personnel”. (b) Performance of the Group and relationship to remuneration of key management personnel The table below summarises Sonic Healthcare’s performance over the last five years and the changes in remuneration of key management personnel (but excluding Non-executive Directors who do not receive bonuses or equity-based remuneration):
2013
2014
2015
2016
2017
Compound Average Annual Growth
Rate1 Growth in Underlying EBITDA (excluding non-recurring items and on a constant currency basis) 4.8% 5.4% (1.9)% 13.8% 5.3% 5.0% Growth in EBITDA (on a constant currency basis) 4.5% 5.4% (6.2)% 20.5% 2.5% 4.7%
Net profit attributable to members ($’000) 334,998 384,984 347,698 451,374 427,773 6.2%
Ordinary earnings per share (cps) 84.3 95.5 86.0 109.3 102.1 4.8%
Dividends paid per share (cps) 60 64 69 71 75
Enterprise value2 ($’000) 7,620,761 8,684,854 10,566,549 11,229,432 12,588,332
Total shareholder return3 64.6% 54.1% 90.0% 63.0% 56.1% Change in total cash remuneration of executives4 (21.4)% 28.6% (1.2)% 44.3% 10.6% 9.8%
Change in total remuneration of executives5 (11.8)% (1.4)% (9.8)% 34.4% 21.2% 5.0%
1 The compound average annual growth rate is calculated over the five year period shown with 2012 as the base year. 2 Enterprise value is the Company’s market capitalisation (number of issued shares times closing share price) plus net interest
bearing debt at 30 June. 3 Total shareholder return is calculated over a rolling 3 year performance period and assumes dividend reinvestment. 4 Change in total cash remuneration of executives is the percentage increase/(decrease) over the prior year of total cash remuneration
of all key management personnel in place for all five years (but excluding Non-executive Directors). 5 Change in total remuneration of executives is the percentage increase/(decrease) over the prior year of total remuneration (cash
plus long service leave accrued plus the calculated value of equity remuneration) of all key management personnel in place for all five years (but excluding Non-executive Directors).
Sonic Healthcare Limited and controlled entities Directors' Report (continued)
23
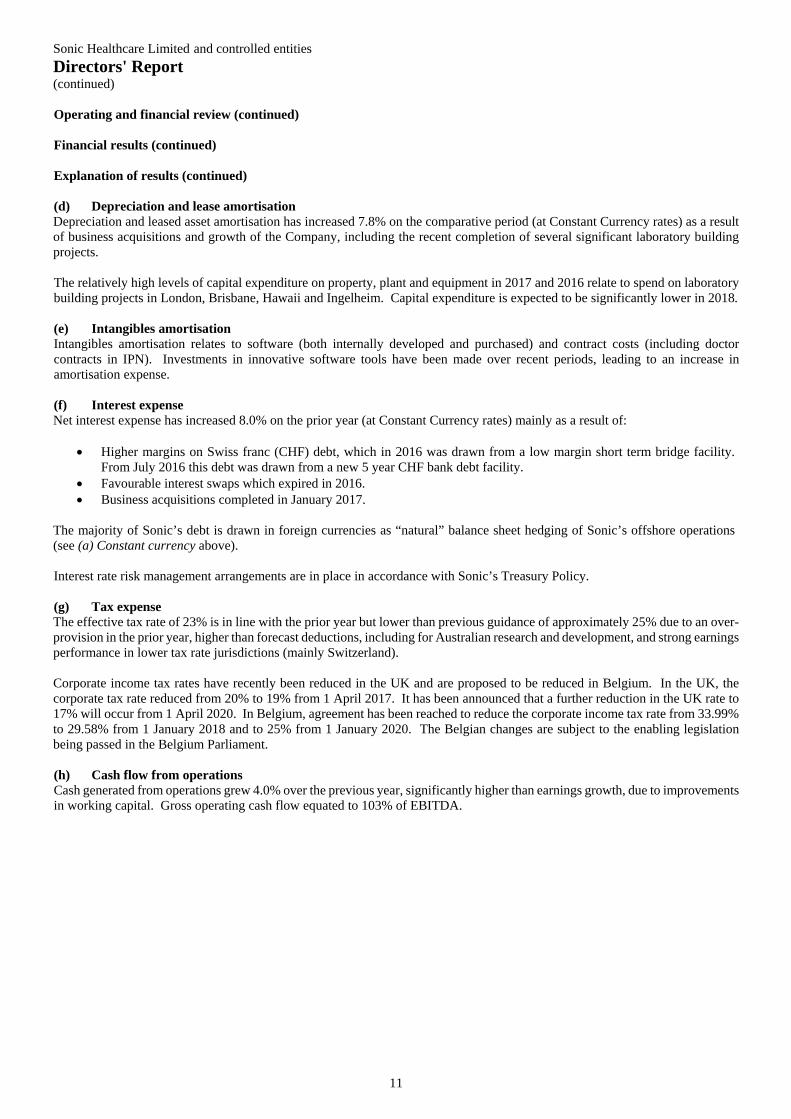
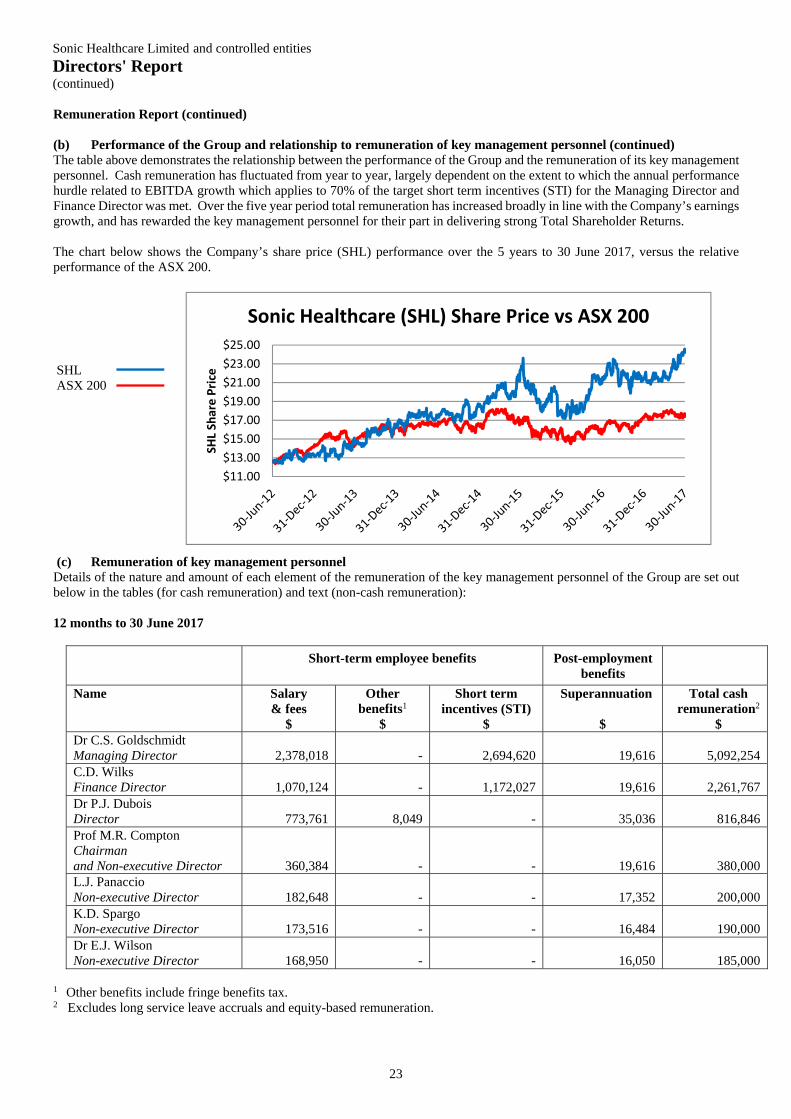
Remuneration Report (continued) (b) Performance of the Group and relationship to remuneration of key management personnel (continued) The table above demonstrates the relationship between the performance of the Group and the remuneration of its key management personnel. Cash remuneration has fluctuated from year to year, largely dependent on the extent to which the annual performance hurdle related to EBITDA growth which applies to 70% of the target short term incentives (STI) for the Managing Director and Finance Director was met. Over the five year period total remuneration has increased broadly in line with the Company’s earnings growth, and has rewarded the key management personnel for their part in delivering strong Total Shareholder Returns. The chart below shows the Company’s share price (SHL) performance over the 5 years to 30 June 2017, versus the relative performance of the ASX 200.
(c) Remuneration of key management personnel Details of the nature and amount of each element of the remuneration of the key management personnel of the Group are set out below in the tables (for cash remuneration) and text (non-cash remuneration): 12 months to 30 June 2017
Short-term employee benefits Post-employment benefits
Name Salary & fees
$
Other benefits1
$
Short term incentives (STI)
$
Superannuation
$
Total cash remuneration2
$ Dr C.S. Goldschmidt Managing Director
2,378,018
-
2,694,620
19,616
5,092,254
C.D. Wilks Finance Director
1,070,124
-
1,172,027
19,616
2,261,767
Dr P.J. Dubois Director
773,761
8,049
-
35,036
816,846
Prof M.R. Compton Chairman and Non-executive Director
360,384
-
-
19,616
380,000 L.J. Panaccio Non-executive Director
182,648
-
-
17,352
200,000
K.D. Spargo Non-executive Director
173,516
-
-
16,484
190,000
Dr E.J. Wilson Non-executive Director
168,950
-
-
16,050
185,000
1 Other benefits include fringe benefits tax. 2 Excludes long service leave accruals and equity-based remuneration.
$11.00
$13.00
$15.00
$17.00
$19.00
$21.00
$23.00
$25.00
SHL Share Price
Sonic Healthcare (SHL) Share Price vs ASX 200
SHL ASX 200
Sonic Healthcare Limited and controlled entities Directors' Report (continued)
24
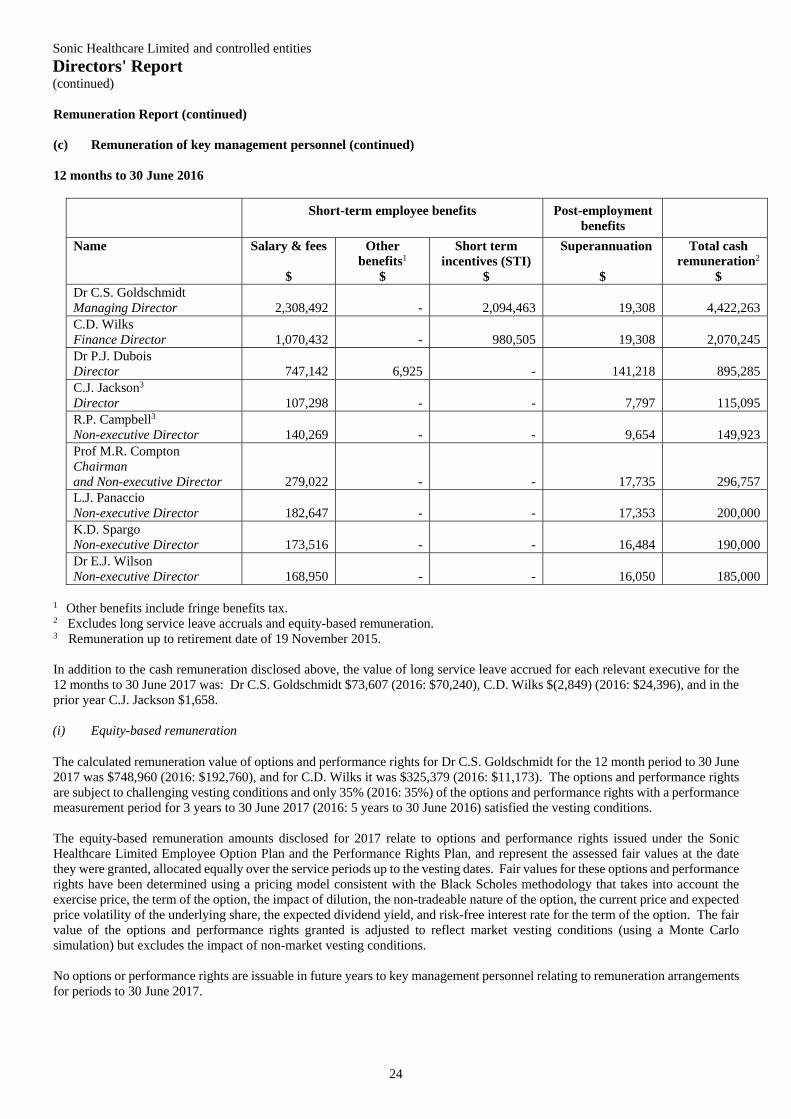
Remuneration Report (continued) (c) Remuneration of key management personnel (continued) 12 months to 30 June 2016
Short-term employee benefits Post-employment benefits
Name Salary & fees
$
Other benefits1
$
Short term incentives (STI)
$
Superannuation
$
Total cash remuneration2
$ Dr C.S. Goldschmidt Managing Director
2,308,492
-
2,094,463
19,308
4,422,263
C.D. Wilks Finance Director
1,070,432
-
980,505
19,308
2,070,245
Dr P.J. Dubois Director
747,142
6,925
-
141,218
895,285
C.J. Jackson3 Director
107,298
-
-
7,797
115,095
R.P. Campbell3 Non-executive Director
140,269
-
-
9,654
149,923
Prof M.R. Compton Chairman and Non-executive Director
279,022
-
-
17,735
296,757 L.J. Panaccio Non-executive Director
182,647
-
-
17,353
200,000
K.D. Spargo Non-executive Director
173,516
-
-
16,484
190,000
Dr E.J. Wilson Non-executive Director
168,950
-
-
16,050
185,000
1 Other benefits include fringe benefits tax. 2 Excludes long service leave accruals and equity-based remuneration. 3 Remuneration up to retirement date of 19 November 2015. In addition to the cash remuneration disclosed above, the value of long service leave accrued for each relevant executive for the 12 months to 30 June 2017 was: Dr C.S. Goldschmidt $73,607 (2016: $70,240), C.D. Wilks $(2,849) (2016: $24,396), and in the prior year C.J. Jackson $1,658. (i) Equity-based remuneration
The calculated remuneration value of options and performance rights for Dr C.S. Goldschmidt for the 12 month period to 30 June 2017 was $748,960 (2016: $192,760), and for C.D. Wilks it was $325,379 (2016: $11,173). The options and performance rights are subject to challenging vesting conditions and only 35% (2016: 35%) of the options and performance rights with a performance measurement period for 3 years to 30 June 2017 (2016: 5 years to 30 June 2016) satisfied the vesting conditions. The equity-based remuneration amounts disclosed for 2017 relate to options and performance rights issued under the Sonic Healthcare Limited Employee Option Plan and the Performance Rights Plan, and represent the assessed fair values at the date they were granted, allocated equally over the service periods up to the vesting dates. Fair values for these options and performance rights have been determined using a pricing model consistent with the Black Scholes methodology that takes into account the exercise price, the term of the option, the impact of dilution, the non-tradeable nature of the option, the current price and expected price volatility of the underlying share, the expected dividend yield, and risk-free interest rate for the term of the option. The fair value of the options and performance rights granted is adjusted to reflect market vesting conditions (using a Monte Carlo simulation) but excludes the impact of non-market vesting conditions. No options or performance rights are issuable in future years to key management personnel relating to remuneration arrangements for periods to 30 June 2017.
Sonic Healthcare Limited and controlled entities Directors' Report (continued)
25
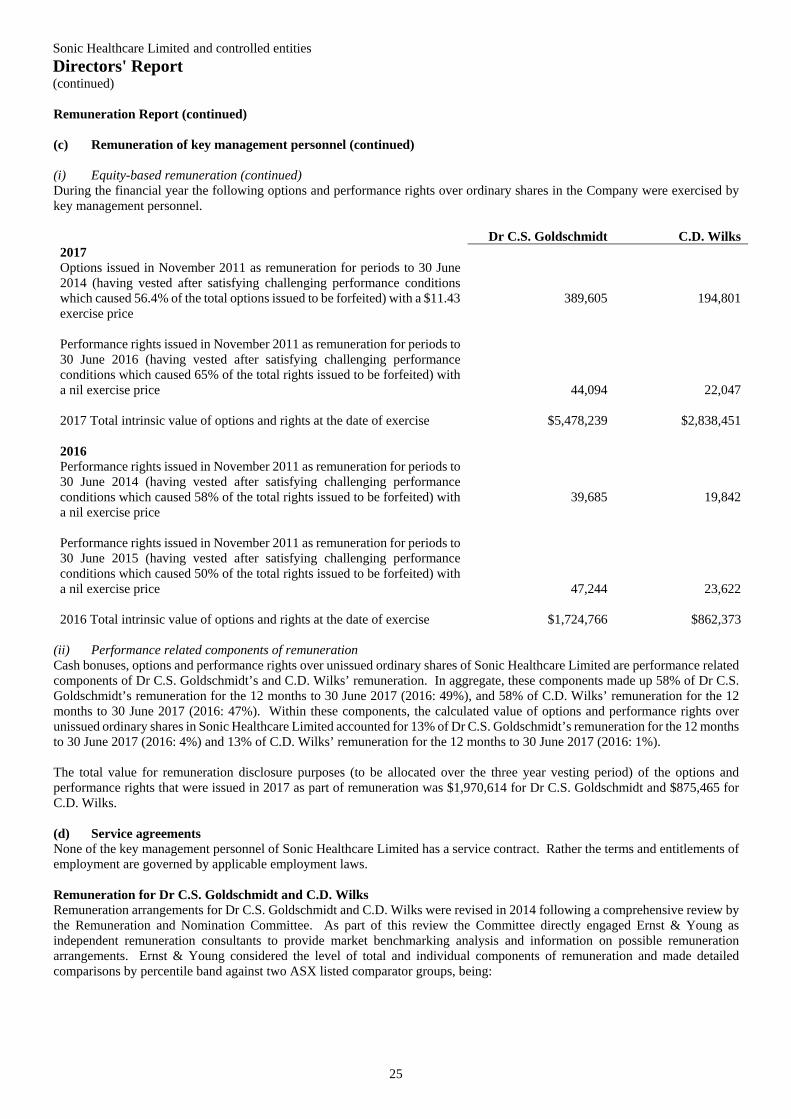
Remuneration Report (continued) (c) Remuneration of key management personnel (continued) (i) Equity-based remuneration (continued) During the financial year the following options and performance rights over ordinary shares in the Company were exercised by key management personnel. Dr C.S. Goldschmidt C.D. Wilks 2017 Options issued in November 2011 as remuneration for periods to 30 June 2014 (having vested after satisfying challenging performance conditions which caused 56.4% of the total options issued to be forfeited) with a $11.43 exercise price
389,605
194,801
Performance rights issued in November 2011 as remuneration for periods to 30 June 2016 (having vested after satisfying challenging performance conditions which caused 65% of the total rights issued to be forfeited) with a nil exercise price
44,094
22,047 2017 Total intrinsic value of options and rights at the date of exercise $5,478,239 $2,838,451
2016 Performance rights issued in November 2011 as remuneration for periods to 30 June 2014 (having vested after satisfying challenging performance conditions which caused 58% of the total rights issued to be forfeited) with a nil exercise price
39,685
19,842
Performance rights issued in November 2011 as remuneration for periods to 30 June 2015 (having vested after satisfying challenging performance conditions which caused 50% of the total rights issued to be forfeited) with a nil exercise price
47,244
23,622 2016 Total intrinsic value of options and rights at the date of exercise $1,724,766 $862,373
(ii) Performance related components of remuneration Cash bonuses, options and performance rights over unissued ordinary shares of Sonic Healthcare Limited are performance related components of Dr C.S. Goldschmidt’s and C.D. Wilks’ remuneration. In aggregate, these components made up 58% of Dr C.S. Goldschmidt’s remuneration for the 12 months to 30 June 2017 (2016: 49%), and 58% of C.D. Wilks’ remuneration for the 12 months to 30 June 2017 (2016: 47%). Within these components, the calculated value of options and performance rights over unissued ordinary shares in Sonic Healthcare Limited accounted for 13% of Dr C.S. Goldschmidt’s remuneration for the 12 months to 30 June 2017 (2016: 4%) and 13% of C.D. Wilks’ remuneration for the 12 months to 30 June 2017 (2016: 1%). The total value for remuneration disclosure purposes (to be allocated over the three year vesting period) of the options and performance rights that were issued in 2017 as part of remuneration was $1,970,614 for Dr C.S. Goldschmidt and $875,465 for C.D. Wilks. (d) Service agreements None of the key management personnel of Sonic Healthcare Limited has a service contract. Rather the terms and entitlements of employment are governed by applicable employment laws. Remuneration for Dr C.S. Goldschmidt and C.D. Wilks Remuneration arrangements for Dr C.S. Goldschmidt and C.D. Wilks were revised in 2014 following a comprehensive review by the Remuneration and Nomination Committee. As part of this review the Committee directly engaged Ernst & Young as independent remuneration consultants to provide market benchmarking analysis and information on possible remuneration arrangements. Ernst & Young considered the level of total and individual components of remuneration and made detailed comparisons by percentile band against two ASX listed comparator groups, being:
Sonic Healthcare Limited and controlled entities Directors' Report (continued)
26
Remuneration Report (continued) (d) Service agreements (continued)
Market Capitalisation comparator group: includes companies with market capitalisation of 50% to 200% of Sonic’s 12-month average market capitalisation, excluding Financials and Metals and Mining companies. This resulted in a group of 34 companies.
Geographic comparator group: includes companies included in the Market Capitalisation comparator group, but excluding companies where less than a quarter of annual revenue can be attributed to overseas operations. This resulted in a group of 16 companies.
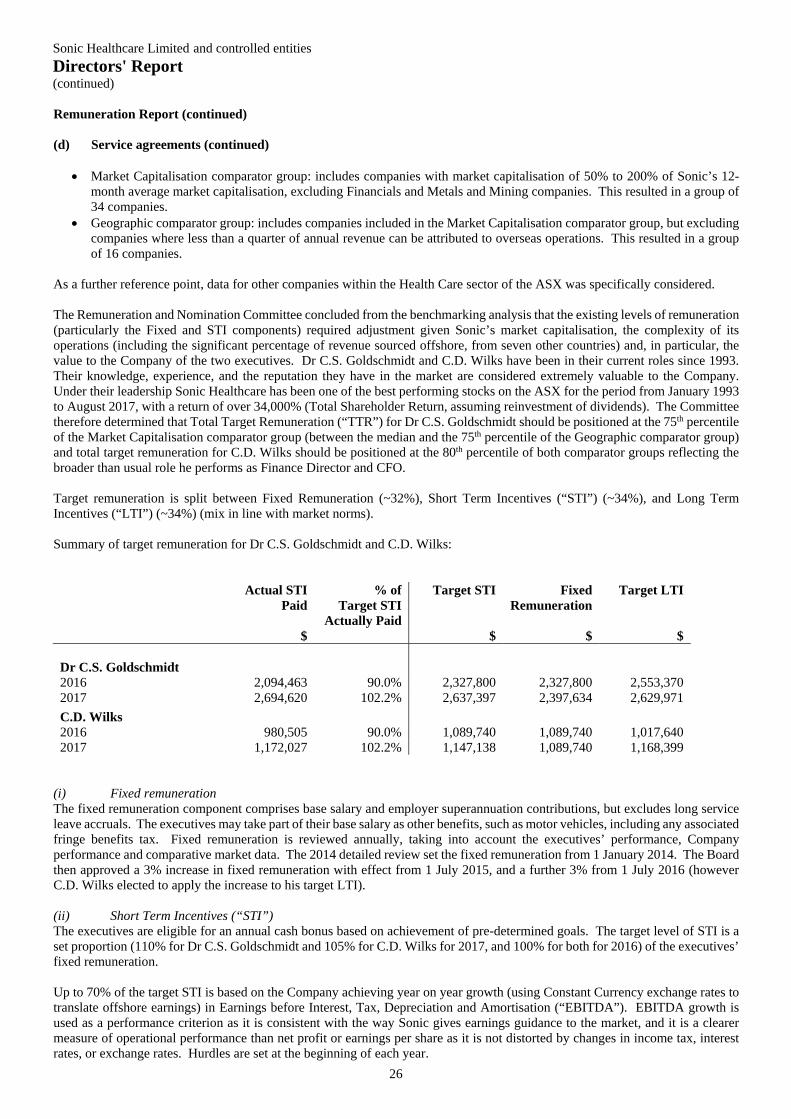
As a further reference point, data for other companies within the Health Care sector of the ASX was specifically considered. The Remuneration and Nomination Committee concluded from the benchmarking analysis that the existing levels of remuneration (particularly the Fixed and STI components) required adjustment given Sonic’s market capitalisation, the complexity of its operations (including the significant percentage of revenue sourced offshore, from seven other countries) and, in particular, the value to the Company of the two executives. Dr C.S. Goldschmidt and C.D. Wilks have been in their current roles since 1993. Their knowledge, experience, and the reputation they have in the market are considered extremely valuable to the Company. Under their leadership Sonic Healthcare has been one of the best performing stocks on the ASX for the period from January 1993 to August 2017, with a return of over 34,000% (Total Shareholder Return, assuming reinvestment of dividends). The Committee therefore determined that Total Target Remuneration (“TTR”) for Dr C.S. Goldschmidt should be positioned at the 75th percentile of the Market Capitalisation comparator group (between the median and the 75th percentile of the Geographic comparator group) and total target remuneration for C.D. Wilks should be positioned at the 80th percentile of both comparator groups reflecting the broader than usual role he performs as Finance Director and CFO. Target remuneration is split between Fixed Remuneration (~32%), Short Term Incentives (“STI”) (~34%), and Long Term Incentives (“LTI”) (~34%) (mix in line with market norms). Summary of target remuneration for Dr C.S. Goldschmidt and C.D. Wilks: Actual STI
Paid
$
% of Target STI
Actually Paid
Target STI
$
Fixed Remuneration
$
Target LTI
$ Dr C.S. Goldschmidt 2016 2,094,463 90.0% 2,327,800 2,327,800 2,553,370 2017 2,694,620 102.2% 2,637,397 2,397,634 2,629,971
C.D. Wilks 2016 980,505 90.0% 1,089,740 1,089,740 1,017,640 2017 1,172,027 102.2% 1,147,138 1,089,740 1,168,399
(i) Fixed remuneration The fixed remuneration component comprises base salary and employer superannuation contributions, but excludes long service leave accruals. The executives may take part of their base salary as other benefits, such as motor vehicles, including any associated fringe benefits tax. Fixed remuneration is reviewed annually, taking into account the executives’ performance, Company performance and comparative market data. The 2014 detailed review set the fixed remuneration from 1 January 2014. The Board then approved a 3% increase in fixed remuneration with effect from 1 July 2015, and a further 3% from 1 July 2016 (however C.D. Wilks elected to apply the increase to his target LTI). (ii) Short Term Incentives (“STI”) The executives are eligible for an annual cash bonus based on achievement of pre-determined goals. The target level of STI is a set proportion (110% for Dr C.S. Goldschmidt and 105% for C.D. Wilks for 2017, and 100% for both for 2016) of the executives’ fixed remuneration. Up to 70% of the target STI is based on the Company achieving year on year growth (using Constant Currency exchange rates to translate offshore earnings) in Earnings before Interest, Tax, Depreciation and Amortisation (“EBITDA”). EBITDA growth is used as a performance criterion as it is consistent with the way Sonic gives earnings guidance to the market, and it is a clearer measure of operational performance than net profit or earnings per share as it is not distorted by changes in income tax, interest rates, or exchange rates. Hurdles are set at the beginning of each year.
Sonic Healthcare Limited and controlled entities Directors' Report (continued)
27
Remuneration Report (continued) (d) Service agreements (continued) (ii) Short Term Incentives (“STI”) (continued) The EBITDA growth targets allow for the contributions from acquisitions that are known when the targets are set. The potential contribution to EBITDA growth of acquisitions that were not known in setting the target growth rate has been capped at a maximum of 2% for the purpose of the performance assessment. Up to 30% of the target STI is awarded after an assessment of performance based on specific objectives relating to:
Promotion of and adherence to Sonic’s Core Values and Foundation Principles. Medical Leadership. Federation model. Risk management. External standing and reputation (including stakeholder management, brand and quality). Financial leadership and innovation (for C.D. Wilks).
An annual assessment of each executive’s performance is made by the Remuneration and Nomination Committee and a recommendation made to the Board for final determination. The table above shows the total STI amounts awarded by year. For the 2017 financial year 30% (2016: 30%) of the target STI was awarded under the qualitative factors above as, following a detailed assessment of each criteria, the Board was satisfied that the executives performed strongly in the areas of assessment during 2017, and no issues have arisen during the year that would suggest anything to the contrary. It is possible for the executives to earn up to 150% of the qualitative portion of the target STI, however this was not awarded in 2017 (or 2016). Underlying EBITDA growth of 5.31% was achieved in 2017, exceeding the 5% (2016: 19%) target level set in August 2016, resulting in 103.1% of the relevant 70% of target STI being paid (achieving between 100% and 200% of the target EBITDA growth triggered payment of pro rata between 100% and 150% of the relevant 70% of target STI). In 2016, 85.7% of the relevant 70% of target STI was paid.
(iii) Long Term Incentives (“LTI”) After approval by shareholders at the 2011 AGM, the executives were issued the following LTI (the “FY2012 Issue”) to provide incentives through to the end of the 2016 year in the form of options and performance rights over shares in Sonic Healthcare Limited, subject to performance conditions.
Dr C.S. Goldschmidt C.D. Wilks Earliest Vesting Performance conditions Expiry date Options Rights Options Rights Date measurement period 894,039 94,488 447,019 47,244 18 November 2014 3 years to 30 June 2014 18 November 2016 868,167 94,488 434,083 47,244 18 November 2015 4 years to 30 June 2015 18 November 2017
1,136,842 125,984 568,421 62,992 18 November 2016 5 years to 30 June 2016 18 November 2018 2,899,048 314,960 1,449,523 157,480
Since the 2014 remuneration review Dr C.S. Goldschmidt and C.D. Wilks receive annual grants of equity-based remuneration (conditional on approval by shareholders), subject to performance conditions with measurement periods of three years. Annual grants have a number of benefits versus the less frequent, larger grants used in the past, including allowing the Company to determine the appropriate performance hurdles each year for the grant being made, adjust the mix between type of instruments for changes in circumstances (e.g. tax law), and/or select different measures to take into account changes in the Company’s strategy or context. It also provides the opportunity for shareholders to vote on the proposed grants each year, taking into account recent Company performance.
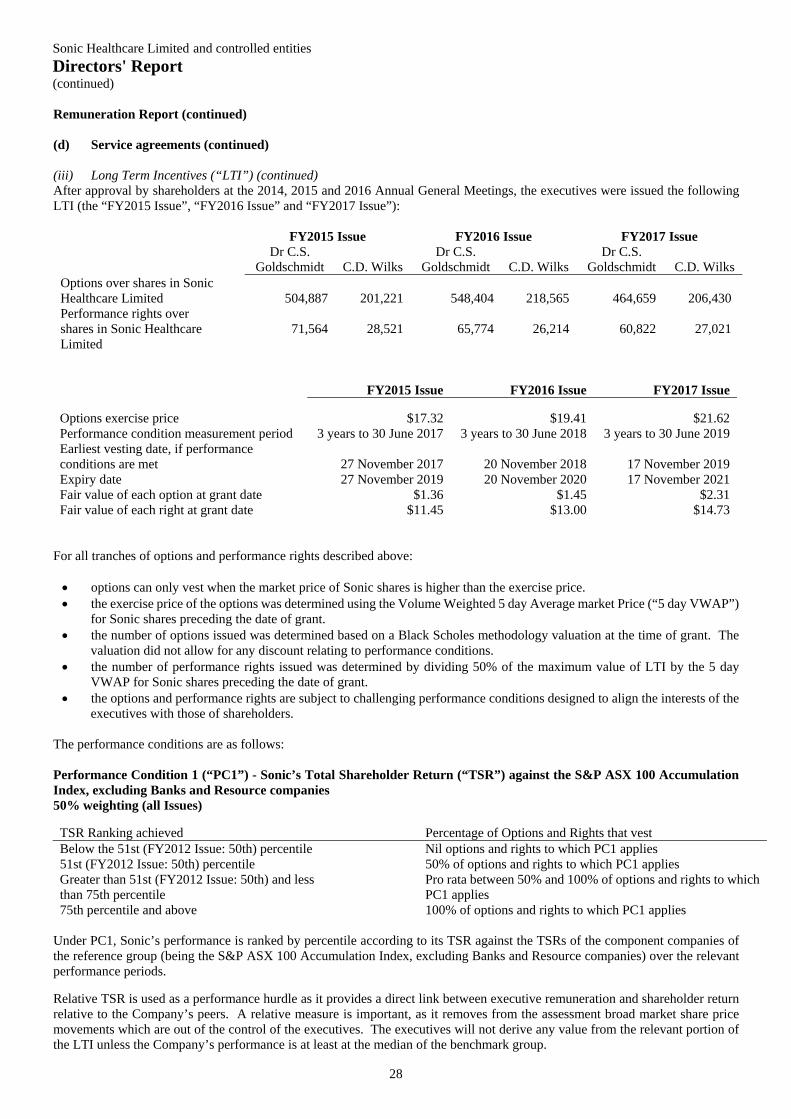
Sonic Healthcare Limited and controlled entities Directors' Report (continued)
28
Remuneration Report (continued) (d) Service agreements (continued) (iii) Long Term Incentives (“LTI”) (continued) After approval by shareholders at the 2014, 2015 and 2016 Annual General Meetings, the executives were issued the following LTI (the “FY2015 Issue”, “FY2016 Issue” and “FY2017 Issue”):
FY2015 Issue FY2016 Issue FY2017 Issue Dr C.S.
Goldschmidt
C.D. Wilks Dr C.S.
Goldschmidt
C.D. Wilks Dr C.S.
Goldschmidt
C.D. Wilks Options over shares in Sonic Healthcare Limited
504,887
201,221
548,404
218,565
464,659
206,430
Performance rights over shares in Sonic Healthcare Limited
71,564
28,521
65,774
26,214
60,822
27,021
FY2015 Issue FY2016 Issue FY2017 Issue
Options exercise price $17.32 $19.41 $21.62 Performance condition measurement period 3 years to 30 June 2017 3 years to 30 June 2018 3 years to 30 June 2019 Earliest vesting date, if performance conditions are met
27 November 2017
20 November 2018
17 November 2019
Expiry date 27 November 2019 20 November 2020 17 November 2021 Fair value of each option at grant date $1.36 $1.45 $2.31 Fair value of each right at grant date $11.45 $13.00 $14.73
For all tranches of options and performance rights described above: options can only vest when the market price of Sonic shares is higher than the exercise price. the exercise price of the options was determined using the Volume Weighted 5 day Average market Price (“5 day VWAP”)
for Sonic shares preceding the date of grant. the number of options issued was determined based on a Black Scholes methodology valuation at the time of grant. The
valuation did not allow for any discount relating to performance conditions. the number of performance rights issued was determined by dividing 50% of the maximum value of LTI by the 5 day
VWAP for Sonic shares preceding the date of grant. the options and performance rights are subject to challenging performance conditions designed to align the interests of the
executives with those of shareholders.
The performance conditions are as follows:
Performance Condition 1 (“PC1”) - Sonic’s Total Shareholder Return (“TSR”) against the S&P ASX 100 Accumulation Index, excluding Banks and Resource companies 50% weighting (all Issues) TSR Ranking achieved Percentage of Options and Rights that vest Below the 51st (FY2012 Issue: 50th) percentile Nil options and rights to which PC1 applies 51st (FY2012 Issue: 50th) percentile 50% of options and rights to which PC1 applies Greater than 51st (FY2012 Issue: 50th) and less than 75th percentile
Pro rata between 50% and 100% of options and rights to which PC1 applies
75th percentile and above 100% of options and rights to which PC1 applies
Under PC1, Sonic’s performance is ranked by percentile according to its TSR against the TSRs of the component companies of the reference group (being the S&P ASX 100 Accumulation Index, excluding Banks and Resource companies) over the relevant performance periods.
Relative TSR is used as a performance hurdle as it provides a direct link between executive remuneration and shareholder return relative to the Company’s peers. A relative measure is important, as it removes from the assessment broad market share price movements which are out of the control of the executives. The executives will not derive any value from the relevant portion of the LTI unless the Company’s performance is at least at the median of the benchmark group.

Sonic Healthcare Limited and controlled entities Directors' Report (continued)
29
Remuneration Report (continued) (d) Service agreements (continued) (iii) Long Term Incentives (“LTI”) (continued) PC1 (TSR) Results Performance measurement period
TSR Rank Achieved
% Eligible to Vest
Vesting Options
Vesting Performance
Rights Forfeited Options
Forfeited Rights
1 July 2011 to 30 June 2014 67% 84% 584,406 59,527 86,123 11,339 1 July 2011 to 30 June 2015 76% 100% 651,126 70,866 - - 1 July 2011 to 30 June 2016 60% 70% 596,841 66,141 255,791 28,347 1 July 2014 to 30 June 2017 61% 70.83% 250,069 35,445 102,986 14,598
Of the Issues and tranches described above, only the first three (2016: two) tranches of the options or performance rights issued in November 2011 had vested or been forfeited at 30 June 2017. Performance Condition 2 (“PC2”) - Compound Average Growth Rate (“CAGR”) in Return on Invested Capital (“ROIC”) Weighting: FY2012 Issue: 50%, FY2015 Issue: 25%, FY2016 Issue: 0%, FY2017 Issue: 0% CAGR ROIC achieved Percentage of Options and Rights that vest Less than 1.08% (FY2012 Issue: 3%) p.a. Nil options and rights to which PC2 applies
1.08% (FY2012 Issue: 3%) p.a. 50% (FY2012 Issue: 30%) of options and rights to which PC2 applies
Greater than 1.08% and less than 3% (FY2012 Issue: 3% and 9%)
Pro rata between 50% (FY2012 Issue: 30%) and 100% of options and rights to which PC2 applies
3% (FY2012 Issue: 9%) or greater 100% of options and rights to which PC2 applies
ROIC was calculated as Earnings before Interest and Tax (“EBIT”) less related tax and minority interests divided by capital employed (see below for detailed calculation). It was expressed as a percentage and the hurdle growth rates were growth in this percentage. Growth in ROIC was chosen as a performance hurdle in FY2012 and FY2015 as the Board believed that a primary focus should be improvement in the return from the substantial investments the Company had made in its offshore markets. The ROIC related hurdle was not used for the FY2016 and FY2017 Issues as the Board was concerned that the measure had proven too volatile to be an effective incentive, and that it could be a disincentive for the executives to pursue acquisitions that are value enhancing for shareholders in the medium and long term (once growth and synergies are achieved). Under the FY2015 Issue ROIC remained a hurdle until 30 June 2017. ROIC = (EBIT1 less minority interests2 less cash taxes paid in year3) / Average4 invested capital5
1 EBIT is statutory EBIT per the Annual Report. 2 Minority interests are as disclosed in the Income Statement of the Annual Report. 3 Cash taxes paid are as per the Cash Flow Statement disclosure in the Annual Report adjusted for the tax impact of interest (using
the Australian Corporate Tax Rate, currently 30% i.e. 30% of Net Interest Expense). 4 The average is taken from the opening and closing invested capital position for each financial year. 5 Invested capital is measured as shareholders’ equity plus net interest bearing debt less deferred taxes.
PC2 (ROIC) Results Vesting Performance measurement period Actual CAGR ROIC
% Eligible to Vest
Vesting Options
Performance Rights
Forfeited Options
Forfeited Rights
1 July 2011 to 30 June 2014 1.1% - - - 670,529 70,866 1 July 2011 to 30 June 2015 (5.2)% - - - 651,124 70,866 1 July 2011 to 30 June 2016 0.4% - - - 852,631 94,488 1 July 2014 to 30 June 2017 (4.2)% - - - 176,527 25,021
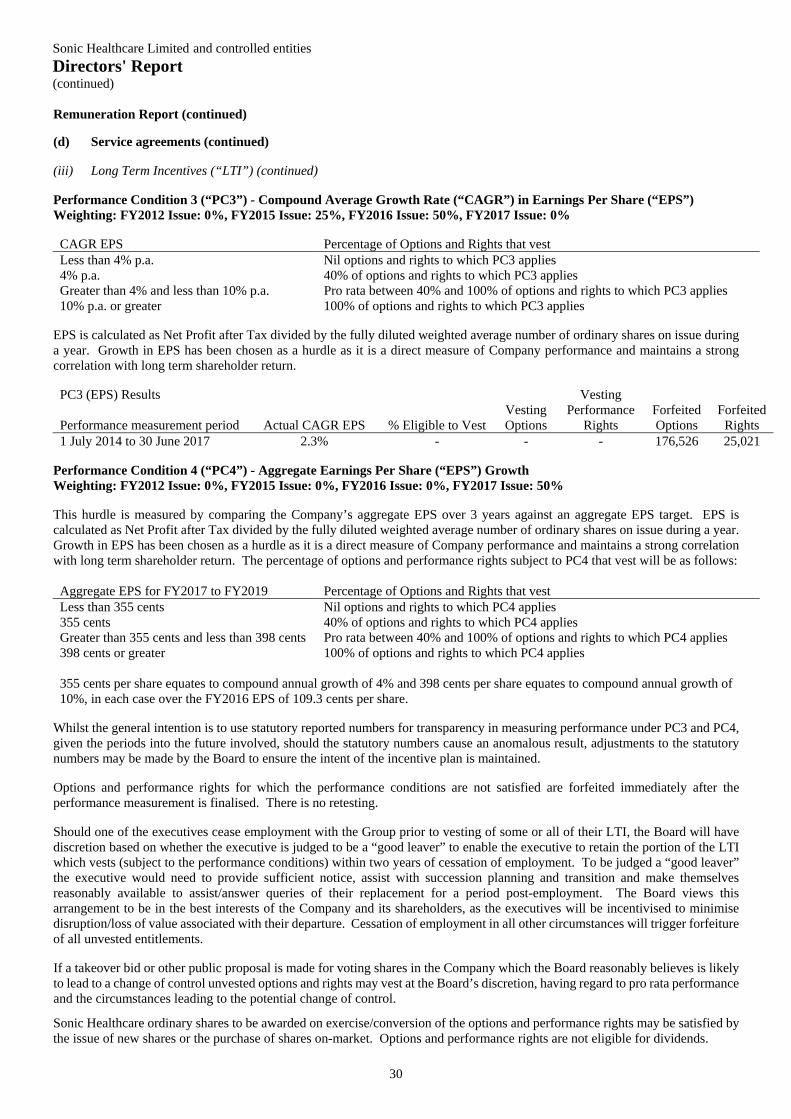
Sonic Healthcare Limited and controlled entities Directors' Report (continued)
30
Remuneration Report (continued) (d) Service agreements (continued) (iii) Long Term Incentives (“LTI”) (continued) Performance Condition 3 (“PC3”) - Compound Average Growth Rate (“CAGR”) in Earnings Per Share (“EPS”) Weighting: FY2012 Issue: 0%, FY2015 Issue: 25%, FY2016 Issue: 50%, FY2017 Issue: 0% CAGR EPS Percentage of Options and Rights that vest Less than 4% p.a. Nil options and rights to which PC3 applies 4% p.a. 40% of options and rights to which PC3 applies Greater than 4% and less than 10% p.a. Pro rata between 40% and 100% of options and rights to which PC3 applies 10% p.a. or greater 100% of options and rights to which PC3 applies
EPS is calculated as Net Profit after Tax divided by the fully diluted weighted average number of ordinary shares on issue during a year. Growth in EPS has been chosen as a hurdle as it is a direct measure of Company performance and maintains a strong correlation with long term shareholder return. PC3 (EPS) Results Vesting Performance measurement period Actual CAGR EPS
% Eligible to Vest
Vesting Options
Performance Rights
Forfeited Options
Forfeited Rights
1 July 2014 to 30 June 2017 2.3% - - - 176,526 25,021 Performance Condition 4 (“PC4”) - Aggregate Earnings Per Share (“EPS”) Growth Weighting: FY2012 Issue: 0%, FY2015 Issue: 0%, FY2016 Issue: 0%, FY2017 Issue: 50% This hurdle is measured by comparing the Company’s aggregate EPS over 3 years against an aggregate EPS target. EPS is calculated as Net Profit after Tax divided by the fully diluted weighted average number of ordinary shares on issue during a year. Growth in EPS has been chosen as a hurdle as it is a direct measure of Company performance and maintains a strong correlation with long term shareholder return. The percentage of options and performance rights subject to PC4 that vest will be as follows: Aggregate EPS for FY2017 to FY2019 Percentage of Options and Rights that vest Less than 355 cents Nil options and rights to which PC4 applies 355 cents 40% of options and rights to which PC4 applies Greater than 355 cents and less than 398 cents Pro rata between 40% and 100% of options and rights to which PC4 applies 398 cents or greater 100% of options and rights to which PC4 applies 355 cents per share equates to compound annual growth of 4% and 398 cents per share equates to compound annual growth of 10%, in each case over the FY2016 EPS of 109.3 cents per share.
Whilst the general intention is to use statutory reported numbers for transparency in measuring performance under PC3 and PC4, given the periods into the future involved, should the statutory numbers cause an anomalous result, adjustments to the statutory numbers may be made by the Board to ensure the intent of the incentive plan is maintained. Options and performance rights for which the performance conditions are not satisfied are forfeited immediately after the performance measurement is finalised. There is no retesting. Should one of the executives cease employment with the Group prior to vesting of some or all of their LTI, the Board will have discretion based on whether the executive is judged to be a “good leaver” to enable the executive to retain the portion of the LTI which vests (subject to the performance conditions) within two years of cessation of employment. To be judged a “good leaver” the executive would need to provide sufficient notice, assist with succession planning and transition and make themselves reasonably available to assist/answer queries of their replacement for a period post-employment. The Board views this arrangement to be in the best interests of the Company and its shareholders, as the executives will be incentivised to minimise disruption/loss of value associated with their departure. Cessation of employment in all other circumstances will trigger forfeiture of all unvested entitlements. If a takeover bid or other public proposal is made for voting shares in the Company which the Board reasonably believes is likely to lead to a change of control unvested options and rights may vest at the Board’s discretion, having regard to pro rata performance and the circumstances leading to the potential change of control.
Sonic Healthcare ordinary shares to be awarded on exercise/conversion of the options and performance rights may be satisfied by the issue of new shares or the purchase of shares on-market. Options and performance rights are not eligible for dividends.
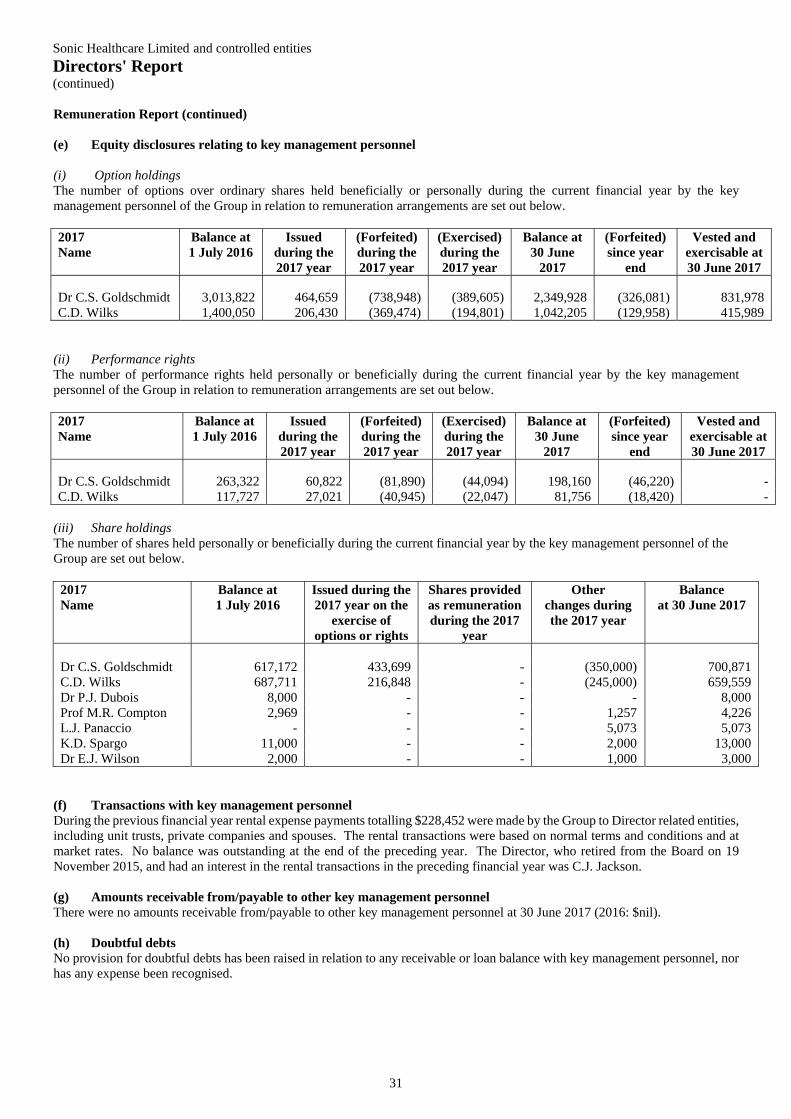
Sonic Healthcare Limited and controlled entities Directors' Report (continued)
31
Remuneration Report (continued) (e) Equity disclosures relating to key management personnel (i) Option holdings The number of options over ordinary shares held beneficially or personally during the current financial year by the key management personnel of the Group in relation to remuneration arrangements are set out below. 2017 Name
Balance at 1 July 2016
Issued during the 2017 year
(Forfeited) during the 2017 year
(Exercised) during the 2017 year
Balance at 30 June
2017
(Forfeited) since year
end
Vested and exercisable at 30 June 2017
Dr C.S. Goldschmidt 3,013,822 464,659 (738,948) (389,605) 2,349,928 (326,081) 831,978 C.D. Wilks 1,400,050 206,430 (369,474) (194,801) 1,042,205 (129,958) 415,989
(ii) Performance rights The number of performance rights held personally or beneficially during the current financial year by the key management personnel of the Group in relation to remuneration arrangements are set out below. 2017 Name
Balance at 1 July 2016
Issued during the 2017 year
(Forfeited) during the 2017 year
(Exercised) during the 2017 year
Balance at 30 June
2017
(Forfeited) since year
end
Vested and exercisable at 30 June 2017
Dr C.S. Goldschmidt 263,322 60,822 (81,890) (44,094) 198,160 (46,220) - C.D. Wilks 117,727 27,021 (40,945) (22,047) 81,756 (18,420) -
(iii) Share holdings The number of shares held personally or beneficially during the current financial year by the key management personnel of the Group are set out below.
2017 Name
Balance at 1 July 2016
Issued during the 2017 year on the
exercise of options or rights
Shares provided as remuneration during the 2017
year
Other changes during the 2017 year
Balance at 30 June 2017
Dr C.S. Goldschmidt 617,172 433,699 - (350,000) 700,871 C.D. Wilks 687,711 216,848 - (245,000) 659,559 Dr P.J. Dubois 8,000 - - - 8,000 Prof M.R. Compton 2,969 - - 1,257 4,226 L.J. Panaccio - - - 5,073 5,073 K.D. Spargo 11,000 - - 2,000 13,000 Dr E.J. Wilson 2,000 - - 1,000 3,000
(f) Transactions with key management personnel During the previous financial year rental expense payments totalling $228,452 were made by the Group to Director related entities, including unit trusts, private companies and spouses. The rental transactions were based on normal terms and conditions and at market rates. No balance was outstanding at the end of the preceding year. The Director, who retired from the Board on 19 November 2015, and had an interest in the rental transactions in the preceding financial year was C.J. Jackson. (g) Amounts receivable from/payable to other key management personnel There were no amounts receivable from/payable to other key management personnel at 30 June 2017 (2016: $nil). (h) Doubtful debts No provision for doubtful debts has been raised in relation to any receivable or loan balance with key management personnel, nor has any expense been recognised.
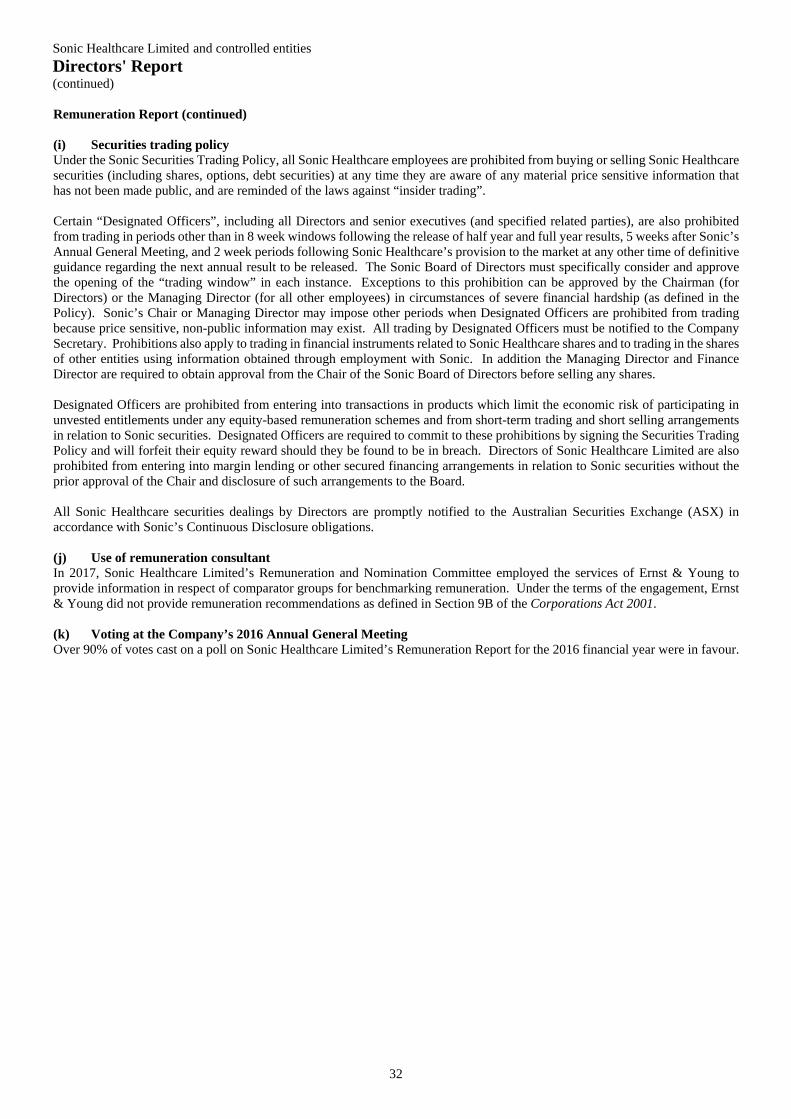
Sonic Healthcare Limited and controlled entities Directors' Report (continued)
32
Remuneration Report (continued) (i) Securities trading policy Under the Sonic Securities Trading Policy, all Sonic Healthcare employees are prohibited from buying or selling Sonic Healthcare securities (including shares, options, debt securities) at any time they are aware of any material price sensitive information that has not been made public, and are reminded of the laws against “insider trading”. Certain “Designated Officers”, including all Directors and senior executives (and specified related parties), are also prohibited from trading in periods other than in 8 week windows following the release of half year and full year results, 5 weeks after Sonic’s Annual General Meeting, and 2 week periods following Sonic Healthcare’s provision to the market at any other time of definitive guidance regarding the next annual result to be released. The Sonic Board of Directors must specifically consider and approve the opening of the “trading window” in each instance. Exceptions to this prohibition can be approved by the Chairman (for Directors) or the Managing Director (for all other employees) in circumstances of severe financial hardship (as defined in the Policy). Sonic’s Chair or Managing Director may impose other periods when Designated Officers are prohibited from trading because price sensitive, non-public information may exist. All trading by Designated Officers must be notified to the Company Secretary. Prohibitions also apply to trading in financial instruments related to Sonic Healthcare shares and to trading in the shares of other entities using information obtained through employment with Sonic. In addition the Managing Director and Finance Director are required to obtain approval from the Chair of the Sonic Board of Directors before selling any shares. Designated Officers are prohibited from entering into transactions in products which limit the economic risk of participating in unvested entitlements under any equity-based remuneration schemes and from short-term trading and short selling arrangements in relation to Sonic securities. Designated Officers are required to commit to these prohibitions by signing the Securities Trading Policy and will forfeit their equity reward should they be found to be in breach. Directors of Sonic Healthcare Limited are also prohibited from entering into margin lending or other secured financing arrangements in relation to Sonic securities without the prior approval of the Chair and disclosure of such arrangements to the Board. All Sonic Healthcare securities dealings by Directors are promptly notified to the Australian Securities Exchange (ASX) in accordance with Sonic’s Continuous Disclosure obligations. (j) Use of remuneration consultant In 2017, Sonic Healthcare Limited’s Remuneration and Nomination Committee employed the services of Ernst & Young to provide information in respect of comparator groups for benchmarking remuneration. Under the terms of the engagement, Ernst & Young did not provide remuneration recommendations as defined in Section 9B of the Corporations Act 2001. (k) Voting at the Company’s 2016 Annual General Meeting Over 90% of votes cast on a poll on Sonic Healthcare Limited’s Remuneration Report for the 2016 financial year were in favour.
Sonic Healthcare Limited and controlled entities Directors' Report (continued)
33
This report is made in accordance with a resolution of the Directors. Dr C.S. Goldschmidt Director C.D. Wilks Director Sydney 18 September 2017
PricewaterhouseCoopers, ABN 52 780 433 757 One International Towers Sydney, Watermans Quay, Barangaroo NSW 2000 GPO Box 2650, Sydney NSW 2001 T: +61 2 8266 0000, F: +61 2 8266 9999, www.pwc.com.au Liability limited by a scheme approved under Professional Standards Legislation.
34
Auditor’s Independence Declaration
As lead auditor for the audit of Sonic Healthcare Limited for the year ended 30 June 2017, I declare that to the best of my knowledge and belief, there have been:
a) no contraventions of the auditor independence requirements of the Corporations Act 2001 in relation to the audit; and
b) no contraventions of any applicable code of professional conduct in relation to the audit.
This declaration is in respect of Sonic Healthcare Limited and the entities it controlled during the period.
Mark Dow Partner 18 September 2017 PricewaterhouseCoopers
Sonic Healthcare Limited and controlled entities
Corporate Governance Statement
35
The Board of Sonic Healthcare continues to place great importance on the governance of the Company, which it believes is vital to its well-being and success. There are two elements to the governance of companies: performance and conformance. Both are important, but it is critical that focus on conformance does not detract from the principal function of a business, which is to undertake prudent activities to:
- generate rewards for shareholders who invest their capital, - provide services of value to customers, and - provide meaningful employment for employees,
and to do so in a way that contributes positively to the community. The principal features of Sonic’s corporate governance framework are set out in this statement, which is current as at 18 September 2017 and has been approved by the Board. Sonic’s Board and management are committed to governance which recognises that all aspects of the Group’s operations are conducted ethically, responsibly and with the highest standards of integrity. The Board has adopted practices and policies designed to achieve these aims. Sonic supports the ASX Corporate Governance Council Corporate Governance Principles and Recommendations (“the Recommendations”) in advancing good corporate governance, and has applied the third edition during the 2017 financial year. Sonic’s Board continues to review and improve Sonic’s compliance with the Recommendations, implementing change in a prudent manner. Sonic’s website (www.sonichealthcare.com) includes a Corporate Governance section which sets out the information required by the Recommendations plus other relevant information, including copies of all Policies, Charters and Codes referred to in this report. Sonic’s Code of Ethics and Core Values (listed below) set out the fundamental principles that govern the way that all Sonic people conduct themselves. Sonic’s Core Values apply equally to every employee of Sonic and were formulated with significant input from Sonic’s staff. They have been embraced throughout the Group. Sonic’s Core Values are:
- Commit to Service Excellence To willingly serve all those with whom we deal; with unsurpassed excellence. - Treat each other with Respect & Honesty To grow a workplace where trust, team spirit and equity are an integral part of everything we do. - Demonstrate Responsibility & Accountability To set an example, to take ownership of each situation to the best of our ability and to seek help when needed. - Be Enthusiastic about Continuous Improvement To never be complacent, to recognise limitations and opportunities for ourselves and processes; and to learn through these. - Maintain Confidentiality
To keep all information pertaining to patients, as well as professional and commercial issues, in strict confidence. A description of the Company’s main corporate governance practices is set out below. All these practices, unless otherwise stated, were in place throughout the 2017 financial year. Any issues of non-compliance with the Recommendations are specifically noted and explained.
Sonic Healthcare Limited and controlled entities Corporate Governance Statement (continued)
36
1. Board of Directors Profiles of the Directors and Company Secretary are included in the Directors’ Report. (a) Role of the Board The Board of Directors is accountable to shareholders for the performance of the Company and the Group and is responsible for the corporate governance practices of the Group. The Board’s principal objective is to increase shareholder value while ensuring that the Group’s overall activities are properly managed.
Sonic’s corporate governance practices provide the structure which enables the Board’s principal objective to be achieved, whilst ensuring that the business and affairs of the Group are conducted ethically and in accordance with law.
The Board’s overall responsibilities include:
- providing strategic direction and approving corporate strategies, - monitoring management and financial performance and reporting, - appointing the Chair and Managing Director, and assessing the performance of Directors, - monitoring and ensuring the maintenance of adequate risk management identification, control and reporting mechanisms,
and - ensuring the business is conducted ethically and transparently.
The Board delegates authority for operational management of the business to the Managing Director and senior executives. The Managing Director also oversees the implementation of strategies approved by the Board, and is responsible for providing accurate and relevant information to enable the Board to perform its responsibilities. Senior executives reporting to the Managing Director have their roles and responsibilities defined in specific position descriptions. The Board uses a number of Committees to support it in matters that require more intensive review and involvement. Details of the Board Committees are provided below.
As part of its commitment to good corporate governance, the Board regularly reviews the practices and standards governing the Board’s composition, independence and effectiveness, the accountability and compensation of Directors (and senior executives) and the Board’s responsibility for the stewardship of the Group.
The role and responsibilities of the Board, the functions reserved for the Board and those delegated to management have been formalised in the Sonic Board Charter. The Company Secretary is appointed by the Board and is accountable directly to the Board, through the Chair, on all matters to do with the proper functioning of the Board. Each Director is able to communicate directly with the Company Secretary.
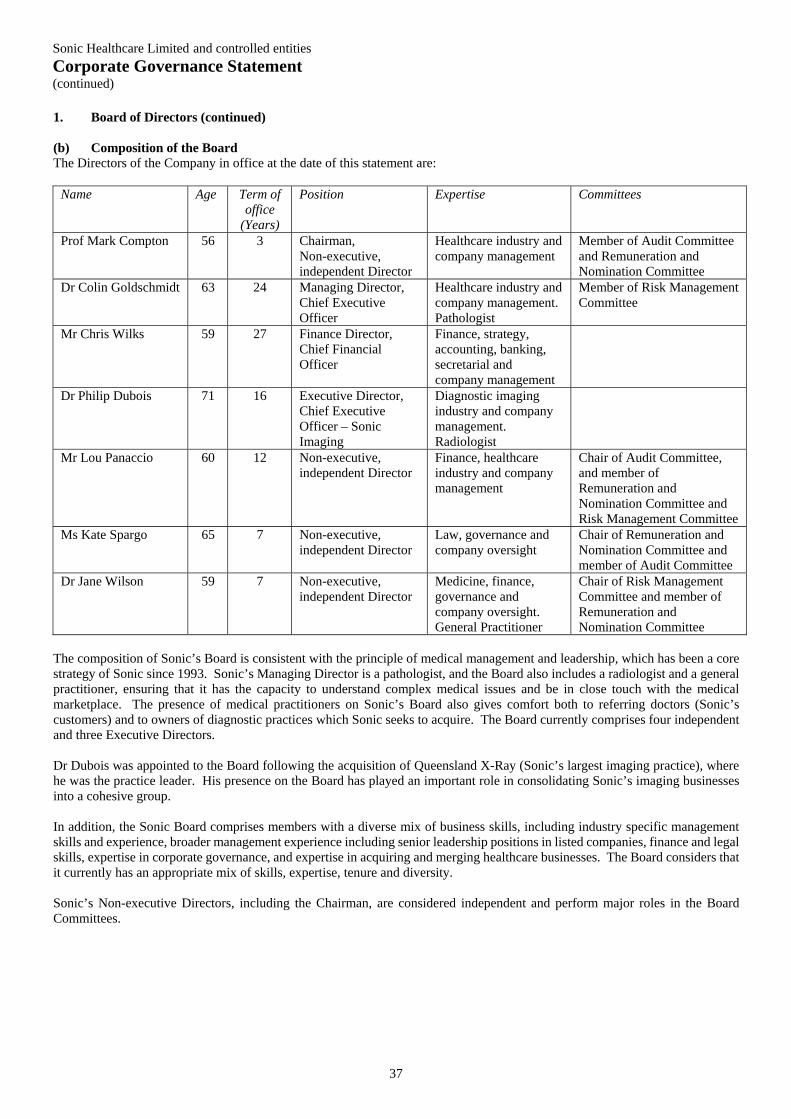
Sonic Healthcare Limited and controlled entities Corporate Governance Statement (continued)
37
1. Board of Directors (continued) (b) Composition of the Board The Directors of the Company in office at the date of this statement are:
Name Age Term of
office (Years)
Position Expertise Committees
Prof Mark Compton
56 3 Chairman, Non-executive, independent Director
Healthcare industry and company management
Member of Audit Committee and Remuneration and Nomination Committee
Dr Colin Goldschmidt 63 24 Managing Director, Chief Executive Officer
Healthcare industry and company management. Pathologist
Member of Risk Management Committee
Mr Chris Wilks 59 27 Finance Director, Chief Financial Officer
Finance, strategy, accounting, banking, secretarial and company management
Dr Philip Dubois
71 16 Executive Director, Chief Executive Officer – Sonic Imaging
Diagnostic imaging industry and company management. Radiologist
Mr Lou Panaccio 60 12 Non-executive, independent Director
Finance, healthcare industry and company management
Chair of Audit Committee, and member of Remuneration and Nomination Committee and Risk Management Committee
Ms Kate Spargo 65 7 Non-executive, independent Director
Law, governance and company oversight
Chair of Remuneration and Nomination Committee and member of Audit Committee
Dr Jane Wilson 59 7 Non-executive, independent Director
Medicine, finance, governance and company oversight. General Practitioner
Chair of Risk Management Committee and member of Remuneration and Nomination Committee
The composition of Sonic’s Board is consistent with the principle of medical management and leadership, which has been a core strategy of Sonic since 1993. Sonic’s Managing Director is a pathologist, and the Board also includes a radiologist and a general practitioner, ensuring that it has the capacity to understand complex medical issues and be in close touch with the medical marketplace. The presence of medical practitioners on Sonic’s Board also gives comfort both to referring doctors (Sonic’s customers) and to owners of diagnostic practices which Sonic seeks to acquire. The Board currently comprises four independent and three Executive Directors. Dr Dubois was appointed to the Board following the acquisition of Queensland X-Ray (Sonic’s largest imaging practice), where he was the practice leader. His presence on the Board has played an important role in consolidating Sonic’s imaging businesses into a cohesive group. In addition, the Sonic Board comprises members with a diverse mix of business skills, including industry specific management skills and experience, broader management experience including senior leadership positions in listed companies, finance and legal skills, expertise in corporate governance, and expertise in acquiring and merging healthcare businesses. The Board considers that it currently has an appropriate mix of skills, expertise, tenure and diversity. Sonic’s Non-executive Directors, including the Chairman, are considered independent and perform major roles in the Board Committees.
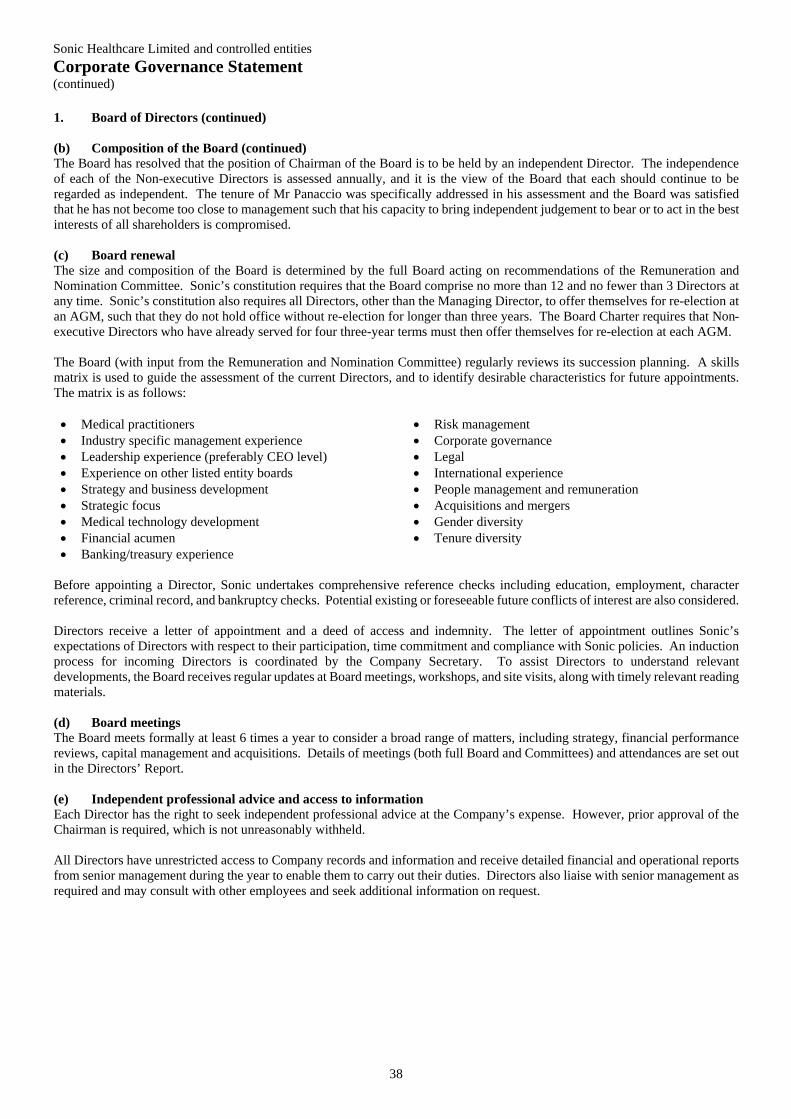
Sonic Healthcare Limited and controlled entities Corporate Governance Statement (continued)
38
1. Board of Directors (continued) (b) Composition of the Board (continued) The Board has resolved that the position of Chairman of the Board is to be held by an independent Director. The independence of each of the Non-executive Directors is assessed annually, and it is the view of the Board that each should continue to be regarded as independent. The tenure of Mr Panaccio was specifically addressed in his assessment and the Board was satisfied that he has not become too close to management such that his capacity to bring independent judgement to bear or to act in the best interests of all shareholders is compromised. (c) Board renewal The size and composition of the Board is determined by the full Board acting on recommendations of the Remuneration and Nomination Committee. Sonic’s constitution requires that the Board comprise no more than 12 and no fewer than 3 Directors at any time. Sonic’s constitution also requires all Directors, other than the Managing Director, to offer themselves for re-election at an AGM, such that they do not hold office without re-election for longer than three years. The Board Charter requires that Non-executive Directors who have already served for four three-year terms must then offer themselves for re-election at each AGM. The Board (with input from the Remuneration and Nomination Committee) regularly reviews its succession planning. A skills matrix is used to guide the assessment of the current Directors, and to identify desirable characteristics for future appointments. The matrix is as follows: Medical practitioners Risk management Industry specific management experience Corporate governance Leadership experience (preferably CEO level) Legal Experience on other listed entity boards International experience Strategy and business development People management and remuneration Strategic focus Acquisitions and mergers Medical technology development Gender diversity Financial acumen Tenure diversity Banking/treasury experience
Before appointing a Director, Sonic undertakes comprehensive reference checks including education, employment, character reference, criminal record, and bankruptcy checks. Potential existing or foreseeable future conflicts of interest are also considered. Directors receive a letter of appointment and a deed of access and indemnity. The letter of appointment outlines Sonic’s expectations of Directors with respect to their participation, time commitment and compliance with Sonic policies. An induction process for incoming Directors is coordinated by the Company Secretary. To assist Directors to understand relevant developments, the Board receives regular updates at Board meetings, workshops, and site visits, along with timely relevant reading materials. (d) Board meetings The Board meets formally at least 6 times a year to consider a broad range of matters, including strategy, financial performance reviews, capital management and acquisitions. Details of meetings (both full Board and Committees) and attendances are set out in the Directors’ Report. (e) Independent professional advice and access to information Each Director has the right to seek independent professional advice at the Company’s expense. However, prior approval of the Chairman is required, which is not unreasonably withheld. All Directors have unrestricted access to Company records and information and receive detailed financial and operational reports from senior management during the year to enable them to carry out their duties. Directors also liaise with senior management as required and may consult with other employees and seek additional information on request.
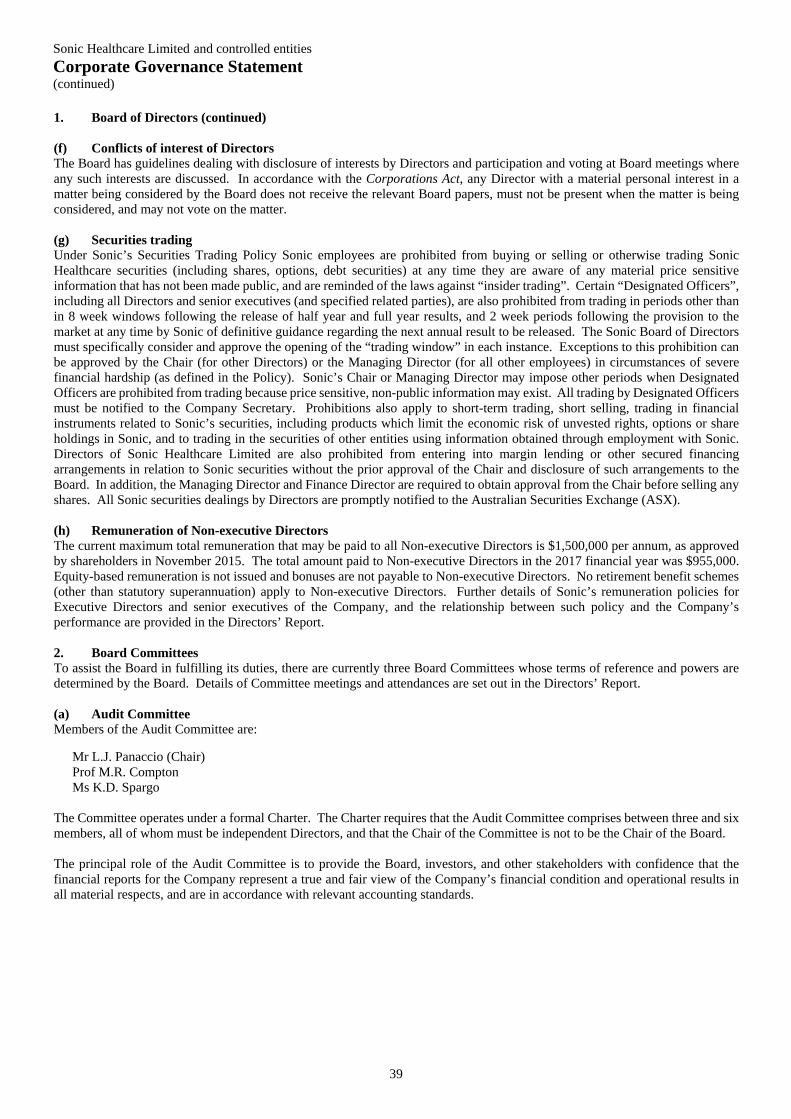
Sonic Healthcare Limited and controlled entities Corporate Governance Statement (continued)
39
1. Board of Directors (continued) (f) Conflicts of interest of Directors The Board has guidelines dealing with disclosure of interests by Directors and participation and voting at Board meetings where any such interests are discussed. In accordance with the Corporations Act, any Director with a material personal interest in a matter being considered by the Board does not receive the relevant Board papers, must not be present when the matter is being considered, and may not vote on the matter. (g) Securities trading Under Sonic’s Securities Trading Policy Sonic employees are prohibited from buying or selling or otherwise trading Sonic Healthcare securities (including shares, options, debt securities) at any time they are aware of any material price sensitive information that has not been made public, and are reminded of the laws against “insider trading”. Certain “Designated Officers”, including all Directors and senior executives (and specified related parties), are also prohibited from trading in periods other than in 8 week windows following the release of half year and full year results, and 2 week periods following the provision to the market at any time by Sonic of definitive guidance regarding the next annual result to be released. The Sonic Board of Directors must specifically consider and approve the opening of the “trading window” in each instance. Exceptions to this prohibition can be approved by the Chair (for other Directors) or the Managing Director (for all other employees) in circumstances of severe financial hardship (as defined in the Policy). Sonic’s Chair or Managing Director may impose other periods when Designated Officers are prohibited from trading because price sensitive, non-public information may exist. All trading by Designated Officers must be notified to the Company Secretary. Prohibitions also apply to short-term trading, short selling, trading in financial instruments related to Sonic’s securities, including products which limit the economic risk of unvested rights, options or share holdings in Sonic, and to trading in the securities of other entities using information obtained through employment with Sonic. Directors of Sonic Healthcare Limited are also prohibited from entering into margin lending or other secured financing arrangements in relation to Sonic securities without the prior approval of the Chair and disclosure of such arrangements to the Board. In addition, the Managing Director and Finance Director are required to obtain approval from the Chair before selling any shares. All Sonic securities dealings by Directors are promptly notified to the Australian Securities Exchange (ASX). (h) Remuneration of Non-executive Directors The current maximum total remuneration that may be paid to all Non-executive Directors is $1,500,000 per annum, as approved by shareholders in November 2015. The total amount paid to Non-executive Directors in the 2017 financial year was $955,000. Equity-based remuneration is not issued and bonuses are not payable to Non-executive Directors. No retirement benefit schemes (other than statutory superannuation) apply to Non-executive Directors. Further details of Sonic’s remuneration policies for Executive Directors and senior executives of the Company, and the relationship between such policy and the Company’s performance are provided in the Directors’ Report. 2. Board Committees To assist the Board in fulfilling its duties, there are currently three Board Committees whose terms of reference and powers are determined by the Board. Details of Committee meetings and attendances are set out in the Directors’ Report.
(a) Audit Committee Members of the Audit Committee are:
Mr L.J. Panaccio (Chair) Prof M.R. Compton Ms K.D. Spargo
The Committee operates under a formal Charter. The Charter requires that the Audit Committee comprises between three and six members, all of whom must be independent Directors, and that the Chair of the Committee is not to be the Chair of the Board. The principal role of the Audit Committee is to provide the Board, investors, and other stakeholders with confidence that the financial reports for the Company represent a true and fair view of the Company’s financial condition and operational results in all material respects, and are in accordance with relevant accounting standards.
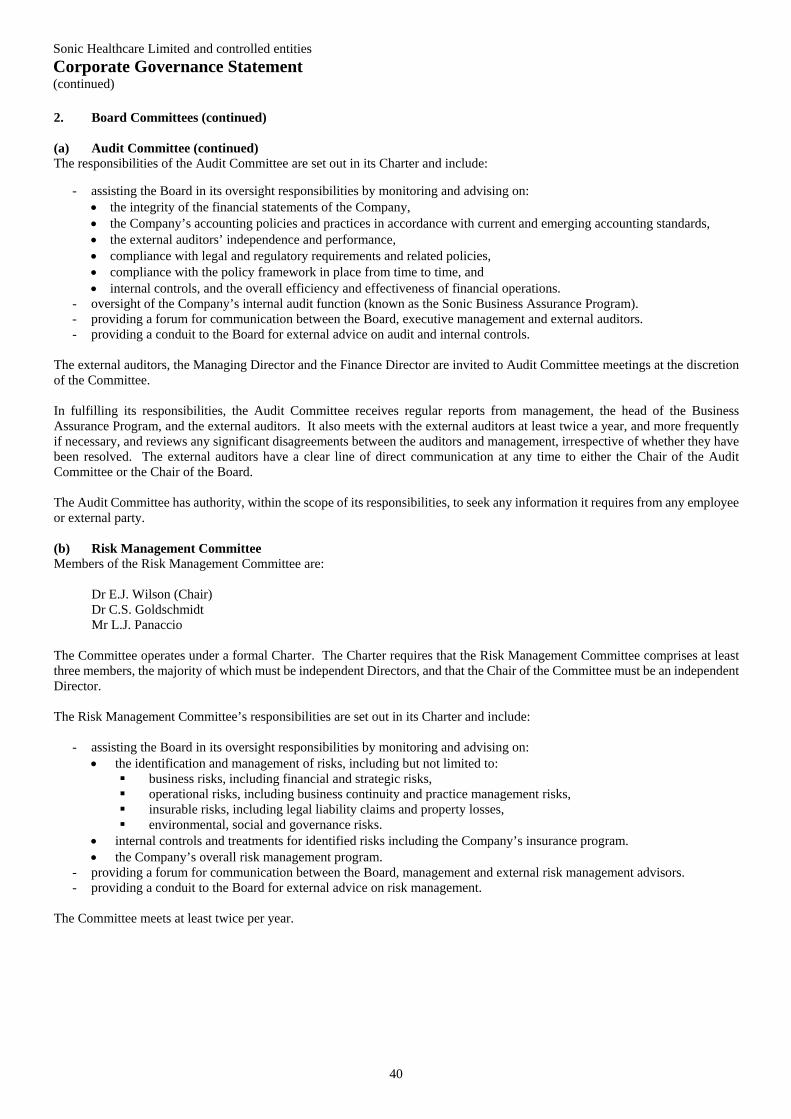
Sonic Healthcare Limited and controlled entities Corporate Governance Statement (continued)
40
2. Board Committees (continued) (a) Audit Committee (continued) The responsibilities of the Audit Committee are set out in its Charter and include:
- assisting the Board in its oversight responsibilities by monitoring and advising on: the integrity of the financial statements of the Company, the Company’s accounting policies and practices in accordance with current and emerging accounting standards, the external auditors’ independence and performance, compliance with legal and regulatory requirements and related policies, compliance with the policy framework in place from time to time, and internal controls, and the overall efficiency and effectiveness of financial operations.
- oversight of the Company’s internal audit function (known as the Sonic Business Assurance Program). - providing a forum for communication between the Board, executive management and external auditors. - providing a conduit to the Board for external advice on audit and internal controls.
The external auditors, the Managing Director and the Finance Director are invited to Audit Committee meetings at the discretion of the Committee. In fulfilling its responsibilities, the Audit Committee receives regular reports from management, the head of the Business Assurance Program, and the external auditors. It also meets with the external auditors at least twice a year, and more frequently if necessary, and reviews any significant disagreements between the auditors and management, irrespective of whether they have been resolved. The external auditors have a clear line of direct communication at any time to either the Chair of the Audit Committee or the Chair of the Board. The Audit Committee has authority, within the scope of its responsibilities, to seek any information it requires from any employee or external party. (b) Risk Management Committee Members of the Risk Management Committee are:
Dr E.J. Wilson (Chair) Dr C.S. Goldschmidt Mr L.J. Panaccio
The Committee operates under a formal Charter. The Charter requires that the Risk Management Committee comprises at least three members, the majority of which must be independent Directors, and that the Chair of the Committee must be an independent Director. The Risk Management Committee’s responsibilities are set out in its Charter and include:
- assisting the Board in its oversight responsibilities by monitoring and advising on: the identification and management of risks, including but not limited to:
business risks, including financial and strategic risks, operational risks, including business continuity and practice management risks, insurable risks, including legal liability claims and property losses, environmental, social and governance risks.
internal controls and treatments for identified risks including the Company’s insurance program. the Company’s overall risk management program.
- providing a forum for communication between the Board, management and external risk management advisors. - providing a conduit to the Board for external advice on risk management.
The Committee meets at least twice per year.
Sonic Healthcare Limited and controlled entities Corporate Governance Statement (continued)
41
2. Board Committees (continued) (c) Remuneration and Nomination Committee Members of the Remuneration and Nomination Committee are:
Ms K.D. Spargo (Chair) Prof M.R. Compton Mr L.J. Panaccio Dr E.J. Wilson
The Remuneration and Nomination Committee operates under a formal Charter. The Charter requires that the Remuneration and Nomination Committee comprises at least three members, all of whom are to be independent Directors. The Remuneration and Nomination Committee’s role, as set out in its Charter, is to:
- review and make recommendations to the Board on remuneration packages and policies applicable to the Managing Director, Finance Director and Non-executive Directors,
- advise the Board in relation to equity-based incentive schemes for other employees, - ensure appropriate disclosure is provided to shareholders in relation to remuneration policies and that equity-based
remuneration is within plans approved by shareholders, - review the Board and Board Committee structures, - advise the Board on the recruitment, appointment, retirement and removal of Directors, - assess and promote the enhancement of competencies of Directors, - review Board succession plans, - make recommendations to the Board in relation to workforce and Board diversity and measurable objectives in relation
to gender diversity, and monitor progress toward achievement of those objectives. The Committee meets on an as required basis. The Remuneration and Nomination Committee, when deemed necessary, directly obtains independent advice on the appropriateness of remuneration. 3. Approach to diversity As a medical diagnostic company, Sonic Healthcare’s business relies on the services provided to referrers and patients by thousands of Sonic staff every day. In addition, in seeking to continually improve Sonic’s services and financial performance, the Company relies on the input and expertise of its Directors, managers, pathologists, radiologists, other medical practitioners and staff. It is therefore critical that Sonic’s workforce brings a broad range of experiences, talents and viewpoints to the business. Diversity is valued as it assists the Company to meet its objectives, and ensures that Sonic’s people at all levels of the Company reflect our customers and the communities we serve.
Sonic Healthcare strives to maintain a healthy, safe and productive environment which is free from discrimination and harassment based on race, colour, religion, gender, sexual orientation, age, national origin or disability. In addition, the Company is committed to the continued development and implementation of initiatives to remove barriers that disadvantage any person or group such that everyone is able to compete on equal terms. Within Sonic, recruitment, development, promotion and remuneration are based on merit. These principles are an integral part of Sonic’s corporate culture, and are encapsulated in the Sonic Core Values and the Company’s Diversity Policy.
The Remuneration and Nomination Committee of the Sonic Board recommends annually measurable objectives for promoting and maintaining gender diversity and measures and reports on progress towards achievement of those objectives. The CEO has discretion with regard to the specific initiatives to be implemented by management to achieve the objectives.
Sonic Healthcare Limited and controlled entities Corporate Governance Statement (continued)
42
3. Approach to diversity (continued) The proportion of female employees to total employees within the Group at 30 June 2017 was:
2017 2016 Non-executive Directors of Sonic Healthcare Limited 50% 50% Directors of Sonic Healthcare Limited 29% 29% Executive staff of the Group+ 34% 32% Other senior leadership positions 56% 55% Total senior leadership positions* 53% 50% All employees 75% 76%
+ Includes Executives to the “CEO-2” level, plus, if not already included, direct reports to the heads of each of Sonic’s operating
subsidiaries. * Includes Directors, executive staff and other senior leadership positions.
The Company’s current objective in relation to gender diversity is to monitor and maintain the percentage of females in senior leadership positions at a level greater than 40%. This objective was achieved in 2017. 4. Identifying and managing business risks Sonic recognises that risk management is an integral part of good management and corporate governance practice and is fundamental to driving shareholder value across the business.
Sonic views the management of risk as a core managerial capability. Risk management is strongly promoted internally and forms part of the performance evaluation of key executives. Sonic’s material business risks are described in the operating and financial review section of the Directors’ Report. Information on Sonic’s impact on society and the environment can be found in the 2017 Corporate Responsibility Report available on Sonic’s website. (a) Responsibilities The Board determines the overall risk profile of the business and is responsible for monitoring and ensuring the maintenance of adequate risk management policies, controls and reporting mechanisms.
To assist the Board in fulfilling its duties, it is aided by the Audit Committee and the Risk Management Committee. The Board has delegated to these Committees responsibility for ensuring:
- the Company’s material business risks, including strategic, financial, operational, compliance, environmental and social sustainability risks, are identified,
- systems are in place to assess, manage, monitor and report on those risks, and that those systems are operating effectively, - management compliance with Board approved policies, - internal controls are operating effectively across the business, and - all Group companies are in compliance with laws and regulations relating to their activities.
The Audit Committee and Risk Management Committee update the Board on all relevant matters.
Management is responsible for the identification, assessment and management of business risks. During the year, management reported on these matters, including the effectiveness of the management of Sonic’s material business risks, to the Audit Committee and Risk Management Committee, who then reported these matters to the Board. The Risk Management Committee reviewed the Company’s risk management framework and reported on that review to the Board.
Sonic Healthcare Limited and controlled entities Corporate Governance Statement (continued)
43
4. Identifying and managing business risks (continued)
(b) Risk management policies, systems and processes Sonic’s activities across all of its operating entities are subject to regular review and continuous oversight by executive management and the Board Committees. The Chief Executive Officers of the individual operating companies are responsible for the identification and management of risk within their business. To assist in this, executive management has developed an effective control environment to help manage the significant risks to its operations. This environment includes the following components:
- clearly defined management responsibilities, management accountabilities and organisational structures, - established policies and procedures that are widely disseminated to, and understood by, employees, - regular internal review of policy compliance and the effectiveness of systems and controls, - comprehensive training programs for staff in relation to operational practices and compliance requirements, - strong management reporting framework for both financial and operational information, - creation of an open culture to share risk management information and to continuously improve the effectiveness of Sonic’s
risk management approach, - benchmarking across operations to share best practice and further reduce the operational risk profile, - Sonic Core Values, a uniting code of conduct embraced by Sonic employees, - centrally administered Group insurance program ensuring a consistent and adequate approach across all operating areas,
and - the ongoing engagement of a professional Risk Manager to coordinate the Company’s approach to material business risk
management.
Control systems and policy compliance are reviewed by Sonic’s Business Assurance Program (Sonic’s internal audit function). The Head of Business Assurance reports to the Audit Committee, and to the Company Secretary for administrative purposes. The Business Assurance Program liaises with, but is independent of, the external auditor, and has full access to the Audit Committee and Risk Management Committee, Sonic management and staff, and records. The Audit Committee determines the scope for the Business Assurance Program each year and monitors management’s response to recommended system enhancements.
(c) Regulatory compliance Sonic’s laboratory, imaging and medical centre activities are subject to Commonwealth and State law in Australia, and similar regulatory control in offshore locations. These laws cover such areas as laboratory and collection centre operations, workplace health and safety, radiation safety, privacy of information and waste management.
Sonic’s network of pathology laboratories, collection centres and imaging centres are required to meet and remain compliant with set performance criteria determined by government and industry bodies.
To support this, Sonic’s operating policies and procedures are overseen by internal quality assurance and workplace health and safety managers who review operational compliance.
In addition, practising pathologists and radiologists are required to be registered and licensed in accordance with Medical Board and Government regulations. The accreditation and licensing of locations, equipment and personnel is subject to regular, random audits by Government experts and medical peer groups. Sonic also undertakes internal reviews to ensure continued best practice and compliance.
Sonic’s established procedures, focus on best practice, Medical Leadership model, structured staff training and the external review activities serve to mitigate operational risk and support regulatory compliance.
(d) Managing Director and Finance Director certification Sonic has adopted a policy requiring the Managing Director and the Finance Director to provide the Board with written certification in relation to its financial reporting processes. For the 2017 financial year, the Managing Director and Finance Director made the following certifications:
- that the financial records of the Company have been properly maintained, - that the financial statements and notes comply in all material respects with the relevant accounting standards, - that the financial statements and notes give a true and fair view, in all material respects, of the Company’s financial
condition and operational results, and - that the statements above are founded on a sound system of risk management and internal control which operates effectively
in all material respects in relation to financial reporting risks.
Sonic Healthcare Limited and controlled entities Corporate Governance Statement (continued)
44
5. Ethical standards The Company has a Code of Ethics policy that outlines the standards required so that the Directors and management conduct themselves with the highest ethical standards. All employees of the Company and its controlled entities are informed of the Code. The Directors regularly review this Code to ensure it reflects best practice in corporate governance. The Code is further supported by the Sonic Core Values. To augment the Code of Ethics and Core Values, the Company has formally implemented and disclosed the following global policies:
- Anti-bribery and Corruption Policy - Diversity Policy - Labour Standards and Human Rights Policy - Workplace Health and Safety Policy - Supplier Code of Conduct - Privacy Policy - Taxation Governance Statement - Environmental Policy
6. Continuous disclosure The Company Secretary has been nominated as the person responsible for communications with the ASX. This role includes responsibility for ensuring compliance with the continuous disclosure requirements in the ASX listing rules and overseeing and co-ordinating information disclosure to the ASX, analysts, brokers, shareholders, the media and the public. Sonic has formalised its policies and procedures on information disclosure in a Policy on Continuous Disclosure. The Policy focuses on continuous disclosure of any information concerning the Company and its controlled entities that a reasonable person would expect to have a material effect on the price of the Company’s securities, and sets out management’s responsibilities and reporting procedures in this regard. All information disclosed to the ASX is then immediately posted on the Company’s website. Presentations to analysts on aspects of the Company’s operations are released to the ASX and posted on the Company’s website. The Company’s investor relations program facilitates effective two-way communication with investors and analysts. All investor relations discussions are conducted or monitored by the Managing Director, Finance Director or Company Secretary and are limited to discussion of non-price sensitive information and material previously announced on the ASX platform. 7. The role of shareholders The Board aims to provide access and communicate openly with shareholders and to ensure that shareholders are informed of all major developments affecting the Group’s state of affairs. Information is communicated to shareholders as follows:
- via the Company’s website (available at www.sonichealthcare.com), which includes electronic and other contact details; - the Annual Report is available to all shareholders on the Company’s website and is distributed to those shareholders who
elect to receive it. The Board ensures that the Annual Report includes relevant information about the operations of the Group during the year, changes in the state of affairs of the Group and details of likely future developments, in addition to the other disclosures required by law; and
- proposed major changes in the Group which may impact on share ownership rights are submitted to a vote of shareholders. To further facilitate communication with shareholders, the Company has established electronic shareholder communication processes via its Share Registry. Shareholders are able to access online Annual Reports, notices of meetings, proxy forms and voting, and receive electronic statements (e.g. holding statements) by email. Where possible the Company provides advance notice of significant group briefings, including for the half and full year results announcements, by publishing details on the Company website and extending open invitations. Telephone dial-in details are generally made available. Records are kept of group and one-on-one briefings with investors and analysts. The Board encourages full participation of shareholders at the AGM to ensure a high level of accountability and identification with the Group’s strategy and goals. AGMs are held at readily accessible locations and advance notice is provided on the Investor Calendar page of the Company’s website. Ample opportunity is provided for shareholders to question the Board and the external auditor at the AGM. Important issues are presented to the shareholders as single resolutions. The shareholders are responsible for voting on the appointment of Directors. The Company ensures that the relevant Notice of Meeting contains all material information in its possession relevant to a decision on whether to elect a Director.
Sonic Healthcare Limited and controlled entities Corporate Governance Statement (continued)
45
8. External auditors The Company’s policy is to appoint external auditors who clearly demonstrate quality and independence. The performance of the external auditor is reviewed annually. Sonic requires its external auditor to attend the AGM and be available to answer shareholder questions about the conduct of the audit and the auditor’s report. It is the policy of the external auditors to provide an annual declaration of their independence to the Audit Committee. 9. Performance evaluation of the Board, its Committees and Directors, and key executive officers (a) The Board and its Committees The Board carries out an annual evaluation of its own performance in meeting its key responsibilities in accordance with the Board Charter, by undertaking the following activities:
- the Chairman discusses with each Director their individual performance and ideas for improvement based on surveys completed by each Director,
- the Board as a whole discusses and analyses its own performance, including suggestions for change or improvement and assessment of the extent to which the Board has discharged its responsibilities as set out in the Board Charter, and
- periodically, an external consultant is engaged to co-ordinate the reviews and provide additional insights. The performance review covers matters such as contribution to strategy development, interaction with management, operation and conduct of meetings, and specific performance objectives for the year ahead. The Board also obtains feedback on its performance and operations from key people such as the external auditors. Each Committee of the Board is required to undertake an annual performance evaluation and report the results of this review to the Board. Performance evaluation results are discussed by the Board, and initiatives are undertaken, where appropriate, to strengthen the effectiveness of the Board’s operation and that of its Committees. The Board periodically reviews the skills, experience and expertise of its Directors and its practices and procedures for both the present and future needs of the Company. Reviews of the performance of the Board, its Committees, and individual Directors were conducted during the year. (b) The Managing Director and Finance Director The performances of the Managing Director and Finance Director are formally reviewed by the Board annually, including during the 2017 year. The performance criteria include:
- economic results of the Group, - fulfilment of objectives and duties, - personnel and resource management, - promotion of and adherence to Sonic Core Values, Foundation Principles, Federation model and the concept of Medical
Leadership, - corporate governance and compliance, - risk management, - external standing and reputation (including stakeholder management, brand and quality), and - additionally for the Finance Director, financial leadership and innovation.
Performance evaluation results are considered by the Remuneration and Nomination Committee in determining the level and structure of remuneration for the Managing Director and Finance Director. (c) Key management personnel The Managing Director evaluates key management personnel at least annually (including during the 2017 year) with qualitative and quantitative measures against agreed business and personal objectives. These business and personal objectives are consistent with those used in the performance reviews for the Managing Director and Finance Director. Key management personnel receive letters of appointment with terms of employment governed by applicable employment laws.
Sonic Healthcare Limited and controlled entities
46
Sonic Healthcare Limited ABN 24 004 196 909 Financial Report - 30 June 2017
Contents
Income Statement 47
Statement of Comprehensive Income 48
Balance Sheet 49
Statement of Changes in Equity 50
Cash Flow Statement 51
Notes to the Financial Statements 52
Directors’ Declaration 112
Independent Auditor’s Report to the Members 113
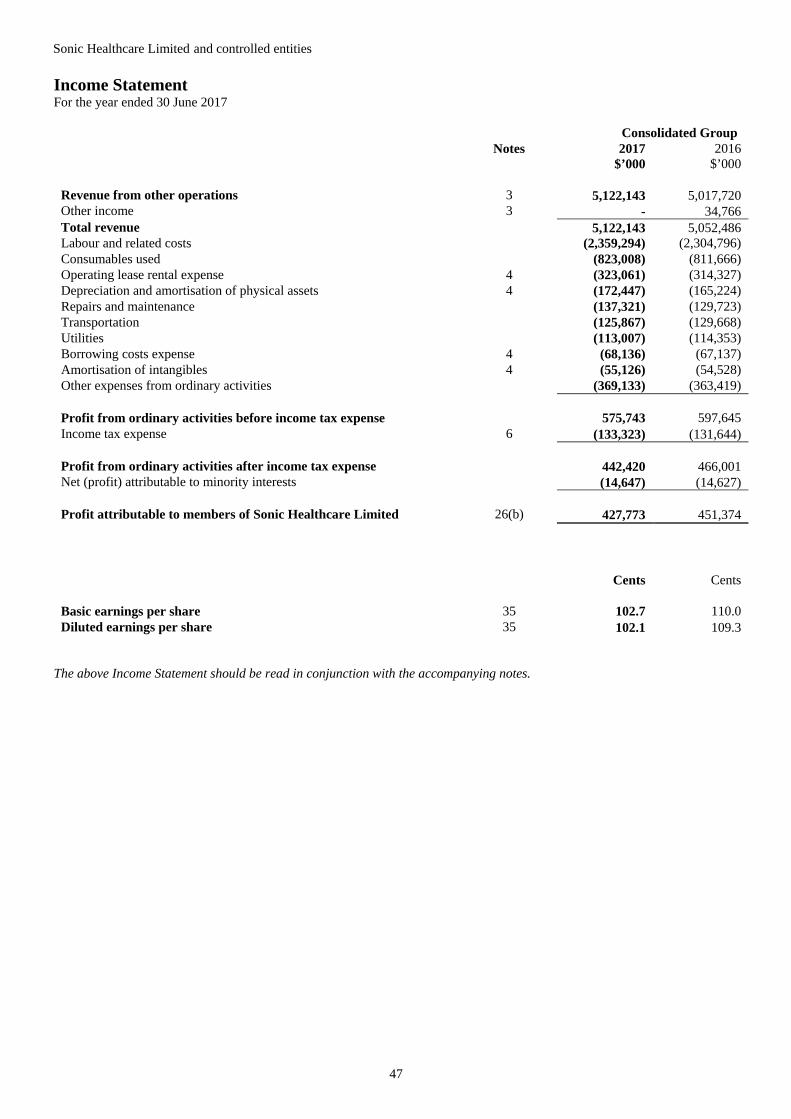
Sonic Healthcare Limited and controlled entities
47
Income Statement For the year ended 30 June 2017
Consolidated Group Notes 2017
$’000 2016
$’000 Revenue from other operations 3 5,122,143 5,017,720 Other income 3 - 34,766 Total revenue 5,122,143 5,052,486 Labour and related costs (2,359,294) (2,304,796) Consumables used (823,008) (811,666) Operating lease rental expense 4 (323,061) (314,327) Depreciation and amortisation of physical assets 4 (172,447) (165,224) Repairs and maintenance (137,321) (129,723) Transportation (125,867) (129,668) Utilities (113,007) (114,353) Borrowing costs expense 4 (68,136) (67,137) Amortisation of intangibles 4 (55,126) (54,528) Other expenses from ordinary activities (369,133) (363,419) Profit from ordinary activities before income tax expense 575,743 597,645 Income tax expense 6 (133,323) (131,644) Profit from ordinary activities after income tax expense 442,420 466,001 Net (profit) attributable to minority interests (14,647) (14,627) Profit attributable to members of Sonic Healthcare Limited 26(b) 427,773 451,374 Cents Cents Basic earnings per share 35 102.7 110.0 Diluted earnings per share 35 102.1 109.3
The above Income Statement should be read in conjunction with the accompanying notes.
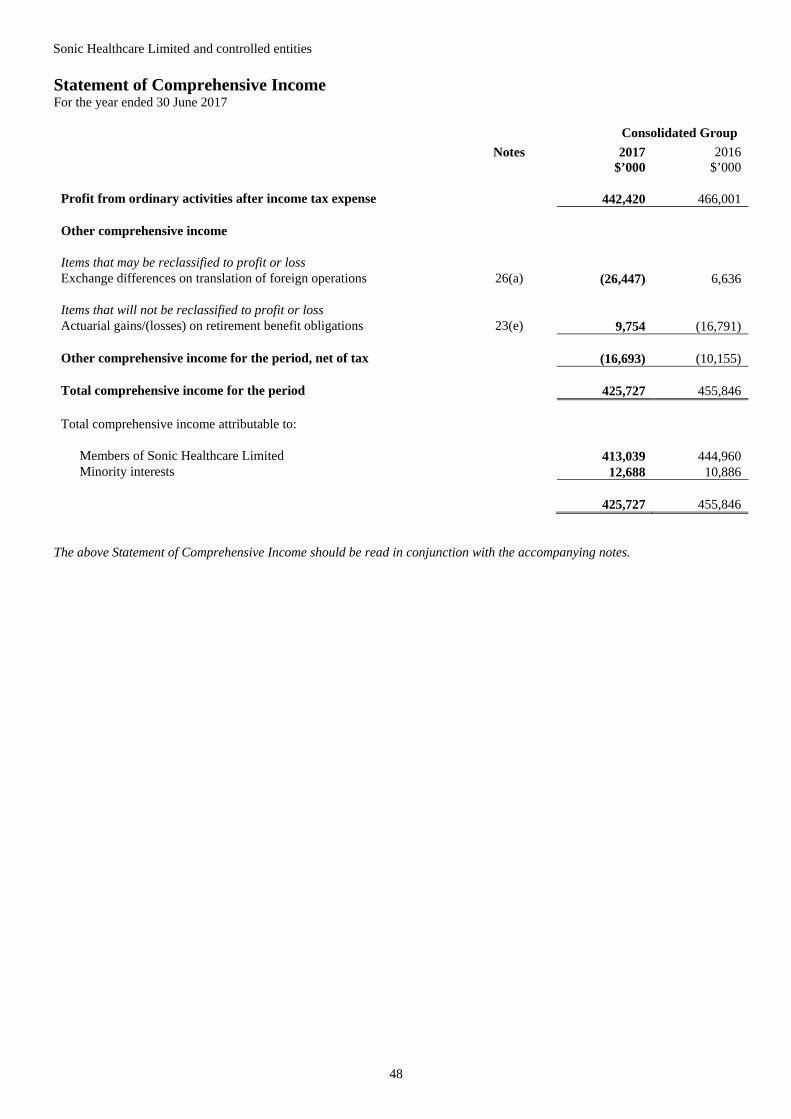
Sonic Healthcare Limited and controlled entities
48
Statement of Comprehensive Income For the year ended 30 June 2017
Consolidated Group
Notes 2017 $’000
2016 $’000
Profit from ordinary activities after income tax expense 442,420 466,001 Other comprehensive income Items that may be reclassified to profit or loss Exchange differences on translation of foreign operations 26(a) (26,447) 6,636 Items that will not be reclassified to profit or loss Actuarial gains/(losses) on retirement benefit obligations 23(e) 9,754 (16,791) Other comprehensive income for the period, net of tax (16,693) (10,155) Total comprehensive income for the period 425,727 455,846 Total comprehensive income attributable to: Members of Sonic Healthcare Limited 413,039 444,960 Minority interests 12,688 10,886 425,727 455,846
The above Statement of Comprehensive Income should be read in conjunction with the accompanying notes.
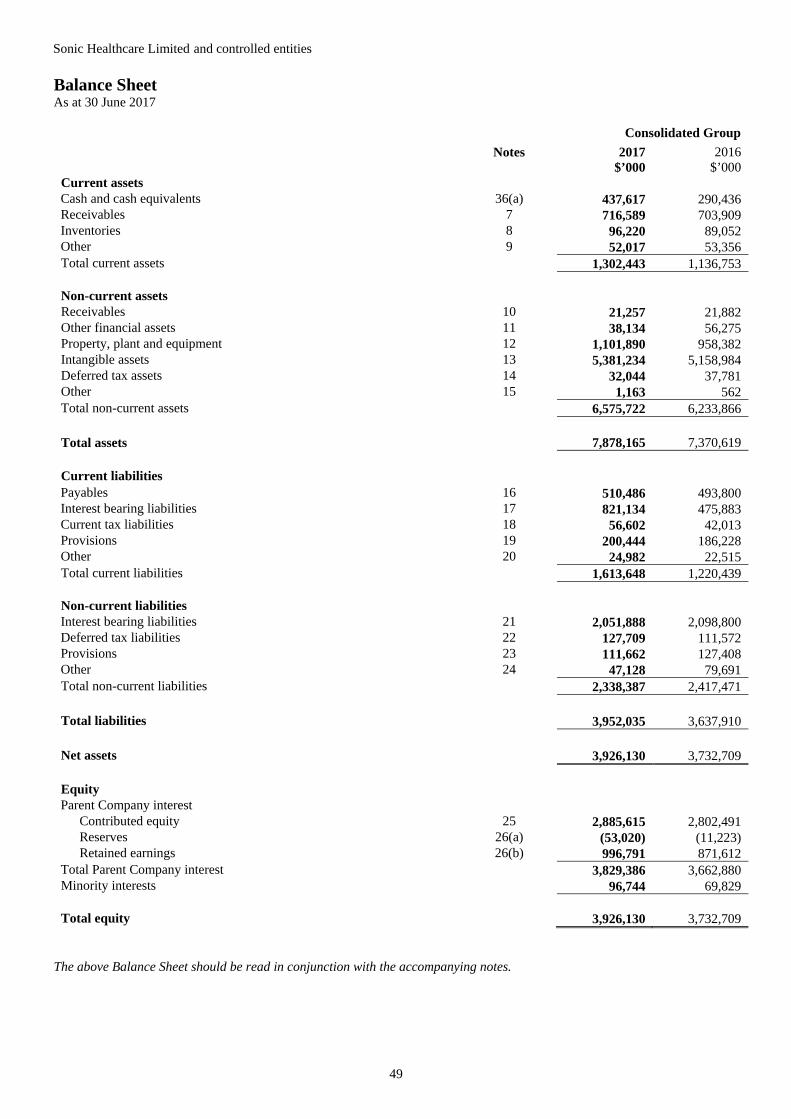
Sonic Healthcare Limited and controlled entities
49
Balance Sheet As at 30 June 2017
Consolidated Group
Notes 2017 $’000
2016 $’000
Current assets Cash and cash equivalents 36(a) 437,617 290,436 Receivables 7 716,589 703,909 Inventories 8 96,220 89,052 Other 9 52,017 53,356 Total current assets 1,302,443 1,136,753 Non-current assets Receivables 10 21,257 21,882 Other financial assets 11 38,134 56,275 Property, plant and equipment 12 1,101,890 958,382 Intangible assets 13 5,381,234 5,158,984 Deferred tax assets 14 32,044 37,781 Other 15 1,163 562 Total non-current assets 6,575,722 6,233,866 Total assets 7,878,165 7,370,619 Current liabilities Payables 16 510,486 493,800 Interest bearing liabilities 17 821,134 475,883 Current tax liabilities 18 56,602 42,013 Provisions 19 200,444 186,228 Other 20 24,982 22,515 Total current liabilities 1,613,648 1,220,439 Non-current liabilities Interest bearing liabilities 21 2,051,888 2,098,800 Deferred tax liabilities 22 127,709 111,572 Provisions 23 111,662 127,408 Other 24 47,128 79,691 Total non-current liabilities 2,338,387 2,417,471 Total liabilities 3,952,035 3,637,910 Net assets 3,926,130 3,732,709 Equity Parent Company interest
Contributed equity 25 2,885,615 2,802,491 Reserves 26(a) (53,020) (11,223) Retained earnings 26(b) 996,791 871,612
Total Parent Company interest 3,829,386 3,662,880 Minority interests 96,744 69,829 Total equity 3,926,130 3,732,709
The above Balance Sheet should be read in conjunction with the accompanying notes.
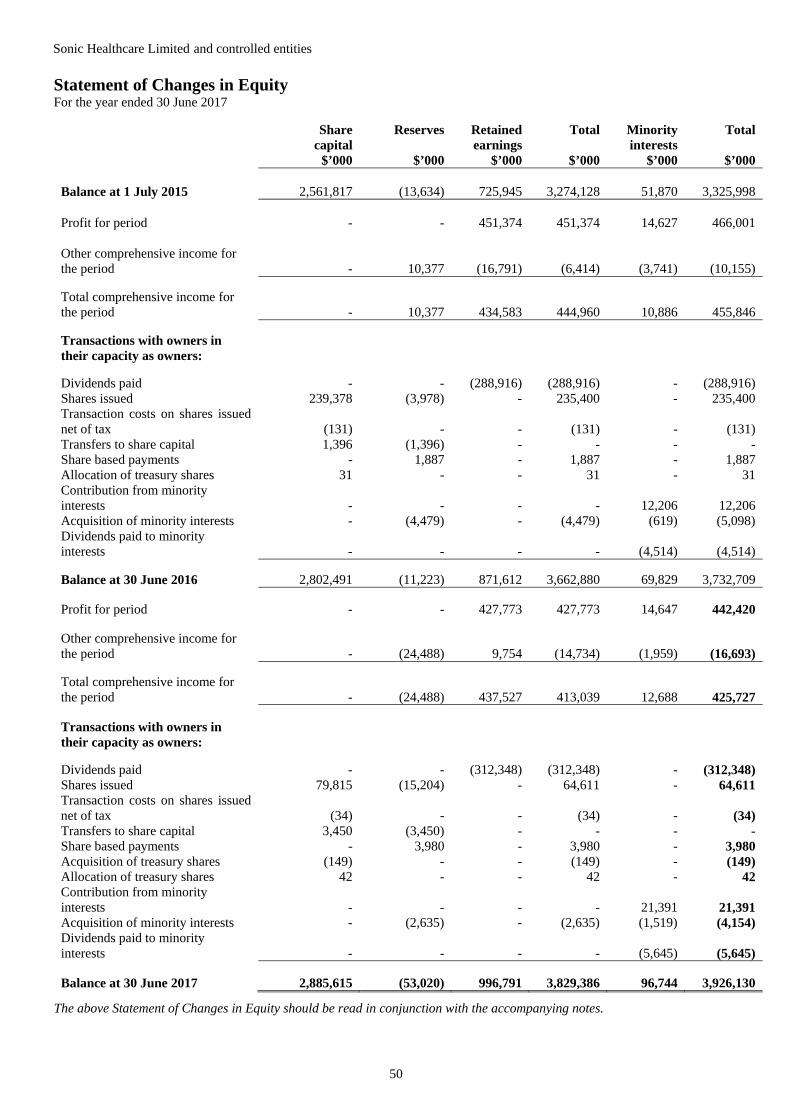
Sonic Healthcare Limited and controlled entities
50
Statement of Changes in Equity For the year ended 30 June 2017
Share capital
$’000
Reserves
$’000
Retained earnings
$’000
Total
$’000
Minority interests
$’000
Total
$’000 Balance at 1 July 2015 2,561,817 (13,634) 725,945 3,274,128 51,870 3,325,998 Profit for period - - 451,374 451,374 14,627 466,001 Other comprehensive income for the period - 10,377 (16,791) (6,414) (3,741)
(10,155)
Total comprehensive income for the period - 10,377 434,583 444,960 10,886
455,846
Transactions with owners in their capacity as owners:
Dividends paid - - (288,916) (288,916) - (288,916) Shares issued 239,378 (3,978) - 235,400 - 235,400 Transaction costs on shares issued net of tax (131) - - (131) -
(131)
Transfers to share capital 1,396 (1,396) - - - - Share based payments - 1,887 - 1,887 - 1,887 Allocation of treasury shares 31 - - 31 - 31 Contribution from minority interests - - - - 12,206
12,206
Acquisition of minority interests - (4,479) - (4,479) (619) (5,098) Dividends paid to minority interests - - - - (4,514)
(4,514)
Balance at 30 June 2016 2,802,491 (11,223) 871,612 3,662,880 69,829 3,732,709 Profit for period - - 427,773 427,773 14,647 442,420 Other comprehensive income for the period - (24,488) 9,754 (14,734) (1,959)
(16,693)
Total comprehensive income for the period - (24,488) 437,527 413,039 12,688
425,727
Transactions with owners in their capacity as owners:
Dividends paid - - (312,348) (312,348) - (312,348) Shares issued 79,815 (15,204) - 64,611 - 64,611 Transaction costs on shares issued net of tax (34) - - (34) -
(34)
Transfers to share capital 3,450 (3,450) - - - - Share based payments - 3,980 - 3,980 - 3,980 Acquisition of treasury shares (149) - - (149) - (149) Allocation of treasury shares 42 - - 42 - 42 Contribution from minority interests - - - - 21,391
21,391
Acquisition of minority interests - (2,635) - (2,635) (1,519) (4,154) Dividends paid to minority interests - - - - (5,645)
(5,645)
Balance at 30 June 2017 2,885,615 (53,020) 996,791 3,829,386 96,744 3,926,130
The above Statement of Changes in Equity should be read in conjunction with the accompanying notes.
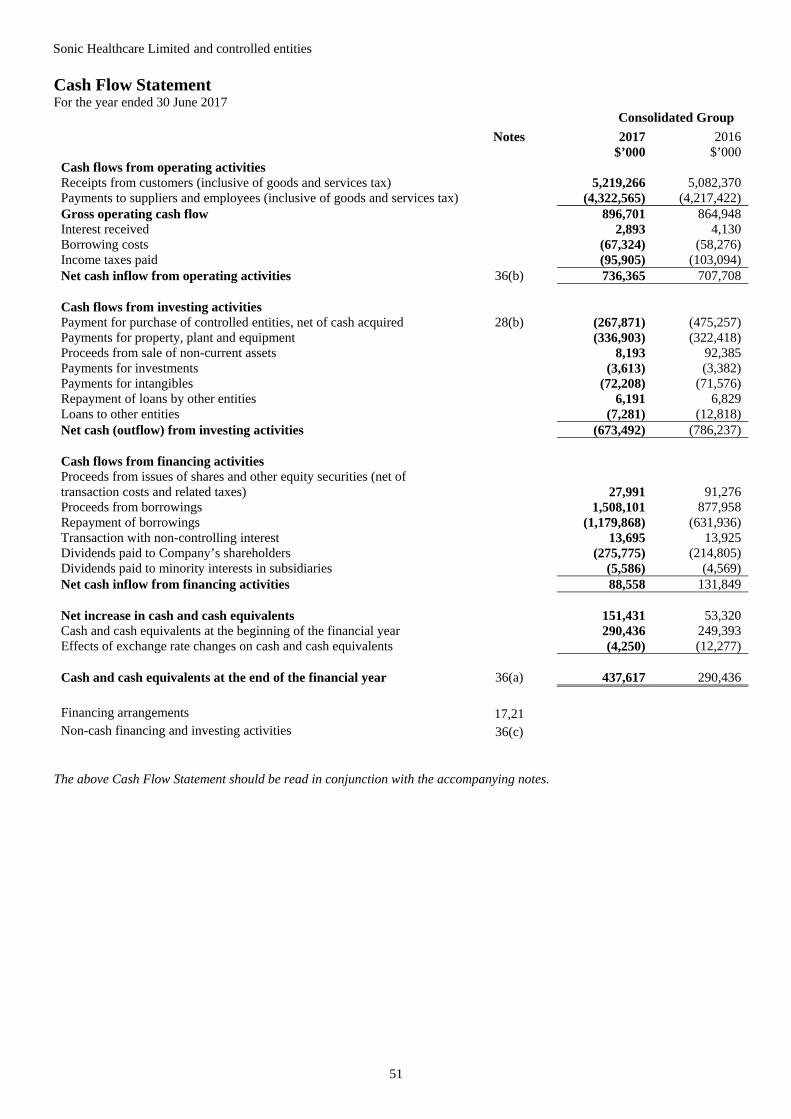
Sonic Healthcare Limited and controlled entities
51
Cash Flow Statement For the year ended 30 June 2017
Consolidated Group
Notes 2017 $’000
2016 $’000
Cash flows from operating activities Receipts from customers (inclusive of goods and services tax) 5,219,266 5,082,370 Payments to suppliers and employees (inclusive of goods and services tax) (4,322,565) (4,217,422) Gross operating cash flow 896,701 864,948 Interest received 2,893 4,130 Borrowing costs (67,324) (58,276) Income taxes paid (95,905) (103,094) Net cash inflow from operating activities 36(b) 736,365 707,708 Cash flows from investing activities Payment for purchase of controlled entities, net of cash acquired 28(b) (267,871) (475,257) Payments for property, plant and equipment (336,903) (322,418) Proceeds from sale of non-current assets 8,193 92,385 Payments for investments (3,613) (3,382) Payments for intangibles (72,208) (71,576) Repayment of loans by other entities 6,191 6,829 Loans to other entities (7,281) (12,818) Net cash (outflow) from investing activities (673,492) (786,237) Cash flows from financing activities Proceeds from issues of shares and other equity securities (net of transaction costs and related taxes) 27,991 91,276 Proceeds from borrowings 1,508,101 877,958 Repayment of borrowings (1,179,868) (631,936) Transaction with non-controlling interest 13,695 13,925 Dividends paid to Company’s shareholders (275,775) (214,805) Dividends paid to minority interests in subsidiaries (5,586) (4,569) Net cash inflow from financing activities 88,558 131,849 Net increase in cash and cash equivalents 151,431 53,320 Cash and cash equivalents at the beginning of the financial year 290,436 249,393 Effects of exchange rate changes on cash and cash equivalents (4,250) (12,277) Cash and cash equivalents at the end of the financial year
36(a) 437,617 290,436
Financing arrangements 17,21 Non-cash financing and investing activities 36(c)
The above Cash Flow Statement should be read in conjunction with the accompanying notes.
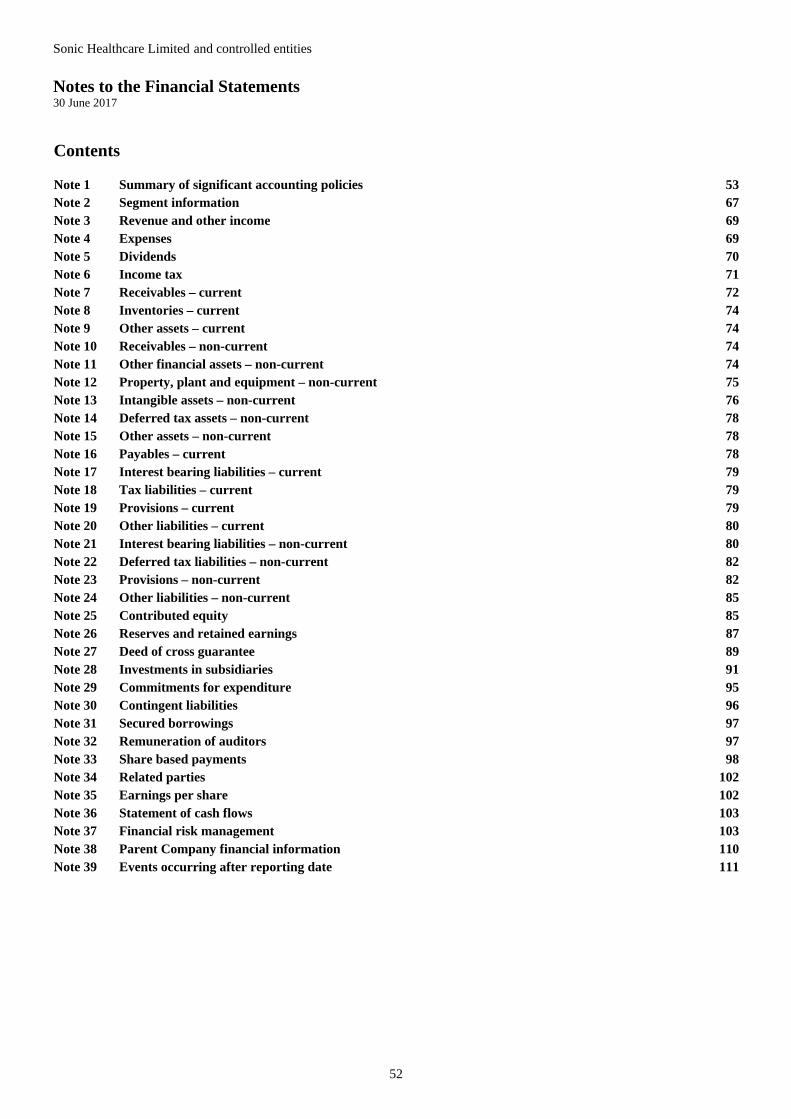
Sonic Healthcare Limited and controlled entities Notes to the Financial Statements 30 June 2017
52
Contents Note 1 Summary of significant accounting policies 53 Note 2 Segment information 67 Note 3 Revenue and other income 69 Note 4 Expenses 69 Note 5 Dividends 70 Note 6 Income tax 71 Note 7 Receivables – current 72 Note 8 Inventories – current 74 Note 9 Other assets – current 74 Note 10 Receivables – non-current 74 Note 11 Other financial assets – non-current 74 Note 12 Property, plant and equipment – non-current 75 Note 13 Intangible assets – non-current 76 Note 14 Deferred tax assets – non-current 78 Note 15 Other assets – non-current 78 Note 16 Payables – current 78 Note 17 Interest bearing liabilities – current 79 Note 18 Tax liabilities – current 79 Note 19 Provisions – current 79 Note 20 Other liabilities – current 80 Note 21 Interest bearing liabilities – non-current 80 Note 22 Deferred tax liabilities – non-current 82 Note 23 Provisions – non-current 82 Note 24 Other liabilities – non-current 85 Note 25 Contributed equity 85 Note 26 Reserves and retained earnings 87 Note 27 Deed of cross guarantee 89 Note 28 Investments in subsidiaries 91 Note 29 Commitments for expenditure 95 Note 30 Contingent liabilities 96 Note 31 Secured borrowings 97 Note 32 Remuneration of auditors 97 Note 33 Share based payments 98 Note 34 Related parties 102 Note 35 Earnings per share 102 Note 36 Statement of cash flows 103 Note 37 Financial risk management 103 Note 38 Parent Company financial information 110 Note 39 Events occurring after reporting date 111
Sonic Healthcare Limited and controlled entities Notes to the Financial Statements
53
Note 1 Summary of significant accounting policies The principal accounting policies adopted in the preparation of the Financial Report are set out below. These policies have been consistently applied to all the periods presented, unless otherwise stated. The Financial Report includes financial statements for the Consolidated Group (“the Group”) consisting of Sonic Healthcare Limited (“Parent Company” or “Company”) and its subsidiaries. The financial statements were authorised for issue by the Directors on 18 September 2017.
(a) Basis of preparation This general purpose Financial Report has been prepared in accordance with Australian Accounting Standards, Interpretations issued by the Australian Accounting Standards Board and the Corporations Act 2001. The Company is a for-profit entity for the purpose of preparing the financial statements.
Compliance with IFRS The consolidated financial statements of the Group also comply with International Financial Reporting Standards (“IFRS”) as issued by the International Accounting Standards Board. The Parent Company financial information included in Note 38 also complies with IFRS.
Historical cost convention These financial statements have been prepared under the historical cost convention, except for the revaluation of financial assets and liabilities (including derivative instruments) at fair value through profit or loss and plan assets of retirement benefit obligations measured at fair value. Working capital Sonic is required to disclose $821M of debt drawn under facilities which expire before 30 June 2018 as a current liability as at 30 June 2017. As a result the Consolidated Balance Sheet shows a deficiency of working capital of $311M. Sonic intends to refinance this debt and foresees no difficulty in doing so based on discussions with existing lenders and approaches from potential new lenders. Sonic also has significant headroom available in cash and undrawn facilities. The financial report has therefore been prepared on a “going concern” basis. Comparatives may be restated to enhance comparability with the current year.
(b) Principles of consolidation The Consolidated Group financial statements incorporate the assets and liabilities of all subsidiaries controlled by Sonic Healthcare Limited as at 30 June 2017 and the results of all subsidiaries for the year then ended. Sonic Healthcare Limited and its controlled entities together are referred to in this Financial Report as the Group or the Consolidated Group.
Subsidiaries are all those entities (including special purpose entities) over which the Group has control. The Group controls an entity when the Group is exposed to, or has rights to, variable returns from its involvement with the entity and has the ability to affect those returns through its power to direct the activities of the entity.
Intercompany transactions, balances and unrealised gains on transactions between Group companies are eliminated. Unrealised losses are also eliminated unless the transaction provides evidence of the impairment of the asset transferred. Accounting policies of subsidiaries have been changed where necessary to ensure consistency with the policies adopted by the Group.
Minority interests in the results and equity of controlled entities are shown separately in the Income Statement, Statement of Comprehensive Income, Statement of Changes in Equity and Balance Sheet respectively.
Subsidiaries are fully consolidated from the date on which control is transferred to the Group. They are de-consolidated from the date that control ceases.
The acquisition method of accounting is used to account for the acquisition of subsidiaries by the Group (refer to Note 1(e)).
Sonic Healthcare Limited Employee Share Trust (“SHEST”) The Group has formed a trust to obtain and hold shares for the purpose of providing shares under selected Group equity plans. This trust is consolidated, as the substance of the relationship is that the trust is controlled by the Group. Shares held by SHEST are disclosed as treasury shares and deducted from contributed equity.
Sonic Healthcare Limited and controlled entities Notes to the Financial Statements (continued)
54
Note 1 Summary of significant accounting policies (continued)
(b) Principles of consolidation (continued)
Changes in ownership interests The Group treats transactions with minority interests that do not result in a loss of control as transactions with equity owners of the Group. A change in ownership interest results in an adjustment between the carrying amounts of the controlling and minority interests to reflect their relative interests in the subsidiary. Any difference between the amount of the adjustment to minority interests and any consideration paid or received is recognised in a separate reserve within equity. When the Group ceases to have control, joint control or significant influence, any retained interest in the entity is remeasured to its fair value with the change in carrying amount recognised in profit or loss. The fair value is the initial carrying amount for the purposes of subsequently accounting for the retained interest as an associate, jointly controlled entity or financial asset. In addition, any amounts previously recognised in other comprehensive income in respect of that entity are accounted for as if the Group had directly disposed of the related assets or liabilities. This may mean that amounts previously recognised in other comprehensive income are reclassified to profit or loss. If the ownership interest in a jointly-controlled entity or an associate is reduced but joint control or significant influence is retained, only a proportionate share of the amounts previously recognised in other comprehensive income are reclassified to profit or loss where appropriate.
(c) Income tax The income tax expense or benefit for the period is the tax payable or receivable on the current period’s taxable income based on the income tax rate for each jurisdiction adjusted by changes in deferred tax assets and liabilities attributable to temporary differences between the tax bases of assets and liabilities and their carrying amounts in the financial statements, and to unused tax losses. The current income tax charge is calculated on the basis of the tax laws enacted or substantively enacted at the end of the reporting period in the countries where the Company’s subsidiaries operate and generate taxable income. Management periodically evaluates positions taken in tax returns with respect to situations in which applicable tax regulation is subject to interpretation. It establishes provisions where appropriate on the basis of amounts expected to be paid to the tax authorities. Deferred income tax is provided in full, using the liability method, on temporary differences arising between the tax bases of assets and liabilities and their carrying amounts in the consolidated financial statements. However, deferred tax liabilities are not recognised if they arise from the initial recognition of goodwill. Deferred income tax is also not accounted for if it arises from initial recognition of an asset or liability in a transaction other than a business combination that at the time of the transaction affects neither accounting nor taxable profit or loss. Deferred income tax is determined using tax rates (and laws) that have been enacted or substantially enacted by the end of the reporting period and are expected to apply when the related deferred income tax asset is realised or the deferred income tax liability is settled. Deferred tax assets are recognised for deductible temporary differences and unused tax losses only if it is probable that future taxable amounts will be available to utilise those temporary differences and losses. Deferred tax liabilities and assets are not recognised for temporary differences between the carrying amount and tax bases of investments in controlled entities where the Group is able to control the timing of the reversal of the temporary differences and it is probable that the differences will not reverse in the foreseeable future. Deferred tax assets and liabilities are offset when there is a legally enforceable right to offset current tax assets and liabilities and when the deferred tax balances relate to the same taxation authority. Current tax assets and tax liabilities are offset where the entity has a legally enforceable right to offset and intends either to settle on a net basis, or to realise the asset and settle the liability simultaneously. Sonic Healthcare Limited and its wholly-owned Australian controlled entities have implemented the Australian tax consolidation legislation. As a consequence, these entities are taxed as a single entity and the deferred tax assets and liabilities of these entities are offset in the consolidated financial statements. Current and deferred tax is recognised in profit or loss, except to the extent that it relates to items recognised in other comprehensive income or directly in equity. In this case, the tax is also recognised in other comprehensive income or directly in equity, respectively.
Sonic Healthcare Limited and controlled entities Notes to the Financial Statements (continued)
55
Note 1 Summary of significant accounting policies (continued)
(c) Income tax (continued)
Investment allowances and similar tax incentives Companies within the Group may be entitled to claim special tax deductions for investments in qualifying assets or in relation to qualifying expenditure (e.g. the Research and Development Tax Incentive regime in Australia or other investment allowances). The Group accounts for such allowances as tax credits, which means that the allowance reduces income tax payable and current tax expense.
(d) Foreign currency translation (i) Functional and presentation currency Items included in the financial statements of each entity are measured using the currency of the primary economic environment in which the entity operates (‘the functional currency’). The Group’s financial statements are presented in Australian dollars, which is Sonic Healthcare Limited’s functional and presentation currency. (ii) Transactions Foreign currency transactions are initially translated into the functional currency using the rates of exchange prevailing at the date of the transaction. At the balance sheet date amounts payable and receivable in foreign currencies are translated to Australian currency at rates of exchange current at that date. Resulting foreign exchange differences are recognised in the Income Statement except where they are deferred in equity as cash flow hedges and qualifying net investment hedges or are attributable to part of the net investment in a foreign operation. (iii) Foreign controlled entities The assets and liabilities of foreign controlled entities are translated into Australian currency at rates of exchange current at the balance sheet date, while their income and expenses are translated at the average of rates prevailing during the year. Exchange differences arising on translation are taken to the foreign currency translation reserve.
Differences on foreign currency borrowings that provide a hedge against a net investment in a foreign entity are recognised in other comprehensive income and accumulated in the foreign currency translation reserve. When a foreign operation is sold, a proportionate share of such exchange difference is reclassified to the Income Statement, as part of the gain or loss on sale where applicable.
(e) Business combinations The acquisition method of accounting is used to account for all business combinations regardless of whether equity instruments or other assets are acquired. The consideration transferred for the acquisition of a subsidiary comprises the fair values of the assets transferred, the liabilities incurred and the equity interests issued by the Group. The consideration transferred also includes the fair value of any contingent consideration arrangement and the fair value of any pre-existing equity interest in the subsidiary. Acquisition-related costs are expensed as incurred. On an acquisition-by-acquisition basis, the Group recognises any minority interest in the acquiree either at fair value or at the minority interest’s proportionate share of the acquiree’s net identifiable assets.
Where settlement of any part of cash consideration is deferred, the amounts payable in the future are discounted to their present value as at the date of the acquisition. The discount rate used is the incremental borrowing rate, being the rate at which a similar borrowing could be obtained from an independent financier under comparable terms and conditions.
Contingent consideration is classified either as equity or a financial liability. Amounts classified as a financial liability are subsequently remeasured to fair value with changes in fair value recognised in profit or loss.
Identifiable assets acquired and liabilities and contingent liabilities assumed in an acquisition are measured initially at their fair values at the acquisition dates, irrespective of the extent of any minority interest. Goodwill is brought to account on the basis described in Note 1(m)(i).
The excess of the consideration transferred, the amount of any minority interest in the acquiree and the acquisition-date fair value of any previous equity interest in the acquiree over the fair value of the Group’s share of the net identifiable assets acquired is recorded as goodwill. If those amounts are less than the fair value of the net identifiable assets of the subsidiary acquired and the measurement of all amounts has been reviewed, the difference is recognised directly in profit or loss as a bargain purchase.
Sonic Healthcare Limited and controlled entities Notes to the Financial Statements (continued)
56
Note 1 Summary of significant accounting policies (continued)
(f) Revenue recognition Revenue is measured at fair value of the consideration received or receivable. Amounts disclosed as revenue are net of returns, trade allowances, rebates and amounts collected on behalf of third parties. The Group recognises revenue when the amount of revenue can be reliably measured, it is probable that future economic benefits will flow to the entity and specific criteria have been met for each of the Group’s activities as described below. The Group bases its estimates on historical results, taking into consideration the type of customer, the type of transaction and the specifics of each arrangement. Revenue is recognised for the major business activities as follows: (i) Medical services Medical services revenue is recognised on a completed test or service basis.
(ii) Other services Revenue from other services is recognised when the service has been provided.
(iii) Rental income Rental income is recognised on a straight-line basis over the term of the lease.
(iv) Government grants Government grants are recognised at their fair value where there is reasonable assurance that these grants will be received and the Group has complied with all attached conditions. At the time of income recognition, there are no unfulfilled conditions or other contingencies attached to these grants. Government grants related to income are presented as a credit in the Income Statement and are recognised as income on a systematic and rational basis over the periods necessary to match them with the related costs.
(v) Interest income Interest income is recognised using the effective interest method.
(vi) Dividends Dividends are recognised as revenue when the right to receive payment is established. This applies even if they are paid out of pre-acquisition profits. However, the investment may need to be tested for impairment as a consequence.
(g) Receivables All trade debtors are initially recognised at their fair value being the amounts receivable and subsequently measured at amortised cost using the effective interest method, less provision for impairment. Trade debtors are generally required to be settled within 30 days. They are presented as current assets unless collection is not expected for more than 12 months after the reporting date. Collectability of trade debtors is reviewed on an ongoing basis. Debts which are known to be uncollectible are written off in the period in which they are identified. A provision for impairment of receivables is raised during the year where there is objective evidence that the Group will not be able to collect all amounts due according to the original terms of the receivables and adjusted following a review of all outstanding amounts at the balance sheet date. (h) Inventories Inventories, comprising consumable stores stock, are valued at the lower of cost and net realisable value. Costs are assigned to individual items of inventory on the first in, first out (FIFO) basis.
(i) Impairment of assets Goodwill and intangible assets that have an indefinite useful life are not subject to amortisation and are tested annually for impairment, or more frequently if events or changes in circumstances indicate that they might be impaired. Other assets are reviewed for impairment whenever events or changes in circumstances indicate that the carrying amount may not be recoverable. An impairment loss is recognised for the amount by which the asset’s carrying value exceeds its recoverable amount. The recoverable amount is the higher of an asset’s fair value less costs to sell and value in use. For the purposes of assessing impairment, assets are grouped at the lowest levels for which there are separately identifiable cash inflows which are largely independent of the cash inflows from other assets or groups of assets (cash-generating units). Non-financial assets other than goodwill that suffered an impairment are reviewed for possible reversal of the impairment at each reporting date. In assessing the value in use, the estimated future cash flows are discounted to their present value using a pre-tax discount rate that reflects current market assessments of the time value of money and the risks specific to the asset.
Sonic Healthcare Limited and controlled entities Notes to the Financial Statements (continued)
57
Note 1 Summary of significant accounting policies (continued)
(j) Investments and other financial assets The Group classifies its financial assets in the following categories: financial assets at fair value through profit or loss, loans and receivables, held to maturity investments, and available-for-sale financial assets. The classification depends on the purpose for which the investments were acquired. Management determines the classification of its investments at initial recognition and re-evaluates this designation at each reporting date. With the exception of loans and receivables and held-to-maturity investments which are measured at amortised cost (refer below), fair value is the measurement basis. Changes in fair value are either taken to the Income Statement or an equity reserve depending upon the classification of the investment. (i) Financial assets at fair value through profit or loss A financial asset is classified in this category if acquired principally for the purpose of selling in the short term. The assets in this category are classified as current assets if they are expected to be settled within 12 months. (ii) Loans and receivables Loans and receivables are non-derivative financial assets with fixed or determinable payments that are not quoted in an active market. They are included in current assets, except for those with maturities greater than 12 months after the balance sheet date which are classified as non-current assets. Loans and receivables are included in receivables in the Balance Sheet. (iii) Held-to-maturity investments Held-to-maturity investments are non-derivative financial assets with fixed or determinable payments and fixed maturities that management has the positive intention and ability to hold to maturity. If the Group were to sell other than an insignificant amount of held-to-maturity financial assets, the whole category would be tainted and re-classified as available-for-sale. Held-to-maturity financial assets are included in non-current assets, except for those with maturities less than 12 months from the reporting date, which are classified as current assets. (iv) Available-for-sale financial assets Available-for-sale financial assets are non-derivatives that are either designated in this category or not classified in any of the other categories. They are included in non-current assets unless management intends to dispose of the investment within 12 months of the balance sheet date. Financial assets are designated as available-for-sale if they do not have fixed maturities and fixed or determinable payments and management intends to hold them for the medium or long term. (v) Recognition and derecognition Purchases and sales of financial assets are recognised on trade-date – the date on which the Group commits to purchase or sell the asset. Financial assets are derecognised when the rights to receive cash flows from the financial assets have expired or have been transferred and the Group has transferred substantially all the risks and rewards of ownership. Financial assets are initially recognised at fair value plus transaction costs associated with the investment for all financial assets not carried at fair value through profit or loss. Financial assets carried at fair value through profit or loss are initially recognised at fair value and transaction costs are expensed in the Income Statement. (vi) Subsequent measurement Loans and receivables and held-to-maturity investments are subsequently carried at amortised cost using the effective interest method. Available-for-sale financial assets and financial assets at fair value through profit and loss are subsequently carried at fair value. Realised and unrealised gains and losses arising from changes in the fair value of the ‘financial assets at fair value through profit or loss’ category are included in the Income Statement in the period in which they arise. The fair values of any quoted investments accounted at ‘fair value through profit and loss’ are based on current market prices. If the market for a financial asset is not active (and for unlisted securities), the Group establishes fair value by using valuation techniques. These include reference to the fair values of recent arm’s length transactions, involving the same instruments or other instruments that are substantially the same, discounted cash flow analysis, and appropriate pricing models.
Sonic Healthcare Limited and controlled entities Notes to the Financial Statements (continued)
58
Note 1 Summary of significant accounting policies (continued)
(j) Investments and other financial assets (continued) (vii) Impairment The Group assesses at each balance sheet date whether there is objective evidence that a financial asset or group of financial assets is impaired. If there is objective evidence of impairment for any of the Group’s financial assets carried at amortised cost, the loss is measured as the difference between the asset’s carrying amount and the present value of estimated future cash flows, excluding future credit losses that have not been incurred. The cash flows are discounted at the financial asset’s original effective interest rate. The loss is recognised in the Income Statement. If there is objective evidence of impairment for available-for-sale financial assets, the cumulative loss - measured as the difference between the acquisition cost and the current fair value, less any impairment loss on that financial asset previously recognised in the Income Statement - is removed from equity and recognised in the Income Statement. (k) Property, plant and equipment Property, plant and equipment is stated at historical cost less accumulated depreciation and any impairment in value. Depreciation is calculated using the straight-line method to allocate the net cost of each item of property, plant and equipment (excluding land), net of their residual values over their estimated useful lives to the Group. Land is not depreciated. Estimates of remaining useful lives and residual values are made on a regular basis for all assets, with annual reassessments for major items. The estimated useful lives are as follows: Buildings and improvements 40 years Plant and equipment 3 - 15 years The cost of improvements to or on leasehold properties is amortised over the unexpired period of the lease or the estimated useful life of the improvement to the Group, whichever is the shorter. The carrying values of property, plant and equipment are reviewed for impairment when events or changes in circumstances indicate the carrying value of the asset is greater than its estimated recoverable amount (Note 1(i)). An item of property, plant and equipment is derecognised upon disposal or when no future economic benefits are expected to arise from the continued use of the asset. Any gain or loss arising on derecognition of the asset (calculated as the difference between the net disposal proceeds and the carrying amount of the item) is included in the Income Statement in the period the item is derecognised. (l) Leases Finance leases, which transfer to the Group substantially all the risks and benefits incidental to ownership of the leased item, are capitalised at the inception of the lease at the fair value of the leased asset or, if lower, at the present value of the minimum lease payments. Lease payments are apportioned between the finance charges and reduction of the lease liability so as to achieve a constant rate of interest on the remaining balance of the liability. Finance costs are charged to the Income Statement. Capitalised leased assets are depreciated over the shorter of the estimated useful life of the asset or the lease term if there is no reasonable certainty that the Group will obtain ownership at the end of the lease term. Leases in which substantially all the risks and rewards of ownership of the asset are not transferred to the Group as lessee are classified as operating leases. Operating lease payments are recognised as an expense in the Income Statement on a straight-line basis over the lease term (net of any incentives received from the lessor). (m) Intangible assets
(i) Goodwill Goodwill represents the excess of the cost of the business combination over the acquirer’s interest in the net fair value of identifiable assets and liabilities acquired at the date of acquisition. Following initial recognition, goodwill is measured at cost less any accumulated impairment losses. Goodwill acquired in business combinations is not amortised. Instead, goodwill is tested for impairment annually, or more frequently if events or changes in circumstances indicate that the carrying value may be impaired.
Sonic Healthcare Limited and controlled entities Notes to the Financial Statements (continued)
59
Note 1 Summary of significant accounting policies (continued)
(m) Intangible assets (continued)
(i) Goodwill (continued) Any goodwill acquired is allocated to each of the cash-generating units (“CGUs”) expected to benefit from the combination’s synergies. The goodwill allocated to the CGUs for the purpose of assessing impairment is identified according to business segment (pathology and imaging) and country of operation (Australia, New Zealand, UK, USA, Germany, Switzerland, Belgium and Ireland). Impairment is determined by assessing the recoverable amount of the cash-generating unit to which the goodwill relates. Where the recoverable amount of the cash-generating unit is less than the carrying amount, an impairment loss is recognised.
Gains and losses on the disposal of an entity include the carrying amount of goodwill relating to that entity. (ii) Intangible assets acquired from a business combination Intangible assets acquired from a business combination are capitalised at fair value as at the date of acquisition. Following initial recognition, the cost model is applied to the class of intangible assets.
The useful lives of these intangible assets are assessed to be either finite or indefinite.
Where amortisation is charged on assets with finite lives, this expense is taken to the Income Statement. Intangible assets are tested for impairment where an indicator of impairment exists, and in the case of indefinite life intangibles annually, either individually or at the cash generating unit level. Useful lives are also examined on an annual basis and adjustments, where applicable, are made on a prospective basis.
Included in intangibles is the value of certain brand names acquired as part of the purchase of certain laboratory businesses and controlled entities.
The brand names have been assessed as having an indefinite useful life after consideration of the following factors:
- the length of time during which the brand name has been in use, - the stability of the healthcare industry, - the market perception and recognition of the brands which have consistently facilitated the retention and growth of revenue
in both the local and national market places, - active promotion of the brands in the marketplace, - brand names are a registered legal trademark of the business. The registration of brands is renewable at minimal cost and
minimal difficulty.
(iii) Software development Expenditure on software development is capitalised when it is probable that the project will, after considering its commercial and technical feasibility, be completed and generate future economic benefits and the costs can be measured reliably. The expenditure capitalised comprises all directly attributable costs. Capitalised software development costs are recorded as finite life intangible assets and amortised from the point at which the asset is ready for use on a straight-line basis over its estimated useful life of 10 years. Capitalised development expenditure is stated at cost less accumulated amortisation. The carrying value is reviewed for impairment annually, or more frequently, if an indicator of impairment arises. The costs of acquiring computer software for internal use are capitalised as intangible non-current assets where the software is used to support significant business systems and the expenditure leads to the creation of an asset. The expected useful life is generally 3-10 years.
Gains or losses arising from the derecognition of an intangible asset are measured as the difference between the net disposal proceeds and the carrying amount of the asset and are recognised in the Income Statement when the asset is derecognised.
Intangible assets (other than software development costs) created within the business are not capitalised and expenditure is charged against profits in the period in which the expenditure is incurred.
(n) Trade and other payables These amounts represent liabilities for goods and services provided to the Group prior to the end of the financial year and which are unpaid. The amounts are unsecured and are usually paid within 30 days of recognition. Trade and other payables are presented as current liabilities unless payment is not due within 12 months from reporting date. They are recognised initially at their fair value and subsequently measured at amortised cost using the effective interest method.
Sonic Healthcare Limited and controlled entities Notes to the Financial Statements (continued)
60
Note 1 Summary of significant accounting policies (continued) (o) Interest bearing liabilities All loans and borrowings are initially recognised at fair value plus transaction costs, except where they are subsequently measured at fair value, in which case transaction costs are expensed as incurred. Thereafter interest bearing loans and borrowings are measured at amortised cost using the effective interest method except for liabilities at fair value which are held at fair value through profit or loss. Interest is accrued over the period it becomes due and is recorded as part of other creditors. Fees paid on the establishment of loan facilities measured at amortised cost are capitalised and amortised on a straight-line basis over the term of the facility. Borrowings are removed from the Balance Sheet when the obligation specified in the contract is discharged, cancelled or expired. The difference between the carrying amount of a financial liability that has been extinguished or transferred to another party and the consideration paid, including any non-cash assets transferred or liabilities assumed, is recognised in other income or other expenses. Borrowings are classified as current liabilities unless the Group has an unconditional right to defer settlement of the liability for at least 12 months after the balance sheet date. (p) Derivative financial instruments Derivatives are initially recognised at fair value on the date a derivative contract is entered into and are subsequently remeasured to their fair value at each reporting date. Changes in fair value are either taken to the Income Statement or an equity reserve (refer below). The method of recognising the resulting gain or loss depends on whether the derivative is designated as a hedging instrument, and if so, the nature of the item being hedged. The Group designates certain derivatives as either: - hedges of the fair value of recognised assets or liabilities or a firm commitment (fair value hedges); - hedges of the cash flows of recognised assets and liabilities and highly probable forecast transactions (cash flow hedges), or; - hedges of a net investment in a foreign operation (net investment hedges). The Group documents at the inception of the hedging transaction the relationship between hedging instruments and hedged items, as well as its risk management objective and strategy for undertaking various hedge transactions. The Group also documents its assessment, both at hedge inception and on an ongoing basis, of whether the derivatives that are used in hedging transactions have been and will continue to be highly effective in offsetting changes in fair values or cash flows of hedged items. The fair values of various derivative financial instruments used for hedging purposes are disclosed in Note 37. Movements in the hedging reserve in shareholders’ equity are shown in Note 26.
(i) Fair value hedge Changes in the fair value of derivatives that are designated and qualify as fair value hedges are recorded in the Income Statement, together with any changes in the fair value of the hedged asset or liability that are attributable to the hedged risk. The gain or loss relating to the effective portion of interest rate swaps hedging fixed rate borrowings is recognised in the Income Statement within borrowing costs expense, together with changes in the fair value of the hedged fixed rate borrowings attributable to interest rate risk. The gain or loss relating to the ineffective portion is recognised in the Income Statement within other income or other expenses. If the hedge no longer meets the criteria for hedge accounting, the adjustment to the carrying amount of a hedged item for which the effective interest method is used is amortised to profit or loss over the period to maturity using a recalculated effective interest rate. (ii) Cash flow hedge The effective portion of changes in the fair value of derivatives that are designated and qualify as cash flow hedges is recognised in other comprehensive income and accumulated in reserves in equity. The gain or loss relating to the ineffective portion is recognised immediately in the Income Statement within other income or other expenses.
Amounts accumulated in equity are recycled to the Income Statement in the periods when the hedged item will affect profit or loss. The gain or loss relating to the effective portion of interest rate swaps hedging variable rate borrowings is recognised in the Income Statement within borrowing costs expense.
Sonic Healthcare Limited and controlled entities Notes to the Financial Statements (continued)
61
Note 1 Summary of significant accounting policies (continued)
(p) Derivative financial instruments (continued)
(ii) Cash flow hedge (continued) When a hedging instrument expires or is sold or terminated, or when a hedge no longer meets the criteria for hedge accounting, any cumulative gain or loss existing in equity at that time remains in equity and is recognised when the forecast transaction is ultimately recognised in the Income Statement. When a forecast transaction is no longer expected to occur, the cumulative gain or loss that was reported in equity is immediately transferred to the Income Statement.
The fair value of the Group’s cash flow hedges are determined by external advisors using the present value of estimated future cash flows. (iii) Net investment hedges Hedges of net investments in foreign operations are accounted for similarly to cash flow hedges. Any gain or loss on the hedging instrument relating to the effective portion of the hedge is recognised in equity. The gain or loss relating to the ineffective portion of the hedge is recognised immediately in the Income Statement within other income or other expenses. Gains and losses accumulated in equity are included in the Income Statement when the foreign operation is partially disposed of or sold. (iv) Derivatives that do not qualify for hedge accounting For derivatives that do not qualify for hedge accounting, any gains or losses arising from changes in fair value are taken directly to the Income Statement and are included in other income or other expenses. (q) Employee benefits (i) Wages and salaries, annual leave Liabilities for wages and salaries and annual leave are recognised and are measured at the amounts expected to be paid when the liabilities are settled.
(ii) Long service leave The liability for long service leave expected to be settled within 12 months of the reporting date is recognised in the current provision for employee benefits and is measured in accordance with (i) above. The liability for long service leave expected to be settled more than 12 months from the reporting date is recognised in the non-current provision for employee benefits and measured as the present value of expected future payments to be made in respect of services provided by employees up to the reporting date. Consideration is given to expected future wage and salary levels, experience of employee departures and periods of service. Expected future payments are discounted using market yields at the reporting date on corporate bonds with terms to maturity that match, as closely as possible, the estimated future cash outflows. (iii) Retirement benefit obligations Certain employees of the Group are entitled to benefits from defined contribution superannuation plans on retirement, disability or death. The defined contribution plans receive fixed contributions from Group companies and the Group’s legal or constructive obligation is limited to these contributions. Contributions to the defined contribution plans are recognised as an expense as they become payable. Prepaid contributions are recognised as an asset to the extent that a cash refund or a reduction in the future payments is available. The Group also has defined benefit superannuation plans in relation to certain non-Australian employees, which provide defined lump sum benefits based on years of service and final average salary. A liability or asset in respect of defined benefit plans is recognised in the Balance Sheet, and is measured as the present value of the defined benefit obligation at the reporting date less the fair value of the superannuation fund’s assets at that date. The present value of the defined benefit obligation is based on expected future payments which arise from membership of the fund to the reporting date, calculated annually by independent actuaries using the projected unit credit method.
Sonic Healthcare Limited and controlled entities Notes to the Financial Statements (continued)
62
Note 1 Summary of significant accounting policies (continued)
(q) Employee benefits (continued)
(iii) Retirement benefit obligations (continued) Consideration is given to expected future wages and salary levels, experience of employee departures and periods of service. Expected future payments are discounted using market yields at the reporting date on national government bonds with terms to maturity and currency that match, as closely as possible, the estimated future cash outflows. In countries where there is a deep market in high quality corporate bonds, the market rates on those bonds are used rather than government bonds. Actuarial gains and losses arising from experience adjustments and changes in actuarial assumptions are recognised in the period in which they occur, outside profit or loss, directly in the Statement of Comprehensive Income. Past service costs are recognised immediately in the Income Statement. (iv) Profit sharing and bonus plans A liability for employee benefits in the form of profit sharing and bonus plans is recognised in other creditors when there is no realistic alternative but to settle the liability and at least one of the following conditions is met: - there are formal terms in the plan for determining the amount of the benefit, or - the amounts to be paid are determined before the time of completion of the Financial Report, or - past practice gives clear evidence of the amount of the obligation. Liabilities for profit sharing and bonus plans are expected to be settled within 12 months and are measured at the amounts expected to be paid when they are settled. (v) Employee benefit on-costs Employee benefit on-costs, including payroll tax, are recognised and included in employee benefit liabilities and costs when the employee benefits to which they relate are recognised as liabilities. (vi) Equity-based compensation benefits Equity-based compensation benefits are provided to employees under various plans. Information relating to these plans is set out in Note 33. The fair value of equity remuneration granted under the various employee plans is recognised as an expense with a corresponding increase in equity. The fair value is measured at grant date and recognised over the period during which the employees become unconditionally entitled to the shares and options (“the vesting period”). The fair value at grant date is determined using a pricing model consistent with the Black Scholes methodology that takes into account the exercise price, the term of the option, the impact of dilution, the non-tradeable nature of the option, the share price at grant date and expected price volatility of the underlying share, the expected dividend yield and the risk-free interest rate for the term of the arrangement. The fair value of the options and shares granted is adjusted to reflect market vesting conditions (using a Monte Carlo simulation) but excludes the impact of any non-market vesting conditions. Non-market vesting conditions are included in assumptions about the number of shares and options that are expected to vest. At each balance sheet date, the entity revises its estimate of the number of shares and options that are expected to vest. The employee benefit expense recognised each period takes into account the most recent estimate. No expense is recognised for shares and options that do not ultimately vest due to a failure to meet a non-market vesting condition. Upon the exercise of options, the balance of the share based payments reserve relating to those options is transferred to share capital. The dilutive effect, if any, of outstanding shares and options is reflected as additional share dilution in the calculation of diluted earnings per share.
Sonic Healthcare Limited and controlled entities Notes to the Financial Statements (continued)
63
Note 1 Summary of significant accounting policies (continued)
(q) Employee benefits (continued) (vi) Equity-based compensation benefits (continued) The Parent Company issues options to employees of subsidiary companies as part of the Group’s remuneration strategy. When options are exercised, the subsidiary company reimburses the Parent Company for the excess of the market price at the time of exercise over the exercise price. These amounts are credited to contributed equity in the Parent Company’s accounts, and eliminated on consolidation. (vii) Termination benefits Termination benefits are payable when employment is terminated before the normal retirement date, or when an employee accepts voluntary redundancy in exchange for these benefits. The Group recognises termination benefits when it is demonstrably committed to either terminating the employment of current employees according to a detailed formal plan without possibility of withdrawal or providing termination benefits as a result of an offer made to encourage voluntary redundancy. Benefits falling due more than 12 months after balance sheet date are discounted to present value. (r) Borrowing costs Borrowing costs include: - interest on bank overdrafts, short term and long term borrowings, including amounts paid or received on interest rate swaps, - amortisation of discounts or premiums relating to borrowings, - amortisation of ancillary costs incurred in connection with the arrangement of borrowings, and - finance lease charges. Borrowing costs are expensed as incurred unless they relate to qualifying assets. Qualifying assets are assets that necessarily take a substantial period of time to get ready for their intended use. In these circumstances, borrowing costs are capitalised to the cost of the assets using the weighted average interest rate applicable to the entity’s outstanding borrowings during the year. (s) Contributed equity Ordinary shares are classified as equity. Incremental costs directly attributable to the issue of new shares or options are shown in equity as a deduction, net of tax, from the proceeds. (t) Cash and cash equivalents Cash and cash equivalents includes cash at bank and in hand, and deposits at call with financial institutions which are readily convertible to known amounts of cash and which are subject to an insignificant risk of changes in value. For the purposes of the Cash Flow Statement, cash and cash equivalents consist of cash and cash equivalents as defined above, net of outstanding bank overdrafts. (u) Earnings per share (i) Basic earnings per share Basic earnings per share is calculated by dividing net profit after income tax attributable to members of the Parent Company by the weighted average number of ordinary shares on issue during the financial year excluding treasury shares. (ii) Diluted earnings per share Diluted earnings per share adjusts the figures used in the determination of basic earnings per share by taking into account the weighted average number of shares assumed to have been issued for no consideration in relation to dilutive potential ordinary shares.
Sonic Healthcare Limited and controlled entities Notes to the Financial Statements (continued)
64
Note 1 Summary of significant accounting policies (continued) (v) Segment information Operating segments are reported in a manner consistent with the internal reporting provided to the chief operating decision maker. The chief operating decision makers who are responsible for allocating resources and assessing performance of the operating segments have been identified as the Chief Executive Officer and the Board of Directors. Segment revenues, expenses and results include transfers between segments. Such transfers are priced on an “arms-length” basis and are eliminated on consolidation. (w) Dividends Provision is made for the amount of any dividend declared, determined or publicly recommended by the Directors on or before the end of a financial year but not distributed at balance date. (x) Repairs and maintenance Plant and equipment and premises occupied require repairs and maintenance from time to time in the course of operations. The costs associated with repairs and maintenance are charged as expenses as incurred, except where they relate to an improvement in the useful life of an asset, in which case the costs are capitalised and depreciated in accordance with Note 1(k). (y) Non-current assets (or disposal groups) held for sale Non-current assets (or disposal groups) are classified as held for sale and stated at the lower of their carrying amount and fair value less costs to sell if their carrying amount will be recovered principally through a sale transaction rather than through continuing use and a sale is considered highly probable. An impairment loss is recognised for any initial or subsequent write down of the asset (or disposal group) to fair value less costs to sell. A gain is recognised for any subsequent increases in fair value less costs to sell of an asset (or disposal group) but not in excess of any cumulative impairment loss previously recognised. A gain or loss not previously recognised by the date of the sale of the non-current asset (or disposal group) is recognised at the date of derecognition. Non-current assets (including those that are part of a disposal group) are not depreciated or amortised while they are classified as held for sale. (z) Provisions Provisions are recognised when the Group has a present legal, equitable or constructive obligation as a result of past transactions or other past events, it is probable that an outflow of resources will be required to settle the obligation, and the amount has been reliably estimated. Provisions are not recognised for future operating losses. When there are a number of similar obligations, the likelihood that an outflow will be required in settlement is determined by considering the class of obligations as a whole. A provision is recognised even if the likelihood of an outflow with respect to any one item included in the same class of obligations may be small. Provisions are measured at the present value of management’s best estimate of the expenditure required to settle the present obligation at the balance sheet date. The discount rate used to determine the present value reflects current market assessments of the time value of money and the risks specific to the liability. Any increase in the provision due to the passage of time is recognised as borrowing costs expense. Surplus leased space provisions are recognised where the Group has identified surplus lease space for premises under non-cancellable operating leases. Surplus leased space provisions are based on rental lease commitments and expected sublease income over the term of the lease and are amortised to the profit and loss on a straight line basis over the term of the lease. Restructuring provisions are recognised where the Group has completed a business combination where there is a detailed formal plan for the restructure, and a present obligation immediately prior to the business combination and its execution was not conditional upon it being acquired by the Group.
Sonic Healthcare Limited and controlled entities Notes to the Financial Statements (continued)
65
Note 1 Summary of significant accounting policies (continued) (aa) Goods and services tax (GST) Revenues, expenses and assets are recognised net of the amount of associated GST, unless the GST incurred is not recoverable from the taxation authority. In this case it is recognised as part of the cost of the acquisition of the asset or as part of the expense. Receivables and payables are stated inclusive of the amount of GST receivable or payable. The net amount of GST recoverable from, or payable to, the taxation authority is included within sundry debtors or sundry creditors in the Balance Sheet. Cash flows are presented on a gross basis. The GST components of cash flows arising from investing or financing activities which are recoverable from, or payable to the taxation authority, are presented as operating cash flow. (ab) Rounding of amounts The Company is of a kind referred to in ASIC Legislation Instrument 2016/191 issued by the Australian Securities & Investments Commission, relating to the “rounding off” of amounts in the Financial Report. Amounts in the Financial Report have been rounded off in accordance with that Instrument to the nearest thousand dollars, or in certain cases, to the nearest dollar. (ac) Significant accounting estimates and assumptions The preparation of financial statements requires the use of estimates and assumptions of future events to determine the carrying amounts of certain assets and liabilities. Key estimates and assumptions used in the preparation of the Financial Report are: Impairment of goodwill and intangibles with indefinite useful lives The Group determines whether goodwill and intangibles with indefinite useful lives are impaired at least on an annual basis. This requires an estimation of the recoverable amount of the cash-generating units to which the goodwill and intangibles with indefinite useful lives are allocated. The assumptions used in this estimation of recoverable amount and the carrying amount of goodwill and intangibles with indefinite useful lives are discussed in Note 13. Share based payment transactions The Group measures the cost of equity-settled share based payments at fair value at the grant date using a pricing model consistent with the Black Scholes methodology, taking into account the terms and conditions upon which the instruments were granted, as discussed in Note 33. Provisional accounting of business combinations The Group provisionally accounts for certain business combinations where the Group is in the process of ascertaining the fair values of the identifiable assets, liabilities and contingent liabilities acquired. In doing so, the Group has relied on the best estimate of the identifiable assets, liabilities and contingent liabilities as disclosed in Note 28, until the quantification and treatment of items under review is complete. Pension benefits The present value of the pension obligations depends on a number of factors that are determined on an actuarial basis using a number of assumptions. These assumptions used in determining the net cost (income) for pensions include the discount rate. Any changes in these assumptions will impact the carrying amount of pension obligations. The Group determines the appropriate discount rate at the end of each year. This is the interest rate that should be used to determine the present value of estimated future cash outflows expected to be required to settle the pension obligations. In determining the appropriate discount rate, the Group considers the interest rates of high quality corporate bonds that are denominated in the currency in which the benefits will be paid, and that have terms to maturity approximating the terms of the related pension liability. Market yields on government bonds are used in countries where there is no deep market in corporate bonds. Other key assumptions for pension obligations are based in part on current market conditions. Additional information is disclosed in Note 23.
Sonic Healthcare Limited and controlled entities Notes to the Financial Statements (continued)
66
Note 1 Summary of significant accounting policies (continued)
(ac) Significant accounting estimates and assumptions (continued) Income tax The Group is subject to income taxes in eight jurisdictions around the world. Significant judgement is required in determining the provision for income taxes on a worldwide basis. Where the final tax outcome is different from amounts provided, such differences will impact the current or deferred tax provisions in the period in which such outcome is obtained. Trade debtors Accounts receivable assessments require significant judgement in the USA due to contractual allowances, being discounts provided to certain payers against the Company’s patient fee schedules. Revenue is billed at the fee schedule rate, but is recognised net of estimated contractual discounts. Adjustments are then made to revenue based on final payments received. Management diligently reviews allowances to ensure that the recoverable amount of debtors is materially accurate. (ad) New accounting standards and interpretations Certain new accounting standards and interpretations have been published that are not applicable for the Group for the financial year ended 30 June 2017. The Group has elected not to early adopt these new standards and interpretations. An assessment of the future impact of the new standards and interpretations is set out below. (i) AASB 9 Financial Instruments AASB 9 Financial Instruments addresses the classification and measurement of financial assets and liabilities. The standard is applicable from 1 January 2018. The Group has commenced its assessment of the new standard’s full impact, however, initial indications are that it would not materially alter the carrying value of the Group’s financial assets and liabilities. (ii) AASB 15 Revenue from Contracts with Customers AASB has issued a new standard for the recognition of revenue, applicable from 1 January 2018. This will replace AASB 118 Revenue. The new standard is based on the principle that revenue is recognised when control of a good or service transfer to a customer. The Group has commenced its assessment of the impact of the new standard but does not believe it would materially alter the revenue recognised by the Group. (iii) AASB 16 Leases AASB 16 Leases will primarily impact the accounting by lessees and will result in the recognition of almost all leases on the balance sheet. The standard removes the distinction between operating and financing leases and requires recognition of a ‘right-to-use’ asset and a financial liability to pay rentals for almost all lease contracts. The Group has commenced its assessment of the impact and it is likely that the Group’s assets and liabilities will be significantly impacted. The standard is applicable from 1 January 2019. (ae) Changes in accounting policies There were no material impacts on the financial statements of the Group as a consequence of new standards effective 1 July 2016. (af) Parent Company financial information The financial information for the Parent Company, Sonic Healthcare Limited, disclosed in Note 38 has been prepared on the same basis as the consolidated financial statements, except as set out below. (i) Investments in subsidiaries Investments in subsidiaries are accounted for at cost in the financial statements of Sonic Healthcare Limited. (ii) Tax consolidation legislation Sonic Healthcare Limited and its wholly-owned Australian controlled entities implemented the tax consolidation legislation with effect from 30 June 2004, and have notified the Australian Taxation Office of this event. The head entity, Sonic Healthcare Limited, and the controlled entities in the tax consolidated group account for their own deferred tax amounts. These tax amounts are measured as if each entity in the tax consolidated group continues to be a stand alone tax payer in its own right. In addition to its own current and deferred tax amounts Sonic Healthcare Limited, as the head entity in the tax consolidated group, also recognises the current tax liabilities (or assets) assumed from the controlled entities in the tax consolidated group. Under tax sharing and funding agreements amounts receivable or payable between the tax consolidated entities are recognised within current amounts receivable/payable to controlled entities. The entities have also entered into a tax funding agreement under which the wholly-owned entities fully compensate Sonic Healthcare Limited for any current tax payable assumed and are compensated by Sonic Healthcare Limited for any current tax receivable transferred under the tax consolidation legislation. The funding amounts are determined by reference to the amounts recognised in the wholly-owned entities’ financial statements.
Sonic Healthcare Limited and controlled entities Notes to the Financial Statements (continued)
67
Note 1 Summary of significant accounting policies (continued) (af) Parent Company financial information (continued) (iii) Share based payments The grant by the Parent Company of options over its equity instruments to the employees of subsidiary undertakings in the Group is treated as a capital contribution to that subsidiary undertaking. The fair value of employee services received, measured by reference to the grant date fair value, is recognised over the vesting period as an increase to investment in subsidiary undertakings, with a corresponding credit to equity. (iv) Investment property Investment property for the Parent Company comprises freehold office/laboratory buildings held for long term rental, mainly to certain subsidiaries. Investment property is carried at fair value, which is based on Directors’ valuations using active market prices, adjusted, if necessary, for any difference in the nature, location or condition of the specific asset. If this information is not available, the Group uses alternative valuation methods such as recent prices in less active markets or discounted cash flow projections. Changes in fair values are recorded in the Income Statement as part of other income.
Note 2 Segment information Business segments The Group’s Chief Executive Officer and the Board of Directors (the chief operating decision makers) review the Group’s performance both by the nature of services provided and geographic region. Discrete financial information about each operating segment is reported to the Chief Executive Officer and the Board of Directors on at least a monthly basis and is used to assess performance and determine the allocation of resources. The Group has the following reportable segments. (i) Laboratory Pathology/clinical laboratory services provided in Australia, New Zealand, the United Kingdom, the United States of America, Germany, Switzerland, Belgium and Ireland. The geographic regions have been aggregated into one reportable segment as they provide similar services and have similar expected growth rates, cost structures, risks, and return profiles. (ii) Imaging Diagnostic imaging services provided in Australia. (iii) Other Includes corporate office functions, medical centre operations (IPN), occupational health services (Sonic HealthPlus), laboratory automation development (GLP Systems), and other minor operations. The internal reports use a “Constant Currency” basis for reporting revenue and EBITA with foreign currency elements restated using the relevant prior period average exchange rates. The segment revenue and EBITA have therefore been presented using Constant Currency.
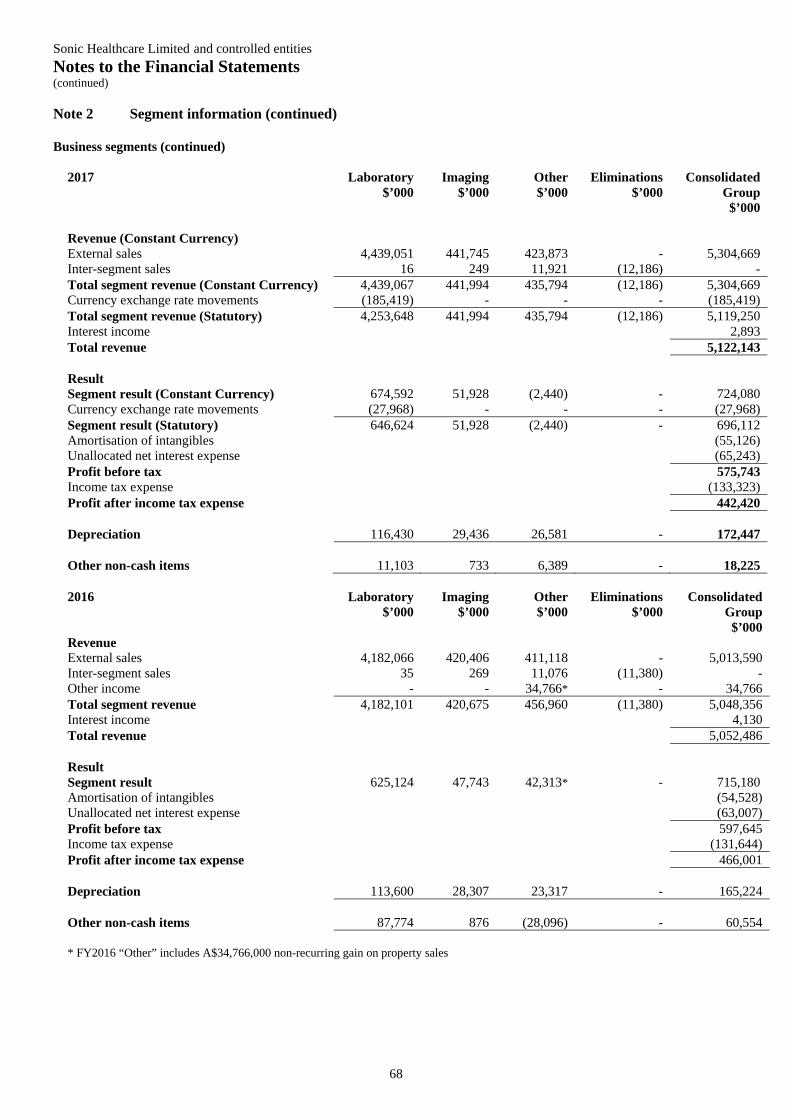
Sonic Healthcare Limited and controlled entities Notes to the Financial Statements (continued)
68
Note 2 Segment information (continued) Business segments (continued)
2017 Laboratory $’000
Imaging $’000
Other $’000
Eliminations $’000
Consolidated Group $’000
Revenue (Constant Currency) External sales 4,439,051 441,745 423,873 - 5,304,669 Inter-segment sales 16 249 11,921 (12,186) - Total segment revenue (Constant Currency) 4,439,067 441,994 435,794 (12,186) 5,304,669 Currency exchange rate movements (185,419) - - - (185,419) Total segment revenue (Statutory) 4,253,648 441,994 435,794 (12,186) 5,119,250 Interest income 2,893 Total revenue 5,122,143 Result Segment result (Constant Currency) 674,592 51,928 (2,440) - 724,080 Currency exchange rate movements (27,968) - - - (27,968) Segment result (Statutory) 646,624 51,928 (2,440) - 696,112 Amortisation of intangibles (55,126) Unallocated net interest expense (65,243) Profit before tax 575,743 Income tax expense (133,323) Profit after income tax expense 442,420 Depreciation 116,430 29,436 26,581 - 172,447 Other non-cash items 11,103 733 6,389 - 18,225
2016 Laboratory
$’000 Imaging
$’000 Other $’000
Eliminations $’000
Consolidated Group $’000
Revenue External sales 4,182,066 420,406 411,118 - 5,013,590 Inter-segment sales 35 269 11,076 (11,380) - Other income - - 34,766* - 34,766 Total segment revenue 4,182,101 420,675 456,960 (11,380) 5,048,356 Interest income 4,130 Total revenue 5,052,486 Result Segment result 625,124 47,743 42,313* - 715,180 Amortisation of intangibles (54,528) Unallocated net interest expense (63,007) Profit before tax 597,645 Income tax expense (131,644) Profit after income tax expense 466,001 Depreciation 113,600 28,307 23,317 - 165,224 Other non-cash items 87,774 876 (28,096) - 60,554 * FY2016 “Other” includes A$34,766,000 non-recurring gain on property sales
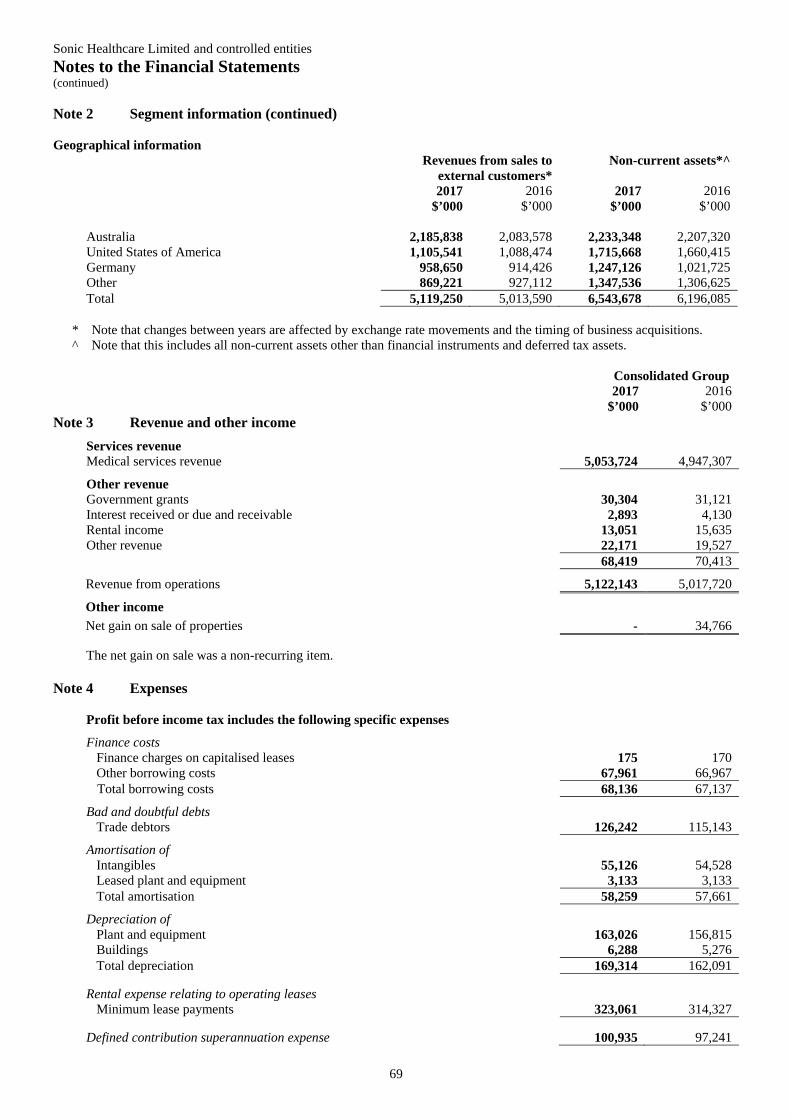
Sonic Healthcare Limited and controlled entities Notes to the Financial Statements (continued)
69
Note 2 Segment information (continued) Geographical information
Revenues from sales to external customers*
Non-current assets*^
2017 $’000
2016 $’000
2017 $’000
2016 $’000
Australia 2,185,838 2,083,578 2,233,348 2,207,320 United States of America 1,105,541 1,088,474 1,715,668 1,660,415 Germany 958,650 914,426 1,247,126 1,021,725 Other 869,221 927,112 1,347,536 1,306,625 Total 5,119,250 5,013,590 6,543,678 6,196,085
* Note that changes between years are affected by exchange rate movements and the timing of business acquisitions. ^ Note that this includes all non-current assets other than financial instruments and deferred tax assets.
Consolidated Group 2017
$’000 2016
$’000 Note 3 Revenue and other income
Services revenue Medical services revenue 5,053,724 4,947,307
Other revenue Government grants 30,304 31,121 Interest received or due and receivable 2,893 4,130 Rental income 13,051 15,635 Other revenue 22,171 19,527 68,419 70,413
Revenue from operations 5,122,143 5,017,720
Other income
Net gain on sale of properties - 34,766
The net gain on sale was a non-recurring item.
Note 4 Expenses
Profit before income tax includes the following specific expenses
Finance costs Finance charges on capitalised leases 175 170 Other borrowing costs 67,961 66,967 Total borrowing costs 68,136 67,137
Bad and doubtful debts Trade debtors 126,242 115,143
Amortisation of Intangibles 55,126 54,528 Leased plant and equipment 3,133 3,133 Total amortisation 58,259 57,661
Depreciation of Plant and equipment 163,026 156,815 Buildings 6,288 5,276
Total depreciation 169,314 162,091
Rental expense relating to operating leases Minimum lease payments 323,061 314,327
Defined contribution superannuation expense 100,935 97,241
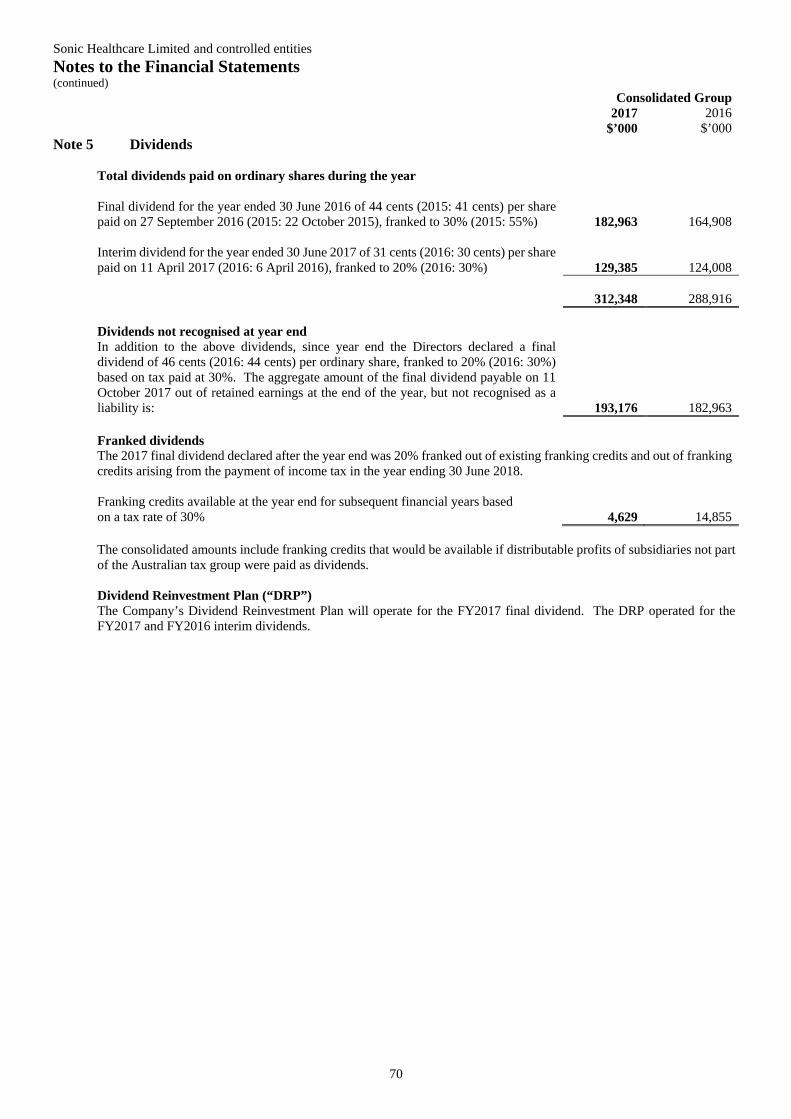
Sonic Healthcare Limited and controlled entities Notes to the Financial Statements (continued)
70
Consolidated Group 2017
$’000 2016
$’000 Note 5 Dividends
Total dividends paid on ordinary shares during the year
Final dividend for the year ended 30 June 2016 of 44 cents (2015: 41 cents) per share paid on 27 September 2016 (2015: 22 October 2015), franked to 30% (2015: 55%) 182,963 164,908 Interim dividend for the year ended 30 June 2017 of 31 cents (2016: 30 cents) per share paid on 11 April 2017 (2016: 6 April 2016), franked to 20% (2016: 30%) 129,385 124,008 312,348 288,916 Dividends not recognised at year end In addition to the above dividends, since year end the Directors declared a final dividend of 46 cents (2016: 44 cents) per ordinary share, franked to 20% (2016: 30%) based on tax paid at 30%. The aggregate amount of the final dividend payable on 11 October 2017 out of retained earnings at the end of the year, but not recognised as a liability is: 193,176 182,963 Franked dividends The 2017 final dividend declared after the year end was 20% franked out of existing franking credits and out of franking credits arising from the payment of income tax in the year ending 30 June 2018. Franking credits available at the year end for subsequent financial years based on a tax rate of 30%
4,629
14,855
The consolidated amounts include franking credits that would be available if distributable profits of subsidiaries not part of the Australian tax group were paid as dividends. Dividend Reinvestment Plan (“DRP”) The Company’s Dividend Reinvestment Plan will operate for the FY2017 final dividend. The DRP operated for the FY2017 and FY2016 interim dividends.
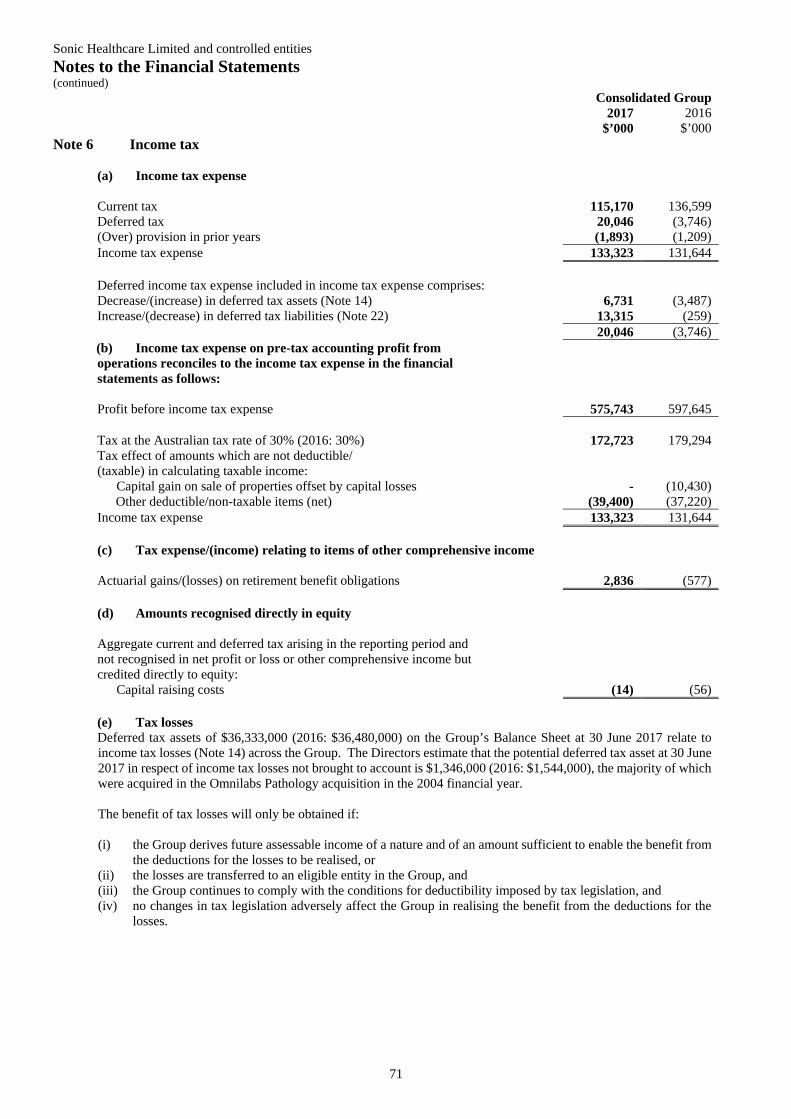
Sonic Healthcare Limited and controlled entities Notes to the Financial Statements (continued)
71
Consolidated Group 2017
$’000 2016
$’000 Note 6 Income tax
(a) Income tax expense Current tax 115,170 136,599 Deferred tax 20,046 (3,746) (Over) provision in prior years (1,893) (1,209) Income tax expense 133,323 131,644 Deferred income tax expense included in income tax expense comprises: Decrease/(increase) in deferred tax assets (Note 14) 6,731 (3,487) Increase/(decrease) in deferred tax liabilities (Note 22) 13,315 (259)
20,046 (3,746) (b) Income tax expense on pre-tax accounting profit from operations reconciles to the income tax expense in the financial statements as follows:
Profit before income tax expense 575,743 597,645 Tax at the Australian tax rate of 30% (2016: 30%) 172,723 179,294 Tax effect of amounts which are not deductible/ (taxable) in calculating taxable income: Capital gain on sale of properties offset by capital losses - (10,430)
Other deductible/non-taxable items (net) (39,400) (37,220) Income tax expense 133,323 131,644 (c) Tax expense/(income) relating to items of other comprehensive income Actuarial gains/(losses) on retirement benefit obligations 2,836 (577) (d) Amounts recognised directly in equity Aggregate current and deferred tax arising in the reporting period and not recognised in net profit or loss or other comprehensive income but credited directly to equity: Capital raising costs (14) (56) (e) Tax losses Deferred tax assets of $36,333,000 (2016: $36,480,000) on the Group’s Balance Sheet at 30 June 2017 relate to income tax losses (Note 14) across the Group. The Directors estimate that the potential deferred tax asset at 30 June 2017 in respect of income tax losses not brought to account is $1,346,000 (2016: $1,544,000), the majority of which were acquired in the Omnilabs Pathology acquisition in the 2004 financial year. The benefit of tax losses will only be obtained if: (i) the Group derives future assessable income of a nature and of an amount sufficient to enable the benefit from
the deductions for the losses to be realised, or (ii) the losses are transferred to an eligible entity in the Group, and (iii) the Group continues to comply with the conditions for deductibility imposed by tax legislation, and (iv) no changes in tax legislation adversely affect the Group in realising the benefit from the deductions for the
losses.
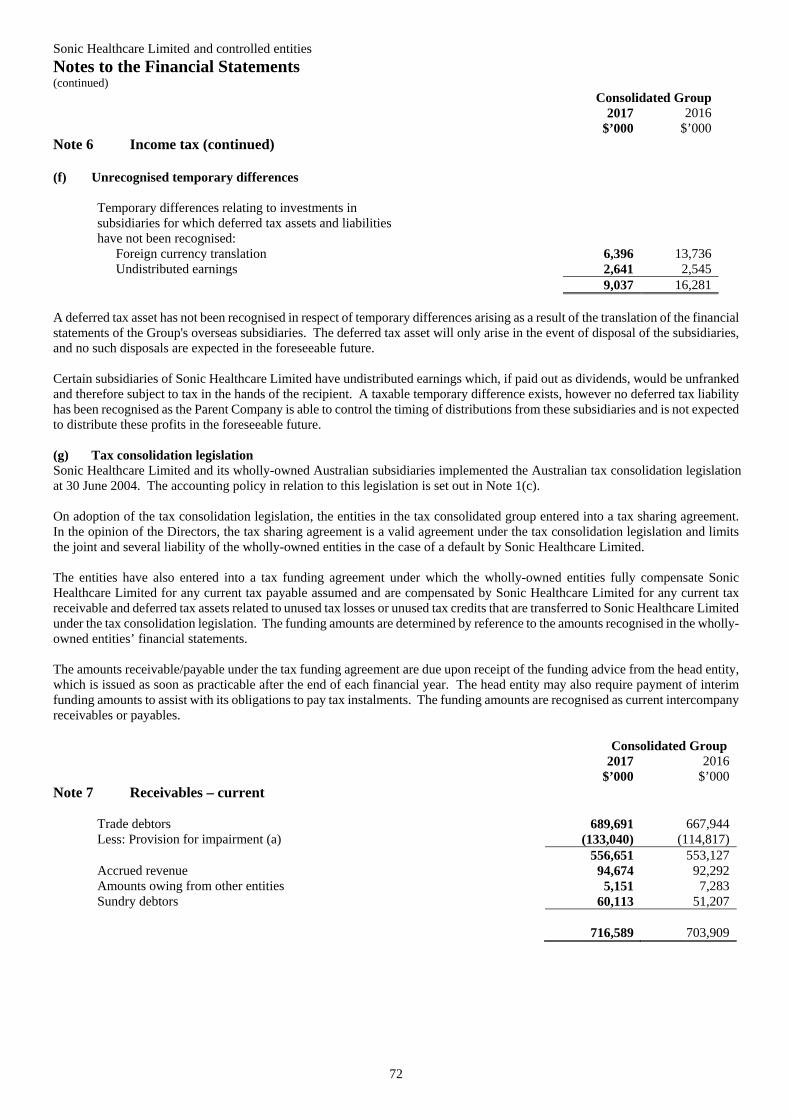
Sonic Healthcare Limited and controlled entities Notes to the Financial Statements (continued)
72
Consolidated Group 2017
$’000 2016
$’000 Note 6 Income tax (continued) (f) Unrecognised temporary differences
Temporary differences relating to investments in subsidiaries for which deferred tax assets and liabilities have not been recognised:
Foreign currency translation 6,396 13,736 Undistributed earnings 2,641 2,545
9,037 16,281
A deferred tax asset has not been recognised in respect of temporary differences arising as a result of the translation of the financial statements of the Group's overseas subsidiaries. The deferred tax asset will only arise in the event of disposal of the subsidiaries, and no such disposals are expected in the foreseeable future. Certain subsidiaries of Sonic Healthcare Limited have undistributed earnings which, if paid out as dividends, would be unfranked and therefore subject to tax in the hands of the recipient. A taxable temporary difference exists, however no deferred tax liability has been recognised as the Parent Company is able to control the timing of distributions from these subsidiaries and is not expected to distribute these profits in the foreseeable future. (g) Tax consolidation legislation Sonic Healthcare Limited and its wholly-owned Australian subsidiaries implemented the Australian tax consolidation legislation at 30 June 2004. The accounting policy in relation to this legislation is set out in Note 1(c). On adoption of the tax consolidation legislation, the entities in the tax consolidated group entered into a tax sharing agreement. In the opinion of the Directors, the tax sharing agreement is a valid agreement under the tax consolidation legislation and limits the joint and several liability of the wholly-owned entities in the case of a default by Sonic Healthcare Limited. The entities have also entered into a tax funding agreement under which the wholly-owned entities fully compensate Sonic Healthcare Limited for any current tax payable assumed and are compensated by Sonic Healthcare Limited for any current tax receivable and deferred tax assets related to unused tax losses or unused tax credits that are transferred to Sonic Healthcare Limited under the tax consolidation legislation. The funding amounts are determined by reference to the amounts recognised in the wholly-owned entities’ financial statements. The amounts receivable/payable under the tax funding agreement are due upon receipt of the funding advice from the head entity, which is issued as soon as practicable after the end of each financial year. The head entity may also require payment of interim funding amounts to assist with its obligations to pay tax instalments. The funding amounts are recognised as current intercompany receivables or payables.
Consolidated Group
2017 $’000
2016 $’000
Note 7 Receivables – current
Trade debtors 689,691 667,944 Less: Provision for impairment (a) (133,040) (114,817)
556,651 553,127 Accrued revenue 94,674 92,292 Amounts owing from other entities 5,151 7,283 Sundry debtors 60,113 51,207
716,589 703,909
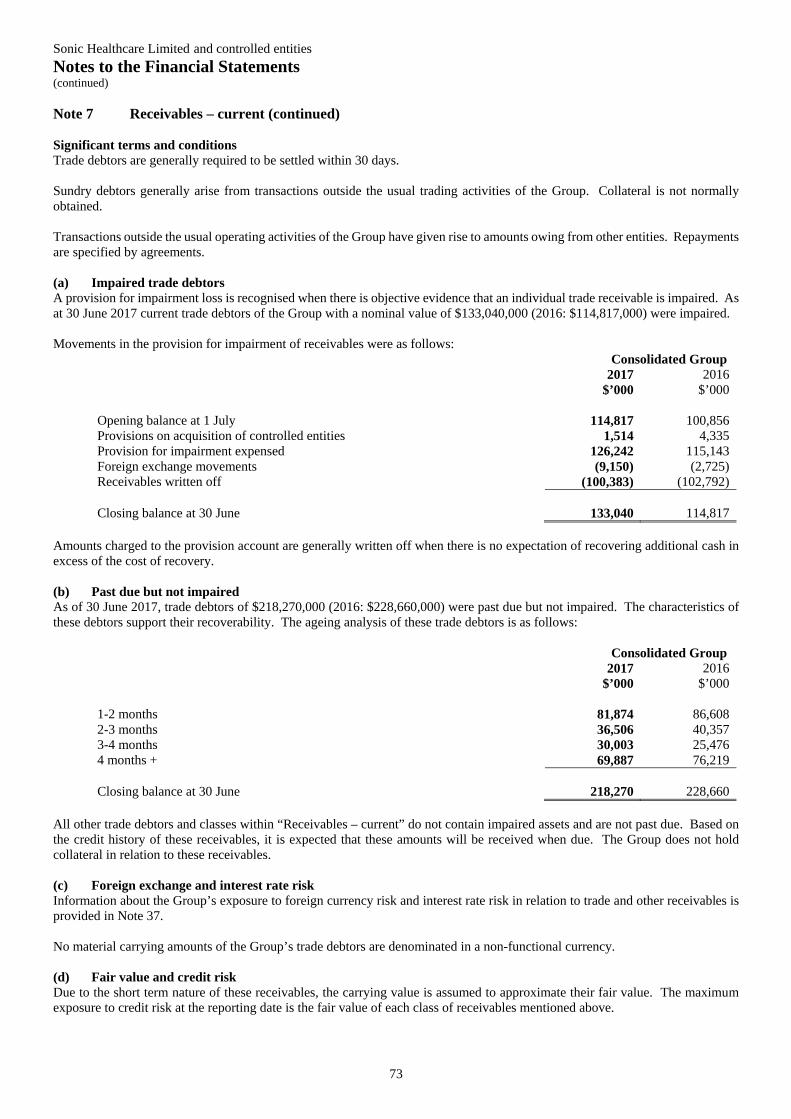
Sonic Healthcare Limited and controlled entities Notes to the Financial Statements (continued)
73
Note 7 Receivables – current (continued)
Significant terms and conditions Trade debtors are generally required to be settled within 30 days. Sundry debtors generally arise from transactions outside the usual trading activities of the Group. Collateral is not normally obtained. Transactions outside the usual operating activities of the Group have given rise to amounts owing from other entities. Repayments are specified by agreements.
(a) Impaired trade debtors A provision for impairment loss is recognised when there is objective evidence that an individual trade receivable is impaired. As at 30 June 2017 current trade debtors of the Group with a nominal value of $133,040,000 (2016: $114,817,000) were impaired. Movements in the provision for impairment of receivables were as follows:
Consolidated Group 2017
$’000 2016
$’000
Opening balance at 1 July 114,817 100,856 Provisions on acquisition of controlled entities 1,514 4,335 Provision for impairment expensed 126,242 115,143 Foreign exchange movements (9,150) (2,725) Receivables written off (100,383) (102,792)
Closing balance at 30 June 133,040 114,817
Amounts charged to the provision account are generally written off when there is no expectation of recovering additional cash in excess of the cost of recovery. (b) Past due but not impaired As of 30 June 2017, trade debtors of $218,270,000 (2016: $228,660,000) were past due but not impaired. The characteristics of these debtors support their recoverability. The ageing analysis of these trade debtors is as follows:
Consolidated Group
2017 $’000
2016 $’000
1-2 months 81,874 86,608 2-3 months 36,506 40,357 3-4 months 30,003 25,476 4 months + 69,887 76,219
Closing balance at 30 June 218,270 228,660
All other trade debtors and classes within “Receivables – current” do not contain impaired assets and are not past due. Based on the credit history of these receivables, it is expected that these amounts will be received when due. The Group does not hold collateral in relation to these receivables. (c) Foreign exchange and interest rate risk Information about the Group’s exposure to foreign currency risk and interest rate risk in relation to trade and other receivables is provided in Note 37. No material carrying amounts of the Group’s trade debtors are denominated in a non-functional currency. (d) Fair value and credit risk Due to the short term nature of these receivables, the carrying value is assumed to approximate their fair value. The maximum exposure to credit risk at the reporting date is the fair value of each class of receivables mentioned above.
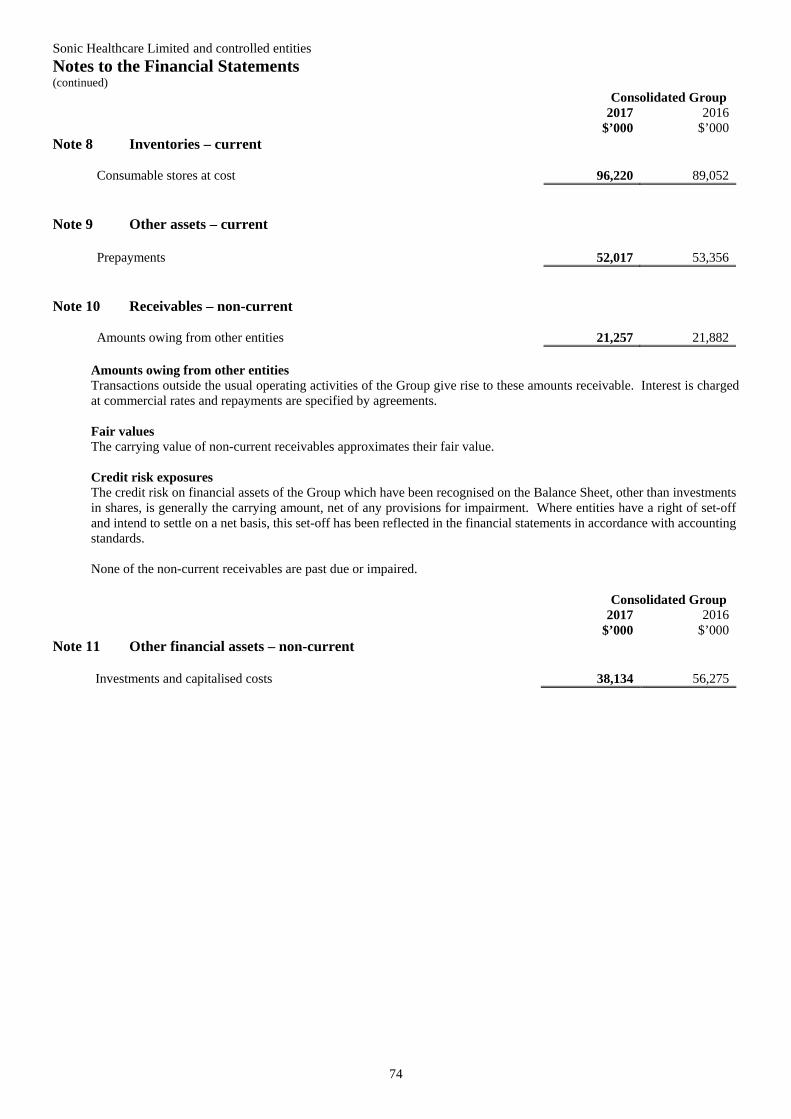
Sonic Healthcare Limited and controlled entities Notes to the Financial Statements (continued)
74
Consolidated Group 2017
$’000 2016
$’000 Note 8 Inventories – current
Consumable stores at cost 96,220 89,052
Note 9 Other assets – current
Prepayments 52,017 53,356
Note 10 Receivables – non-current
Amounts owing from other entities 21,257 21,882
Amounts owing from other entities Transactions outside the usual operating activities of the Group give rise to these amounts receivable. Interest is charged at commercial rates and repayments are specified by agreements. Fair values The carrying value of non-current receivables approximates their fair value. Credit risk exposures The credit risk on financial assets of the Group which have been recognised on the Balance Sheet, other than investments in shares, is generally the carrying amount, net of any provisions for impairment. Where entities have a right of set-off and intend to settle on a net basis, this set-off has been reflected in the financial statements in accordance with accounting standards. None of the non-current receivables are past due or impaired.
Consolidated Group 2017
$’000 2016
$’000 Note 11 Other financial assets – non-current
Investments and capitalised costs 38,134 56,275
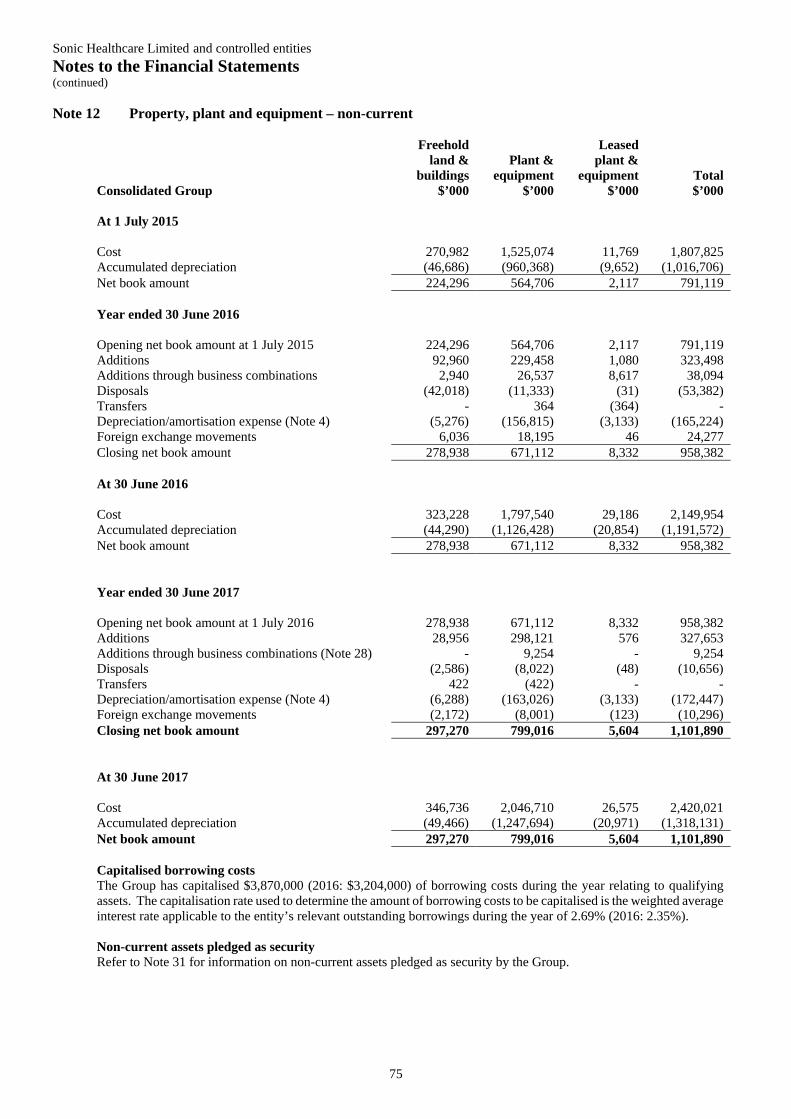
Sonic Healthcare Limited and controlled entities Notes to the Financial Statements (continued)
75
Note 12 Property, plant and equipment – non-current
Freehold land &
buildings
Plant &
equipment
Leased plant &
equipment
Total Consolidated Group $’000 $’000 $’000 $’000 At 1 July 2015
Cost 270,982 1,525,074 11,769 1,807,825 Accumulated depreciation (46,686) (960,368) (9,652) (1,016,706) Net book amount 224,296 564,706 2,117 791,119 Year ended 30 June 2016
Opening net book amount at 1 July 2015 224,296 564,706 2,117 791,119 Additions 92,960 229,458 1,080 323,498 Additions through business combinations 2,940 26,537 8,617 38,094 Disposals (42,018) (11,333) (31) (53,382) Transfers - 364 (364) - Depreciation/amortisation expense (Note 4) (5,276) (156,815) (3,133) (165,224) Foreign exchange movements 6,036 18,195 46 24,277 Closing net book amount 278,938 671,112 8,332 958,382 At 30 June 2016 Cost 323,228 1,797,540 29,186 2,149,954 Accumulated depreciation (44,290) (1,126,428) (20,854) (1,191,572) Net book amount 278,938 671,112 8,332 958,382 Year ended 30 June 2017
Opening net book amount at 1 July 2016 278,938 671,112 8,332 958,382 Additions 28,956 298,121 576 327,653 Additions through business combinations (Note 28) - 9,254 - 9,254 Disposals (2,586) (8,022) (48) (10,656) Transfers 422 (422) - - Depreciation/amortisation expense (Note 4) (6,288) (163,026) (3,133) (172,447) Foreign exchange movements (2,172) (8,001) (123) (10,296) Closing net book amount 297,270 799,016 5,604 1,101,890 At 30 June 2017 Cost 346,736 2,046,710 26,575 2,420,021 Accumulated depreciation (49,466) (1,247,694) (20,971) (1,318,131) Net book amount 297,270 799,016 5,604 1,101,890 Capitalised borrowing costs The Group has capitalised $3,870,000 (2016: $3,204,000) of borrowing costs during the year relating to qualifying assets. The capitalisation rate used to determine the amount of borrowing costs to be capitalised is the weighted average interest rate applicable to the entity’s relevant outstanding borrowings during the year of 2.69% (2016: 2.35%). Non-current assets pledged as security Refer to Note 31 for information on non-current assets pledged as security by the Group.
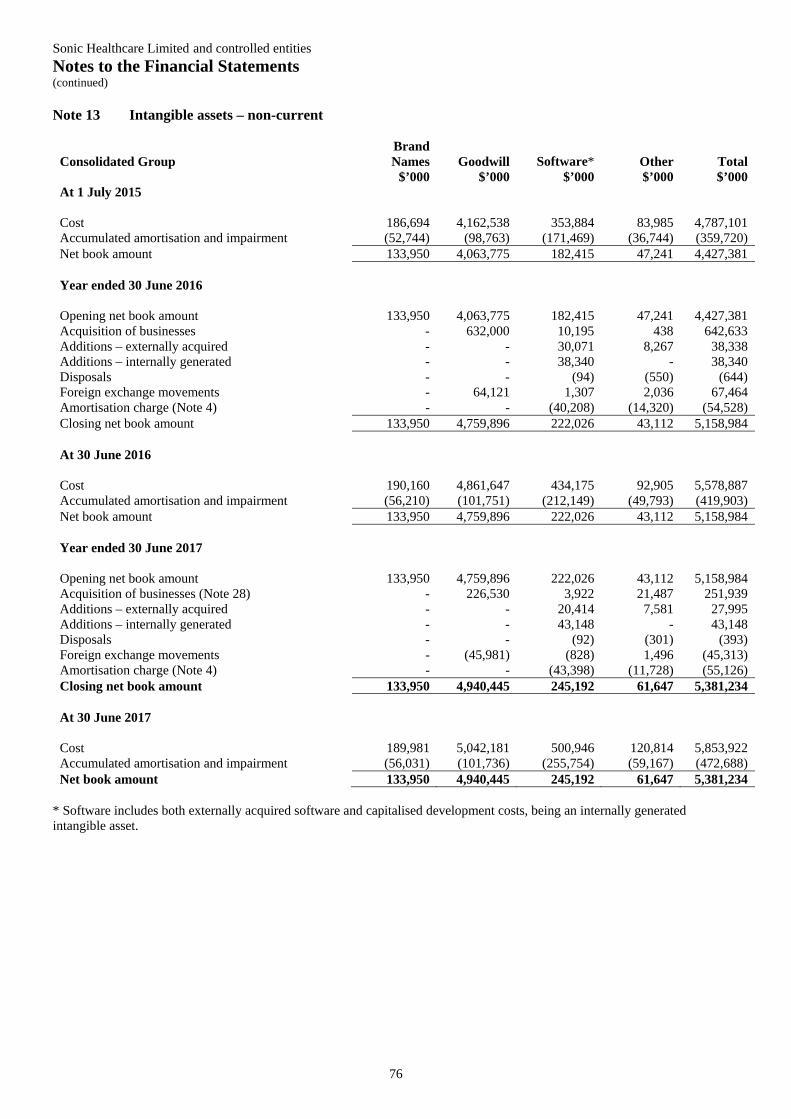
Sonic Healthcare Limited and controlled entities Notes to the Financial Statements (continued)
76
Note 13 Intangible assets – non-current
Consolidated Group Brand Names
$’000
Goodwill
$’000
Software*
$’000
Other $’000
Total $’000
At 1 July 2015
Cost 186,694 4,162,538 353,884 83,985 4,787,101 Accumulated amortisation and impairment (52,744) (98,763) (171,469) (36,744) (359,720) Net book amount 133,950 4,063,775 182,415 47,241 4,427,381 Year ended 30 June 2016
Opening net book amount 133,950 4,063,775 182,415 47,241 4,427,381 Acquisition of businesses - 632,000 10,195 438 642,633 Additions – externally acquired - - 30,071 8,267 38,338 Additions – internally generated - - 38,340 - 38,340 Disposals - - (94) (550) (644) Foreign exchange movements - 64,121 1,307 2,036 67,464 Amortisation charge (Note 4) - - (40,208) (14,320) (54,528) Closing net book amount 133,950 4,759,896 222,026 43,112 5,158,984 At 30 June 2016
Cost 190,160 4,861,647 434,175 92,905 5,578,887 Accumulated amortisation and impairment (56,210) (101,751) (212,149) (49,793) (419,903) Net book amount 133,950 4,759,896 222,026 43,112 5,158,984 Year ended 30 June 2017
Opening net book amount 133,950 4,759,896 222,026 43,112 5,158,984 Acquisition of businesses (Note 28) - 226,530 3,922 21,487 251,939 Additions – externally acquired - - 20,414 7,581 27,995 Additions – internally generated - - 43,148 - 43,148 Disposals - - (92) (301) (393) Foreign exchange movements - (45,981) (828) 1,496 (45,313) Amortisation charge (Note 4) - - (43,398) (11,728) (55,126) Closing net book amount 133,950 4,940,445 245,192 61,647 5,381,234 At 30 June 2017
Cost 189,981 5,042,181 500,946 120,814 5,853,922 Accumulated amortisation and impairment (56,031) (101,736) (255,754) (59,167) (472,688) Net book amount 133,950 4,940,445 245,192 61,647 5,381,234
* Software includes both externally acquired software and capitalised development costs, being an internally generated intangible asset.
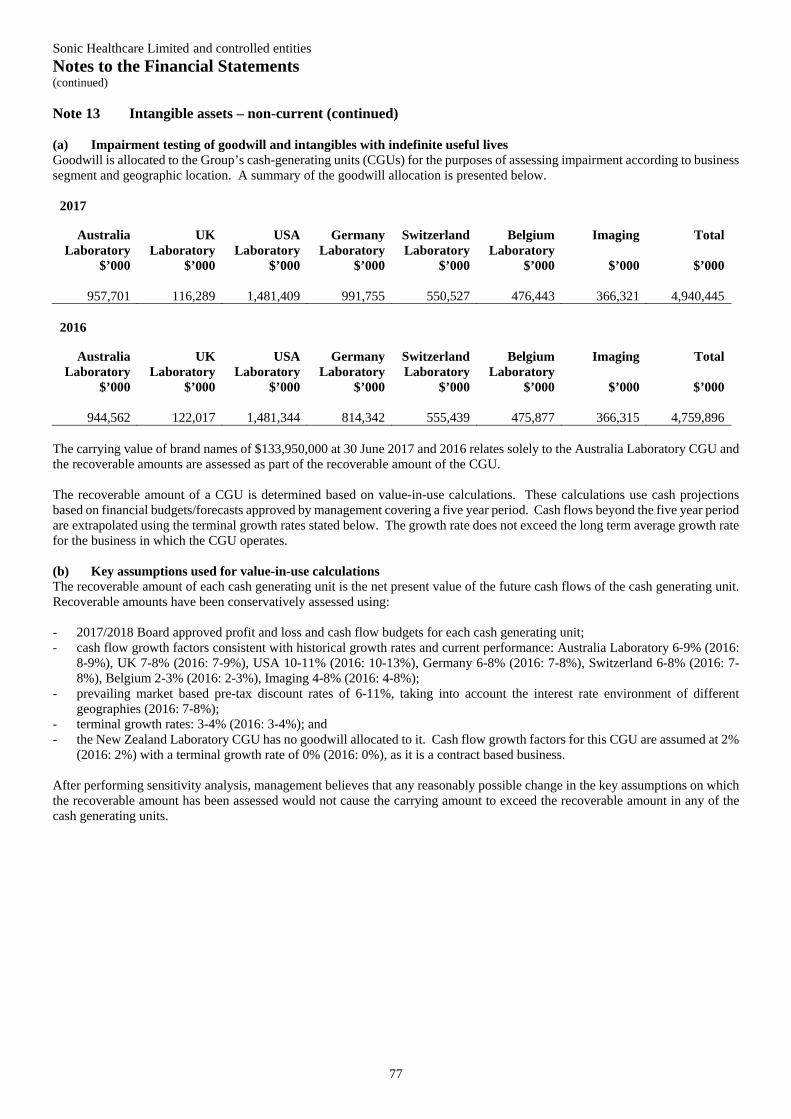
Sonic Healthcare Limited and controlled entities Notes to the Financial Statements (continued)
77
Note 13 Intangible assets – non-current (continued) (a) Impairment testing of goodwill and intangibles with indefinite useful lives Goodwill is allocated to the Group’s cash-generating units (CGUs) for the purposes of assessing impairment according to business segment and geographic location. A summary of the goodwill allocation is presented below.
2017
Australia Laboratory
$’000
UK Laboratory
$’000
USA Laboratory
$’000
Germany Laboratory
$’000
Switzerland Laboratory
$’000
Belgium Laboratory
$’000
Imaging
$’000
Total
$’000
957,701 116,289 1,481,409 991,755 550,527 476,443 366,321 4,940,445
2016
Australia Laboratory
$’000
UK Laboratory
$’000
USA Laboratory
$’000
Germany Laboratory
$’000
Switzerland Laboratory
$’000
Belgium Laboratory
$’000
Imaging
$’000
Total
$’000
944,562 122,017 1,481,344 814,342 555,439 475,877 366,315 4,759,896 The carrying value of brand names of $133,950,000 at 30 June 2017 and 2016 relates solely to the Australia Laboratory CGU and the recoverable amounts are assessed as part of the recoverable amount of the CGU. The recoverable amount of a CGU is determined based on value-in-use calculations. These calculations use cash projections based on financial budgets/forecasts approved by management covering a five year period. Cash flows beyond the five year period are extrapolated using the terminal growth rates stated below. The growth rate does not exceed the long term average growth rate for the business in which the CGU operates.
(b) Key assumptions used for value-in-use calculations The recoverable amount of each cash generating unit is the net present value of the future cash flows of the cash generating unit. Recoverable amounts have been conservatively assessed using: - 2017/2018 Board approved profit and loss and cash flow budgets for each cash generating unit; - cash flow growth factors consistent with historical growth rates and current performance: Australia Laboratory 6-9% (2016:
8-9%), UK 7-8% (2016: 7-9%), USA 10-11% (2016: 10-13%), Germany 6-8% (2016: 7-8%), Switzerland 6-8% (2016: 7-8%), Belgium 2-3% (2016: 2-3%), Imaging 4-8% (2016: 4-8%);
- prevailing market based pre-tax discount rates of 6-11%, taking into account the interest rate environment of different geographies (2016: 7-8%);
- terminal growth rates: 3-4% (2016: 3-4%); and - the New Zealand Laboratory CGU has no goodwill allocated to it. Cash flow growth factors for this CGU are assumed at 2%
(2016: 2%) with a terminal growth rate of 0% (2016: 0%), as it is a contract based business. After performing sensitivity analysis, management believes that any reasonably possible change in the key assumptions on which the recoverable amount has been assessed would not cause the carrying amount to exceed the recoverable amount in any of the cash generating units.
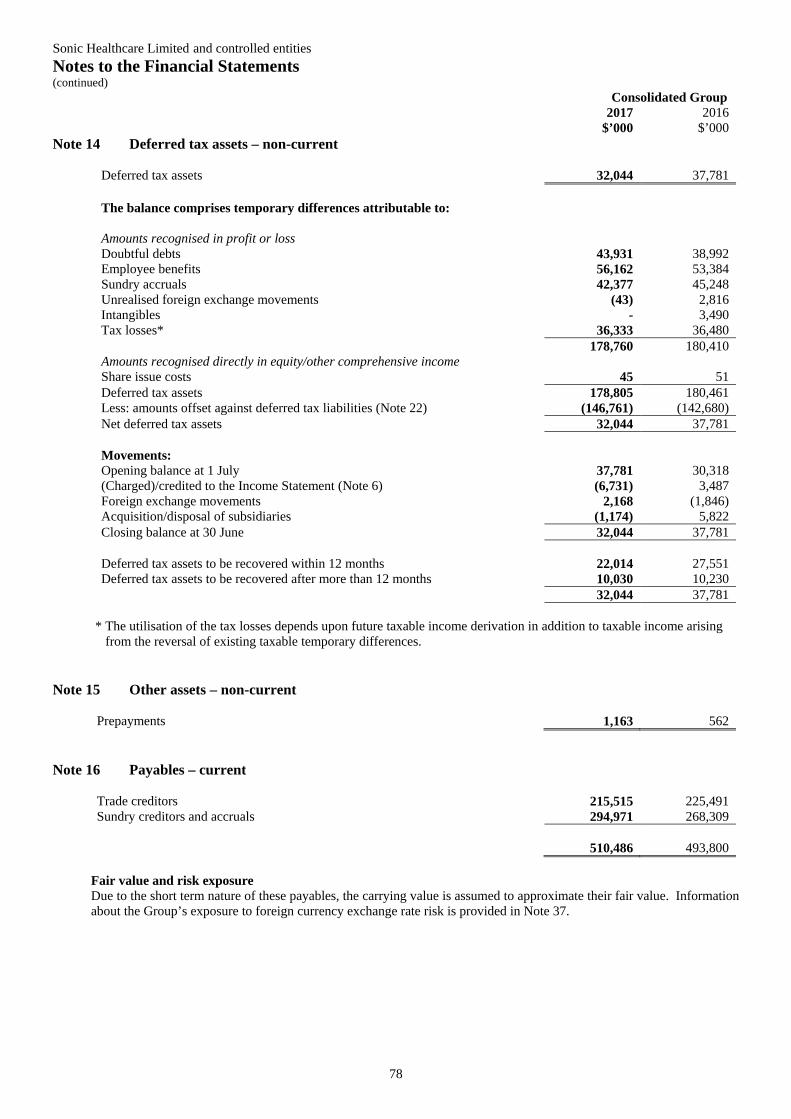
Sonic Healthcare Limited and controlled entities Notes to the Financial Statements (continued)
78
Consolidated Group
2017
$’000 2016
$’000 Note 14 Deferred tax assets – non-current
Deferred tax assets 32,044 37,781 The balance comprises temporary differences attributable to: Amounts recognised in profit or loss Doubtful debts 43,931 38,992 Employee benefits 56,162 53,384 Sundry accruals 42,377 45,248 Unrealised foreign exchange movements (43) 2,816 Intangibles - 3,490 Tax losses* 36,333 36,480 178,760 180,410 Amounts recognised directly in equity/other comprehensive income Share issue costs 45 51 Deferred tax assets 178,805 180,461 Less: amounts offset against deferred tax liabilities (Note 22) (146,761) (142,680) Net deferred tax assets 32,044 37,781 Movements: Opening balance at 1 July 37,781 30,318 (Charged)/credited to the Income Statement (Note 6) (6,731) 3,487 Foreign exchange movements 2,168 (1,846) Acquisition/disposal of subsidiaries (1,174) 5,822 Closing balance at 30 June 32,044 37,781 Deferred tax assets to be recovered within 12 months 22,014 27,551 Deferred tax assets to be recovered after more than 12 months 10,030 10,230 32,044 37,781
* The utilisation of the tax losses depends upon future taxable income derivation in addition to taxable income arising from the reversal of existing taxable temporary differences.
Note 15 Other assets – non-current
Prepayments 1,163 562
Note 16 Payables – current
Trade creditors 215,515 225,491 Sundry creditors and accruals 294,971 268,309
510,486 493,800
Fair value and risk exposure Due to the short term nature of these payables, the carrying value is assumed to approximate their fair value. Information about the Group’s exposure to foreign currency exchange rate risk is provided in Note 37.
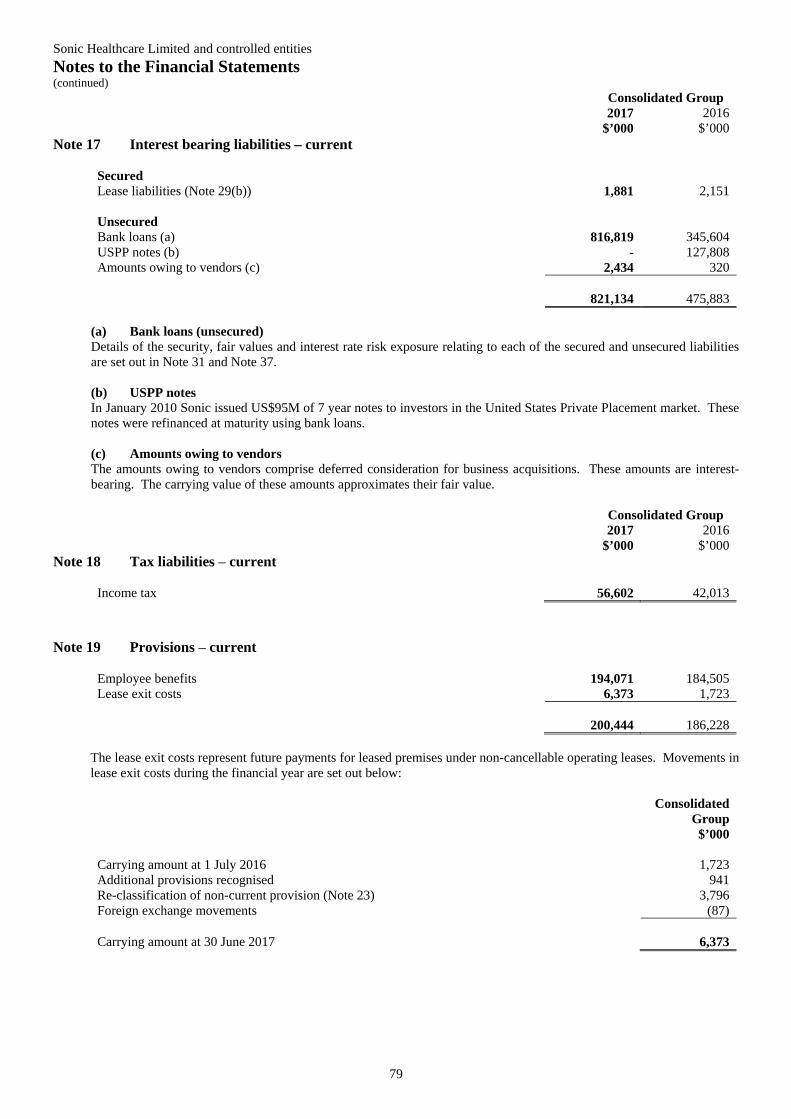
Sonic Healthcare Limited and controlled entities Notes to the Financial Statements (continued)
79
Consolidated Group 2017
$’000 2016
$’000 Note 17 Interest bearing liabilities – current
Secured Lease liabilities (Note 29(b)) 1,881 2,151 Unsecured
Bank loans (a) 816,819 345,604 USPP notes (b) - 127,808 Amounts owing to vendors (c) 2,434 320 821,134 475,883
(a) Bank loans (unsecured) Details of the security, fair values and interest rate risk exposure relating to each of the secured and unsecured liabilities are set out in Note 31 and Note 37. (b) USPP notes In January 2010 Sonic issued US$95M of 7 year notes to investors in the United States Private Placement market. These notes were refinanced at maturity using bank loans. (c) Amounts owing to vendors The amounts owing to vendors comprise deferred consideration for business acquisitions. These amounts are interest-bearing. The carrying value of these amounts approximates their fair value. Consolidated Group 2017
$’000 2016
$’000 Note 18 Tax liabilities – current
Income tax 56,602 42,013
Note 19 Provisions – current
Employee benefits 194,071 184,505 Lease exit costs 6,373 1,723
200,444
186,228 The lease exit costs represent future payments for leased premises under non-cancellable operating leases. Movements in lease exit costs during the financial year are set out below:
Consolidated
Group $’000
Carrying amount at 1 July 2016 1,723 Additional provisions recognised 941 Re-classification of non-current provision (Note 23) 3,796 Foreign exchange movements (87) Carrying amount at 30 June 2017
6,373
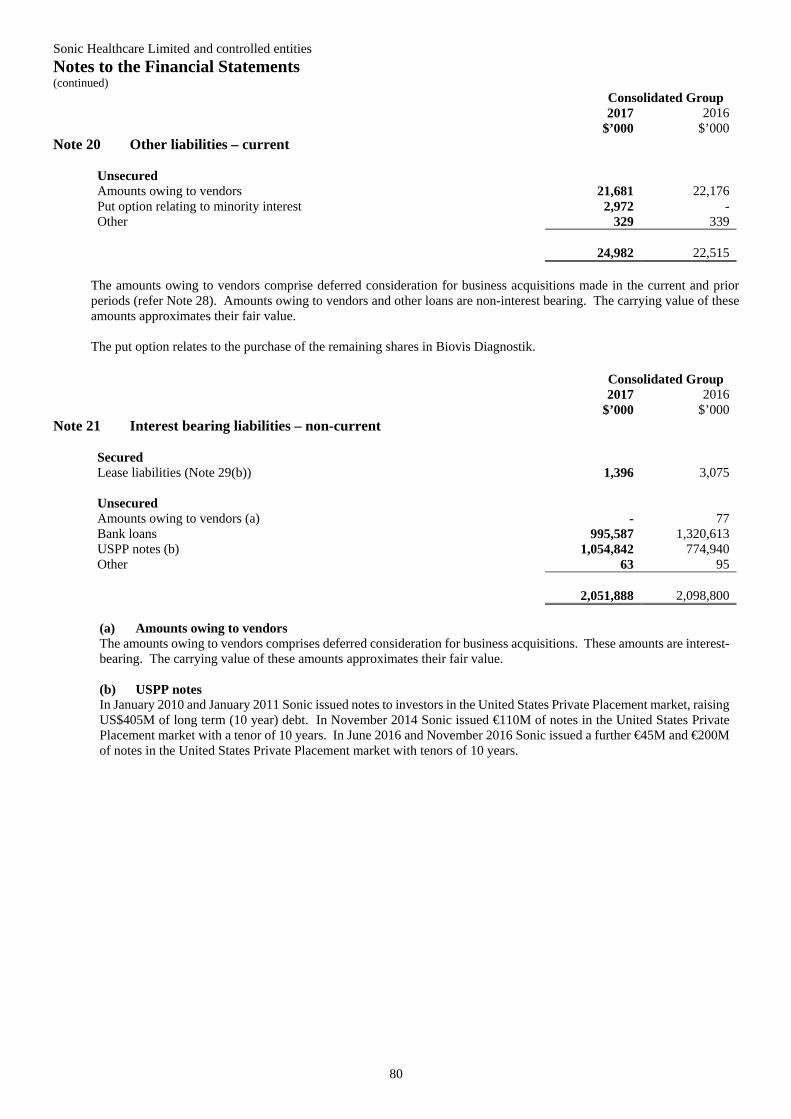
Sonic Healthcare Limited and controlled entities Notes to the Financial Statements (continued)
80
Consolidated Group 2017
$’000 2016
$’000 Note 20 Other liabilities – current
Unsecured Amounts owing to vendors 21,681 22,176 Put option relating to minority interest 2,972 - Other 329 339 24,982 22,515
The amounts owing to vendors comprise deferred consideration for business acquisitions made in the current and prior periods (refer Note 28). Amounts owing to vendors and other loans are non-interest bearing. The carrying value of these amounts approximates their fair value. The put option relates to the purchase of the remaining shares in Biovis Diagnostik. Consolidated Group 2017
$’000 2016
$’000 Note 21 Interest bearing liabilities – non-current
Secured
Lease liabilities (Note 29(b)) 1,396 3,075 Unsecured Amounts owing to vendors (a) - 77 Bank loans 995,587 1,320,613 USPP notes (b) 1,054,842 774,940 Other 63 95 2,051,888 2,098,800 (a) Amounts owing to vendors The amounts owing to vendors comprises deferred consideration for business acquisitions. These amounts are interest-bearing. The carrying value of these amounts approximates their fair value. (b) USPP notes In January 2010 and January 2011 Sonic issued notes to investors in the United States Private Placement market, raising US$405M of long term (10 year) debt. In November 2014 Sonic issued €110M of notes in the United States Private Placement market with a tenor of 10 years. In June 2016 and November 2016 Sonic issued a further €45M and €200M of notes in the United States Private Placement market with tenors of 10 years.
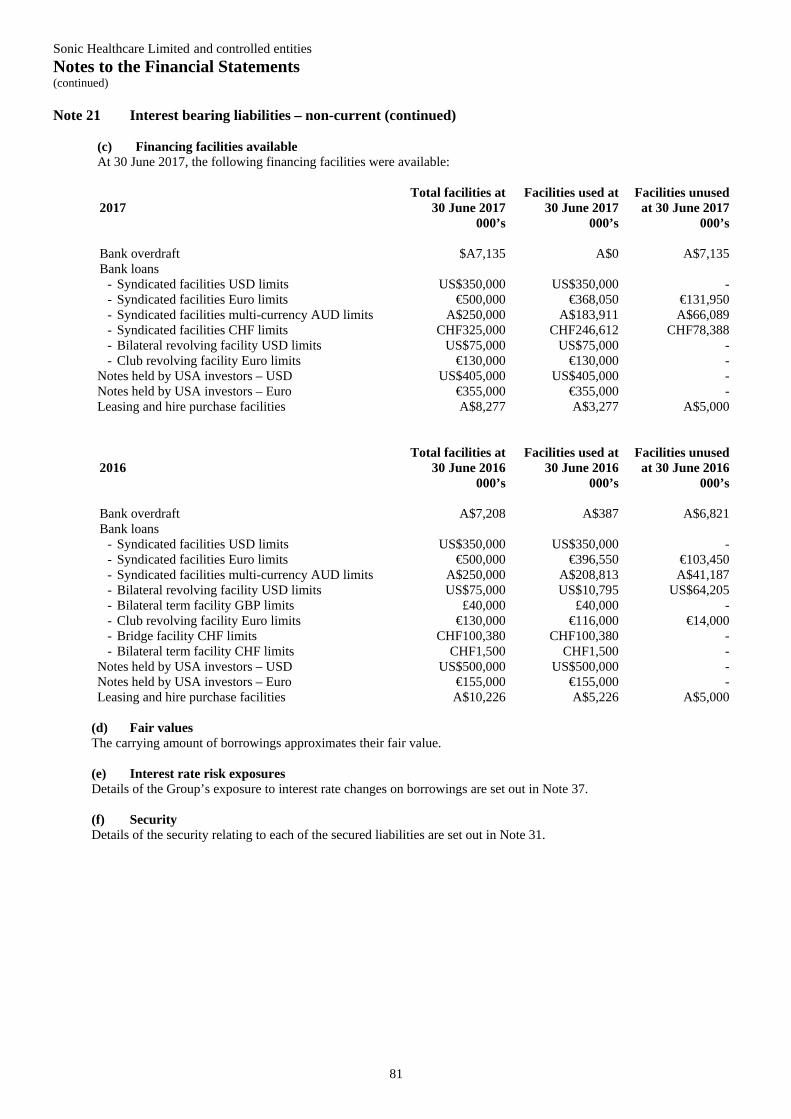
Sonic Healthcare Limited and controlled entities Notes to the Financial Statements (continued)
81
Note 21 Interest bearing liabilities – non-current (continued)
(c) Financing facilities available At 30 June 2017, the following financing facilities were available:
2017 Total facilities at
30 June 2017 Facilities used at
30 June 2017 Facilities unused
at 30 June 2017 000’s 000’s 000’s Bank overdraft $A7,135 A$0 A$7,135 Bank loans
- Syndicated facilities USD limits US$350,000 US$350,000 - - Syndicated facilities Euro limits €500,000 €368,050 €131,950 - Syndicated facilities multi-currency AUD limits A$250,000 A$183,911 A$66,089 - Syndicated facilities CHF limits CHF325,000 CHF246,612 CHF78,388 - Bilateral revolving facility USD limits US$75,000 US$75,000 - - Club revolving facility Euro limits €130,000 €130,000 -
Notes held by USA investors – USD US$405,000 US$405,000 - Notes held by USA investors – Euro €355,000 €355,000 - Leasing and hire purchase facilities A$8,277 A$3,277 A$5,000
2016 Total facilities at
30 June 2016 Facilities used at
30 June 2016 Facilities unused
at 30 June 2016 000’s 000’s 000’s Bank overdraft A$7,208 A$387 A$6,821 Bank loans
- Syndicated facilities USD limits US$350,000 US$350,000 - - Syndicated facilities Euro limits €500,000 €396,550 €103,450 - Syndicated facilities multi-currency AUD limits A$250,000 A$208,813 A$41,187 - Bilateral revolving facility USD limits US$75,000 US$10,795 US$64,205 - Bilateral term facility GBP limits £40,000 £40,000 - - Club revolving facility Euro limits €130,000 €116,000 €14,000 - Bridge facility CHF limits CHF100,380 CHF100,380 - - Bilateral term facility CHF limits CHF1,500 CHF1,500 -
Notes held by USA investors – USD US$500,000 US$500,000 - Notes held by USA investors – Euro €155,000 €155,000 - Leasing and hire purchase facilities A$10,226 A$5,226 A$5,000
(d) Fair values The carrying amount of borrowings approximates their fair value. (e) Interest rate risk exposures Details of the Group’s exposure to interest rate changes on borrowings are set out in Note 37. (f) Security Details of the security relating to each of the secured liabilities are set out in Note 31.
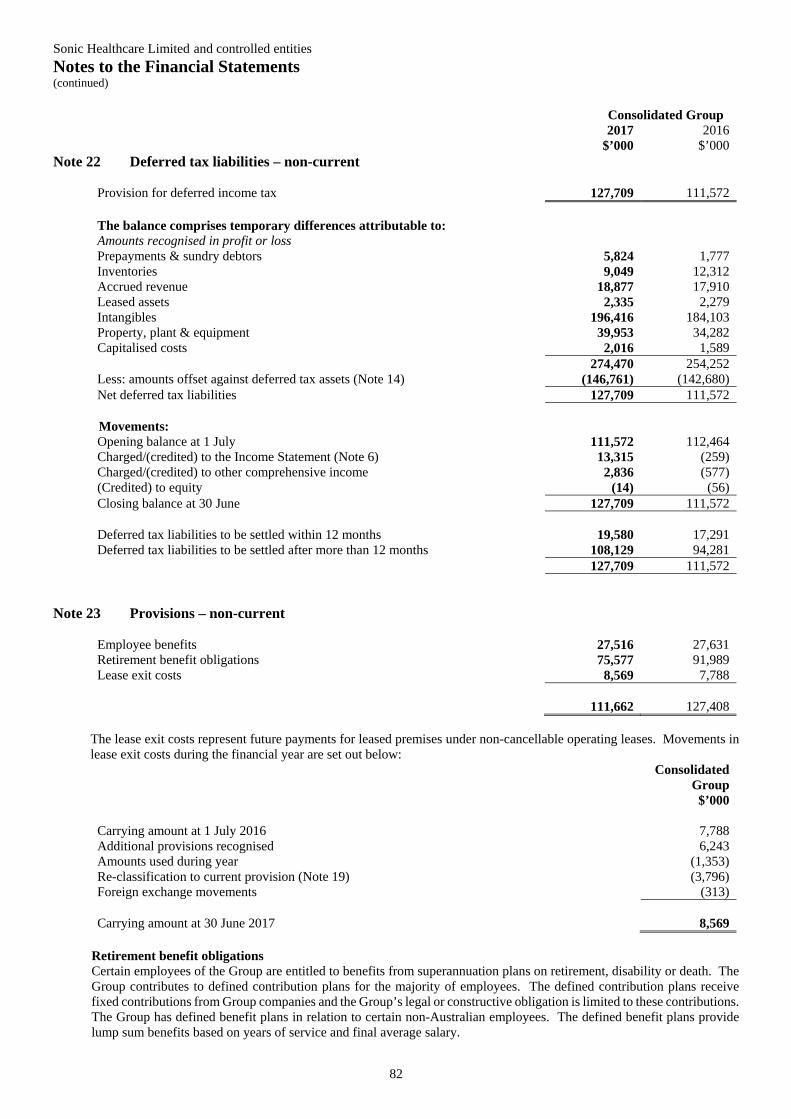
Sonic Healthcare Limited and controlled entities Notes to the Financial Statements (continued)
82
Consolidated Group 2017
$’000 2016
$’000 Note 22 Deferred tax liabilities – non-current
Provision for deferred income tax 127,709 111,572 The balance comprises temporary differences attributable to: Amounts recognised in profit or loss Prepayments & sundry debtors 5,824 1,777 Inventories 9,049 12,312 Accrued revenue 18,877 17,910 Leased assets 2,335 2,279 Intangibles 196,416 184,103 Property, plant & equipment 39,953 34,282 Capitalised costs 2,016 1,589 274,470 254,252 Less: amounts offset against deferred tax assets (Note 14) (146,761) (142,680) Net deferred tax liabilities 127,709 111,572 Movements: Opening balance at 1 July 111,572 112,464 Charged/(credited) to the Income Statement (Note 6) 13,315 (259) Charged/(credited) to other comprehensive income 2,836 (577) (Credited) to equity (14) (56) Closing balance at 30 June 127,709 111,572 Deferred tax liabilities to be settled within 12 months 19,580 17,291 Deferred tax liabilities to be settled after more than 12 months 108,129 94,281 127,709 111,572
Note 23 Provisions – non-current
Employee benefits 27,516 27,631 Retirement benefit obligations 75,577 91,989 Lease exit costs 8,569 7,788 111,662 127,408
The lease exit costs represent future payments for leased premises under non-cancellable operating leases. Movements in lease exit costs during the financial year are set out below:
Consolidated Group $’000
Carrying amount at 1 July 2016 7,788 Additional provisions recognised 6,243 Amounts used during year (1,353) Re-classification to current provision (Note 19) (3,796) Foreign exchange movements (313) Carrying amount at 30 June 2017
8,569
Retirement benefit obligations Certain employees of the Group are entitled to benefits from superannuation plans on retirement, disability or death. The Group contributes to defined contribution plans for the majority of employees. The defined contribution plans receive fixed contributions from Group companies and the Group’s legal or constructive obligation is limited to these contributions. The Group has defined benefit plans in relation to certain non-Australian employees. The defined benefit plans provide lump sum benefits based on years of service and final average salary.
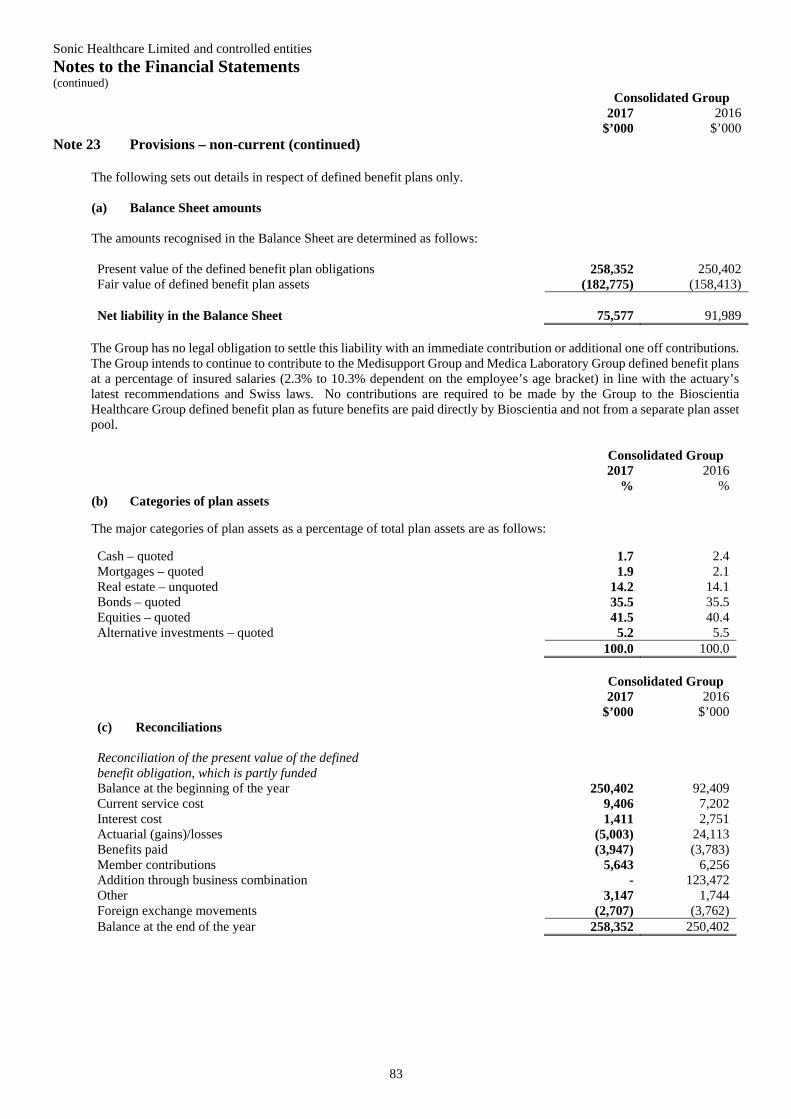
Sonic Healthcare Limited and controlled entities Notes to the Financial Statements (continued)
83
Consolidated Group 2017
$’000 2016
$’000 Note 23 Provisions – non-current (continued)
The following sets out details in respect of defined benefit plans only. (a) Balance Sheet amounts The amounts recognised in the Balance Sheet are determined as follows:
Present value of the defined benefit plan obligations 258,352 250,402 Fair value of defined benefit plan assets (182,775) (158,413) Net liability in the Balance Sheet 75,577 91,989
The Group has no legal obligation to settle this liability with an immediate contribution or additional one off contributions. The Group intends to continue to contribute to the Medisupport Group and Medica Laboratory Group defined benefit plans at a percentage of insured salaries (2.3% to 10.3% dependent on the employee’s age bracket) in line with the actuary’s latest recommendations and Swiss laws. No contributions are required to be made by the Group to the Bioscientia Healthcare Group defined benefit plan as future benefits are paid directly by Bioscientia and not from a separate plan asset pool. Consolidated Group 2017
% 2016
% (b) Categories of plan assets The major categories of plan assets as a percentage of total plan assets are as follows:
Cash – quoted 1.7 2.4 Mortgages – quoted 1.9 2.1 Real estate – unquoted 14.2 14.1 Bonds – quoted 35.5 35.5 Equities – quoted 41.5 40.4 Alternative investments – quoted 5.2 5.5 100.0 100.0
Consolidated Group 2017
$’000 2016
$’000 (c) Reconciliations Reconciliation of the present value of the defined benefit obligation, which is partly funded
Balance at the beginning of the year 250,402 92,409 Current service cost 9,406 7,202 Interest cost 1,411 2,751 Actuarial (gains)/losses (5,003) 24,113 Benefits paid (3,947) (3,783) Member contributions 5,643 6,256 Addition through business combination - 123,472 Other 3,147 1,744 Foreign exchange movements (2,707) (3,762) Balance at the end of the year 258,352 250,402
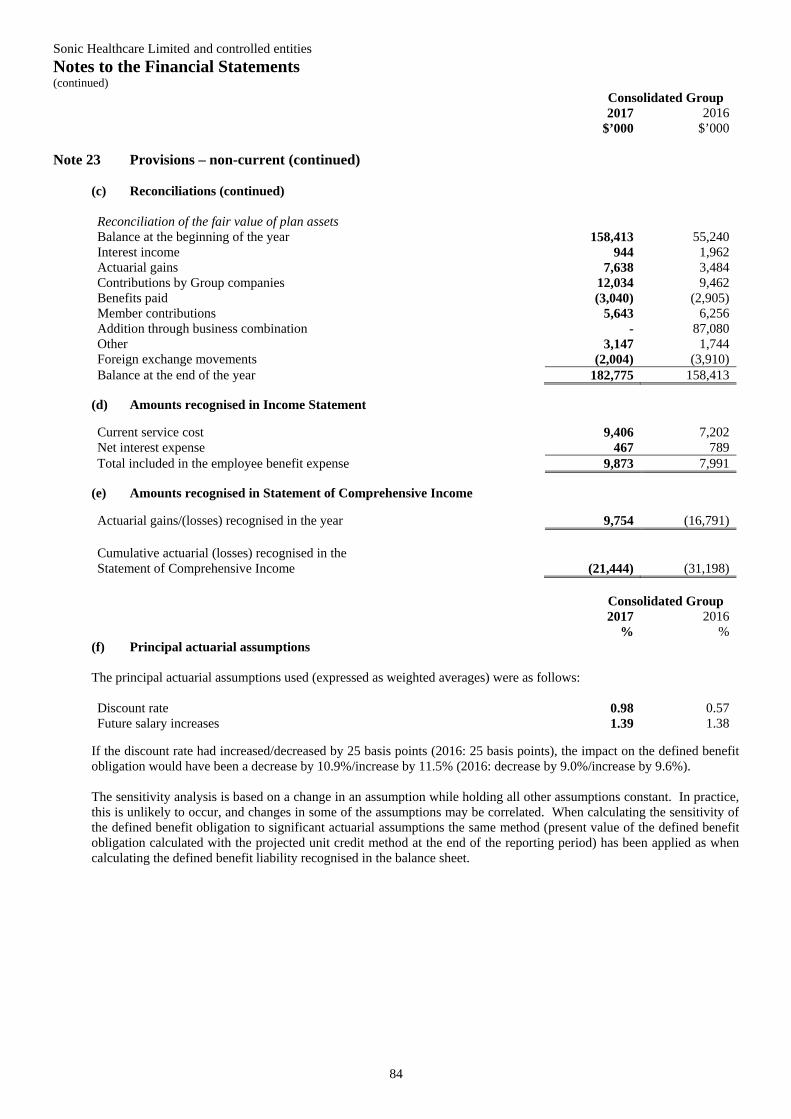
Sonic Healthcare Limited and controlled entities Notes to the Financial Statements (continued)
84
Consolidated Group 2017
$’000 2016
$’000 Note 23 Provisions – non-current (continued)
(c) Reconciliations (continued) Reconciliation of the fair value of plan assets Balance at the beginning of the year 158,413 55,240 Interest income 944 1,962 Actuarial gains 7,638 3,484 Contributions by Group companies 12,034 9,462 Benefits paid (3,040) (2,905) Member contributions 5,643 6,256 Addition through business combination - 87,080 Other 3,147 1,744 Foreign exchange movements (2,004) (3,910) Balance at the end of the year 182,775 158,413
(d) Amounts recognised in Income Statement Current service cost 9,406 7,202 Net interest expense 467 789 Total included in the employee benefit expense 9,873 7,991
(e) Amounts recognised in Statement of Comprehensive Income
Actuarial gains/(losses) recognised in the year 9,754 (16,791) Cumulative actuarial (losses) recognised in the Statement of Comprehensive Income
(21,444)
(31,198)
Consolidated Group 2017
% 2016
% (f) Principal actuarial assumptions The principal actuarial assumptions used (expressed as weighted averages) were as follows: Discount rate 0.98 0.57 Future salary increases 1.39 1.38
If the discount rate had increased/decreased by 25 basis points (2016: 25 basis points), the impact on the defined benefit obligation would have been a decrease by 10.9%/increase by 11.5% (2016: decrease by 9.0%/increase by 9.6%). The sensitivity analysis is based on a change in an assumption while holding all other assumptions constant. In practice, this is unlikely to occur, and changes in some of the assumptions may be correlated. When calculating the sensitivity of the defined benefit obligation to significant actuarial assumptions the same method (present value of the defined benefit obligation calculated with the projected unit credit method at the end of the reporting period) has been applied as when calculating the defined benefit liability recognised in the balance sheet.
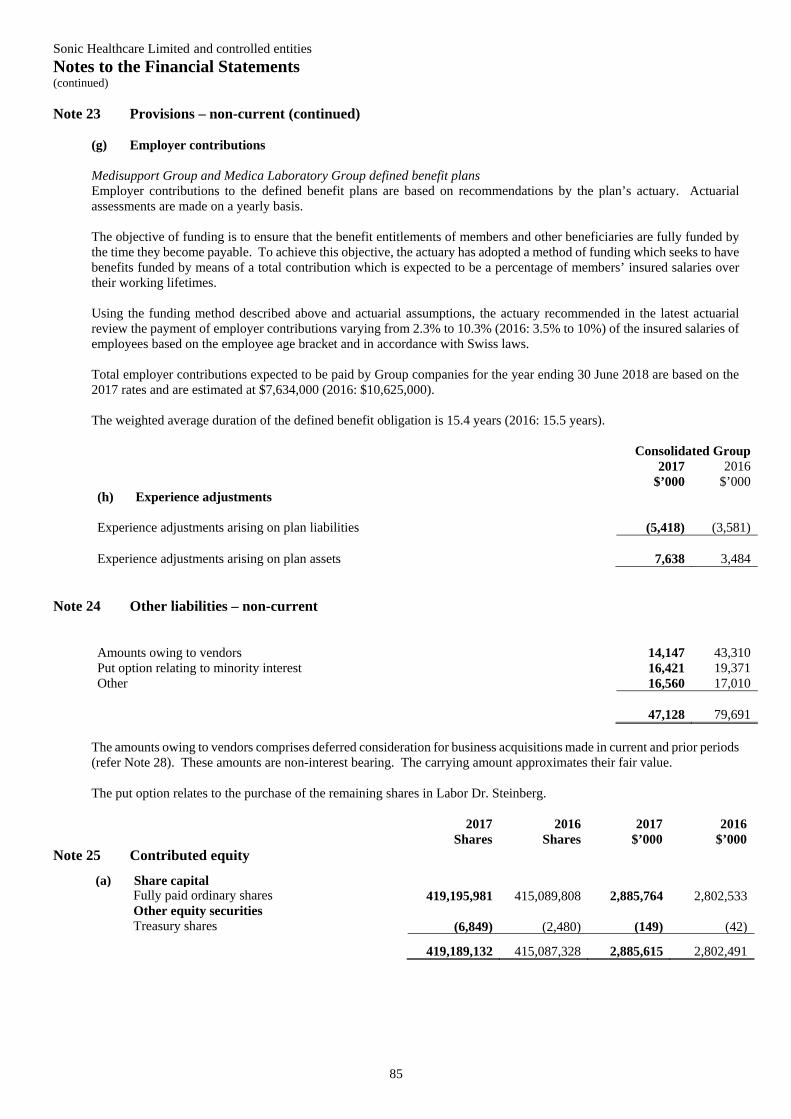
Sonic Healthcare Limited and controlled entities Notes to the Financial Statements (continued)
85
Note 23 Provisions – non-current (continued)
(g) Employer contributions Medisupport Group and Medica Laboratory Group defined benefit plans Employer contributions to the defined benefit plans are based on recommendations by the plan’s actuary. Actuarial assessments are made on a yearly basis. The objective of funding is to ensure that the benefit entitlements of members and other beneficiaries are fully funded by the time they become payable. To achieve this objective, the actuary has adopted a method of funding which seeks to have benefits funded by means of a total contribution which is expected to be a percentage of members’ insured salaries over their working lifetimes. Using the funding method described above and actuarial assumptions, the actuary recommended in the latest actuarial review the payment of employer contributions varying from 2.3% to 10.3% (2016: 3.5% to 10%) of the insured salaries of employees based on the employee age bracket and in accordance with Swiss laws. Total employer contributions expected to be paid by Group companies for the year ending 30 June 2018 are based on the 2017 rates and are estimated at $7,634,000 (2016: $10,625,000). The weighted average duration of the defined benefit obligation is 15.4 years (2016: 15.5 years). Consolidated Group 2017
$’000 2016
$’000 (h) Experience adjustments
Experience adjustments arising on plan liabilities (5,418) (3,581) Experience adjustments arising on plan assets 7,638 3,484
Note 24 Other liabilities – non-current Amounts owing to vendors 14,147 43,310 Put option relating to minority interest 16,421 19,371 Other 16,560 17,010
47,128
79,691
The amounts owing to vendors comprises deferred consideration for business acquisitions made in current and prior periods (refer Note 28). These amounts are non-interest bearing. The carrying amount approximates their fair value.
The put option relates to the purchase of the remaining shares in Labor Dr. Steinberg. 2017
Shares 2016
Shares 2017
$’000 2016
$’000 Note 25 Contributed equity
(a) Share capital
Fully paid ordinary shares 419,195,981 415,089,808 2,885,764 2,802,533 Other equity securities Treasury shares (6,849) (2,480) (149) (42)
419,189,132 415,087,328 2,885,615
2,802,491
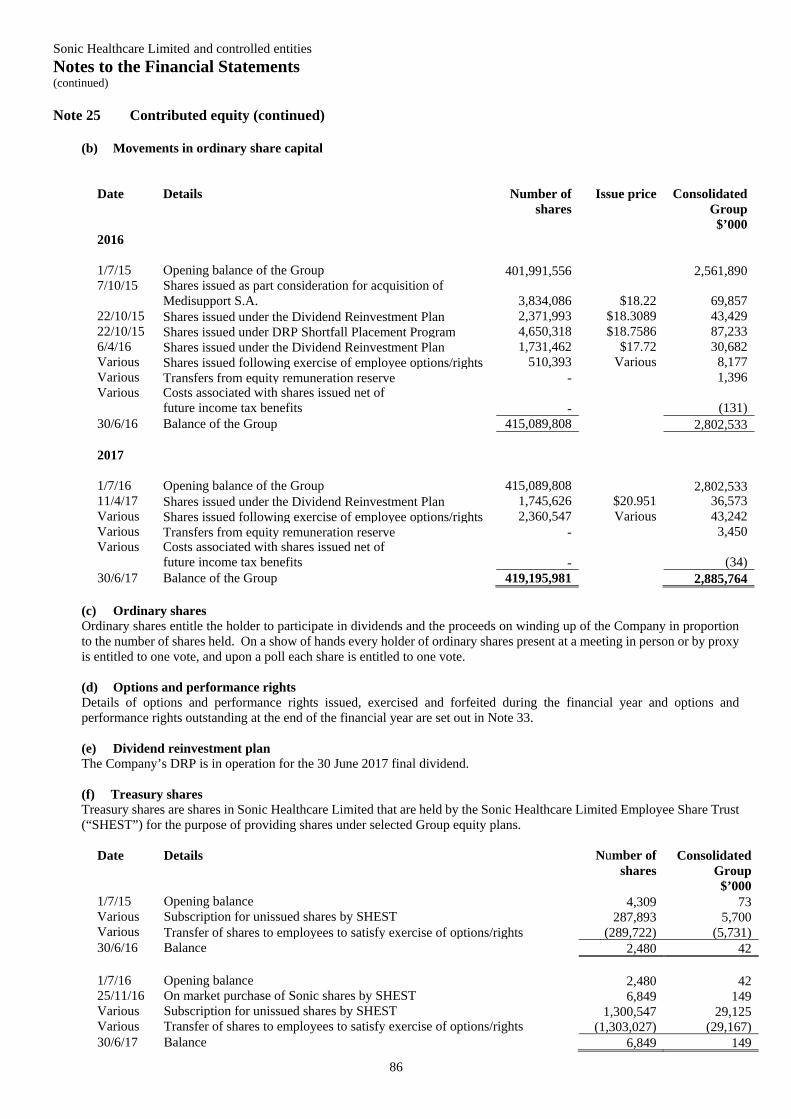
Sonic Healthcare Limited and controlled entities Notes to the Financial Statements (continued)
86
Note 25 Contributed equity (continued)
(b) Movements in ordinary share capital Date Details Number of
shares Issue price Consolidated
Group $’000
2016
1/7/15 Opening balance of the Group 401,991,556 2,561,890 7/10/15 Shares issued as part consideration for acquisition of
Medisupport S.A. 3,834,086 $18.22 69,857 22/10/15 Shares issued under the Dividend Reinvestment Plan 2,371,993 $18.3089 43,429 22/10/15 Shares issued under DRP Shortfall Placement Program 4,650,318 $18.7586 87,233 6/4/16 Shares issued under the Dividend Reinvestment Plan 1,731,462 $17.72 30,682 Various Shares issued following exercise of employee options/rights 510,393 Various 8,177 Various Transfers from equity remuneration reserve - 1,396 Various Costs associated with shares issued net of
future income tax benefits - (131) 30/6/16 Balance of the Group 415,089,808 2,802,533 2017
1/7/16 Opening balance of the Group 415,089,808 2,802,533 11/4/17 Shares issued under the Dividend Reinvestment Plan 1,745,626 $20.951 36,573 Various Shares issued following exercise of employee options/rights 2,360,547 Various 43,242 Various Transfers from equity remuneration reserve - 3,450 Various Costs associated with shares issued net of
future income tax benefits - (34) 30/6/17 Balance of the Group 419,195,981 2,885,764
(c) Ordinary shares Ordinary shares entitle the holder to participate in dividends and the proceeds on winding up of the Company in proportion to the number of shares held. On a show of hands every holder of ordinary shares present at a meeting in person or by proxy is entitled to one vote, and upon a poll each share is entitled to one vote. (d) Options and performance rights Details of options and performance rights issued, exercised and forfeited during the financial year and options and performance rights outstanding at the end of the financial year are set out in Note 33. (e) Dividend reinvestment plan The Company’s DRP is in operation for the 30 June 2017 final dividend. (f) Treasury shares Treasury shares are shares in Sonic Healthcare Limited that are held by the Sonic Healthcare Limited Employee Share Trust (“SHEST”) for the purpose of providing shares under selected Group equity plans.
Date Details Number of shares
Consolidated Group $’000
1/7/15 Opening balance 4,309 73 Various Subscription for unissued shares by SHEST 287,893 5,700 Various Transfer of shares to employees to satisfy exercise of options/rights (289,722) (5,731) 30/6/16 Balance 2,480 42 1/7/16 Opening balance 2,480 42 25/11/16 On market purchase of Sonic shares by SHEST 6,849 149 Various Subscription for unissued shares by SHEST 1,300,547 29,125 Various Transfer of shares to employees to satisfy exercise of options/rights (1,303,027) (29,167) 30/6/17 Balance 6,849 149
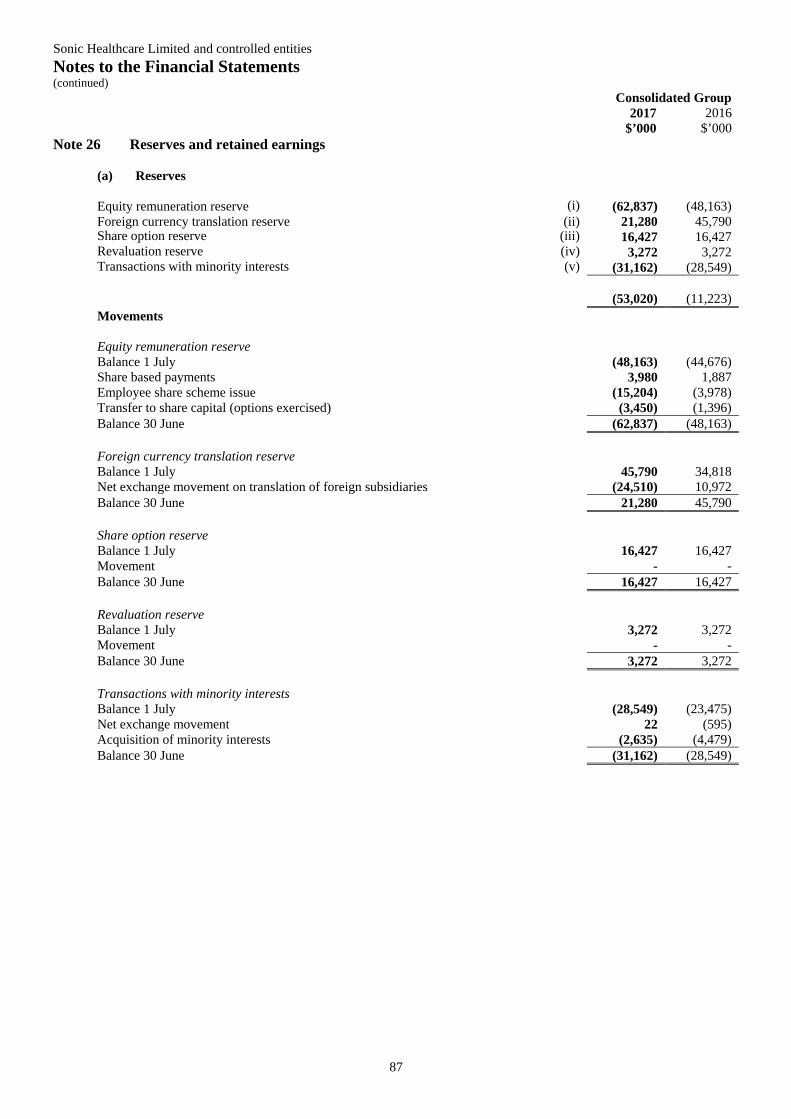
Sonic Healthcare Limited and controlled entities Notes to the Financial Statements (continued)
87
Consolidated Group 2017
$’000 2016
$’000 Note 26 Reserves and retained earnings
(a) Reserves Equity remuneration reserve (i) (62,837) (48,163) Foreign currency translation reserve (ii) 21,280 45,790 Share option reserve (iii) 16,427 16,427 Revaluation reserve (iv) 3,272 3,272 Transactions with minority interests (v) (31,162) (28,549)
(53,020) (11,223)
Movements Equity remuneration reserve Balance 1 July (48,163) (44,676) Share based payments 3,980 1,887 Employee share scheme issue (15,204) (3,978) Transfer to share capital (options exercised) (3,450) (1,396) Balance 30 June (62,837) (48,163) Foreign currency translation reserve Balance 1 July 45,790 34,818 Net exchange movement on translation of foreign subsidiaries (24,510) 10,972 Balance 30 June 21,280 45,790 Share option reserve Balance 1 July 16,427 16,427 Movement - - Balance 30 June 16,427 16,427 Revaluation reserve Balance 1 July 3,272 3,272 Movement - - Balance 30 June 3,272 3,272 Transactions with minority interests Balance 1 July (28,549) (23,475) Net exchange movement 22 (595) Acquisition of minority interests (2,635) (4,479) Balance 30 June (31,162) (28,549)
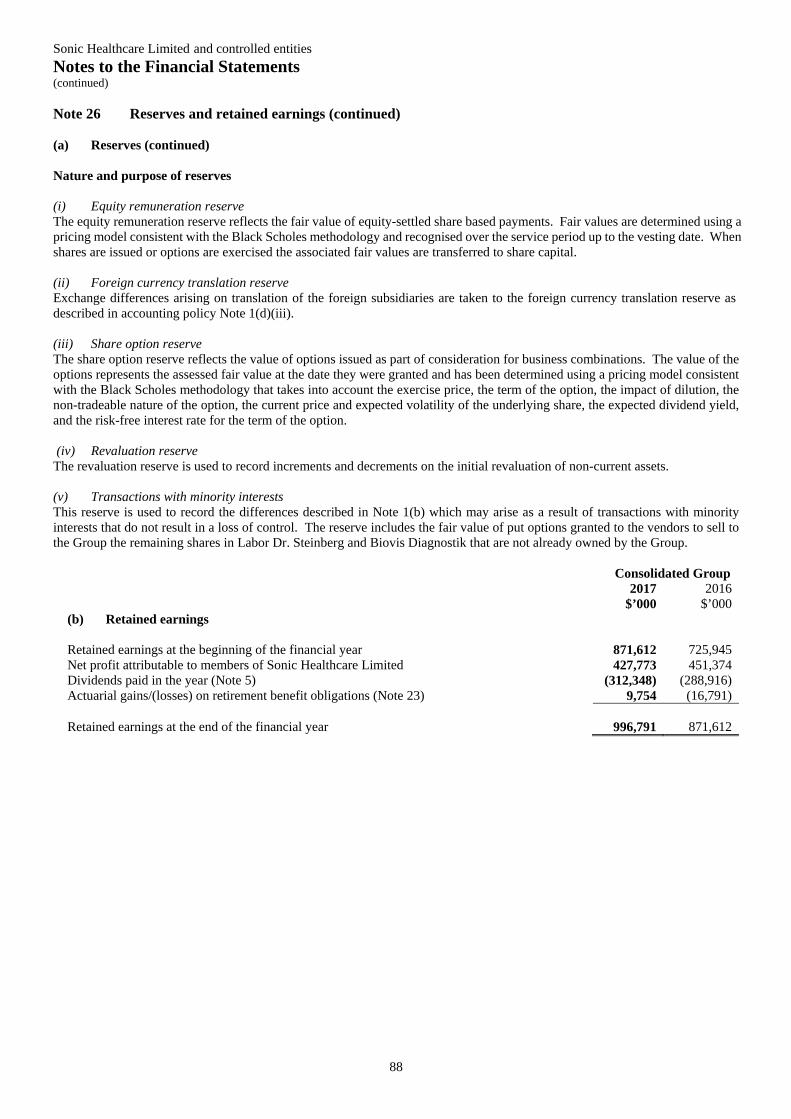
Sonic Healthcare Limited and controlled entities Notes to the Financial Statements (continued)
88
Note 26 Reserves and retained earnings (continued)
(a) Reserves (continued) Nature and purpose of reserves (i) Equity remuneration reserve The equity remuneration reserve reflects the fair value of equity-settled share based payments. Fair values are determined using a pricing model consistent with the Black Scholes methodology and recognised over the service period up to the vesting date. When shares are issued or options are exercised the associated fair values are transferred to share capital. (ii) Foreign currency translation reserve Exchange differences arising on translation of the foreign subsidiaries are taken to the foreign currency translation reserve as described in accounting policy Note 1(d)(iii). (iii) Share option reserve The share option reserve reflects the value of options issued as part of consideration for business combinations. The value of the options represents the assessed fair value at the date they were granted and has been determined using a pricing model consistent with the Black Scholes methodology that takes into account the exercise price, the term of the option, the impact of dilution, the non-tradeable nature of the option, the current price and expected volatility of the underlying share, the expected dividend yield, and the risk-free interest rate for the term of the option. (iv) Revaluation reserve The revaluation reserve is used to record increments and decrements on the initial revaluation of non-current assets. (v) Transactions with minority interests This reserve is used to record the differences described in Note 1(b) which may arise as a result of transactions with minority interests that do not result in a loss of control. The reserve includes the fair value of put options granted to the vendors to sell to the Group the remaining shares in Labor Dr. Steinberg and Biovis Diagnostik that are not already owned by the Group.
Consolidated Group 2017
$’000 2016
$’000 (b) Retained earnings Retained earnings at the beginning of the financial year 871,612 725,945 Net profit attributable to members of Sonic Healthcare Limited 427,773 451,374 Dividends paid in the year (Note 5) (312,348) (288,916) Actuarial gains/(losses) on retirement benefit obligations (Note 23) 9,754 (16,791) Retained earnings at the end of the financial year
996,791 871,612
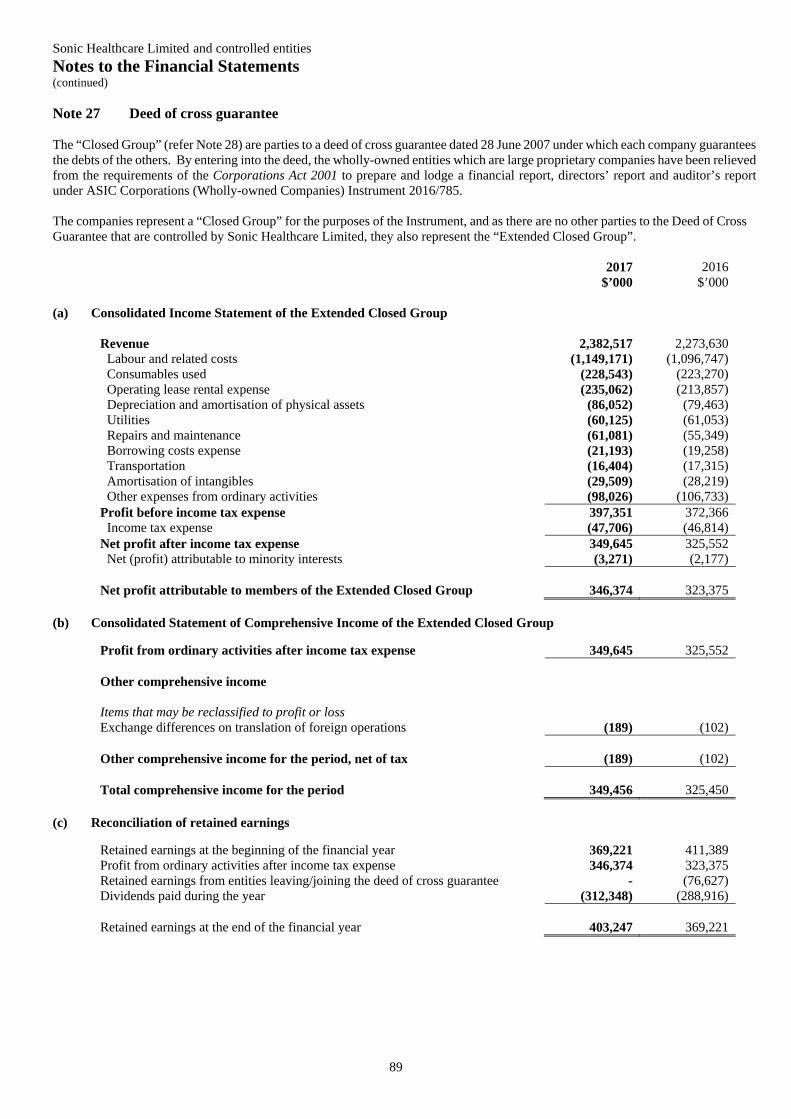
Sonic Healthcare Limited and controlled entities Notes to the Financial Statements (continued)
89
Note 27 Deed of cross guarantee The “Closed Group” (refer Note 28) are parties to a deed of cross guarantee dated 28 June 2007 under which each company guarantees the debts of the others. By entering into the deed, the wholly-owned entities which are large proprietary companies have been relieved from the requirements of the Corporations Act 2001 to prepare and lodge a financial report, directors’ report and auditor’s report under ASIC Corporations (Wholly-owned Companies) Instrument 2016/785. The companies represent a “Closed Group” for the purposes of the Instrument, and as there are no other parties to the Deed of Cross Guarantee that are controlled by Sonic Healthcare Limited, they also represent the “Extended Closed Group”.
2017 $’000
2016 $’000
(a) Consolidated Income Statement of the Extended Closed Group
Revenue 2,382,517 2,273,630 Labour and related costs (1,149,171) (1,096,747) Consumables used (228,543) (223,270) Operating lease rental expense (235,062) (213,857) Depreciation and amortisation of physical assets (86,052) (79,463) Utilities (60,125) (61,053) Repairs and maintenance (61,081) (55,349) Borrowing costs expense (21,193) (19,258) Transportation (16,404) (17,315) Amortisation of intangibles (29,509) (28,219) Other expenses from ordinary activities (98,026) (106,733) Profit before income tax expense 397,351 372,366 Income tax expense (47,706) (46,814) Net profit after income tax expense 349,645 325,552 Net (profit) attributable to minority interests (3,271) (2,177) Net profit attributable to members of the Extended Closed Group
346,374
323,375
(b) Consolidated Statement of Comprehensive Income of the Extended Closed Group
Profit from ordinary activities after income tax expense 349,645 325,552 Other comprehensive income Items that may be reclassified to profit or loss Exchange differences on translation of foreign operations (189) (102) Other comprehensive income for the period, net of tax (189) (102) Total comprehensive income for the period 349,456 325,450
(c) Reconciliation of retained earnings
Retained earnings at the beginning of the financial year 369,221 411,389 Profit from ordinary activities after income tax expense 346,374 323,375 Retained earnings from entities leaving/joining the deed of cross guarantee - (76,627) Dividends paid during the year (312,348) (288,916) Retained earnings at the end of the financial year 403,247 369,221
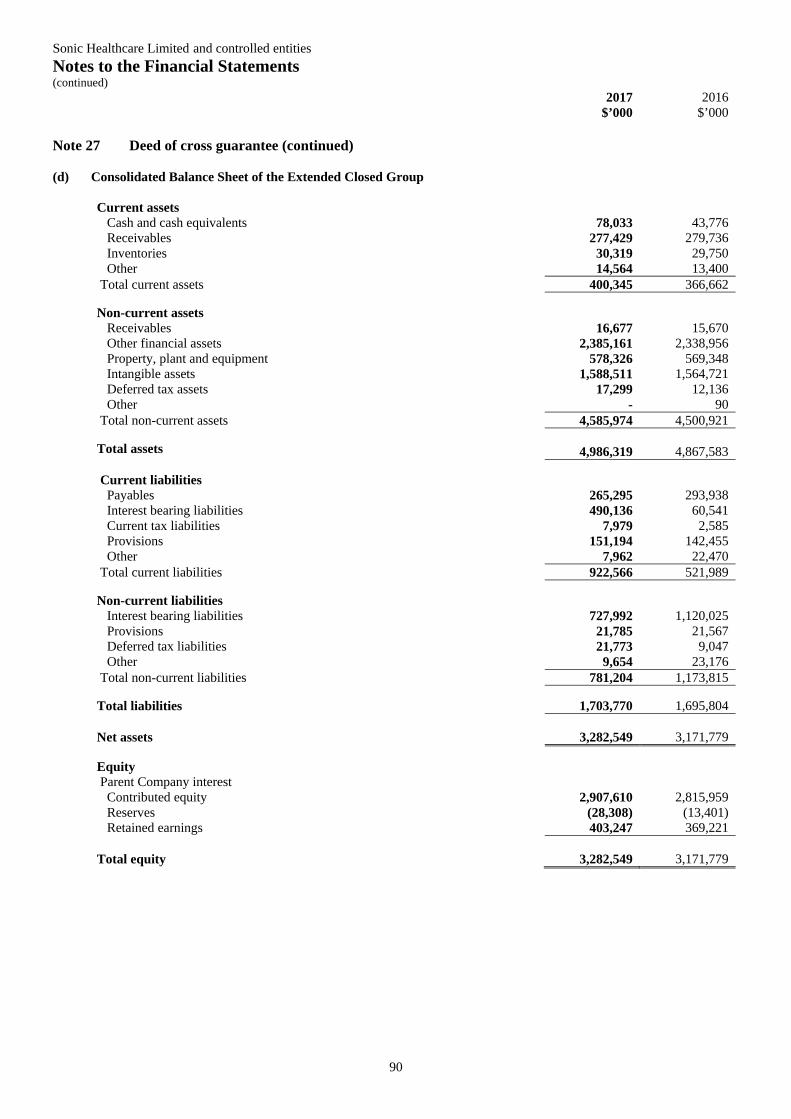
Sonic Healthcare Limited and controlled entities Notes to the Financial Statements (continued)
90
2017 $’000
2016 $’000
Note 27 Deed of cross guarantee (continued) (d) Consolidated Balance Sheet of the Extended Closed Group
Current assets Cash and cash equivalents 78,033 43,776 Receivables 277,429 279,736 Inventories 30,319 29,750 Other 14,564 13,400 Total current assets 400,345 366,662
Non-current assets Receivables 16,677 15,670 Other financial assets 2,385,161 2,338,956 Property, plant and equipment 578,326 569,348 Intangible assets 1,588,511 1,564,721 Deferred tax assets 17,299 12,136 Other - 90 Total non-current assets 4,585,974 4,500,921 Total assets
4,986,319
4,867,583
Current liabilities Payables 265,295 293,938 Interest bearing liabilities 490,136 60,541 Current tax liabilities 7,979 2,585 Provisions 151,194 142,455 Other 7,962 22,470 Total current liabilities 922,566 521,989
Non-current liabilities Interest bearing liabilities 727,992 1,120,025 Provisions 21,785 21,567 Deferred tax liabilities 21,773 9,047 Other 9,654 23,176 Total non-current liabilities 781,204 1,173,815 Total liabilities 1,703,770 1,695,804 Net assets 3,282,549 3,171,779
Equity Parent Company interest Contributed equity 2,907,610 2,815,959 Reserves (28,308) (13,401) Retained earnings 403,247 369,221 Total equity
3,282,549
3,171,779
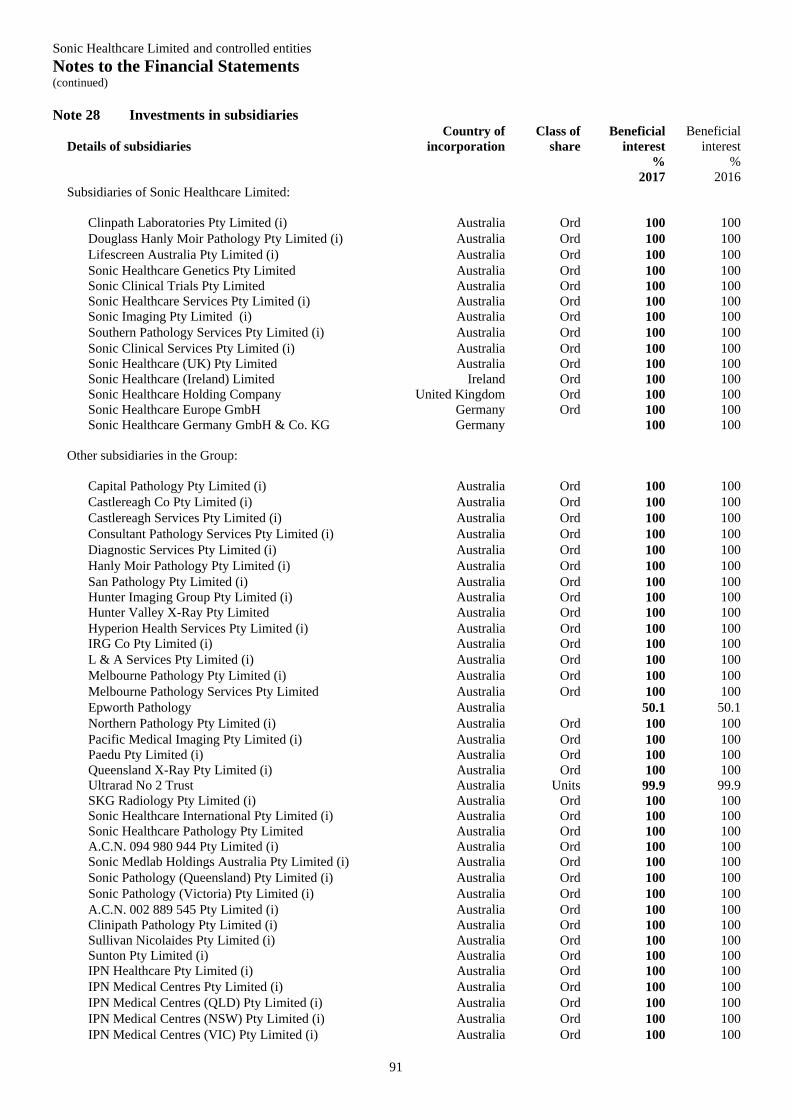
Sonic Healthcare Limited and controlled entities Notes to the Financial Statements (continued)
91
Note 28 Investments in subsidiaries
San Pathology Pty Limited (i) Australia Ord 100 100 Hunter Imaging Group Pty Limited (i) Australia Ord 100 100 Hunter Valley X-Ray Pty Limited Australia Ord 100 100 Hyperion Health Services Pty Limited (i) Australia Ord 100 100 IRG Co Pty Limited (i) Australia Ord 100 100 L & A Services Pty Limited (i) Australia Ord 100 100 Melbourne Pathology Pty Limited (i) Australia Ord 100 100 Melbourne Pathology Services Pty Limited Australia Ord 100 100 Epworth Pathology Australia 50.1 50.1 Northern Pathology Pty Limited (i) Australia Ord 100 100 Pacific Medical Imaging Pty Limited (i) Australia Ord 100 100 Paedu Pty Limited (i) Australia Ord 100 100 Queensland X-Ray Pty Limited (i) Australia Ord 100 100 Ultrarad No 2 Trust Australia Units 99.9 99.9 SKG Radiology Pty Limited (i) Australia Ord 100 100 Sonic Healthcare International Pty Limited (i) Australia Ord 100 100 Sonic Healthcare Pathology Pty Limited Australia Ord 100 100 A.C.N. 094 980 944 Pty Limited (i) Australia Ord 100 100 Sonic Medlab Holdings Australia Pty Limited (i) Australia Ord 100 100 Sonic Pathology (Queensland) Pty Limited (i) Australia Ord 100 100 Sonic Pathology (Victoria) Pty Limited (i) Australia Ord 100 100 A.C.N. 002 889 545 Pty Limited (i) Australia Ord 100 100 Clinipath Pathology Pty Limited (i) Australia Ord 100 100 Sullivan Nicolaides Pty Limited (i) Australia Ord 100 100 Sunton Pty Limited (i) Australia Ord 100 100 IPN Healthcare Pty Limited (i) Australia Ord 100 100 IPN Medical Centres Pty Limited (i) Australia Ord 100 100 IPN Medical Centres (QLD) Pty Limited (i) Australia Ord 100 100 IPN Medical Centres (NSW) Pty Limited (i) Australia Ord 100 100 IPN Medical Centres (VIC) Pty Limited (i) Australia Ord 100 100
Details of subsidiaries
Country of incorporation
Class of share
Beneficial interest
%
Beneficial interest
% 2017 2016 Subsidiaries of Sonic Healthcare Limited:
Clinpath Laboratories Pty Limited (i) Australia Ord 100 100 Douglass Hanly Moir Pathology Pty Limited (i) Australia Ord 100 100 Lifescreen Australia Pty Limited (i) Australia Ord 100 100 Sonic Healthcare Genetics Pty Limited Australia Ord 100 100 Sonic Clinical Trials Pty Limited Australia Ord 100 100 Sonic Healthcare Services Pty Limited (i) Australia Ord 100 100 Sonic Imaging Pty Limited (i) Australia Ord 100 100 Southern Pathology Services Pty Limited (i) Australia Ord 100 100 Sonic Clinical Services Pty Limited (i) Australia Ord 100 100 Sonic Healthcare (UK) Pty Limited Australia Ord 100 100 Sonic Healthcare (Ireland) Limited Ireland Ord 100 100 Sonic Healthcare Holding Company United Kingdom Ord 100 100 Sonic Healthcare Europe GmbH Germany Ord 100 100 Sonic Healthcare Germany GmbH & Co. KG Germany
100 100
Other subsidiaries in the Group:
Capital Pathology Pty Limited (i) Australia Ord 100 100 Castlereagh Co Pty Limited (i) Australia Ord 100 100 Castlereagh Services Pty Limited (i) Australia Ord 100 100 Consultant Pathology Services Pty Limited (i) Australia Ord 100 100 Diagnostic Services Pty Limited (i) Australia Ord 100 100 Hanly Moir Pathology Pty Limited (i) Australia Ord 100 100
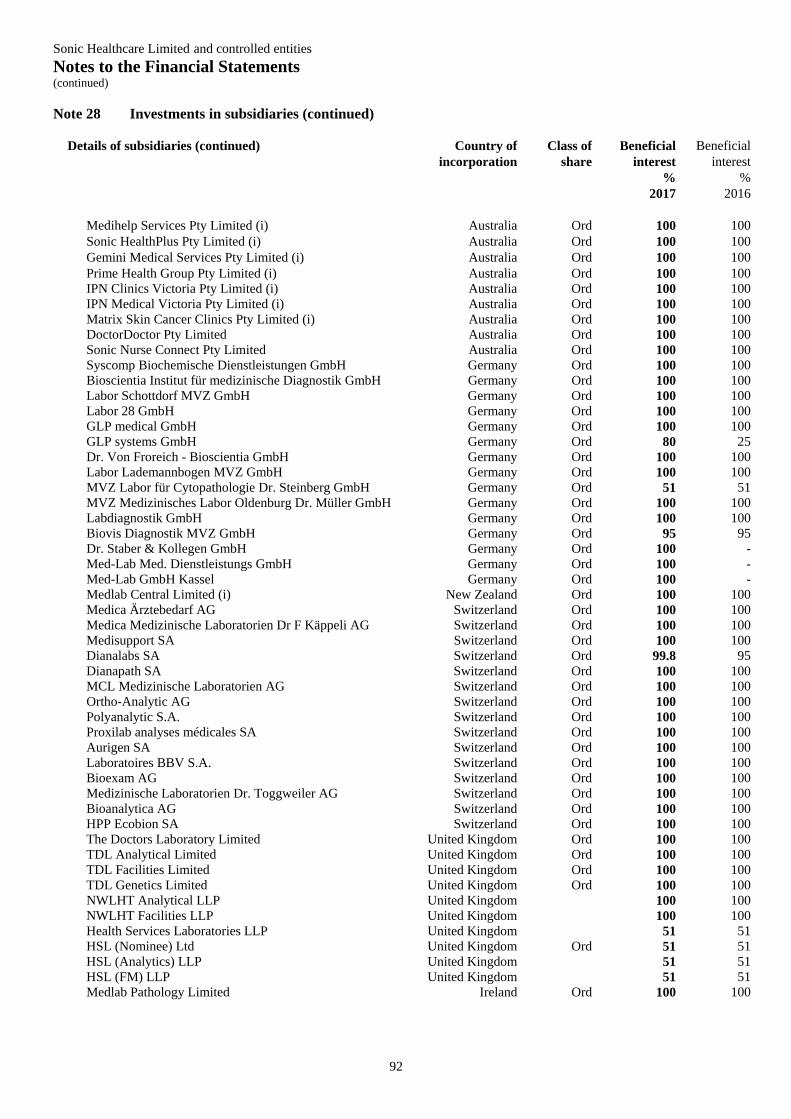
Sonic Healthcare Limited and controlled entities Notes to the Financial Statements (continued)
92
Note 28 Investments in subsidiaries (continued)
Details of subsidiaries (continued) Country of Class of Beneficial Beneficial incorporation share interest interest % % 2017 2016 Medihelp Services Pty Limited (i) Australia Ord 100 100 Sonic HealthPlus Pty Limited (i) Australia Ord 100 100 Gemini Medical Services Pty Limited (i) Australia Ord 100 100 Prime Health Group Pty Limited (i) Australia Ord 100 100 IPN Clinics Victoria Pty Limited (i) Australia Ord 100 100 IPN Medical Victoria Pty Limited (i) Australia Ord 100 100 Matrix Skin Cancer Clinics Pty Limited (i) Australia Ord 100 100 DoctorDoctor Pty Limited Australia Ord 100 100 Sonic Nurse Connect Pty Limited Australia Ord 100 100 Syscomp Biochemische Dienstleistungen GmbH Germany Ord 100 100 Bioscientia Institut für medizinische Diagnostik GmbH Germany Ord 100 100 Labor Schottdorf MVZ GmbH Germany Ord 100 100 Labor 28 GmbH Germany Ord 100 100 GLP medical GmbH Germany Ord 100 100 GLP systems GmbH Germany Ord 80 25 Dr. Von Froreich - Bioscientia GmbH Germany Ord 100 100 Labor Lademannbogen MVZ GmbH Germany Ord 100 100 MVZ Labor für Cytopathologie Dr. Steinberg GmbH Germany Ord 51 51 MVZ Medizinisches Labor Oldenburg Dr. Müller GmbH Germany Ord 100 100 Labdiagnostik GmbH Germany Ord 100 100 Biovis Diagnostik MVZ GmbH Germany Ord 95 95 Dr. Staber & Kollegen GmbH Germany Ord 100 - Med-Lab Med. Dienstleistungs GmbH Germany Ord 100 - Med-Lab GmbH Kassel Germany Ord 100 - Medlab Central Limited (i) New Zealand Ord 100 100 Medica Ärztebedarf AG Switzerland Ord 100 100 Medica Medizinische Laboratorien Dr F Käppeli AG Switzerland Ord 100 100 Medisupport SA Switzerland Ord 100 100 Dianalabs SA Switzerland Ord 99.8 95 Dianapath SA Switzerland Ord 100 100 MCL Medizinische Laboratorien AG Switzerland Ord 100 100 Ortho-Analytic AG Switzerland Ord 100 100 Polyanalytic S.A. Switzerland Ord 100 100 Proxilab analyses médicales SA Switzerland Ord 100 100 Aurigen SA Switzerland Ord 100 100 Laboratoires BBV S.A. Switzerland Ord 100 100 Bioexam AG Switzerland Ord 100 100 Medizinische Laboratorien Dr. Toggweiler AG Switzerland Ord 100 100 Bioanalytica AG Switzerland Ord 100 100 HPP Ecobion SA Switzerland Ord 100 100 The Doctors Laboratory Limited United Kingdom Ord 100 100 TDL Analytical Limited United Kingdom Ord 100 100 TDL Facilities Limited United Kingdom Ord 100 100 TDL Genetics Limited United Kingdom Ord 100 100 NWLHT Analytical LLP United Kingdom 100 100 NWLHT Facilities LLP United Kingdom 100 100 Health Services Laboratories LLP United Kingdom 51 51 HSL (Nominee) Ltd United Kingdom Ord 51 51 HSL (Analytics) LLP United Kingdom 51 51 HSL (FM) LLP United Kingdom 51 51 Medlab Pathology Limited Ireland Ord 100 100
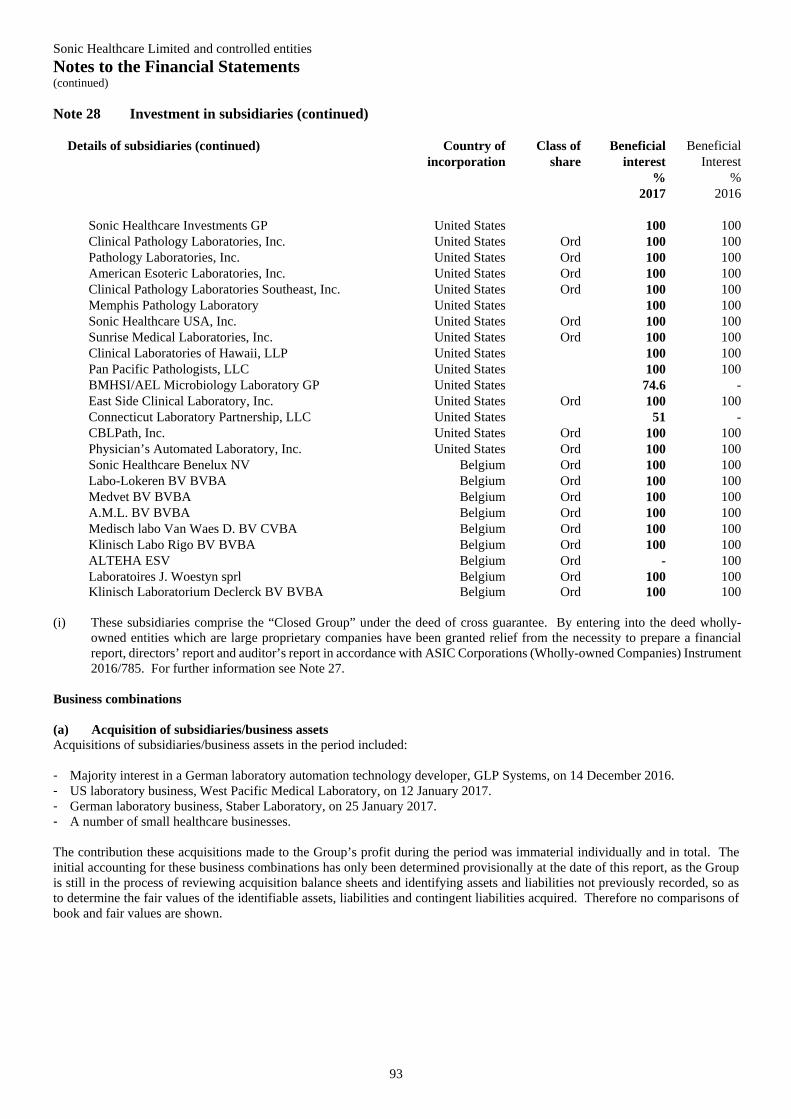
Sonic Healthcare Limited and controlled entities Notes to the Financial Statements (continued)
93
Note 28 Investment in subsidiaries (continued)
Details of subsidiaries (continued) Country of Class of Beneficial Beneficial incorporation share interest Interest % % 2017 2016 Sonic Healthcare Investments GP United States 100 100 Clinical Pathology Laboratories, Inc. United States Ord 100 100 Pathology Laboratories, Inc. United States Ord 100 100 American Esoteric Laboratories, Inc. United States Ord 100 100 Clinical Pathology Laboratories Southeast, Inc. United States Ord 100 100 Memphis Pathology Laboratory United States 100 100 Sonic Healthcare USA, Inc. United States Ord 100 100 Sunrise Medical Laboratories, Inc. United States Ord 100 100 Clinical Laboratories of Hawaii, LLP United States 100 100 Pan Pacific Pathologists, LLC United States 100 100 BMHSI/AEL Microbiology Laboratory GP United States 74.6 - East Side Clinical Laboratory, Inc. United States Ord 100 100 Connecticut Laboratory Partnership, LLC United States 51 - CBLPath, Inc. United States Ord 100 100 Physician’s Automated Laboratory, Inc. United States Ord 100 100 Sonic Healthcare Benelux NV Belgium Ord 100 100 Labo-Lokeren BV BVBA Belgium Ord 100 100 Medvet BV BVBA Belgium Ord 100 100 A.M.L. BV BVBA Belgium Ord 100 100 Medisch labo Van Waes D. BV CVBA Belgium Ord 100 100 Klinisch Labo Rigo BV BVBA Belgium Ord 100 100 ALTEHA ESV Belgium Ord - 100 Laboratoires J. Woestyn sprl Belgium Ord 100 100 Klinisch Laboratorium Declerck BV BVBA Belgium Ord 100 100
(i) These subsidiaries comprise the “Closed Group” under the deed of cross guarantee. By entering into the deed wholly-
owned entities which are large proprietary companies have been granted relief from the necessity to prepare a financial report, directors’ report and auditor’s report in accordance with ASIC Corporations (Wholly-owned Companies) Instrument 2016/785. For further information see Note 27.
Business combinations (a) Acquisition of subsidiaries/business assets Acquisitions of subsidiaries/business assets in the period included: - Majority interest in a German laboratory automation technology developer, GLP Systems, on 14 December 2016. - US laboratory business, West Pacific Medical Laboratory, on 12 January 2017. - German laboratory business, Staber Laboratory, on 25 January 2017. - A number of small healthcare businesses. The contribution these acquisitions made to the Group’s profit during the period was immaterial individually and in total. The initial accounting for these business combinations has only been determined provisionally at the date of this report, as the Group is still in the process of reviewing acquisition balance sheets and identifying assets and liabilities not previously recorded, so as to determine the fair values of the identifiable assets, liabilities and contingent liabilities acquired. Therefore no comparisons of book and fair values are shown.
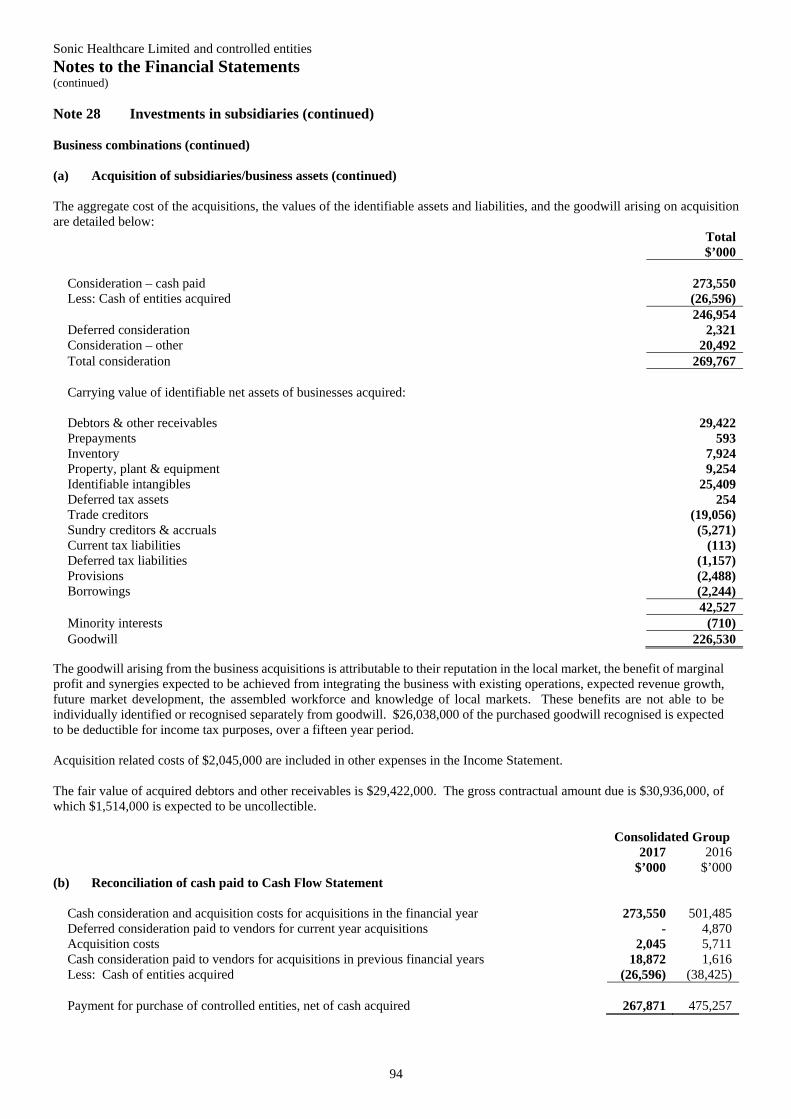
Sonic Healthcare Limited and controlled entities Notes to the Financial Statements (continued)
94
Note 28 Investments in subsidiaries (continued) Business combinations (continued) (a) Acquisition of subsidiaries/business assets (continued) The aggregate cost of the acquisitions, the values of the identifiable assets and liabilities, and the goodwill arising on acquisition are detailed below:
Total $’000
Consideration – cash paid 273,550 Less: Cash of entities acquired (26,596) 246,954 Deferred consideration 2,321 Consideration – other 20,492 Total consideration 269,767 Carrying value of identifiable net assets of businesses acquired: Debtors & other receivables 29,422 Prepayments 593 Inventory 7,924 Property, plant & equipment 9,254 Identifiable intangibles 25,409 Deferred tax assets 254 Trade creditors (19,056) Sundry creditors & accruals (5,271) Current tax liabilities (113) Deferred tax liabilities (1,157) Provisions (2,488) Borrowings (2,244) 42,527 Minority interests (710) Goodwill 226,530
The goodwill arising from the business acquisitions is attributable to their reputation in the local market, the benefit of marginal profit and synergies expected to be achieved from integrating the business with existing operations, expected revenue growth, future market development, the assembled workforce and knowledge of local markets. These benefits are not able to be individually identified or recognised separately from goodwill. $26,038,000 of the purchased goodwill recognised is expected to be deductible for income tax purposes, over a fifteen year period. Acquisition related costs of $2,045,000 are included in other expenses in the Income Statement. The fair value of acquired debtors and other receivables is $29,422,000. The gross contractual amount due is $30,936,000, of which $1,514,000 is expected to be uncollectible.
Consolidated Group 2017
$’000 2016
$’000 (b) Reconciliation of cash paid to Cash Flow Statement
Cash consideration and acquisition costs for acquisitions in the financial year 273,550 501,485 Deferred consideration paid to vendors for current year acquisitions - 4,870 Acquisition costs 2,045 5,711 Cash consideration paid to vendors for acquisitions in previous financial years 18,872 1,616 Less: Cash of entities acquired (26,596) (38,425) Payment for purchase of controlled entities, net of cash acquired 267,871 475,257
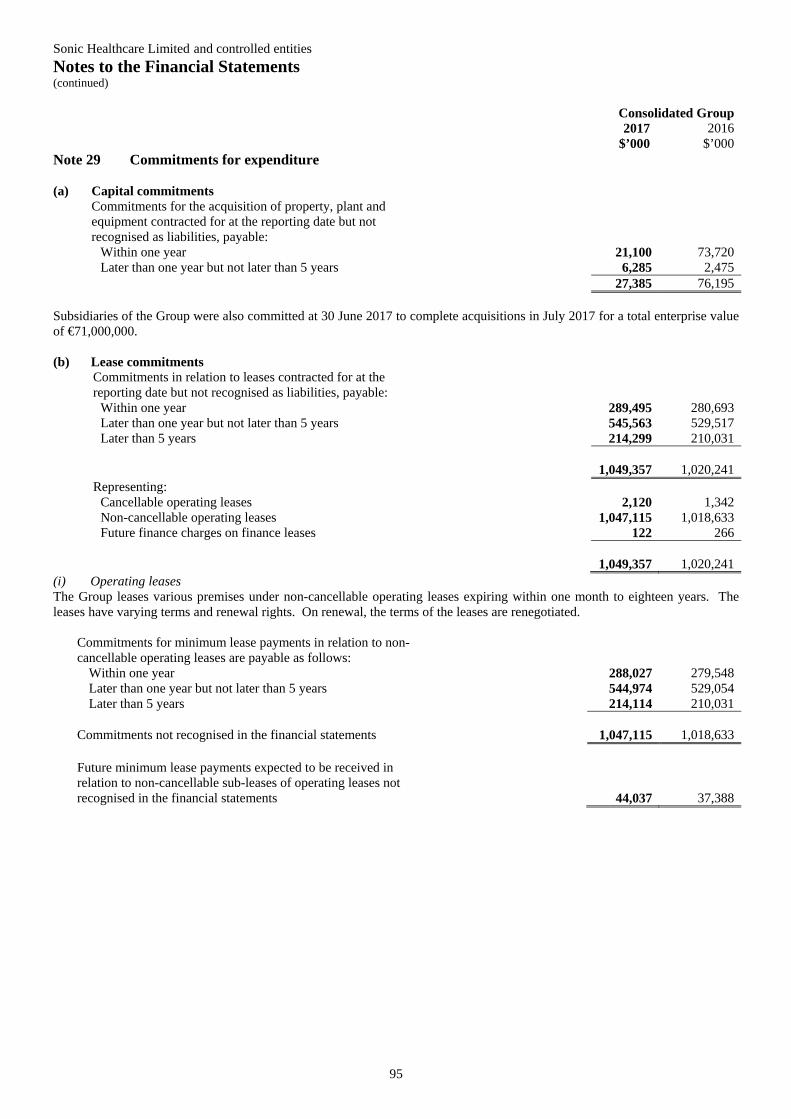
Sonic Healthcare Limited and controlled entities Notes to the Financial Statements (continued)
95
Consolidated Group 2017
$’000 2016
$’000 Note 29 Commitments for expenditure (a) Capital commitments
Commitments for the acquisition of property, plant and equipment contracted for at the reporting date but not recognised as liabilities, payable:
Within one year 21,100 73,720 Later than one year but not later than 5 years 6,285 2,475 27,385 76,195
Subsidiaries of the Group were also committed at 30 June 2017 to complete acquisitions in July 2017 for a total enterprise value of €71,000,000.
(b) Lease commitments
Commitments in relation to leases contracted for at the reporting date but not recognised as liabilities, payable:
Within one year 289,495 280,693 Later than one year but not later than 5 years 545,563 529,517 Later than 5 years 214,299 210,031
1,049,357
1,020,241 Representing: Cancellable operating leases 2,120 1,342 Non-cancellable operating leases 1,047,115 1,018,633 Future finance charges on finance leases 122 266
1,049,357
1,020,241 (i) Operating leases The Group leases various premises under non-cancellable operating leases expiring within one month to eighteen years. The leases have varying terms and renewal rights. On renewal, the terms of the leases are renegotiated.
Commitments for minimum lease payments in relation to non-cancellable operating leases are payable as follows:
Within one year 288,027 279,548 Later than one year but not later than 5 years 544,974 529,054 Later than 5 years 214,114 210,031 Commitments not recognised in the financial statements 1,047,115 1,018,633 Future minimum lease payments expected to be received in relation to non-cancellable sub-leases of operating leases not recognised in the financial statements 44,037 37,388
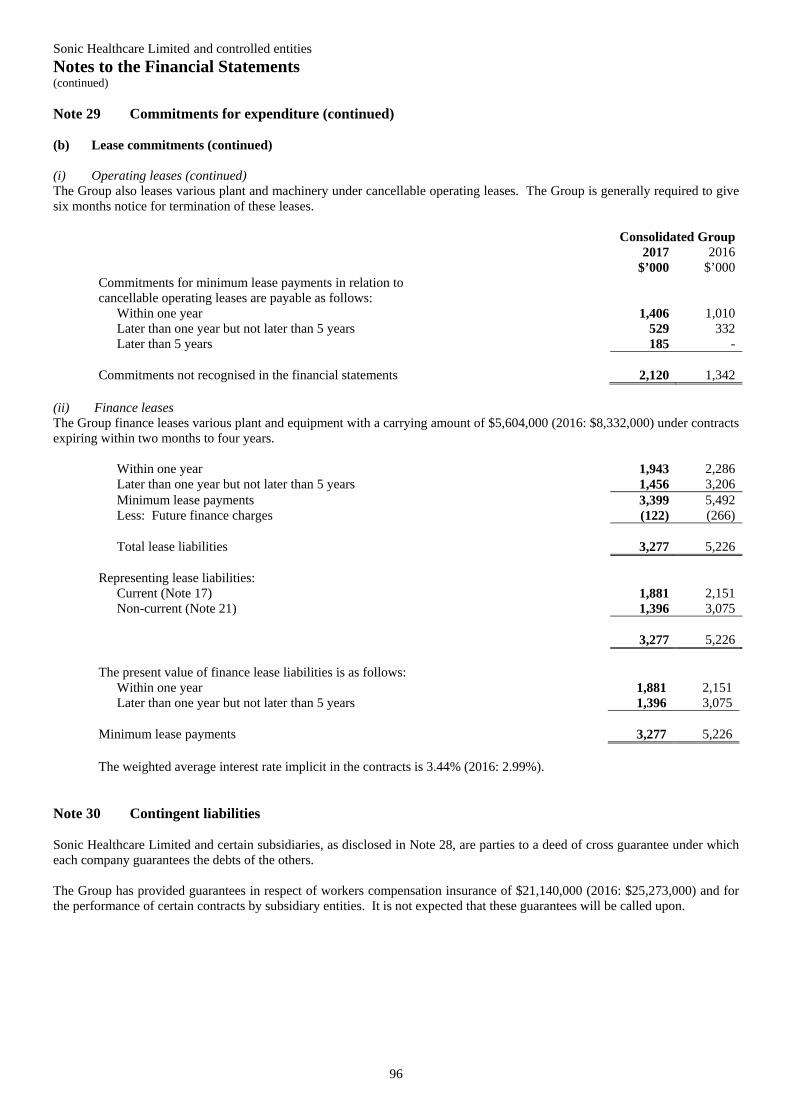
Sonic Healthcare Limited and controlled entities Notes to the Financial Statements (continued)
96
Note 29 Commitments for expenditure (continued) (b) Lease commitments (continued) (i) Operating leases (continued) The Group also leases various plant and machinery under cancellable operating leases. The Group is generally required to give six months notice for termination of these leases.
Consolidated Group 2017
$’000 2016
$’000 Commitments for minimum lease payments in relation to cancellable operating leases are payable as follows:
Within one year 1,406 1,010 Later than one year but not later than 5 years 529 332 Later than 5 years 185 - Commitments not recognised in the financial statements 2,120 1,342
(ii) Finance leases The Group finance leases various plant and equipment with a carrying amount of $5,604,000 (2016: $8,332,000) under contracts expiring within two months to four years.
Within one year 1,943 2,286 Later than one year but not later than 5 years 1,456 3,206 Minimum lease payments 3,399 5,492 Less: Future finance charges (122) (266) Total lease liabilities 3,277 5,226 Representing lease liabilities: Current (Note 17) 1,881 2,151 Non-current (Note 21) 1,396 3,075 3,277 5,226 The present value of finance lease liabilities is as follows:
Within one year 1,881 2,151 Later than one year but not later than 5 years 1,396 3,075 Minimum lease payments 3,277 5,226 The weighted average interest rate implicit in the contracts is 3.44% (2016: 2.99%).
Note 30 Contingent liabilities Sonic Healthcare Limited and certain subsidiaries, as disclosed in Note 28, are parties to a deed of cross guarantee under which each company guarantees the debts of the others. The Group has provided guarantees in respect of workers compensation insurance of $21,140,000 (2016: $25,273,000) and for the performance of certain contracts by subsidiary entities. It is not expected that these guarantees will be called upon.
Sonic Healthcare Limited and controlled entities Notes to the Financial Statements (continued)
97
Consolidated Group 2017
$’000 2016
$’000 Note 31 Secured borrowings The total secured liabilities (current and non-current) are as follows:
Lease liabilities 3,277 5,226
Assets pledged as security Lease liabilities are effectively secured as the rights to the relevant assets revert to the lessor/lender in the event of default. The carrying amounts of assets pledged as security for current and non-current borrowings are:
Consolidated Group 2017
$’000 2016
$’000 Non-current Finance lease & hire purchase agreements Property, plant and equipment 5,604 8,332
Consolidated Group 2017
$ 2016
$ Note 32 Remuneration of auditors
During the year the auditors of the Group and their related practices earned the following remuneration:
PricewaterhouseCoopers – Australian firm Audit and review of financial reports of Group entities 788,695 754,736 Taxation and accounting services 180,000 50,871 Total audit, taxation and accounting services 968,695 805,607 Related practices of PricewaterhouseCoopers Australian firm (including overseas PricewaterhouseCoopers firms)
Audit and review of the financial reports of Group entities 1,197,126 1,145,540 Taxation and accounting services 99,480 88,798 Total audit, taxation and accounting services 1,296,606 1,234,338
Non PricewaterhouseCoopers audit firms Audit and review of financial reports of Group entities 439,791 500,486
The non-audit services provided are not considered to be of a nature which could give rise to a conflict of interest or loss of independence for the external auditors.
Sonic Healthcare Limited and controlled entities Notes to the Financial Statements (continued)
98
Note 33 Share based payments Share based payments relating to remuneration The Group has several equity-settled share based compensation plans for executives and employees. The fair value of equity remuneration granted under the various plans is recognised as an expense with a corresponding increase in equity. The fair value is measured at grant date and recognised over the period during which the employees become unconditionally entitled to shares and options (“the vesting period”). Details of the pricing model and the measurement inputs utilised to determine the fair value of shares and options granted are disclosed in Note 1(q) to the financial statements. (i) Sonic Healthcare Limited Employee Option Plan Options are granted under the Sonic Healthcare Limited Employee Option Plan for no consideration. Options granted are able to be exercised subject to the following vesting periods unless otherwise specified: - Up to 50% may be exercised after 30 months from the date of grant - Up to 75% may be exercised after 42 months from the date of grant - Up to 100% may be exercised after 54 months from the date of grant Options granted under the plan expire after 58 months (unless otherwise specified) and carry no dividend or voting rights. When exercisable, each option is convertible into one ordinary share. No option holder has any right under the options to participate in any other share issue of the Company or of any other entity. The grants of options on 2 July 2012, 18 October 2013, 13 December 2013 and 11 December 2015 are subject to different vesting and expiry periods. Options granted on 2 July 2012 are exercisable from 2 July 2017 until expiry on 2 July 2019. Options granted on 18 October 2013 are exercisable from 18 October 2016 until expiry on 18 October 2018. For the options granted on 13 December 2013 up to 600,000 options are exercisable from 13 December 2016 until expiry on 13 December 2018. For the options granted on 11 December 2015 a third are exercisable after 11 June 2018, two thirds after 11 June 2019 and up to 100% after 11 June 2020 subject to satisfying vesting conditions. Executive Long Term Incentives The following options and performance rights were granted under Long Term Incentive (‘LTI’) arrangements for Dr C.S. Goldschmidt and C.D. Wilks. Vesting is subject to challenging performance conditions, details of which are set out in the Remuneration Report.
Grant Date Options Performance Rights
Earliest Vesting Date*
Performance conditions measurement period
Expiry date
18 November 2011 1,341,058 141,732 18 November 2014 3 years to 30 June 2014 18 November 2016 18 November 2011 1,302,350 141,732 18 November 2015 4 years to 30 June 2015 18 November 2017 18 November 2011 1,705,263 188,976 18 November 2016 5 years to 30 June 2016 18 November 2018 27 November 2014 706,108 100,085 27 November 2017 3 years to 30 June 2017 27 November 2019 20 November 2015 766,969 91,988 20 November 2018 3 years to 30 June 2018 20 November 2020 17 November 2016 671,089 87,843 17 November 2019 3 years to 30 June 2019 17 November 2021
* Options can only vest when the market price of Sonic shares is higher than the exercise price. Of the options and performance rights granted on 18 November 2011, 2,516,198 options and 275,906 performance rights (58% of each) were forfeited as the performance conditions were not satisfied. Of the options and performance rights granted on 27 November 2014, 456,039 options and 64,640 performance rights (65% of each) were forfeited as the performance conditions were not satisfied. Sonic Healthcare ordinary shares to be awarded on exercise/conversion of the options and performance rights may be satisfied by the issue of new shares or the purchase of shares on-market.
Sonic Healthcare Limited and controlled entities Notes to the Financial Statements (continued)
99
Note 33 Share based payments (continued) Share based payments relating to remuneration (continued) (i) Sonic Healthcare Limited Employee Option Plan (continued) Set out below are summaries of options granted under the plan.
Grant date
Expiry date
Exerciseprice
Balance at start of
the year
Granted during the
year
Forfeited during
the year
Exercised during
the year
Expired during
the year
Balance at end of the year
Exercis-able at end of the year
Balance at date of this
report
Number
Number
Number
Number
Number
Number
Number
Number Consolidated Group - 2017
18/11/11 18/11/16 $11.43 584,406 - - (584,406) - - - - 18/11/11 18/11/17 $11.43 651,126 - - - - 651,126 651,126 - 18/11/11 18/11/18 $11.43 1,705,263 - (1,108,422) - - 596,841 596,841 596,841 20/02/12 20/12/16 $11.14 150,000 - - (150,000) - - - - 07/03/12 07/03/19 $11.14 1,000,000 - - (1,000,000) - - - - 02/07/12 02/07/19 $12.57 125,000 - - - - 125,000 - 105,000 18/10/13 18/10/18 $15.43 320,000 - - (135,000) - 185,000 185,000 165,000 13/12/13 13/12/18 $15.21 600,000 - (100,000) (425,000) - 75,000 75,000 75,000 27/11/14 27/11/19 $17.32 706,108 - - - - 706,108 - 250,069 30/01/15 30/11/19 $18.84 750,000 - - - - 750,000 - 690,000 20/10/15 20/08/20 $18.49 925,000 - - - - 925,000 - 925,000 20/11/15 20/11/20 $19.41 766,969 - - - - 766,969 - 766,969 11/12/15 11/10/20 $19.78 2,200,000 - (46,667) - - 2,153,333 - 2,103,333 17/11/16 17/09/21 $21.62 - 800,000 - - - 800,000 - 800,000 17/11/16 17/09/21 $22.02 - 200,000 - - - 200,000 - 200,000 17/11/16 17/11/21 $21.62 - 671,089 - - - 671,089 - 671,089 05/07/17 05/05/22 $23.34 - - - - - - - 1,000,000
Total
10,483,872
1,671,089
(1,255,089)
(2,294,406)
-
8,605,466
1,507,967
8,348,301
Weighted average exercise price $15.64 $21.67 $12.04 $12.22 - $18.24 $12.11
Grant
date Expiry
date Exercise
priceBalance at
start of the year
Granted during the
year
Forfeited during
the year
Exercised during
the year
Expired during
the year
Balance at end of the year
Exercis-able at end of the year
Number
Number
Number
Number
Number
Number
Number
Consolidated Group - 2016
03/03/11 03/01/16 $11.13 242,500 - (12,500) (230,000) - - - 18/11/11 18/11/16 $11.43 584,406 - - - - 584,406 584,406 18/11/11 18/11/17 $11.43 1,302,250 - (651,124) - - 651,126 651,126 18/11/11 18/11/18 $11.43 1,705,263 - - - - 1,705,263 - 20/02/12 20/12/16 $11.14 300,000 - - (150,000) - 150,000 - 07/03/12 07/03/19 $11.14 1,000,000 - - - - 1,000,000 - 02/07/12 02/07/19 $12.57 125,000 - - - - 125,000 - 18/10/13 18/10/18 $15.43 335,000 - (15,000) - - 320,000 - 13/12/13 13/12/18 $15.21 600,000 - - - - 600,000 - 27/11/14 27/11/19 $17.32 706,108 - - - - 706,108 - 30/01/15 30/11/19 $18.84 1,000,000 - (250,000) - - 750,000 - 20/10/15 20/08/20 $18.49 - 1,000,000 (75,000) - - 925,000 - 20/11/15 20/11/20 $19.41 - 766,969 - - - 766,969 - 11/12/15 11/10/20 $19.78 - 2,200,000 - - - 2,200,000 -
Total
7,900,527
3,966,969
(1,003,624)
(380,000)
-
10,483,872
1,235,532
Weighted average exercise price $13.31 $19.38 $13.86 $11.13 - $15.64 $11.43
The weighted average share price at the date of exercise for options exercised in the 2017 year was $21.89 (2016: $18.86). The weighted average remaining contractual life of share options on issue at the end of the year was 2.9 years (2016: 3.1 years). Fair value of options granted The average assessed fair value of options granted during the year ended 30 June 2017 was $2.28 per option (2016: $1.61).
Sonic Healthcare Limited and controlled entities Notes to the Financial Statements (continued)
100
Note 33 Share based payments (continued) Share based payments relating to remuneration (continued) (i) Sonic Healthcare Limited Employee Option Plan (continued) The valuation model inputs for options granted during the years ending 30 June 2017 and 30 June 2016 include:
Grant date
Expiry date
Exercise price
Share price at time of
grant
Expected life (years from
date of issue)
Share price volatility (based on 3 year
historic prices)
Risk free rate
Dividend yield
20/10/15 20/08/20 $18.49 $18.51 4.0 17.0% 2.0% 4.3% 20/11/15 20/11/20 $19.41 $19.41 4.0 17.0% 2.4% 4.5% 11/12/15 11/10/20 $19.78 $19.78 4.2 17.1% 2.4% 4.5% 17/11/16 17/09/21 $21.62 $21.62 4.0 19.9% 1.9% 3.9% 17/11/16 17/09/21 $22.02 $21.62 4.0 19.9% 1.9% 3.9% 17/11/16 17/11/21 $21.62 $21.62 4.0 19.9% 1.9% 3.9%
A Monte Carlo simulation was applied to fair value the relative Total Shareholder Return (“TSR”) performance condition element of the options granted. The model simulated Sonic’s TSR and compared it against the peer group over the vesting periods. (ii) Sonic Healthcare Limited Performance Rights Plan Performance rights are granted under the Sonic Healthcare Limited Performance Rights Plan for no consideration and carry no dividend or voting rights. When exercisable, each performance right is convertible into one ordinary share. No rights holder has any right to participate in any other share issue of the Company or of any other entity.
Grant date
Expiry date
Exercise price
Balance at start
of the year
Granted during
the year
Forfeitedduring
the year
Exercised during
the year
Expired during
the year
Balance at end of the year
Exercis-able at end of the year
Balance at date of
this report
Consolidated Group - 2017 18/11/11 18/11/18 Nil 188,976 - (122,835) (66,141) - - - - 27/11/14 27/11/19 Nil 100,085 - - - - 100,085 - 35,445 20/11/15 20/11/20 Nil 91,988 - - - - 91,988 - 91,988 17/11/16 03/10/17 Nil - 2,480 - (2,480) - - - - 17/11/16 17/11/21 Nil - 87,843 - - - 87,843 - 87,843
Total
381,049
90,323
(122,835)
(68,621)
-
279,916
-
215,276
Consolidated Group - 2016
18/11/11 18/11/16 Nil 59,527 - - (59,527) - - - 18/11/11 18/11/17 Nil 141,732 - (70,866) (70,866) - - - 18/11/11 18/11/18 Nil 188,976 - - - - 188,976 - 27/11/14 27/11/19 Nil 100,085 - - - - 100,085 - 20/11/15 20/11/20 Nil - 91,988 - - - 91,988 - 11/12/15 04/10/16 Nil - 1,829 - (1,829) - - -
Total
490,320
93,817
(70,866)
(132,222)
-
381,049
-
The weighted average remaining contractual life of performance rights on issue at the end of the year was 3.3 years (2016: 3.1 years). Fair value of rights granted The average assessed fair value of rights granted during the year ended 30 June 2017 was $14.92 per right (2016: $13.12).
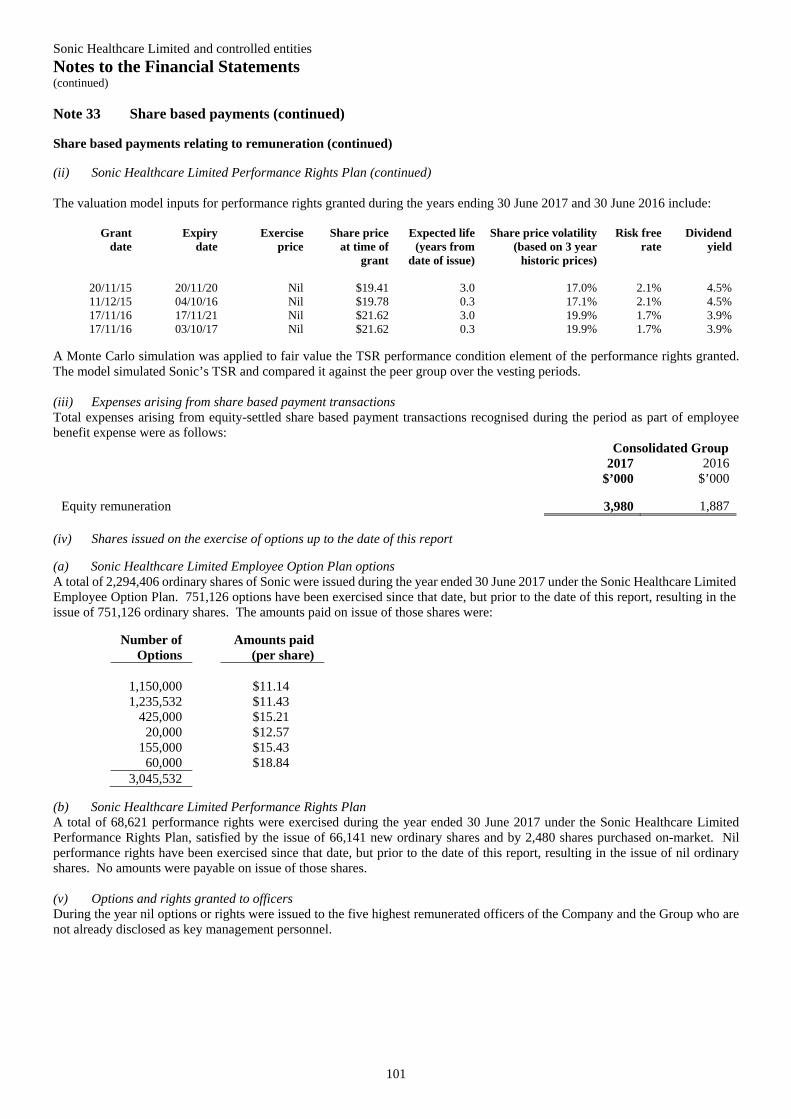
Sonic Healthcare Limited and controlled entities Notes to the Financial Statements (continued)
101
Note 33 Share based payments (continued) Share based payments relating to remuneration (continued) (ii) Sonic Healthcare Limited Performance Rights Plan (continued) The valuation model inputs for performance rights granted during the years ending 30 June 2017 and 30 June 2016 include:
Grant date
Expiry date
Exercise price
Share price at time of
grant
Expected life (years from
date of issue)
Share price volatility (based on 3 year
historic prices)
Risk free rate
Dividend yield
20/11/15 20/11/20 Nil $19.41 3.0 17.0% 2.1% 4.5% 11/12/15 04/10/16 Nil $19.78 0.3 17.1% 2.1% 4.5% 17/11/16 17/11/21 Nil $21.62 3.0 19.9% 1.7% 3.9% 17/11/16 03/10/17 Nil $21.62 0.3 19.9% 1.7% 3.9%
A Monte Carlo simulation was applied to fair value the TSR performance condition element of the performance rights granted. The model simulated Sonic’s TSR and compared it against the peer group over the vesting periods. (iii) Expenses arising from share based payment transactions Total expenses arising from equity-settled share based payment transactions recognised during the period as part of employee benefit expense were as follows:
Consolidated Group 2017
$’000 2016
$’000
Equity remuneration
3,980
1,887 (iv) Shares issued on the exercise of options up to the date of this report
(a) Sonic Healthcare Limited Employee Option Plan options A total of 2,294,406 ordinary shares of Sonic were issued during the year ended 30 June 2017 under the Sonic Healthcare Limited Employee Option Plan. 751,126 options have been exercised since that date, but prior to the date of this report, resulting in the issue of 751,126 ordinary shares. The amounts paid on issue of those shares were:
Number of Options
Amounts paid (per share)
1,150,000 $11.14 1,235,532 $11.43
425,000 $15.21 20,000 $12.57
155,000 $15.43 60,000 $18.84
3,045,532
(b) Sonic Healthcare Limited Performance Rights Plan A total of 68,621 performance rights were exercised during the year ended 30 June 2017 under the Sonic Healthcare Limited Performance Rights Plan, satisfied by the issue of 66,141 new ordinary shares and by 2,480 shares purchased on-market. Nil performance rights have been exercised since that date, but prior to the date of this report, resulting in the issue of nil ordinary shares. No amounts were payable on issue of those shares. (v) Options and rights granted to officers During the year nil options or rights were issued to the five highest remunerated officers of the Company and the Group who are not already disclosed as key management personnel.
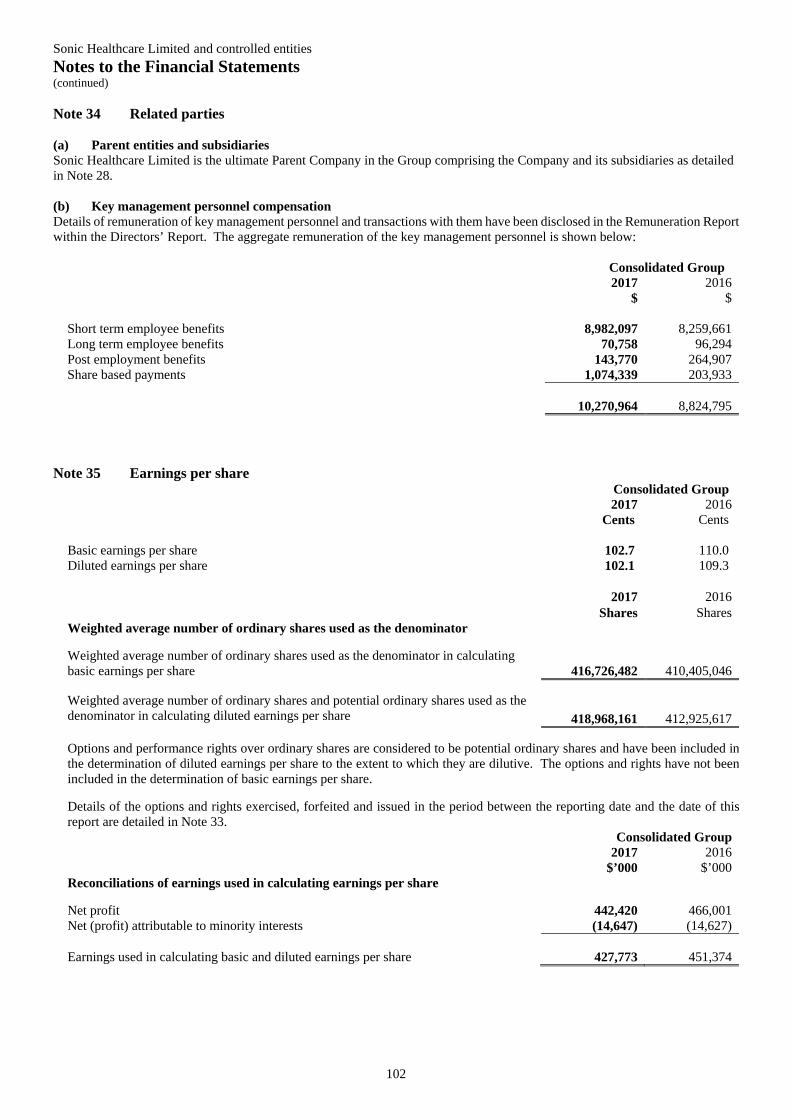
Sonic Healthcare Limited and controlled entities Notes to the Financial Statements (continued)
102
Note 34 Related parties (a) Parent entities and subsidiaries
Sonic Healthcare Limited is the ultimate Parent Company in the Group comprising the Company and its subsidiaries as detailed in Note 28.
(b) Key management personnel compensation Details of remuneration of key management personnel and transactions with them have been disclosed in the Remuneration Report within the Directors’ Report. The aggregate remuneration of the key management personnel is shown below:
Consolidated Group 2017
$ 2016
$ Short term employee benefits 8,982,097 8,259,661 Long term employee benefits 70,758 96,294 Post employment benefits 143,770 264,907 Share based payments 1,074,339 203,933
10,270,964
8,824,795
Note 35 Earnings per share
Consolidated Group 2017
Cents 2016
Cents Basic earnings per share 102.7 110.0 Diluted earnings per share 102.1 109.3
2017 2016 Shares Shares Weighted average number of ordinary shares used as the denominator
Weighted average number of ordinary shares used as the denominator in calculating basic earnings per share
416,726,482
410,405,046
Weighted average number of ordinary shares and potential ordinary shares used as the denominator in calculating diluted earnings per share
418,968,161
412,925,617
Options and performance rights over ordinary shares are considered to be potential ordinary shares and have been included inthe determination of diluted earnings per share to the extent to which they are dilutive. The options and rights have not beenincluded in the determination of basic earnings per share.
Details of the options and rights exercised, forfeited and issued in the period between the reporting date and the date of thisreport are detailed in Note 33. Consolidated Group 2017 2016 $’000 $’000 Reconciliations of earnings used in calculating earnings per share
Net profit 442,420 466,001 Net (profit) attributable to minority interests (14,647) (14,627) Earnings used in calculating basic and diluted earnings per share
427,773
451,374
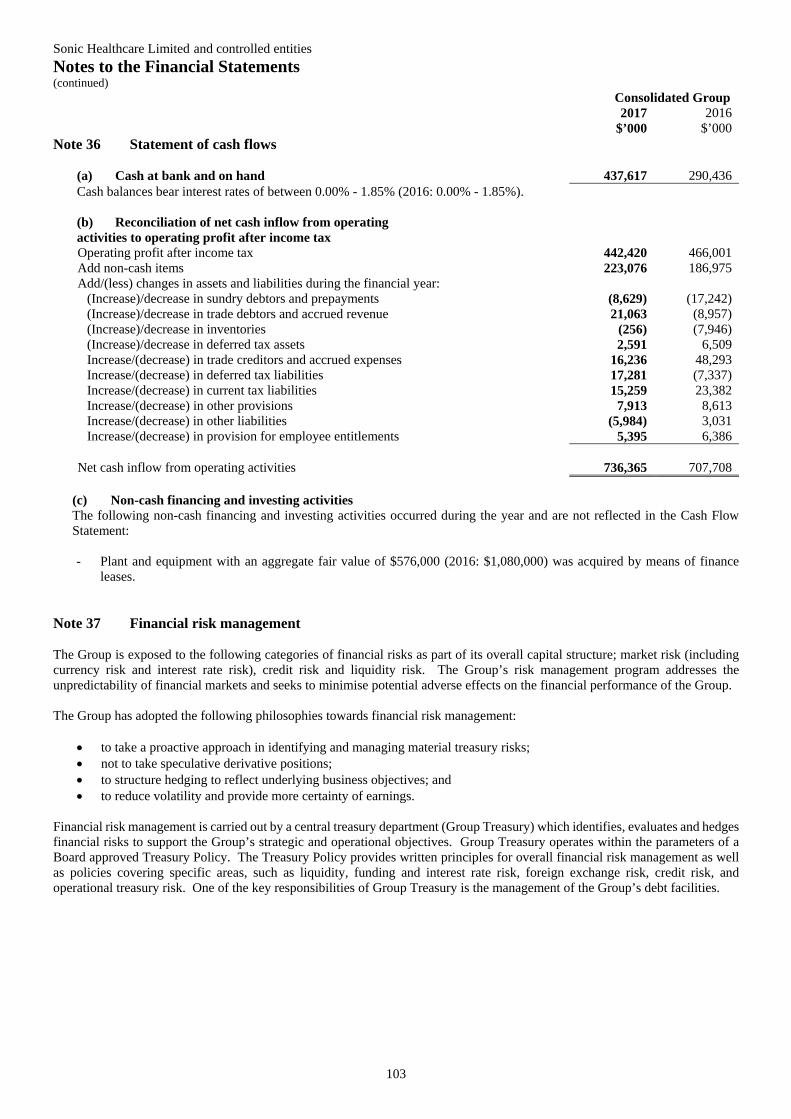
Sonic Healthcare Limited and controlled entities Notes to the Financial Statements (continued)
103
Consolidated Group 2017
$’000 2016
$’000 Note 36 Statement of cash flows
(a) Cash at bank and on hand 437,617 290,436 Cash balances bear interest rates of between 0.00% - 1.85% (2016: 0.00% - 1.85%). (b) Reconciliation of net cash inflow from operating activities to operating profit after income tax
Operating profit after income tax 442,420 466,001 Add non-cash items 223,076 186,975 Add/(less) changes in assets and liabilities during the financial year: (Increase)/decrease in sundry debtors and prepayments (8,629) (17,242) (Increase)/decrease in trade debtors and accrued revenue 21,063 (8,957) (Increase)/decrease in inventories (256) (7,946) (Increase)/decrease in deferred tax assets 2,591 6,509 Increase/(decrease) in trade creditors and accrued expenses 16,236 48,293 Increase/(decrease) in deferred tax liabilities 17,281 (7,337) Increase/(decrease) in current tax liabilities 15,259 23,382 Increase/(decrease) in other provisions 7,913 8,613 Increase/(decrease) in other liabilities (5,984) 3,031 Increase/(decrease) in provision for employee entitlements 5,395 6,386 Net cash inflow from operating activities 736,365 707,708
(c) Non-cash financing and investing activities The following non-cash financing and investing activities occurred during the year and are not reflected in the Cash Flow Statement: - Plant and equipment with an aggregate fair value of $576,000 (2016: $1,080,000) was acquired by means of finance
leases. Note 37 Financial risk management The Group is exposed to the following categories of financial risks as part of its overall capital structure; market risk (including currency risk and interest rate risk), credit risk and liquidity risk. The Group’s risk management program addresses the unpredictability of financial markets and seeks to minimise potential adverse effects on the financial performance of the Group. The Group has adopted the following philosophies towards financial risk management:
to take a proactive approach in identifying and managing material treasury risks; not to take speculative derivative positions; to structure hedging to reflect underlying business objectives; and to reduce volatility and provide more certainty of earnings.
Financial risk management is carried out by a central treasury department (Group Treasury) which identifies, evaluates and hedges financial risks to support the Group’s strategic and operational objectives. Group Treasury operates within the parameters of a Board approved Treasury Policy. The Treasury Policy provides written principles for overall financial risk management as well as policies covering specific areas, such as liquidity, funding and interest rate risk, foreign exchange risk, credit risk, and operational treasury risk. One of the key responsibilities of Group Treasury is the management of the Group’s debt facilities.
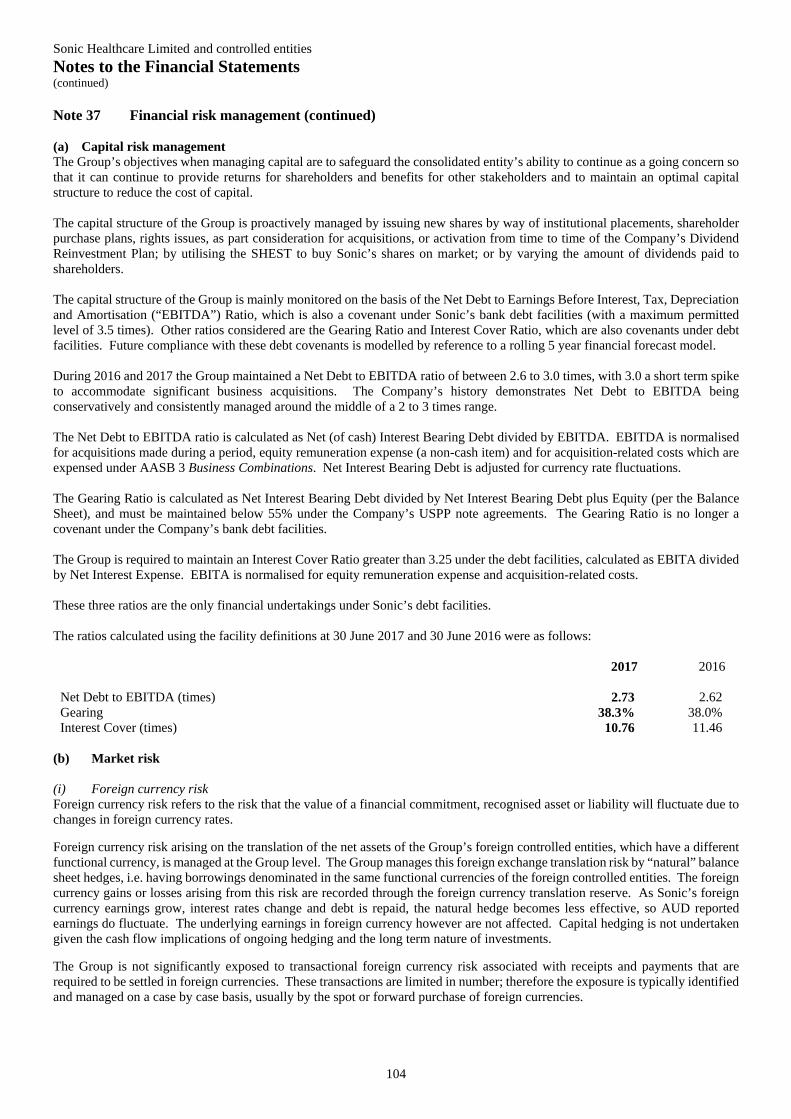
Sonic Healthcare Limited and controlled entities Notes to the Financial Statements (continued)
104
Note 37 Financial risk management (continued)
(a) Capital risk management The Group’s objectives when managing capital are to safeguard the consolidated entity’s ability to continue as a going concern so that it can continue to provide returns for shareholders and benefits for other stakeholders and to maintain an optimal capital structure to reduce the cost of capital. The capital structure of the Group is proactively managed by issuing new shares by way of institutional placements, shareholder purchase plans, rights issues, as part consideration for acquisitions, or activation from time to time of the Company’s Dividend Reinvestment Plan; by utilising the SHEST to buy Sonic’s shares on market; or by varying the amount of dividends paid to shareholders. The capital structure of the Group is mainly monitored on the basis of the Net Debt to Earnings Before Interest, Tax, Depreciation and Amortisation (“EBITDA”) Ratio, which is also a covenant under Sonic’s bank debt facilities (with a maximum permitted level of 3.5 times). Other ratios considered are the Gearing Ratio and Interest Cover Ratio, which are also covenants under debt facilities. Future compliance with these debt covenants is modelled by reference to a rolling 5 year financial forecast model. During 2016 and 2017 the Group maintained a Net Debt to EBITDA ratio of between 2.6 to 3.0 times, with 3.0 a short term spike to accommodate significant business acquisitions. The Company’s history demonstrates Net Debt to EBITDA being conservatively and consistently managed around the middle of a 2 to 3 times range. The Net Debt to EBITDA ratio is calculated as Net (of cash) Interest Bearing Debt divided by EBITDA. EBITDA is normalised for acquisitions made during a period, equity remuneration expense (a non-cash item) and for acquisition-related costs which are expensed under AASB 3 Business Combinations. Net Interest Bearing Debt is adjusted for currency rate fluctuations. The Gearing Ratio is calculated as Net Interest Bearing Debt divided by Net Interest Bearing Debt plus Equity (per the Balance Sheet), and must be maintained below 55% under the Company’s USPP note agreements. The Gearing Ratio is no longer a covenant under the Company’s bank debt facilities. The Group is required to maintain an Interest Cover Ratio greater than 3.25 under the debt facilities, calculated as EBITA divided by Net Interest Expense. EBITA is normalised for equity remuneration expense and acquisition-related costs. These three ratios are the only financial undertakings under Sonic’s debt facilities. The ratios calculated using the facility definitions at 30 June 2017 and 30 June 2016 were as follows:
2017
2016
Net Debt to EBITDA (times) 2.73 2.62 Gearing 38.3% 38.0% Interest Cover (times) 10.76 11.46
(b) Market risk (i) Foreign currency risk Foreign currency risk refers to the risk that the value of a financial commitment, recognised asset or liability will fluctuate due to changes in foreign currency rates.
Foreign currency risk arising on the translation of the net assets of the Group’s foreign controlled entities, which have a different functional currency, is managed at the Group level. The Group manages this foreign exchange translation risk by “natural” balance sheet hedges, i.e. having borrowings denominated in the same functional currencies of the foreign controlled entities. The foreign currency gains or losses arising from this risk are recorded through the foreign currency translation reserve. As Sonic’s foreign currency earnings grow, interest rates change and debt is repaid, the natural hedge becomes less effective, so AUD reported earnings do fluctuate. The underlying earnings in foreign currency however are not affected. Capital hedging is not undertaken given the cash flow implications of ongoing hedging and the long term nature of investments.
The Group is not significantly exposed to transactional foreign currency risk associated with receipts and payments that are required to be settled in foreign currencies. These transactions are limited in number; therefore the exposure is typically identified and managed on a case by case basis, usually by the spot or forward purchase of foreign currencies.
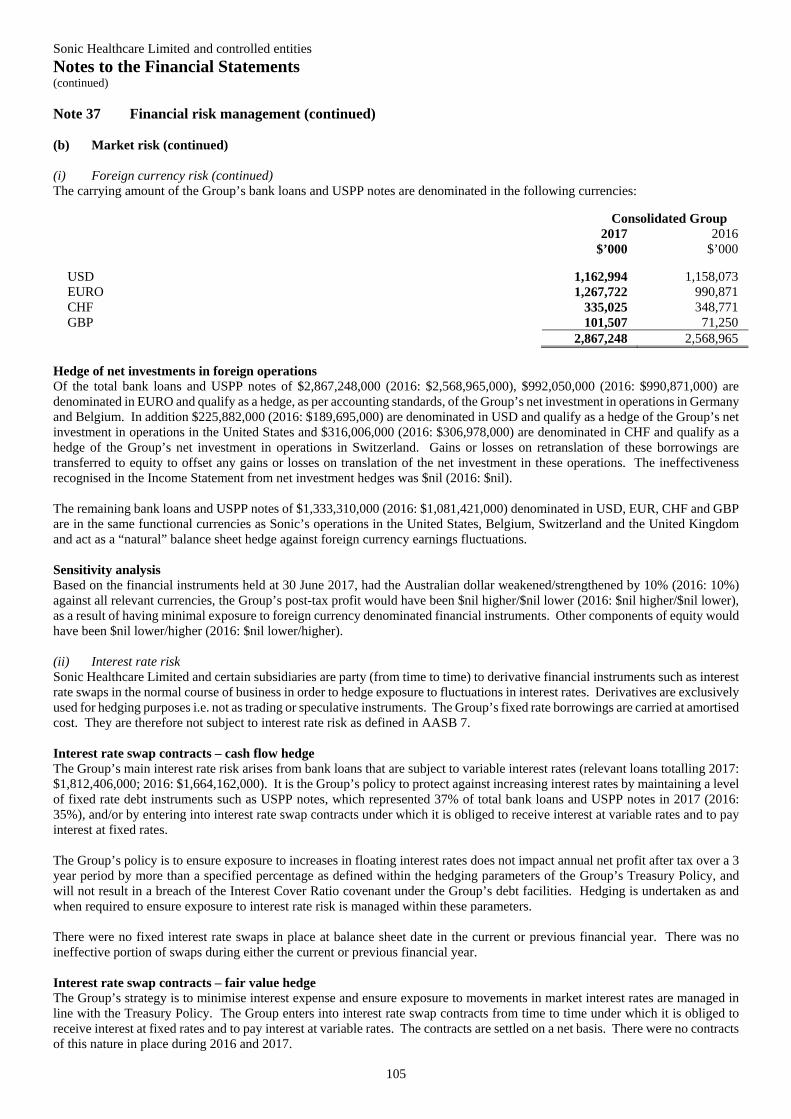
Sonic Healthcare Limited and controlled entities Notes to the Financial Statements (continued)
105
Note 37 Financial risk management (continued) (b) Market risk (continued) (i) Foreign currency risk (continued) The carrying amount of the Group’s bank loans and USPP notes are denominated in the following currencies:
Consolidated Group 2017
$’000 2016
$’000
USD 1,162,994 1,158,073 EURO 1,267,722 990,871 CHF 335,025 348,771 GBP 101,507 71,250 2,867,248 2,568,965
Hedge of net investments in foreign operations Of the total bank loans and USPP notes of $2,867,248,000 (2016: $2,568,965,000), $992,050,000 (2016: $990,871,000) are denominated in EURO and qualify as a hedge, as per accounting standards, of the Group’s net investment in operations in Germany and Belgium. In addition $225,882,000 (2016: $189,695,000) are denominated in USD and qualify as a hedge of the Group’s net investment in operations in the United States and $316,006,000 (2016: $306,978,000) are denominated in CHF and qualify as a hedge of the Group’s net investment in operations in Switzerland. Gains or losses on retranslation of these borrowings are transferred to equity to offset any gains or losses on translation of the net investment in these operations. The ineffectiveness recognised in the Income Statement from net investment hedges was $nil (2016: $nil). The remaining bank loans and USPP notes of $1,333,310,000 (2016: $1,081,421,000) denominated in USD, EUR, CHF and GBP are in the same functional currencies as Sonic’s operations in the United States, Belgium, Switzerland and the United Kingdom and act as a “natural” balance sheet hedge against foreign currency earnings fluctuations. Sensitivity analysis Based on the financial instruments held at 30 June 2017, had the Australian dollar weakened/strengthened by 10% (2016: 10%) against all relevant currencies, the Group’s post-tax profit would have been $nil higher/$nil lower (2016: $nil higher/$nil lower), as a result of having minimal exposure to foreign currency denominated financial instruments. Other components of equity would have been $nil lower/higher (2016: $nil lower/higher). (ii) Interest rate risk Sonic Healthcare Limited and certain subsidiaries are party (from time to time) to derivative financial instruments such as interest rate swaps in the normal course of business in order to hedge exposure to fluctuations in interest rates. Derivatives are exclusively used for hedging purposes i.e. not as trading or speculative instruments. The Group’s fixed rate borrowings are carried at amortised cost. They are therefore not subject to interest rate risk as defined in AASB 7. Interest rate swap contracts – cash flow hedge The Group’s main interest rate risk arises from bank loans that are subject to variable interest rates (relevant loans totalling 2017: $1,812,406,000; 2016: $1,664,162,000). It is the Group’s policy to protect against increasing interest rates by maintaining a level of fixed rate debt instruments such as USPP notes, which represented 37% of total bank loans and USPP notes in 2017 (2016: 35%), and/or by entering into interest rate swap contracts under which it is obliged to receive interest at variable rates and to pay interest at fixed rates. The Group’s policy is to ensure exposure to increases in floating interest rates does not impact annual net profit after tax over a 3 year period by more than a specified percentage as defined within the hedging parameters of the Group’s Treasury Policy, and will not result in a breach of the Interest Cover Ratio covenant under the Group’s debt facilities. Hedging is undertaken as and when required to ensure exposure to interest rate risk is managed within these parameters. There were no fixed interest rate swaps in place at balance sheet date in the current or previous financial year. There was no ineffective portion of swaps during either the current or previous financial year. Interest rate swap contracts – fair value hedge The Group’s strategy is to minimise interest expense and ensure exposure to movements in market interest rates are managed in line with the Treasury Policy. The Group enters into interest rate swap contracts from time to time under which it is obliged to receive interest at fixed rates and to pay interest at variable rates. The contracts are settled on a net basis. There were no contracts of this nature in place during 2016 and 2017.
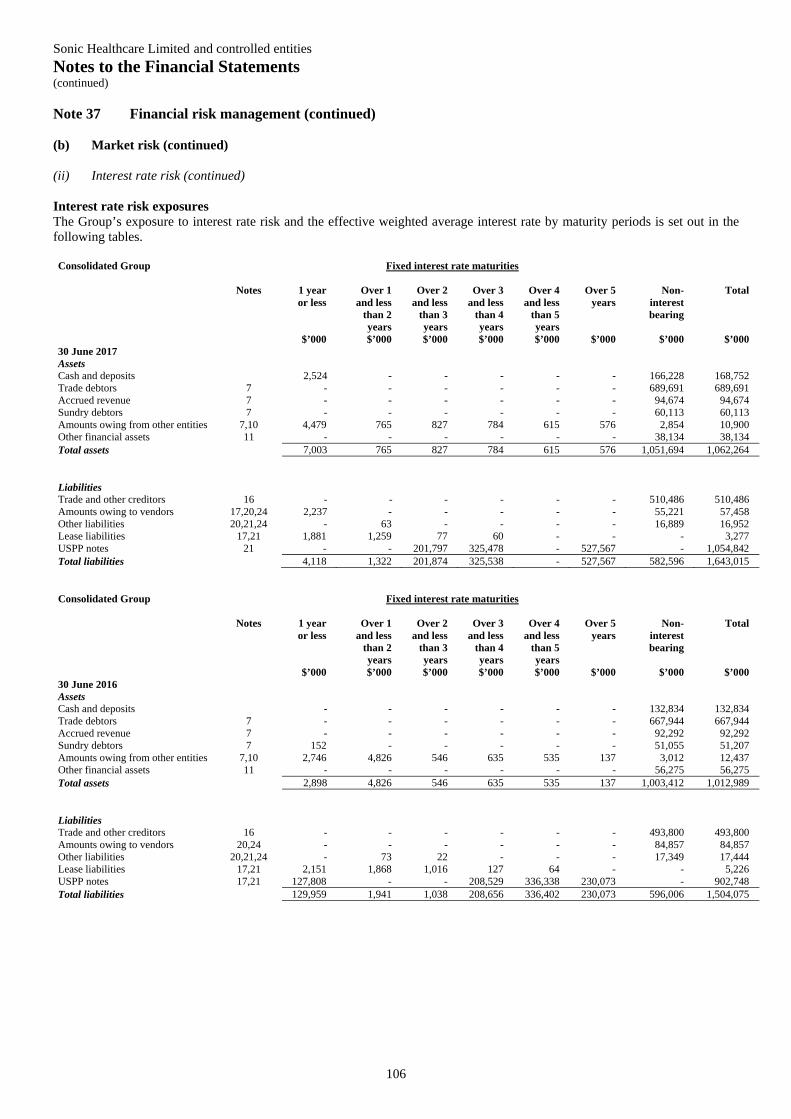
Sonic Healthcare Limited and controlled entities Notes to the Financial Statements (continued)
106
Note 37 Financial risk management (continued) (b) Market risk (continued) (ii) Interest rate risk (continued) Interest rate risk exposures The Group’s exposure to interest rate risk and the effective weighted average interest rate by maturity periods is set out in the following tables. Consolidated Group Fixed interest rate maturities
Notes 1 year or less
Over 1 and less
than 2 years
Over 2 and less
than 3 years
Over 3 and less
than 4 years
Over 4 and less
than 5 years
Over 5 years
Non-interest bearing
Total
$’000 $’000 $’000 $’000 $’000 $’000 $’000 $’000 30 June 2017 Assets Cash and deposits 2,524 - - - - - 166,228 168,752 Trade debtors 7 - - - - - - 689,691 689,691 Accrued revenue 7 - - - - - - 94,674 94,674 Sundry debtors 7 - - - - - - 60,113 60,113 Amounts owing from other entities 7,10 4,479 765 827 784 615 576 2,854 10,900 Other financial assets 11 - - - - - - 38,134 38,134 Total assets 7,003 765 827 784 615 576 1,051,694 1,062,264
Liabilities Trade and other creditors 16 - - - - - - 510,486 510,486 Amounts owing to vendors 17,20,24 2,237 - - - - - 55,221 57,458 Other liabilities 20,21,24 - 63 - - - - 16,889 16,952 Lease liabilities 17,21 1,881 1,259 77 60 - - - 3,277 USPP notes 21 - - 201,797 325,478 - 527,567 - 1,054,842 Total liabilities 4,118 1,322 201,874 325,538 - 527,567 582,596 1,643,015
Consolidated Group Fixed interest rate maturities
Notes 1 year or less
Over 1 and less
than 2 years
Over 2 and less
than 3 years
Over 3 and less
than 4 years
Over 4 and less
than 5 years
Over 5 years
Non-interest bearing
Total
$’000 $’000 $’000 $’000 $’000 $’000 $’000 $’000 30 June 2016 Assets Cash and deposits - - - - - - 132,834 132,834 Trade debtors 7 - - - - - - 667,944 667,944 Accrued revenue 7 - - - - - - 92,292 92,292 Sundry debtors 7 152 - - - - - 51,055 51,207 Amounts owing from other entities 7,10 2,746 4,826 546 635 535 137 3,012 12,437 Other financial assets 11 - - - - - - 56,275 56,275 Total assets 2,898 4,826 546 635 535 137 1,003,412 1,012,989
Liabilities Trade and other creditors 16 - - - - - - 493,800 493,800 Amounts owing to vendors 20,24 - - - - - - 84,857 84,857 Other liabilities 20,21,24 - 73 22 - - - 17,349 17,444 Lease liabilities 17,21 2,151 1,868 1,016 127 64 - - 5,226 USPP notes 17,21 127,808 - - 208,529 336,338 230,073 - 902,748 Total liabilities 129,959 1,941 1,038 208,656 336,402 230,073 596,006 1,504,075
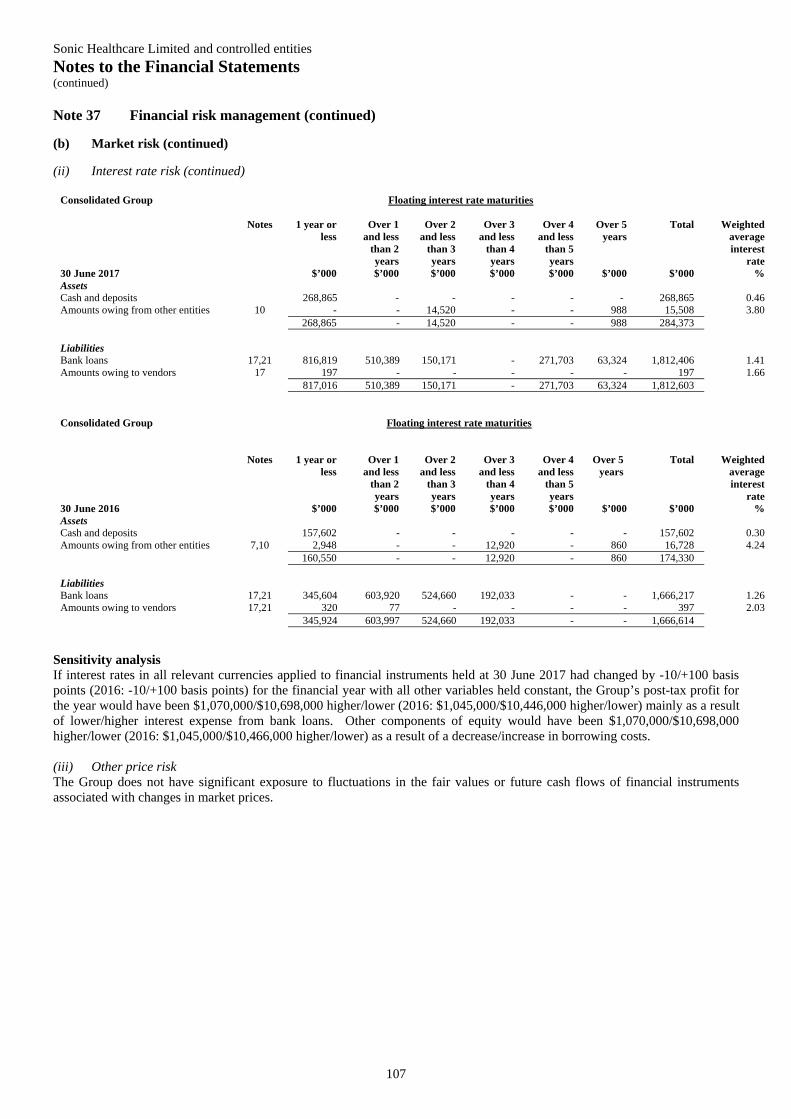
Sonic Healthcare Limited and controlled entities Notes to the Financial Statements (continued)
107
Note 37 Financial risk management (continued) (b) Market risk (continued) (ii) Interest rate risk (continued)
Consolidated Group Floating interest rate maturities
Notes 1 year or less
Over 1 and less
than 2 years
Over 2 and less
than 3 years
Over 3 and less
than 4 years
Over 4 and less
than 5 years
Over 5 years
Total Weighted average interest
rate 30 June 2017 $’000 $’000 $’000 $’000 $’000 $’000 $’000 % Assets Cash and deposits 268,865 - - - - - 268,865 0.46 Amounts owing from other entities 10 - - 14,520 - - 988 15,508 3.80 268,865 - 14,520 - - 988 284,373 Liabilities Bank loans 17,21 816,819 510,389 150,171 - 271,703 63,324 1,812,406 1.41 Amounts owing to vendors 17 197 - - - - - 197 1.66 817,016 510,389 150,171 - 271,703 63,324 1,812,603
Consolidated Group Floating interest rate maturities
Notes 1 year or
less Over 1
and less than 2 years
Over 2 and less
than 3 years
Over 3 and less
than 4 years
Over 4 and less
than 5 years
Over 5 years
Total Weighted average interest
rate 30 June 2016 $’000 $’000 $’000 $’000 $’000 $’000 $’000 % Assets Cash and deposits 157,602 - - - - - 157,602 0.30 Amounts owing from other entities 7,10 2,948 - - 12,920 - 860 16,728 4.24 160,550 - - 12,920 - 860 174,330 Liabilities Bank loans 17,21 345,604 603,920 524,660 192,033 - - 1,666,217 1.26 Amounts owing to vendors 17,21 320 77 - - - - 397 2.03 345,924 603,997 524,660 192,033 - - 1,666,614
Sensitivity analysis If interest rates in all relevant currencies applied to financial instruments held at 30 June 2017 had changed by -10/+100 basis points (2016: -10/+100 basis points) for the financial year with all other variables held constant, the Group’s post-tax profit for the year would have been $1,070,000/$10,698,000 higher/lower (2016: $1,045,000/$10,446,000 higher/lower) mainly as a result of lower/higher interest expense from bank loans. Other components of equity would have been $1,070,000/$10,698,000 higher/lower (2016: $1,045,000/$10,466,000 higher/lower) as a result of a decrease/increase in borrowing costs. (iii) Other price risk The Group does not have significant exposure to fluctuations in the fair values or future cash flows of financial instruments associated with changes in market prices.
Sonic Healthcare Limited and controlled entities Notes to the Financial Statements (continued)
108
Note 37 Financial risk management (continued) (c) Credit risk The credit risk on financial assets of the Group which have been recognised on the Balance Sheet, other than investment in shares, is generally the carrying amount, net of any provisions for impairment. Where entities have a right of set-off and intend to settle on a net basis, this set-off has been reflected in the financial statements in accordance with accounting standards. The Group does not have any material exposure to any individual customer or counterparty other than certain government or statutory funded bodies in the countries in which the Group operates. There are no other significant concentrations of credit risk within the Group. Receivable balances and ageing analysis are monitored on an ongoing basis. In order to minimise the Group’s exposure to bad debts, rigorously enforced processes are in place to send reminder notices, demands for repayments and ultimately to refer to debt collection agencies. Credit limits are imposed and monitored for commercial customers. The Group has not renegotiated any material collection/repayment terms of any financial assets in the current or previous financial year. Credit risk in the treasury context is defined as the risk of sustaining a loss as a result of a counterparty that has accepted a deposit from the Group and/or entered into a financial transaction with the Group related to the management of treasury related risks. Group Treasury seeks to only enter into transactions with counterparties who are senior lenders to the Group. (d) Liquidity risk The Group is exposed to funding and liquidity risks including the risk that in refinancing its debt, the Group may be exposed to an increased credit spread (the credit spread is the margin that must be paid over the equivalent government or risk free rate or swap rate) and the risk of not being able to refinance debt obligations or meet other cash outflow obligations at a reasonable cost when required. The Group’s strong cash flows and Balance Sheet are a major mitigator of this type of risk, along with the dynamics of the medical diagnostic services market. The Group seeks to further mitigate these risks by structuring its debt with a spread of maturities, maintaining excellent relationships with a number of leading Australian and international banks, diversifying funding sources by accessing the private placement bond market in the USA and the syndicated bank loan market in Europe, and keeping sufficient committed credit lines available for short to medium term needs (balanced against the cost of maintaining such lines) in accordance with Sonic’s Treasury Policy. The tables below analyse the Group’s financial liabilities and net-settled derivative financial instruments into relevant maturity groupings based on the remaining period at the reporting date to the contractual maturity date. The amounts disclosed in the table are the contractual undiscounted cash flows including interest (other than in the “carrying value” column). The table ignores the maturities of undrawn credit lines. For interest rate swaps the cash flows are estimated using forward interest rates applicable at the reporting date.
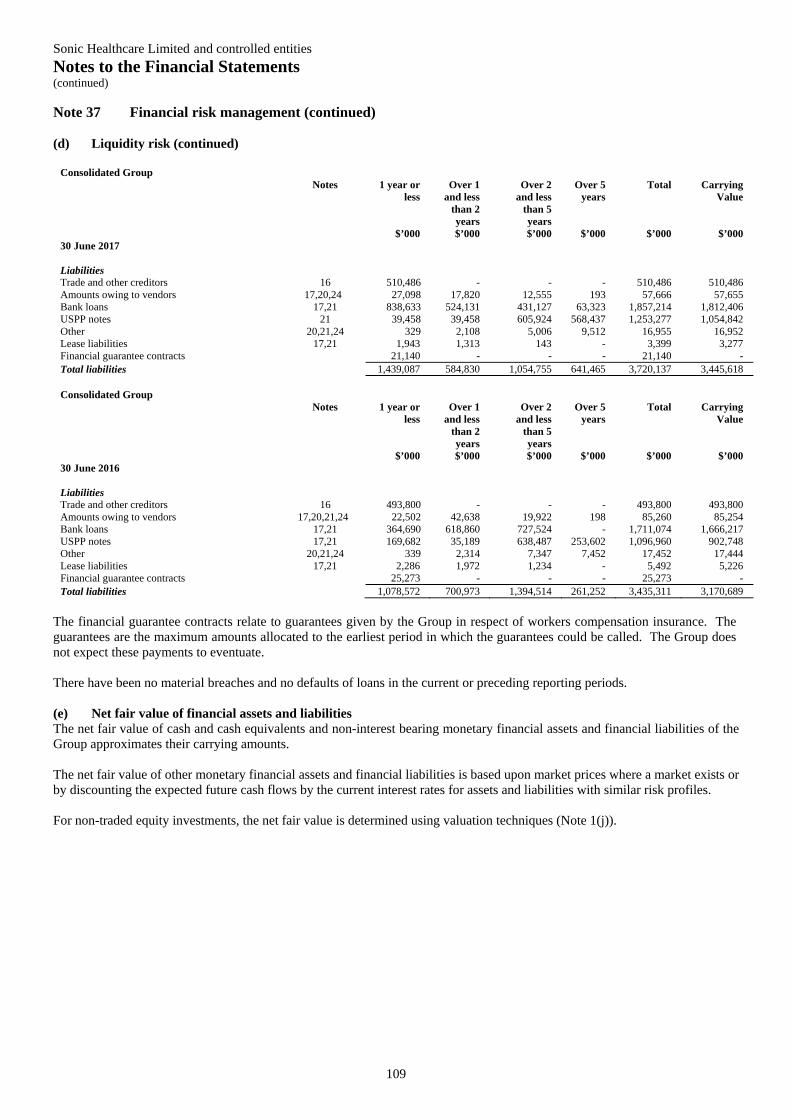
Sonic Healthcare Limited and controlled entities Notes to the Financial Statements (continued)
109
Note 37 Financial risk management (continued) (d) Liquidity risk (continued)
Consolidated Group Notes 1 year or
less Over 1
and less than 2 years
Over 2 and less
than 5 years
Over 5 years
Total Carrying Value
$’000 $’000 $’000 $’000 $’000 $’000 30 June 2017 Liabilities Trade and other creditors 16 510,486 - - - 510,486 510,486 Amounts owing to vendors 17,20,24 27,098 17,820 12,555 193 57,666 57,655 Bank loans 17,21 838,633 524,131 431,127 63,323 1,857,214 1,812,406 USPP notes 21 39,458 39,458 605,924 568,437 1,253,277 1,054,842 Other 20,21,24 329 2,108 5,006 9,512 16,955 16,952 Lease liabilities 17,21 1,943 1,313 143 - 3,399 3,277 Financial guarantee contracts 21,140 - - - 21,140 - Total liabilities 1,439,087 584,830 1,054,755 641,465 3,720,137 3,445,618 Consolidated Group
Notes 1 year or less
Over 1 and less
than 2 years
Over 2 and less
than 5 years
Over 5 years
Total Carrying Value
$’000 $’000 $’000 $’000 $’000 $’000 30 June 2016 Liabilities Trade and other creditors 16 493,800 - - - 493,800 493,800 Amounts owing to vendors 17,20,21,24 22,502 42,638 19,922 198 85,260 85,254 Bank loans 17,21 364,690 618,860 727,524 - 1,711,074 1,666,217 USPP notes 17,21 169,682 35,189 638,487 253,602 1,096,960 902,748 Other 20,21,24 339 2,314 7,347 7,452 17,452 17,444 Lease liabilities 17,21 2,286 1,972 1,234 - 5,492 5,226 Financial guarantee contracts 25,273 - - - 25,273 - Total liabilities 1,078,572 700,973 1,394,514 261,252 3,435,311 3,170,689
The financial guarantee contracts relate to guarantees given by the Group in respect of workers compensation insurance. The guarantees are the maximum amounts allocated to the earliest period in which the guarantees could be called. The Group does not expect these payments to eventuate. There have been no material breaches and no defaults of loans in the current or preceding reporting periods. (e) Net fair value of financial assets and liabilities The net fair value of cash and cash equivalents and non-interest bearing monetary financial assets and financial liabilities of the Group approximates their carrying amounts. The net fair value of other monetary financial assets and financial liabilities is based upon market prices where a market exists or by discounting the expected future cash flows by the current interest rates for assets and liabilities with similar risk profiles. For non-traded equity investments, the net fair value is determined using valuation techniques (Note 1(j)).
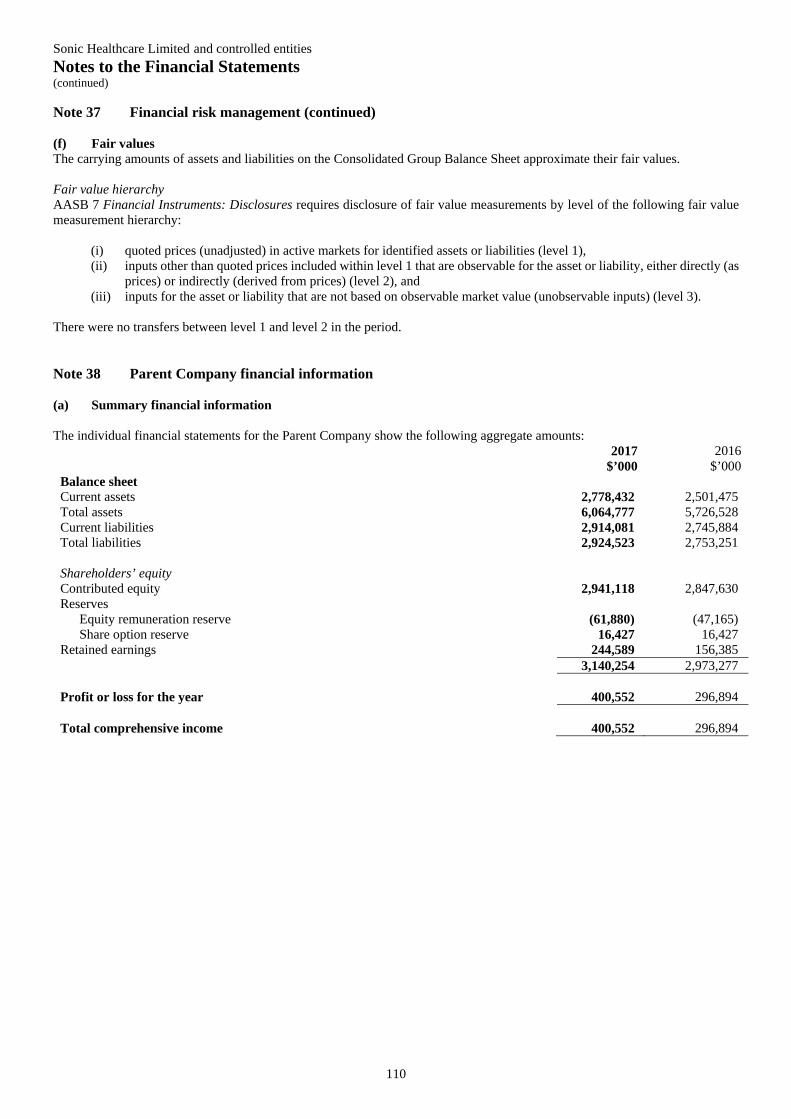
Sonic Healthcare Limited and controlled entities Notes to the Financial Statements (continued)
110
Note 37 Financial risk management (continued) (f) Fair values The carrying amounts of assets and liabilities on the Consolidated Group Balance Sheet approximate their fair values. Fair value hierarchy AASB 7 Financial Instruments: Disclosures requires disclosure of fair value measurements by level of the following fair value measurement hierarchy:
(i) quoted prices (unadjusted) in active markets for identified assets or liabilities (level 1), (ii) inputs other than quoted prices included within level 1 that are observable for the asset or liability, either directly (as
prices) or indirectly (derived from prices) (level 2), and (iii) inputs for the asset or liability that are not based on observable market value (unobservable inputs) (level 3).
There were no transfers between level 1 and level 2 in the period. Note 38 Parent Company financial information (a) Summary financial information The individual financial statements for the Parent Company show the following aggregate amounts:
2017 $’000
2016 $’000
Balance sheet Current assets 2,778,432 2,501,475 Total assets 6,064,777 5,726,528 Current liabilities 2,914,081 2,745,884 Total liabilities 2,924,523 2,753,251 Shareholders’ equity Contributed equity 2,941,118 2,847,630 Reserves Equity remuneration reserve (61,880) (47,165) Share option reserve 16,427 16,427 Retained earnings 244,589 156,385 3,140,254 2,973,277 Profit or loss for the year 400,552 296,894 Total comprehensive income 400,552 296,894
Sonic Healthcare Limited and controlled entities Notes to the Financial Statements (continued)
111
Note 38 Parent Company financial information (continued) (b) Guarantees entered into by the Parent Company The Parent Company is a party to the deed of cross guarantee as disclosed in Note 27. No liabilities have been assumed by the Parent Company in relation to this guarantee as it is expected the parties to the deed of cross guarantee will continue to generate positive cash flows. The Parent Company has further provided guarantees of $83,745,000 (2016: $80,810,000) in respect of property leases and workers compensation insurance for subsidiary entities. In addition the Parent Company has provided guarantees of the performance of certain contracts by subsidiary entities. No liability was recognised by the Parent Company or the Consolidated Group in relation to these guarantees, as their fair values are immaterial. (c) Contingent liabilities of the Parent Company The Parent Company had no contingent liabilities as at 30 June 2017 or 30 June 2016 other than as described in (b) above. (d) Contractual commitments for the acquisition of property, plant or equipment The Parent Company did not have any contractual commitments for the acquisition of property, plant or equipment as at 30 June 2017. Note 39 Events occurring after reporting date Since the end of the financial year, the Directors are not aware of any matter or circumstance not otherwise dealt with in these financial statements that has significantly or may significantly affect the operations of the Group, the results of those operations or the state of affairs of the Group in subsequent financial years, other than the acquisition on 3 July 2017 of Medical Laboratory Bremen, a laboratory practice in the North West of Germany, for an enterprise value of €63M, as announced to the market on 30 January 2017.
Sonic Healthcare Limited and controlled entities Directors’ Declaration For the year ended 30 June 2017
112
In the Directors’ opinion: (a) the financial statements and Notes set out on pages 46 to 111 are in accordance with the Corporations Act 2001, including:
(i) complying with Accounting Standards, the Corporations Regulations 2001 and other mandatory professional reporting requirements; and (ii) giving a true and fair view of the Group’s financial position as at 30 June 2017 and of its performance for the financial year ended on that date; and
(b) there are reasonable grounds to believe that the Company will be able to pay its debts as and when they become due and payable; and
(c) at the date of this declaration, there are reasonable grounds to believe that the members of the Extended Closed Group identified in Note 28 will be able to meet any obligations or liabilities to which they are, or may become, subject by virtue of the deed of cross guarantee described in Note 27.
Note 1(a) confirms that the financial statements also comply with International Financial Reporting Standards as issued by the International Accounting Standards Board. The Directors have been given the declarations by the Managing Director and Finance Director required by section 295A of the Corporations Act 2001. This declaration is made in accordance with a resolution of the Directors. Dr C.S. Goldschmidt Director C.D. Wilks Director Sydney 18 September 2017
PricewaterhouseCoopers, ABN 52 780 433 757 One International Towers Sydney, Watermans Quay, Barangaroo, GPO BOX 2650, SYDNEY NSW 2001 T: +61 2 8266 0000, F: +61 2 8266 9999, www.pwc.com.au Liability limited by a scheme approved under Professional Standards Legislation.
113
Independent auditor’s report To the members of Sonic Healthcare Limited Report on the audit of the financial report
Our opinion In our opinion:
The accompanying financial report of Sonic Healthcare Limited (the Company) and its controlled entities (together, the Group) is in accordance with the Corporations Act 2001, including:
a) giving a true and fair view of the Group’s financial position as at 30 June 2017 and of its financial performance for the year then ended
b) complying with Australian Accounting Standards and the Corporations Regulations 2001.
What we have audited The Group consolidated financial report comprises:
the balance sheet as at 30 June 2017
the income statement for the year then ended
the statement of comprehensive income for the year then ended
the statement of changes in equity for the year then ended
the cash flow statement for the year then ended
the notes to the financial statements, which include a summary of significant accounting policies
the directors’ declaration.
Basis for opinion We conducted our audit in accordance with Australian Auditing Standards. Our responsibilities under those standards are further described in the Auditor’s responsibilities for the audit of the financial report section of our report. We believe that the audit evidence we have obtained is sufficient and appropriate to provide a basis for our opinion. Independence
We are independent of the Group in accordance with the auditor independence requirements of the Corporations Act 2001 and the ethical requirements of the Accounting Professional and Ethical Standards Board’s APES 110 Code of Ethics for Professional Accountants (the Code) that are relevant to our audit of the financial report in Australia. We have also fulfilled our other ethical responsibilities in accordance with the Code.
Our audit approach An audit is designed to provide reasonable assurance about whether the financial report is free from material misstatement. Misstatements may arise due to fraud or error. They are considered material if individually or in aggregate, they could reasonably be expected to influence the economic decisions of users taken on the basis of the financial report.
We tailored the scope of our audit and skills of our audit team to ensure that we performed enough work to be able to give an opinion on the financial report as a whole, taking into account the geographic and management structure of the Group, its accounting processes and controls and the industry in which it operates.
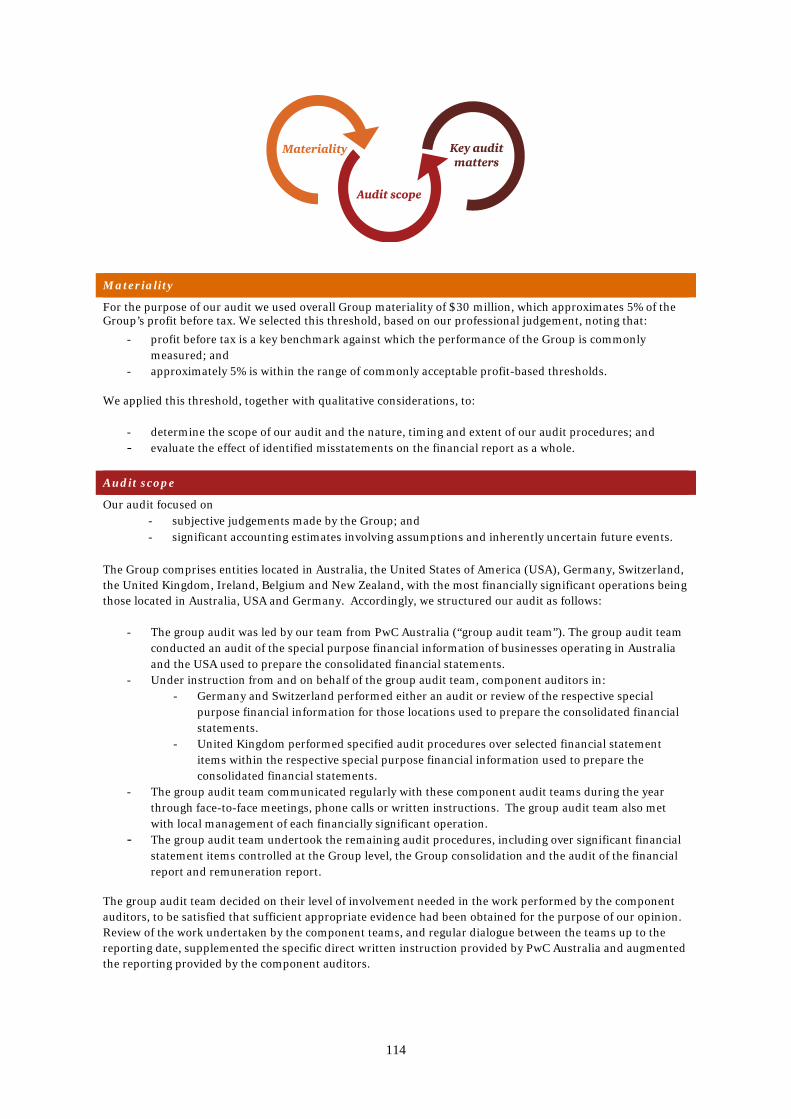
114
Materiality
For the purpose of our audit we used overall Group materiality of $30 million, which approximates 5% of the Group’s profit before tax. We selected this threshold, based on our professional judgement, noting that:
- profit before tax is a key benchmark against which the performance of the Group is commonly measured; and
- approximately 5% is within the range of commonly acceptable profit-based thresholds.
We applied this threshold, together with qualitative considerations, to:
- determine the scope of our audit and the nature, timing and extent of our audit procedures; and - evaluate the effect of identified misstatements on the financial report as a whole.
Audit scope
Our audit focused on - subjective judgements made by the Group; and - significant accounting estimates involving assumptions and inherently uncertain future events.
The Group comprises entities located in Australia, the United States of America (USA), Germany, Switzerland, the United Kingdom, Ireland, Belgium and New Zealand, with the most financially significant operations being those located in Australia, USA and Germany. Accordingly, we structured our audit as follows:
- The group audit was led by our team from PwC Australia (“group audit team”). The group audit team conducted an audit of the special purpose financial information of businesses operating in Australia and the USA used to prepare the consolidated financial statements.
- Under instruction from and on behalf of the group audit team, component auditors in: - Germany and Switzerland performed either an audit or review of the respective special
purpose financial information for those locations used to prepare the consolidated financial statements.
- United Kingdom performed specified audit procedures over selected financial statement items within the respective special purpose financial information used to prepare the consolidated financial statements.
- The group audit team communicated regularly with these component audit teams during the year through face-to-face meetings, phone calls or written instructions. The group audit team also met with local management of each financially significant operation.
- The group audit team undertook the remaining audit procedures, including over significant financial statement items controlled at the Group level, the Group consolidation and the audit of the financial report and remuneration report.
The group audit team decided on their level of involvement needed in the work performed by the component auditors, to be satisfied that sufficient appropriate evidence had been obtained for the purpose of our opinion. Review of the work undertaken by the component teams, and regular dialogue between the teams up to the reporting date, supplemented the specific direct written instruction provided by PwC Australia and augmented the reporting provided by the component auditors.
115
The combination of all these procedures provided us with sufficient and appropriate audit evidence to express an opinion on the Group’s financial report as a whole.
Key audit matters Key audit matters are those matters that, in our professional judgement, were of most significance in our audit of the financial report for the current period. Amongst other relevant topics, we communicated the key matters to the Audit Committee. The key audit matters were addressed in the context of our audit of the financial report as a whole, and in forming our opinion thereon, and we do not provide a separate opinion on these matters. Further, any commentary on the outcomes of a particular audit procedure is made in that context.
Key audit matter How our audit addressed the key audit matter
Estimated recoverable amount of goodwill and other indefinite life intangibles assets Refer to note 13 – Intangible assets
Goodwill and other indefinite life intangible assets of $5.4 billion are recognised on the balance sheet. Under Australian Accounting Standards, the Group is required to test the goodwill and indefinite lived intangible assets annually for impairment, irrespective of whether there are indications of impairment. This assessment is inherently complex and judgemental. It requires judgement by the Group in forecasting the operational cash flows of the cash generating units of the Group, and determining discount rates and terminal value growth rates used in the discounted cash flow models used to assess impairment (the models).
The recoverable amount of goodwill and other indefinite life intangible assets was considered a key audit matter given:
the financial significance of the intangible assets on the balance sheet; and
the judgement applied by the Group in completing the impairment assessments.
We focused our efforts on developing an understanding and testing the overall calculation and methodology of the Group’s impairment assessment, including identification of the cash generating units of the Group for the purposes of impairment testing, and the attribution of net assets, revenues and costs to those units.
In obtaining audit evidence, our procedures included, amongst others:
assessing the cash flow forecasts included in the models with reference to actual historical earnings
testing the mathematical calculations within the models
assessing the terminal value growth rates and discount rates applied in the models by comparing them to external information sources
performing sensitivity analyses over the key assumptions used in the models
evaluating the related financial statement disclosures for consistency with Australian Accounting Standards requirements.
Business combinations Refer to note 28 – Investments in subsidiaries
During the year, the Group acquired the Staber Laboratory Group (Staber) in Germany for a total consideration of $198 million. The acquisition of Staber was assessed as a key audit matter given:
the financial significance of the purchase price; and
the judgement applied by the Group in allocating the total consideration to the underlying assets and liabilities of Staber.
Noting that the Group’s accounting for the acquisition remains provisional, our audit procedures to date included:
Reading the executed purchase contract between the relevant parties.
Assessing whether the basis and composition of the purchase price in the executed contract was consistent with the Group’s accounting for the acquisition.
Reading the due diligence reports received by the Group and associated analysis to consider if appropriate assets and liabilities have been identified, valued and recognised.
We assessed the appropriateness of the Group’s relevant disclosure in the financial report.
116
Taxation Refer to note 6, 14 & 22 – Income tax and deferred tax balances
The income tax provision was a key audit matter because the Group is subject to taxation in multiple jurisdictions and, in many cases, the final tax treatment is not certain until resolved with the relevant tax authority. Consequently, the Group has made judgements about the incidence and quantum of tax exposures and liabilities which are subject to the future outcome of assessments by relevant tax authorities.
Our procedures included evaluating the analysis conducted by the Group for judgements made in respect of the ultimate amounts expected to be paid to tax authorities. We used our understanding of the business, engaged PwC tax experts and read a sample of external advice obtained by the Group to assess the provisions for tax under Australian Accounting Standards. We assessed the appropriateness of the Group’s disclosure in relation to these matters in the financial report.
Other information The directors are responsible for the other information. The other information comprises the Corporate Directory, Chairman’s Letter, CEO Report, Financial History, Directors’ Report, Corporate Governance Statement and Shareholders’ Information included in the Group’s annual report for the year ended 30 June 2017 but does not include the financial report and our auditor’s report thereon. Our opinion on the financial report does not cover the other information and accordingly we do not express any form of assurance conclusion thereon. In connection with our audit of the financial report, our responsibility is to read the other information identified above and, in doing so, consider whether the other information is materially inconsistent with the financial report or our knowledge obtained in the audit, or otherwise appears to be materially misstated. If, based on the work we have performed, we conclude that there is a material misstatement of this other information, we are required to report that fact. We have nothing to report in this regard.
Responsibilities of the directors for the financial report The directors of the Company are responsible for the preparation of the financial report that gives a true and fair view in accordance with Australian Accounting Standards and the Corporations Act 2001 and for such internal control as the directors determine is necessary to enable the preparation of the financial report that gives a true and fair view and is free from material misstatement, whether due to fraud or error. In preparing the financial report, the directors are responsible for assessing the ability of the Group to continue as a going concern, disclosing, as applicable, matters related to going concern and using the going concern basis of accounting unless the directors either intend to liquidate the Group or to cease operations, or have no realistic alternative but to do so. Auditor’s responsibilities for the audit of the financial report Our objectives are to obtain reasonable assurance about whether the financial report as a whole is free from material misstatement, whether due to fraud or error, and to issue an auditor’s report that includes our opinion. Reasonable assurance is a high level of assurance, but is not a guarantee that an audit conducted in accordance with the Australian Auditing Standards will always detect a material misstatement when it exists. Misstatements can arise from fraud or error and are considered material if, individually or in the aggregate, they could reasonably be expected to influence the economic decisions of users taken on the basis of the financial report. A further description of our responsibilities for the audit of the financial report is located at the Auditing and Assurance Standards Board website at http://www.auasb.gov.au/auditors_responsibilities/ar1.pdf. This description forms part of our auditor’s report.
117
Report on the remuneration report
Our opinion on the remuneration report We have audited the remuneration report included in pages 21 to 32 of the directors’ report for the year ended 30 June 2017. In our opinion, the remuneration report of Sonic Healthcare Limited for the year ended 30 June 2017 complies with section 300A of the Corporations Act 2001.
Responsibilities The directors of the Company are responsible for the preparation and presentation of the remuneration report in accordance with section 300A of the Corporations Act 2001. Our responsibility is to express an opinion on the remuneration report, based on our audit conducted in accordance with Australian Auditing Standards.
PricewaterhouseCoopers
Mark Dow Partner Sydney 18 September 2017
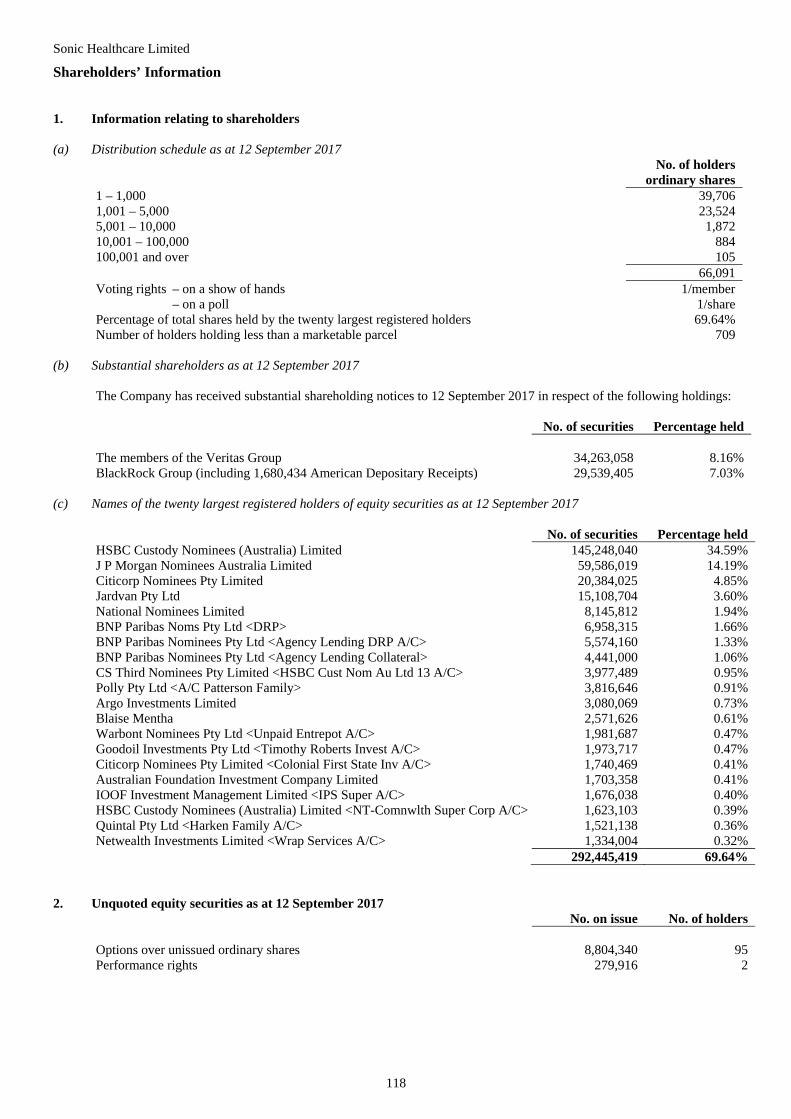
Sonic Healthcare Limited
118
Shareholders’ Information 1. Information relating to shareholders (a) Distribution schedule as at 12 September 2017
No. of holders ordinary shares
1 – 1,000 39,706 1,001 – 5,000 23,524 5,001 – 10,000 1,872 10,001 – 100,000 884 100,001 and over 105 66,091 Voting rights – on a show of hands 1/member – on a poll 1/share Percentage of total shares held by the twenty largest registered holders 69.64% Number of holders holding less than a marketable parcel 709
(b) Substantial shareholders as at 12 September 2017
The Company has received substantial shareholding notices to 12 September 2017 in respect of the following holdings: No. of securities Percentage held The members of the Veritas Group 34,263,058 8.16% BlackRock Group (including 1,680,434 American Depositary Receipts) 29,539,405 7.03%
(c) Names of the twenty largest registered holders of equity securities as at 12 September 2017
No. of securities Percentage held HSBC Custody Nominees (Australia) Limited 145,248,040 34.59% J P Morgan Nominees Australia Limited 59,586,019 14.19% Citicorp Nominees Pty Limited 20,384,025 4.85% Jardvan Pty Ltd 15,108,704 3.60% National Nominees Limited 8,145,812 1.94% BNP Paribas Noms Pty Ltd <DRP> 6,958,315 1.66% BNP Paribas Nominees Pty Ltd <Agency Lending DRP A/C> 5,574,160 1.33% BNP Paribas Nominees Pty Ltd <Agency Lending Collateral> 4,441,000 1.06% CS Third Nominees Pty Limited <HSBC Cust Nom Au Ltd 13 A/C> 3,977,489 0.95% Polly Pty Ltd <A/C Patterson Family> 3,816,646 0.91% Argo Investments Limited 3,080,069 0.73% Blaise Mentha 2,571,626 0.61% Warbont Nominees Pty Ltd <Unpaid Entrepot A/C> 1,981,687 0.47% Goodoil Investments Pty Ltd <Timothy Roberts Invest A/C> 1,973,717 0.47% Citicorp Nominees Pty Limited <Colonial First State Inv A/C> 1,740,469 0.41% Australian Foundation Investment Company Limited 1,703,358 0.41% IOOF Investment Management Limited <IPS Super A/C> 1,676,038 0.40% HSBC Custody Nominees (Australia) Limited <NT-Comnwlth Super Corp A/C> 1,623,103 0.39% Quintal Pty Ltd <Harken Family A/C> 1,521,138 0.36% Netwealth Investments Limited <Wrap Services A/C> 1,334,004 0.32% 292,445,419 69.64%
2. Unquoted equity securities as at 12 September 2017
No. on issue No. of holders Options over unissued ordinary shares 8,804,340 95 Performance rights 279,916 2
Sonic Healthcare Limited
119
Shareholders’ Information (continued) 3. Share Registry Computershare Investor Services Pty Limited Registered address: Level 5, 115 Grenfell Street, Adelaide, SA 5000 Postal address: GPO Box 1903, Adelaide, SA 5001 Enquiries within Australia: 1300 556 161 Fax within Australia: 1300 534 987 Enquiries outside Australia: +61 3 9415 4000 Fax outside Australia: +61 3 9473 2408 Email: www.investorcentre.com/contact Shareholders with enquiries should email, telephone or write to the Share Registry. Separate shareholdings may be consolidated by advising the Share Registry in writing or by completing a Request to Consolidate Holdings form which can be found online at the above website. Shareholders who are issuer sponsored holders should notify the Share Registry of a change of address without delay. Shareholders who are broker sponsored on the CHESS sub-register must notify their sponsoring broker of a change of address. Direct payment of dividends into a nominated account may be arranged with the Share Registry. Shareholders are encouraged to use this option by completing a payment instruction form online or advising the Share Registry in writing with particulars. The Annual Report is produced for your information. However, should you receive more than one or wish to be removed from the mailing list for the Annual Report, please advise the Share Registry. You will continue to receive any Notices of Meetings and Proxy Forms. Supporting the environment through electronic communication With your support of electronic communication channels, Sonic Healthcare has significantly decreased its shareholder communication print production. Less than 3% of Sonic’s shareholders still request a hard copy Annual Report, and over 36% of shareholders receive communications electronically. The result is a reduction in energy and water resources associated with paper production. 4. Annual General Meeting The Annual General Meeting will be held in the Fort Macquarie Room at the InterContinental Sydney Hotel, 117 Macquarie Street, Sydney at 10.00am on Wednesday 22 November 2017.