sophos xg firewall v 15.01.0 release notes iview 03... · logs of sophos utm 9 into sophos iview to...
TRANSCRIPT

Sophos XG Firewall v 15.01.0 – Release Notes
Sophos iViewv03.01.2 MR-1Administrator Guide
For Sophos Customers
Document Date: April 2018

| Contents | ii
Contents
What's New in this Release..................................................................................... 6
Introduction............................................................................................................... 7Basics.....................................................................................................................................................................8Accessing Sophos iView.................................................................................................................................... 12Using Online Help..............................................................................................................................................13
Dashboards.............................................................................................................. 13Main Dashboard..................................................................................................................................................13
Allowed Traffic Overview......................................................................................................................13Blocked Traffic Overview...................................................................................................................... 14
Traffic Dashboard............................................................................................................................................... 14Applications.............................................................................................................................................15Application Categories............................................................................................................................16Application Users....................................................................................................................................17Hosts........................................................................................................................................................18Source Countries.....................................................................................................................................19Destination Countries..............................................................................................................................20Allowed Policies..................................................................................................................................... 21Web Categories....................................................................................................................................... 22Web Users............................................................................................................................................... 23Web Domains..........................................................................................................................................24Web Server Domains.............................................................................................................................. 25File Uploaded via Web...........................................................................................................................26Files Transferred via FTP.......................................................................................................................27FTP Servers.............................................................................................................................................28Mail Traffic Summary............................................................................................................................ 28Mail Senders........................................................................................................................................... 29Mail Recipients....................................................................................................................................... 30Allowed Traffic Summary...................................................................................................................... 31Web Traffic Summary............................................................................................................................ 32FTP Traffic Summary.............................................................................................................................33
Security Dashboard.............................................................................................................................................34High Risk Applications.......................................................................................................................... 35High Risk Application Users..................................................................................................................35Blocked Applications..............................................................................................................................36Blocked Application Users.....................................................................................................................37Blocked Hosts......................................................................................................................................... 38Blocked Source Countries...................................................................................................................... 39Blocked Destination Countries...............................................................................................................40Blocked Rule ID..................................................................................................................................... 41Objectionable Web Categories............................................................................................................... 42Objectionable Web Domains.................................................................................................................. 43Blocked Web Categories.........................................................................................................................44Blocked Web Domains........................................................................................................................... 45Objectionable Web Users....................................................................................................................... 46Blocked Web Users................................................................................................................................ 47
| Contents | iii
Hosts - ATP............................................................................................................................................ 48Users - ATP............................................................................................................................................ 49Advanced Threats................................................................................................................................... 50Security Heartbeat - ATP....................................................................................................................... 51Intrusion Attacks.....................................................................................................................................52Virus Summary....................................................................................................................................... 52Viruses..................................................................................................................................................... 53Spam Senders..........................................................................................................................................54Spam Recipients......................................................................................................................................55Spam Summary.......................................................................................................................................56Content Filtering Blocked Summary......................................................................................................57Blocked Traffic Summary...................................................................................................................... 58Detailed View - Client Health................................................................................................................59Attacked Web Server Domains.............................................................................................................. 60Blocked Web Server Requests............................................................................................................... 60
System Dashboard.............................................................................................................................................. 61CPU Usage..............................................................................................................................................61Memory Usage........................................................................................................................................62Disk Usage..............................................................................................................................................63Event Frequency..................................................................................................................................... 64
Executive Report.................................................................................................................................................65Users........................................................................................................................................................68Application Categories............................................................................................................................68Applications.............................................................................................................................................69High Risk Applications.......................................................................................................................... 70Blocked Applications..............................................................................................................................71Web Categories....................................................................................................................................... 72Web Category Types...............................................................................................................................73Objectionable Web Categories............................................................................................................... 74Objectionable Web Domains.................................................................................................................. 75Web Server Domain................................................................................................................................76Blocked Web Server Requests............................................................................................................... 77Intrusion Attacks.....................................................................................................................................78Severity wise Attacks............................................................................................................................. 79Advanced Threats................................................................................................................................... 80Users - ATP............................................................................................................................................ 81Mail Traffic Summary............................................................................................................................ 82Spam Senders..........................................................................................................................................83Spam Recipients......................................................................................................................................84CPU Usage..............................................................................................................................................85Memory Usage........................................................................................................................................86Disk Usage..............................................................................................................................................86Live Users............................................................................................................................................... 87Interface...................................................................................................................................................87
Reports..................................................................................................................... 88Application & Web.............................................................................................................................................88
App Risks & Usage................................................................................................................................88Blocked Apps........................................................................................................................................107Web Risks & Usage............................................................................................................................. 119Blocked Web Attempts......................................................................................................................... 140Search Engine....................................................................................................................................... 159Web Server Usage................................................................................................................................ 162Web Server Protection.......................................................................................................................... 167User Data Transfer Report................................................................................................................... 173
| Contents | iv
FTP Usage.............................................................................................................................................179FTP Protection...................................................................................................................................... 187IM Usage...............................................................................................................................................198Blocked IM Attempts........................................................................................................................... 201
Network & Threats........................................................................................................................................... 205Intrusion Attacks...................................................................................................................................206Advanced Threats................................................................................................................................. 222Security Heartbeat.................................................................................................................................233VPN.......................................................................................................................................................242SSL VPN...............................................................................................................................................252Clientless Access.................................................................................................................................. 255Wireless................................................................................................................................................. 261Rule Usage............................................................................................................................................ 265Sandstorm..............................................................................................................................................274
Email................................................................................................................................................................. 281Email Usage.......................................................................................................................................... 281Email Protection....................................................................................................................................292
Compliance............................................................................................................ 313Compliance Reports..........................................................................................................................................314
HIPAA................................................................................................................................................... 314GLBA.................................................................................................................................................... 329SOX.......................................................................................................................................................344FISMA...................................................................................................................................................359PCI.........................................................................................................................................................371NERC CIP v3....................................................................................................................................... 383CIPA...................................................................................................................................................... 398Events.................................................................................................................................................... 405
Bookmarks............................................................................................................. 408Add Bookmark..................................................................................................................................................409Delete Bookmark.............................................................................................................................................. 409
Custom................................................................................................................... 409Custom Reports.................................................................................................................................................409
Web........................................................................................................................................................410Email..................................................................................................................................................... 416FTP........................................................................................................................................................ 419User....................................................................................................................................................... 422Web Server............................................................................................................................................451
System & Monitor................................................................................................ 453Device inventory...............................................................................................................................................454
Devices.................................................................................................................................................. 454Device Group........................................................................................................................................ 455
Log & Report Settings..................................................................................................................................... 456Report Scheduling.................................................................................................................................456Custom View.........................................................................................................................................458Bookmark Management........................................................................................................................459Archives.................................................................................................................................................460Data Management................................................................................................................................. 462Log Integrity......................................................................................................................................... 464
| Contents | v
Monitor..............................................................................................................................................................464Live Logs.............................................................................................................................................. 464Audit Logs............................................................................................................................................ 465Archive Search......................................................................................................................................467
System Settings.................................................................................................................................................467Administration.......................................................................................................................................468System................................................................................................................................................... 472Network................................................................................................................................................. 478Maintenance.......................................................................................................................................... 482Diagnostics............................................................................................................................................ 487
Log Digester......................................................................................................................................................490Wizard................................................................................................................................................... 490Status..................................................................................................................................................... 492
Data Anonymization......................................................................................................................................... 492Data Anonymization............................................................................................................................. 493Anonymized Exceptions....................................................................................................................... 496
Appendix A - Guides............................................................................................496
Copyright Notice................................................................................................... 496
| What's New in this Release | 6
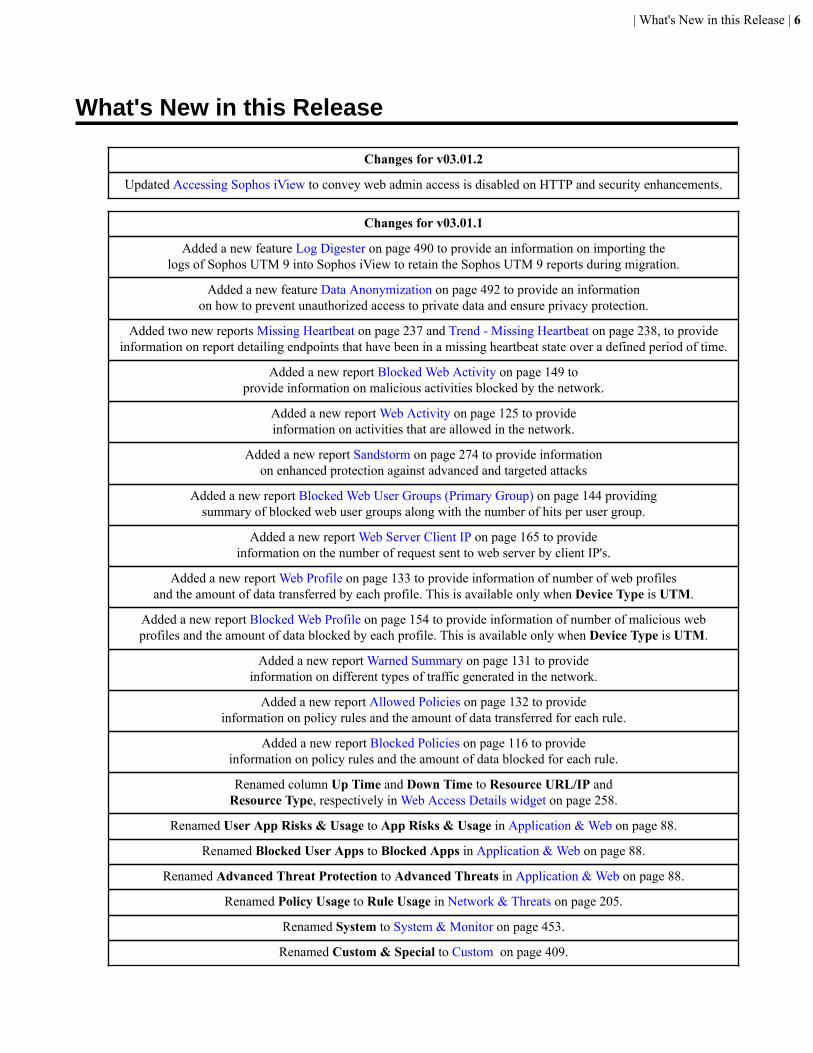
What's New in this Release
Changes for v03.01.2
Updated Accessing Sophos iView to convey web admin access is disabled on HTTP and security enhancements.
Changes for v03.01.1
Added a new feature Log Digester on page 490 to provide an information on importing thelogs of Sophos UTM 9 into Sophos iView to retain the Sophos UTM 9 reports during migration.
Added a new feature Data Anonymization on page 492 to provide an informationon how to prevent unauthorized access to private data and ensure privacy protection.
Added two new reports Missing Heartbeat on page 237 and Trend - Missing Heartbeat on page 238, to provideinformation on report detailing endpoints that have been in a missing heartbeat state over a defined period of time.
Added a new report Blocked Web Activity on page 149 toprovide information on malicious activities blocked by the network.
Added a new report Web Activity on page 125 to provideinformation on activities that are allowed in the network.
Added a new report Sandstorm on page 274 to provide informationon enhanced protection against advanced and targeted attacks
Added a new report Blocked Web User Groups (Primary Group) on page 144 providingsummary of blocked web user groups along with the number of hits per user group.
Added a new report Web Server Client IP on page 165 to provideinformation on the number of request sent to web server by client IP's.
Added a new report Web Profile on page 133 to provide information of number of web profilesand the amount of data transferred by each profile. This is available only when Device Type is UTM.
Added a new report Blocked Web Profile on page 154 to provide information of number of malicious webprofiles and the amount of data blocked by each profile. This is available only when Device Type is UTM.
Added a new report Warned Summary on page 131 to provideinformation on different types of traffic generated in the network.
Added a new report Allowed Policies on page 132 to provideinformation on policy rules and the amount of data transferred for each rule.
Added a new report Blocked Policies on page 116 to provideinformation on policy rules and the amount of data blocked for each rule.
Renamed column Up Time and Down Time to Resource URL/IP andResource Type, respectively in Web Access Details widget on page 258.
Renamed User App Risks & Usage to App Risks & Usage in Application & Web on page 88.
Renamed Blocked User Apps to Blocked Apps in Application & Web on page 88.
Renamed Advanced Threat Protection to Advanced Threats in Application & Web on page 88.
Renamed Policy Usage to Rule Usage in Network & Threats on page 205.
Renamed System to System & Monitor on page 453.
Renamed Custom & Special to Custom on page 409.
| Introduction | 7
Changes for v03.01.1
Moved Executive Summary under Dashboards on page 13.
Renamed option IP to Client IP in FTP Search Report on page 420.
Renamed option IP to Source IP in FTP Virus Search Report on page 421.
Added two new columns Rule Name and Action in Spam Report on page 417.
Renamed report Custom User Report by Email Addresssender to Custom User Report by Sender's Email Address.
Renamed report Custom User Report by Email Address recipient toCustom User Report by Recipient's Email Address in User on page 422.
Removed column Status from RED Disconnects Detailed Report on page 252.
Added a new column Mising To to show the date/time when a device leaves the missing state in .
Added a new option Sort By for group level and filtered reports, to sort a reportdata based on the column headings shown in Basics on page 8 page.
Added a new column Policy Rule in Detailed Web Surfing Reports on page 414.
Added a new note Summarized report logs can be retained for time intervalstarting from 1 month to 7 yearsin Data Management on page 462 page.
Changes for MR-2
Renamed report Web User Groups to Web User Groups (Primary Group) in Web UserGroups (Primary Group) on page 124 page under Web Risks & Usage on page 119.
Renamed column headingApplications to Application/Proto: Port inApplications on page 69 page under App Risks & Usage on page 88.
Added columns User Name and Mail_Size in Mail UsageReport on page 417 page under Email on page 416.
Added column Virus in WAF Protection Search Results on page 452 page under Web Server on page 451.
Renamed report Spam Receiver to Spam Recipients in SpamRecipients on page 55 page under Email Protection on page 292.
Renamed label Web Usage to All modules in Log Integrityon page 464 page under System & Monitor on page 453.
Removed column Module from Virus Summary on page 52 page under Compliance on page 313.
Added reports SSL VPN and Wireless option under Add Custom View on page 458.
Introduction
With the advent of new business technologies and evolving Internet threats, organizations are deploying an increasingnumber of solutions and devices to ensure security and business continuity. This includes firewalls, content filteringsystems, unified threat management solutions, routers, servers, applications, operating systems and more whichgenerate a vast amount of logs.
Sophos iView – Logging and Reporting Solution
| Introduction | 8
Sophos iView is a logging and reporting solution that provides organizations with visibility into their networksacross multiple devices for high levels of security, data confidentiality while meeting the requirements of regulatorycompliance.
Enabling centralized reporting from multiple devices across geographical locations, Sophos iView offers a singleview of the entire network activity. This allows organizations not just to view information across hundreds of users,applications and protocols, it also helps them correlate the information, giving them a comprehensive view of networkactivity.
Sophos iView aggregates log and report data from all your Sophos Firewall, Cyberoam and Sophos UTM Devicesinto a consolidated view of all your network activity. Get a clear picture of what is happening on your network at anytime from a single pane of glass.
Moreover, organizations receive logs and reports related to intrusions, attacks, spam and blocked attempts, bothinternal and external, enabling them to take rapid action throughout their network.
Given below are some of the salient features of Reports:
• At-a-glance flow graphs show usage trends and web activity• The daily summary Executive Report keeps you informed• Report anonymization can hide user identities, where needed• Built-in Syslog support and automated log backup options
BasicsThis section provides basic instructions on how to view Reports, in addition to information on configuration settingsrelated to Reports.
Given below are common screen components used to generate and view reports:
• Date Selection• Records per chart• Page Controls• Reports Navigation• Drop Down• Search Reports• Filter Reports• Export to PDF• Export to MS Excel• Bookmark• Schedule• Sort By• Info Icon• Device Selection
Date Selection
1.Use icon to select the time interval for which you want to view the reports. By default, the report for thecurrent date is displayed.
2. Click Generate to generate reports for the selected time interval.
Records per chartSelect the number of records (rows) of the report to be displayed per chart from Records per chart. A chart can have aminimum of 5 and a maximum of 200 rows.
| Introduction | 9
Note: If the number of records are more than 10, then the reports will be displayed in the form of in-linecharts.
Page ControlsEvery report displays the first page of the report along with total number of pages available for the report.
Use the following controls to navigate through pages:
• :Navigate to the next page• :Navigate to the previous page• :Navigate to the first page• :Navigate to the last page
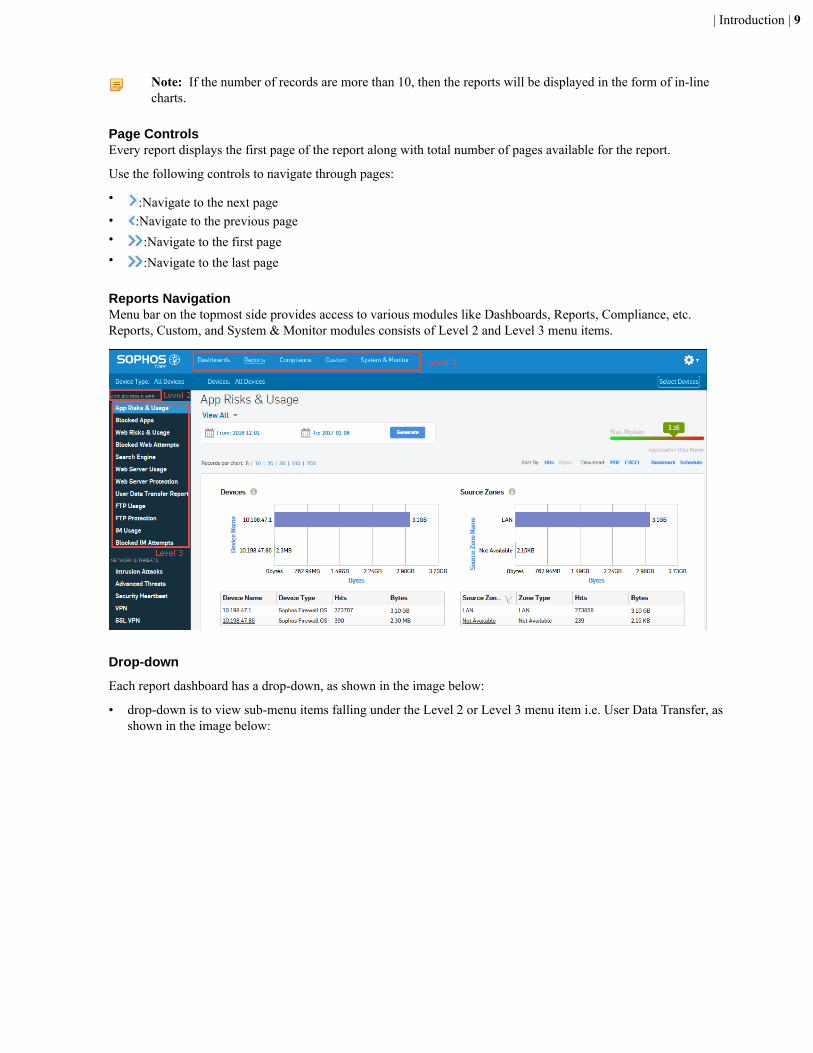
Reports NavigationMenu bar on the topmost side provides access to various modules like Dashboards, Reports, Compliance, etc.Reports, Custom, and System & Monitor modules consists of Level 2 and Level 3 menu items.
Drop-down
Each report dashboard has a drop-down, as shown in the image below:
• drop-down is to view sub-menu items falling under the Level 2 or Level 3 menu item i.e. User Data Transfer, asshown in the image below:
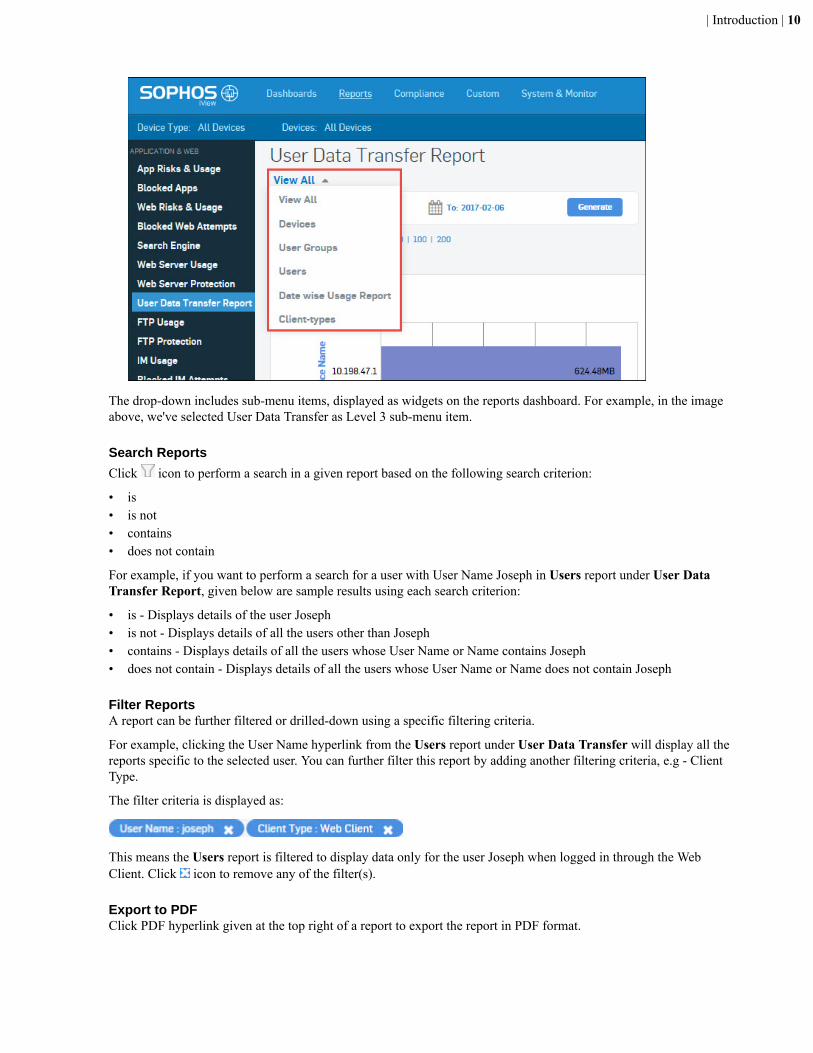
| Introduction | 10
The drop-down includes sub-menu items, displayed as widgets on the reports dashboard. For example, in the imageabove, we've selected User Data Transfer as Level 3 sub-menu item.
Search Reports
Click icon to perform a search in a given report based on the following search criterion:
• is• is not• contains• does not contain
For example, if you want to perform a search for a user with User Name Joseph in Users report under User DataTransfer Report, given below are sample results using each search criterion:
• is - Displays details of the user Joseph• is not - Displays details of all the users other than Joseph• contains - Displays details of all the users whose User Name or Name contains Joseph• does not contain - Displays details of all the users whose User Name or Name does not contain Joseph
Filter ReportsA report can be further filtered or drilled-down using a specific filtering criteria.
For example, clicking the User Name hyperlink from the Users report under User Data Transfer will display all thereports specific to the selected user. You can further filter this report by adding another filtering criteria, e.g - ClientType.
The filter criteria is displayed as:
This means the Users report is filtered to display data only for the user Joseph when logged in through the WebClient. Click icon to remove any of the filter(s).
Export to PDFClick PDF hyperlink given at the top right of a report to export the report in PDF format.

| Introduction | 11
Export to MS ExcelClick EXCEL hyperlink given at the top right of a report to export the report in MS Excel format.
BookmarkUse this to create a bookmark of a report page at any level of drill- down. Click Bookmark hyperlink given at the topright of a report to create a bookmark of the report page. The created bookmark(s) can be viewed from System &Monitor > Log & Report Settings > Bookmark Management.
ScheduleUse this to create a report schedule. Once configured, the Device sends report schedule(s) to specified EmailAddresses as per the configured frequency.
Sort ByUse this option to sort a report data based on the column headings. You can select one column name at a time to sortout the report data in descending order and to regenerate the graph based on sorted data.
Note: This option is not available for Executive,Custom and Compliance reports.
Info Icon (i)
The Info Icon beside any report title indicates one of the 3 things:
• Reports for devices running on Sophos Firewall OS• Reports for devices running on CyberoamOS• Does not report for devices running on Sophos UTM 9.x
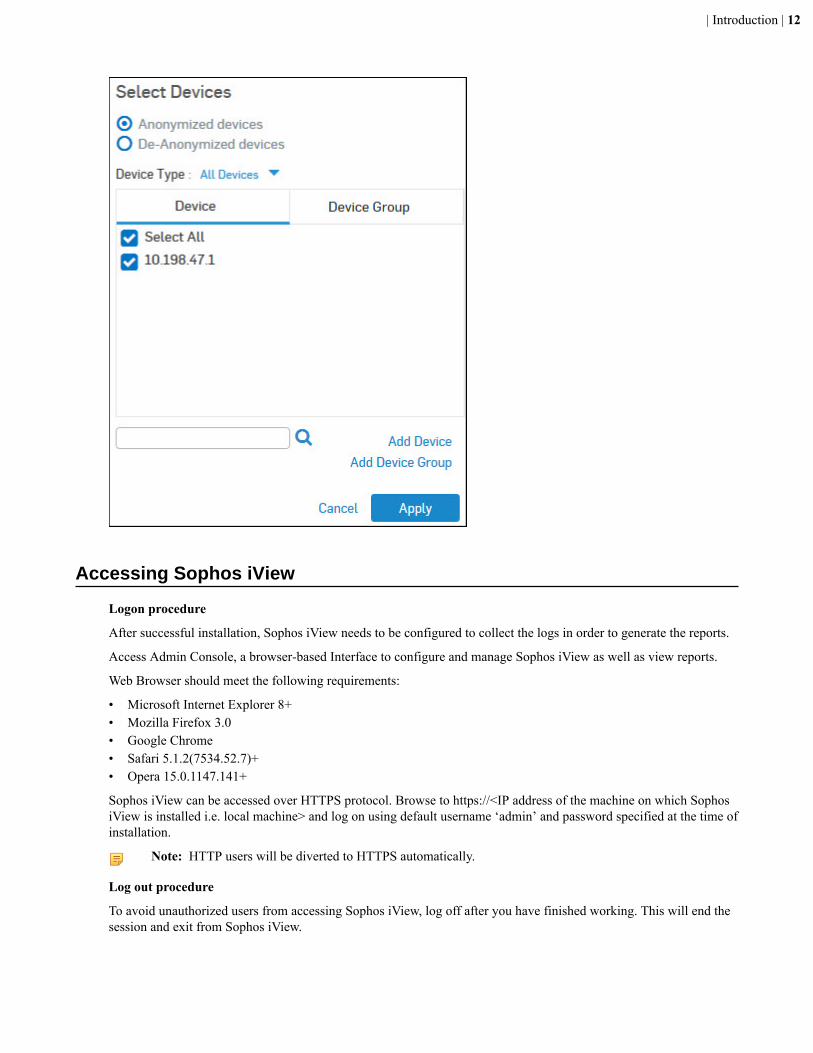
Device Selection
Click on Device Type or Devices, available at the upper left corner of the screen to select an individual device ordevice group from the Select Devices dialog box. Reports or logs for a device can be anonymized or deanonymizedusing the option Anonymized devices or De-anonymized devices.
Note: The Anonymized devices and De-anonymized devices options are only available when the 4-eyeauthentication is enabled by the user.
| Introduction | 12
Accessing Sophos iView
Logon procedure
After successful installation, Sophos iView needs to be configured to collect the logs in order to generate the reports.
Access Admin Console, a browser-based Interface to configure and manage Sophos iView as well as view reports.
Web Browser should meet the following requirements:
• Microsoft Internet Explorer 8+• Mozilla Firefox 3.0• Google Chrome• Safari 5.1.2(7534.52.7)+• Opera 15.0.1147.141+
Sophos iView can be accessed over HTTPS protocol. Browse to https://<IP address of the machine on which SophosiView is installed i.e. local machine> and log on using default username ‘admin’ and password specified at the time ofinstallation.
Note: HTTP users will be diverted to HTTPS automatically.
Log out procedure
To avoid unauthorized users from accessing Sophos iView, log off after you have finished working. This will end thesession and exit from Sophos iView.
| Dashboards | 13
Using Online Help
Sophos iView Online Help is a Web-based help which can be viewed from any of the pages of Web Admin console. Itis installed automatically with the software. To view context sensitive (page-specific) help topic:
•Click in the top right corner of the screen and select Help from the dropdown menu.
• Press F1.
Dashboards
Dashboards provide a comprehensive summary of network traffic passing through the Device as well as securitythreats associated with the processed network traffic.
Sophos iView consists of following Dashboards:
• Main Dashboard• Traffic Dashboard• Security Dashboard• System Dashboard• Executive Report
Main Dashboard
Main Dashboard provides summary of allowed and blocked traffic for the selected Sophos UTM, Cyberoam and/orSophos Firewall device(s) integrated with Sophos iView.
Main Dashboard provides a quick overview of top allowed and blocked traffic of network including Web, FTP, mail,database and other applications.
It displays graphical and tabular overview of allowed and blocked traffic of the top traffic generating applications forall the added devices in a Widget form.
Widget displays report in graphical as well as tabular format. By default, the report is displayed for the current date.Report date can be changed through the Calendar available on the topmost row of the page.
Allowed Traffic Overview
Blocked Traffic Overview
Allowed Traffic Overview
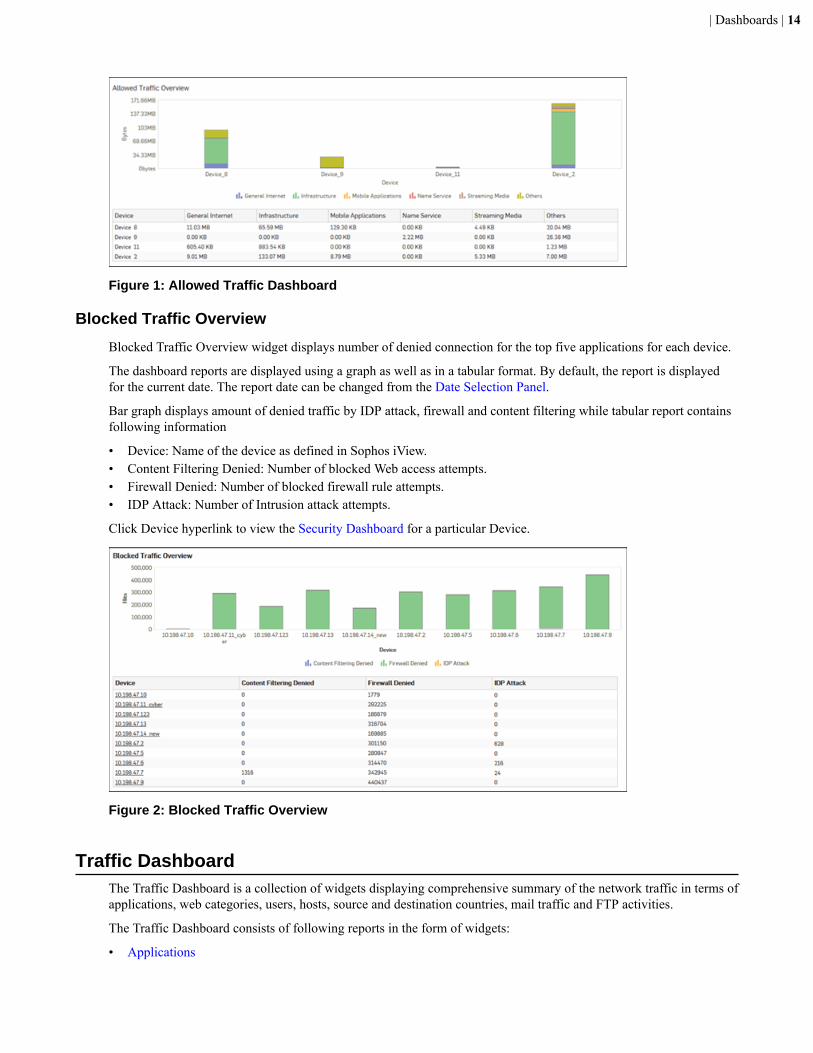
Allowed Traffic Overview displays amount of data transferred by the top six traffic-generating applications for thedevices.
The dashboard reports are displayed using a graph as well as in a tabular format. By default, the report is displayedfor the current date. The report date can be changed from the Date Selection Panel.
Bar graph displays amount of data transferred by top applications while tabular report contains following information:
• Device: Name of the device as defined in Sophos iView.• Applications (e.g. Web, SSL, POP3 etc as shown in the below given screen): Amount of data transfer through each
application.• Others: Amount of data transfer through other applications.
Click Device hyperlink to view the Device specific Traffic Dashboard for a particular Device.
| Dashboards | 14
Figure 1: Allowed Traffic Dashboard
Blocked Traffic Overview
Blocked Traffic Overview widget displays number of denied connection for the top five applications for each device.
The dashboard reports are displayed using a graph as well as in a tabular format. By default, the report is displayedfor the current date. The report date can be changed from the Date Selection Panel.
Bar graph displays amount of denied traffic by IDP attack, firewall and content filtering while tabular report containsfollowing information
• Device: Name of the device as defined in Sophos iView.• Content Filtering Denied: Number of blocked Web access attempts.• Firewall Denied: Number of blocked firewall rule attempts.• IDP Attack: Number of Intrusion attack attempts.
Click Device hyperlink to view the Security Dashboard for a particular Device.
Figure 2: Blocked Traffic Overview
Traffic DashboardThe Traffic Dashboard is a collection of widgets displaying comprehensive summary of the network traffic in terms ofapplications, web categories, users, hosts, source and destination countries, mail traffic and FTP activities.
The Traffic Dashboard consists of following reports in the form of widgets:
• Applications
| Dashboards | 15
• Applications Categories• Application Users• Hosts• Source Countries• Destination Countries• Allowed Policies• Web Categories• Web Users• Web Domains• Web Server Domains on page 25• Files Uploaded via Web• Files Uploaded via FTP• FTP Servers• Mail Traffic Summary• Mail Senders• Mail Recipients• Allowed Traffic Summary• Web Traffic Summary• FTP Traffic Summary
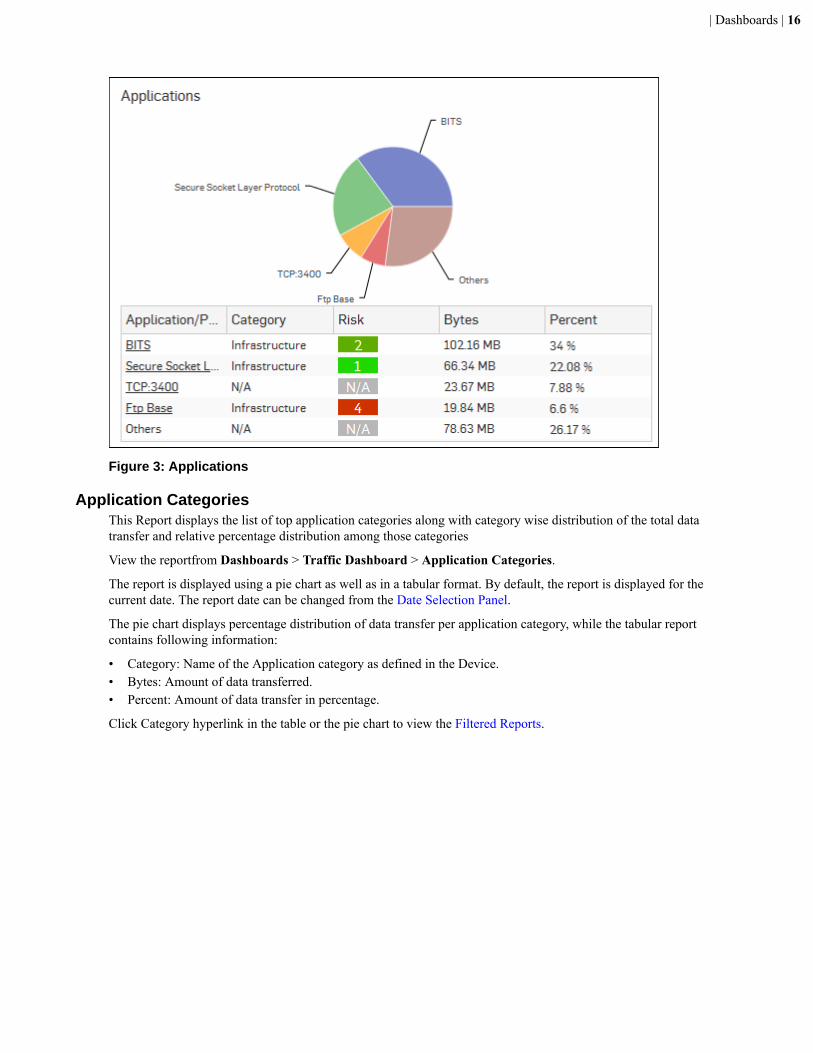
ApplicationsThis Report displays the list of applications along with total data transfer and relative percentage distribution amongstthose applications.
View the reportfrom Dashboards > Traffic Dashboard > Applications.
The report is displayed using a pie chart as well as in a tabular format. By default, the report is displayed for thecurrent date. The report date can be changed from the Date Selection Panel.
The pie chart displays percentage distribution of data transfer per application, while the tabular report contains thefollowing information:
• Application/Proto:Port: Name of the application. If the application is not defined in the Device, then this fielddisplays the application identifier as a combination of protocol and port number.
• Category: Name of application category as defined in the Device.• Risk: Risk level associated with the application. This is a numeric value. Higher value represents higher risk.• Bytes: The amount of data transferred per application.• Percent: The amount of data transfer per application, in percentage.
Click Application hyperlink in the table or the pie chart to view the Filtered Reports.
| Dashboards | 16
Figure 3: Applications
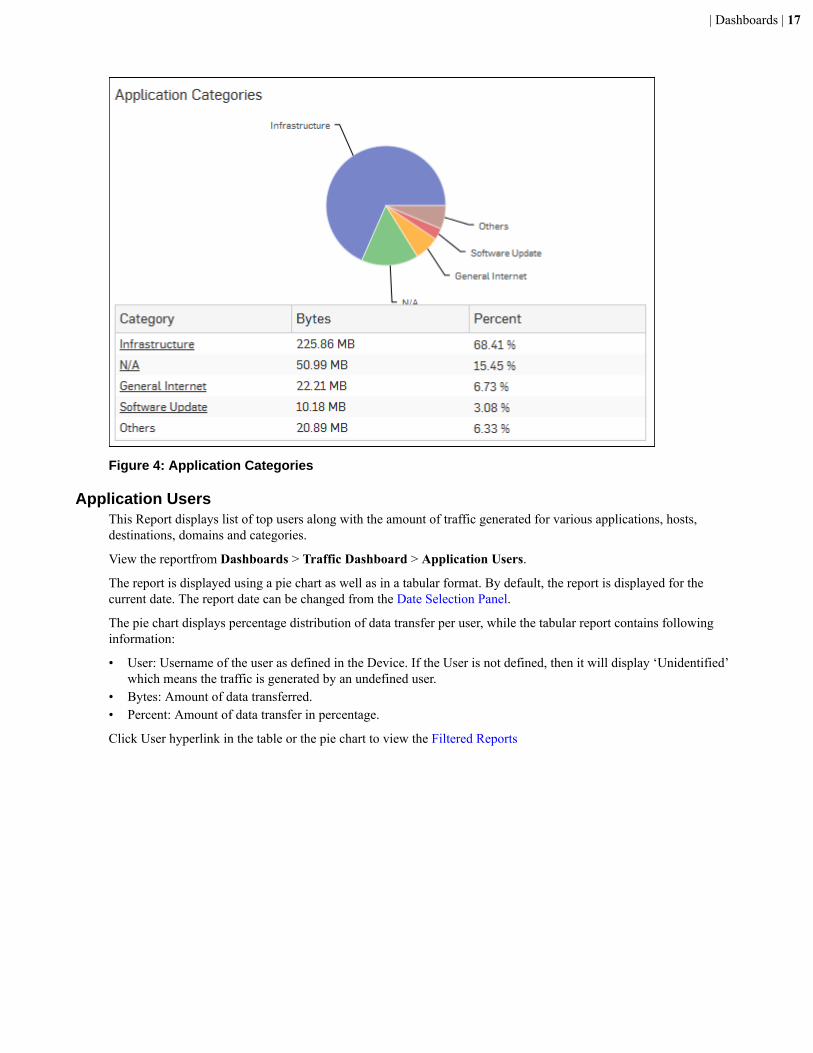
Application CategoriesThis Report displays the list of top application categories along with category wise distribution of the total datatransfer and relative percentage distribution among those categories
View the reportfrom Dashboards > Traffic Dashboard > Application Categories.
The report is displayed using a pie chart as well as in a tabular format. By default, the report is displayed for thecurrent date. The report date can be changed from the Date Selection Panel.
The pie chart displays percentage distribution of data transfer per application category, while the tabular reportcontains following information:
• Category: Name of the Application category as defined in the Device.• Bytes: Amount of data transferred.• Percent: Amount of data transfer in percentage.
Click Category hyperlink in the table or the pie chart to view the Filtered Reports.
| Dashboards | 17
Figure 4: Application Categories
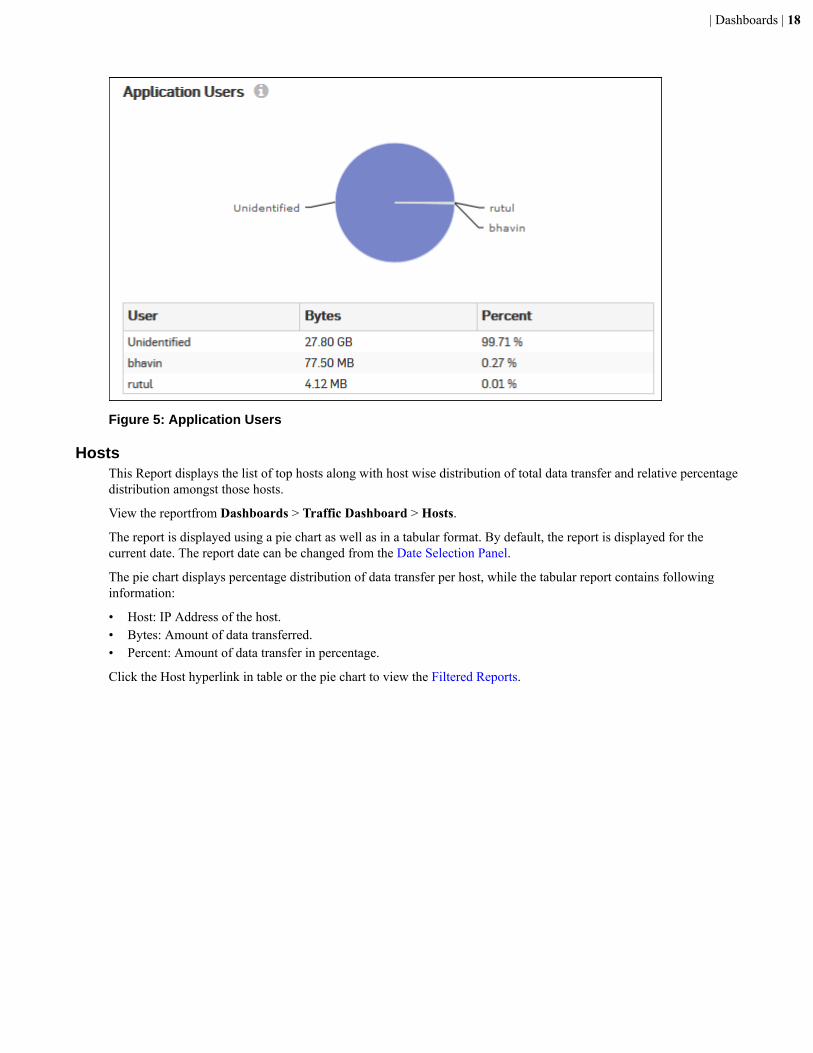
Application UsersThis Report displays list of top users along with the amount of traffic generated for various applications, hosts,destinations, domains and categories.
View the reportfrom Dashboards > Traffic Dashboard > Application Users.
The report is displayed using a pie chart as well as in a tabular format. By default, the report is displayed for thecurrent date. The report date can be changed from the Date Selection Panel.
The pie chart displays percentage distribution of data transfer per user, while the tabular report contains followinginformation:
• User: Username of the user as defined in the Device. If the User is not defined, then it will display ‘Unidentified’which means the traffic is generated by an undefined user.
• Bytes: Amount of data transferred.• Percent: Amount of data transfer in percentage.
Click User hyperlink in the table or the pie chart to view the Filtered Reports
| Dashboards | 18
Figure 5: Application Users
HostsThis Report displays the list of top hosts along with host wise distribution of total data transfer and relative percentagedistribution amongst those hosts.
View the reportfrom Dashboards > Traffic Dashboard > Hosts.
The report is displayed using a pie chart as well as in a tabular format. By default, the report is displayed for thecurrent date. The report date can be changed from the Date Selection Panel.
The pie chart displays percentage distribution of data transfer per host, while the tabular report contains followinginformation:
• Host: IP Address of the host.• Bytes: Amount of data transferred.• Percent: Amount of data transfer in percentage.
Click the Host hyperlink in table or the pie chart to view the Filtered Reports.

| Dashboards | 19
Figure 6: Hosts
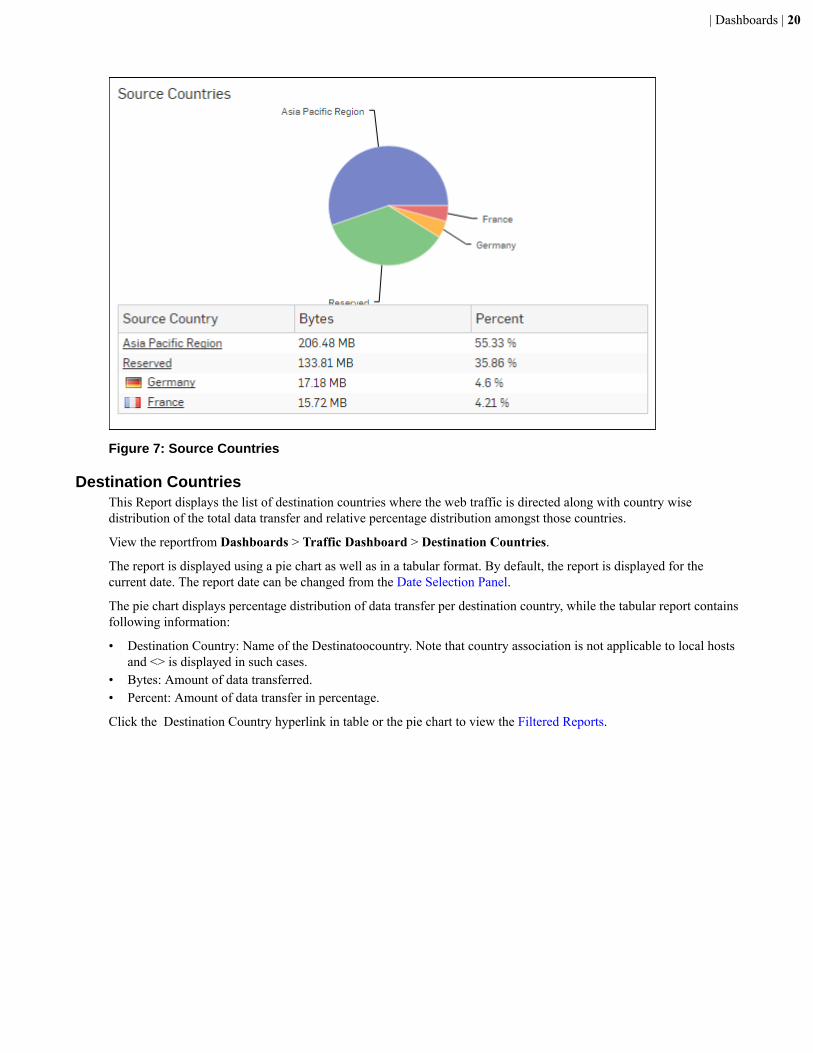
Source CountriesThis Report displays the list of source countries from where the Internet traffic is originated along with total datatransfer and relative percentage distribution amongst those countries.
View the reportfrom Dashboards > Traffic Dashboard > Source Countries.
The report is displayed using a pie chart as well as in a tabular format. By default, the report is displayed for thecurrent date. The report date can be changed from the Date Selection Panel.
The pie chart displays percentage distribution of data transfer per source country, while the tabular report containsfollowing information:
• Source Country: Name of the source country. Note that country association is not applicable to local hosts and'Unknown' is displayed in such cases.
• Bytes: Amount of data transferred.• Percent: Amount of data transfer in percentage.
Click the Source Country hyperlink in table or the pie chart to view the Filtered Reports
| Dashboards | 20
Figure 7: Source Countries
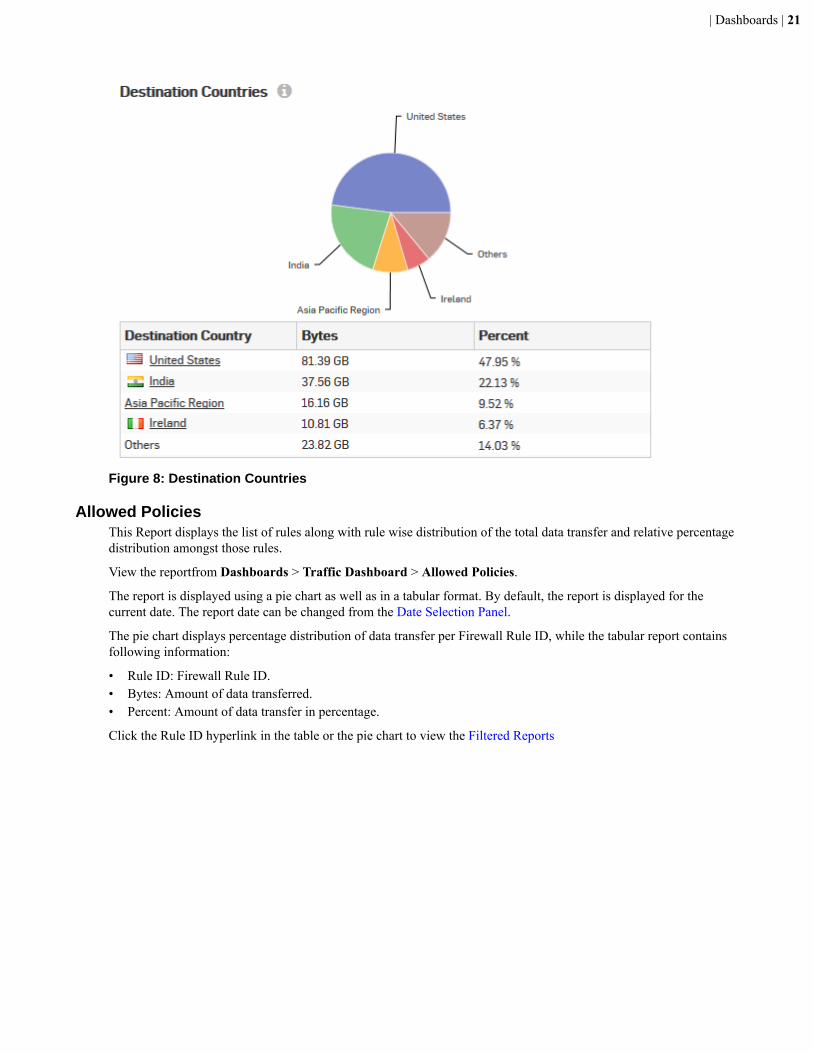
Destination CountriesThis Report displays the list of destination countries where the web traffic is directed along with country wisedistribution of the total data transfer and relative percentage distribution amongst those countries.
View the reportfrom Dashboards > Traffic Dashboard > Destination Countries.
The report is displayed using a pie chart as well as in a tabular format. By default, the report is displayed for thecurrent date. The report date can be changed from the Date Selection Panel.
The pie chart displays percentage distribution of data transfer per destination country, while the tabular report containsfollowing information:
• Destination Country: Name of the Destinatoocountry. Note that country association is not applicable to local hostsand <> is displayed in such cases.
• Bytes: Amount of data transferred.• Percent: Amount of data transfer in percentage.
Click the Destination Country hyperlink in table or the pie chart to view the Filtered Reports.
| Dashboards | 21
Figure 8: Destination Countries
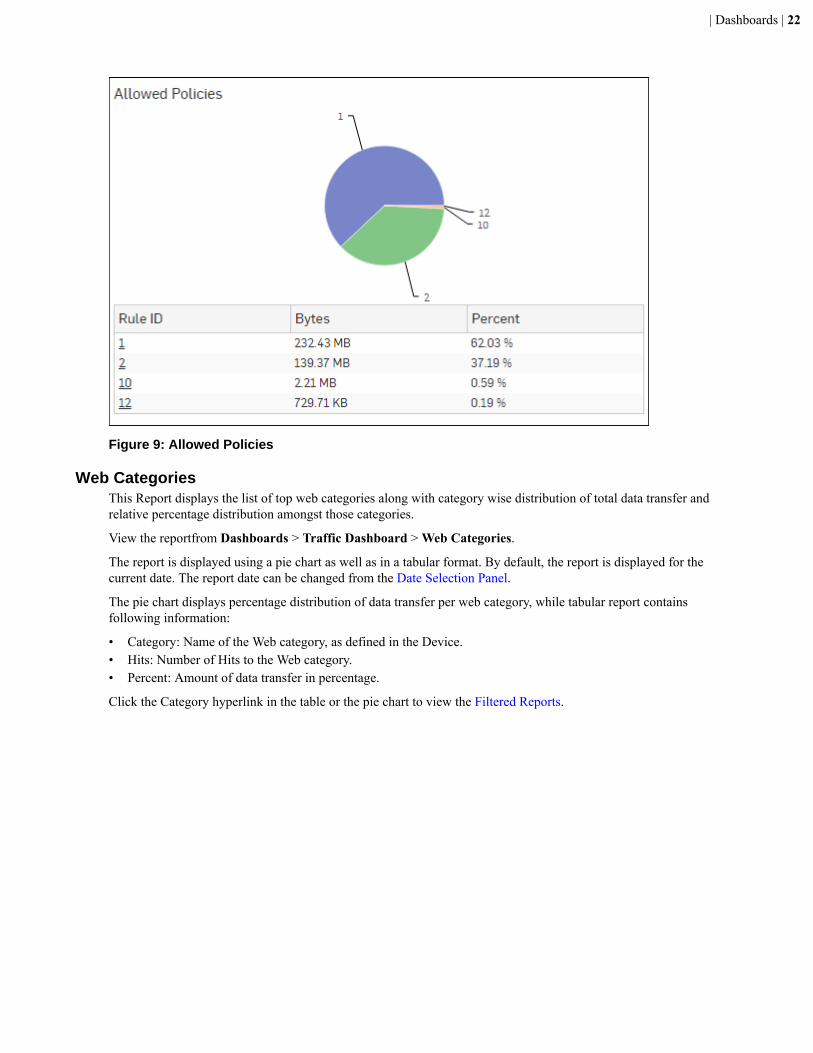
Allowed PoliciesThis Report displays the list of rules along with rule wise distribution of the total data transfer and relative percentagedistribution amongst those rules.
View the reportfrom Dashboards > Traffic Dashboard > Allowed Policies.
The report is displayed using a pie chart as well as in a tabular format. By default, the report is displayed for thecurrent date. The report date can be changed from the Date Selection Panel.
The pie chart displays percentage distribution of data transfer per Firewall Rule ID, while the tabular report containsfollowing information:
• Rule ID: Firewall Rule ID.• Bytes: Amount of data transferred.• Percent: Amount of data transfer in percentage.
Click the Rule ID hyperlink in the table or the pie chart to view the Filtered Reports
| Dashboards | 22
Figure 9: Allowed Policies
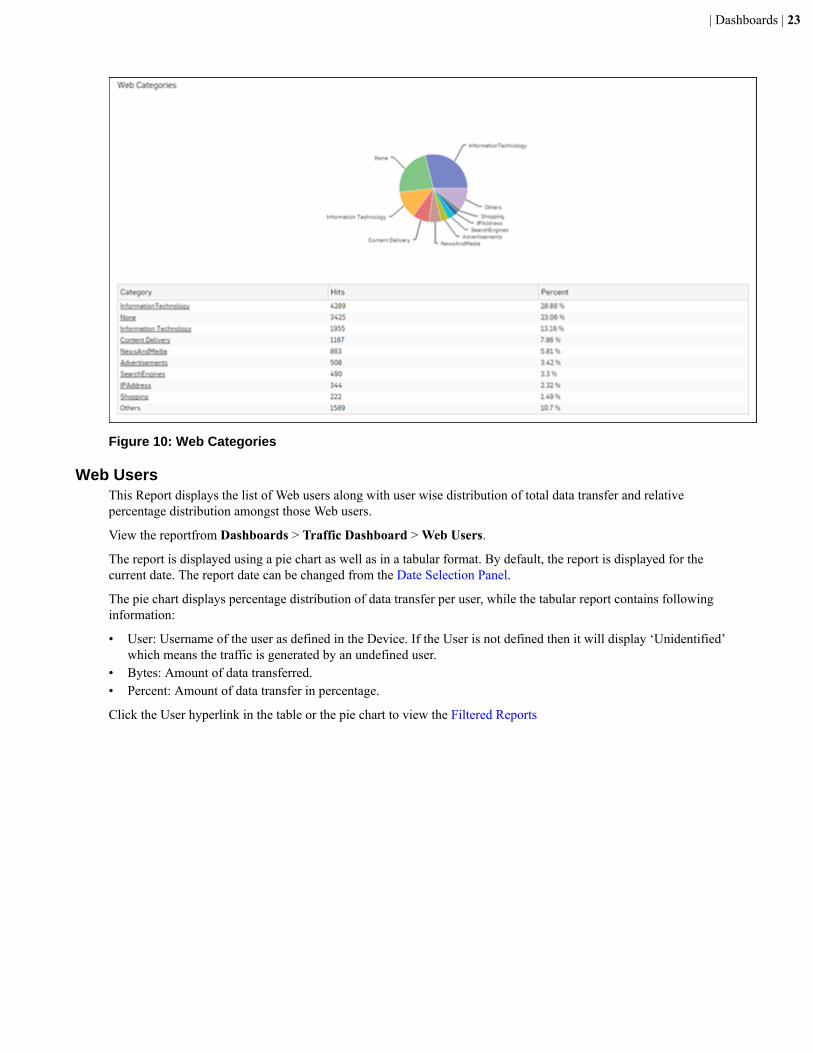
Web CategoriesThis Report displays the list of top web categories along with category wise distribution of total data transfer andrelative percentage distribution amongst those categories.
View the reportfrom Dashboards > Traffic Dashboard > Web Categories.
The report is displayed using a pie chart as well as in a tabular format. By default, the report is displayed for thecurrent date. The report date can be changed from the Date Selection Panel.
The pie chart displays percentage distribution of data transfer per web category, while tabular report containsfollowing information:
• Category: Name of the Web category, as defined in the Device.• Hits: Number of Hits to the Web category.• Percent: Amount of data transfer in percentage.
Click the Category hyperlink in the table or the pie chart to view the Filtered Reports.
| Dashboards | 23
Figure 10: Web Categories
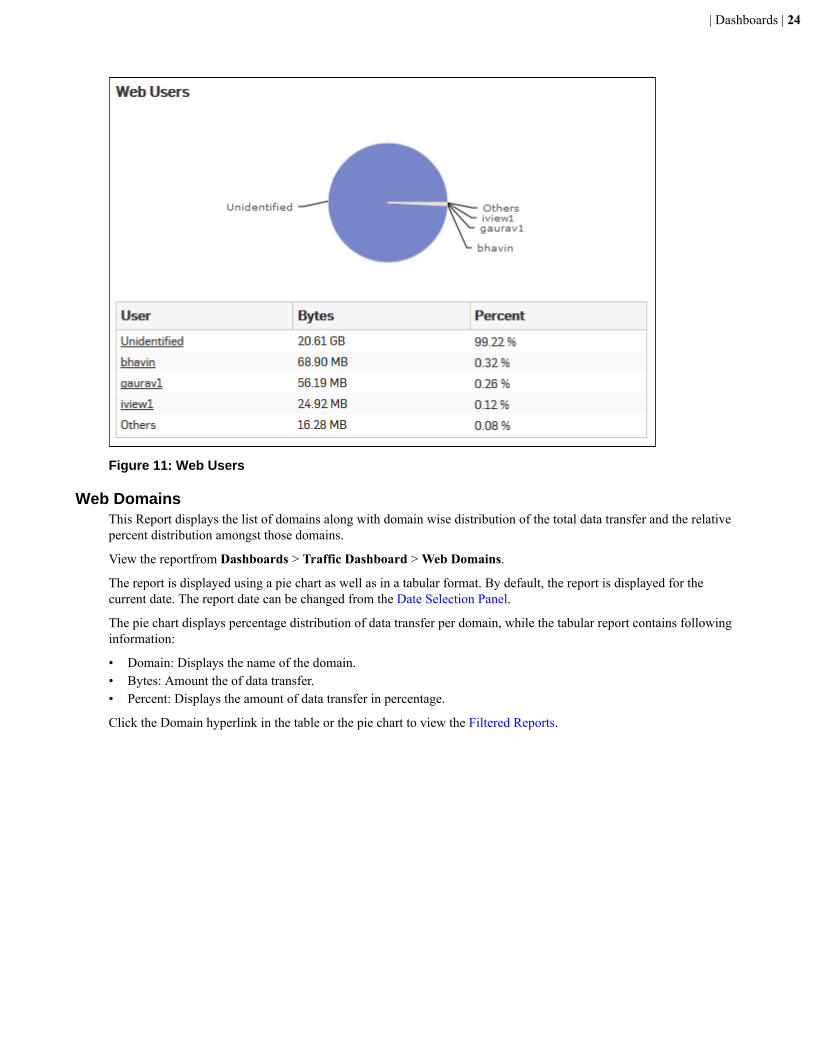
Web UsersThis Report displays the list of Web users along with user wise distribution of total data transfer and relativepercentage distribution amongst those Web users.
View the reportfrom Dashboards > Traffic Dashboard > Web Users.
The report is displayed using a pie chart as well as in a tabular format. By default, the report is displayed for thecurrent date. The report date can be changed from the Date Selection Panel.
The pie chart displays percentage distribution of data transfer per user, while the tabular report contains followinginformation:
• User: Username of the user as defined in the Device. If the User is not defined then it will display ‘Unidentified’which means the traffic is generated by an undefined user.
• Bytes: Amount of data transferred.• Percent: Amount of data transfer in percentage.
Click the User hyperlink in the table or the pie chart to view the Filtered Reports
| Dashboards | 24
Figure 11: Web Users
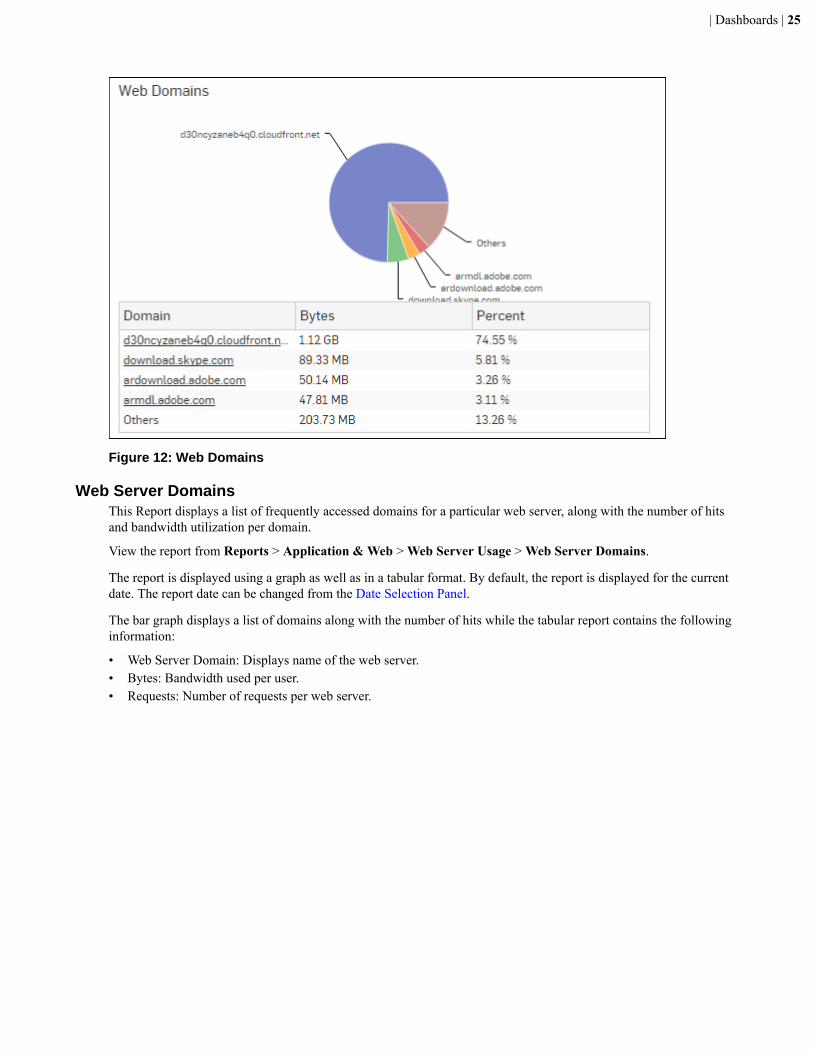
Web DomainsThis Report displays the list of domains along with domain wise distribution of the total data transfer and the relativepercent distribution amongst those domains.
View the reportfrom Dashboards > Traffic Dashboard > Web Domains.
The report is displayed using a pie chart as well as in a tabular format. By default, the report is displayed for thecurrent date. The report date can be changed from the Date Selection Panel.
The pie chart displays percentage distribution of data transfer per domain, while the tabular report contains followinginformation:
• Domain: Displays the name of the domain.• Bytes: Amount the of data transfer.• Percent: Displays the amount of data transfer in percentage.
Click the Domain hyperlink in the table or the pie chart to view the Filtered Reports.
| Dashboards | 25
Figure 12: Web Domains
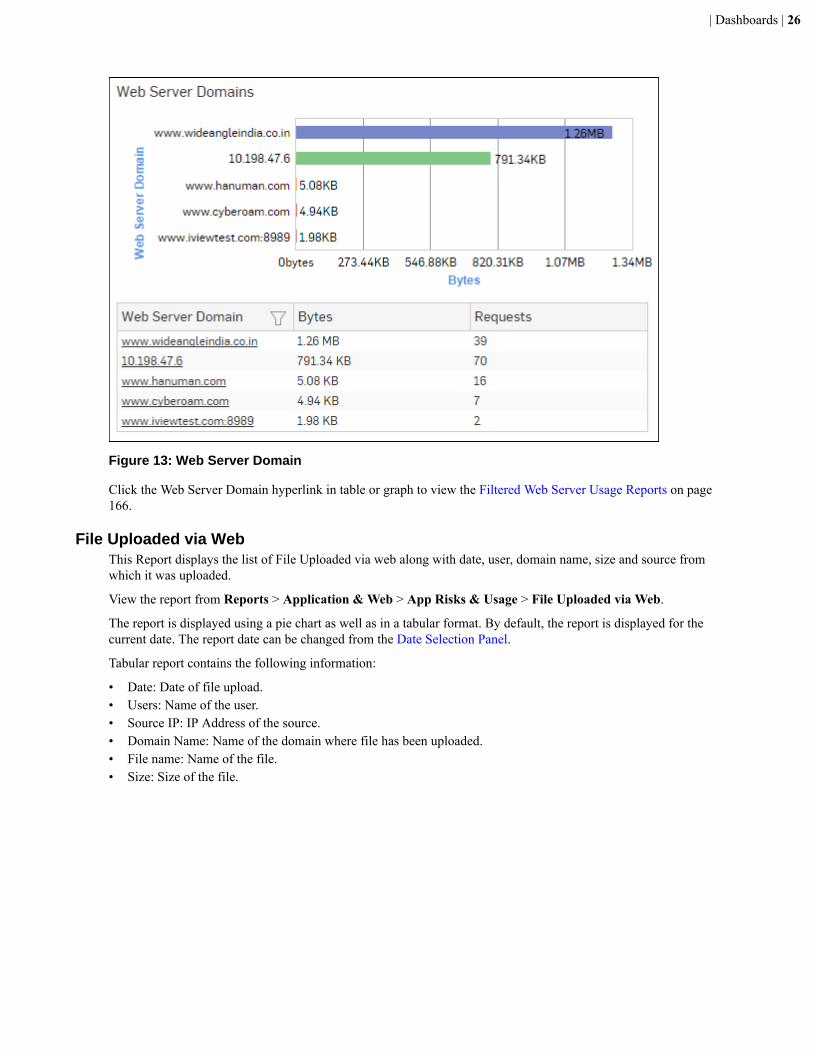
Web Server DomainsThis Report displays a list of frequently accessed domains for a particular web server, along with the number of hitsand bandwidth utilization per domain.
View the report from Reports > Application & Web > Web Server Usage > Web Server Domains.
The report is displayed using a graph as well as in a tabular format. By default, the report is displayed for the currentdate. The report date can be changed from the Date Selection Panel.
The bar graph displays a list of domains along with the number of hits while the tabular report contains the followinginformation:
• Web Server Domain: Displays name of the web server.• Bytes: Bandwidth used per user.• Requests: Number of requests per web server.
| Dashboards | 26
Figure 13: Web Server Domain
Click the Web Server Domain hyperlink in table or graph to view the Filtered Web Server Usage Reports on page166.
File Uploaded via WebThis Report displays the list of File Uploaded via web along with date, user, domain name, size and source fromwhich it was uploaded.
View the report from Reports > Application & Web > App Risks & Usage > File Uploaded via Web.
The report is displayed using a pie chart as well as in a tabular format. By default, the report is displayed for thecurrent date. The report date can be changed from the Date Selection Panel.
Tabular report contains the following information:
• Date: Date of file upload.• Users: Name of the user.• Source IP: IP Address of the source.• Domain Name: Name of the domain where file has been uploaded.• File name: Name of the file.• Size: Size of the file.
| Dashboards | 27
Figure 14: File Uploaded via Web
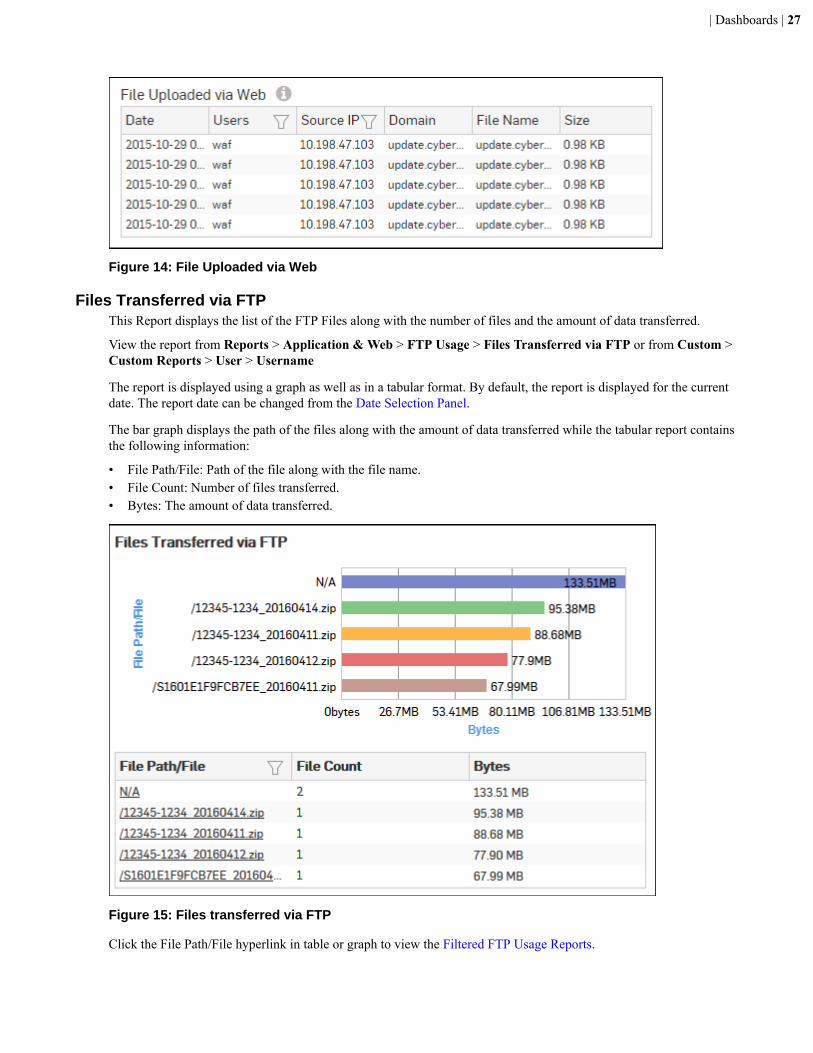
Files Transferred via FTPThis Report displays the list of the FTP Files along with the number of files and the amount of data transferred.
View the report from Reports > Application & Web > FTP Usage > Files Transferred via FTP or from Custom >Custom Reports > User > Username
The report is displayed using a graph as well as in a tabular format. By default, the report is displayed for the currentdate. The report date can be changed from the Date Selection Panel.
The bar graph displays the path of the files along with the amount of data transferred while the tabular report containsthe following information:
• File Path/File: Path of the file along with the file name.• File Count: Number of files transferred.• Bytes: The amount of data transferred.
Figure 15: Files transferred via FTP
Click the File Path/File hyperlink in table or graph to view the Filtered FTP Usage Reports.
| Dashboards | 28
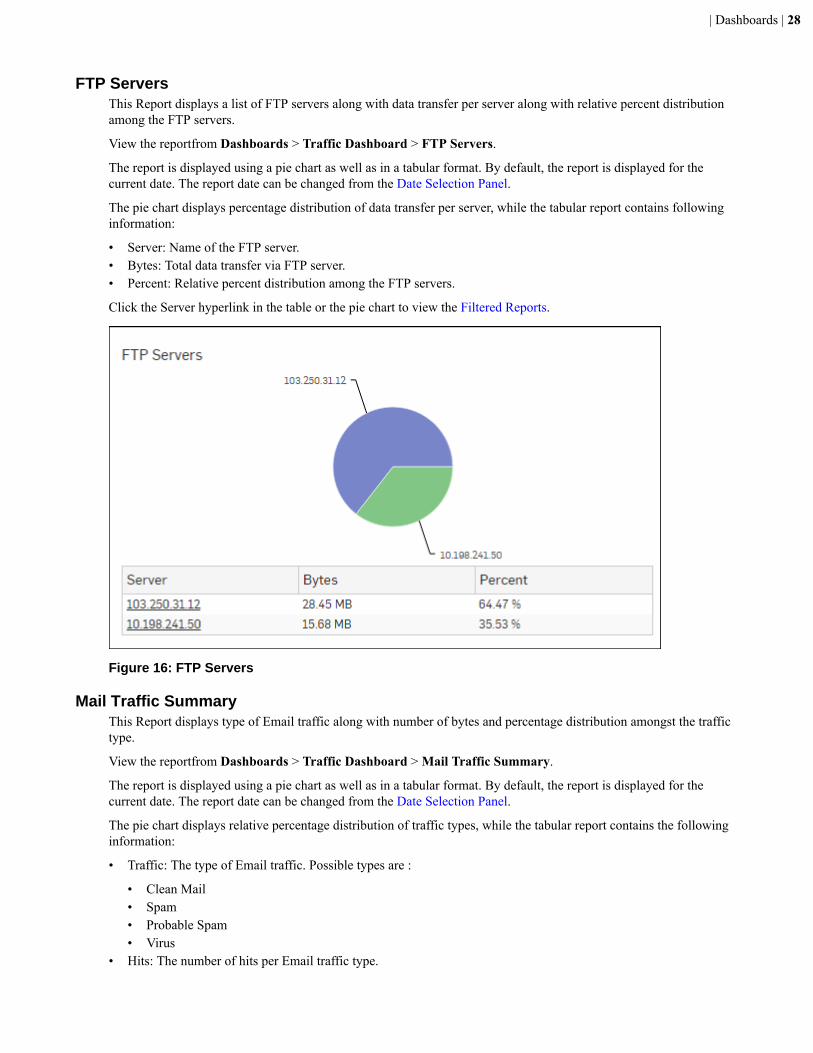
FTP ServersThis Report displays a list of FTP servers along with data transfer per server along with relative percent distributionamong the FTP servers.
View the reportfrom Dashboards > Traffic Dashboard > FTP Servers.
The report is displayed using a pie chart as well as in a tabular format. By default, the report is displayed for thecurrent date. The report date can be changed from the Date Selection Panel.
The pie chart displays percentage distribution of data transfer per server, while the tabular report contains followinginformation:
• Server: Name of the FTP server.• Bytes: Total data transfer via FTP server.• Percent: Relative percent distribution among the FTP servers.
Click the Server hyperlink in the table or the pie chart to view the Filtered Reports.
Figure 16: FTP Servers
Mail Traffic SummaryThis Report displays type of Email traffic along with number of bytes and percentage distribution amongst the traffictype.
View the reportfrom Dashboards > Traffic Dashboard > Mail Traffic Summary.
The report is displayed using a pie chart as well as in a tabular format. By default, the report is displayed for thecurrent date. The report date can be changed from the Date Selection Panel.
The pie chart displays relative percentage distribution of traffic types, while the tabular report contains the followinginformation:
• Traffic: The type of Email traffic. Possible types are :
• Clean Mail• Spam• Probable Spam• Virus
• Hits: The number of hits per Email traffic type.
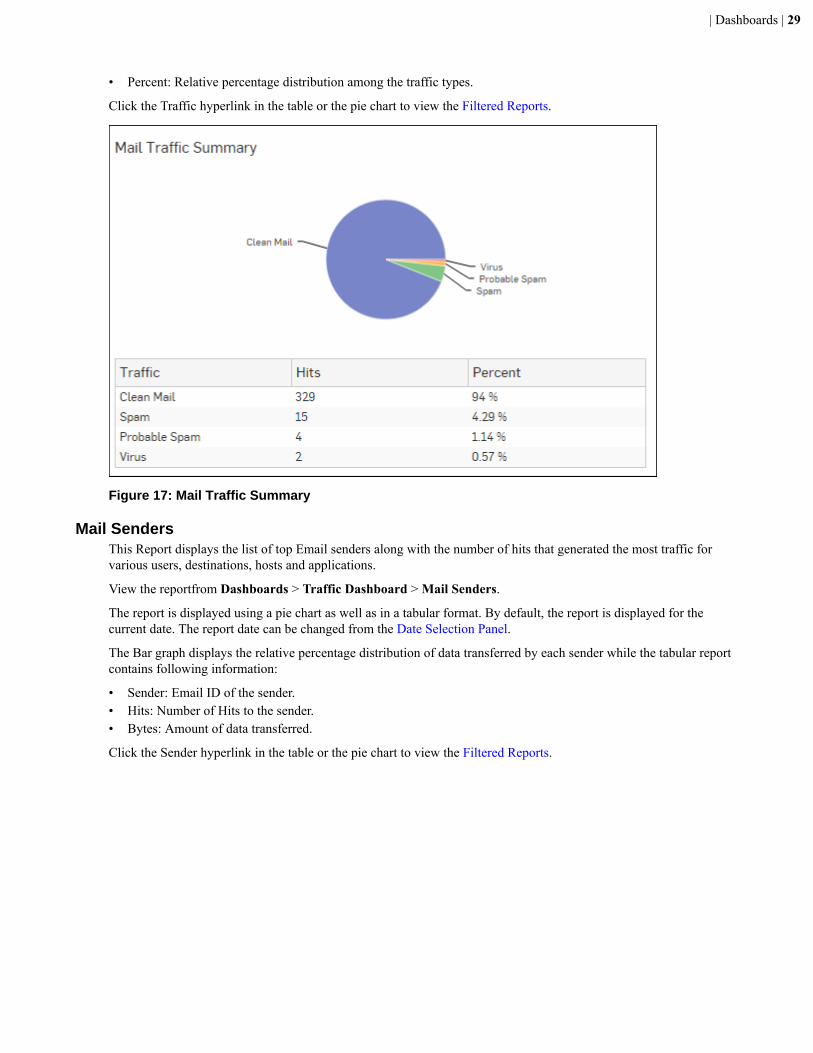
| Dashboards | 29
• Percent: Relative percentage distribution among the traffic types.
Click the Traffic hyperlink in the table or the pie chart to view the Filtered Reports.
Figure 17: Mail Traffic Summary
Mail SendersThis Report displays the list of top Email senders along with the number of hits that generated the most traffic forvarious users, destinations, hosts and applications.
View the reportfrom Dashboards > Traffic Dashboard > Mail Senders.
The report is displayed using a pie chart as well as in a tabular format. By default, the report is displayed for thecurrent date. The report date can be changed from the Date Selection Panel.
The Bar graph displays the relative percentage distribution of data transferred by each sender while the tabular reportcontains following information:
• Sender: Email ID of the sender.• Hits: Number of Hits to the sender.• Bytes: Amount of data transferred.
Click the Sender hyperlink in the table or the pie chart to view the Filtered Reports.

| Dashboards | 30
Figure 18: Mail Senders
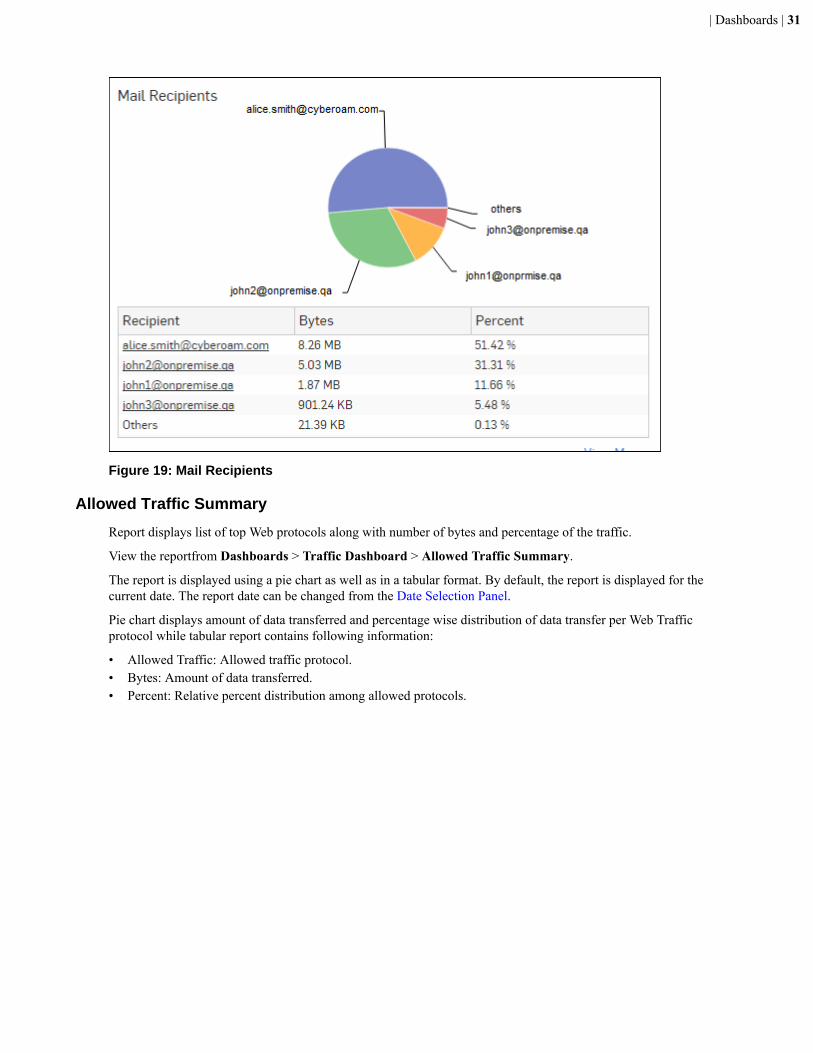
Mail RecipientsThis Report displays list of top Email recipients along with the number of hits that generated the most traffic forvarious users, destinations, hosts and applications.
View the reportfrom Dashboards > Traffic Dashboard > Mail Recipients.
The report is displayed using a pie chart as well as in a tabular format. By default, the report is displayed for thecurrent date. The report date can be changed from the Date Selection Panel.
The Bar graph displays the relative percentage distribution of data transferred by each recipient while the tabularreport contains following information:
• Recipient: Email ID of the recipient.• Hits: Number of Hits to the recipient.• Bytes: Amount of data transferred.
Click the Recipient hyperlink in the table or the pie chart to view the Filtered Reports.
| Dashboards | 31
Figure 19: Mail Recipients
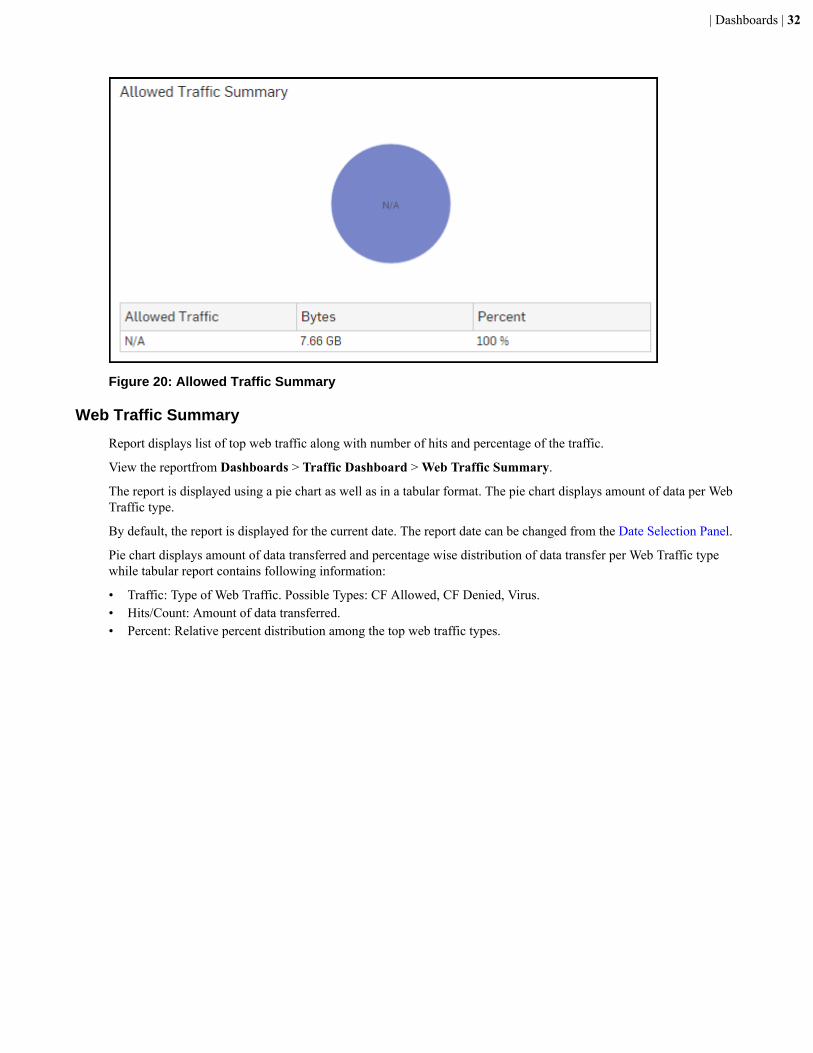
Allowed Traffic Summary
Report displays list of top Web protocols along with number of bytes and percentage of the traffic.
View the reportfrom Dashboards > Traffic Dashboard > Allowed Traffic Summary.
The report is displayed using a pie chart as well as in a tabular format. By default, the report is displayed for thecurrent date. The report date can be changed from the Date Selection Panel.
Pie chart displays amount of data transferred and percentage wise distribution of data transfer per Web Trafficprotocol while tabular report contains following information:
• Allowed Traffic: Allowed traffic protocol.• Bytes: Amount of data transferred.• Percent: Relative percent distribution among allowed protocols.
| Dashboards | 32
Figure 20: Allowed Traffic Summary
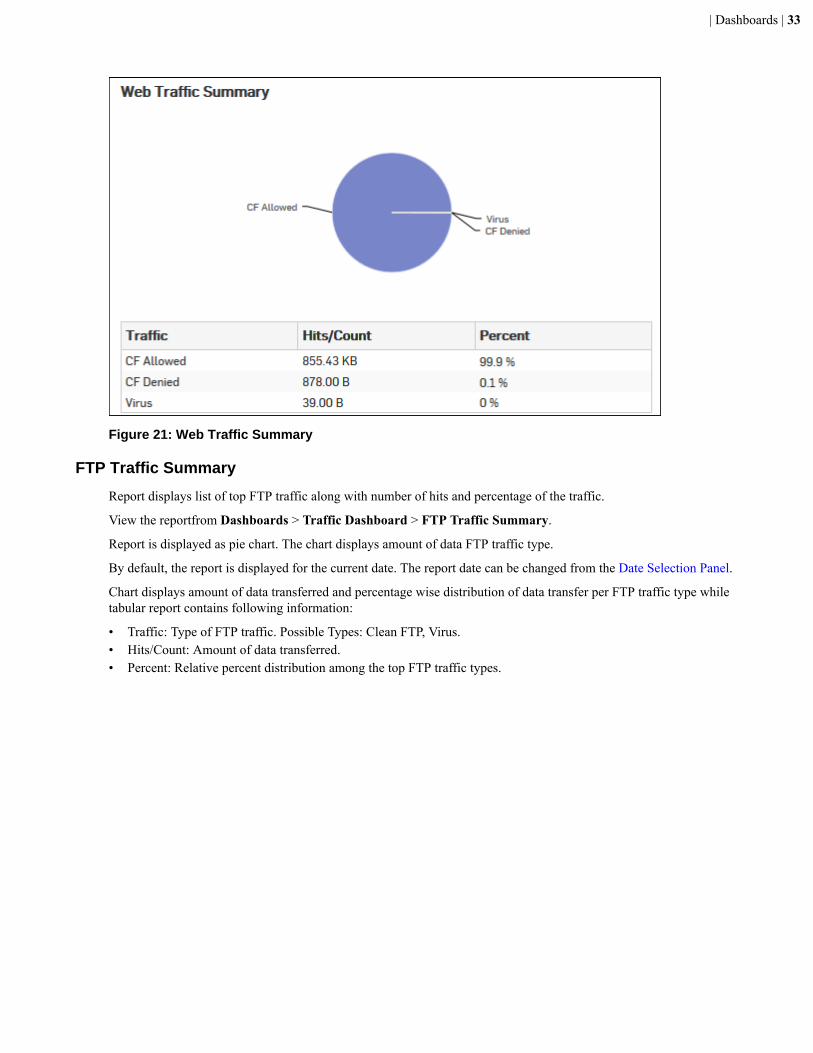
Web Traffic Summary
Report displays list of top web traffic along with number of hits and percentage of the traffic.
View the reportfrom Dashboards > Traffic Dashboard > Web Traffic Summary.
The report is displayed using a pie chart as well as in a tabular format. The pie chart displays amount of data per WebTraffic type.
By default, the report is displayed for the current date. The report date can be changed from the Date Selection Panel.
Pie chart displays amount of data transferred and percentage wise distribution of data transfer per Web Traffic typewhile tabular report contains following information:
• Traffic: Type of Web Traffic. Possible Types: CF Allowed, CF Denied, Virus.• Hits/Count: Amount of data transferred.• Percent: Relative percent distribution among the top web traffic types.
| Dashboards | 33
Figure 21: Web Traffic Summary
FTP Traffic Summary
Report displays list of top FTP traffic along with number of hits and percentage of the traffic.
View the reportfrom Dashboards > Traffic Dashboard > FTP Traffic Summary.
Report is displayed as pie chart. The chart displays amount of data FTP traffic type.
By default, the report is displayed for the current date. The report date can be changed from the Date Selection Panel.
Chart displays amount of data transferred and percentage wise distribution of data transfer per FTP traffic type whiletabular report contains following information:
• Traffic: Type of FTP traffic. Possible Types: Clean FTP, Virus.• Hits/Count: Amount of data transferred.• Percent: Relative percent distribution among the top FTP traffic types.
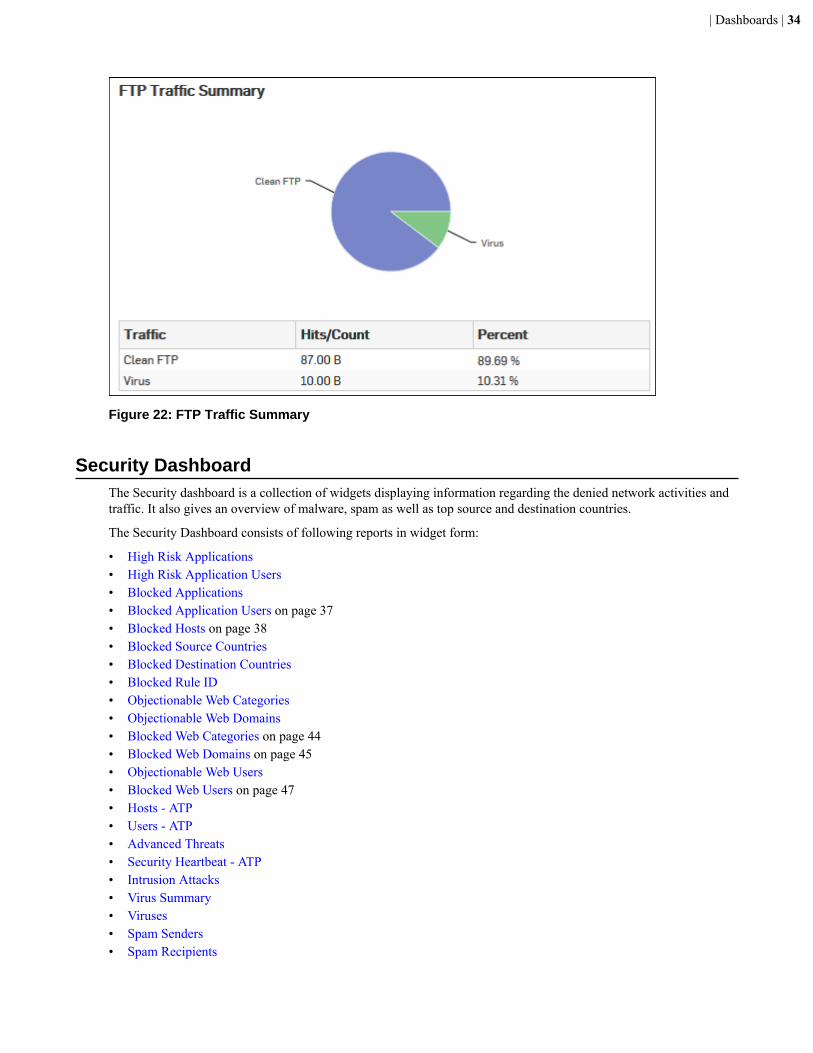
| Dashboards | 34
Figure 22: FTP Traffic Summary
Security DashboardThe Security dashboard is a collection of widgets displaying information regarding the denied network activities andtraffic. It also gives an overview of malware, spam as well as top source and destination countries.
The Security Dashboard consists of following reports in widget form:
• High Risk Applications• High Risk Application Users• Blocked Applications• Blocked Application Users on page 37• Blocked Hosts on page 38• Blocked Source Countries• Blocked Destination Countries• Blocked Rule ID• Objectionable Web Categories• Objectionable Web Domains• Blocked Web Categories on page 44• Blocked Web Domains on page 45• Objectionable Web Users• Blocked Web Users on page 47• Hosts - ATP• Users - ATP• Advanced Threats• Security Heartbeat - ATP• Intrusion Attacks• Virus Summary• Viruses• Spam Senders• Spam Recipients
| Dashboards | 35
• Spam Summary• Content Filtering Blocked Summary• Blocked Traffic Summary• Detailed View - Client Health• Attacked Web Server Domains• Blocked Web Server Requests
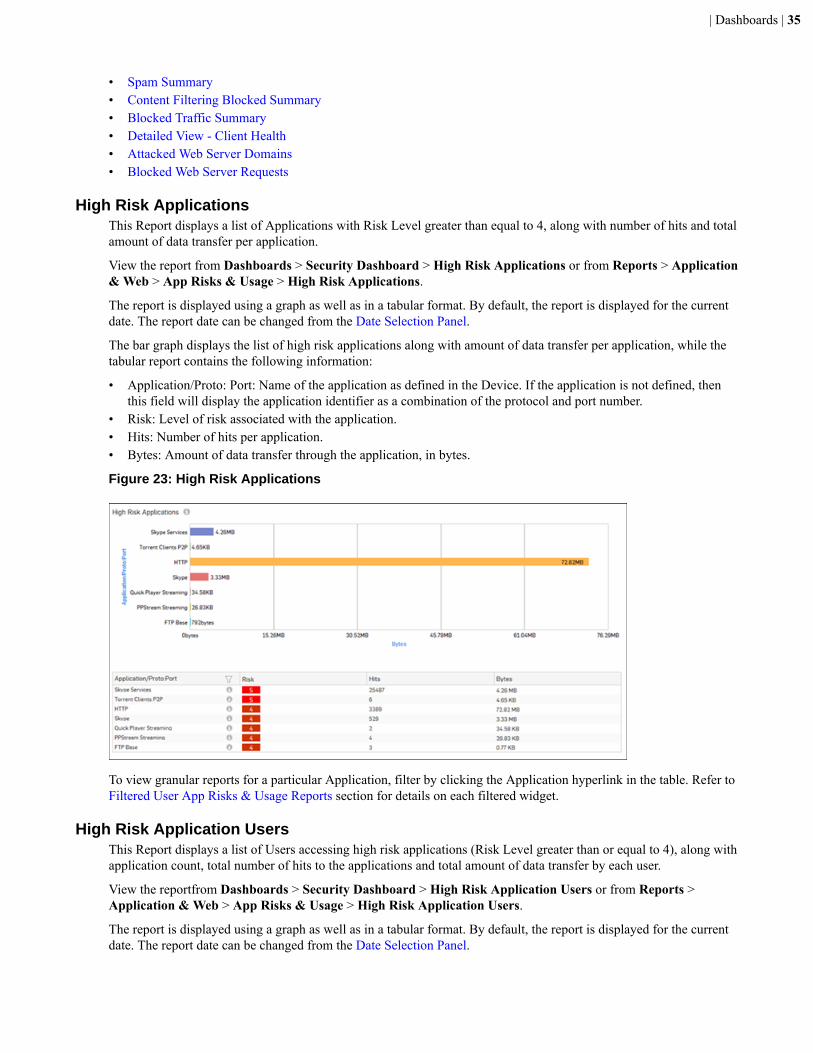
High Risk ApplicationsThis Report displays a list of Applications with Risk Level greater than equal to 4, along with number of hits and totalamount of data transfer per application.
View the report from Dashboards > Security Dashboard > High Risk Applications or from Reports > Application& Web > App Risks & Usage > High Risk Applications.
The report is displayed using a graph as well as in a tabular format. By default, the report is displayed for the currentdate. The report date can be changed from the Date Selection Panel.
The bar graph displays the list of high risk applications along with amount of data transfer per application, while thetabular report contains the following information:
• Application/Proto: Port: Name of the application as defined in the Device. If the application is not defined, thenthis field will display the application identifier as a combination of the protocol and port number.
• Risk: Level of risk associated with the application.• Hits: Number of hits per application.• Bytes: Amount of data transfer through the application, in bytes.
Figure 23: High Risk Applications
To view granular reports for a particular Application, filter by clicking the Application hyperlink in the table. Refer toFiltered User App Risks & Usage Reports section for details on each filtered widget.
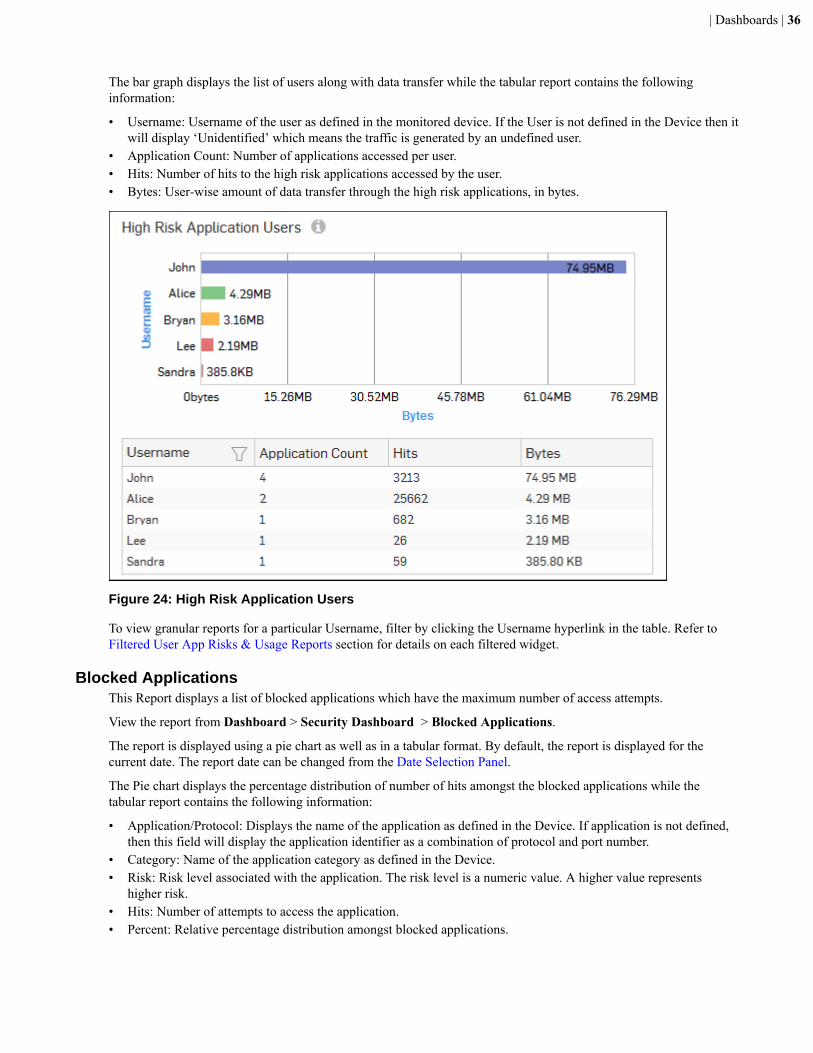
High Risk Application UsersThis Report displays a list of Users accessing high risk applications (Risk Level greater than or equal to 4), along withapplication count, total number of hits to the applications and total amount of data transfer by each user.
View the reportfrom Dashboards > Security Dashboard > High Risk Application Users or from Reports >Application & Web > App Risks & Usage > High Risk Application Users.
The report is displayed using a graph as well as in a tabular format. By default, the report is displayed for the currentdate. The report date can be changed from the Date Selection Panel.
| Dashboards | 36
The bar graph displays the list of users along with data transfer while the tabular report contains the followinginformation:
• Username: Username of the user as defined in the monitored device. If the User is not defined in the Device then itwill display ‘Unidentified’ which means the traffic is generated by an undefined user.
• Application Count: Number of applications accessed per user.• Hits: Number of hits to the high risk applications accessed by the user.• Bytes: User-wise amount of data transfer through the high risk applications, in bytes.
Figure 24: High Risk Application Users
To view granular reports for a particular Username, filter by clicking the Username hyperlink in the table. Refer toFiltered User App Risks & Usage Reports section for details on each filtered widget.
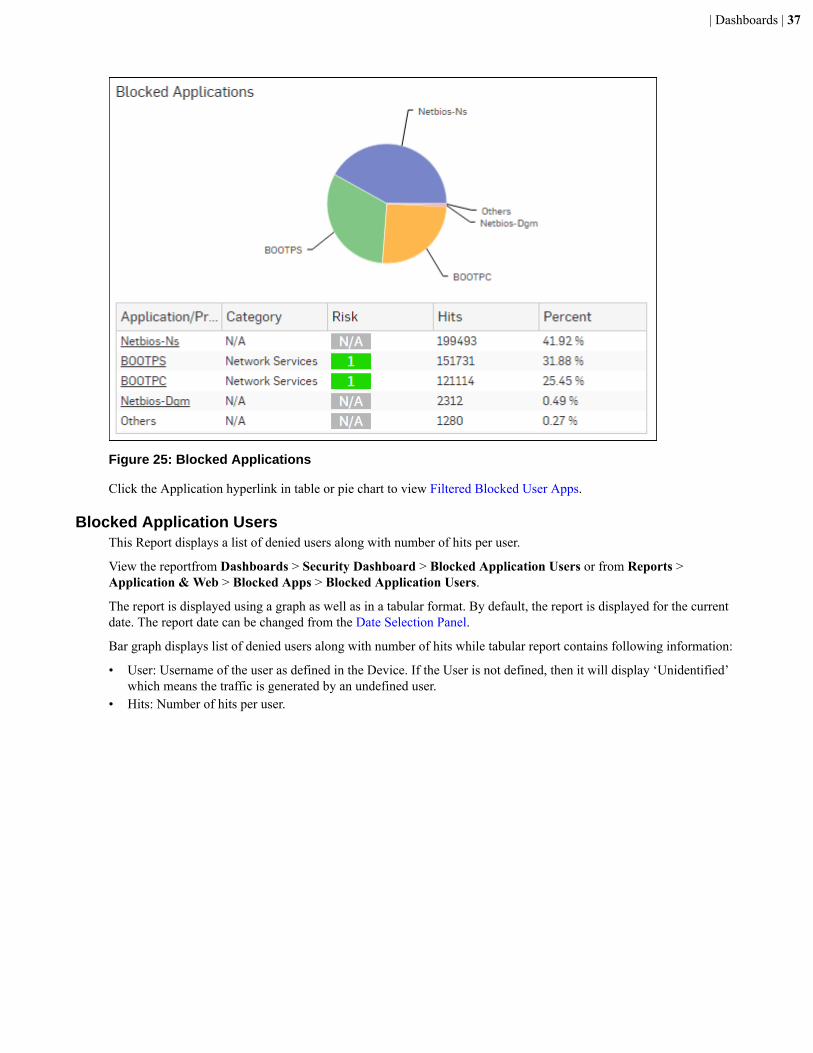
Blocked ApplicationsThis Report displays a list of blocked applications which have the maximum number of access attempts.
View the report from Dashboard > Security Dashboard > Blocked Applications.
The report is displayed using a pie chart as well as in a tabular format. By default, the report is displayed for thecurrent date. The report date can be changed from the Date Selection Panel.
The Pie chart displays the percentage distribution of number of hits amongst the blocked applications while thetabular report contains the following information:
• Application/Protocol: Displays the name of the application as defined in the Device. If application is not defined,then this field will display the application identifier as a combination of protocol and port number.
• Category: Name of the application category as defined in the Device.• Risk: Risk level associated with the application. The risk level is a numeric value. A higher value represents
higher risk.• Hits: Number of attempts to access the application.• Percent: Relative percentage distribution amongst blocked applications.
| Dashboards | 37
Figure 25: Blocked Applications
Click the Application hyperlink in table or pie chart to view Filtered Blocked User Apps.
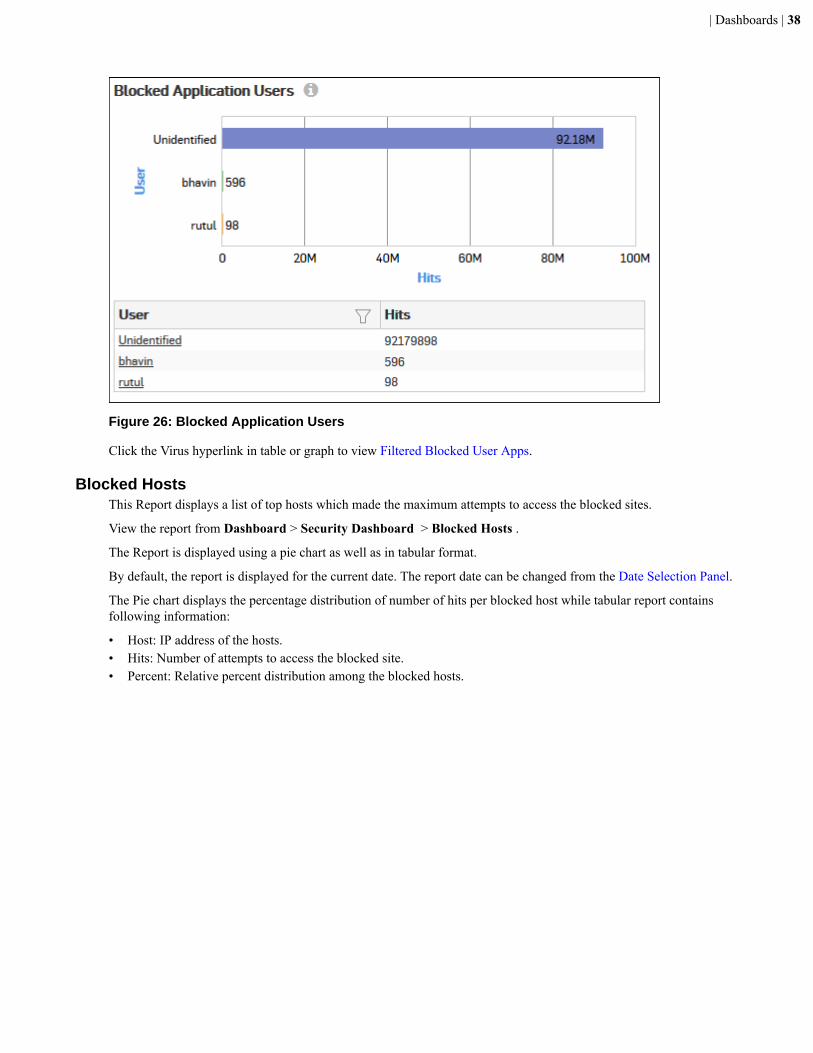
Blocked Application UsersThis Report displays a list of denied users along with number of hits per user.
View the reportfrom Dashboards > Security Dashboard > Blocked Application Users or from Reports >Application & Web > Blocked Apps > Blocked Application Users.
The report is displayed using a graph as well as in a tabular format. By default, the report is displayed for the currentdate. The report date can be changed from the Date Selection Panel.
Bar graph displays list of denied users along with number of hits while tabular report contains following information:
• User: Username of the user as defined in the Device. If the User is not defined, then it will display ‘Unidentified’which means the traffic is generated by an undefined user.
• Hits: Number of hits per user.
| Dashboards | 38
Figure 26: Blocked Application Users
Click the Virus hyperlink in table or graph to view Filtered Blocked User Apps.
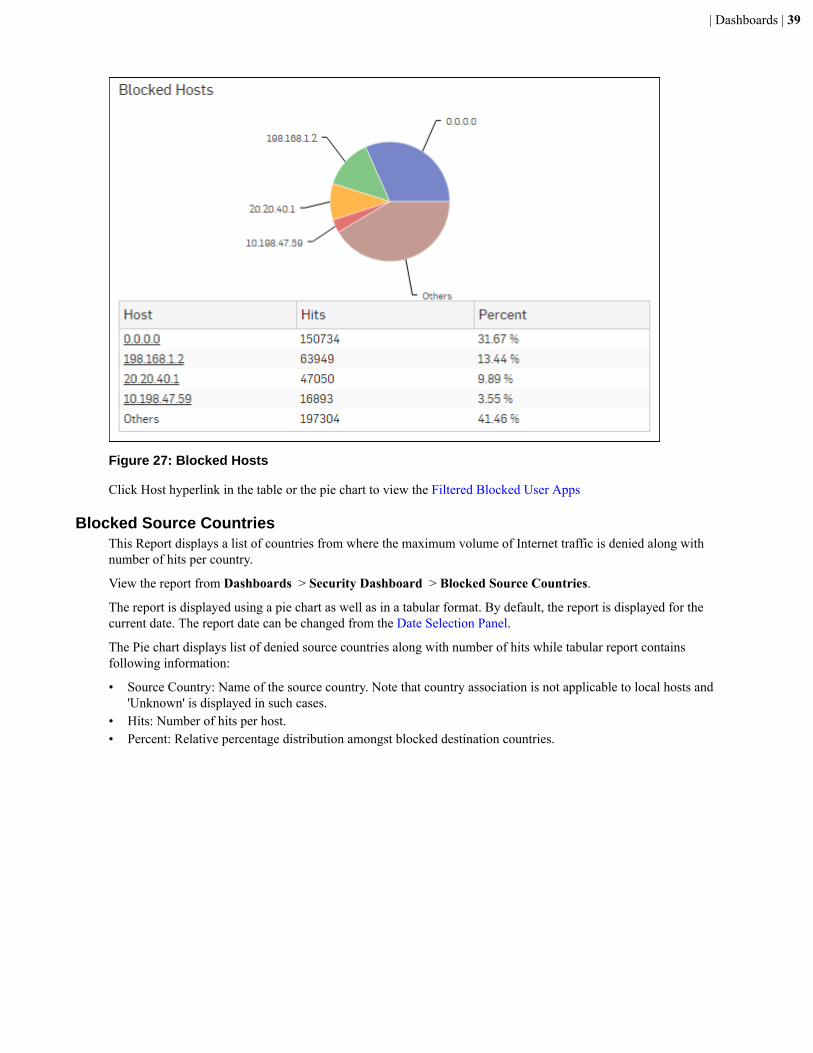
Blocked HostsThis Report displays a list of top hosts which made the maximum attempts to access the blocked sites.
View the report from Dashboard > Security Dashboard > Blocked Hosts .
The Report is displayed using a pie chart as well as in tabular format.
By default, the report is displayed for the current date. The report date can be changed from the Date Selection Panel.
The Pie chart displays the percentage distribution of number of hits per blocked host while tabular report containsfollowing information:
• Host: IP address of the hosts.• Hits: Number of attempts to access the blocked site.• Percent: Relative percent distribution among the blocked hosts.
| Dashboards | 39
Figure 27: Blocked Hosts
Click Host hyperlink in the table or the pie chart to view the Filtered Blocked User Apps
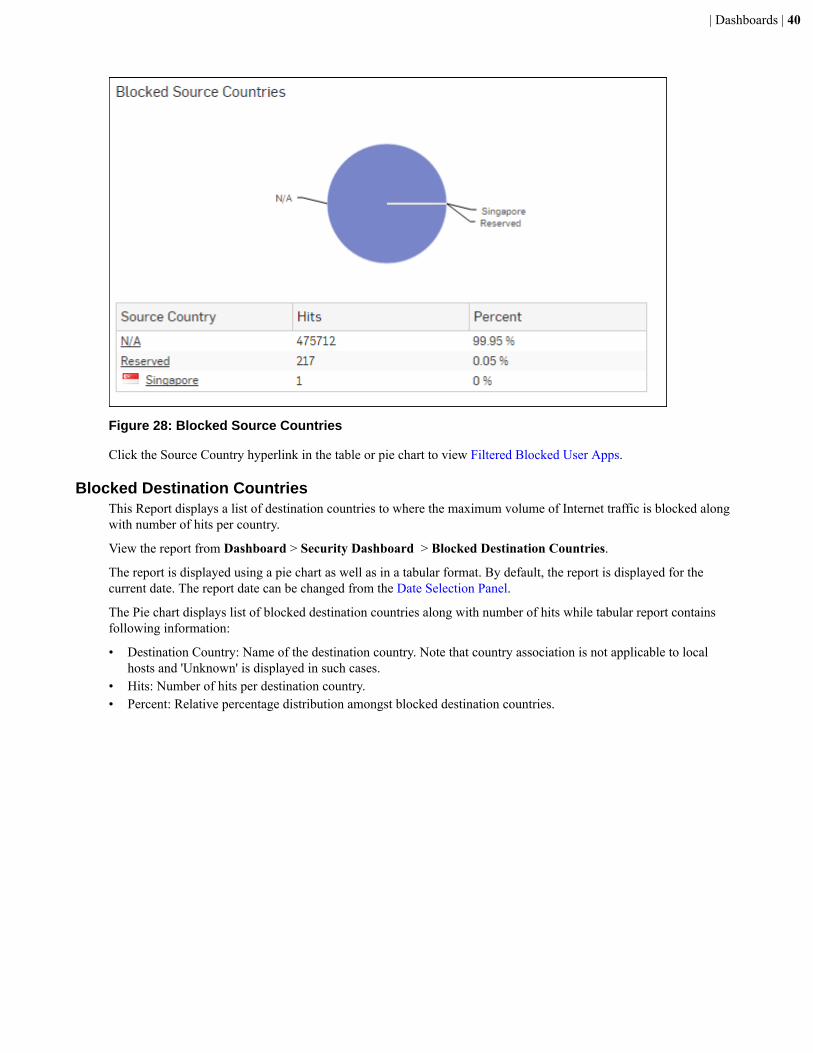
Blocked Source CountriesThis Report displays a list of countries from where the maximum volume of Internet traffic is denied along withnumber of hits per country.
View the report from Dashboards > Security Dashboard > Blocked Source Countries.
The report is displayed using a pie chart as well as in a tabular format. By default, the report is displayed for thecurrent date. The report date can be changed from the Date Selection Panel.
The Pie chart displays list of denied source countries along with number of hits while tabular report containsfollowing information:
• Source Country: Name of the source country. Note that country association is not applicable to local hosts and'Unknown' is displayed in such cases.
• Hits: Number of hits per host.• Percent: Relative percentage distribution amongst blocked destination countries.
| Dashboards | 40
Figure 28: Blocked Source Countries
Click the Source Country hyperlink in the table or pie chart to view Filtered Blocked User Apps.
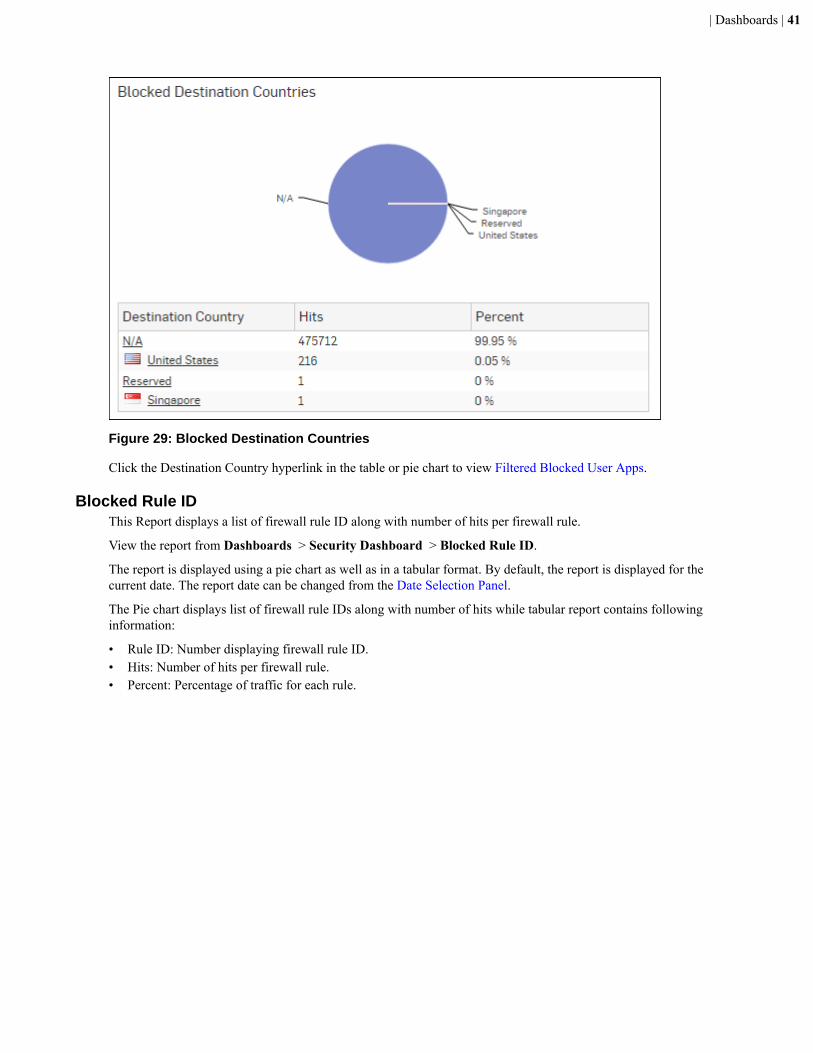
Blocked Destination CountriesThis Report displays a list of destination countries to where the maximum volume of Internet traffic is blocked alongwith number of hits per country.
View the report from Dashboard > Security Dashboard > Blocked Destination Countries.
The report is displayed using a pie chart as well as in a tabular format. By default, the report is displayed for thecurrent date. The report date can be changed from the Date Selection Panel.
The Pie chart displays list of blocked destination countries along with number of hits while tabular report containsfollowing information:
• Destination Country: Name of the destination country. Note that country association is not applicable to localhosts and 'Unknown' is displayed in such cases.
• Hits: Number of hits per destination country.• Percent: Relative percentage distribution amongst blocked destination countries.
| Dashboards | 41
Figure 29: Blocked Destination Countries
Click the Destination Country hyperlink in the table or pie chart to view Filtered Blocked User Apps.
Blocked Rule IDThis Report displays a list of firewall rule ID along with number of hits per firewall rule.
View the report from Dashboards > Security Dashboard > Blocked Rule ID.
The report is displayed using a pie chart as well as in a tabular format. By default, the report is displayed for thecurrent date. The report date can be changed from the Date Selection Panel.
The Pie chart displays list of firewall rule IDs along with number of hits while tabular report contains followinginformation:
• Rule ID: Number displaying firewall rule ID.• Hits: Number of hits per firewall rule.• Percent: Percentage of traffic for each rule.

| Dashboards | 42
Figure 30: Blocked Rule ID
Click the Rule ID hyperlink in the table or pie chart to view Filtered Blocked User Apps.
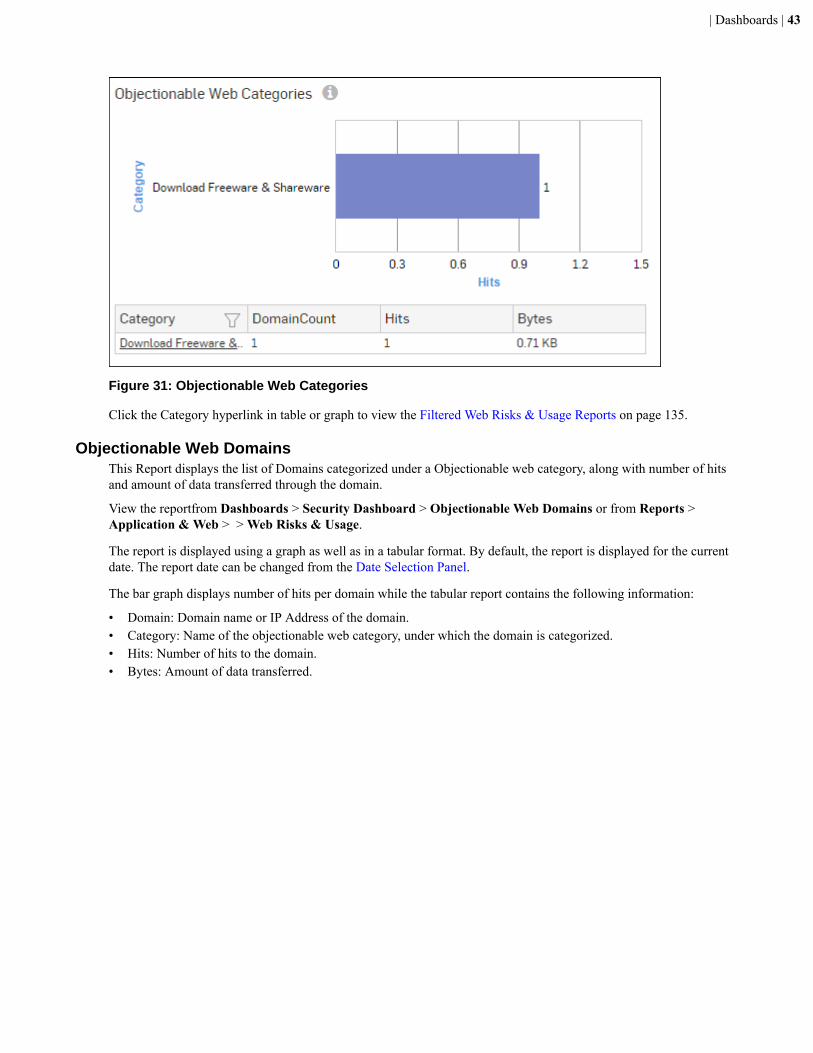
Objectionable Web CategoriesThis Report displays a list of Objectionable web categories accessed over the selected time period along with domaincount per Objectionable category, number of hits and amount of data transferred through the category.
View the reportfrom Dashboards > Security Dashboard > Objectionable Web Categories or from Reports >Application & Web > Web Risks & Usage > Objectionable Web Categories.
The report is displayed using a graph as well as in a tabular format. By default, the report is displayed for the currentdate. The report date can be changed from the Date Selection Panel.
The bar graph displays number of hits per category while the tabular report contains the following information:
• Category: Displays name of the web category categorized as Objectionable in the Device.• Domain Count: Number of domains accessed per Objectionable web category.• Hits: Number of hits to the category.• Bytes: Amount of data transferred.
| Dashboards | 43
Figure 31: Objectionable Web Categories
Click the Category hyperlink in table or graph to view the Filtered Web Risks & Usage Reports on page 135.
Objectionable Web DomainsThis Report displays the list of Domains categorized under a Objectionable web category, along with number of hitsand amount of data transferred through the domain.
View the reportfrom Dashboards > Security Dashboard > Objectionable Web Domains or from Reports >Application & Web > > Web Risks & Usage.
The report is displayed using a graph as well as in a tabular format. By default, the report is displayed for the currentdate. The report date can be changed from the Date Selection Panel.
The bar graph displays number of hits per domain while the tabular report contains the following information:
• Domain: Domain name or IP Address of the domain.• Category: Name of the objectionable web category, under which the domain is categorized.• Hits: Number of hits to the domain.• Bytes: Amount of data transferred.

| Dashboards | 44
Figure 32: Objectionable Web Domains
Click the Domain hyperlink in table or graph to view the Filtered Web Risks & Usage Reports on page 135.
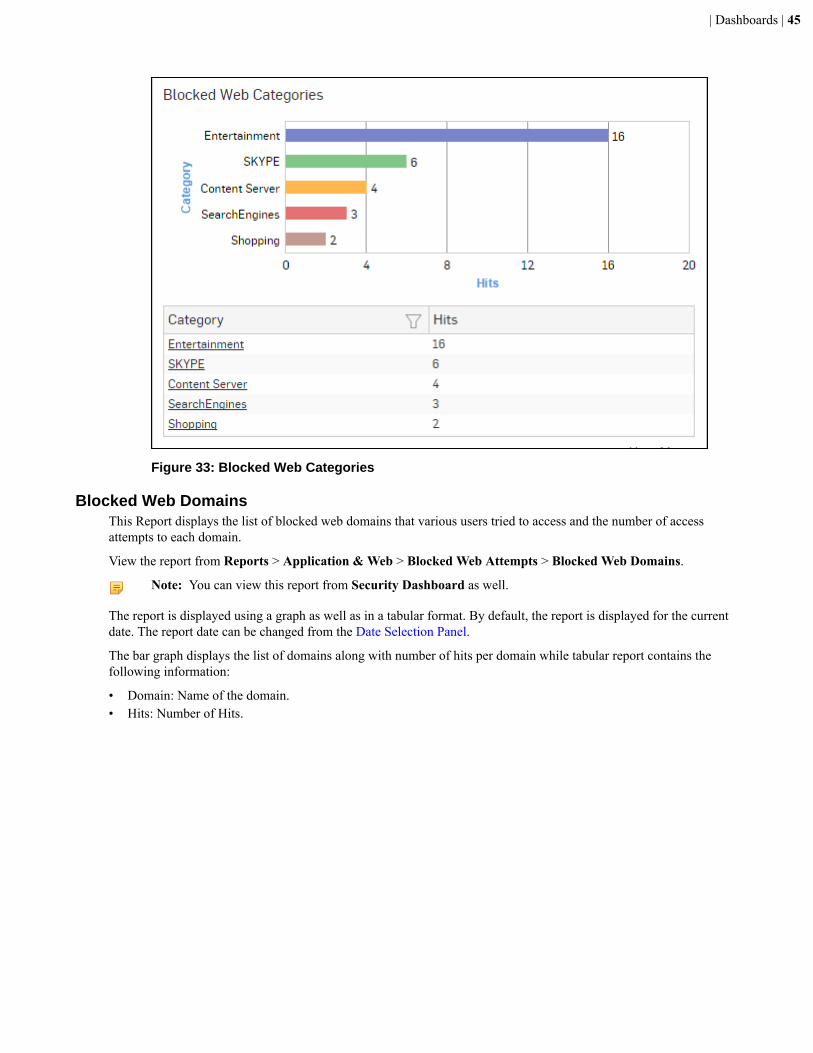
Blocked Web CategoriesThe widget report displays the number of hits per blocked web category for the selected host.
View the report from Custom > Custom Reports > User > Source Host.
The Report is displayed as a graph as well as in a tabular format.
The bar graph displays number of hits per category while the tabular graph displays following information:
• Category: Displays name of the blocked web category as defined in the Device. If the category is not defined inthe Device, then this field will display ‘None’ instead of category name
• Hits: Number of hits to the category.
Note: Click on a category to view Filtered Blocked Web Attempts Reports.
| Dashboards | 45
Figure 33: Blocked Web Categories
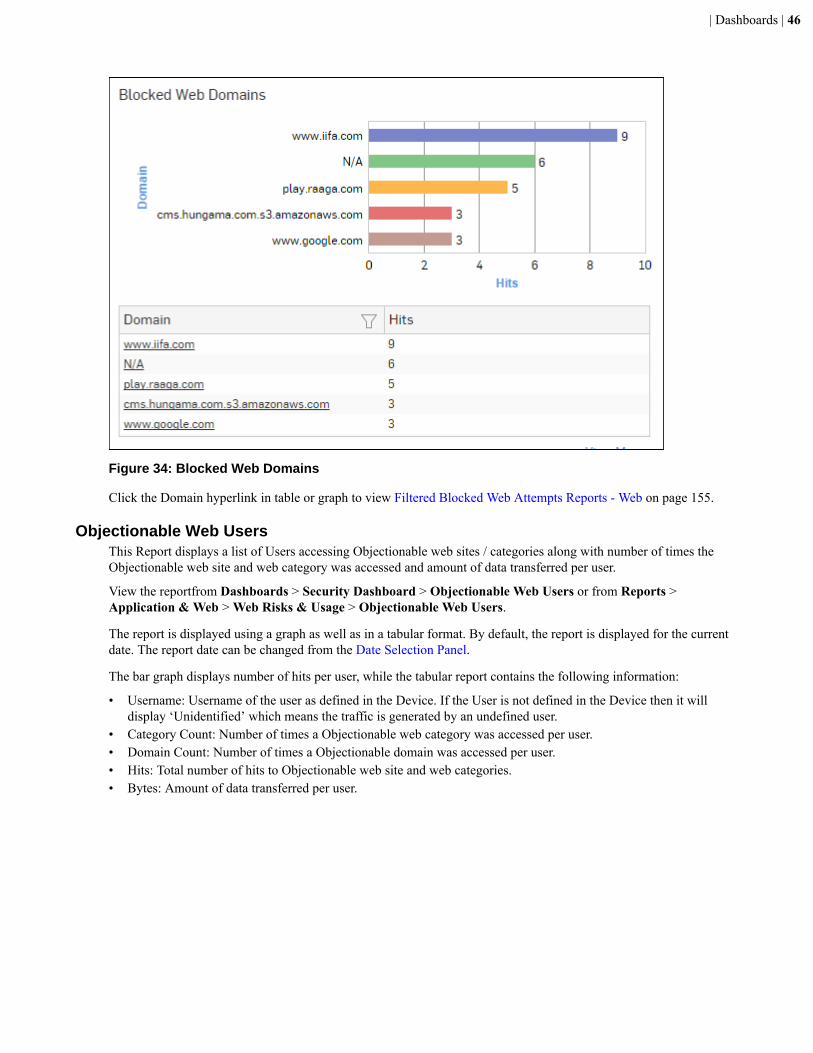
Blocked Web DomainsThis Report displays the list of blocked web domains that various users tried to access and the number of accessattempts to each domain.
View the report from Reports > Application & Web > Blocked Web Attempts > Blocked Web Domains.
Note: You can view this report from Security Dashboard as well.
The report is displayed using a graph as well as in a tabular format. By default, the report is displayed for the currentdate. The report date can be changed from the Date Selection Panel.
The bar graph displays the list of domains along with number of hits per domain while tabular report contains thefollowing information:
• Domain: Name of the domain.• Hits: Number of Hits.
| Dashboards | 46
Figure 34: Blocked Web Domains
Click the Domain hyperlink in table or graph to view Filtered Blocked Web Attempts Reports - Web on page 155.
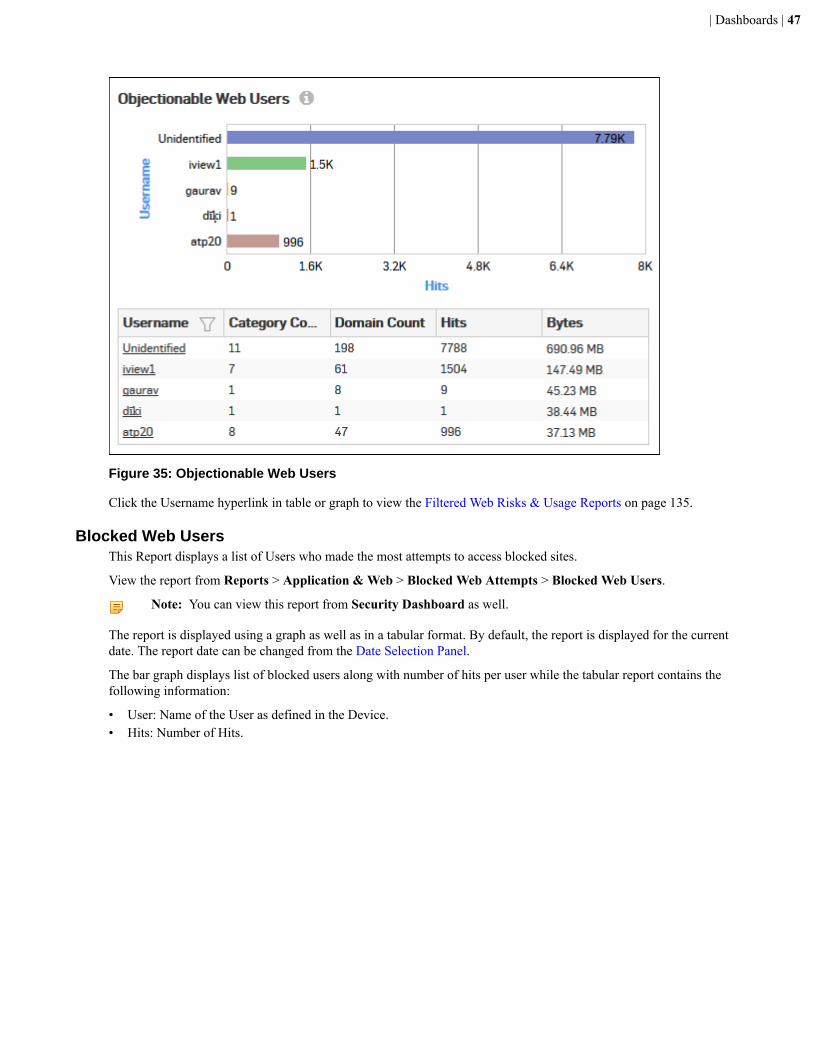
Objectionable Web UsersThis Report displays a list of Users accessing Objectionable web sites / categories along with number of times theObjectionable web site and web category was accessed and amount of data transferred per user.
View the reportfrom Dashboards > Security Dashboard > Objectionable Web Users or from Reports >Application & Web > Web Risks & Usage > Objectionable Web Users.
The report is displayed using a graph as well as in a tabular format. By default, the report is displayed for the currentdate. The report date can be changed from the Date Selection Panel.
The bar graph displays number of hits per user, while the tabular report contains the following information:
• Username: Username of the user as defined in the Device. If the User is not defined in the Device then it willdisplay ‘Unidentified’ which means the traffic is generated by an undefined user.
• Category Count: Number of times a Objectionable web category was accessed per user.• Domain Count: Number of times a Objectionable domain was accessed per user.• Hits: Total number of hits to Objectionable web site and web categories.• Bytes: Amount of data transferred per user.
| Dashboards | 47
Figure 35: Objectionable Web Users
Click the Username hyperlink in table or graph to view the Filtered Web Risks & Usage Reports on page 135.
Blocked Web UsersThis Report displays a list of Users who made the most attempts to access blocked sites.
View the report from Reports > Application & Web > Blocked Web Attempts > Blocked Web Users.
Note: You can view this report from Security Dashboard as well.
The report is displayed using a graph as well as in a tabular format. By default, the report is displayed for the currentdate. The report date can be changed from the Date Selection Panel.
The bar graph displays list of blocked users along with number of hits per user while the tabular report contains thefollowing information:
• User: Name of the User as defined in the Device.• Hits: Number of Hits.
| Dashboards | 48
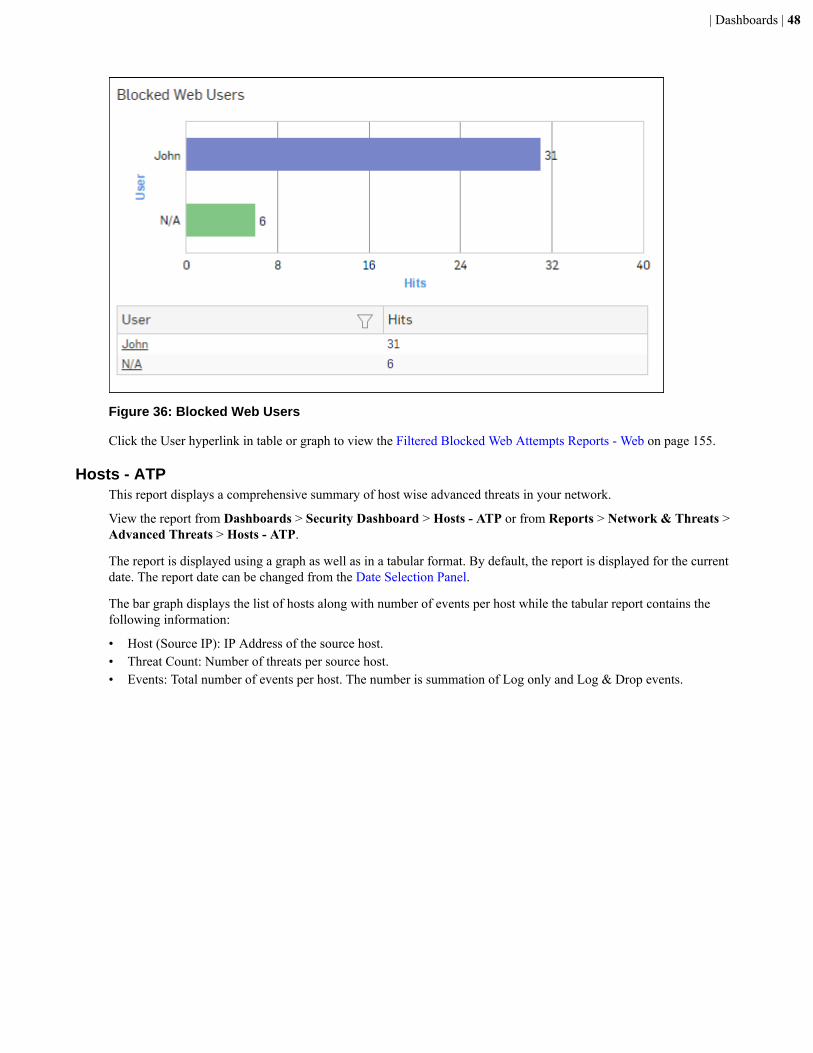
Figure 36: Blocked Web Users
Click the User hyperlink in table or graph to view the Filtered Blocked Web Attempts Reports - Web on page 155.
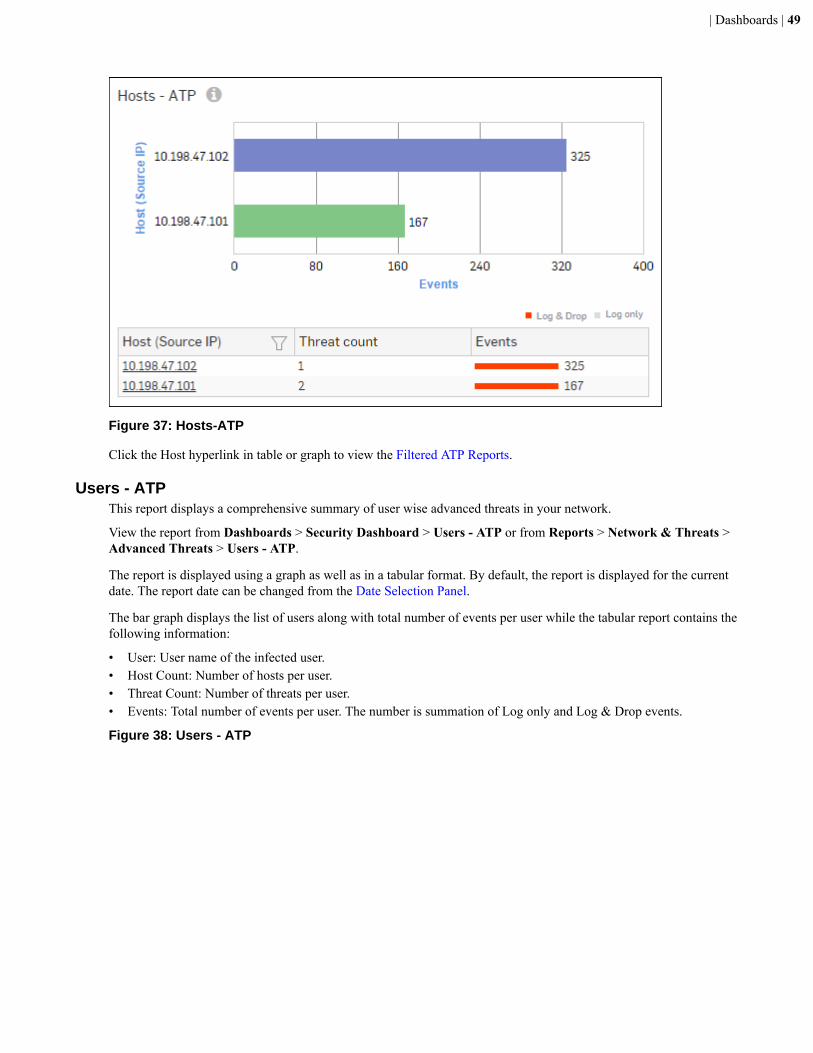
Hosts - ATPThis report displays a comprehensive summary of host wise advanced threats in your network.
View the report from Dashboards > Security Dashboard > Hosts - ATP or from Reports > Network & Threats >Advanced Threats > Hosts - ATP.
The report is displayed using a graph as well as in a tabular format. By default, the report is displayed for the currentdate. The report date can be changed from the Date Selection Panel.
The bar graph displays the list of hosts along with number of events per host while the tabular report contains thefollowing information:
• Host (Source IP): IP Address of the source host.• Threat Count: Number of threats per source host.• Events: Total number of events per host. The number is summation of Log only and Log & Drop events.
| Dashboards | 49
Figure 37: Hosts-ATP
Click the Host hyperlink in table or graph to view the Filtered ATP Reports.
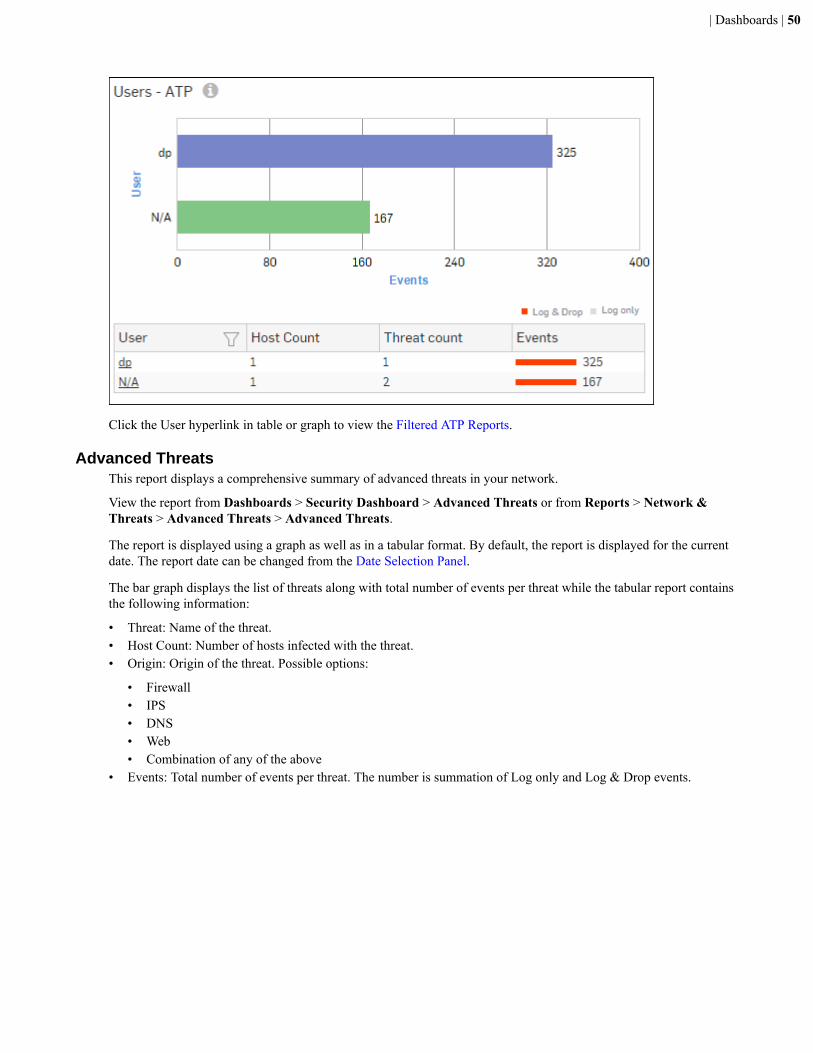
Users - ATPThis report displays a comprehensive summary of user wise advanced threats in your network.
View the report from Dashboards > Security Dashboard > Users - ATP or from Reports > Network & Threats >Advanced Threats > Users - ATP.
The report is displayed using a graph as well as in a tabular format. By default, the report is displayed for the currentdate. The report date can be changed from the Date Selection Panel.
The bar graph displays the list of users along with total number of events per user while the tabular report contains thefollowing information:
• User: User name of the infected user.• Host Count: Number of hosts per user.• Threat Count: Number of threats per user.• Events: Total number of events per user. The number is summation of Log only and Log & Drop events.
Figure 38: Users - ATP
| Dashboards | 50
Click the User hyperlink in table or graph to view the Filtered ATP Reports.
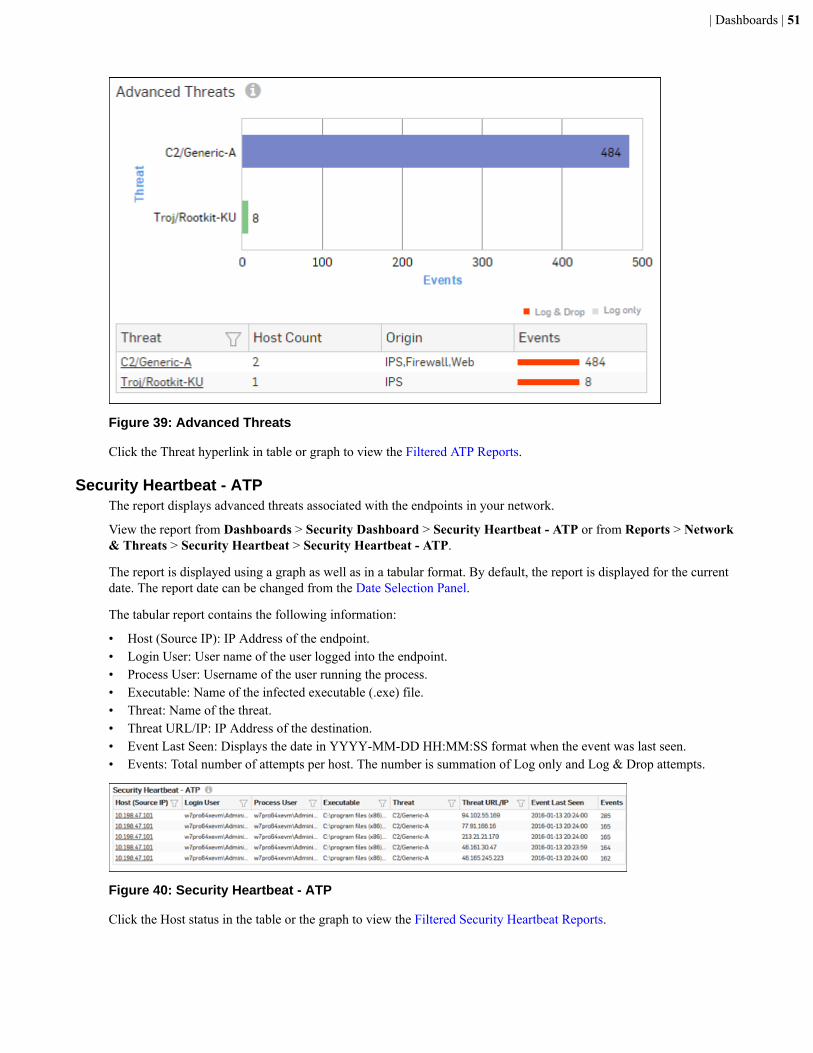
Advanced ThreatsThis report displays a comprehensive summary of advanced threats in your network.
View the report from Dashboards > Security Dashboard > Advanced Threats or from Reports > Network &Threats > Advanced Threats > Advanced Threats.
The report is displayed using a graph as well as in a tabular format. By default, the report is displayed for the currentdate. The report date can be changed from the Date Selection Panel.
The bar graph displays the list of threats along with total number of events per threat while the tabular report containsthe following information:
• Threat: Name of the threat.• Host Count: Number of hosts infected with the threat.• Origin: Origin of the threat. Possible options:
• Firewall• IPS• DNS• Web• Combination of any of the above
• Events: Total number of events per threat. The number is summation of Log only and Log & Drop events.
| Dashboards | 51
Figure 39: Advanced Threats
Click the Threat hyperlink in table or graph to view the Filtered ATP Reports.
Security Heartbeat - ATPThe report displays advanced threats associated with the endpoints in your network.
View the report from Dashboards > Security Dashboard > Security Heartbeat - ATP or from Reports > Network& Threats > Security Heartbeat > Security Heartbeat - ATP.
The report is displayed using a graph as well as in a tabular format. By default, the report is displayed for the currentdate. The report date can be changed from the Date Selection Panel.
The tabular report contains the following information:
• Host (Source IP): IP Address of the endpoint.• Login User: User name of the user logged into the endpoint.• Process User: Username of the user running the process.• Executable: Name of the infected executable (.exe) file.• Threat: Name of the threat.• Threat URL/IP: IP Address of the destination.• Event Last Seen: Displays the date in YYYY-MM-DD HH:MM:SS format when the event was last seen.• Events: Total number of attempts per host. The number is summation of Log only and Log & Drop attempts.
Figure 40: Security Heartbeat - ATP
Click the Host status in the table or the graph to view the Filtered Security Heartbeat Reports.
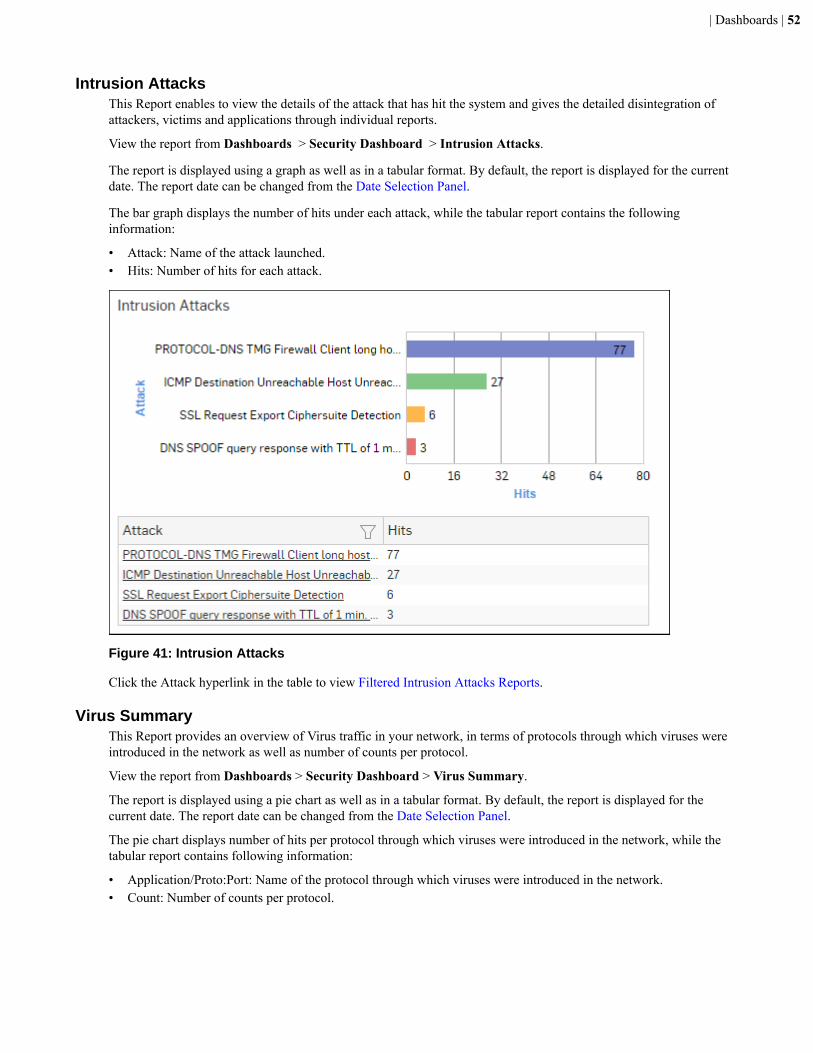
| Dashboards | 52
Intrusion AttacksThis Report enables to view the details of the attack that has hit the system and gives the detailed disintegration ofattackers, victims and applications through individual reports.
View the report from Dashboards > Security Dashboard > Intrusion Attacks.
The report is displayed using a graph as well as in a tabular format. By default, the report is displayed for the currentdate. The report date can be changed from the Date Selection Panel.
The bar graph displays the number of hits under each attack, while the tabular report contains the followinginformation:
• Attack: Name of the attack launched.• Hits: Number of hits for each attack.
Figure 41: Intrusion Attacks
Click the Attack hyperlink in the table to view Filtered Intrusion Attacks Reports.
Virus SummaryThis Report provides an overview of Virus traffic in your network, in terms of protocols through which viruses wereintroduced in the network as well as number of counts per protocol.
View the report from Dashboards > Security Dashboard > Virus Summary.
The report is displayed using a pie chart as well as in a tabular format. By default, the report is displayed for thecurrent date. The report date can be changed from the Date Selection Panel.
The pie chart displays number of hits per protocol through which viruses were introduced in the network, while thetabular report contains following information:
• Application/Proto:Port: Name of the protocol through which viruses were introduced in the network.• Count: Number of counts per protocol.
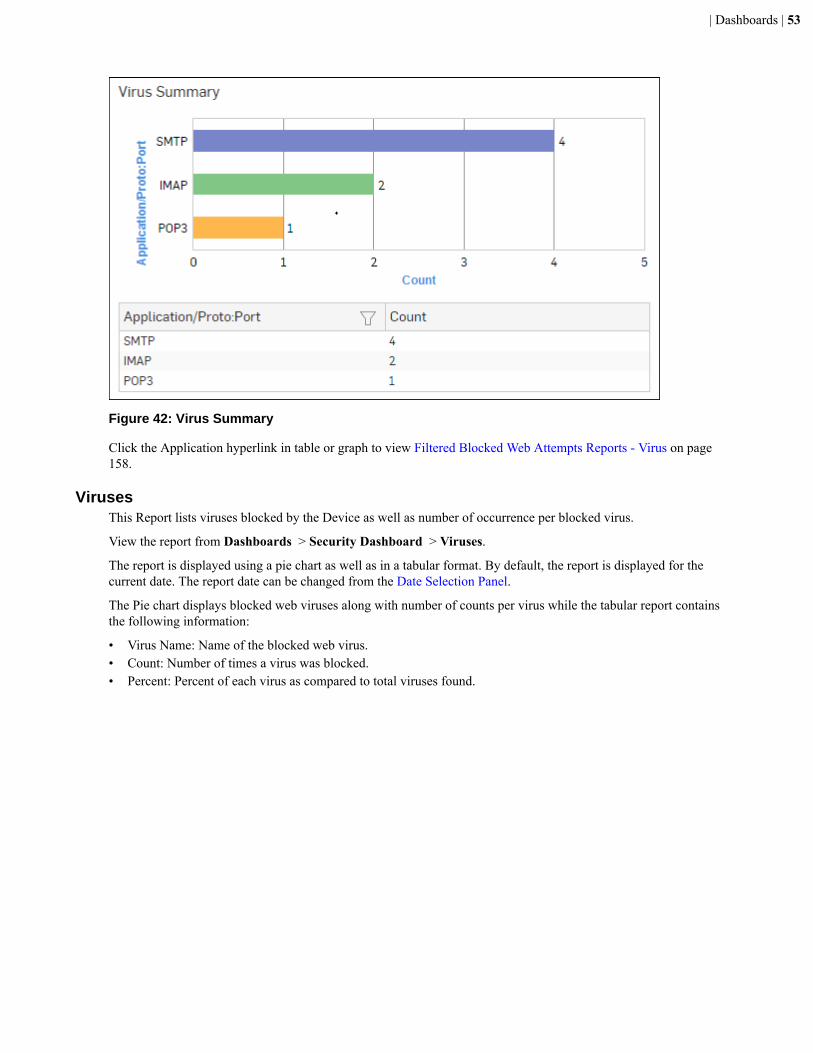
| Dashboards | 53
Figure 42: Virus Summary
Click the Application hyperlink in table or graph to view Filtered Blocked Web Attempts Reports - Virus on page158.
VirusesThis Report lists viruses blocked by the Device as well as number of occurrence per blocked virus.
View the report from Dashboards > Security Dashboard > Viruses.
The report is displayed using a pie chart as well as in a tabular format. By default, the report is displayed for thecurrent date. The report date can be changed from the Date Selection Panel.
The Pie chart displays blocked web viruses along with number of counts per virus while the tabular report containsthe following information:
• Virus Name: Name of the blocked web virus.• Count: Number of times a virus was blocked.• Percent: Percent of each virus as compared to total viruses found.
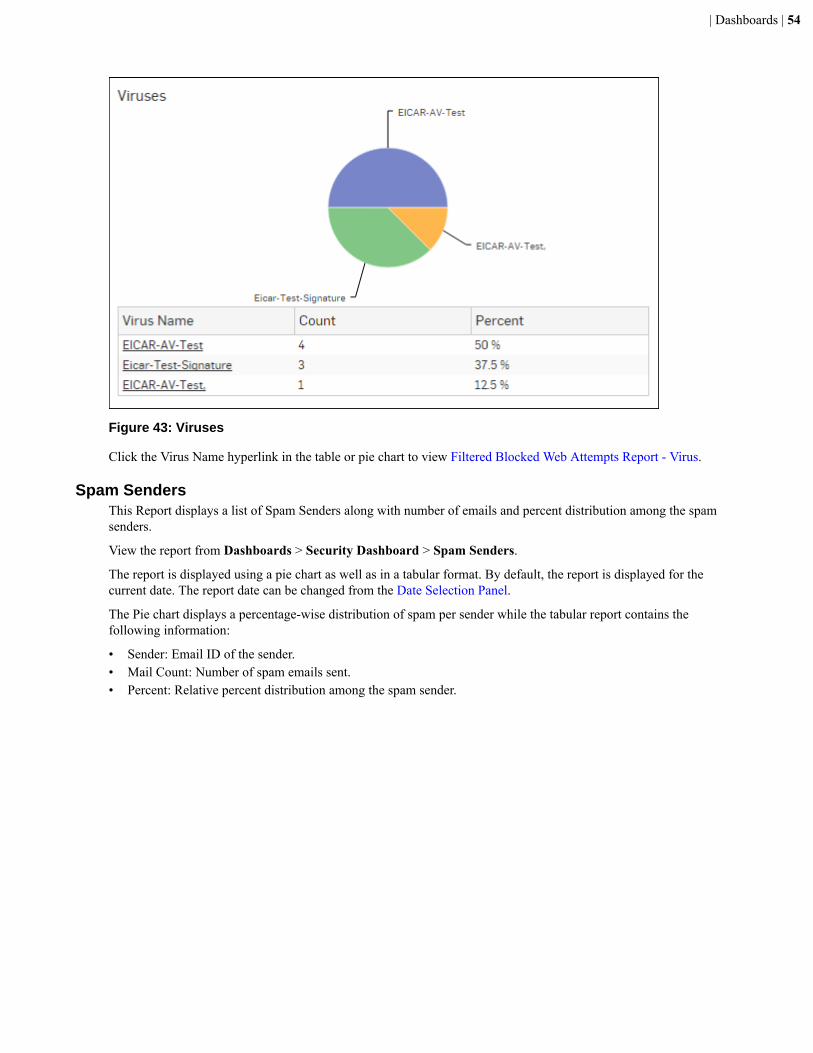
| Dashboards | 54
Figure 43: Viruses
Click the Virus Name hyperlink in the table or pie chart to view Filtered Blocked Web Attempts Report - Virus.
Spam SendersThis Report displays a list of Spam Senders along with number of emails and percent distribution among the spamsenders.
View the report from Dashboards > Security Dashboard > Spam Senders.
The report is displayed using a pie chart as well as in a tabular format. By default, the report is displayed for thecurrent date. The report date can be changed from the Date Selection Panel.
The Pie chart displays a percentage-wise distribution of spam per sender while the tabular report contains thefollowing information:
• Sender: Email ID of the sender.• Mail Count: Number of spam emails sent.• Percent: Relative percent distribution among the spam sender.

| Dashboards | 55
Figure 44: Spam Senders
Click the Sender hyperlink in the table or the chart to view the Filtered Spam Reports
Spam RecipientsThis Report displays a list of Spam Recipients along with number of emails and percent distribution among the spamrecipients.
View the report from Dashboards > Security Dashboard > Spam Recipients.
The report is displayed using a pie chart as well as in a tabular format. By default, the report is displayed for thecurrent date. The report date can be changed from the Date Selection Panel.
The Pie chart displays a percentage-wise distribution of spam per recipient while the tabular report contains thefollowing information:
• Recipient: Email ID of the recipient.• Mail Count: Number of spam emails received.• Percent: Relative percent distribution among the spam recipients.

| Dashboards | 56
Figure 45: Spam Recipients
Click the Recipient hyperlink in the table or the chart to view the Filtered Spam Reports on page 308
Spam SummaryThis Report displays list of spam protocols along with number of hits and relative percentage distribution.
View the report from Dashboards > Security Dashboard > Spam Summary.
The report is displayed using a graph as well as in a tabular format. By default, the report is displayed for the currentdate. The report date can be changed from the Date Selection Panel.
The Pie chart displays number of hits and percentage wise distribution of hits per spam protocol while tabular reportcontains following information:
• Application/Proto:Port: Name of the protocol through which spams were introduced in the network.• Hits: Number of hits per protocol.• Percent: Relative percent distribution among the application protocol.
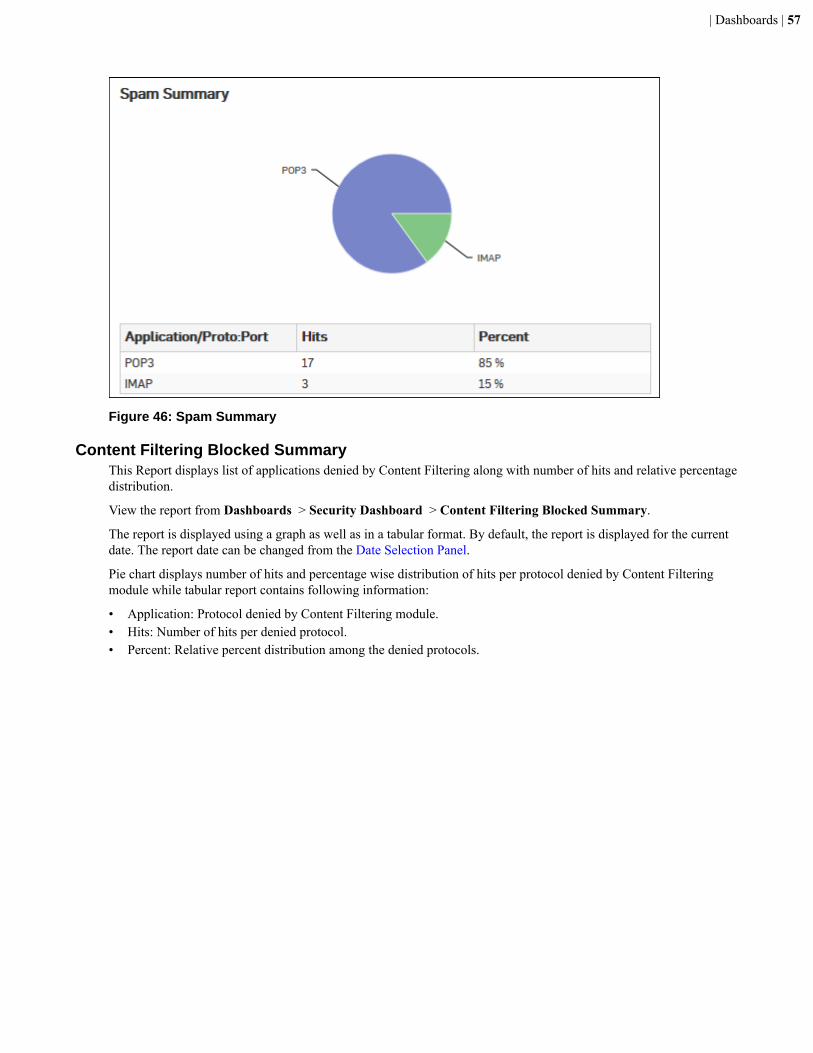
| Dashboards | 57
Figure 46: Spam Summary
Content Filtering Blocked SummaryThis Report displays list of applications denied by Content Filtering along with number of hits and relative percentagedistribution.
View the report from Dashboards > Security Dashboard > Content Filtering Blocked Summary.
The report is displayed using a graph as well as in a tabular format. By default, the report is displayed for the currentdate. The report date can be changed from the Date Selection Panel.
Pie chart displays number of hits and percentage wise distribution of hits per protocol denied by Content Filteringmodule while tabular report contains following information:
• Application: Protocol denied by Content Filtering module.• Hits: Number of hits per denied protocol.• Percent: Relative percent distribution among the denied protocols.
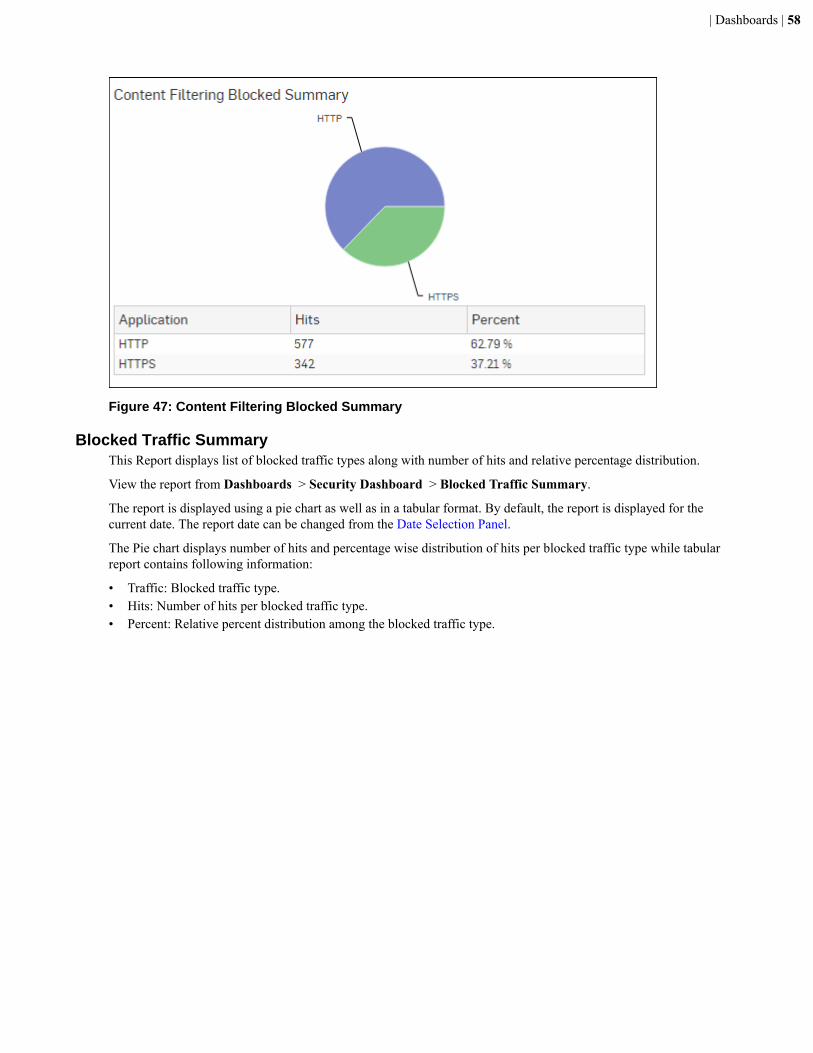
| Dashboards | 58
Figure 47: Content Filtering Blocked Summary
Blocked Traffic SummaryThis Report displays list of blocked traffic types along with number of hits and relative percentage distribution.
View the report from Dashboards > Security Dashboard > Blocked Traffic Summary.
The report is displayed using a pie chart as well as in a tabular format. By default, the report is displayed for thecurrent date. The report date can be changed from the Date Selection Panel.
The Pie chart displays number of hits and percentage wise distribution of hits per blocked traffic type while tabularreport contains following information:
• Traffic: Blocked traffic type.• Hits: Number of hits per blocked traffic type.• Percent: Relative percent distribution among the blocked traffic type.

| Dashboards | 59
Figure 48: Blocked Traffic Summary
Detailed View - Client HealthThis report shows in-depth information regarding health status of endpoints in your network.
View the report from Dashboards > Security Dashboard > Detailed View - Client Health or from Reports >Network & Threats > Security Heartbeat > Detailed View - Client Health.
The report is displayed using a graph as well as in a tabular format. By default, the report is displayed for the currentdate. The report date can be changed from the Date Selection Panel.
The tabular report contains the following information:
• Host (Source IP): IP Address of the endpoint.• Host Name: Name of the client.• Health - Last Seen: Displays the latest health status. Possible options are:
• Green: The client is healthy, i.e. not infected with any malicious files.• Yellow: The client is potentially Objectionable, i.e. it may be infected with some malicious content.• Red: The client is Objectionable and is infected with some malicious content.
• Last Health Changed: Displays the date in YYYY-MM-DD HH:MM:SS format when the health of the host waslast changed.
Figure 49: Detailed View - Client Health
Click the Host status in the table or the graph to view the Filtered Security Heartbeat Reports.
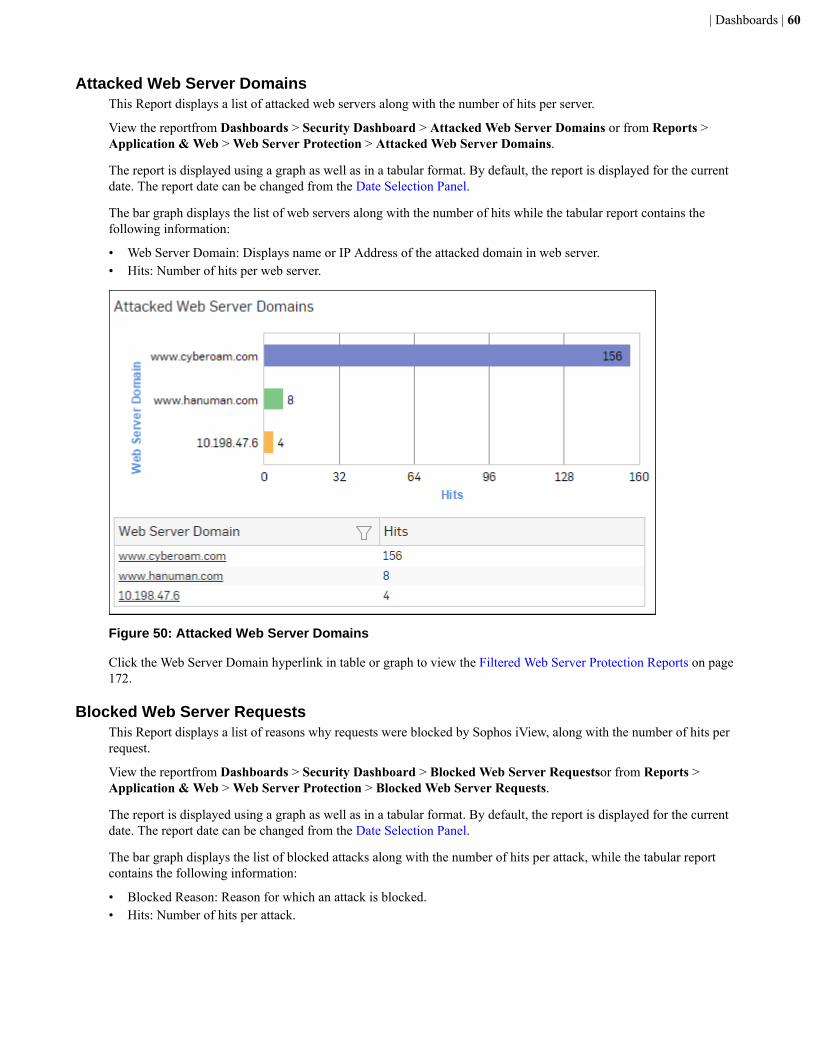
| Dashboards | 60
Attacked Web Server DomainsThis Report displays a list of attacked web servers along with the number of hits per server.
View the reportfrom Dashboards > Security Dashboard > Attacked Web Server Domains or from Reports >Application & Web > Web Server Protection > Attacked Web Server Domains.
The report is displayed using a graph as well as in a tabular format. By default, the report is displayed for the currentdate. The report date can be changed from the Date Selection Panel.
The bar graph displays the list of web servers along with the number of hits while the tabular report contains thefollowing information:
• Web Server Domain: Displays name or IP Address of the attacked domain in web server.• Hits: Number of hits per web server.
Figure 50: Attacked Web Server Domains
Click the Web Server Domain hyperlink in table or graph to view the Filtered Web Server Protection Reports on page172.
Blocked Web Server RequestsThis Report displays a list of reasons why requests were blocked by Sophos iView, along with the number of hits perrequest.
View the reportfrom Dashboards > Security Dashboard > Blocked Web Server Requestsor from Reports >Application & Web > Web Server Protection > Blocked Web Server Requests.
The report is displayed using a graph as well as in a tabular format. By default, the report is displayed for the currentdate. The report date can be changed from the Date Selection Panel.
The bar graph displays the list of blocked attacks along with the number of hits per attack, while the tabular reportcontains the following information:
• Blocked Reason: Reason for which an attack is blocked.• Hits: Number of hits per attack.

| Dashboards | 61
Figure 51: Blocked Web Server Requests
Click the Blocked Reason hyperlink in table or graph to view Filtered Web Server Protection Reports on page 172.
System Dashboard
Sophos iView dashboard gives overview of main components of Sophos iView. This page displays followinginformation:
• CPU Usage• Memory Usage• Disk Usage• Event Frequency
CPU Usage
View the reportfrom Dashboards > System Dashboard > CPU Usage.
The report is displayed using a pie chart as well as in a tabular format. By default, the report is displayed for thecurrent date. The report date can be changed from the Date Selection Panel
Tabular report contains following information:
• CPU: State of CPU as Idle or Used.• Percent: Percentage wise distribution of CPU state.
To view CPU Usage Details drill down by clicking the CPU hyperlink in the table.
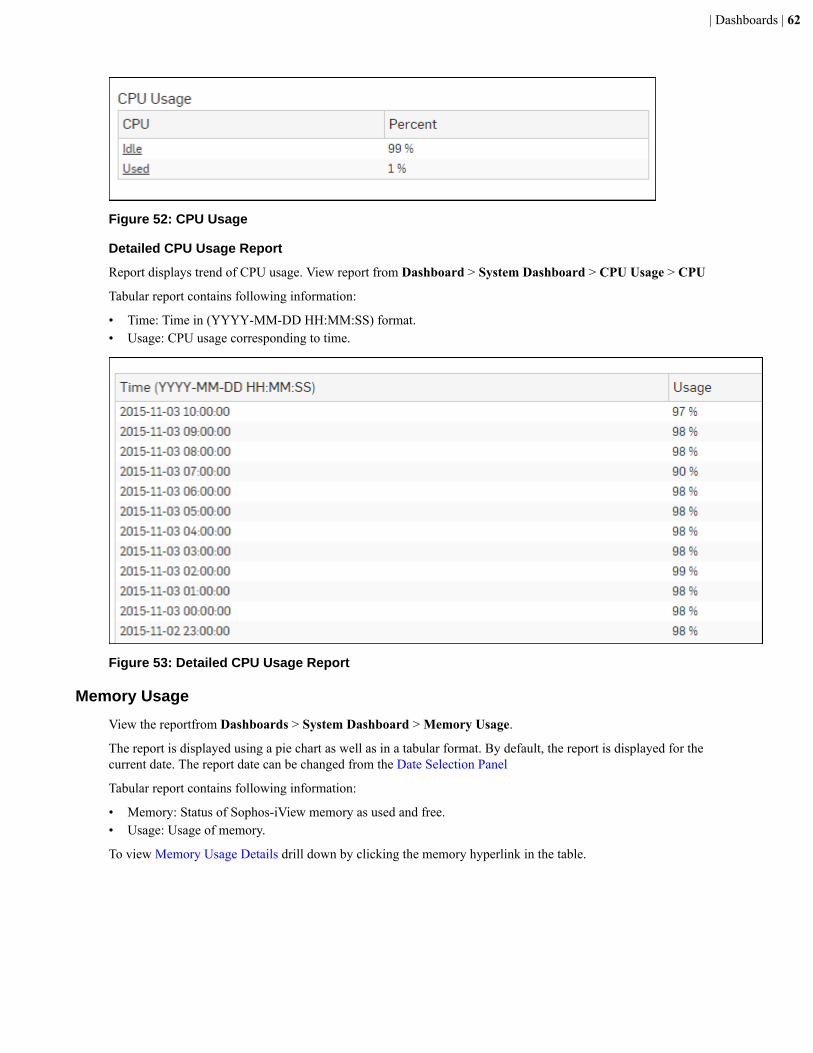
| Dashboards | 62
Figure 52: CPU Usage
Detailed CPU Usage Report
Report displays trend of CPU usage. View report from Dashboard > System Dashboard > CPU Usage > CPU
Tabular report contains following information:
• Time: Time in (YYYY-MM-DD HH:MM:SS) format.• Usage: CPU usage corresponding to time.
Figure 53: Detailed CPU Usage Report
Memory Usage
View the reportfrom Dashboards > System Dashboard > Memory Usage.
The report is displayed using a pie chart as well as in a tabular format. By default, the report is displayed for thecurrent date. The report date can be changed from the Date Selection Panel
Tabular report contains following information:
• Memory: Status of Sophos-iView memory as used and free.• Usage: Usage of memory.
To view Memory Usage Details drill down by clicking the memory hyperlink in the table.

| Dashboards | 63
Figure 54: Memory Usage
Detailed Memory Usage Report
Report displays trend of memory usage. View report from Dashboard > System Dashboard > Memory Usage >Memory.
Tabular report contains following information:
• Time: Time in (YYYY-MM-DD HH:MM:SS) format.• Usage: Memory usage corresponding to time.
Figure 55: Detailed Memory Usage Report
Disk Usage
View the reportfrom Dashboards > System Dashboard > Disk Usage.
The report is displayed using a pie chart as well as in a tabular format. By default, the report is displayed for thecurrent date. The report date can be changed from the Date Selection Panel
Tabular report contains following information:
• Disk: Name and status of disk used to store database and archive logs.• Usage: Disk usage
To view Disk Usage Details drill down by clicking the Disk hyperlink in the table.
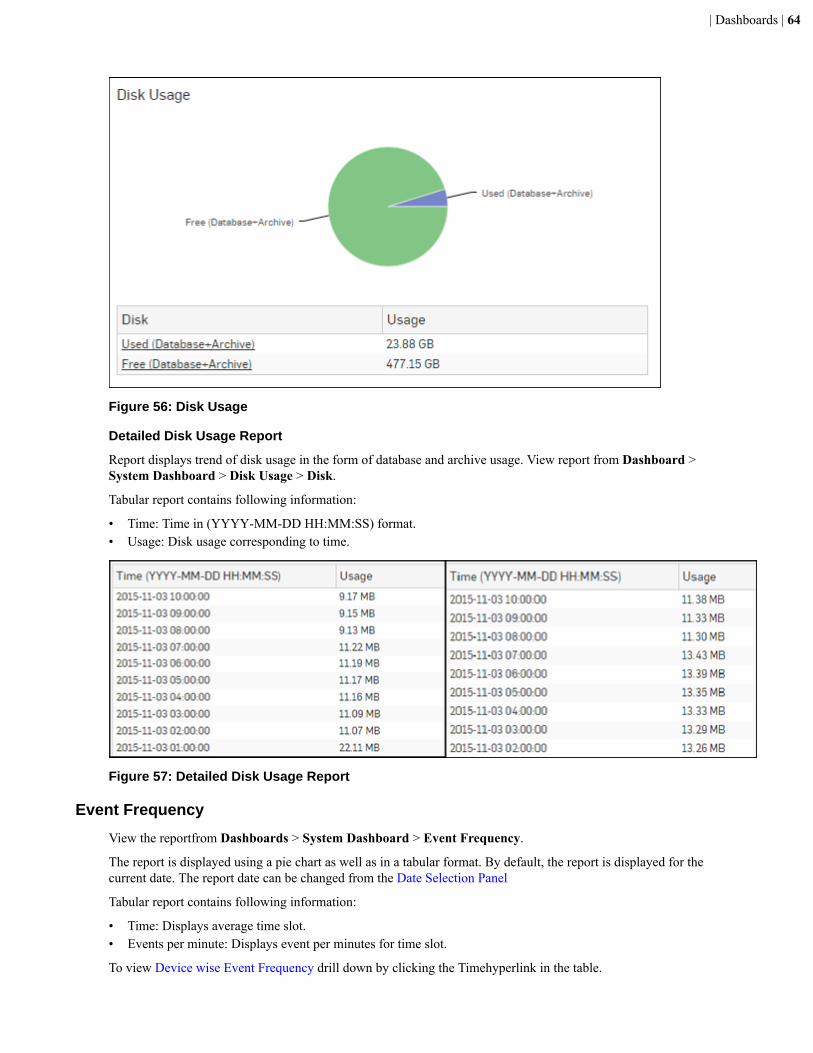
| Dashboards | 64
Figure 56: Disk Usage
Detailed Disk Usage Report
Report displays trend of disk usage in the form of database and archive usage. View report from Dashboard >System Dashboard > Disk Usage > Disk.
Tabular report contains following information:
• Time: Time in (YYYY-MM-DD HH:MM:SS) format.• Usage: Disk usage corresponding to time.
Figure 57: Detailed Disk Usage Report
Event Frequency
View the reportfrom Dashboards > System Dashboard > Event Frequency.
The report is displayed using a pie chart as well as in a tabular format. By default, the report is displayed for thecurrent date. The report date can be changed from the Date Selection Panel
Tabular report contains following information:
• Time: Displays average time slot.• Events per minute: Displays event per minutes for time slot.
To view Device wise Event Frequency drill down by clicking the Timehyperlink in the table.
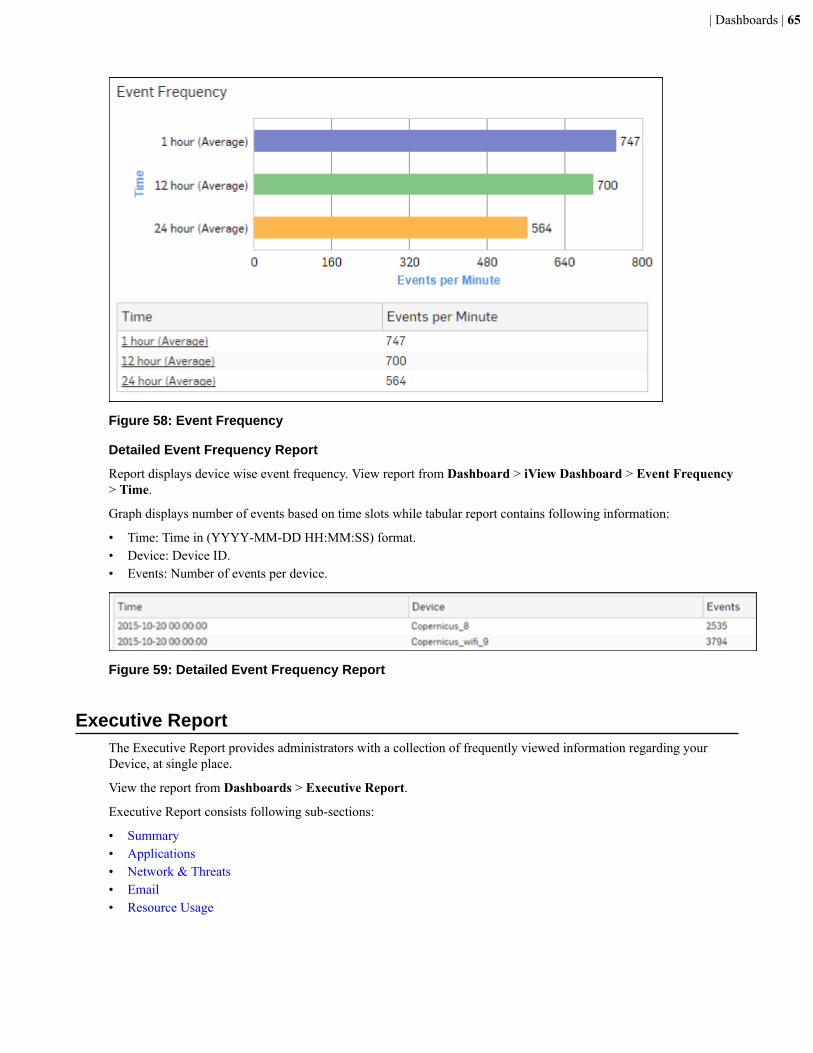
| Dashboards | 65
Figure 58: Event Frequency
Detailed Event Frequency Report
Report displays device wise event frequency. View report from Dashboard > iView Dashboard > Event Frequency> Time.
Graph displays number of events based on time slots while tabular report contains following information:
• Time: Time in (YYYY-MM-DD HH:MM:SS) format.• Device: Device ID.• Events: Number of events per device.
Figure 59: Detailed Event Frequency Report
Executive ReportThe Executive Report provides administrators with a collection of frequently viewed information regarding yourDevice, at single place.
View the report from Dashboards > Executive Report.
Executive Report consists following sub-sections:
• Summary• Applications• Network & Threats• Email• Resource Usage
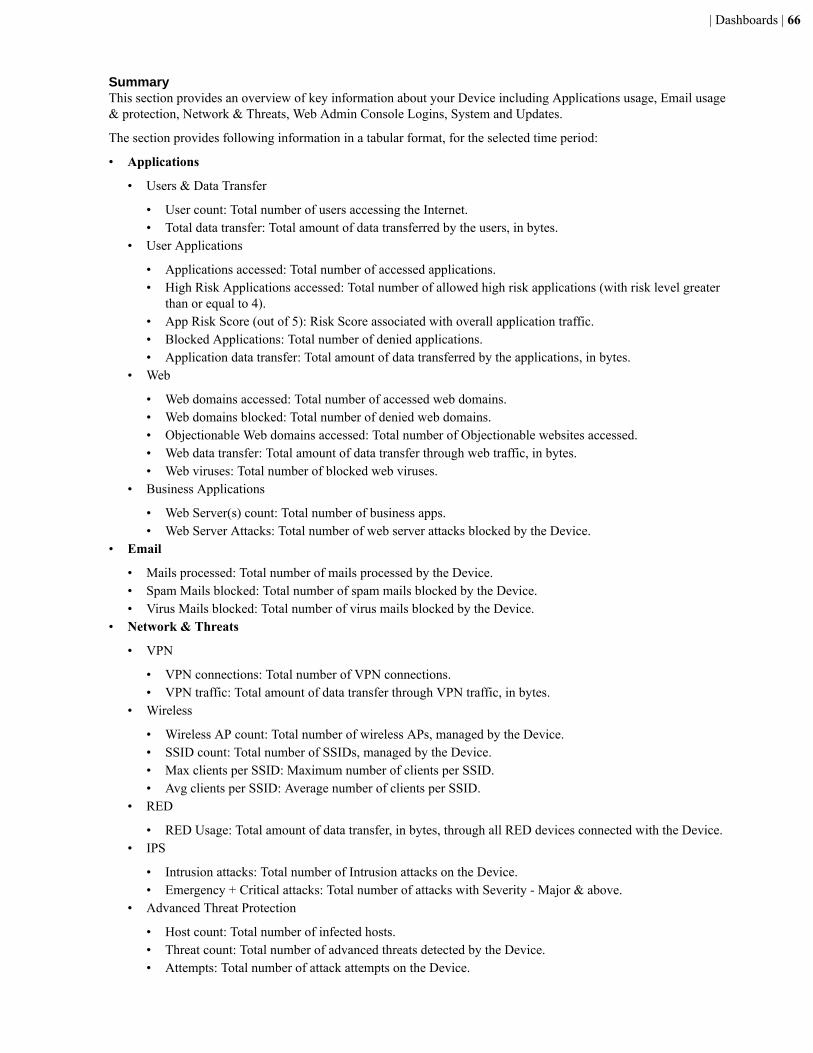
| Dashboards | 66
SummaryThis section provides an overview of key information about your Device including Applications usage, Email usage& protection, Network & Threats, Web Admin Console Logins, System and Updates.
The section provides following information in a tabular format, for the selected time period:
• Applications
• Users & Data Transfer
• User count: Total number of users accessing the Internet.• Total data transfer: Total amount of data transferred by the users, in bytes.
• User Applications
• Applications accessed: Total number of accessed applications.• High Risk Applications accessed: Total number of allowed high risk applications (with risk level greater
than or equal to 4).• App Risk Score (out of 5): Risk Score associated with overall application traffic.• Blocked Applications: Total number of denied applications.• Application data transfer: Total amount of data transferred by the applications, in bytes.
• Web
• Web domains accessed: Total number of accessed web domains.• Web domains blocked: Total number of denied web domains.• Objectionable Web domains accessed: Total number of Objectionable websites accessed.• Web data transfer: Total amount of data transfer through web traffic, in bytes.• Web viruses: Total number of blocked web viruses.
• Business Applications
• Web Server(s) count: Total number of business apps.• Web Server Attacks: Total number of web server attacks blocked by the Device.
• Mails processed: Total number of mails processed by the Device.• Spam Mails blocked: Total number of spam mails blocked by the Device.• Virus Mails blocked: Total number of virus mails blocked by the Device.
• Network & Threats
• VPN
• VPN connections: Total number of VPN connections.• VPN traffic: Total amount of data transfer through VPN traffic, in bytes.
• Wireless
• Wireless AP count: Total number of wireless APs, managed by the Device.• SSID count: Total number of SSIDs, managed by the Device.• Max clients per SSID: Maximum number of clients per SSID.• Avg clients per SSID: Average number of clients per SSID.
• RED
• RED Usage: Total amount of data transfer, in bytes, through all RED devices connected with the Device.• IPS
• Intrusion attacks: Total number of Intrusion attacks on the Device.• Emergency + Critical attacks: Total number of attacks with Severity - Major & above.
• Advanced Threat Protection
• Host count: Total number of infected hosts.• Threat count: Total number of advanced threats detected by the Device.• Attempts: Total number of attack attempts on the Device.
| Dashboards | 67
• Web Admin Console Logins
• Successful: Number of successful login attempts through Web Admin Console.• Failed: Number of failed login attempts through Web Admin Console.
• System
• System Restarts: Number of times the Device re-booted.• Updates
• Firmware updates installed: Number of times firmware updates were installed by the Device.• Pattern updates installed: Number of times pattern updates were installed by the Device.
ApplicationsThis section provides an overview of Web & Application usage in your network.
The section contains following reports in Widget format, for the selected time period:
• Users• Application Categories• Applications• High Risk Applications• Blocked Applications• Web Categories• Web Category Types• Objectionable Web Categories• Objectionable Web Domains• Web Servers by Bandwidth• Web Server Attacks
Network & ThreatsThis section provides an overview of intrusion attacks and advanced threats found in your network.
The section contains following reports in Widget format, for the selected time period:
• Intrusion Attacks• Severity wise Attacks• Advanced Threats• Users - ATP
EmailThis section provides an overview of Email usage as well as spam & virus associated with the Email traffic.
The section contains following reports in Widget format, for the selected time period:
• Mail Traffic Summary• Spam Senders• Spam Recipients
Resource UsageThis section provides an overview of hardware resources consumed, for the selected time period.
The section displays, for the selected time period, following details, in tabular format:
• CPU Usage• Memory Usage• Disk Usage

| Dashboards | 68
• Live Users• Interface
UsersThis Report displays a list of the Users along with the amount of data transferred and time used for data transfer.
View the reportfrom Reports > Application & Web > User Data Transfer Report > Users.
The report is displayed using a graph as well as in a tabular format. By default, the report is displayed for the currentdate. The report date can be changed from the Date Selection Panel.
The bar graph displays the list of users along with amount of data transfer while the tabular report contains thefollowing information:
• User Name: Name of the user as defined in the Device.• Data Transfer: Total amount of data transferred (Upload + Download) by the user.• Uploaded: Amount of uploaded data.• Downloaded: Amount of downloaded data.• Used Time: Time used for data transfer.• Client Type: Type of client used for data transfer.
Figure 60: Users
Click the User hyperlink in table or graph to view the Filtered User Data Transfer Reports on page 177.
Application CategoriesThis report displays a list of top Application Categories along with number of hits per category and total amount ofdata transfer using that application.
View the reportdashboard from Reports > Application & Web > App Risks & Usage > Application Categories.
The report is displayed using a graph as well as in a tabular format. By default, the report is displayed for the currentdate. The report date can be changed from the Date Selection Panel.

| Dashboards | 69
The bar graph displays the list of application categories along with the data transfer while the tabular report containsthe following information:
• Category: Displays name of the Application Category as defined in the Device.• Hits: Number of hits per application category.• Bytes: Amount of data transfer through the application category, in bytes.
Figure 61: Application Categories
To view granular reports for a category, filter by clicking the Category hyperlink in the table. Refer to Filtered UserApp Risks & Usage Reports section for details on each filtered widget.
ApplicationsThis report displays a list of Applications along with the number of hits per application and the total amount of datatransfer using that application.
View the reportdashboard from Reports > Application & Web > aApp Risks & Usage > Applications.
The report is displayed using a graph as well as in a tabular format. By default, the report is displayed for the currentdate. The report date can be changed from the Date Selection Panel.
The bar graph displays the list of applications along with the data transfer while the tabular report contains thefollowing information:
• Application/Proto: Port: Displays name of the Application as defined in the Device. If the application is notdefined in the Device then this field will display the application identifier as a combination of the protocol andport number.
• Risk: Level of risk associated with the application.• Category: Name of the associated application category.• Hits: Number of hits per application.• Bytes: Amount of data transfer through the application, in bytes.
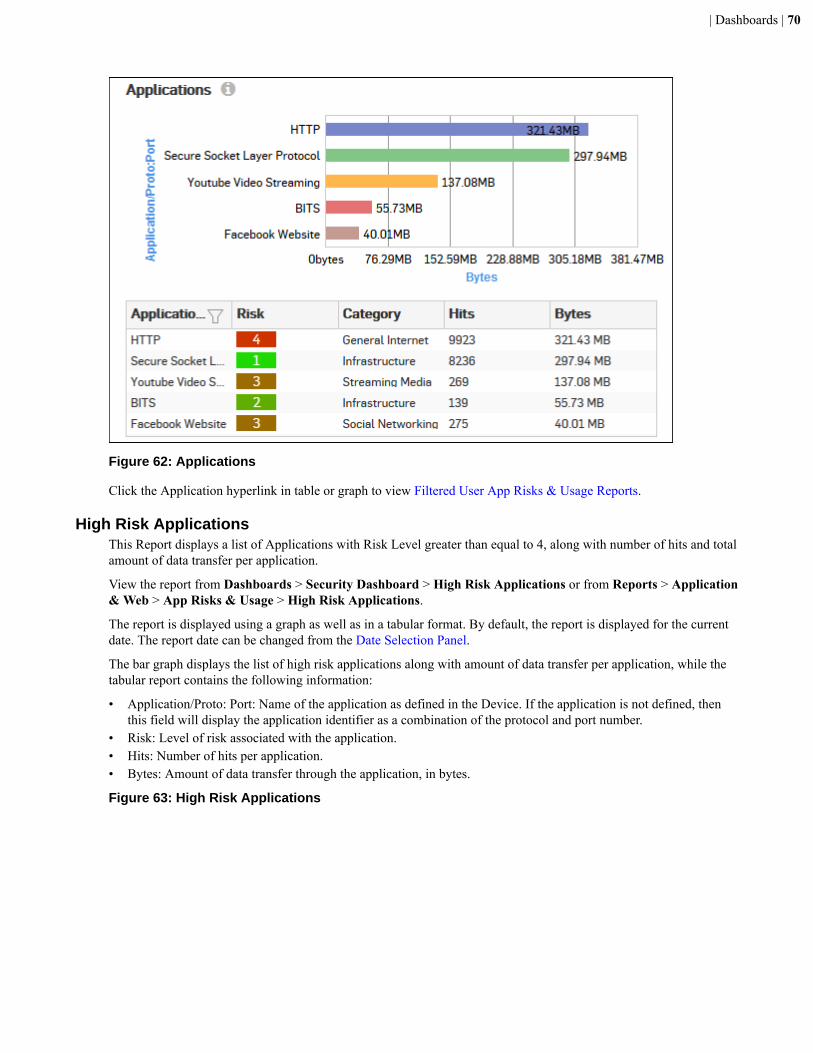
| Dashboards | 70
Figure 62: Applications
Click the Application hyperlink in table or graph to view Filtered User App Risks & Usage Reports.
High Risk ApplicationsThis Report displays a list of Applications with Risk Level greater than equal to 4, along with number of hits and totalamount of data transfer per application.
View the report from Dashboards > Security Dashboard > High Risk Applications or from Reports > Application& Web > App Risks & Usage > High Risk Applications.
The report is displayed using a graph as well as in a tabular format. By default, the report is displayed for the currentdate. The report date can be changed from the Date Selection Panel.
The bar graph displays the list of high risk applications along with amount of data transfer per application, while thetabular report contains the following information:
• Application/Proto: Port: Name of the application as defined in the Device. If the application is not defined, thenthis field will display the application identifier as a combination of the protocol and port number.
• Risk: Level of risk associated with the application.• Hits: Number of hits per application.• Bytes: Amount of data transfer through the application, in bytes.
Figure 63: High Risk Applications
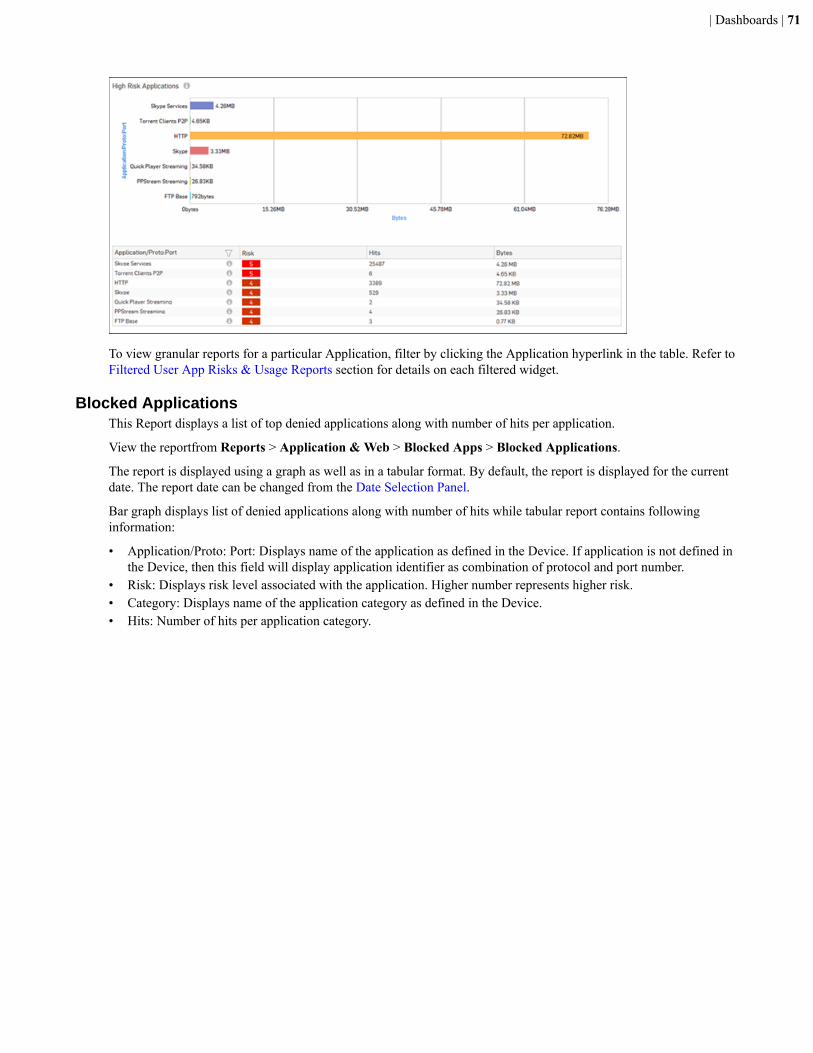
| Dashboards | 71
To view granular reports for a particular Application, filter by clicking the Application hyperlink in the table. Refer toFiltered User App Risks & Usage Reports section for details on each filtered widget.
Blocked ApplicationsThis Report displays a list of top denied applications along with number of hits per application.
View the reportfrom Reports > Application & Web > Blocked Apps > Blocked Applications.
The report is displayed using a graph as well as in a tabular format. By default, the report is displayed for the currentdate. The report date can be changed from the Date Selection Panel.
Bar graph displays list of denied applications along with number of hits while tabular report contains followinginformation:
• Application/Proto: Port: Displays name of the application as defined in the Device. If application is not defined inthe Device, then this field will display application identifier as combination of protocol and port number.
• Risk: Displays risk level associated with the application. Higher number represents higher risk.• Category: Displays name of the application category as defined in the Device.• Hits: Number of hits per application category.
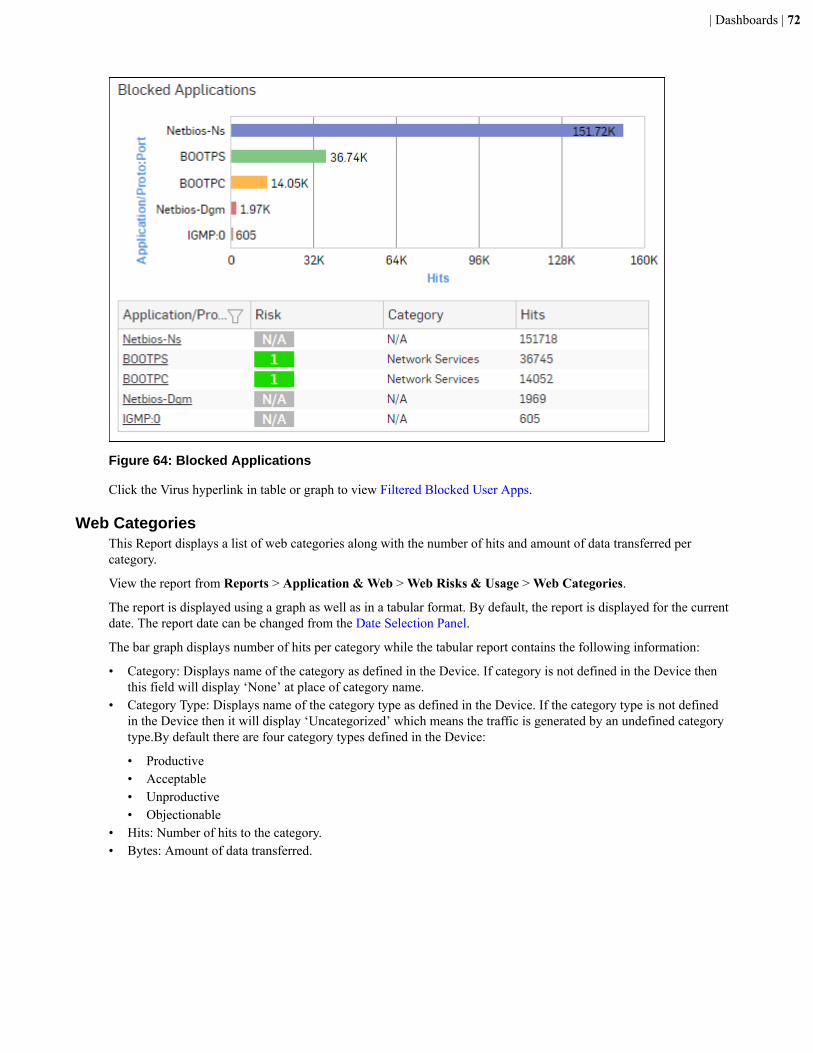
| Dashboards | 72
Figure 64: Blocked Applications
Click the Virus hyperlink in table or graph to view Filtered Blocked User Apps.
Web CategoriesThis Report displays a list of web categories along with the number of hits and amount of data transferred percategory.
View the report from Reports > Application & Web > Web Risks & Usage > Web Categories.
The report is displayed using a graph as well as in a tabular format. By default, the report is displayed for the currentdate. The report date can be changed from the Date Selection Panel.
The bar graph displays number of hits per category while the tabular report contains the following information:
• Category: Displays name of the category as defined in the Device. If category is not defined in the Device thenthis field will display ‘None’ at place of category name.
• Category Type: Displays name of the category type as defined in the Device. If the category type is not definedin the Device then it will display ‘Uncategorized’ which means the traffic is generated by an undefined categorytype.By default there are four category types defined in the Device:
• Productive• Acceptable• Unproductive• Objectionable
• Hits: Number of hits to the category.• Bytes: Amount of data transferred.
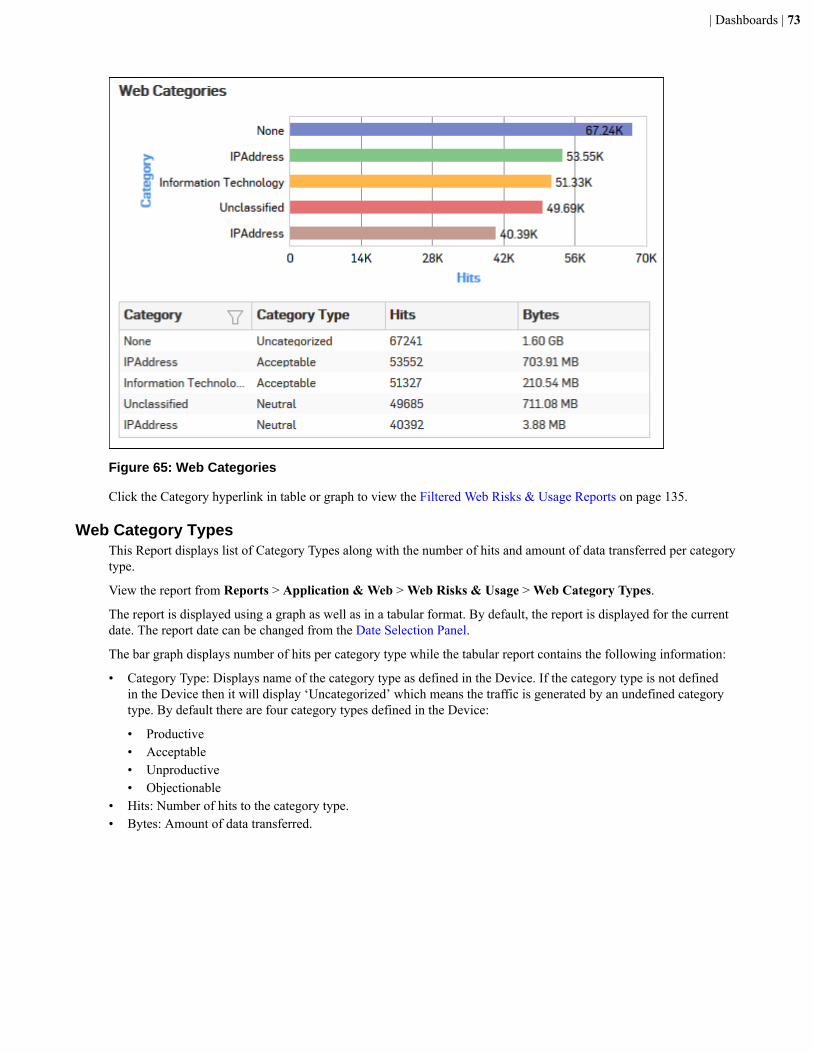
| Dashboards | 73
Figure 65: Web Categories
Click the Category hyperlink in table or graph to view the Filtered Web Risks & Usage Reports on page 135.
Web Category TypesThis Report displays list of Category Types along with the number of hits and amount of data transferred per categorytype.
View the report from Reports > Application & Web > Web Risks & Usage > Web Category Types.
The report is displayed using a graph as well as in a tabular format. By default, the report is displayed for the currentdate. The report date can be changed from the Date Selection Panel.
The bar graph displays number of hits per category type while the tabular report contains the following information:
• Category Type: Displays name of the category type as defined in the Device. If the category type is not definedin the Device then it will display ‘Uncategorized’ which means the traffic is generated by an undefined categorytype. By default there are four category types defined in the Device:
• Productive• Acceptable• Unproductive• Objectionable
• Hits: Number of hits to the category type.• Bytes: Amount of data transferred.

| Dashboards | 74
Figure 66: Web Category Types
Click the Category Type hyperlink in table or graph to view the Filtered Web Risks & Usage Reports on page 135.
Objectionable Web CategoriesThis Report displays a list of Objectionable web categories accessed over the selected time period along with domaincount per Objectionable category, number of hits and amount of data transferred through the category.
View the reportfrom Dashboards > Security Dashboard > Objectionable Web Categories or from Reports >Application & Web > Web Risks & Usage > Objectionable Web Categories.
The report is displayed using a graph as well as in a tabular format. By default, the report is displayed for the currentdate. The report date can be changed from the Date Selection Panel.
The bar graph displays number of hits per category while the tabular report contains the following information:
• Category: Displays name of the web category categorized as Objectionable in the Device.• Domain Count: Number of domains accessed per Objectionable web category.• Hits: Number of hits to the category.• Bytes: Amount of data transferred.

| Dashboards | 75
Figure 67: Objectionable Web Categories
Click the Category hyperlink in table or graph to view the Filtered Web Risks & Usage Reports on page 135.
Objectionable Web DomainsThis Report displays the list of Domains categorized under a Objectionable web category, along with number of hitsand amount of data transferred through the domain.
View the reportfrom Dashboards > Security Dashboard > Objectionable Web Domains or from Reports >Application & Web > > Web Risks & Usage.
The report is displayed using a graph as well as in a tabular format. By default, the report is displayed for the currentdate. The report date can be changed from the Date Selection Panel.
The bar graph displays number of hits per domain while the tabular report contains the following information:
• Domain: Domain name or IP Address of the domain.• Category: Name of the objectionable web category, under which the domain is categorized.• Hits: Number of hits to the domain.• Bytes: Amount of data transferred.
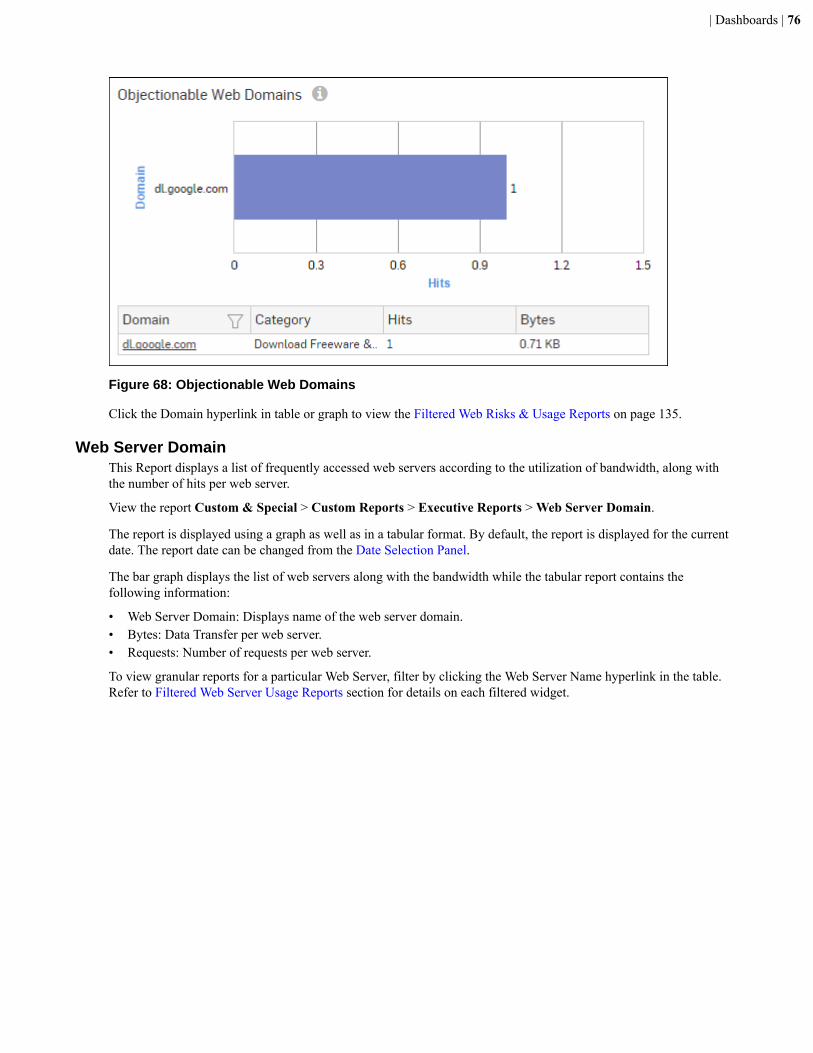
| Dashboards | 76
Figure 68: Objectionable Web Domains
Click the Domain hyperlink in table or graph to view the Filtered Web Risks & Usage Reports on page 135.
Web Server DomainThis Report displays a list of frequently accessed web servers according to the utilization of bandwidth, along withthe number of hits per web server.
View the report Custom & Special > Custom Reports > Executive Reports > Web Server Domain.
The report is displayed using a graph as well as in a tabular format. By default, the report is displayed for the currentdate. The report date can be changed from the Date Selection Panel.
The bar graph displays the list of web servers along with the bandwidth while the tabular report contains thefollowing information:
• Web Server Domain: Displays name of the web server domain.• Bytes: Data Transfer per web server.• Requests: Number of requests per web server.
To view granular reports for a particular Web Server, filter by clicking the Web Server Name hyperlink in the table.Refer to Filtered Web Server Usage Reports section for details on each filtered widget.
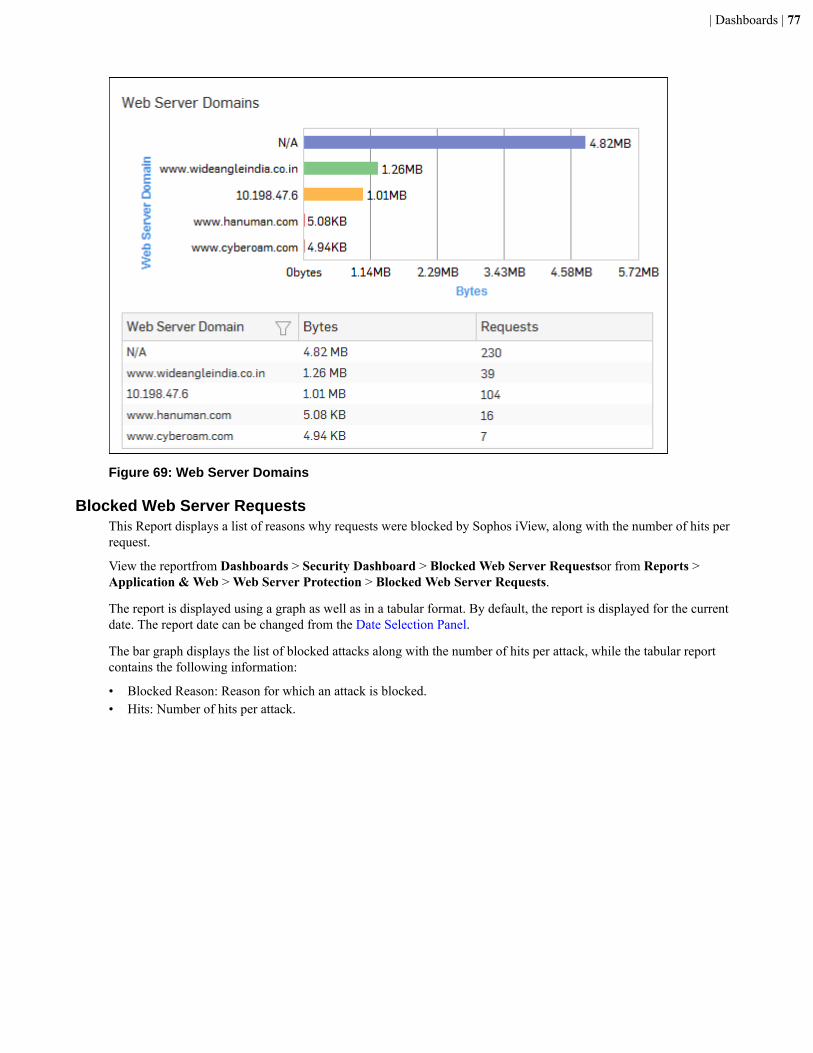
| Dashboards | 77
Figure 69: Web Server Domains
Blocked Web Server RequestsThis Report displays a list of reasons why requests were blocked by Sophos iView, along with the number of hits perrequest.
View the reportfrom Dashboards > Security Dashboard > Blocked Web Server Requestsor from Reports >Application & Web > Web Server Protection > Blocked Web Server Requests.
The report is displayed using a graph as well as in a tabular format. By default, the report is displayed for the currentdate. The report date can be changed from the Date Selection Panel.
The bar graph displays the list of blocked attacks along with the number of hits per attack, while the tabular reportcontains the following information:
• Blocked Reason: Reason for which an attack is blocked.• Hits: Number of hits per attack.
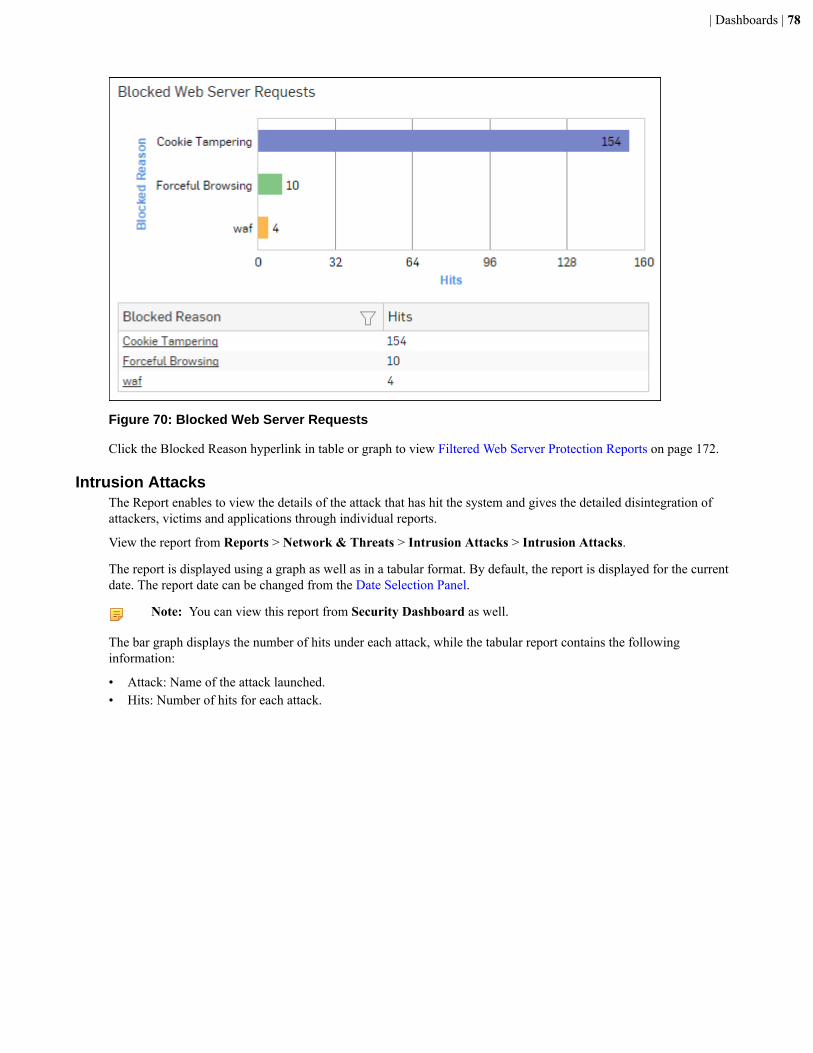
| Dashboards | 78
Figure 70: Blocked Web Server Requests
Click the Blocked Reason hyperlink in table or graph to view Filtered Web Server Protection Reports on page 172.
Intrusion AttacksThe Report enables to view the details of the attack that has hit the system and gives the detailed disintegration ofattackers, victims and applications through individual reports.
View the report from Reports > Network & Threats > Intrusion Attacks > Intrusion Attacks.
The report is displayed using a graph as well as in a tabular format. By default, the report is displayed for the currentdate. The report date can be changed from the Date Selection Panel.
Note: You can view this report from Security Dashboard as well.
The bar graph displays the number of hits under each attack, while the tabular report contains the followinginformation:
• Attack: Name of the attack launched.• Hits: Number of hits for each attack.
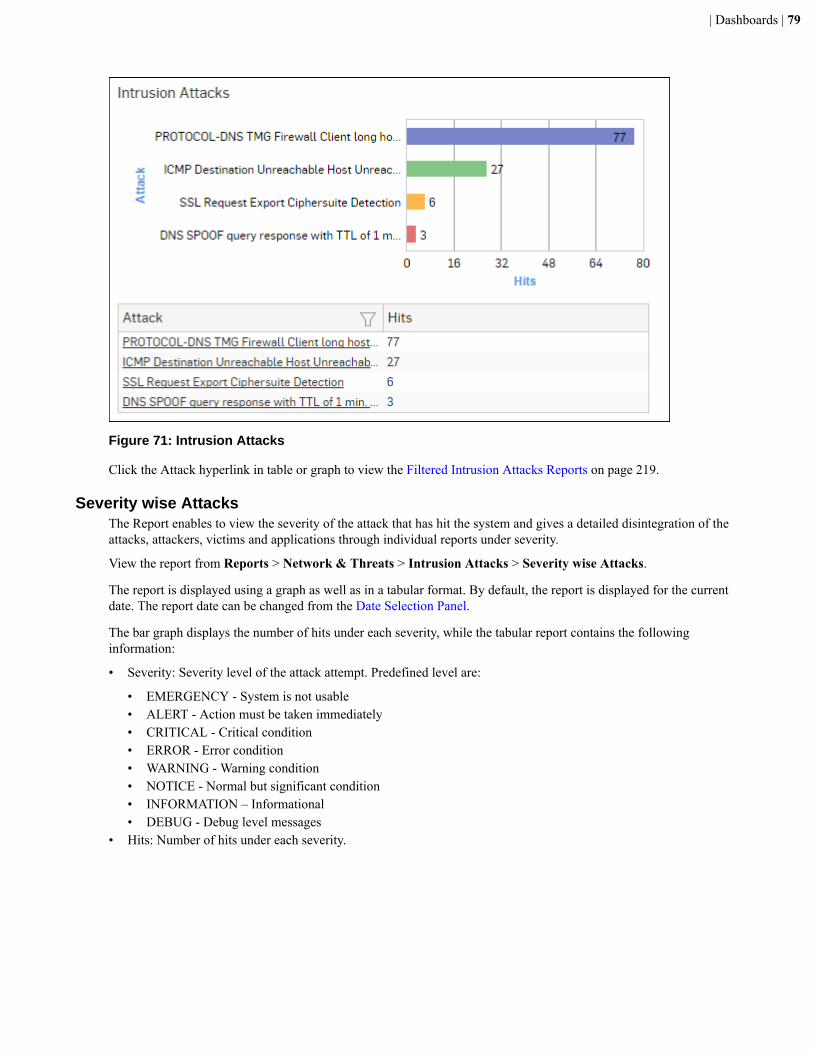
| Dashboards | 79
Figure 71: Intrusion Attacks
Click the Attack hyperlink in table or graph to view the Filtered Intrusion Attacks Reports on page 219.
Severity wise AttacksThe Report enables to view the severity of the attack that has hit the system and gives a detailed disintegration of theattacks, attackers, victims and applications through individual reports under severity.
View the report from Reports > Network & Threats > Intrusion Attacks > Severity wise Attacks.
The report is displayed using a graph as well as in a tabular format. By default, the report is displayed for the currentdate. The report date can be changed from the Date Selection Panel.
The bar graph displays the number of hits under each severity, while the tabular report contains the followinginformation:
• Severity: Severity level of the attack attempt. Predefined level are:
• EMERGENCY - System is not usable• ALERT - Action must be taken immediately• CRITICAL - Critical condition• ERROR - Error condition• WARNING - Warning condition• NOTICE - Normal but significant condition• INFORMATION – Informational• DEBUG - Debug level messages
• Hits: Number of hits under each severity.
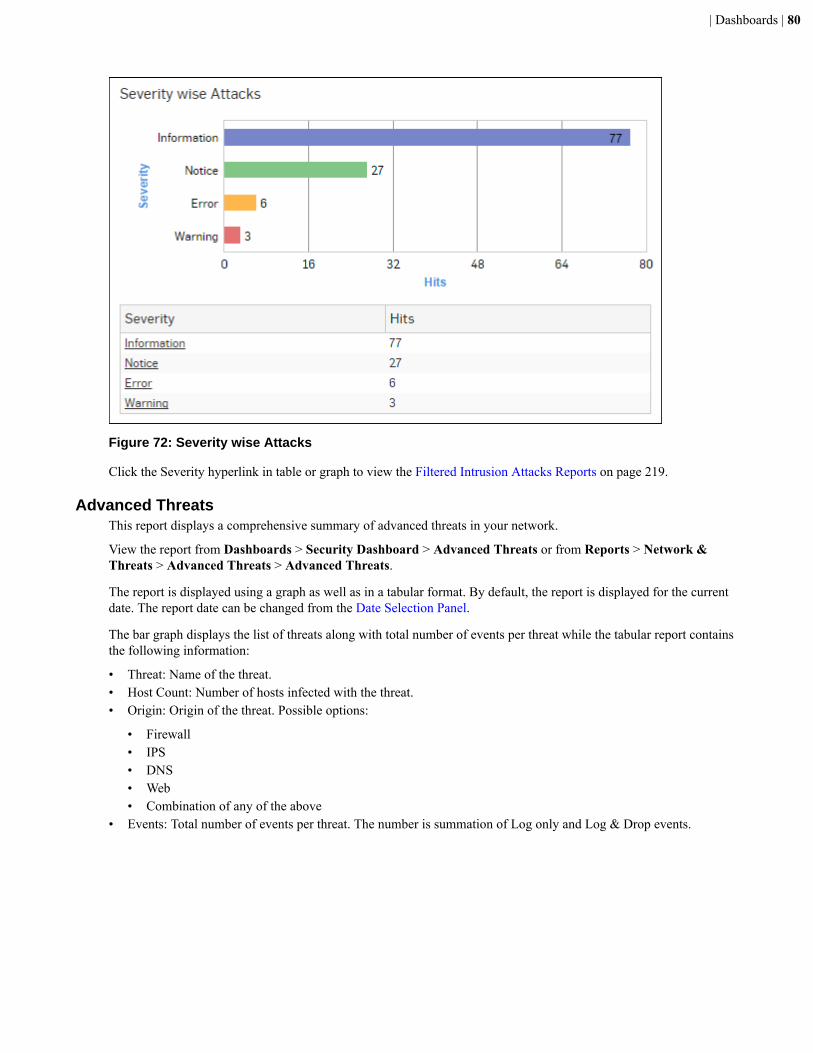
| Dashboards | 80
Figure 72: Severity wise Attacks
Click the Severity hyperlink in table or graph to view the Filtered Intrusion Attacks Reports on page 219.
Advanced ThreatsThis report displays a comprehensive summary of advanced threats in your network.
View the report from Dashboards > Security Dashboard > Advanced Threats or from Reports > Network &Threats > Advanced Threats > Advanced Threats.
The report is displayed using a graph as well as in a tabular format. By default, the report is displayed for the currentdate. The report date can be changed from the Date Selection Panel.
The bar graph displays the list of threats along with total number of events per threat while the tabular report containsthe following information:
• Threat: Name of the threat.• Host Count: Number of hosts infected with the threat.• Origin: Origin of the threat. Possible options:
• Firewall• IPS• DNS• Web• Combination of any of the above
• Events: Total number of events per threat. The number is summation of Log only and Log & Drop events.
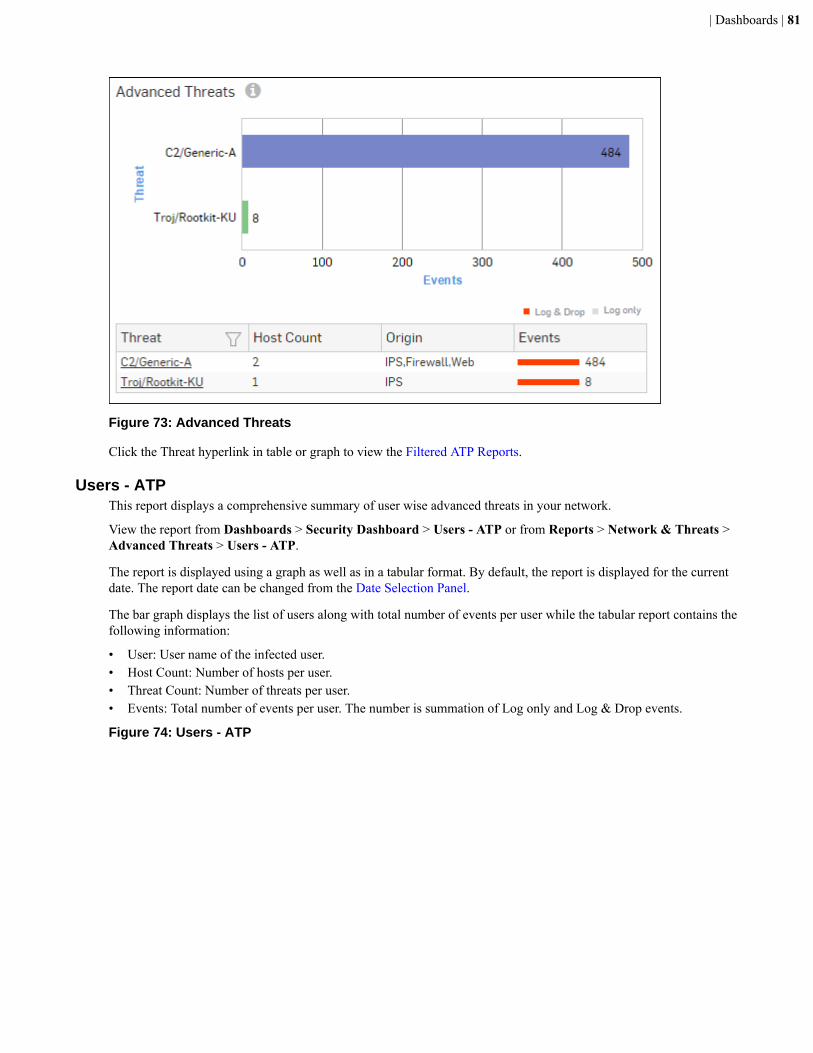
| Dashboards | 81
Figure 73: Advanced Threats
Click the Threat hyperlink in table or graph to view the Filtered ATP Reports.
Users - ATPThis report displays a comprehensive summary of user wise advanced threats in your network.
View the report from Dashboards > Security Dashboard > Users - ATP or from Reports > Network & Threats >Advanced Threats > Users - ATP.
The report is displayed using a graph as well as in a tabular format. By default, the report is displayed for the currentdate. The report date can be changed from the Date Selection Panel.
The bar graph displays the list of users along with total number of events per user while the tabular report contains thefollowing information:
• User: User name of the infected user.• Host Count: Number of hosts per user.• Threat Count: Number of threats per user.• Events: Total number of events per user. The number is summation of Log only and Log & Drop events.
Figure 74: Users - ATP
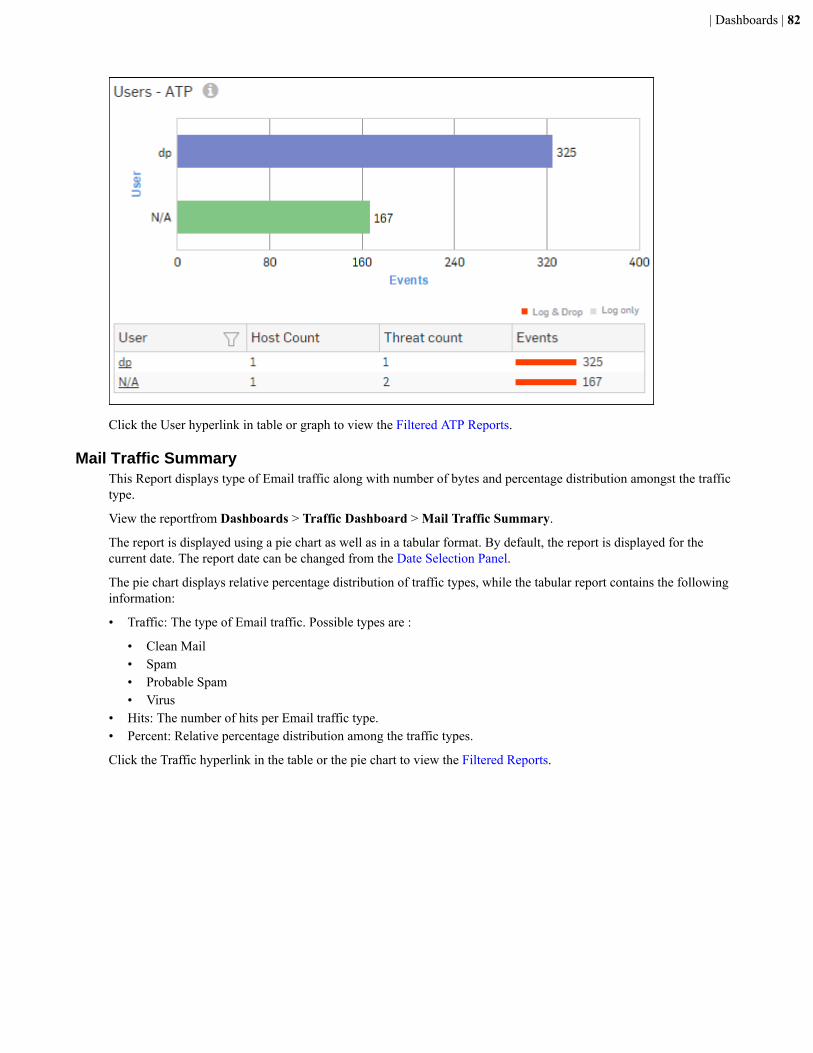
| Dashboards | 82
Click the User hyperlink in table or graph to view the Filtered ATP Reports.
Mail Traffic SummaryThis Report displays type of Email traffic along with number of bytes and percentage distribution amongst the traffictype.
View the reportfrom Dashboards > Traffic Dashboard > Mail Traffic Summary.
The report is displayed using a pie chart as well as in a tabular format. By default, the report is displayed for thecurrent date. The report date can be changed from the Date Selection Panel.
The pie chart displays relative percentage distribution of traffic types, while the tabular report contains the followinginformation:
• Traffic: The type of Email traffic. Possible types are :
• Clean Mail• Spam• Probable Spam• Virus
• Hits: The number of hits per Email traffic type.• Percent: Relative percentage distribution among the traffic types.
Click the Traffic hyperlink in the table or the pie chart to view the Filtered Reports.
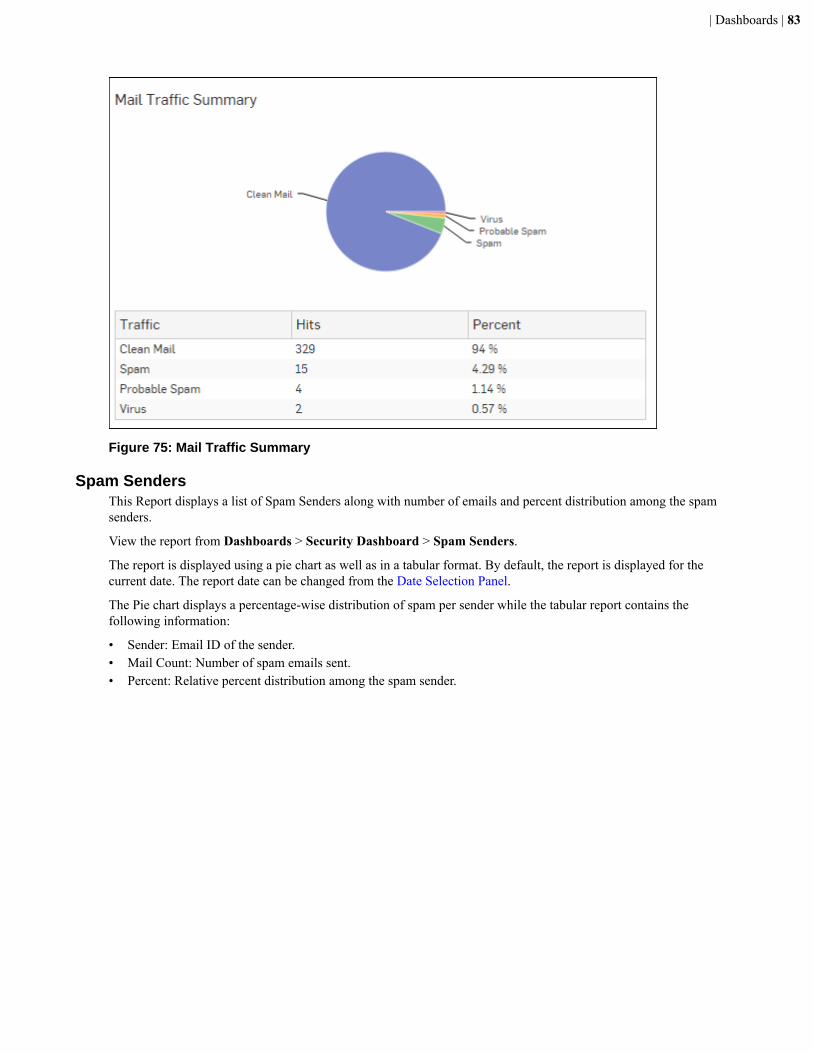
| Dashboards | 83
Figure 75: Mail Traffic Summary
Spam SendersThis Report displays a list of Spam Senders along with number of emails and percent distribution among the spamsenders.
View the report from Dashboards > Security Dashboard > Spam Senders.
The report is displayed using a pie chart as well as in a tabular format. By default, the report is displayed for thecurrent date. The report date can be changed from the Date Selection Panel.
The Pie chart displays a percentage-wise distribution of spam per sender while the tabular report contains thefollowing information:
• Sender: Email ID of the sender.• Mail Count: Number of spam emails sent.• Percent: Relative percent distribution among the spam sender.
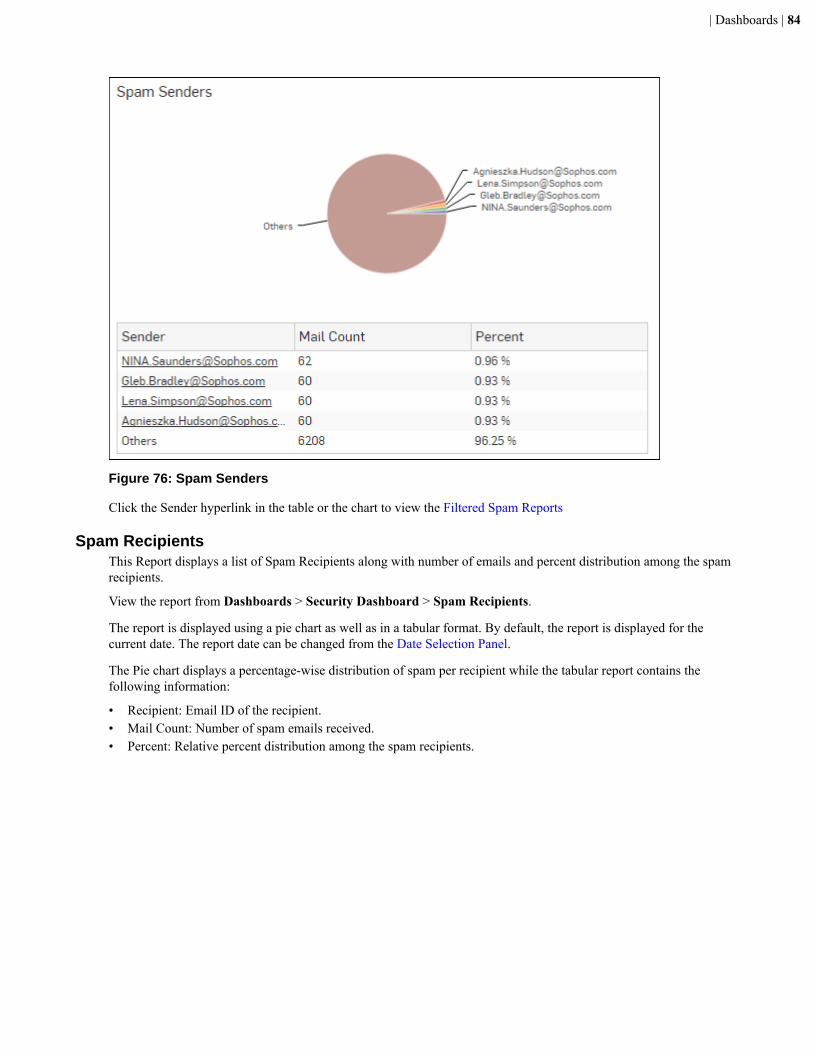
| Dashboards | 84
Figure 76: Spam Senders
Click the Sender hyperlink in the table or the chart to view the Filtered Spam Reports
Spam RecipientsThis Report displays a list of Spam Recipients along with number of emails and percent distribution among the spamrecipients.
View the report from Dashboards > Security Dashboard > Spam Recipients.
The report is displayed using a pie chart as well as in a tabular format. By default, the report is displayed for thecurrent date. The report date can be changed from the Date Selection Panel.
The Pie chart displays a percentage-wise distribution of spam per recipient while the tabular report contains thefollowing information:
• Recipient: Email ID of the recipient.• Mail Count: Number of spam emails received.• Percent: Relative percent distribution among the spam recipients.
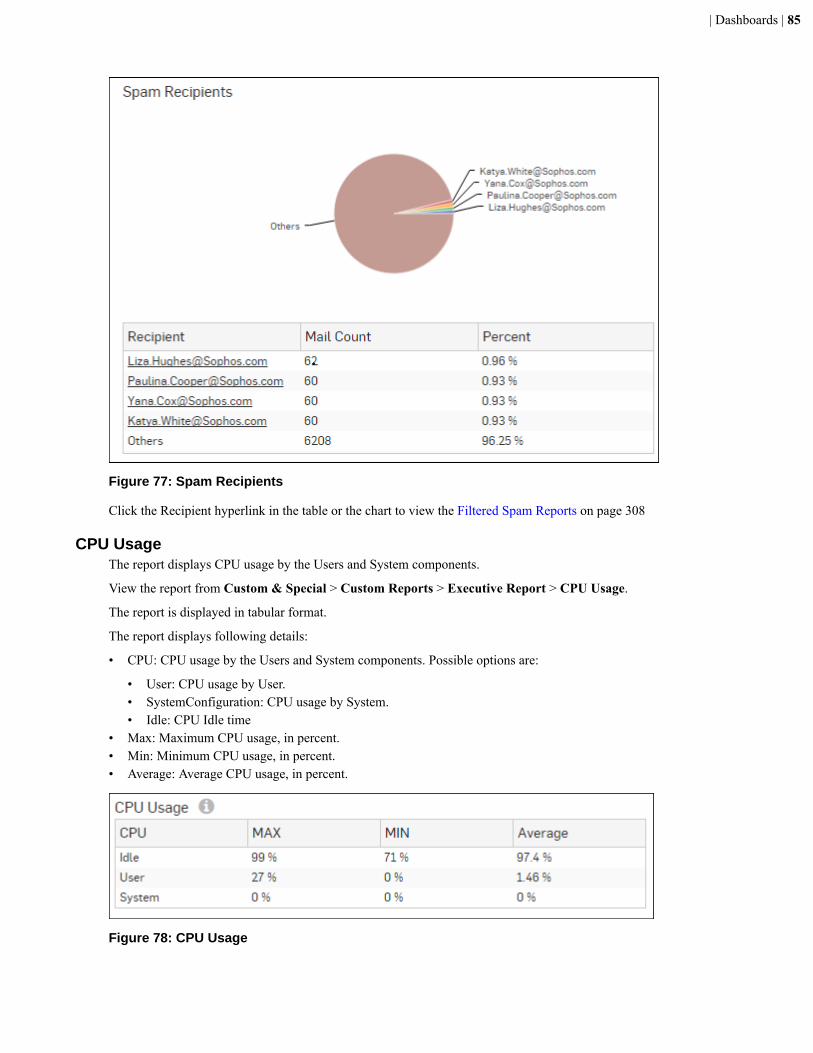
| Dashboards | 85
Figure 77: Spam Recipients
Click the Recipient hyperlink in the table or the chart to view the Filtered Spam Reports on page 308
CPU UsageThe report displays CPU usage by the Users and System components.
View the report from Custom & Special > Custom Reports > Executive Report > CPU Usage.
The report is displayed in tabular format.
The report displays following details:
• CPU: CPU usage by the Users and System components. Possible options are:
• User: CPU usage by User.• SystemConfiguration: CPU usage by System.• Idle: CPU Idle time
• Max: Maximum CPU usage, in percent.• Min: Minimum CPU usage, in percent.• Average: Average CPU usage, in percent.
Figure 78: CPU Usage
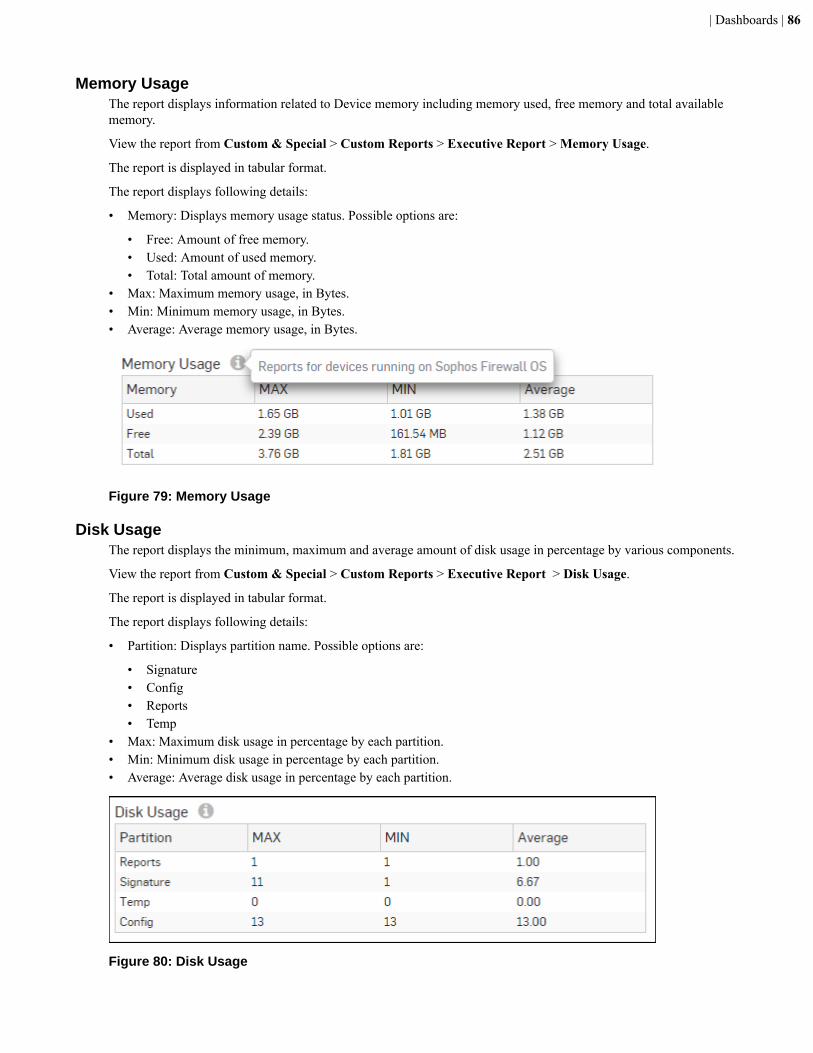
| Dashboards | 86
Memory UsageThe report displays information related to Device memory including memory used, free memory and total availablememory.
View the report from Custom & Special > Custom Reports > Executive Report > Memory Usage.
The report is displayed in tabular format.
The report displays following details:
• Memory: Displays memory usage status. Possible options are:
• Free: Amount of free memory.• Used: Amount of used memory.• Total: Total amount of memory.
• Max: Maximum memory usage, in Bytes.• Min: Minimum memory usage, in Bytes.• Average: Average memory usage, in Bytes.
Figure 79: Memory Usage
Disk UsageThe report displays the minimum, maximum and average amount of disk usage in percentage by various components.
View the report from Custom & Special > Custom Reports > Executive Report > Disk Usage.
The report is displayed in tabular format.
The report displays following details:
• Partition: Displays partition name. Possible options are:
• Signature• Config• Reports• Temp
• Max: Maximum disk usage in percentage by each partition.• Min: Minimum disk usage in percentage by each partition.• Average: Average disk usage in percentage by each partition.
Figure 80: Disk Usage
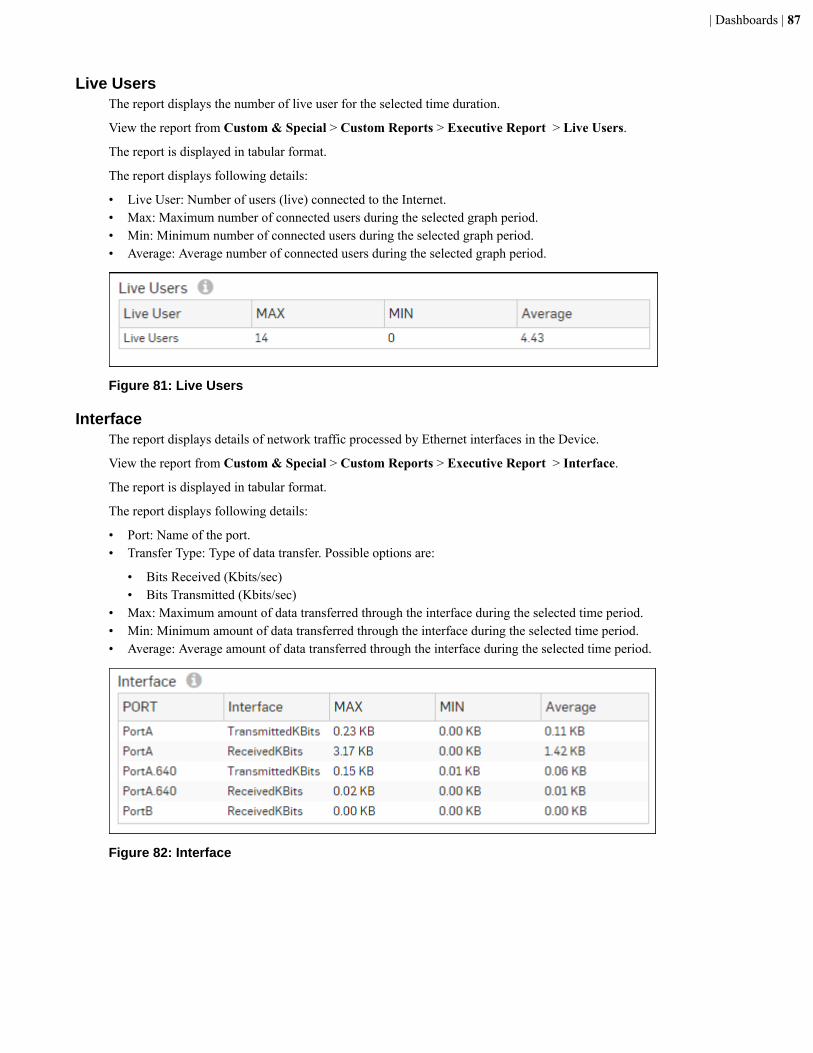
| Dashboards | 87
Live UsersThe report displays the number of live user for the selected time duration.
View the report from Custom & Special > Custom Reports > Executive Report > Live Users.
The report is displayed in tabular format.
The report displays following details:
• Live User: Number of users (live) connected to the Internet.• Max: Maximum number of connected users during the selected graph period.• Min: Minimum number of connected users during the selected graph period.• Average: Average number of connected users during the selected graph period.
Figure 81: Live Users
InterfaceThe report displays details of network traffic processed by Ethernet interfaces in the Device.
View the report from Custom & Special > Custom Reports > Executive Report > Interface.
The report is displayed in tabular format.
The report displays following details:
• Port: Name of the port.• Transfer Type: Type of data transfer. Possible options are:
• Bits Received (Kbits/sec)• Bits Transmitted (Kbits/sec)
• Max: Maximum amount of data transferred through the interface during the selected time period.• Min: Minimum amount of data transferred through the interface during the selected time period.• Average: Average amount of data transferred through the interface during the selected time period.
Figure 82: Interface
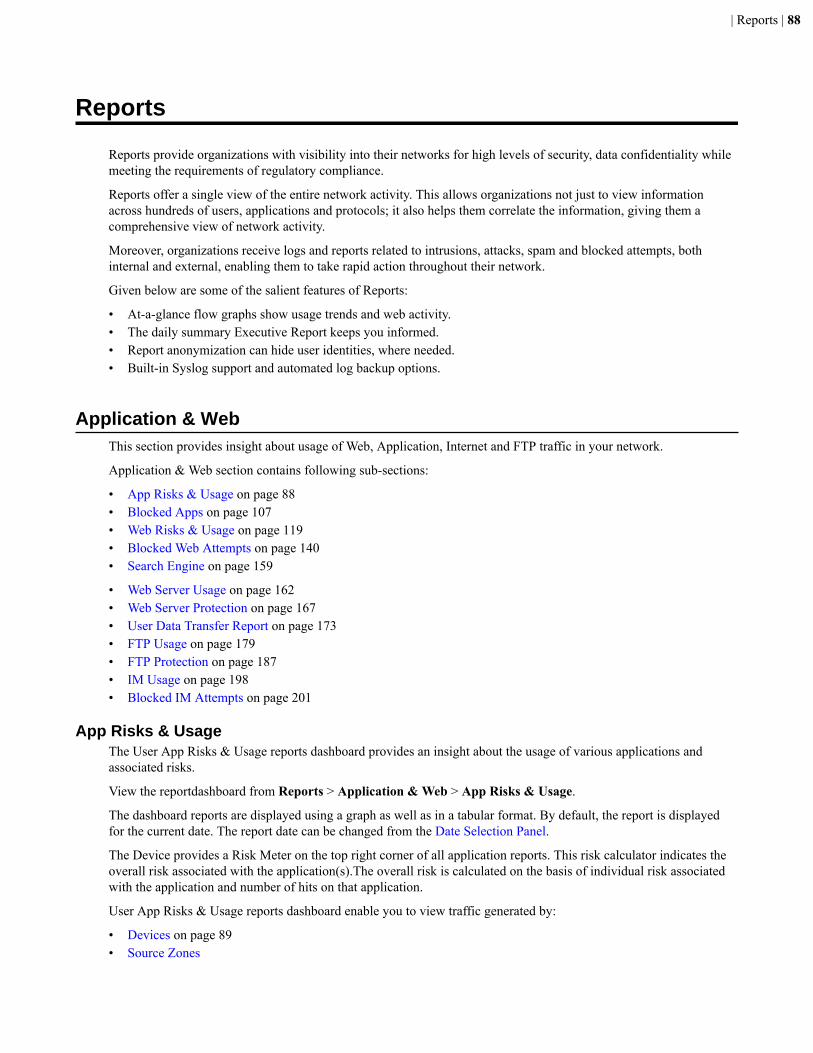
| Reports | 88
Reports
Reports provide organizations with visibility into their networks for high levels of security, data confidentiality whilemeeting the requirements of regulatory compliance.
Reports offer a single view of the entire network activity. This allows organizations not just to view informationacross hundreds of users, applications and protocols; it also helps them correlate the information, giving them acomprehensive view of network activity.
Moreover, organizations receive logs and reports related to intrusions, attacks, spam and blocked attempts, bothinternal and external, enabling them to take rapid action throughout their network.
Given below are some of the salient features of Reports:
• At-a-glance flow graphs show usage trends and web activity.• The daily summary Executive Report keeps you informed.• Report anonymization can hide user identities, where needed.• Built-in Syslog support and automated log backup options.
Application & WebThis section provides insight about usage of Web, Application, Internet and FTP traffic in your network.
Application & Web section contains following sub-sections:
• App Risks & Usage on page 88• Blocked Apps on page 107• Web Risks & Usage on page 119• Blocked Web Attempts on page 140• Search Engine on page 159
• Web Server Usage on page 162• Web Server Protection on page 167• User Data Transfer Report on page 173• FTP Usage on page 179• FTP Protection on page 187• IM Usage on page 198• Blocked IM Attempts on page 201
App Risks & UsageThe User App Risks & Usage reports dashboard provides an insight about the usage of various applications andassociated risks.
View the reportdashboard from Reports > Application & Web > App Risks & Usage.
The dashboard reports are displayed using a graph as well as in a tabular format. By default, the report is displayedfor the current date. The report date can be changed from the Date Selection Panel.
The Device provides a Risk Meter on the top right corner of all application reports. This risk calculator indicates theoverall risk associated with the application(s).The overall risk is calculated on the basis of individual risk associatedwith the application and number of hits on that application.
User App Risks & Usage reports dashboard enable you to view traffic generated by:
• Devices on page 89• Source Zones
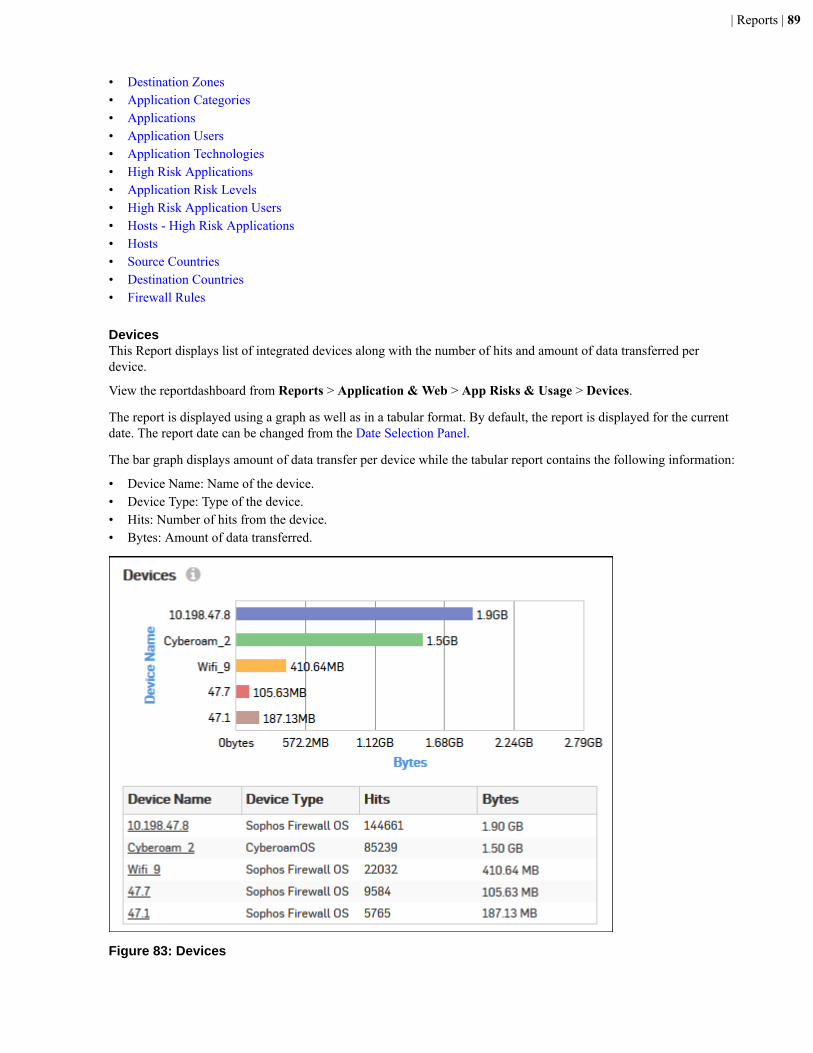
| Reports | 89
• Destination Zones• Application Categories• Applications• Application Users• Application Technologies• High Risk Applications• Application Risk Levels• High Risk Application Users• Hosts - High Risk Applications• Hosts• Source Countries• Destination Countries• Firewall Rules
DevicesThis Report displays list of integrated devices along with the number of hits and amount of data transferred perdevice.
View the reportdashboard from Reports > Application & Web > App Risks & Usage > Devices.
The report is displayed using a graph as well as in a tabular format. By default, the report is displayed for the currentdate. The report date can be changed from the Date Selection Panel.
The bar graph displays amount of data transfer per device while the tabular report contains the following information:
• Device Name: Name of the device.• Device Type: Type of the device.• Hits: Number of hits from the device.• Bytes: Amount of data transferred.
Figure 83: Devices

| Reports | 90
To view granular reports for a particular device, filter by clicking the Device Name hyperlink in the table. Refer toFiltered User App Risks & Usage Reports on page 102 section for details on each filtered widget.
Source ZonesThis Report displays a list of Source Zones along with the type of zone, number of hits per zone and zone wise totalamount of data transfer.
View the reportdashboard from Reports > Application & Web > App Risks & Usage > Source Zones.
The report is displayed using a graph as well as in a tabular format. By default, the report is displayed for the currentdate. The report date can be changed from the Date Selection Panel.
The bar graph displays the list of network zones along with the amount of data transfer while the tabular reportcontains the following information:
• Source Zone: Displays name of the source zone as defined in the Device.• Zone Type: Type of the Zone.• Hits: Number of hits per zone.• Bytes: Amount of data transferred.
Figure 84: Source Zones
To view granular reports for a particular zone, filter by clicking the Source Zone hyperlink in the table. Refer toFiltered User App Risks & Usage Reports section for details on each filtered widget.
Destination ZonesThis report displays a list of top destination zones along with the type of zone, number of hits per zone and zone wisetotal amount of data transfer.
View the reportdashboard from Reports > Application & Web > App Risks & Usage > Destination Zones.
The report is displayed using a graph as well as in a tabular format. By default, the report is displayed for the currentdate. The report date can be changed from the Date Selection Panel.
The bar graph displays the list of destination network Zones along with the amount of data transfer while the tabularreport contains the following information:
• Zone Name: Displays name of the zone as defined in the Device.• Zone Type: Type of the Zone.• Hits: Number of hits per zone.

| Reports | 91
• Bytes: Amount of data transferred.
Figure 85: Destination Zones
To view granular reports for a particular zone, filter by clicking the Zone Name hyperlink in the table. Refer toFiltered User App Risks & Usage Reports section for details on each filtered widget.
Application CategoriesThis report displays a list of top Application Categories along with number of hits per category and total amount ofdata transfer using that application.
View the reportdashboard from Reports > Application & Web > App Risks & Usage > Application Categories.
The report is displayed using a graph as well as in a tabular format. By default, the report is displayed for the currentdate. The report date can be changed from the Date Selection Panel.
The bar graph displays the list of application categories along with the data transfer while the tabular report containsthe following information:
• Category: Displays name of the Application Category as defined in the Device.• Hits: Number of hits per application category.• Bytes: Amount of data transfer through the application category, in bytes.
Figure 86: Application Categories
To view granular reports for a category, filter by clicking the Category hyperlink in the table. Refer to Filtered UserApp Risks & Usage Reports section for details on each filtered widget.
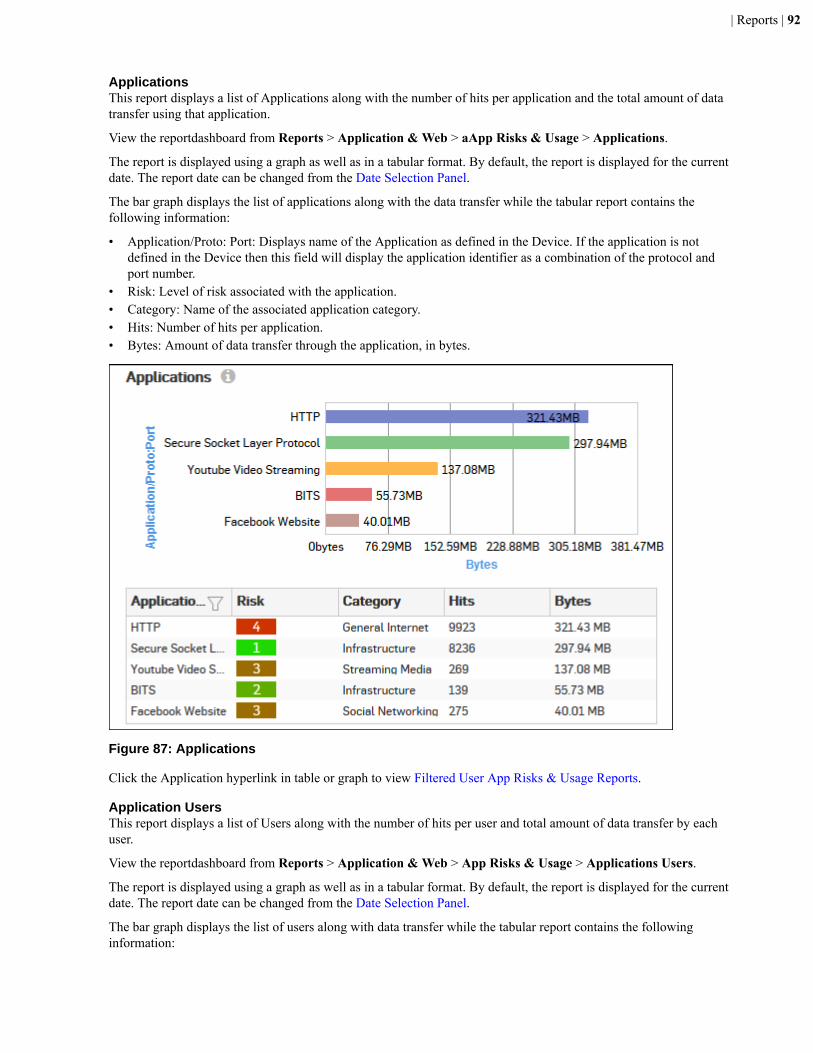
| Reports | 92
ApplicationsThis report displays a list of Applications along with the number of hits per application and the total amount of datatransfer using that application.
View the reportdashboard from Reports > Application & Web > aApp Risks & Usage > Applications.
The report is displayed using a graph as well as in a tabular format. By default, the report is displayed for the currentdate. The report date can be changed from the Date Selection Panel.
The bar graph displays the list of applications along with the data transfer while the tabular report contains thefollowing information:
• Application/Proto: Port: Displays name of the Application as defined in the Device. If the application is notdefined in the Device then this field will display the application identifier as a combination of the protocol andport number.
• Risk: Level of risk associated with the application.• Category: Name of the associated application category.• Hits: Number of hits per application.• Bytes: Amount of data transfer through the application, in bytes.
Figure 87: Applications
Click the Application hyperlink in table or graph to view Filtered User App Risks & Usage Reports.
Application UsersThis report displays a list of Users along with the number of hits per user and total amount of data transfer by eachuser.
View the reportdashboard from Reports > Application & Web > App Risks & Usage > Applications Users.
The report is displayed using a graph as well as in a tabular format. By default, the report is displayed for the currentdate. The report date can be changed from the Date Selection Panel.
The bar graph displays the list of users along with data transfer while the tabular report contains the followinginformation:
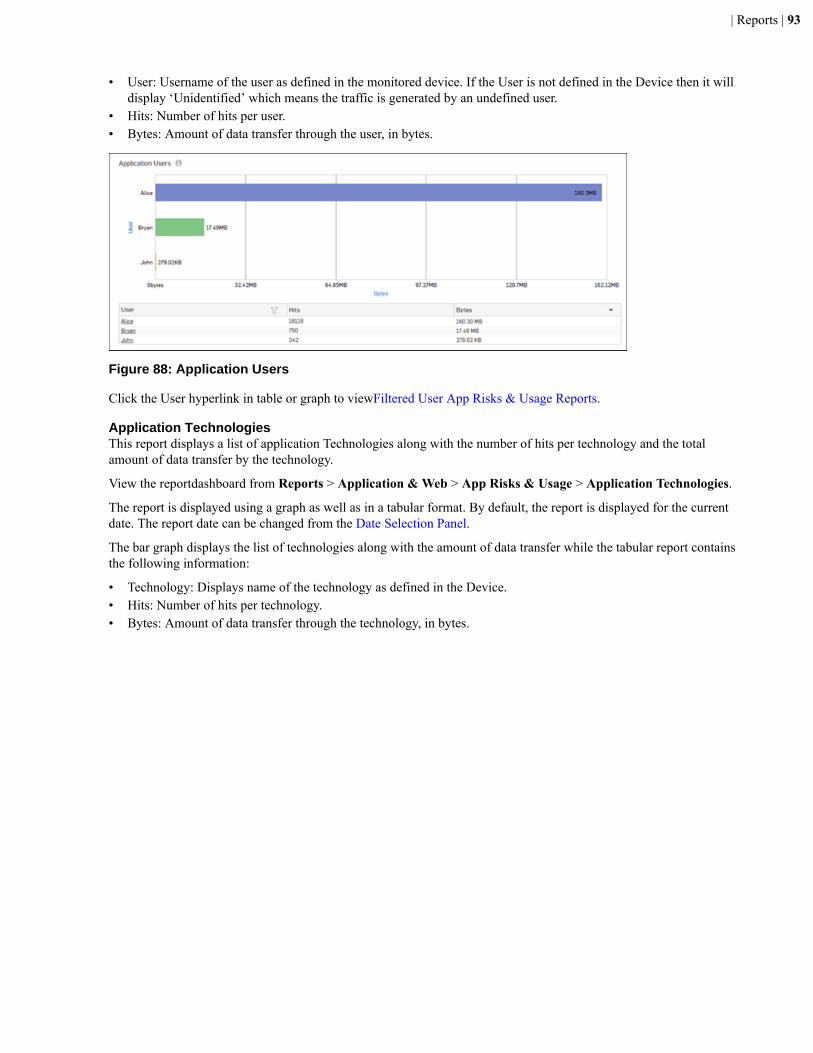
| Reports | 93
• User: Username of the user as defined in the monitored device. If the User is not defined in the Device then it willdisplay ‘Unidentified’ which means the traffic is generated by an undefined user.
• Hits: Number of hits per user.• Bytes: Amount of data transfer through the user, in bytes.
Figure 88: Application Users
Click the User hyperlink in table or graph to viewFiltered User App Risks & Usage Reports.
Application TechnologiesThis report displays a list of application Technologies along with the number of hits per technology and the totalamount of data transfer by the technology.
View the reportdashboard from Reports > Application & Web > App Risks & Usage > Application Technologies.
The report is displayed using a graph as well as in a tabular format. By default, the report is displayed for the currentdate. The report date can be changed from the Date Selection Panel.
The bar graph displays the list of technologies along with the amount of data transfer while the tabular report containsthe following information:
• Technology: Displays name of the technology as defined in the Device.• Hits: Number of hits per technology.• Bytes: Amount of data transfer through the technology, in bytes.
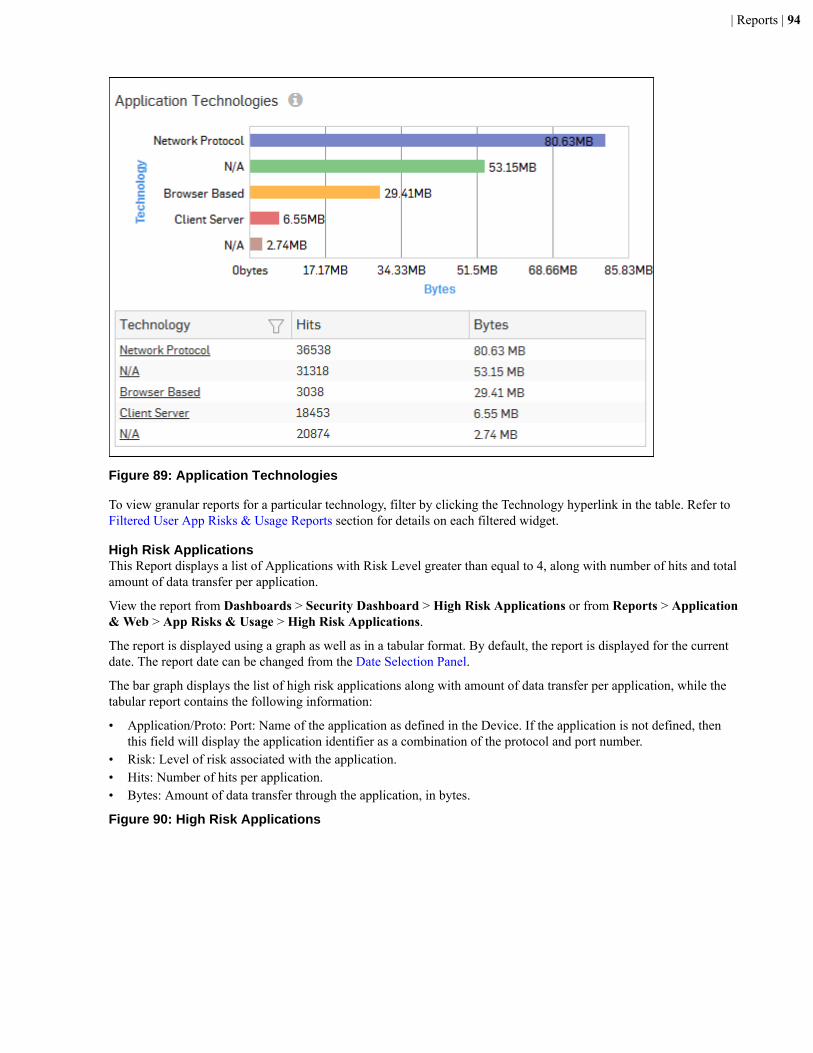
| Reports | 94
Figure 89: Application Technologies
To view granular reports for a particular technology, filter by clicking the Technology hyperlink in the table. Refer toFiltered User App Risks & Usage Reports section for details on each filtered widget.
High Risk ApplicationsThis Report displays a list of Applications with Risk Level greater than equal to 4, along with number of hits and totalamount of data transfer per application.
View the report from Dashboards > Security Dashboard > High Risk Applications or from Reports > Application& Web > App Risks & Usage > High Risk Applications.
The report is displayed using a graph as well as in a tabular format. By default, the report is displayed for the currentdate. The report date can be changed from the Date Selection Panel.
The bar graph displays the list of high risk applications along with amount of data transfer per application, while thetabular report contains the following information:
• Application/Proto: Port: Name of the application as defined in the Device. If the application is not defined, thenthis field will display the application identifier as a combination of the protocol and port number.
• Risk: Level of risk associated with the application.• Hits: Number of hits per application.• Bytes: Amount of data transfer through the application, in bytes.
Figure 90: High Risk Applications

| Reports | 95
To view granular reports for a particular Application, filter by clicking the Application hyperlink in the table. Refer toFiltered User App Risks & Usage Reports section for details on each filtered widget.
Application Risk LevelsThis report displays a list of Risk Levels associated with the various applications accessed in the network, along withthe number of hits and total amount of data transfer per risk level.
View the reportdashboard from Reports > Application & Web > App Risks & Usage > Application Risk Levels.
The report is displayed using a graph as well as in a tabular format. By default, the report is displayed for the currentdate. The report date can be changed from the Date Selection Panel.
The bar graph displays the list of risk levels along with the amount of data transfer while the tabular report containsthe following information:
• Risk: Risk associated with an application. Higher number shows higher risk.• Application Count: Number of applications accessed per risk level.• Hits: Number of hits to the applications with mentioned risk level.• Bytes: Amount of data transfer through the applications with mentioned risk level, in bytes.

| Reports | 96
Figure 91: Application Risk Levels
To view granular reports for a particular Risk, filter by clicking the Risk hyperlink in the table. Refer to Filtered UserApp Risks & Usage Reports section for details on each filtered widget.
High Risk Application UsersThis Report displays a list of Users accessing high risk applications (Risk Level greater than or equal to 4), along withapplication count, total number of hits to the applications and total amount of data transfer by each user.
View the reportfrom Dashboards > Security Dashboard > High Risk Application Users or from Reports >Application & Web > App Risks & Usage > High Risk Application Users.
The report is displayed using a graph as well as in a tabular format. By default, the report is displayed for the currentdate. The report date can be changed from the Date Selection Panel.
The bar graph displays the list of users along with data transfer while the tabular report contains the followinginformation:
• Username: Username of the user as defined in the monitored device. If the User is not defined in the Device then itwill display ‘Unidentified’ which means the traffic is generated by an undefined user.
• Application Count: Number of applications accessed per user.• Hits: Number of hits to the high risk applications accessed by the user.• Bytes: User-wise amount of data transfer through the high risk applications, in bytes.
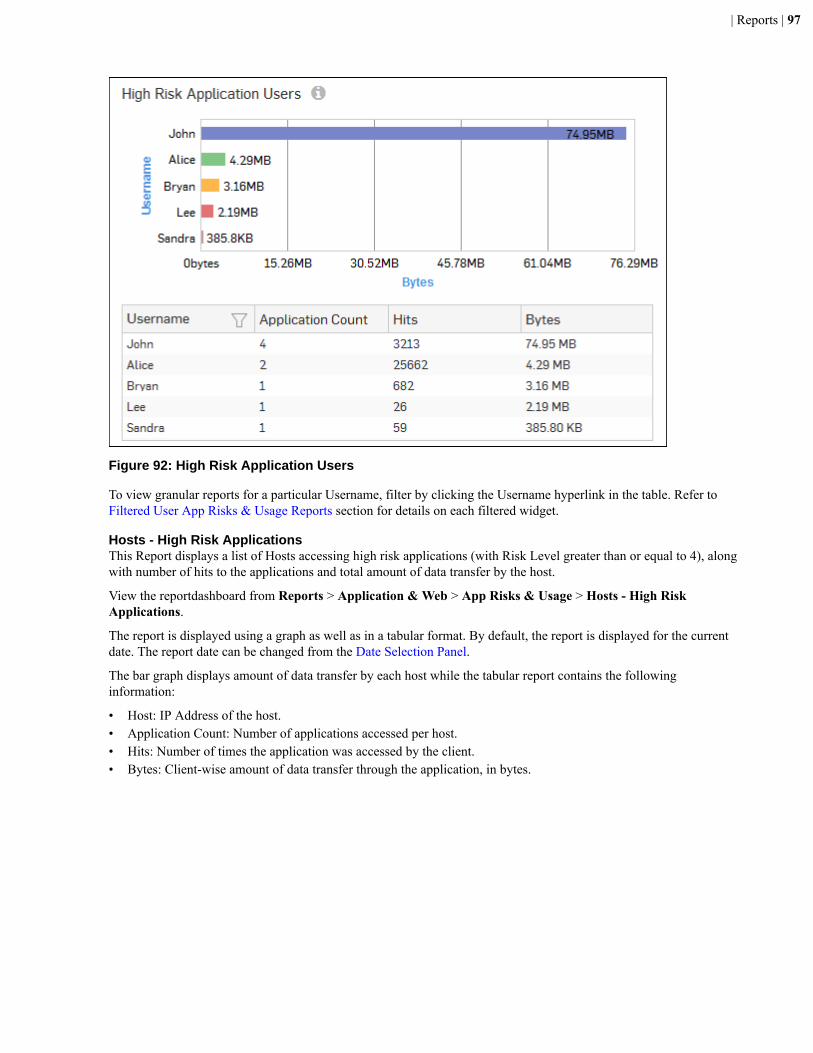
| Reports | 97
Figure 92: High Risk Application Users
To view granular reports for a particular Username, filter by clicking the Username hyperlink in the table. Refer toFiltered User App Risks & Usage Reports section for details on each filtered widget.
Hosts - High Risk ApplicationsThis Report displays a list of Hosts accessing high risk applications (with Risk Level greater than or equal to 4), alongwith number of hits to the applications and total amount of data transfer by the host.
View the reportdashboard from Reports > Application & Web > App Risks & Usage > Hosts - High RiskApplications.
The report is displayed using a graph as well as in a tabular format. By default, the report is displayed for the currentdate. The report date can be changed from the Date Selection Panel.
The bar graph displays amount of data transfer by each host while the tabular report contains the followinginformation:
• Host: IP Address of the host.• Application Count: Number of applications accessed per host.• Hits: Number of times the application was accessed by the client.• Bytes: Client-wise amount of data transfer through the application, in bytes.
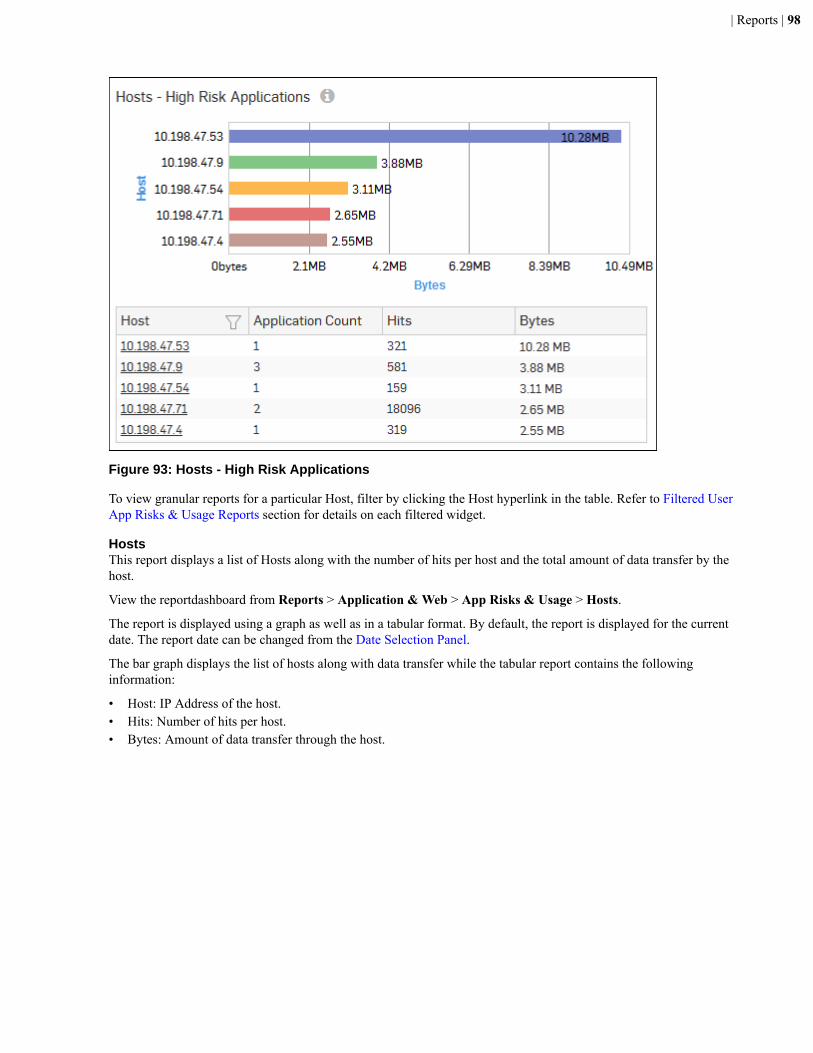
| Reports | 98
Figure 93: Hosts - High Risk Applications
To view granular reports for a particular Host, filter by clicking the Host hyperlink in the table. Refer to Filtered UserApp Risks & Usage Reports section for details on each filtered widget.
HostsThis report displays a list of Hosts along with the number of hits per host and the total amount of data transfer by thehost.
View the reportdashboard from Reports > Application & Web > App Risks & Usage > Hosts.
The report is displayed using a graph as well as in a tabular format. By default, the report is displayed for the currentdate. The report date can be changed from the Date Selection Panel.
The bar graph displays the list of hosts along with data transfer while the tabular report contains the followinginformation:
• Host: IP Address of the host.• Hits: Number of hits per host.• Bytes: Amount of data transfer through the host.
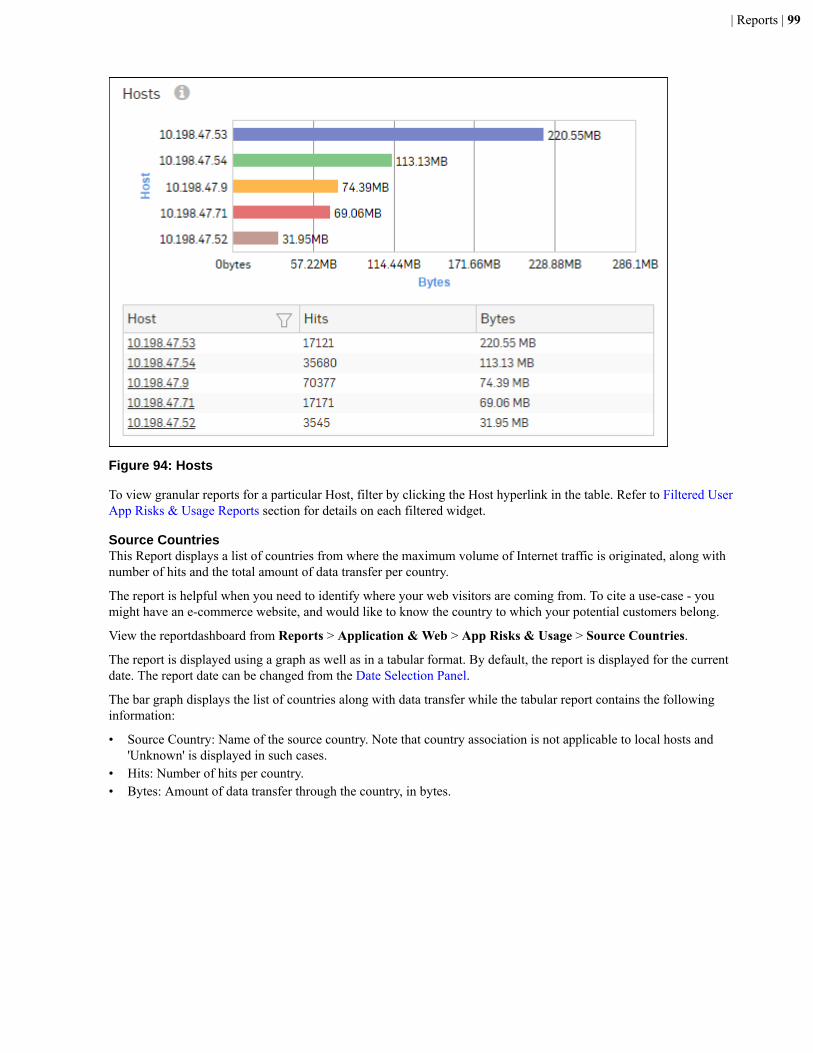
| Reports | 99
Figure 94: Hosts
To view granular reports for a particular Host, filter by clicking the Host hyperlink in the table. Refer to Filtered UserApp Risks & Usage Reports section for details on each filtered widget.
Source CountriesThis Report displays a list of countries from where the maximum volume of Internet traffic is originated, along withnumber of hits and the total amount of data transfer per country.
The report is helpful when you need to identify where your web visitors are coming from. To cite a use-case - youmight have an e-commerce website, and would like to know the country to which your potential customers belong.
View the reportdashboard from Reports > Application & Web > App Risks & Usage > Source Countries.
The report is displayed using a graph as well as in a tabular format. By default, the report is displayed for the currentdate. The report date can be changed from the Date Selection Panel.
The bar graph displays the list of countries along with data transfer while the tabular report contains the followinginformation:
• Source Country: Name of the source country. Note that country association is not applicable to local hosts and'Unknown' is displayed in such cases.
• Hits: Number of hits per country.• Bytes: Amount of data transfer through the country, in bytes.
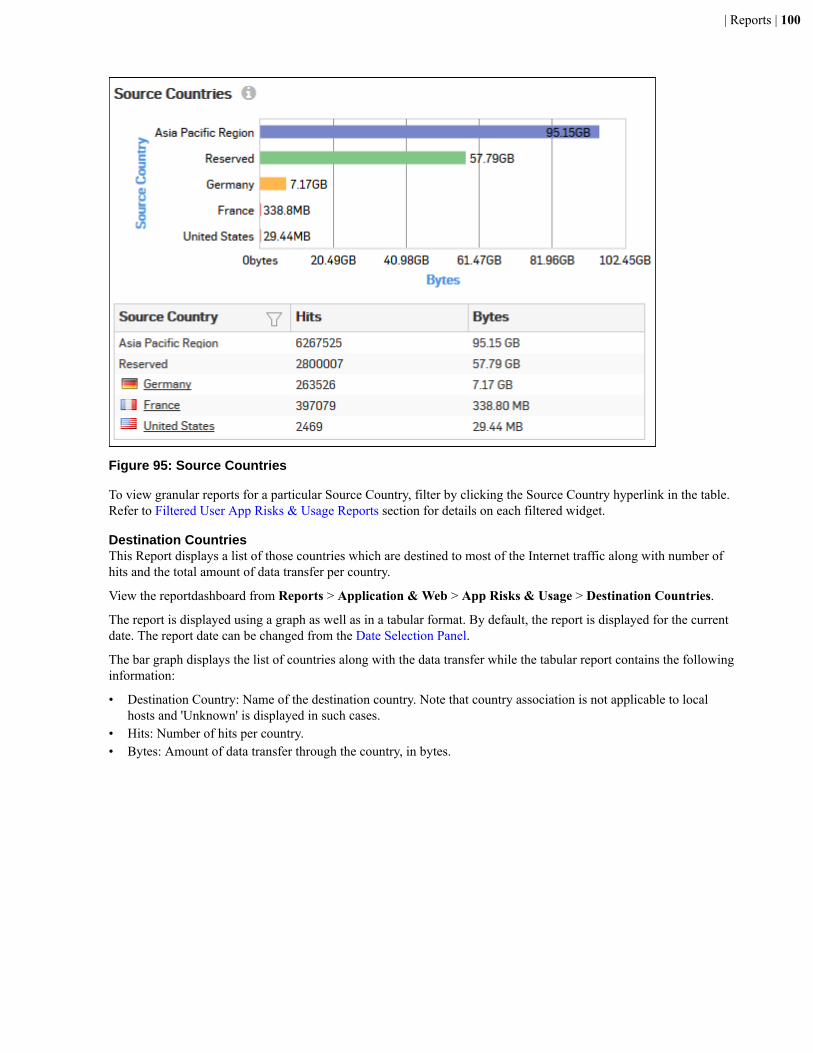
| Reports | 100
Figure 95: Source Countries
To view granular reports for a particular Source Country, filter by clicking the Source Country hyperlink in the table.Refer to Filtered User App Risks & Usage Reports section for details on each filtered widget.
Destination CountriesThis Report displays a list of those countries which are destined to most of the Internet traffic along with number ofhits and the total amount of data transfer per country.
View the reportdashboard from Reports > Application & Web > App Risks & Usage > Destination Countries.
The report is displayed using a graph as well as in a tabular format. By default, the report is displayed for the currentdate. The report date can be changed from the Date Selection Panel.
The bar graph displays the list of countries along with the data transfer while the tabular report contains the followinginformation:
• Destination Country: Name of the destination country. Note that country association is not applicable to localhosts and 'Unknown' is displayed in such cases.
• Hits: Number of hits per country.• Bytes: Amount of data transfer through the country, in bytes.
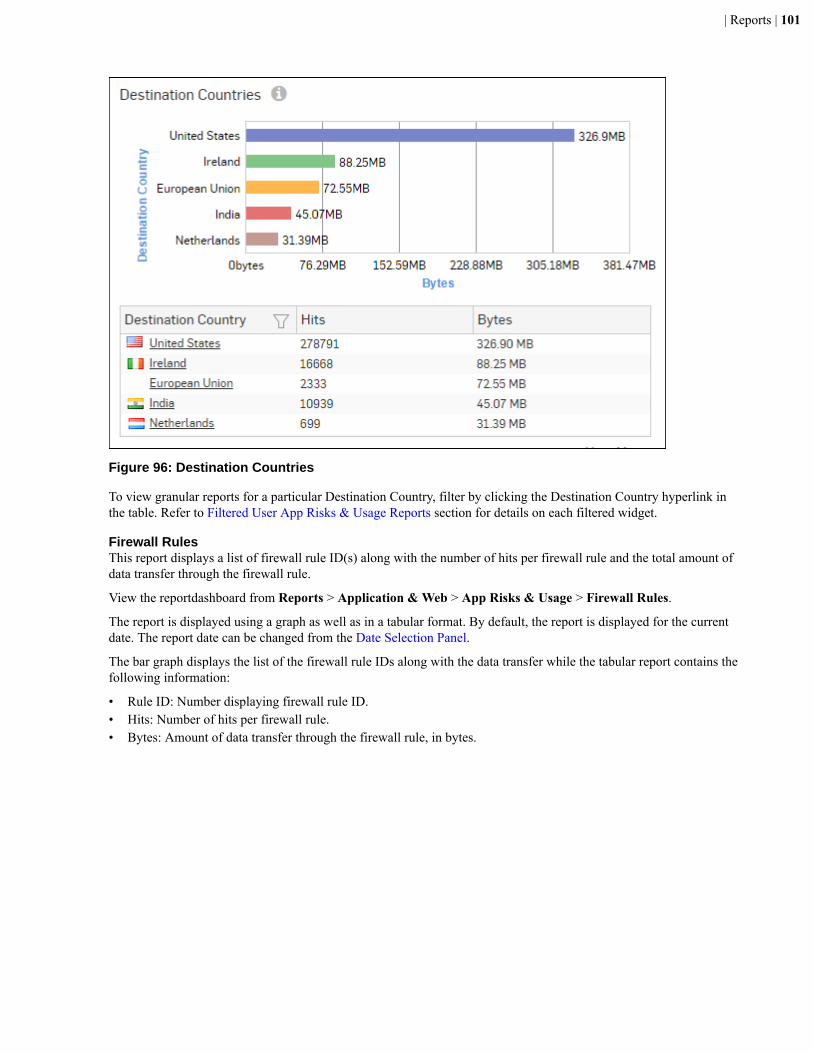
| Reports | 101
Figure 96: Destination Countries
To view granular reports for a particular Destination Country, filter by clicking the Destination Country hyperlink inthe table. Refer to Filtered User App Risks & Usage Reports section for details on each filtered widget.
Firewall RulesThis report displays a list of firewall rule ID(s) along with the number of hits per firewall rule and the total amount ofdata transfer through the firewall rule.
View the reportdashboard from Reports > Application & Web > App Risks & Usage > Firewall Rules.
The report is displayed using a graph as well as in a tabular format. By default, the report is displayed for the currentdate. The report date can be changed from the Date Selection Panel.
The bar graph displays the list of the firewall rule IDs along with the data transfer while the tabular report contains thefollowing information:
• Rule ID: Number displaying firewall rule ID.• Hits: Number of hits per firewall rule.• Bytes: Amount of data transfer through the firewall rule, in bytes.

| Reports | 102
Figure 97: Firewall Rules
To view the granular reports for a particular firewall rule, filter by clicking the Rule ID hyperlink in the table. Refer toFiltered User App Risks & Usage Reports section for details on each filtered widget.
Filtered User App Risks & Usage Reports
The User App Risks & Usage Reports can be filtered to get the following set of reports.
• Devices• Source Zones• Destination Zones• Application Categories• Applications• Application Users• Application Technologies• High Risk Applications• Application Risk Levels• High Risk Application Users• Hosts - High Risk Applications• Hosts• Source Countries• Destination Countries• Firewall Rules
To get filtered User App Risks & Usage reports, you need to choose one of the following filter criteria:
• Device Name from Devices on page 89 Report• Source Zone from Source Zones Report• Zone Name from Destination Zones Report• Category from Application Categories Report• Application from Applications Report• User from Application Users Report

| Reports | 103
• Technology from Application Technologies Report• Application from High Risk Applications Report• Risk from Application Risk Levels Report• Username from High Risk Application Users Report• Host from Hosts - High Risk Applications Report• Host from Hosts Report• Source Country from Source Countries Report• Destination Country from Destination Countries Report• Rule ID from Firewall Rules Report
Filtered Reports consist of multiple report widgets except the filter criterion widget. Each widget displays the reportin a graph as well as in a tabular format which can again be filtered.
By default, the report is displayed for the current date. The report date can be changed from the top most row of thepage.
Devices widgetThis widget Report displays the Devices along with number of hits and amount of data transfer.
Note: This widget will not be displayed for filter criterion Device Name.
The report is displayed as a graph as well as in a tabular format.
By default, the report is displayed for the current date. The report date can be changed from the Date Selection Panel.
The bar graph displays amount of data transfer per device while the tabular report contains the following information:
• Device Name: Name of the device.• Device Type: Type of the device.• Hits: Number of hits from the device.• Bytes: Amount of data transferred.
Source Zones widgetThis widget report displays a list of Source Zones along with the number of hits and the amount of data transfer perzone.
Note: This widget will not be displayed for filter criterion Source Zone.
The report is displayed as a graph as well as in a tabular format.
The report is displayed using a graph as well as in a tabular format. By default, the report is displayed for the currentdate. The report date can be changed from the Date Selection Panel.
The bar graph displays the amount of data transferred per zone while the tabular report contains the followinginformation:
• Source Zone: Displays name of the source zone as defined in the Device.• Zone Type: Type of the Zone.• Hits: Number of hits per zone.• Bytes: Amount of data transferred.
Destination Zones widgetThis widget report displays the list of destination zones along with the number of hits and the amount of data transferper zone.
Note: This widget will not be displayed for filter criterion Destination Zone.
The report is displayed as a graph as well as in a tabular format.
The report is displayed using a graph as well as in a tabular format. By default, the report is displayed for the currentdate. The report date can be changed from the Date Selection Panel.
| Reports | 104
The bar graph displays the amount of data transferred per zone while the tabular report contains the followinginformation:
• Zone Name: Displays name of the zone as defined in the Device.• Zone Type: Type of the Zone.• Hits: Number of hits per zone.• Bytes: Amount of data transferred.
Application Categories widgetThis widget report displays a list of Application Categories along with the number of Hits per category and totalamount of data transfer using that application.
Note: This widget will not be displayed for filter criterion Application Category.
The report is displayed as a graph as well as in a tabular format.
The report is displayed using a graph as well as in a tabular format. By default, the report is displayed for the currentdate. The report date can be changed from the Date Selection Panel.
The bar graph displays the list of application categories and the amount of data transfer while the tabular reportcontains the following information:
• Category: Displays name of the application category as defined in the Device.• Hits: Number of hits per category.• Bytes: Amount of data transfer through the application category, in bytes.
Applications widgetThis widget report displays a list of the Applications along with the number of hits per application and the totalamount of data transfer using that application.
Note: This widget will not be displayed for filter criterion Application.
The report is displayed as a graph as well as in a tabular format.
The report is displayed using a graph as well as in a tabular format. By default, the report is displayed for the currentdate. The report date can be changed from the Date Selection Panel.
The bar graph displays the list of applications along with number of hits while the tabular report contains thefollowing information:
• Application/Proto:Port: Displays the name of the application. If the application is not defined in the Device thenthis field displays the application identifier as combination of protocol and port number.
• Risk: Risk level associated with the application. The risk level is a numeric value. Higher value represents higherrisk.
• Category: Name of application category as defined in the Device.• Hits: Number of hits per application.• Bytes: Amount of data transferred per application.
Application Users widgetThis Widget report displays the list of network Users along with the number of hits and the amount of data transferper user.
Note: This widget will not be displayed for filter criterion User.
The report is displayed as a bar graph as well as in a tabular format.
The report is displayed using a graph as well as in a tabular format. By default, the report is displayed for the currentdate. The report date can be changed from the Date Selection Panel.
The bar graph displays the amount of data transferred per user while the tabular report contains the followinginformation:
| Reports | 105
• User: Username of the user as defined in the Device. If the User is not defined in the Device then it will display‘Unidentified’ which means that the traffic is generated by an undefined user.
• Hits: Number of hits per user.• Bytes: Amount of data transferred.
Application Technologies widgetThis widget report displays a list of Technologies along with the number of Hits per technology and the total amountof data transfer using that technology.
Note: This widget will not be displayed for filter criterion Technology.
The report is displayed as a graph as well as in a tabular format.
The bar graph displays the list of technologies along with the data transfer while the tabular report contains thefollowing information:
• Technology: Displays name of the technology as defined in the Device. Possible technology type: Browser Based,Client Server, Mobile, Network Protocol, P2P.
• Hits: Number of hits per technology.• Bytes: Amount of data transfer through the technology, in bytes.
High Risk Applications widgetThis widget report displays a list of Applications with Risk Level greater than equal to 4, along with number of hitsand total amount of data transfer per application.
Note: This widget will not be displayed for filter criterion Application.
The report is displayed as a graph as well as in a tabular format.
The report is displayed using a graph as well as in a tabular format. By default, the report is displayed for the currentdate. The report date can be changed from the Date Selection Panel.
The bar graph displays the list of high risk applications along with amount of data transfer per application, while thetabular report contains the following information:
• Application/Proto: Port: Name of the application as defined in the Device. If the application is not defined, thenthis field will display the application identifier as a combination of the protocol and port number.
• Risk: Level of risk associated with the application.• Hits: Number of hits per application.• Bytes: Amount of data transfer through the application, in bytes.
Application Risk Levels widgetThis widget report displays a list of Risks along with the number of hits per Risk level and the total amount of datatransfer using that technology.
Note: This widget will not be displayed for filter criterion Risk.
The report is displayed using a graph as well as in a tabular format.
The report is displayed using a graph as well as in a tabular format. By default, the report is displayed for the currentdate. The report date can be changed from the Date Selection Panel.
The bar graph displays the list of risk levels along with amount of data transfer while the tabular report contains thefollowing information:
• Risk: Risk associated with the application. Higher number shows higher risk.• Hits: Number of hits per risk.• Bytes: Amount of data transfer through the risk level, in bytes.
High Risk Application Users widgetThis widget report displays a list of Users accessing high risk applications (Risk Level greater than or equal to 4),along with application count, total number of hits to the applications and total amount of data transfer by each user.
| Reports | 106
Note: This widget will not be displayed for filter criterion Username and Risk.
The report is displayed using a graph as well as in a tabular format. By default, the report is displayed for the currentdate. The report date can be changed from the Date Selection Panel.
The bar graph displays the list of users along with data transfer while the tabular report contains the followinginformation:
• Username: Username of the user as defined in the monitored device. If the User is not defined in the Device then itwill display ‘Unidentified’ which means the traffic is generated by an undefined user.
• Application Count: Number of applications accessed per user.• Hits: Number of hits to the high risk applications accessed by the user.• Bytes: User-wise amount of data transfer through the high risk applications, in bytes.
Hosts - High Risk Applications widgetThis widget report displays a list of Hosts accessing high risk applications (with Risk Level greater than or equal to4), along with number of hits to the applications and total amount of data transfer by the host.
Note: This widget will not be displayed for filter criterion User.
The report is displayed using a graph as well as in a tabular format. By default, the report is displayed for the currentdate. The report date can be changed from the Date Selection Panel.
The bar graph displays amount of data transfer by each host while the tabular report contains the followinginformation:
• Host: IP Address of the host.• Application Count: Number of applications accessed per host.• Hits: Number of times the application was accessed by the client.• Bytes: Client-wise amount of data transfer through the application, in bytes.
Hosts widgetThis widget report displays the list of Hosts along with the number of hits and the amount of data transfer per host.
Note: This widget will not be displayed for filter criterion Host.
The report is displayed as a bar graph as well as in a tabular format.
The report is displayed using a graph as well as in a tabular format. By default, the report is displayed for the currentdate. The report date can be changed from the Date Selection Panel.
The bar graph displays the amount of data transferred per host while the tabular report contains the followinginformation:
• Host: IP Address of the host.• Hits: Number of hits per host.• Bytes: Amount of data transferred.
Source Countries widgetThis widget displays a list of countries from where the maximum volume of Internet traffic is originated, along withnumber of hits and the total amount of data transfer per country.
Note: This widget will not be displayed for filter criterion Source Country.
The report is displayed as a bar graph as well as in a tabular format.
The report is displayed using a graph as well as in a tabular format. By default, the report is displayed for the currentdate. The report date can be changed from the Date Selection Panel.
The bar graph displays the amount of data transfer per Source Country while the tabular report contains the followinginformation:

| Reports | 107
• Source Country: Name of country. Note that country association is not applicable to local hosts and 'Unknown' isdisplayed in such cases.
• Hits: Number of hits per country.• Bytes: Total data transfer per source country.
Destination Countries widgetThis widget report displays the list of the Destination Countries where the web traffic is directed along with a countrywise distribution of the total data transfer and the number of hits.
Note: This widget will not be displayed for filter criterion Destination Country.
The report is displayed as bar graph as well as in tabular format.
The report is displayed using a graph as well as in a tabular format. By default, the report is displayed for the currentdate. The report date can be changed from the Date Selection Panel.
The bar graph displays the amount of data transfer per destination country while the tabular report contains thefollowing information:
• Destination Country: Name of the county. Note that country association is not applicable to local hosts and'Unknown' is displayed in such cases.
• Hits: Number of hits per country.• Bytes: Total data transfer per destination country.
Destinations widgetThis widget report displays a list of destination IP Addresses along with number of hits and amount of data transferper destination.
The report is displayed as a graph as well as in a tabular format.
The report is displayed using a graph as well as in a tabular format. By default, the report is displayed for the currentdate. The report date can be changed from the Date Selection Panel.
The bar graph displays the amount of data transferred per destination while the tabular report contains the followinginformation:
• Destination: IP Address of the destination.• Hits: Number of hits per destination.• Bytes: Amount of data transferred per destination.
Firewall Rules widgetThis widget report displays a list of firewall rule IDs along with the rule-wise distribution of the total data transfer andthe number of hits to those rules.
Note: This widget will not be displayed for filter criterion Rule ID.
The report is displayed as a bar graph as well as in a tabular format.
The report is displayed using a graph as well as in a tabular format. By default, the report is displayed for the currentdate. The report date can be changed from the Date Selection Panel.
The bar graph displays various firewall Rule IDs and the amount of data transfer using that firewall rule while thetabular report contains the following information:
• Rule ID: Displays firewall rule ID.• Hits: Number of hits per firewall rule ID.• Bytes: Amount of data transferred per firewall Rule ID.
Blocked AppsThe Blocked User Apps reports dashboard provides an insight into blocked attempts for accessing variousapplications.
View the reportdashboard from Reports > Application & Web > Blocked Apps.

| Reports | 108
The widgets are displayed using a graph as well as in a tabular format. By default, the report is displayed for thecurrent date. The report date can be changed from the Date Selection Panel.
Blocked User Apps reports dashboard consist of following reports:
• Devices on page 108• Blocked Application Categories• Blocked Applications• Blocked Technologies• Blocked Application Risk Levels• Blocked Application Users• Blocked Hosts• Blocked Source Countries• Blocked Destination Countries• Blocked Policies
DevicesThis Report displays list of integrated devices along with the number of hits and amount of data transferred perdevice.
View the reportfrom Reports > Application & Web > Blocked Apps > Devices.
The report is displayed using a graph as well as in a tabular format. By default, the report is displayed for the currentdate. The report date can be changed from the Date Selection Panel.
The bar graph displays amount of data transfer per device while the tabular report contains the following information:
• Device Name: Name of the device.• Device Type: Type of the device.• Hits: Number of hits from the device.
Figure 98: Devices
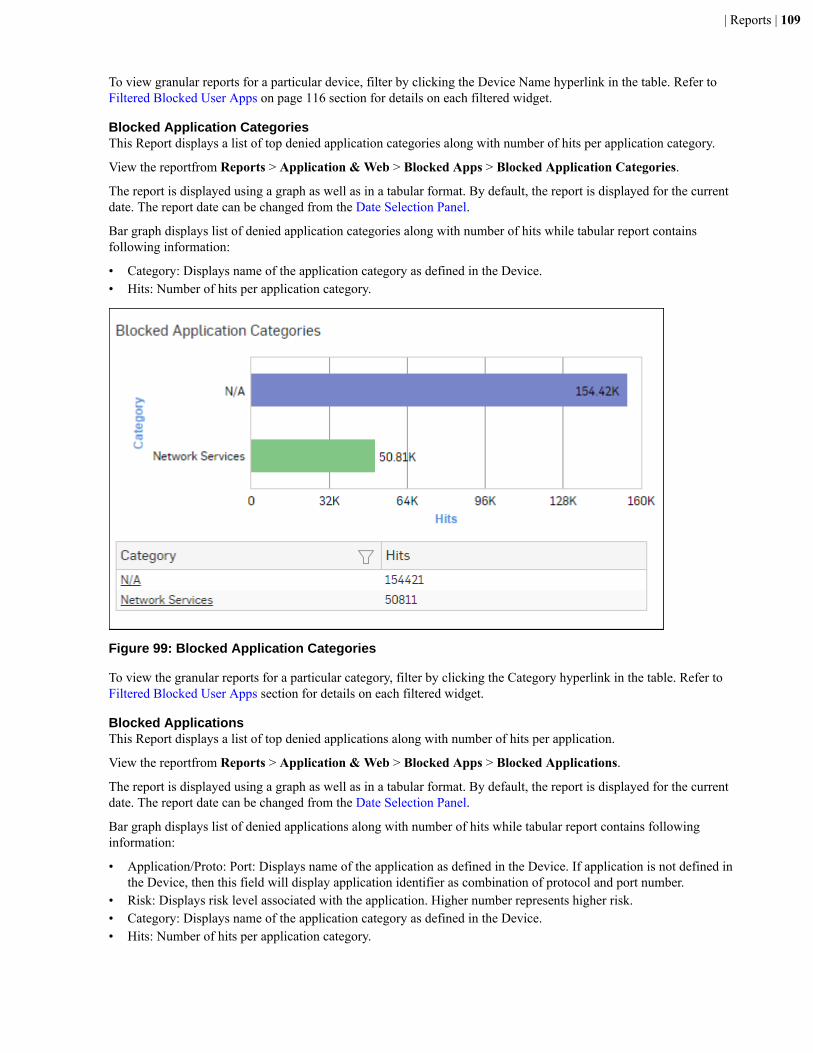
| Reports | 109
To view granular reports for a particular device, filter by clicking the Device Name hyperlink in the table. Refer toFiltered Blocked User Apps on page 116 section for details on each filtered widget.
Blocked Application CategoriesThis Report displays a list of top denied application categories along with number of hits per application category.
View the reportfrom Reports > Application & Web > Blocked Apps > Blocked Application Categories.
The report is displayed using a graph as well as in a tabular format. By default, the report is displayed for the currentdate. The report date can be changed from the Date Selection Panel.
Bar graph displays list of denied application categories along with number of hits while tabular report containsfollowing information:
• Category: Displays name of the application category as defined in the Device.• Hits: Number of hits per application category.
Figure 99: Blocked Application Categories
To view the granular reports for a particular category, filter by clicking the Category hyperlink in the table. Refer toFiltered Blocked User Apps section for details on each filtered widget.
Blocked ApplicationsThis Report displays a list of top denied applications along with number of hits per application.
View the reportfrom Reports > Application & Web > Blocked Apps > Blocked Applications.
The report is displayed using a graph as well as in a tabular format. By default, the report is displayed for the currentdate. The report date can be changed from the Date Selection Panel.
Bar graph displays list of denied applications along with number of hits while tabular report contains followinginformation:
• Application/Proto: Port: Displays name of the application as defined in the Device. If application is not defined inthe Device, then this field will display application identifier as combination of protocol and port number.
• Risk: Displays risk level associated with the application. Higher number represents higher risk.• Category: Displays name of the application category as defined in the Device.• Hits: Number of hits per application category.
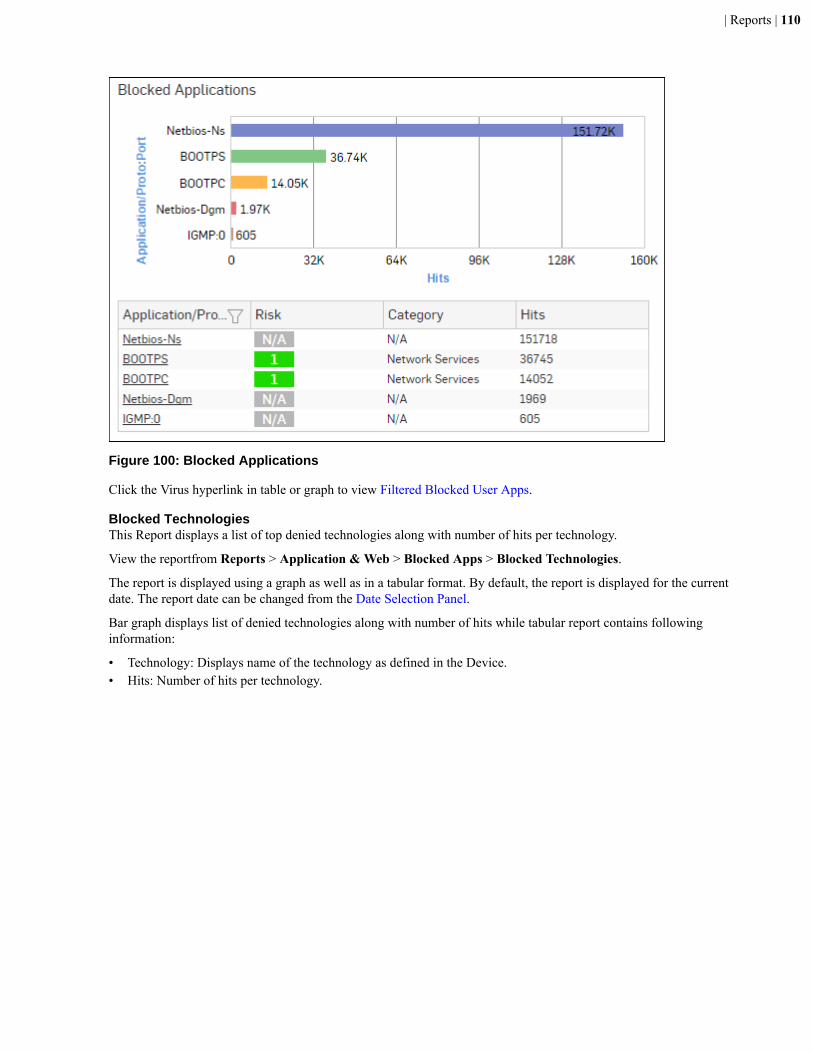
| Reports | 110
Figure 100: Blocked Applications
Click the Virus hyperlink in table or graph to view Filtered Blocked User Apps.
Blocked TechnologiesThis Report displays a list of top denied technologies along with number of hits per technology.
View the reportfrom Reports > Application & Web > Blocked Apps > Blocked Technologies.
The report is displayed using a graph as well as in a tabular format. By default, the report is displayed for the currentdate. The report date can be changed from the Date Selection Panel.
Bar graph displays list of denied technologies along with number of hits while tabular report contains followinginformation:
• Technology: Displays name of the technology as defined in the Device.• Hits: Number of hits per technology.
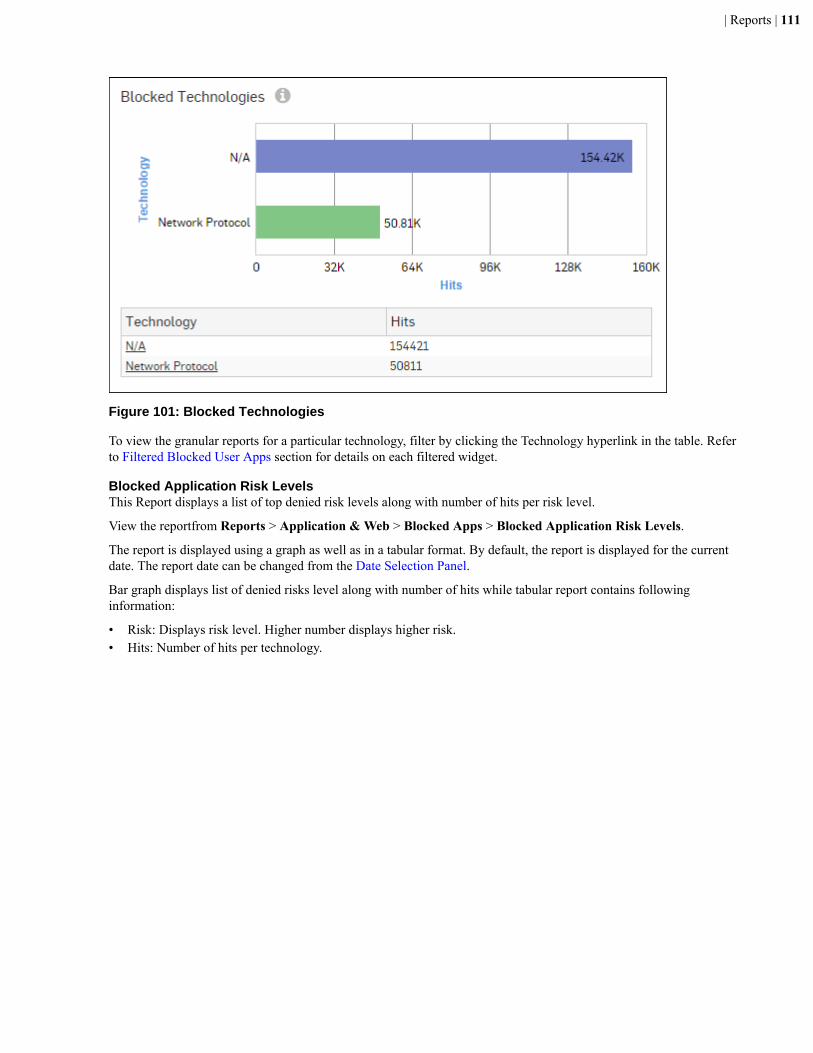
| Reports | 111
Figure 101: Blocked Technologies
To view the granular reports for a particular technology, filter by clicking the Technology hyperlink in the table. Referto Filtered Blocked User Apps section for details on each filtered widget.
Blocked Application Risk LevelsThis Report displays a list of top denied risk levels along with number of hits per risk level.
View the reportfrom Reports > Application & Web > Blocked Apps > Blocked Application Risk Levels.
The report is displayed using a graph as well as in a tabular format. By default, the report is displayed for the currentdate. The report date can be changed from the Date Selection Panel.
Bar graph displays list of denied risks level along with number of hits while tabular report contains followinginformation:
• Risk: Displays risk level. Higher number displays higher risk.• Hits: Number of hits per technology.
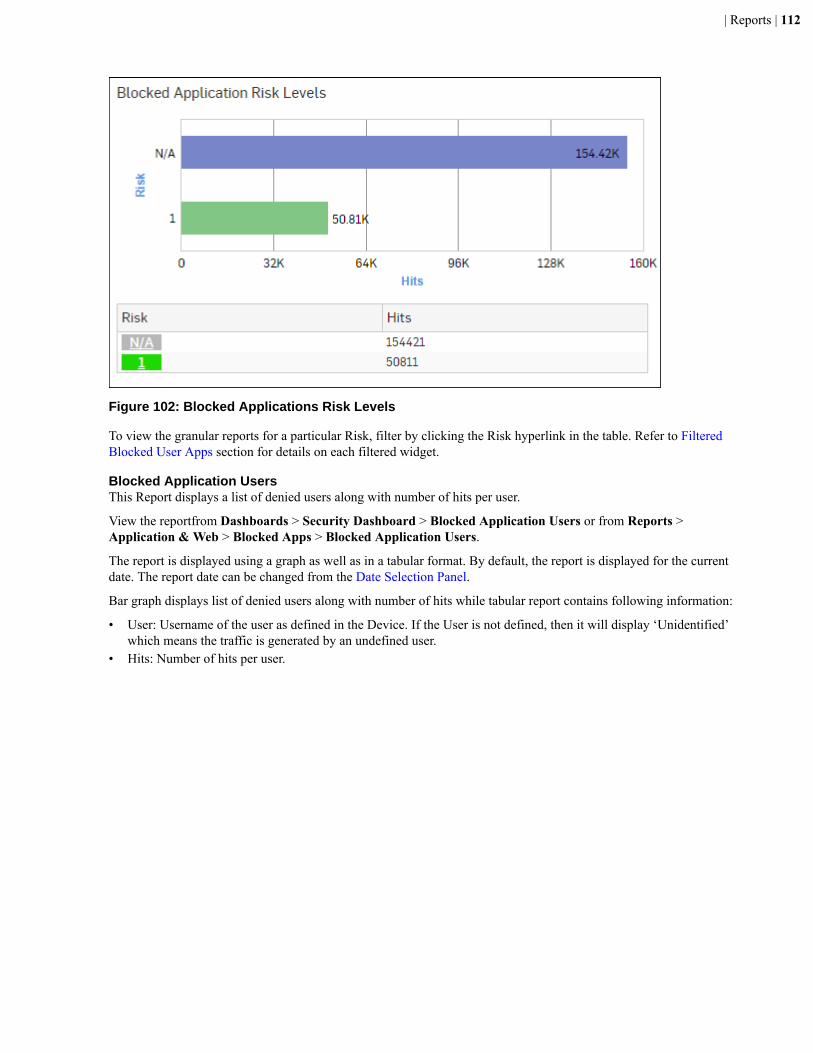
| Reports | 112
Figure 102: Blocked Applications Risk Levels
To view the granular reports for a particular Risk, filter by clicking the Risk hyperlink in the table. Refer to FilteredBlocked User Apps section for details on each filtered widget.
Blocked Application UsersThis Report displays a list of denied users along with number of hits per user.
View the reportfrom Dashboards > Security Dashboard > Blocked Application Users or from Reports >Application & Web > Blocked Apps > Blocked Application Users.
The report is displayed using a graph as well as in a tabular format. By default, the report is displayed for the currentdate. The report date can be changed from the Date Selection Panel.
Bar graph displays list of denied users along with number of hits while tabular report contains following information:
• User: Username of the user as defined in the Device. If the User is not defined, then it will display ‘Unidentified’which means the traffic is generated by an undefined user.
• Hits: Number of hits per user.

| Reports | 113
Figure 103: Blocked Application Users
Click the Virus hyperlink in table or graph to view Filtered Blocked User Apps.
Blocked HostsThis Report displays a list of top denied hosts along with number of hits per host.
View the reportfrom Reports > Application & Web > Blocked Apps > Blocked Hosts.
The report is displayed using a graph as well as in a tabular format. By default, the report is displayed for the currentdate. The report date can be changed from the Date Selection Panel.
Bar graph displays list of denied hosts along with number of hits while tabular report contains following information:
• Host: IP Address or host name of the host.• Hits: Number of hits per host.
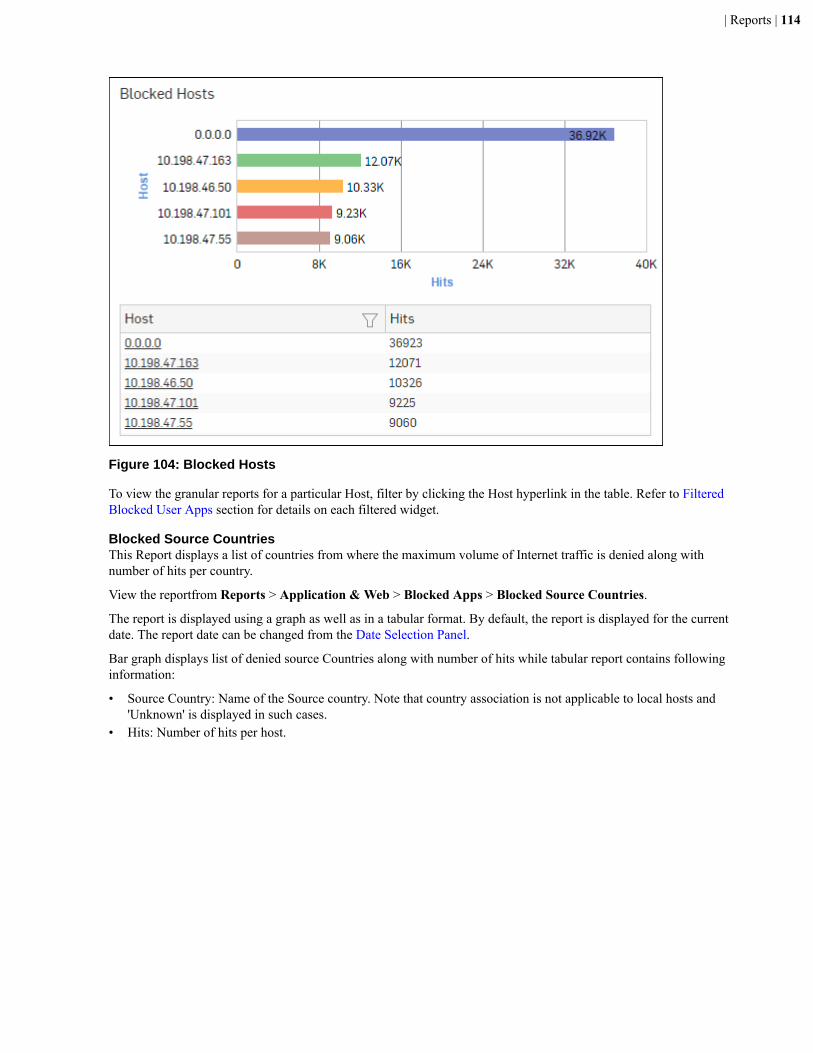
| Reports | 114
Figure 104: Blocked Hosts
To view the granular reports for a particular Host, filter by clicking the Host hyperlink in the table. Refer to FilteredBlocked User Apps section for details on each filtered widget.
Blocked Source CountriesThis Report displays a list of countries from where the maximum volume of Internet traffic is denied along withnumber of hits per country.
View the reportfrom Reports > Application & Web > Blocked Apps > Blocked Source Countries.
The report is displayed using a graph as well as in a tabular format. By default, the report is displayed for the currentdate. The report date can be changed from the Date Selection Panel.
Bar graph displays list of denied source Countries along with number of hits while tabular report contains followinginformation:
• Source Country: Name of the Source country. Note that country association is not applicable to local hosts and'Unknown' is displayed in such cases.
• Hits: Number of hits per host.

| Reports | 115
Figure 105: Blocked Source Countries
To view the granular reports for a particular Source Country, filter by clicking the Source Country hyperlink in thetable. Refer to Filtered Blocked User Apps section for details on each filtered widget.
Blocked Destination CountriesThis Report displays a list of countries to where the maximum volume of Internet traffic is denied along with numberof hits per country.
View the reportfrom Reports > Application & Web > Blocked Apps > Blocked Destination Countries.
The report is displayed using a graph as well as in a tabular format. By default, the report is displayed for the currentdate. The report date can be changed from the Date Selection Panel.
Bar graph displays list of denied destination Countries along with number of hits while tabular report containsfollowing information:
• Destination Country: Name of the Destination country. Note that country association is not applicable to localhosts and 'Unknown' is displayed in such cases.
• Hits: Number of hits per host.
Figure 106: Blocked Destinations Countries
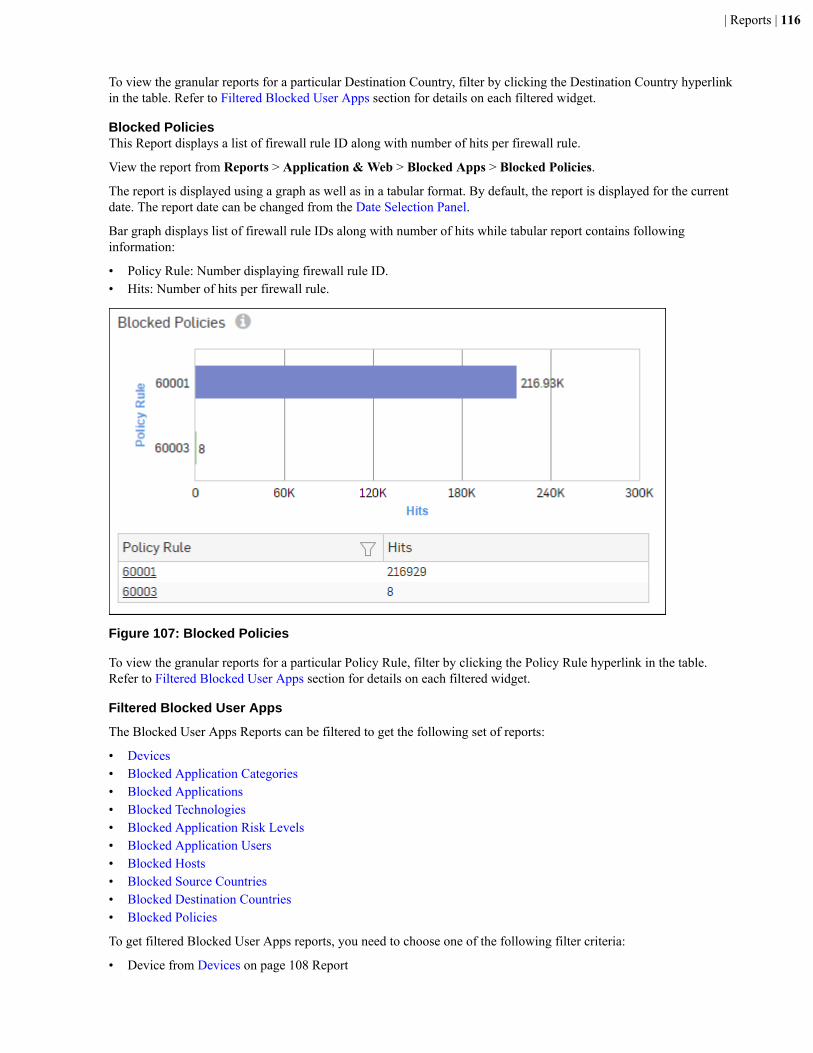
| Reports | 116
To view the granular reports for a particular Destination Country, filter by clicking the Destination Country hyperlinkin the table. Refer to Filtered Blocked User Apps section for details on each filtered widget.
Blocked PoliciesThis Report displays a list of firewall rule ID along with number of hits per firewall rule.
View the report from Reports > Application & Web > Blocked Apps > Blocked Policies.
The report is displayed using a graph as well as in a tabular format. By default, the report is displayed for the currentdate. The report date can be changed from the Date Selection Panel.
Bar graph displays list of firewall rule IDs along with number of hits while tabular report contains followinginformation:
• Policy Rule: Number displaying firewall rule ID.• Hits: Number of hits per firewall rule.
Figure 107: Blocked Policies
To view the granular reports for a particular Policy Rule, filter by clicking the Policy Rule hyperlink in the table.Refer to Filtered Blocked User Apps section for details on each filtered widget.
Filtered Blocked User Apps
The Blocked User Apps Reports can be filtered to get the following set of reports:
• Devices• Blocked Application Categories• Blocked Applications• Blocked Technologies• Blocked Application Risk Levels• Blocked Application Users• Blocked Hosts• Blocked Source Countries• Blocked Destination Countries• Blocked Policies
To get filtered Blocked User Apps reports, you need to choose one of the following filter criteria:
• Device from Devices on page 108 Report

| Reports | 117
• Category from Blocked Application Categories Report• Application from Blocked Applications Report• Technology from Blocked Technologies Report• Risk Level from Blocked Application Risk Levels Report• User from Blocked Application Users Report• Host from Blocked Hosts Report• Country from Blocked Source Countries Report• Country from Blocked Destination Countries Report• Rule ID from Blocked Policies Report
Filtered Reports consist of multiple report widgets except the filter criterion widget. Each widget displays the reportin a graph as well as in a tabular format which can again be filtered.
By default, the report is displayed for the current date. The report date can be changed from the top most row of thepage.
Devices widgetThis widget Report displays the Devices along with number of hits and amount of data transfer.
Note: This widget will not be displayed for filter criterion Device Name.
The report is displayed as a graph as well as in a tabular format.
By default, the report is displayed for the current date. The report date can be changed from the Date Selection Panel.
The bar graph displays amount of data transfer per device while the tabular report contains the following information:
• Device Name: Name of the device.• Device Type: Type of the device.• Hits: Number of hits from the device.
Blocked Application Categories widgetThis widget report displays a list of denied application categories along with number of hits per application category.
Note: This widget will not be displayed for filter criterion Category.
The Report is displayed in the form of a bar graph as well as in a tabular format.
Bar graph displays list of denied application categories along with number of hits while tabular report containsfollowing information:
• Category: Displays name of the application category as defined in the Device.• Hits: Number of hits per application category.
Blocked Applications widgetThis widget report displays a list of denied applications along with number of hits per application.
Note: This widget will not be displayed for filter criterion Application.
The Report is displayed in the form of a bar graph as well as in a tabular format.
Bar graph displays list of denied applications along with number of hits while tabular report contains followinginformation:
• Application/Proto: Port: Displays name of the application as defined in the Device. If application is not defined inthe Device, then this field will display application identifier as combination of protocol and port number.
• Risk: Displays risk level associated with the application. Higher number represents higher risk.• Category: Displays name of the application category as defined in the Device.• Hits: Number of hits per application category.
Blocked Technologies widgetThis widget report displays a list of denied technologies along with number of hits per technology.
| Reports | 118
Note: This widget will not be displayed for filter criterion Technology.
The Report is displayed in the form of a bar graph as well as in a tabular format.
Bar graph displays list of denied technologies along with number of hits while tabular report contains followinginformation:
• Technology: Displays name of the technology as defined in the Device.• Hits: Number of hits per technology.
Blocked App Risk Levels widgetThis widget report displays a list of denied risk levels along with number of hits per risk level.
Note: This widget will not be displayed for filter criterion Risk.
The Report is displayed in the form of a bar graph as well as in a tabular format.
Bar graph displays list of denied risks level along with number of hits while tabular report contains followinginformation:
• Risk: Displays risk level. Higher number displays higher risk.• Hits: Number of hits per technology.
Blocked Application Users widgetThis widget report displays a list of denied users along with number of hits per user.
Note: This widget will not be displayed for filter criterion User.
The Report is displayed in the form of a bar graph as well as in a tabular format.
Bar graph displays list of denied users along with number of hits while tabular report contains following information:
• User: Username of the user as defined in the Device. If the User is not defined, then it will display ‘Unidentified’which means the traffic is generated by an undefined user.
• Hits: Number of hits per user.
Blocked Hosts widgetThis widget report displays a list of denied hosts along with number of hits per host.
Note: This widget will not be displayed for filter criterion Host.
The Report is displayed in the form of a bar graph as well as in a tabular format.
Bar graph displays list of denied hosts along with number of hits while tabular report contains following information:
• Host: IP Address or host name of the host.• Hits: Number of hits per host.
Blocked Source Countries widgetThis widget displays a list of countries from where the maximum volume of Internet traffic is denied along withnumber of hits per country.
Note: This widget will not be displayed for filter criterion Source Country.
The Report is displayed in the form of a bar graph as well as in a tabular format.
Bar graph displays list of denied source Countries along with number of hits while tabular report contains followinginformation:
• Source Country: Name of the Source country. Note that country association is not applicable to local hosts and'Unknown' is displayed in such cases.
• Hits: Number of hits per country.
| Reports | 119
Blocked Destination Countries widgetThis widget displays a list of countries to where the maximum volume of Internet traffic is denied along with numberof hits per country.
Note: This widget will not be displayed for filter criterion Destination Country.
The Report is displayed in the form of a bar graph as well as in a tabular format.
Bar graph displays list of denied source Countries along with number of hits while tabular report contains followinginformation:
• Destination Country: Name of the Destination country. Note that country association is not applicable to localhosts and 'Unknown' is displayed in such cases.
• Hits: Number of hits per country.
Blocked Policies widgetThis widget report displays a list of firewall rule ID along with number of hits per firewall rule.
Note: This widget will not be displayed for filter criterion Policy Rule.
The Report is displayed in the form of a bar graph as well as in a tabular format.
Bar graph displays list of firewall rule IDs along with number of hits while tabular report contains followinginformation:
• Policy Rule: Number displaying firewall rule ID.• Hits: Number of hits per firewall rule.
Web Risks & UsageWeb Risks & Usage reports dashboard provides a snapshot of web usage through your network, in addition toassociated risks.
These reports help to identify highest traffic generators who are affecting the overall network traffic. It providesstatistics based on traffic generated by User Data Transfer.
The reports can help determine the Internet usage behavior and provide a basis for fine-tuning the configuration toefficiently control traffic flow.
View the reportdashboard from Reports > Application & Web > Web Risks & Usage.
Web Risks & Usage reports dashboard enables viewing of traffic generated by:
• Devices on page 120• Web Domains• Web Categories• Web Category Types• Web Users• Web User Groups• Web Activity• Web User Groups (Primary Group)• Objectionable Web Categories• Objectionable Web Domains• Objectionable Web Users• Web Content• Web Hosts• Warned Summary• Allowed Policies• File Uploaded via Web• Trend-Web Usage
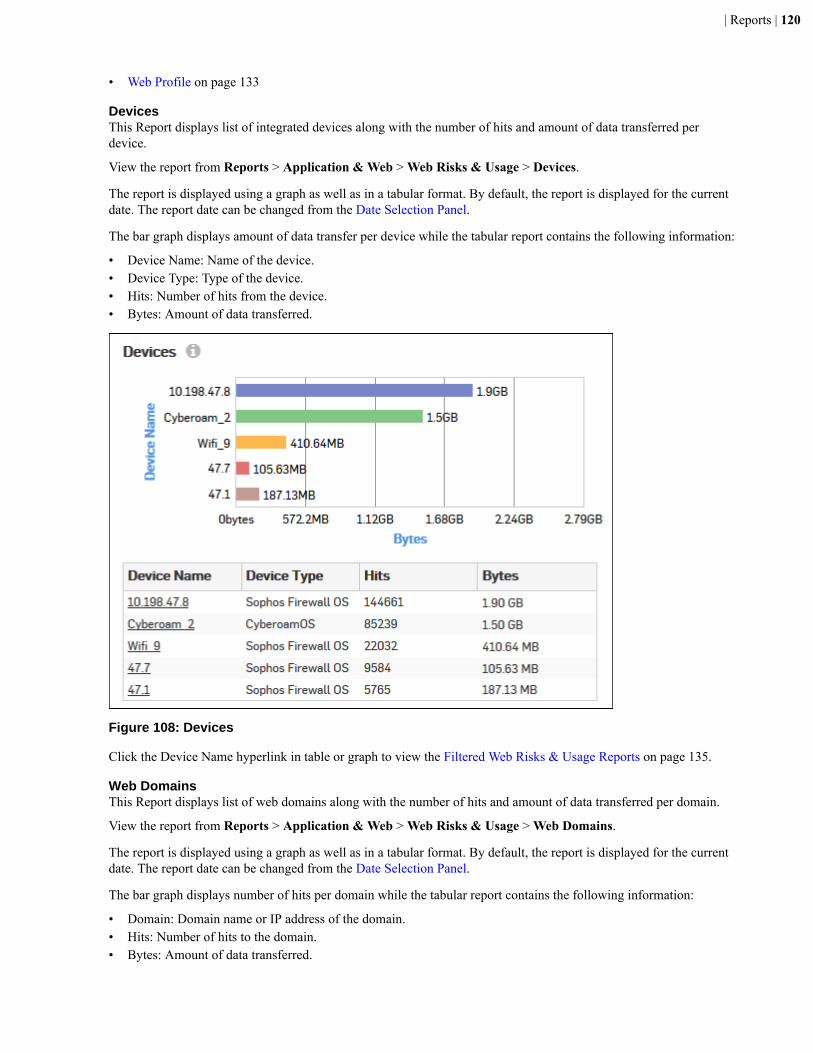
| Reports | 120
• Web Profile on page 133
DevicesThis Report displays list of integrated devices along with the number of hits and amount of data transferred perdevice.
View the report from Reports > Application & Web > Web Risks & Usage > Devices.
The report is displayed using a graph as well as in a tabular format. By default, the report is displayed for the currentdate. The report date can be changed from the Date Selection Panel.
The bar graph displays amount of data transfer per device while the tabular report contains the following information:
• Device Name: Name of the device.• Device Type: Type of the device.• Hits: Number of hits from the device.• Bytes: Amount of data transferred.
Figure 108: Devices
Click the Device Name hyperlink in table or graph to view the Filtered Web Risks & Usage Reports on page 135.
Web DomainsThis Report displays list of web domains along with the number of hits and amount of data transferred per domain.
View the report from Reports > Application & Web > Web Risks & Usage > Web Domains.
The report is displayed using a graph as well as in a tabular format. By default, the report is displayed for the currentdate. The report date can be changed from the Date Selection Panel.
The bar graph displays number of hits per domain while the tabular report contains the following information:
• Domain: Domain name or IP address of the domain.• Hits: Number of hits to the domain.• Bytes: Amount of data transferred.
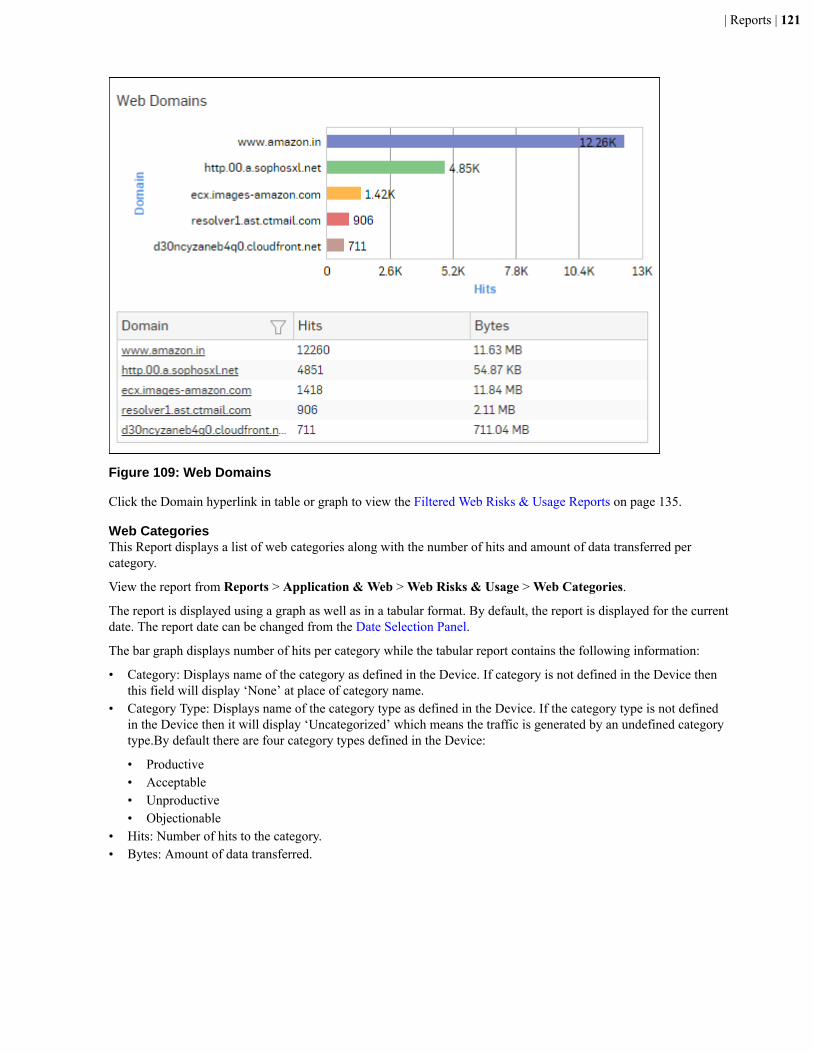
| Reports | 121
Figure 109: Web Domains
Click the Domain hyperlink in table or graph to view the Filtered Web Risks & Usage Reports on page 135.
Web CategoriesThis Report displays a list of web categories along with the number of hits and amount of data transferred percategory.
View the report from Reports > Application & Web > Web Risks & Usage > Web Categories.
The report is displayed using a graph as well as in a tabular format. By default, the report is displayed for the currentdate. The report date can be changed from the Date Selection Panel.
The bar graph displays number of hits per category while the tabular report contains the following information:
• Category: Displays name of the category as defined in the Device. If category is not defined in the Device thenthis field will display ‘None’ at place of category name.
• Category Type: Displays name of the category type as defined in the Device. If the category type is not definedin the Device then it will display ‘Uncategorized’ which means the traffic is generated by an undefined categorytype.By default there are four category types defined in the Device:
• Productive• Acceptable• Unproductive• Objectionable
• Hits: Number of hits to the category.• Bytes: Amount of data transferred.
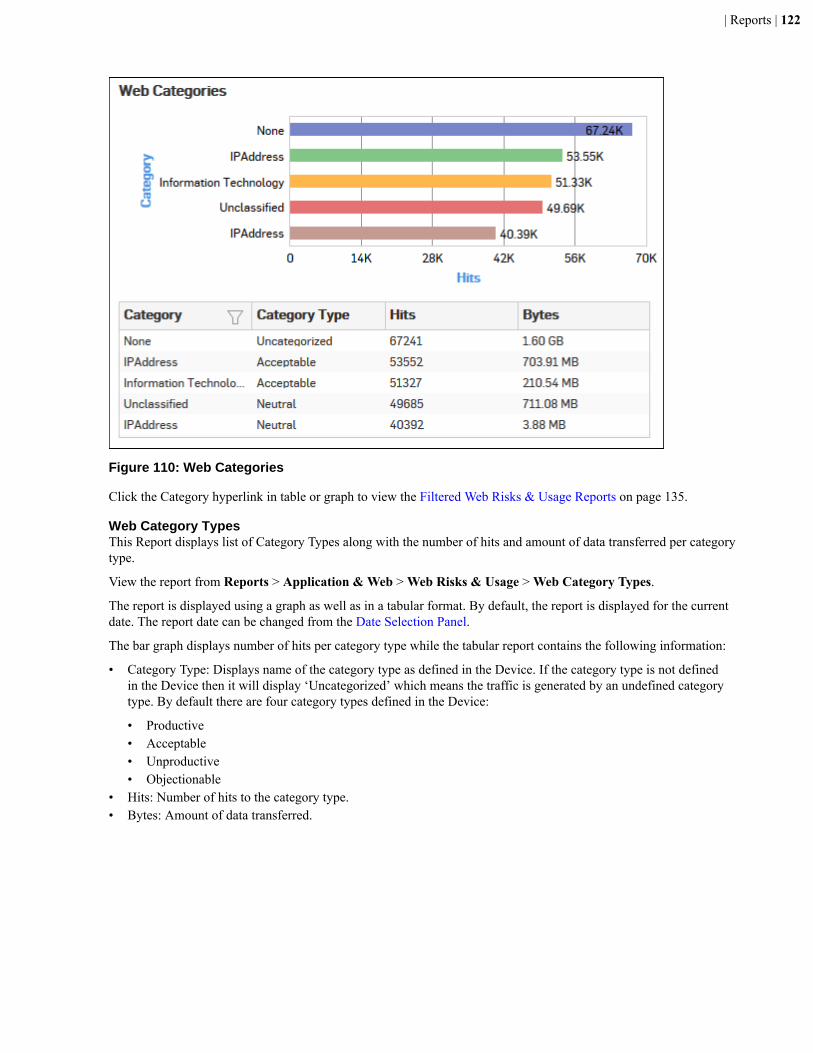
| Reports | 122
Figure 110: Web Categories
Click the Category hyperlink in table or graph to view the Filtered Web Risks & Usage Reports on page 135.
Web Category TypesThis Report displays list of Category Types along with the number of hits and amount of data transferred per categorytype.
View the report from Reports > Application & Web > Web Risks & Usage > Web Category Types.
The report is displayed using a graph as well as in a tabular format. By default, the report is displayed for the currentdate. The report date can be changed from the Date Selection Panel.
The bar graph displays number of hits per category type while the tabular report contains the following information:
• Category Type: Displays name of the category type as defined in the Device. If the category type is not definedin the Device then it will display ‘Uncategorized’ which means the traffic is generated by an undefined categorytype. By default there are four category types defined in the Device:
• Productive• Acceptable• Unproductive• Objectionable
• Hits: Number of hits to the category type.• Bytes: Amount of data transferred.

| Reports | 123
Figure 111: Web Category Types
Click the Category Type hyperlink in table or graph to view the Filtered Web Risks & Usage Reports on page 135.
Web UsersThis Report displays a list of Web Users, the group under which they are defined and number of hits & amount of datatransferred per user.
View the report from Reports > Application & Web > Web Risks & Usage > Web Users.
The report is displayed using a graph as well as in a tabular format. By default, the report is displayed for the currentdate. The report date can be changed from the Date Selection Panel.
The bar graph displays number of hits per user while the tabular report contains the following information:
• User: Username of the user as defined in the Device. If the User is not defined in the Device then it will display‘Unidentified’ which means the traffic is generated by an undefined user.
• Hits: Number of hits to the user.• Bytes: Amount of data transferred.
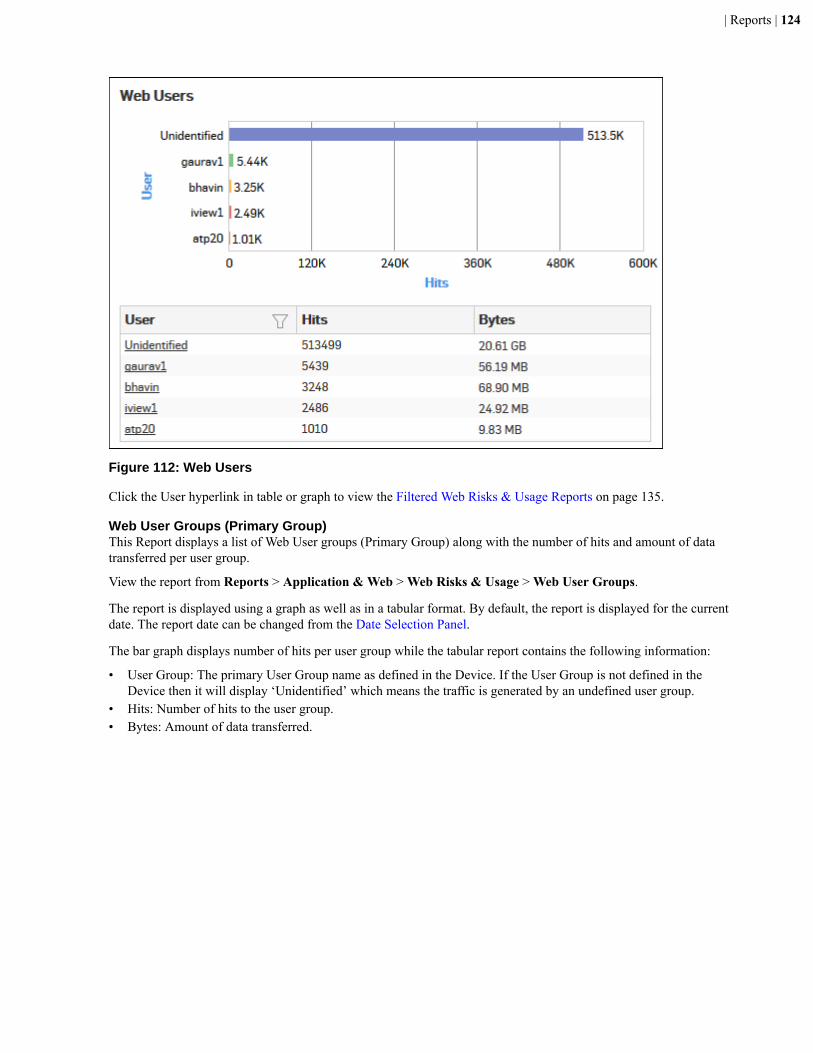
| Reports | 124
Figure 112: Web Users
Click the User hyperlink in table or graph to view the Filtered Web Risks & Usage Reports on page 135.
Web User Groups (Primary Group)This Report displays a list of Web User groups (Primary Group) along with the number of hits and amount of datatransferred per user group.
View the report from Reports > Application & Web > Web Risks & Usage > Web User Groups.
The report is displayed using a graph as well as in a tabular format. By default, the report is displayed for the currentdate. The report date can be changed from the Date Selection Panel.
The bar graph displays number of hits per user group while the tabular report contains the following information:
• User Group: The primary User Group name as defined in the Device. If the User Group is not defined in theDevice then it will display ‘Unidentified’ which means the traffic is generated by an undefined user group.
• Hits: Number of hits to the user group.• Bytes: Amount of data transferred.
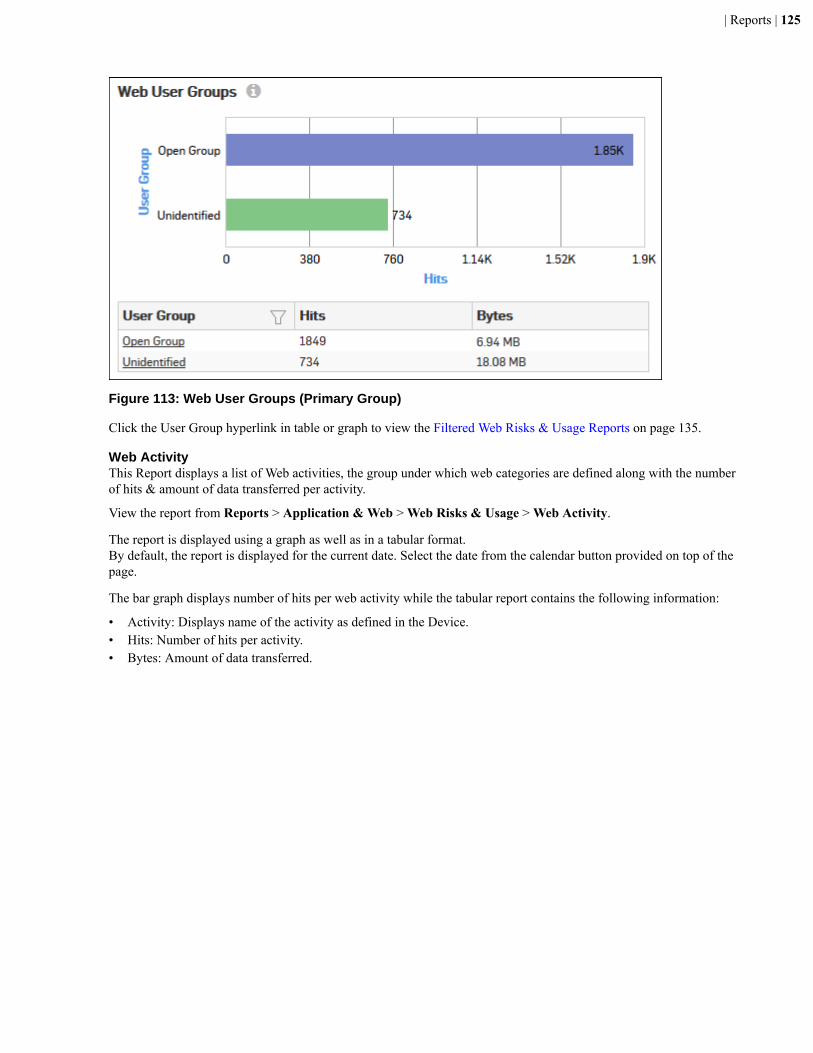
| Reports | 125
Figure 113: Web User Groups (Primary Group)
Click the User Group hyperlink in table or graph to view the Filtered Web Risks & Usage Reports on page 135.
Web ActivityThis Report displays a list of Web activities, the group under which web categories are defined along with the numberof hits & amount of data transferred per activity.
View the report from Reports > Application & Web > Web Risks & Usage > Web Activity.
The report is displayed using a graph as well as in a tabular format.By default, the report is displayed for the current date. Select the date from the calendar button provided on top of thepage.
The bar graph displays number of hits per web activity while the tabular report contains the following information:
• Activity: Displays name of the activity as defined in the Device.• Hits: Number of hits per activity.• Bytes: Amount of data transferred.
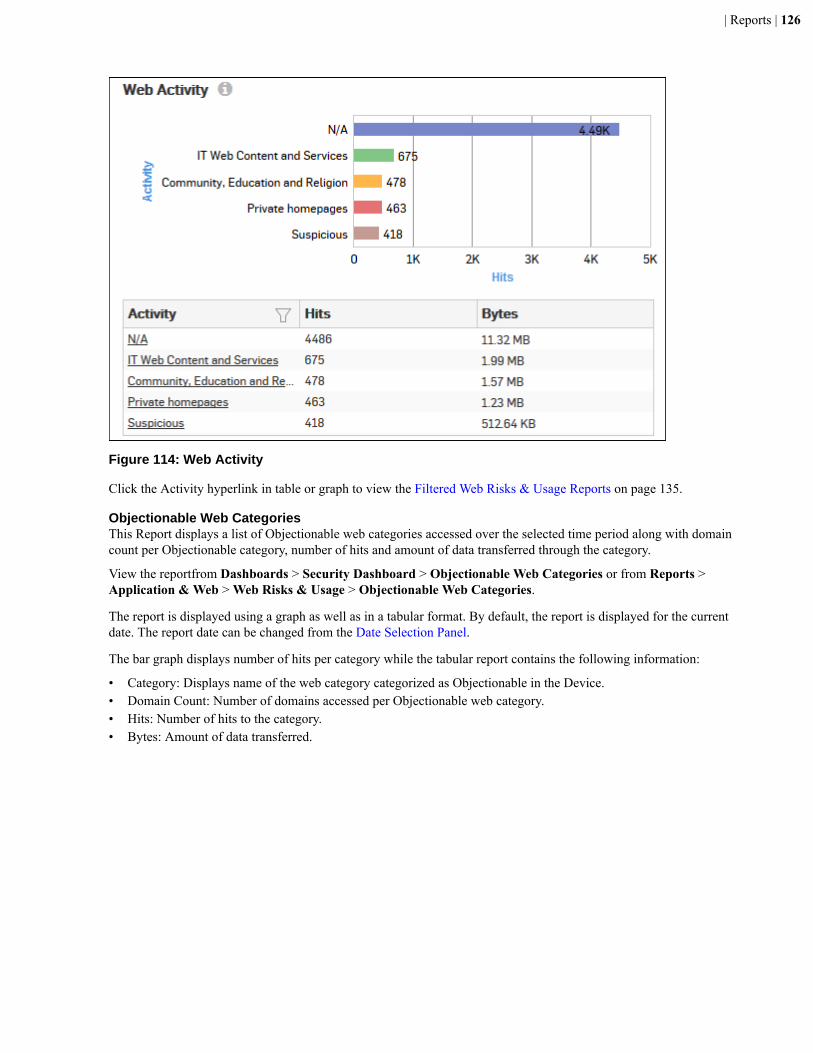
| Reports | 126
Figure 114: Web Activity
Click the Activity hyperlink in table or graph to view the Filtered Web Risks & Usage Reports on page 135.
Objectionable Web CategoriesThis Report displays a list of Objectionable web categories accessed over the selected time period along with domaincount per Objectionable category, number of hits and amount of data transferred through the category.
View the reportfrom Dashboards > Security Dashboard > Objectionable Web Categories or from Reports >Application & Web > Web Risks & Usage > Objectionable Web Categories.
The report is displayed using a graph as well as in a tabular format. By default, the report is displayed for the currentdate. The report date can be changed from the Date Selection Panel.
The bar graph displays number of hits per category while the tabular report contains the following information:
• Category: Displays name of the web category categorized as Objectionable in the Device.• Domain Count: Number of domains accessed per Objectionable web category.• Hits: Number of hits to the category.• Bytes: Amount of data transferred.
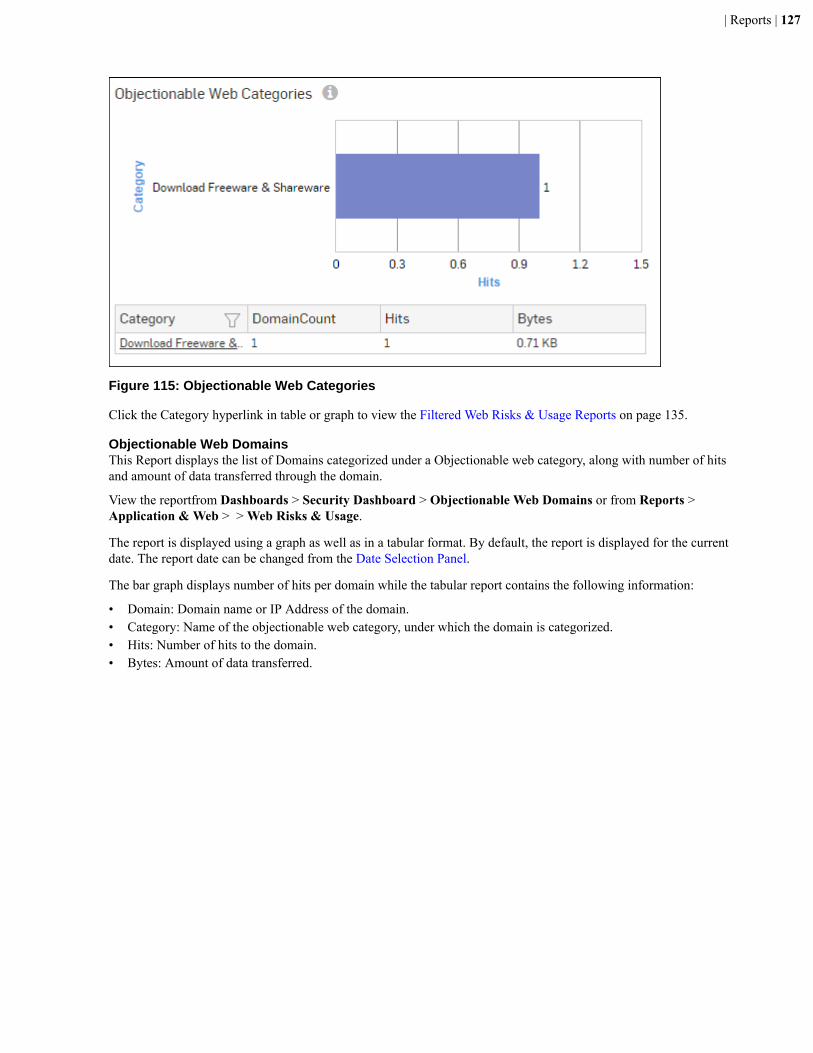
| Reports | 127
Figure 115: Objectionable Web Categories
Click the Category hyperlink in table or graph to view the Filtered Web Risks & Usage Reports on page 135.
Objectionable Web DomainsThis Report displays the list of Domains categorized under a Objectionable web category, along with number of hitsand amount of data transferred through the domain.
View the reportfrom Dashboards > Security Dashboard > Objectionable Web Domains or from Reports >Application & Web > > Web Risks & Usage.
The report is displayed using a graph as well as in a tabular format. By default, the report is displayed for the currentdate. The report date can be changed from the Date Selection Panel.
The bar graph displays number of hits per domain while the tabular report contains the following information:
• Domain: Domain name or IP Address of the domain.• Category: Name of the objectionable web category, under which the domain is categorized.• Hits: Number of hits to the domain.• Bytes: Amount of data transferred.
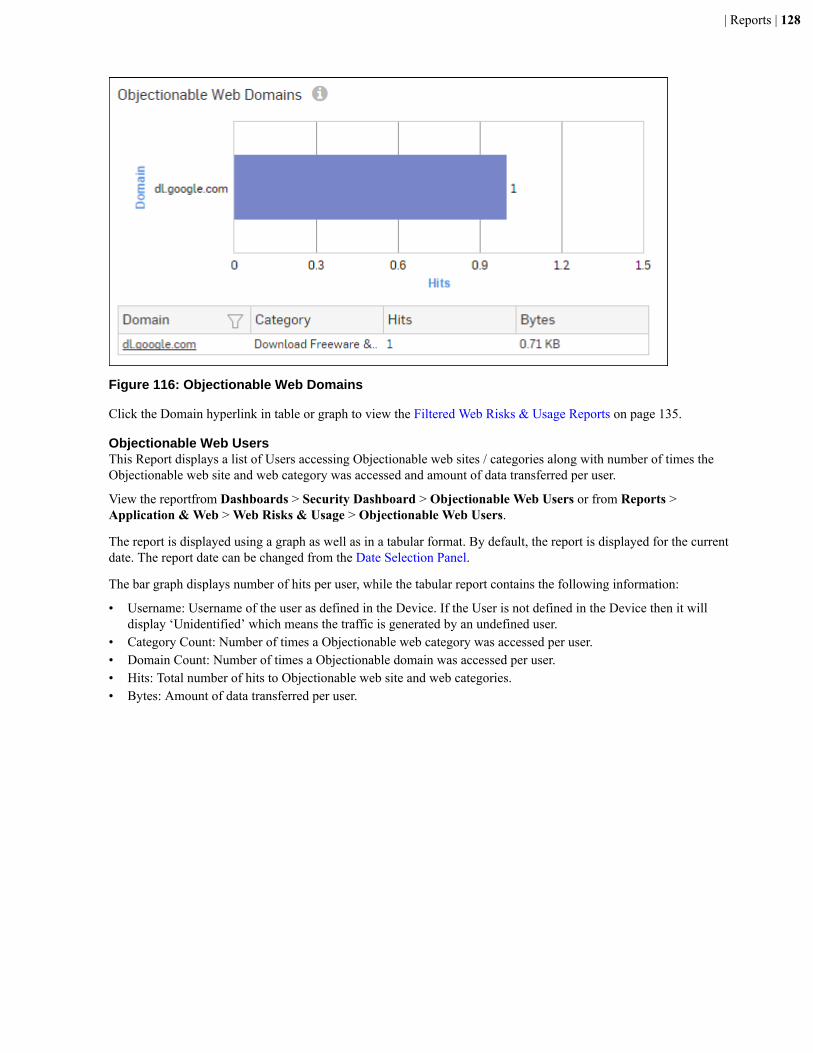
| Reports | 128
Figure 116: Objectionable Web Domains
Click the Domain hyperlink in table or graph to view the Filtered Web Risks & Usage Reports on page 135.
Objectionable Web UsersThis Report displays a list of Users accessing Objectionable web sites / categories along with number of times theObjectionable web site and web category was accessed and amount of data transferred per user.
View the reportfrom Dashboards > Security Dashboard > Objectionable Web Users or from Reports >Application & Web > Web Risks & Usage > Objectionable Web Users.
The report is displayed using a graph as well as in a tabular format. By default, the report is displayed for the currentdate. The report date can be changed from the Date Selection Panel.
The bar graph displays number of hits per user, while the tabular report contains the following information:
• Username: Username of the user as defined in the Device. If the User is not defined in the Device then it willdisplay ‘Unidentified’ which means the traffic is generated by an undefined user.
• Category Count: Number of times a Objectionable web category was accessed per user.• Domain Count: Number of times a Objectionable domain was accessed per user.• Hits: Total number of hits to Objectionable web site and web categories.• Bytes: Amount of data transferred per user.
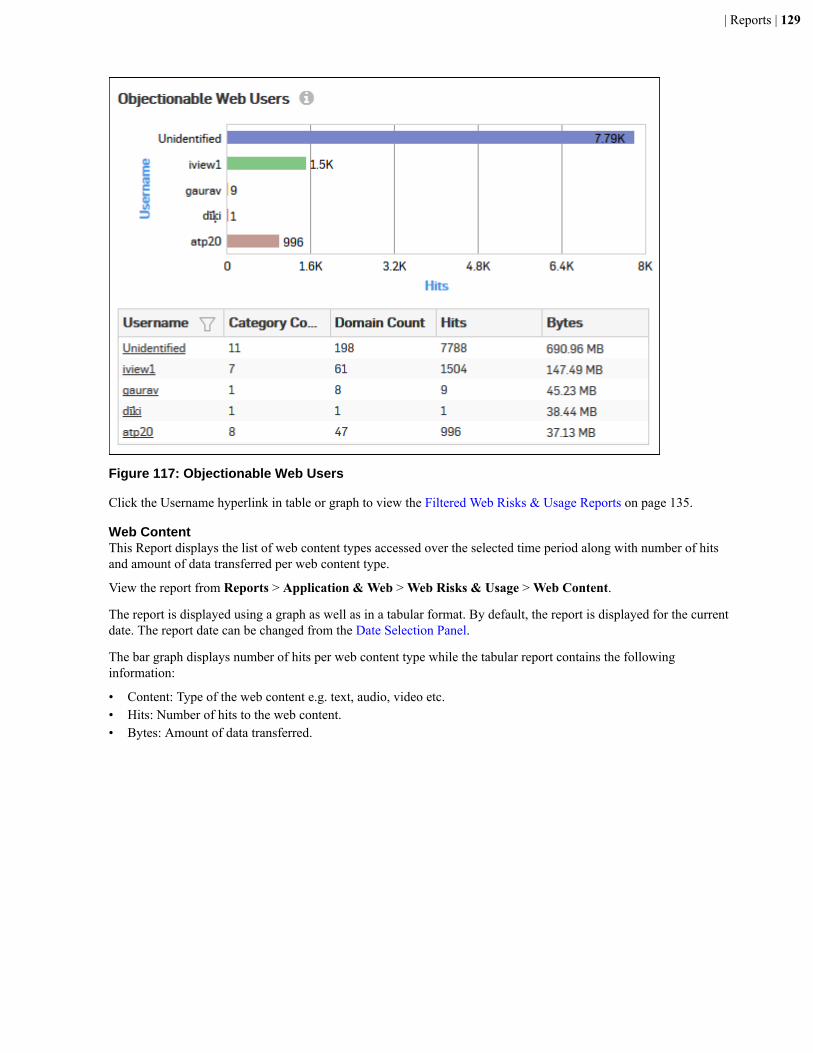
| Reports | 129
Figure 117: Objectionable Web Users
Click the Username hyperlink in table or graph to view the Filtered Web Risks & Usage Reports on page 135.
Web ContentThis Report displays the list of web content types accessed over the selected time period along with number of hitsand amount of data transferred per web content type.
View the report from Reports > Application & Web > Web Risks & Usage > Web Content.
The report is displayed using a graph as well as in a tabular format. By default, the report is displayed for the currentdate. The report date can be changed from the Date Selection Panel.
The bar graph displays number of hits per web content type while the tabular report contains the followinginformation:
• Content: Type of the web content e.g. text, audio, video etc.• Hits: Number of hits to the web content.• Bytes: Amount of data transferred.

| Reports | 130
Figure 118: Web Content
Click the Content hyperlink in table or graph to view the Filtered Web Risks & Usage Reports on page 135.
Web HostsThis Report displays the list of Web Hosts along with the number of hits and amount of data transferred per host.
View the report from Reports > Application & Web > Web Risks & Usage > Web Hosts.
The report is displayed using a graph as well as in a tabular format. By default, the report is displayed for the currentdate. The report date can be changed from the Date Selection Panel.
The bar graph displays number of hits per web host while the tabular report contains the following information:
• Host: IP Address of the web host.• Hits: Number of hits to the host.• Bytes: Amount of data transferred.
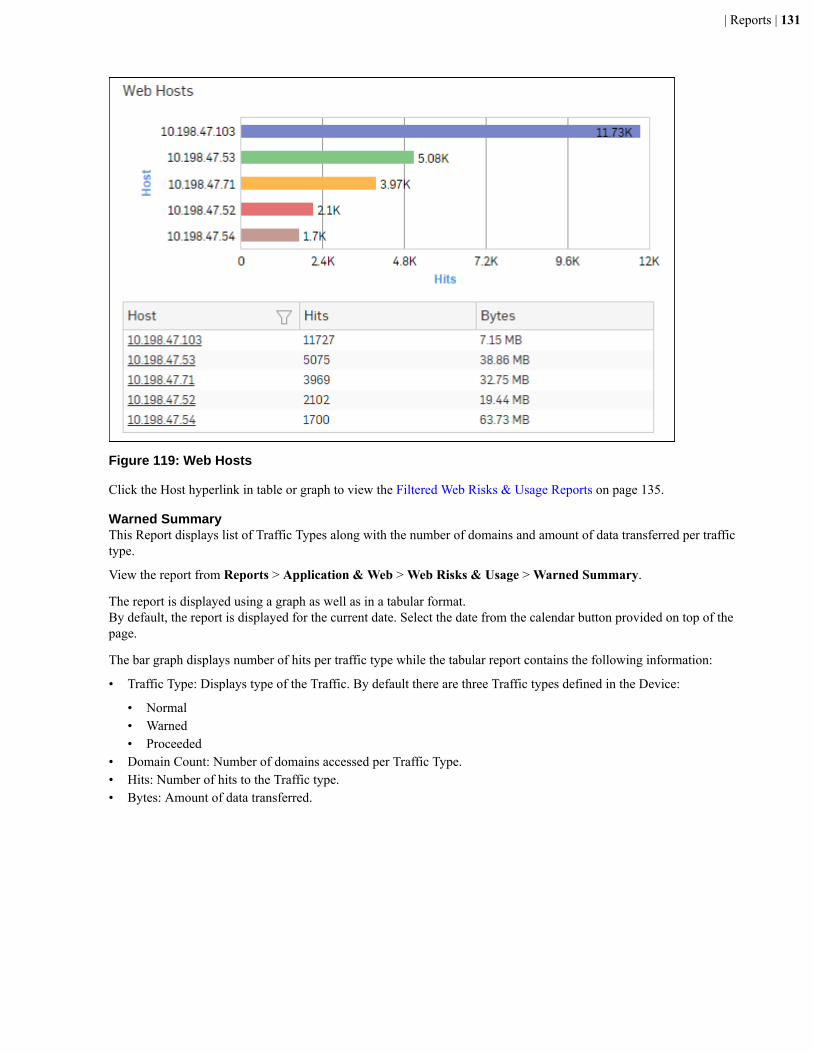
| Reports | 131
Figure 119: Web Hosts
Click the Host hyperlink in table or graph to view the Filtered Web Risks & Usage Reports on page 135.
Warned SummaryThis Report displays list of Traffic Types along with the number of domains and amount of data transferred per traffictype.
View the report from Reports > Application & Web > Web Risks & Usage > Warned Summary.
The report is displayed using a graph as well as in a tabular format.By default, the report is displayed for the current date. Select the date from the calendar button provided on top of thepage.
The bar graph displays number of hits per traffic type while the tabular report contains the following information:
• Traffic Type: Displays type of the Traffic. By default there are three Traffic types defined in the Device:
• Normal• Warned• Proceeded
• Domain Count: Number of domains accessed per Traffic Type.• Hits: Number of hits to the Traffic type.• Bytes: Amount of data transferred.
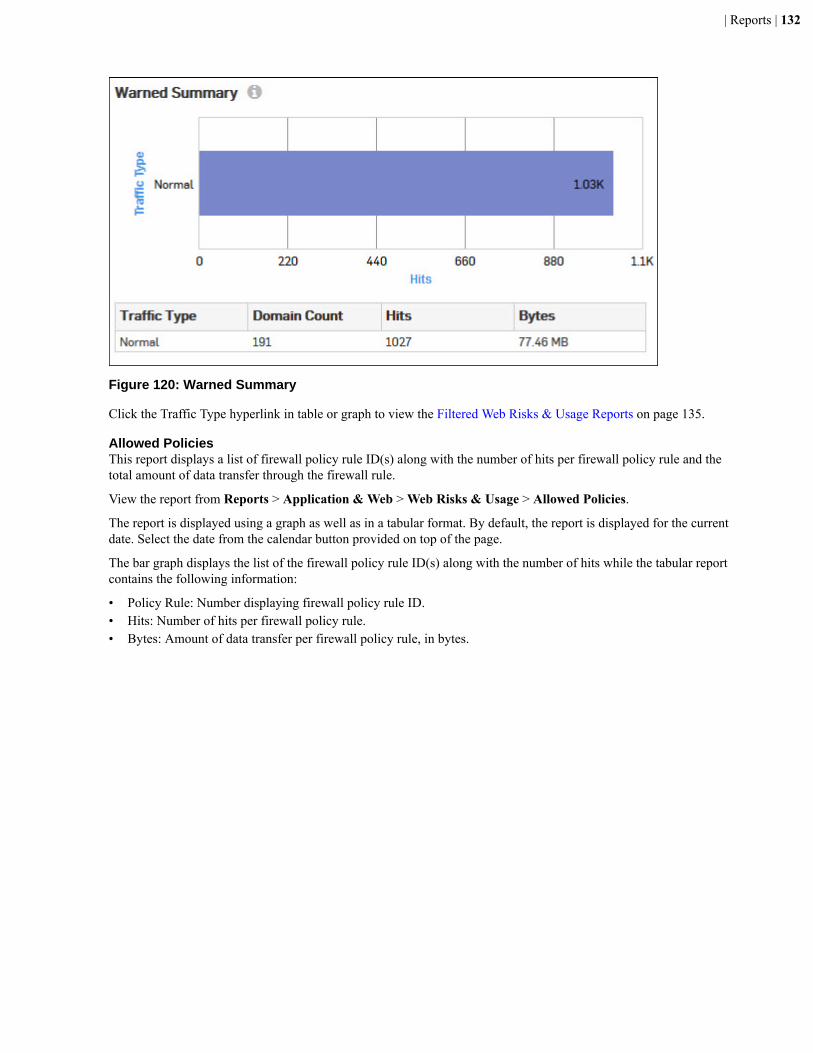
| Reports | 132
Figure 120: Warned Summary
Click the Traffic Type hyperlink in table or graph to view the Filtered Web Risks & Usage Reports on page 135.
Allowed PoliciesThis report displays a list of firewall policy rule ID(s) along with the number of hits per firewall policy rule and thetotal amount of data transfer through the firewall rule.
View the report from Reports > Application & Web > Web Risks & Usage > Allowed Policies.
The report is displayed using a graph as well as in a tabular format. By default, the report is displayed for the currentdate. Select the date from the calendar button provided on top of the page.
The bar graph displays the list of the firewall policy rule ID(s) along with the number of hits while the tabular reportcontains the following information:
• Policy Rule: Number displaying firewall policy rule ID.• Hits: Number of hits per firewall policy rule.• Bytes: Amount of data transfer per firewall policy rule, in bytes.
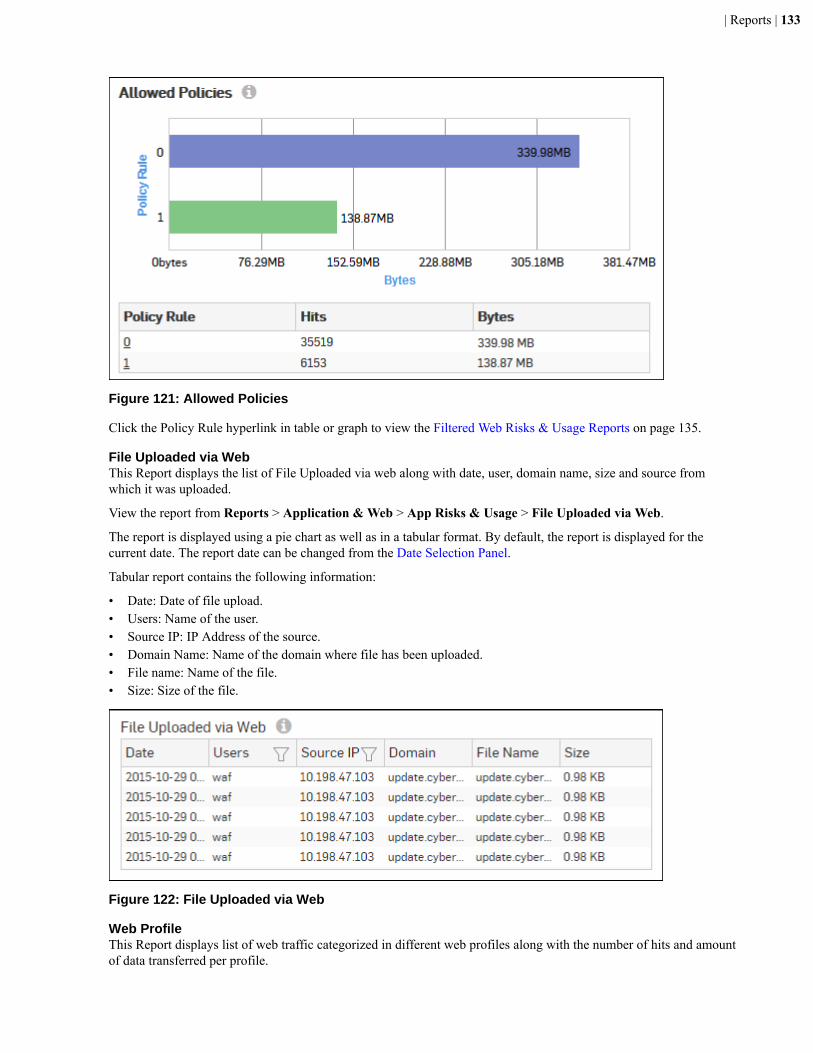
| Reports | 133
Figure 121: Allowed Policies
Click the Policy Rule hyperlink in table or graph to view the Filtered Web Risks & Usage Reports on page 135.
File Uploaded via WebThis Report displays the list of File Uploaded via web along with date, user, domain name, size and source fromwhich it was uploaded.
View the report from Reports > Application & Web > App Risks & Usage > File Uploaded via Web.
The report is displayed using a pie chart as well as in a tabular format. By default, the report is displayed for thecurrent date. The report date can be changed from the Date Selection Panel.
Tabular report contains the following information:
• Date: Date of file upload.• Users: Name of the user.• Source IP: IP Address of the source.• Domain Name: Name of the domain where file has been uploaded.• File name: Name of the file.• Size: Size of the file.
Figure 122: File Uploaded via Web
Web ProfileThis Report displays list of web traffic categorized in different web profiles along with the number of hits and amountof data transferred per profile.
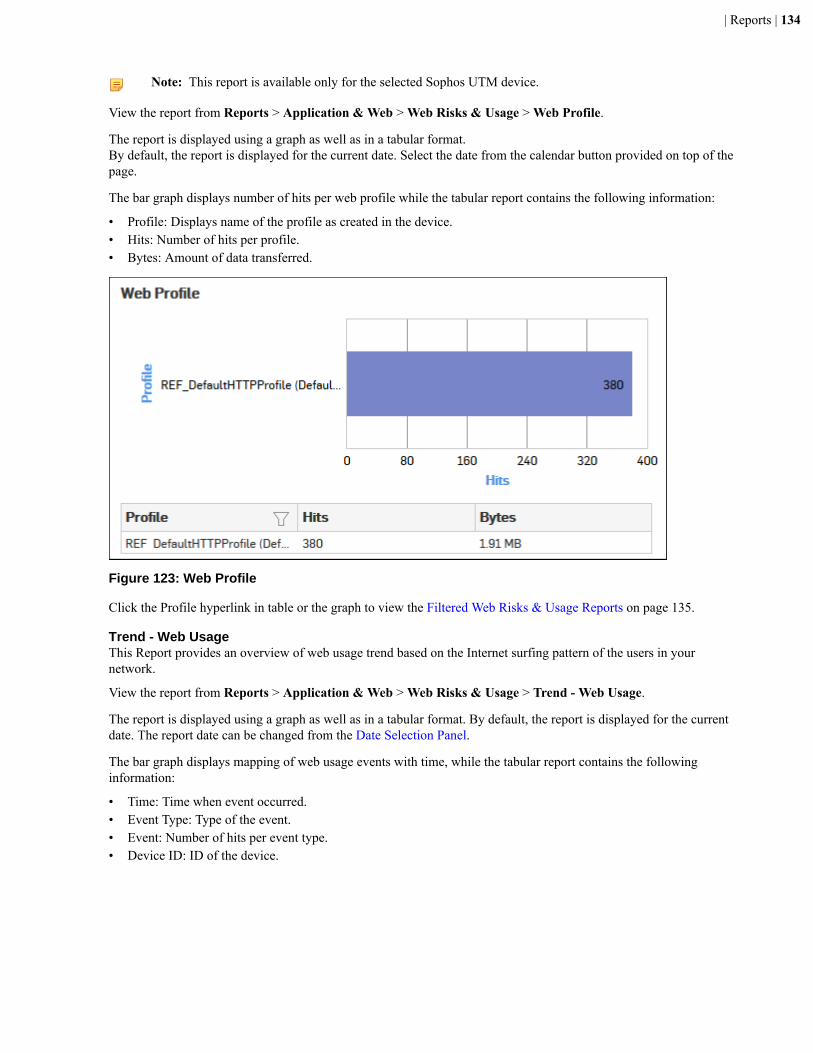
| Reports | 134
Note: This report is available only for the selected Sophos UTM device.
View the report from Reports > Application & Web > Web Risks & Usage > Web Profile.
The report is displayed using a graph as well as in a tabular format.By default, the report is displayed for the current date. Select the date from the calendar button provided on top of thepage.
The bar graph displays number of hits per web profile while the tabular report contains the following information:
• Profile: Displays name of the profile as created in the device.• Hits: Number of hits per profile.• Bytes: Amount of data transferred.
Figure 123: Web Profile
Click the Profile hyperlink in table or the graph to view the Filtered Web Risks & Usage Reports on page 135.
Trend - Web UsageThis Report provides an overview of web usage trend based on the Internet surfing pattern of the users in yournetwork.
View the report from Reports > Application & Web > Web Risks & Usage > Trend - Web Usage.
The report is displayed using a graph as well as in a tabular format. By default, the report is displayed for the currentdate. The report date can be changed from the Date Selection Panel.
The bar graph displays mapping of web usage events with time, while the tabular report contains the followinginformation:
• Time: Time when event occurred.• Event Type: Type of the event.• Event: Number of hits per event type.• Device ID: ID of the device.
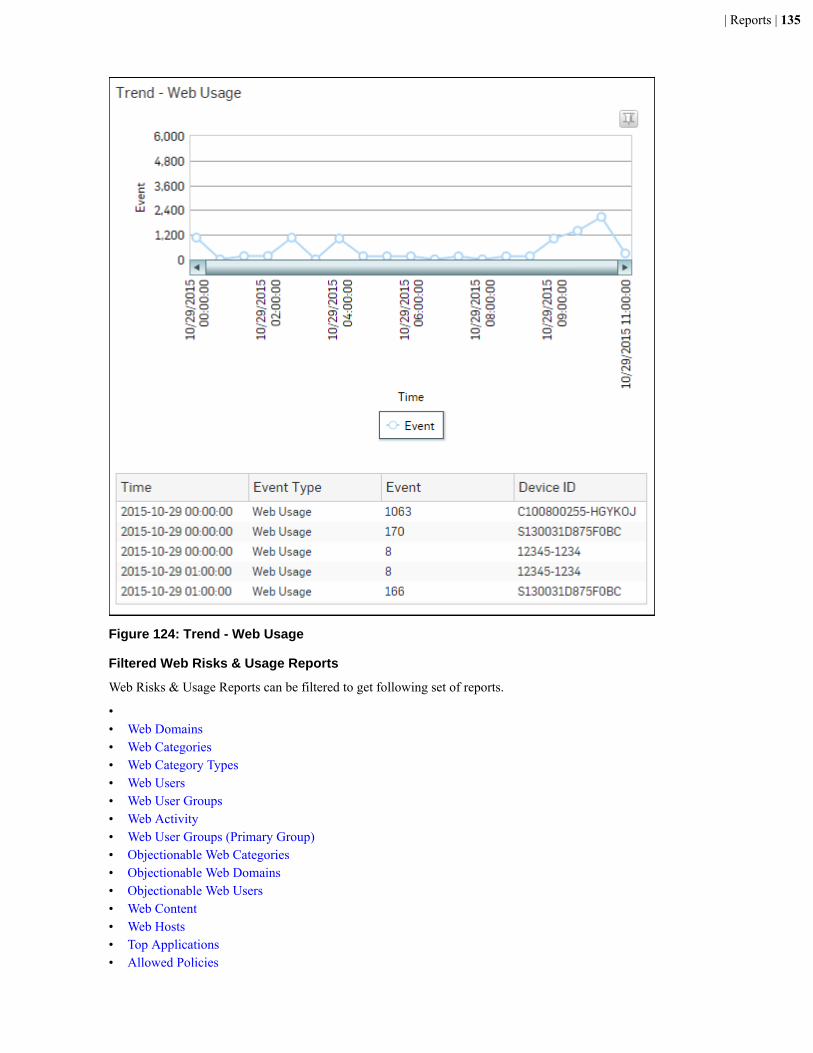
| Reports | 135
Figure 124: Trend - Web Usage
Filtered Web Risks & Usage Reports
Web Risks & Usage Reports can be filtered to get following set of reports.
•• Web Domains• Web Categories• Web Category Types• Web Users• Web User Groups• Web Activity• Web User Groups (Primary Group)• Objectionable Web Categories• Objectionable Web Domains• Objectionable Web Users• Web Content• Web Hosts• Top Applications• Allowed Policies

| Reports | 136
To get filtered Web Risks & Usage reports, you need to choose one of the following filter criteria:
• Device Name from Devices on page 120 Report• Domain from Web Domains Report• Category from Web Categories Report• Category Type from Web Category Types Report• User from Web Users Report• User Group from Web User Groups Report• Activity from Web Activity on page 125 Report• User Group from Web User Groups (Primary Group) Report• Category from Objectionable Web Categories Report• Domain from Objectionable Web Domains Report• Username from Objectionable Web Users Report• Content from Web Content Report• Host from Web Hosts Report• Policy Rule from Allowed Policies on page 132 Report
Based on the filter criterion, reports will be displayed in the following format:
• Summary - Reports in graphical format• Details - Reports in tabular format
Filtered Summary Reports consist of multiple report widgets except the filter criterion widget. Each widget displaysreport in a graph as well as in a tabular format which can again be filtered. Detailed Reports are displayed in a tabularformat which can be filtered by clicking hyperlinks in the table.
By default, the report is displayed for the current date. The report date can be changed from the top most row of thepage.
Devices widgetThis widget Report displays the Devices along with number of hits and amount of data transfer.
Note: This widget will not be displayed for filter criterion Device Name.
The report is displayed as a graph as well as in a tabular format.
By default, the report is displayed for the current date. The report date can be changed from the Date Selection Panel.
The bar graph displays amount of data transfer per device while the tabular report contains the following information:
• Device Name: Name of the device.• Device Type: Type of the device.• Hits: Number of hits from the device.• Bytes: Amount of data transferred.
Web Domains widgetThis widget Report displays the number of hits and the amount of data transferred per domain.
Note: This widget will not be displayed for filter criterion Domain.
The report is displayed as a graph as well as in a tabular format.
By default, the report is displayed for the current date. The report date can be changed from the Date Selection Panel.
The bar graph displays number of hits per domain while the tabular report contains the following information:
• Domain: Domain name or IP Address of the domain.• Hits: Number of hits to the domain.• Bytes: Amount of data transferred.
Web Categories widgetThis widget report displays the number of hits and the amount of data transferred per category.
| Reports | 137
Note: This widget will not be displayed for filter criterion Category.
The report is displayed as a graph as well as in a tabular format.
By default, the report is displayed for the current date. The report date can be changed from the Date Selection Panel.
The bar graph displays number of hits per category while the tabular report contains the following information:
• Category: Displays name of the category as defined in the Device. If category is not defined in the Device thenthis field will display ‘Uncategorizeds’ at place of category name.
• Category Type: Displays name of the category type as defined in the Device. If the category type is not definedin the Device then it will display ‘Uncategorized’ which means the traffic is generated by an undefined categorytype.By default there are four category types defined in the Device:
• Productive• Acceptable• Unproductive• Objectionable
• Hits: Number of hits to the category.• Bytes: Amount of data transferred.
Web Category Types widgetThis widget Report displays the list of Web Category Types along with the number of hits that generate the mosttraffic.
Note: This widget will not be displayed for the filter criterion Category Type.
The report is displayed as a graph as well as in a tabular format.
By default, the report is displayed for the current date. The report date can be changed from the Date Selection Panel.
The bar graph displays number of hits per web category type while the tabular report contains the followinginformation:
• Category Type: Displays name of the category type as defined in the Device. If the category type is not definedin the Device then it will display ‘Uncategorized’ which means the traffic is generated by an undefined categorytype. By default there are five category types defined in the Device.
• Productive• Acceptable• Neutral• Unproductive• Objectionable
• Hits: Number of hits to the Web category.• Bytes: Amount of data transfer in bytes.
Web Users widgetThis widget report displays the number of hits and amount of data transferred per Web user for the selected filtercriterion.
Note: This widget will not be displayed for filter criterion User.
The bar graph displays number of hits per Web user group while the tabular report contains the following information:
• User: Username of the user as defined in the Device. If the User is not defined in the Device then it will display‘Unidentified’ which means the traffic is generated by an undefined user.
• Hits: Number of hits to the user.• Bytes: Amount of data transferred.
Web User Groups (Primary Group) widgetThis widget report displays the number of hits and the amount of data transferred per Web User Group.
| Reports | 138
Note: This widget will not be displayed for filter criterion User Group.
The report is displayed as a graph as well as in a tabular format.
By default, the report is displayed for the current date. The report date can be changed from the Date Selection Panel.
The bar graph displays number of hits per Web user group while the tabular report contains the following information:
• User Group: User group name as defined in the Device.• Hits: Number of hits to the category.• Bytes: Amount of data transferred.
Web Activity widgetThis widget report displays the number of hits and the amount of data transferred per activity.
Note: This widget will not be displayed for filter criterion Web Activity.
The report is displayed as a graph as well as in a tabular format.
By default, the report is displayed for the current date. Select the date from the calendar button provided on top of thepage.
The bar graph displays number of hits per web activity while the tabular report contains the following information:
• Activity: Displays name of the activity as defined in the Device.If activity is not defined in the Device then thisfield will display ‘Not Available’ at place of activity name.
• Hits: Number of hits per activity.• Bytes: Amount of data transferred.
Objectionable Web Categories widgetThis widget displays a list of Objectionable web categories accessed over the selected time period along with domaincount per Objectionable category, number of hits and amount of data transferred through the category.
Note: This widget will not be displayed for filter criterion Category.
The report is displayed as a graph as well as in a tabular format.
By default, the report is displayed for the current date. The report date can be changed from the top most row of thepage.
The bar graph displays number of hits per category while the tabular report contains the following information:
• Category: Displays name of the web category categorized as Objectionable in the Device.• Domain Count: Number of domains accessed per objectionable web category.• Hits: Number of hits to the category.• Bytes: Amount of data transferred.
Objectionable Web Domains widgetThis widget displays the list of Domains categorized under a Objectionable web category, along with number of hitsand amount of data transferred through the domain.
Note: This widget will not be displayed for filter criterion Domain.
The report is displayed as a graph as well as in a tabular format.
By default, the report is displayed for the current date. The report date can be changed from the top most row of thepage.
The bar graph displays number of hits per domain, while the tabular report contains the following information:
• Domain: Name of the domain falling under objectionable web category.• Category: Name of the Objectionable web category.• Hits: User-wise number of hits to the domains falling under Objectionable web category.• Bytes: Amount of data transferred.
| Reports | 139
Objectionable Web Users widgetThis widget displays a list of Users accessing Objectionable web sites / categories along with number of times theObjectionable web site and web category was accessed and amount of data transferred per user.
Note: This widget will not be displayed for filter criterion Category.
The report is displayed as a graph as well as in a tabular format.
By default, the report is displayed for the current date. The report date can be changed from the top most row of thepage.
The bar graph displays number of hits per user, while the tabular report contains the following information:
• Username: Username of the user as defined in the Device. If the User is not defined in the Device then it willdisplay ‘Unidentified’ which means the traffic is generated by an unauthenticated user.
• Category Count: Number of times a Objectionable web category was accessed per user.• Domain Count: User-wise number of domains accessed per objectionable web category.• Hits: User-wise number of hits to the objectionable web category.• Bytes: Amount of data transferred.
Web Content widgetThis widget Report displays the Content Types along with number of hits and amount of data transfer.
Note: This widget will not be displayed for filter criterion Content.
The report is displayed as a graph as well as in a tabular format.
By default, the report is displayed for the current date. The report date can be changed from the Date Selection Panel.
The bar graph displays number of hits per web content while the tabular report contains the following information:
• Content: Type of web content. Examples of possible content types are text, image, application etc.• Hits: Number of hits to the web content.• Bytes: Amount of data transferred.
Web Hosts widgetThis widget displays the list of Web Hosts along with the number of hits and amount of data transferred per host.
Note: This widget will not be displayed for filter criterion Host.
The report is displayed as a graph as well as in a tabular format.
By default, the report is displayed for the current date. The report date can be changed from the Date Selection Panel.
The bar graph displays number of hits per web host, while the tabular report contains the following information:
• Host: IP Address of the host.• Hits: Number of hits to the host.• Bytes: Amount of data transferred.
Web Applications widgetThis widget displays the list of web applications along with number of hits and amount of data transferred perapplication.
The bar graph displays web applications along with number of hits and amount of data transferred per applicationwhile the tabular report contains the following information:
• Application: Name of the web application.• Hits: Number of hits per web application.• Bytes: Amount of data transferred per application.
Allowed Policies widgetThis widget report displays a list of allowed firewall policy rule ID(s) along with the rule-wise distribution of the totaldata transfer and the number of hits to those rules.
| Reports | 140
Note: This widget will not be displayed for filter criterion Policy Rule.
The report is displayed as a bar graph as well as in a tabular format.
By default, the report is displayed for the current date. Select the date from the calendar button provided on top of thepage.
The bar graph displays various firewall policy Rule ID(s) and the amount of data transfer using that firewall rulewhile the tabular report contains the following information:
• Policy Rule: Displays firewall policy rule ID.• Hits: Number of hits per firewall policy rule.• Bytes: Amount of data transferred per firewall policy rule.
Blocked Web AttemptsBlocked Web Attempts reports dashboard provides an insight about the unsuccessful attempts made by users to accessblocked sites.
View Blocked Web Attempts reports dashboard from Reports > Application & Web > Blocked Web Attempts.
The Reports are displayed as a graph as well as in a tabular format.
By default, the reports are displayed for the current date. The report date can be changed from the Date SelectionPanel.
Blocked Web Attempts reports dashboard enable to view traffic generated by:
• Blocked Web Users• Blocked Web Categories• Blocked Web Domains• Blocked Web Hosts• Blocked Web User Groups (Primary Group) on page 144• Blocked Allowable Categories• Blocked Allowable Domains• Blocked Policies on page 147• Trend - Blocked Web Attempts• Blocked Web Activity• Web Virus• Domains - Web Virus• Users - Web Virus• Hosts - Web Virus• Blocked Web Profile on page 154• Trend - Web Virus
Blocked Web UsersThis Report displays a list of Users who made the most attempts to access blocked sites.
View the report from Reports > Application & Web > Blocked Web Attempts > Blocked Web Users.
Note: You can view this report from Security Dashboard as well.
The report is displayed using a graph as well as in a tabular format. By default, the report is displayed for the currentdate. The report date can be changed from the Date Selection Panel.
The bar graph displays list of blocked users along with number of hits per user while the tabular report contains thefollowing information:
• User: Name of the User as defined in the Device.• Hits: Number of Hits.
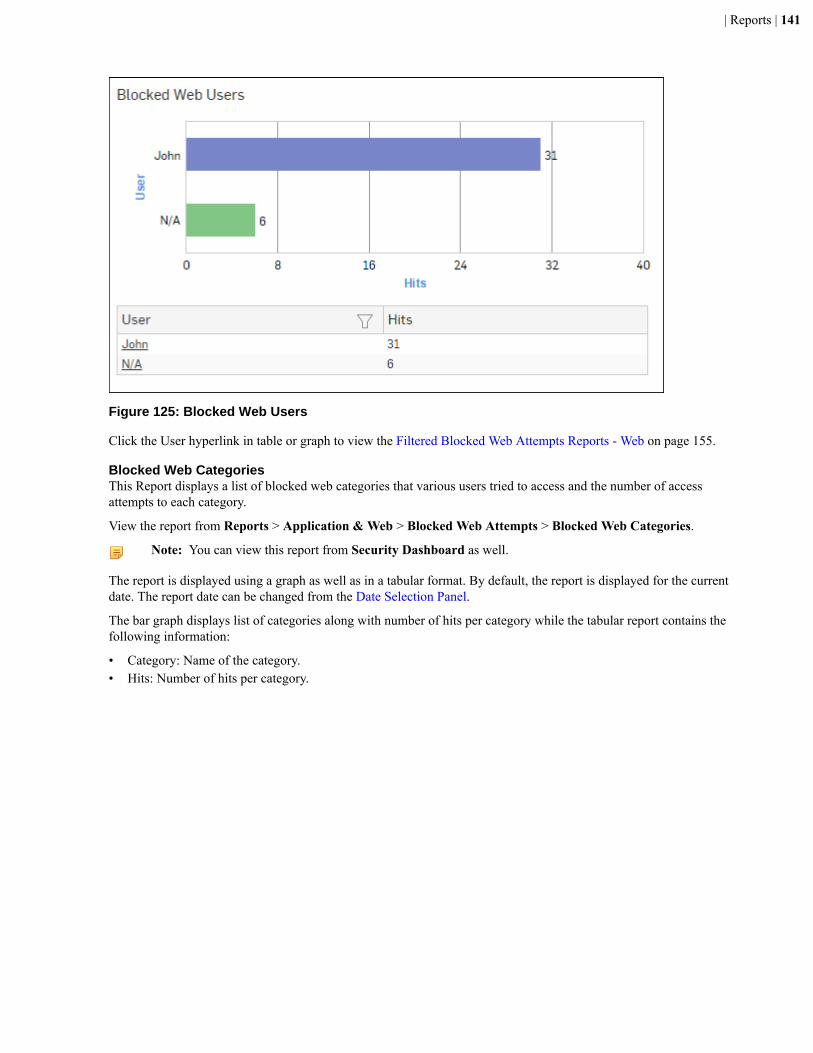
| Reports | 141
Figure 125: Blocked Web Users
Click the User hyperlink in table or graph to view the Filtered Blocked Web Attempts Reports - Web on page 155.
Blocked Web CategoriesThis Report displays a list of blocked web categories that various users tried to access and the number of accessattempts to each category.
View the report from Reports > Application & Web > Blocked Web Attempts > Blocked Web Categories.
Note: You can view this report from Security Dashboard as well.
The report is displayed using a graph as well as in a tabular format. By default, the report is displayed for the currentdate. The report date can be changed from the Date Selection Panel.
The bar graph displays list of categories along with number of hits per category while the tabular report contains thefollowing information:
• Category: Name of the category.• Hits: Number of hits per category.
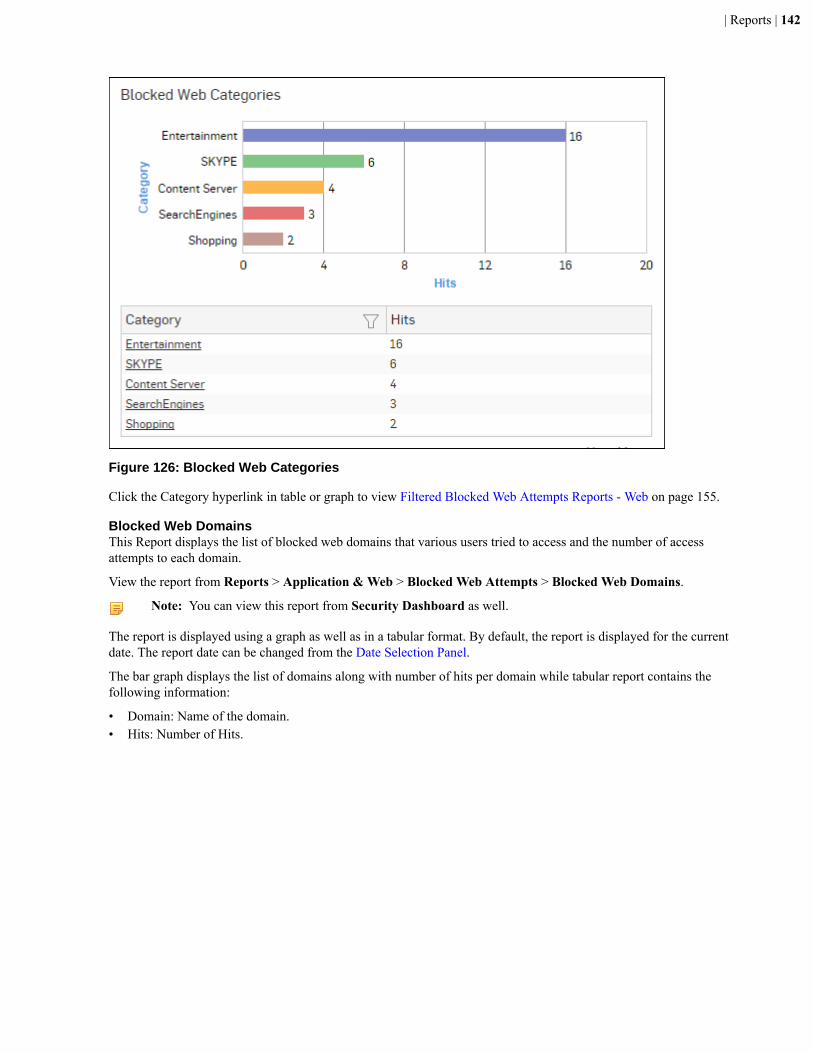
| Reports | 142
Figure 126: Blocked Web Categories
Click the Category hyperlink in table or graph to view Filtered Blocked Web Attempts Reports - Web on page 155.
Blocked Web DomainsThis Report displays the list of blocked web domains that various users tried to access and the number of accessattempts to each domain.
View the report from Reports > Application & Web > Blocked Web Attempts > Blocked Web Domains.
Note: You can view this report from Security Dashboard as well.
The report is displayed using a graph as well as in a tabular format. By default, the report is displayed for the currentdate. The report date can be changed from the Date Selection Panel.
The bar graph displays the list of domains along with number of hits per domain while tabular report contains thefollowing information:
• Domain: Name of the domain.• Hits: Number of Hits.

| Reports | 143
Figure 127: Blocked Web Domains
Click the Domain hyperlink in table or graph to view Filtered Blocked Web Attempts Reports - Web on page 155.
Blocked Web HostsThis Report displays the list of blocked web hosts and the number of blocked sites users tried to access through thathosts.
View the report from Reports > Application & Web > Blocked Web Attempts > Blocked Web Hosts.
Note: You can view this report from Security Dashboard as well.
The report is displayed using a graph as well as in a tabular format. By default, the report is displayed for the currentdate. The report date can be changed from the Date Selection Panel.
The bar graph displays a list of hosts along with number of hits per host while the tabular report contains thefollowing information:
• Host: Name of the Host.• Hits: Number of Hits.

| Reports | 144
Figure 128: Blocked Web Hosts
Click the Host hyperlink in table or graph to view Filtered Blocked Web Attempts Reports - Web on page 155.
Blocked Web User Groups (Primary Group)This Report displays a list of blocked web user groups along with the number of hits per user group.
View the report from Reports > Application & Web > Blocked Web Attempts > Blocked Web User Groups(Primary Group).
The report is displayed using a graph as well as in a tabular format. By default, the report is displayed for the currentdate. Select the date from the calendar button provided on top of the page.
The bar graph displays number of hits per user group while the tabular report contains the following information:
• User Group: User Group name as defined in the Device. If the User Group is not defined in the Device then it willdisplay ‘Unidentified’which means the traffic is generated by an unauthenticated user group.
Note: For users who are part of multiple user groups, the group shown here is the one that is at top ofObjects > Identity > Groups page.
• Hits: Number of hits to the user group.
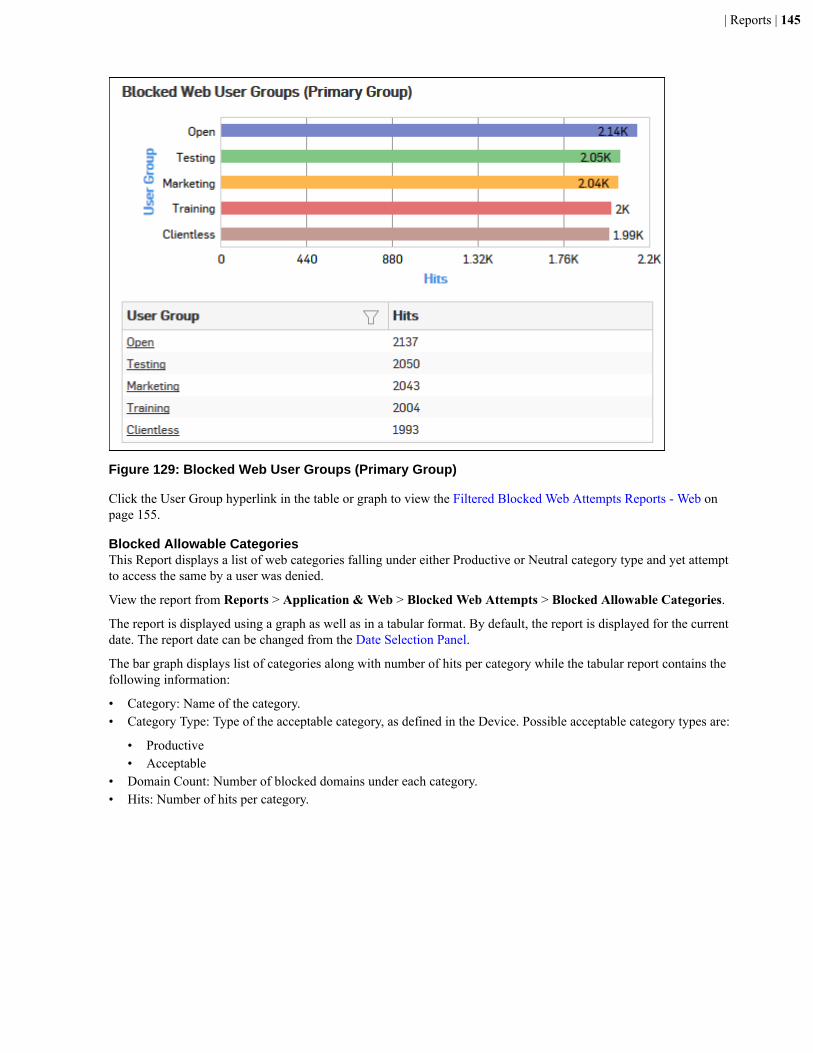
| Reports | 145
Figure 129: Blocked Web User Groups (Primary Group)
Click the User Group hyperlink in the table or graph to view the Filtered Blocked Web Attempts Reports - Web onpage 155.
Blocked Allowable CategoriesThis Report displays a list of web categories falling under either Productive or Neutral category type and yet attemptto access the same by a user was denied.
View the report from Reports > Application & Web > Blocked Web Attempts > Blocked Allowable Categories.
The report is displayed using a graph as well as in a tabular format. By default, the report is displayed for the currentdate. The report date can be changed from the Date Selection Panel.
The bar graph displays list of categories along with number of hits per category while the tabular report contains thefollowing information:
• Category: Name of the category.• Category Type: Type of the acceptable category, as defined in the Device. Possible acceptable category types are:
• Productive• Acceptable
• Domain Count: Number of blocked domains under each category.• Hits: Number of hits per category.
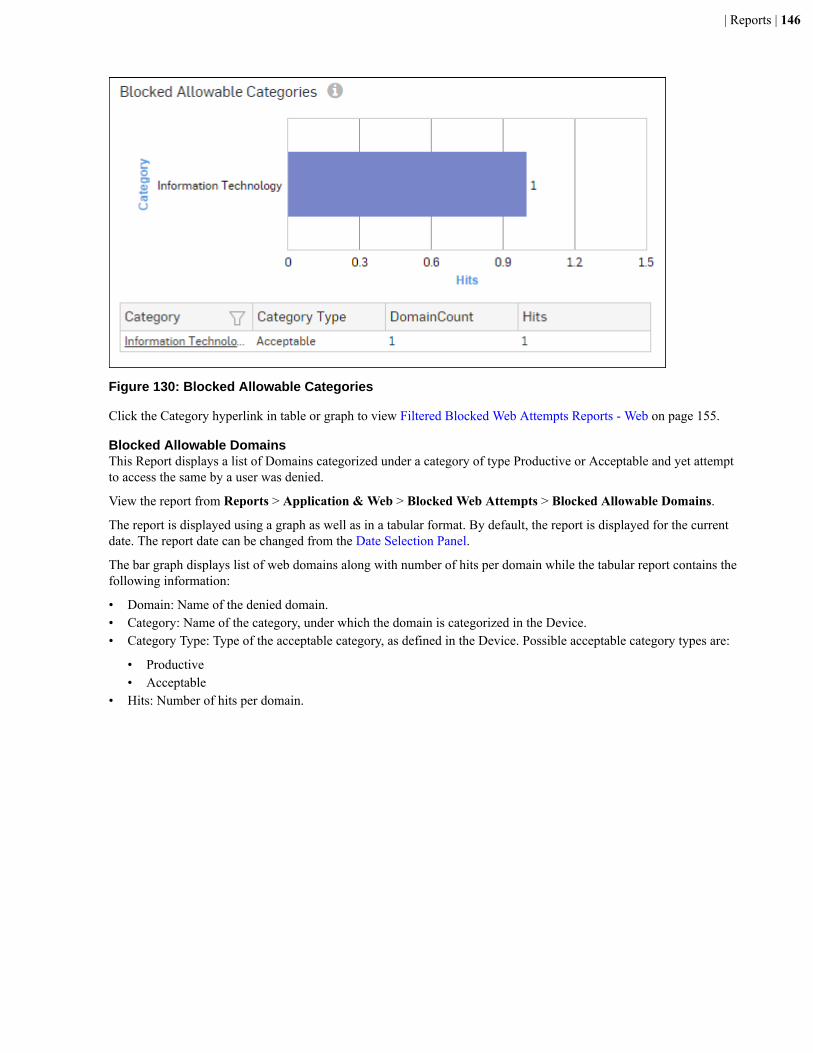
| Reports | 146
Figure 130: Blocked Allowable Categories
Click the Category hyperlink in table or graph to view Filtered Blocked Web Attempts Reports - Web on page 155.
Blocked Allowable DomainsThis Report displays a list of Domains categorized under a category of type Productive or Acceptable and yet attemptto access the same by a user was denied.
View the report from Reports > Application & Web > Blocked Web Attempts > Blocked Allowable Domains.
The report is displayed using a graph as well as in a tabular format. By default, the report is displayed for the currentdate. The report date can be changed from the Date Selection Panel.
The bar graph displays list of web domains along with number of hits per domain while the tabular report contains thefollowing information:
• Domain: Name of the denied domain.• Category: Name of the category, under which the domain is categorized in the Device.• Category Type: Type of the acceptable category, as defined in the Device. Possible acceptable category types are:
• Productive• Acceptable
• Hits: Number of hits per domain.
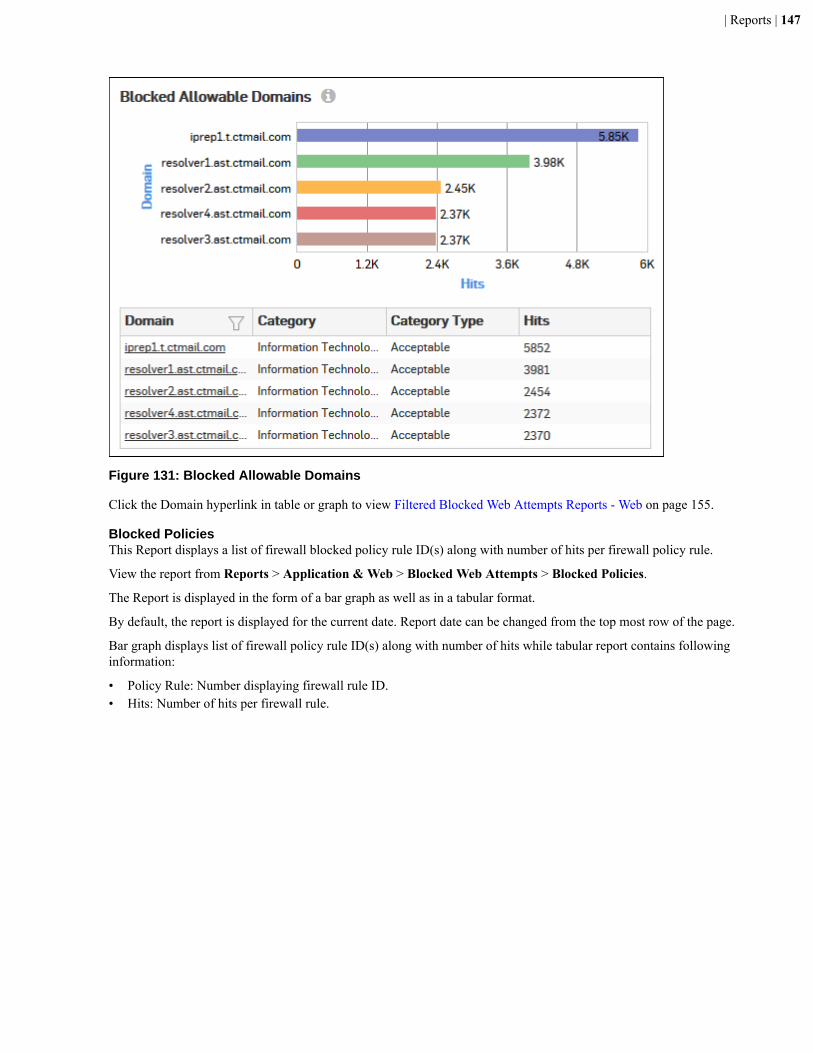
| Reports | 147
Figure 131: Blocked Allowable Domains
Click the Domain hyperlink in table or graph to view Filtered Blocked Web Attempts Reports - Web on page 155.
Blocked PoliciesThis Report displays a list of firewall blocked policy rule ID(s) along with number of hits per firewall policy rule.
View the report from Reports > Application & Web > Blocked Web Attempts > Blocked Policies.
The Report is displayed in the form of a bar graph as well as in a tabular format.
By default, the report is displayed for the current date. Report date can be changed from the top most row of the page.
Bar graph displays list of firewall policy rule ID(s) along with number of hits while tabular report contains followinginformation:
• Policy Rule: Number displaying firewall rule ID.• Hits: Number of hits per firewall rule.
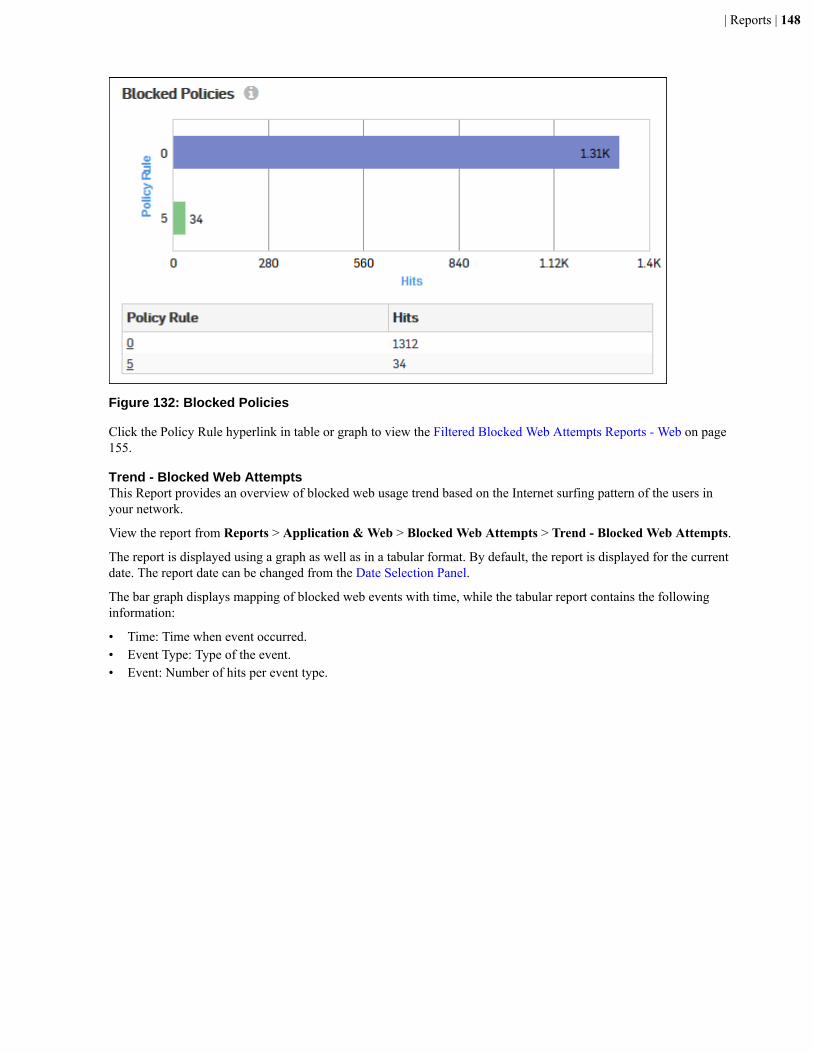
| Reports | 148
Figure 132: Blocked Policies
Click the Policy Rule hyperlink in table or graph to view the Filtered Blocked Web Attempts Reports - Web on page155.
Trend - Blocked Web AttemptsThis Report provides an overview of blocked web usage trend based on the Internet surfing pattern of the users inyour network.
View the report from Reports > Application & Web > Blocked Web Attempts > Trend - Blocked Web Attempts.
The report is displayed using a graph as well as in a tabular format. By default, the report is displayed for the currentdate. The report date can be changed from the Date Selection Panel.
The bar graph displays mapping of blocked web events with time, while the tabular report contains the followinginformation:
• Time: Time when event occurred.• Event Type: Type of the event.• Event: Number of hits per event type.
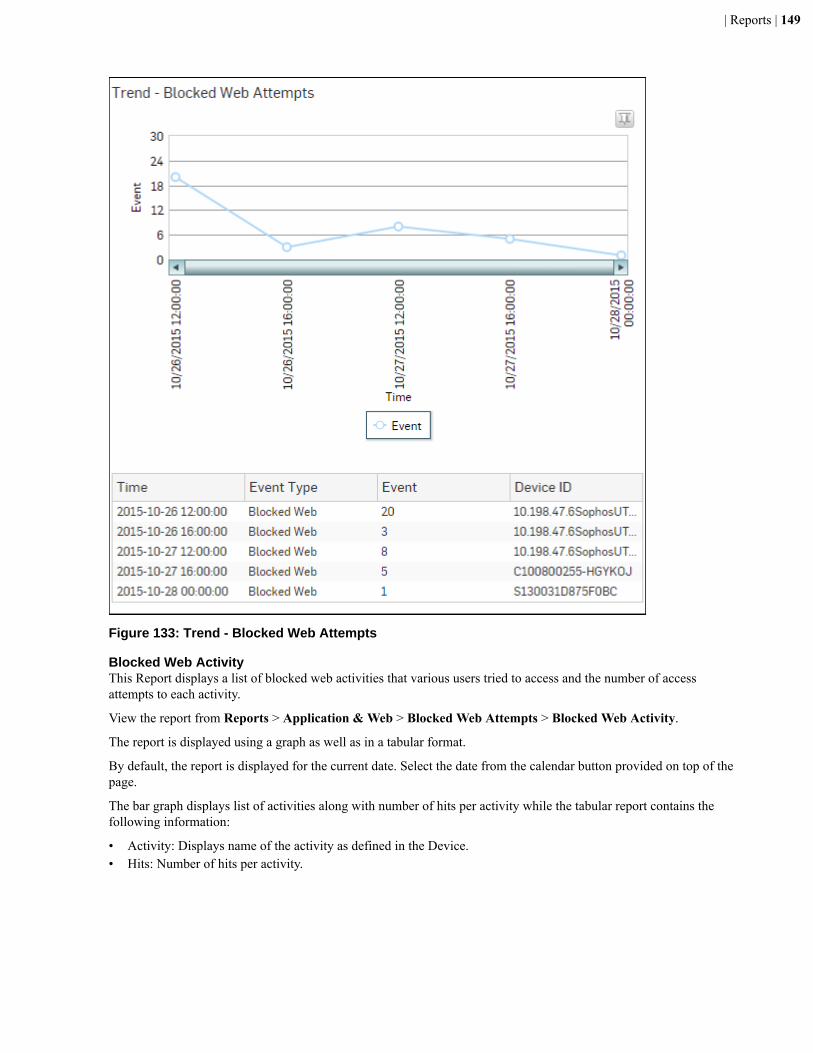
| Reports | 149
Figure 133: Trend - Blocked Web Attempts
Blocked Web ActivityThis Report displays a list of blocked web activities that various users tried to access and the number of accessattempts to each activity.
View the report from Reports > Application & Web > Blocked Web Attempts > Blocked Web Activity.
The report is displayed using a graph as well as in a tabular format.
By default, the report is displayed for the current date. Select the date from the calendar button provided on top of thepage.
The bar graph displays list of activities along with number of hits per activity while the tabular report contains thefollowing information:
• Activity: Displays name of the activity as defined in the Device.• Hits: Number of hits per activity.

| Reports | 150
Figure 134: Blocked Web Activity
Click the Activity hyperlink in table or graph to view the Filtered Blocked Web Attempts Reports - Web.
Web VirusThis Report lists viruses blocked by the Device as well as number of occurrence per blocked virus.
View the report from Reports > Application & Web > Blocked Web Attempts > Web Virus.
The report is displayed using a graph as well as in a tabular format. By default, the report is displayed for the currentdate. The report date can be changed from the Date Selection Panel.
The bar graph displays blocked web viruses along with number of counts per virus while the tabular report containsthe following information:
• Virus: Name of the blocked web virus.• Count: Number of times a virus was blocked.
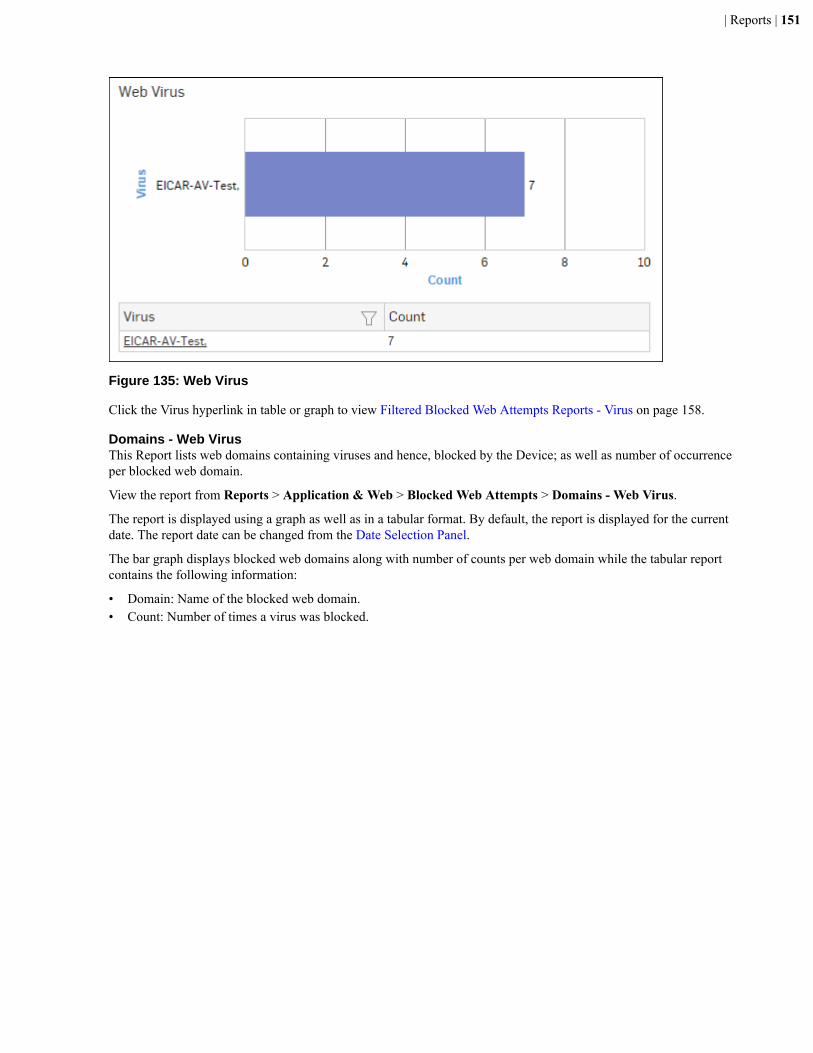
| Reports | 151
Figure 135: Web Virus
Click the Virus hyperlink in table or graph to view Filtered Blocked Web Attempts Reports - Virus on page 158.
Domains - Web VirusThis Report lists web domains containing viruses and hence, blocked by the Device; as well as number of occurrenceper blocked web domain.
View the report from Reports > Application & Web > Blocked Web Attempts > Domains - Web Virus.
The report is displayed using a graph as well as in a tabular format. By default, the report is displayed for the currentdate. The report date can be changed from the Date Selection Panel.
The bar graph displays blocked web domains along with number of counts per web domain while the tabular reportcontains the following information:
• Domain: Name of the blocked web domain.• Count: Number of times a virus was blocked.
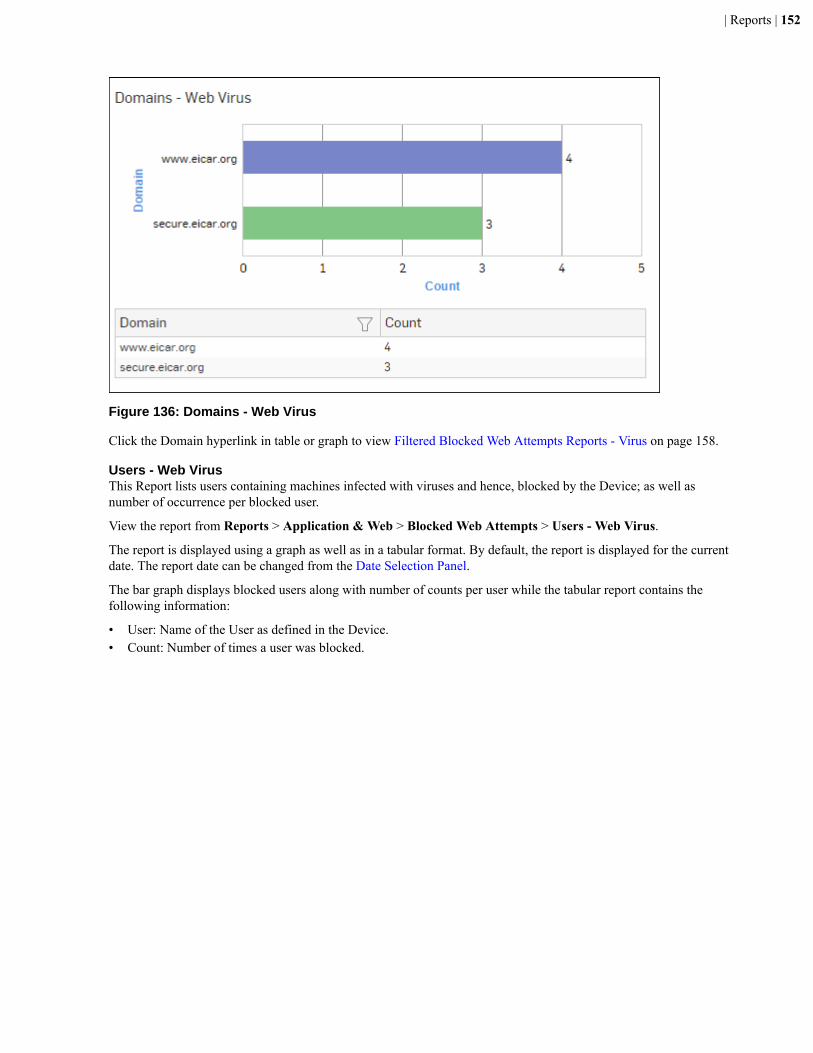
| Reports | 152
Figure 136: Domains - Web Virus
Click the Domain hyperlink in table or graph to view Filtered Blocked Web Attempts Reports - Virus on page 158.
Users - Web VirusThis Report lists users containing machines infected with viruses and hence, blocked by the Device; as well asnumber of occurrence per blocked user.
View the report from Reports > Application & Web > Blocked Web Attempts > Users - Web Virus.
The report is displayed using a graph as well as in a tabular format. By default, the report is displayed for the currentdate. The report date can be changed from the Date Selection Panel.
The bar graph displays blocked users along with number of counts per user while the tabular report contains thefollowing information:
• User: Name of the User as defined in the Device.• Count: Number of times a user was blocked.
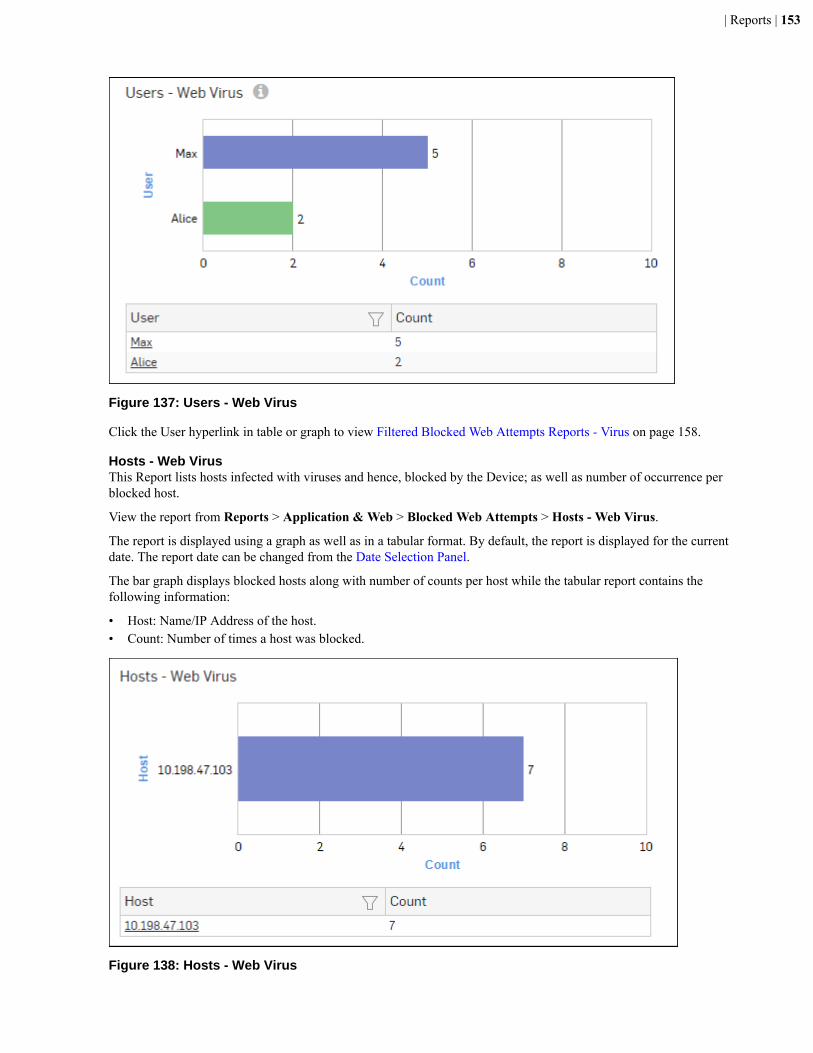
| Reports | 153
Figure 137: Users - Web Virus
Click the User hyperlink in table or graph to view Filtered Blocked Web Attempts Reports - Virus on page 158.
Hosts - Web VirusThis Report lists hosts infected with viruses and hence, blocked by the Device; as well as number of occurrence perblocked host.
View the report from Reports > Application & Web > Blocked Web Attempts > Hosts - Web Virus.
The report is displayed using a graph as well as in a tabular format. By default, the report is displayed for the currentdate. The report date can be changed from the Date Selection Panel.
The bar graph displays blocked hosts along with number of counts per host while the tabular report contains thefollowing information:
• Host: Name/IP Address of the host.• Count: Number of times a host was blocked.
Figure 138: Hosts - Web Virus
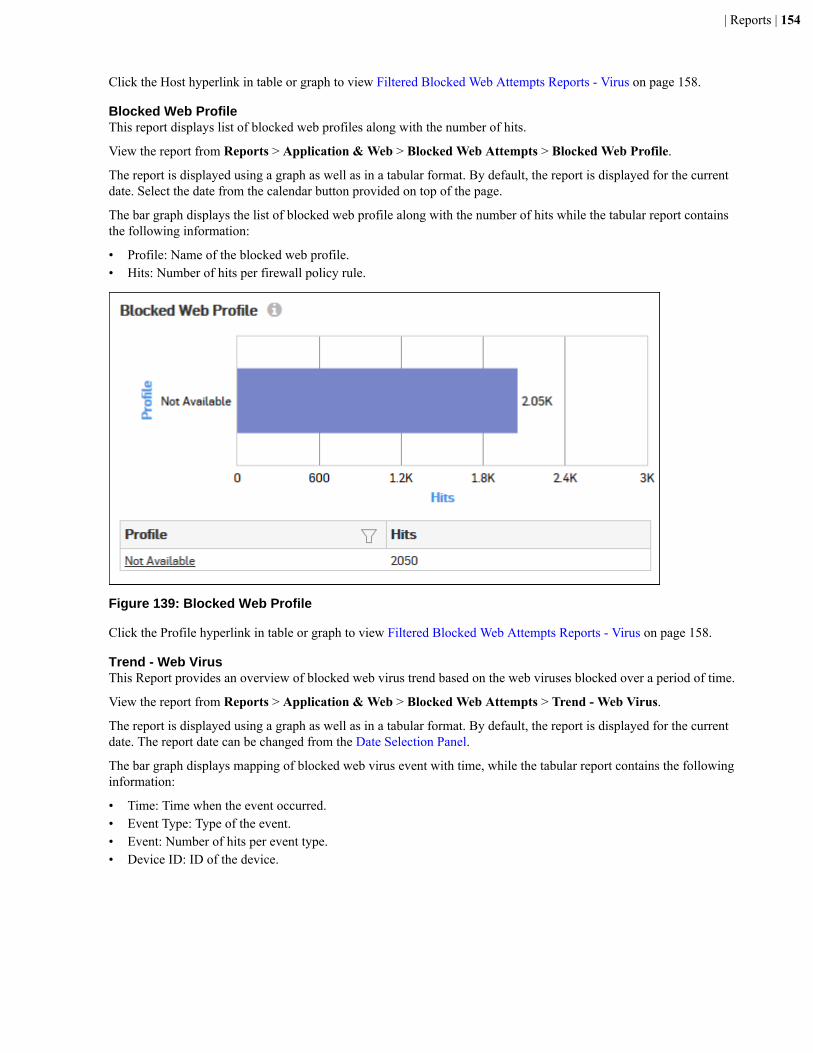
| Reports | 154
Click the Host hyperlink in table or graph to view Filtered Blocked Web Attempts Reports - Virus on page 158.
Blocked Web ProfileThis report displays list of blocked web profiles along with the number of hits.
View the report from Reports > Application & Web > Blocked Web Attempts > Blocked Web Profile.
The report is displayed using a graph as well as in a tabular format. By default, the report is displayed for the currentdate. Select the date from the calendar button provided on top of the page.
The bar graph displays the list of blocked web profile along with the number of hits while the tabular report containsthe following information:
• Profile: Name of the blocked web profile.• Hits: Number of hits per firewall policy rule.
Figure 139: Blocked Web Profile
Click the Profile hyperlink in table or graph to view Filtered Blocked Web Attempts Reports - Virus on page 158.
Trend - Web VirusThis Report provides an overview of blocked web virus trend based on the web viruses blocked over a period of time.
View the report from Reports > Application & Web > Blocked Web Attempts > Trend - Web Virus.
The report is displayed using a graph as well as in a tabular format. By default, the report is displayed for the currentdate. The report date can be changed from the Date Selection Panel.
The bar graph displays mapping of blocked web virus event with time, while the tabular report contains the followinginformation:
• Time: Time when the event occurred.• Event Type: Type of the event.• Event: Number of hits per event type.• Device ID: ID of the device.

| Reports | 155
Figure 140: Trend - Web Virus
Filtered Blocked Web Attempts Reports - Web
The Blocked Web Attempts Reports can be filtered to get the following set of Blocked Web Attempts Reports:
• Blocked Web Users• Blocked Web Categories• Blocked Web Domains• Blocked Web Hosts• Blocked Allowable Categories• Blocked Allowable Domains• Blocked Policies widget on page 157• Blocked Web Activity• Blocked Web User Groups (Primary Group) widget on page 157• Blocked Web Profile widget on page 158
To get the Filtered Blocked Web Attempts reports, you need to choose one of the following filter criteria:
• User from Blocked Web Users Report• Category from Blocked Web Categories Report• Domain from Blocked Web Domains Report
| Reports | 156
• Host from Blocked Web Hosts Report• Category from Blocked Allowable Categories Report• Domain from Blocked Allowable Domains Report• Policy Rule from Blocked Policies on page 147 Report• Activity from Blocked Web Activity on page 149 Report• User Group from Blocked Web User Groups (Primary Group) on page 144 Report• Profile from Blocked Web Profile on page 154 Report
Filtered Reports consist of multiple report widgets except the filter criterion widget. Each widget displays the reportin a graph as well as in a tabular format, which can again be filtered.
By default, the report is displayed for the current date. The report date can be changed from the top most row of thepage.
Blocked Web Users widgetThis widget displays the list of blocked web users along with the number of hits.
Note: This widget will not be displayed for filter criterion User.
The bar graph displays various users who tried to access sites under a denied category while the tabular reportcontains the following information:
• User: Displays the various denied users.• Hits: Number of hits per user.
Blocked Web Categories widgetThis widget displays a list of blocked web categories along with the number of hits per category.
Note: This widget will not be displayed for filter criterion Category.
The bar graph displays various denied categories which a user has tried to access while the tabular report contains thefollowing information:
• Category: Web category name.• Hits: Number of Hits.
Blocked Web Domains widgetThis Widget displays the list of blocked web domains along with the number of hits per domain.
Note: This widget will not be displayed for filter criterion Domain.
The bar graph displays various denied domains and number of hits while the tabular report contains the followinginformation:
• Domain: Name of denied domain.• Hits: Number of Hits
Blocked Web Hosts widgetThis widget displays the list of blocked web hosts through which a user has tried to access denied sites, along with thenumber of hits per host.
Note: This widget will not be displayed for filter criterion Host.
The bar graph displays various hosts and number of hits while the tabular report contains the following information:
• Host: Displays the host name.• Hits: Number of hits per host.
Blocked Allowable Categories widgetThis widget displays a list of web categories falling under either Productive or Acceptable category type and yetattempt to access the same by a user was denied
Note: This widget will not be displayed for filter criterion Category.
| Reports | 157
The bar graph displays list of categories along with number of hits per category while the tabular report contains thefollowing information:
• Category: Name of the category.• Category Type: Type of the acceptable category, as defined in the Device. Possible acceptable category types are:
• Productive• Acceptable
• Domain Count: Number of blocked domains under each category.• Hits: Number of hits per category.
Blocked Allowable Domains widgetThis widget displays a list of Domains categorized under a category of type Productive or Acceptable and yet attemptto access the same by a user was denied
Note: This widget will not be displayed for filter criterion Domain.
The bar graph displays list of web domains along with number of hits per domain while the tabular report contains thefollowing information:
• Domain: Name of the denied domain.• Category: Name of the category, under which the domain is categorized in the Device.• Category Type: Type of the acceptable category, as defined in the Device. Possible acceptable category types are:
• Productive• Acceptable
• Hits: Number of hits per domain.
Blocked Policies widgetThis widget report displays a list of firewall blocked policy rule ID(s) along with number of hits per firewall rule.
Note: This widget will not be displayed for filter criterion Policy Rule.
The Report is displayed in the form of a bar graph as well as in a tabular format.
By default, the report is displayed for the current date. Report date can be changed from the top most row of the page.
Bar graph displays list of firewall policy rule ID(s) along with number of hits while tabular report contains followinginformation:
• Policy Rule: Number displaying firewall rule ID.• Hits: Number of hits per firewall rule.
Blocked Web Activity widgetThis widget displays a list of blocked web activities along with the number of hits per activity.
Note: This widget will not be displayed for filter criterion Activity.
The bar graph displays various denied activity which a user has tried to access while the tabular report contains thefollowing information:
• Activity: Displays name of the activity as defined in the Device.• Hits: Number of hits per activtiy.
Blocked Web User Groups (Primary Group) widget
This Report displays a list of blocked web user groups along with the number of hits per user group.
Note: This widget will not be displayed for filter criterion User Group.
The bar graph displays number of hits per user group while the tabular report contains the following information:
• User Group: User Group name as defined in the Device. If the User Group is not defined in the Device then it willdisplay ‘Unidentified’which means the traffic is generated by an unauthenticated user group.
| Reports | 158
Note: For users who are part of multiple user groups, the group shown here is the one that is at top ofObjects > Identity > Groups page.
• Hits: Number of hits to the user group.
Blocked Web Profile widget
This report displays list of blocked web profiles along with the number of hits.
Note: This widget will not be displayed for filter criterion Profile.
The bar graph displays the list of blocked web profile along with the number of hits while the tabular report containsthe following information:
• Profile: Name of the blocked web profile.• Hits: Number of hits per firewall policy rule.
Filtered Blocked Web Attempts Reports - Virus
The Blocked Web Attempts Reports can be filtered to get the following set of Blocked Web Attempts Reports:
• Web Virus• Domains - Web Virus• Users - Web Virus• Hosts - Web Virus
To get the Filtered Blocked Web Attempts reports, you need to choose one of the following filter criteria:
• Virus from Web Virus Report• Domain from Domains - Web Virus Report• User from Users - Web Virus Report• Host from Hosts - Web Virus Report
Filtered Reports consist of multiple report widgets except the filter criterion widget. Each widget displays the reportin a graph as well as in a tabular format, which can again be filtered.
By default, the report is displayed for the current date. The report date can be changed from the top most row of thepage.
Web Virus widgetThis widget lists viruses blocked by the Device as well as number of occurrence per blocked virus.
Note: This widget will not be displayed for filter criterion Virus.
The bar graph displays blocked web viruses along with number of hits per virus while the tabular report contains thefollowing information:
• Virus: Name of the blocked web virus.• Count: Number of times a virus was blocked.
Domains - Web Virus widgetThis widget lists web domains containing viruses and hence, blocked by the Device; as well as number of occurrenceper blocked web domain.
Note: This widget will not be displayed for filter criterion Domain.
The bar graph displays blocked web domains along with number of hits per web domain while the tabular reportcontains the following information:
• Domain: Name of the blocked web domain.• Count: Number of times a virus was blocked.
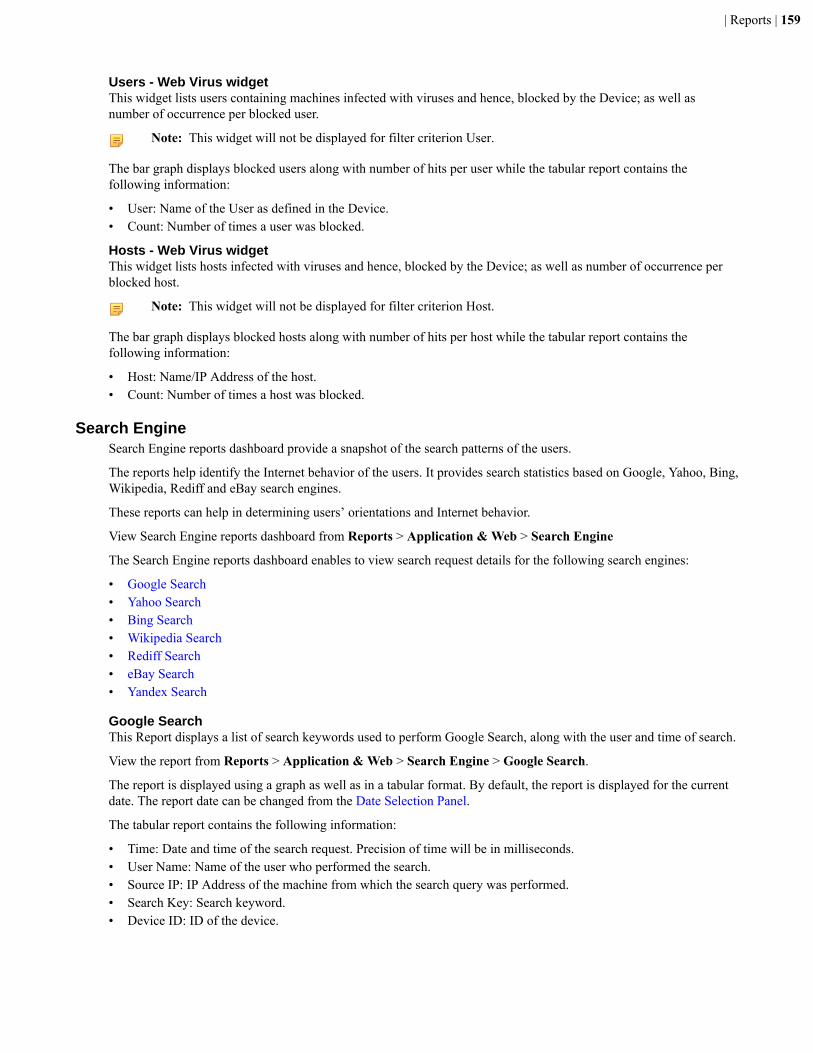
| Reports | 159
Users - Web Virus widgetThis widget lists users containing machines infected with viruses and hence, blocked by the Device; as well asnumber of occurrence per blocked user.
Note: This widget will not be displayed for filter criterion User.
The bar graph displays blocked users along with number of hits per user while the tabular report contains thefollowing information:
• User: Name of the User as defined in the Device.• Count: Number of times a user was blocked.
Hosts - Web Virus widgetThis widget lists hosts infected with viruses and hence, blocked by the Device; as well as number of occurrence perblocked host.
Note: This widget will not be displayed for filter criterion Host.
The bar graph displays blocked hosts along with number of hits per host while the tabular report contains thefollowing information:
• Host: Name/IP Address of the host.• Count: Number of times a host was blocked.
Search EngineSearch Engine reports dashboard provide a snapshot of the search patterns of the users.
The reports help identify the Internet behavior of the users. It provides search statistics based on Google, Yahoo, Bing,Wikipedia, Rediff and eBay search engines.
These reports can help in determining users’ orientations and Internet behavior.
View Search Engine reports dashboard from Reports > Application & Web > Search Engine
The Search Engine reports dashboard enables to view search request details for the following search engines:
• Google Search• Yahoo Search• Bing Search• Wikipedia Search• Rediff Search• eBay Search• Yandex Search
Google SearchThis Report displays a list of search keywords used to perform Google Search, along with the user and time of search.
View the report from Reports > Application & Web > Search Engine > Google Search.
The report is displayed using a graph as well as in a tabular format. By default, the report is displayed for the currentdate. The report date can be changed from the Date Selection Panel.
The tabular report contains the following information:
• Time: Date and time of the search request. Precision of time will be in milliseconds.• User Name: Name of the user who performed the search.• Source IP: IP Address of the machine from which the search query was performed.• Search Key: Search keyword.• Device ID: ID of the device.
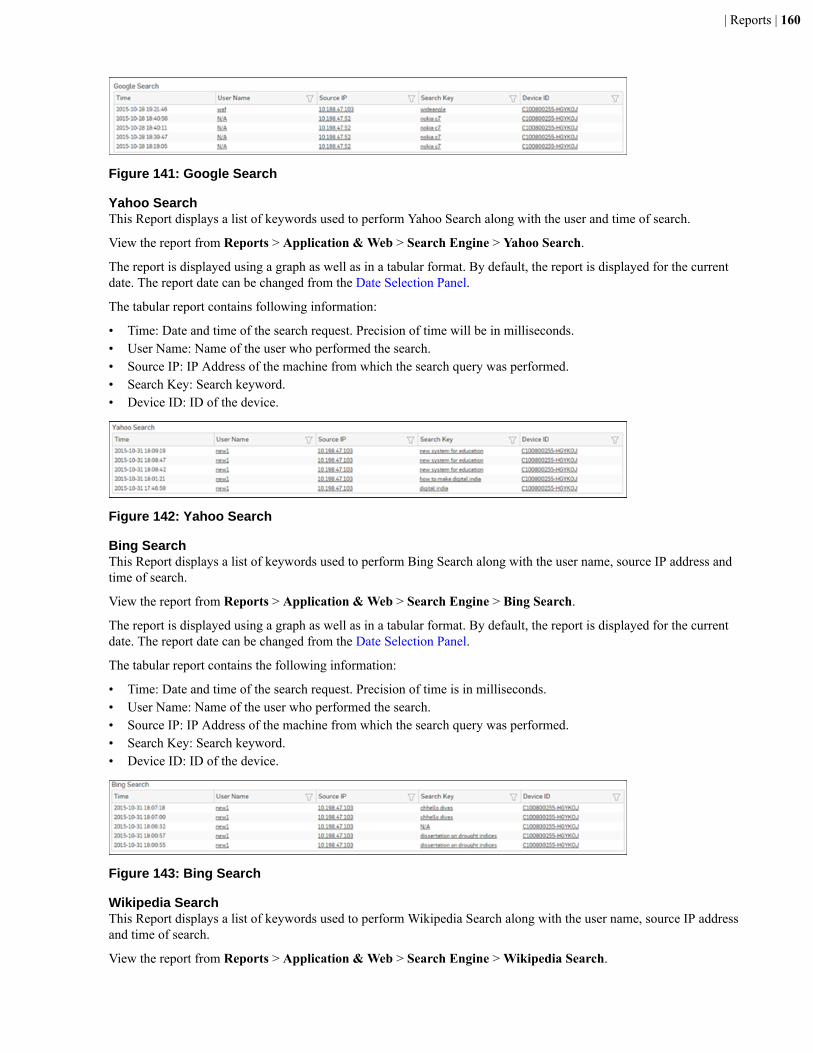
| Reports | 160
Figure 141: Google Search
Yahoo SearchThis Report displays a list of keywords used to perform Yahoo Search along with the user and time of search.
View the report from Reports > Application & Web > Search Engine > Yahoo Search.
The report is displayed using a graph as well as in a tabular format. By default, the report is displayed for the currentdate. The report date can be changed from the Date Selection Panel.
The tabular report contains following information:
• Time: Date and time of the search request. Precision of time will be in milliseconds.• User Name: Name of the user who performed the search.• Source IP: IP Address of the machine from which the search query was performed.• Search Key: Search keyword.• Device ID: ID of the device.
Figure 142: Yahoo Search
Bing SearchThis Report displays a list of keywords used to perform Bing Search along with the user name, source IP address andtime of search.
View the report from Reports > Application & Web > Search Engine > Bing Search.
The report is displayed using a graph as well as in a tabular format. By default, the report is displayed for the currentdate. The report date can be changed from the Date Selection Panel.
The tabular report contains the following information:
• Time: Date and time of the search request. Precision of time is in milliseconds.• User Name: Name of the user who performed the search.• Source IP: IP Address of the machine from which the search query was performed.• Search Key: Search keyword.• Device ID: ID of the device.
Figure 143: Bing Search
Wikipedia SearchThis Report displays a list of keywords used to perform Wikipedia Search along with the user name, source IP addressand time of search.
View the report from Reports > Application & Web > Search Engine > Wikipedia Search.

| Reports | 161
The report is displayed using a graph as well as in a tabular format. By default, the report is displayed for the currentdate. The report date can be changed from the Date Selection Panel.
The tabular report contains the following information:
• Time: Date and time of the search request. Precision of time is in milliseconds.• User Name: Name of the user who performed the search.• Source IP: IP Address of the machine from which the search query was performed.• Search Key: Search keyword.• Device ID: ID of the device.
Figure 144: Wikipedia Search
Rediff SearchThis Report displays a list of keywords used to perform Rediff Search along with the user name, source IP Addressand time of search.
View the report from Reports > Application & Web > Search Engine > Rediff Search.
The report is displayed using a graph as well as in a tabular format. By default, the report is displayed for the currentdate. The report date can be changed from the Date Selection Panel.
The tabular report contains the following information:
• Time: Date and time of the search request. Precision of time is in milliseconds.• User Name: Name of the user who performed the search.• Source IP: IP Address of the machine from which the search query was performed.• Search Key: Search keyword.• Device ID: ID of the device.
Figure 145: Rediff Search
eBay SearchThis Report displays a list of keywords used to perform eBay Search along with the user name, source IP address andtime of search.
View the report from Reports > Application & Web > Search Engine > eBay Search.
The report is displayed using a graph as well as in a tabular format. By default, the report is displayed for the currentdate. The report date can be changed from the Date Selection Panel.
The tabular report contains the following information:
• Time: Date and time of the search request. Precision of time is in milliseconds.• User Name: Name of the user who performed the search.• Source IP: IP Address of the machine from which the search query was performed.• Search Key: Search keyword.• Device ID: ID of the device.
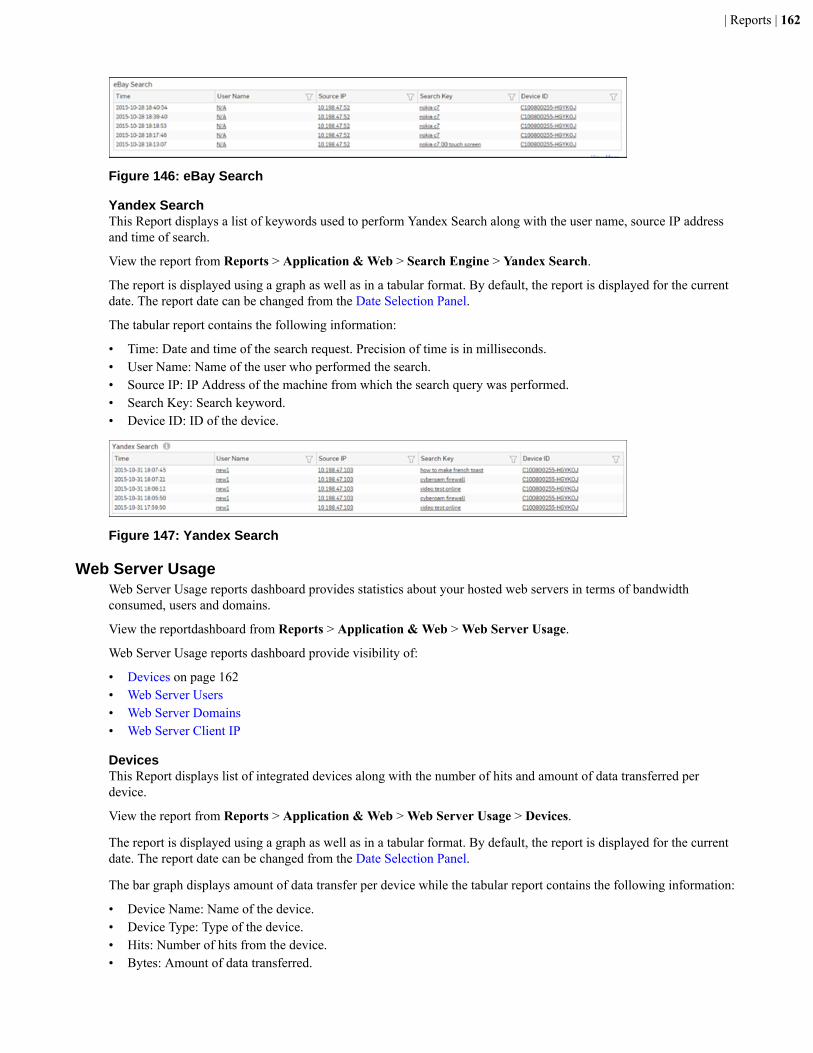
| Reports | 162
Figure 146: eBay Search
Yandex SearchThis Report displays a list of keywords used to perform Yandex Search along with the user name, source IP addressand time of search.
View the report from Reports > Application & Web > Search Engine > Yandex Search.
The report is displayed using a graph as well as in a tabular format. By default, the report is displayed for the currentdate. The report date can be changed from the Date Selection Panel.
The tabular report contains the following information:
• Time: Date and time of the search request. Precision of time is in milliseconds.• User Name: Name of the user who performed the search.• Source IP: IP Address of the machine from which the search query was performed.• Search Key: Search keyword.• Device ID: ID of the device.
Figure 147: Yandex Search
Web Server UsageWeb Server Usage reports dashboard provides statistics about your hosted web servers in terms of bandwidthconsumed, users and domains.
View the reportdashboard from Reports > Application & Web > Web Server Usage.
Web Server Usage reports dashboard provide visibility of:
• Devices on page 162• Web Server Users• Web Server Domains• Web Server Client IP
DevicesThis Report displays list of integrated devices along with the number of hits and amount of data transferred perdevice.
View the report from Reports > Application & Web > Web Server Usage > Devices.
The report is displayed using a graph as well as in a tabular format. By default, the report is displayed for the currentdate. The report date can be changed from the Date Selection Panel.
The bar graph displays amount of data transfer per device while the tabular report contains the following information:
• Device Name: Name of the device.• Device Type: Type of the device.• Hits: Number of hits from the device.• Bytes: Amount of data transferred.
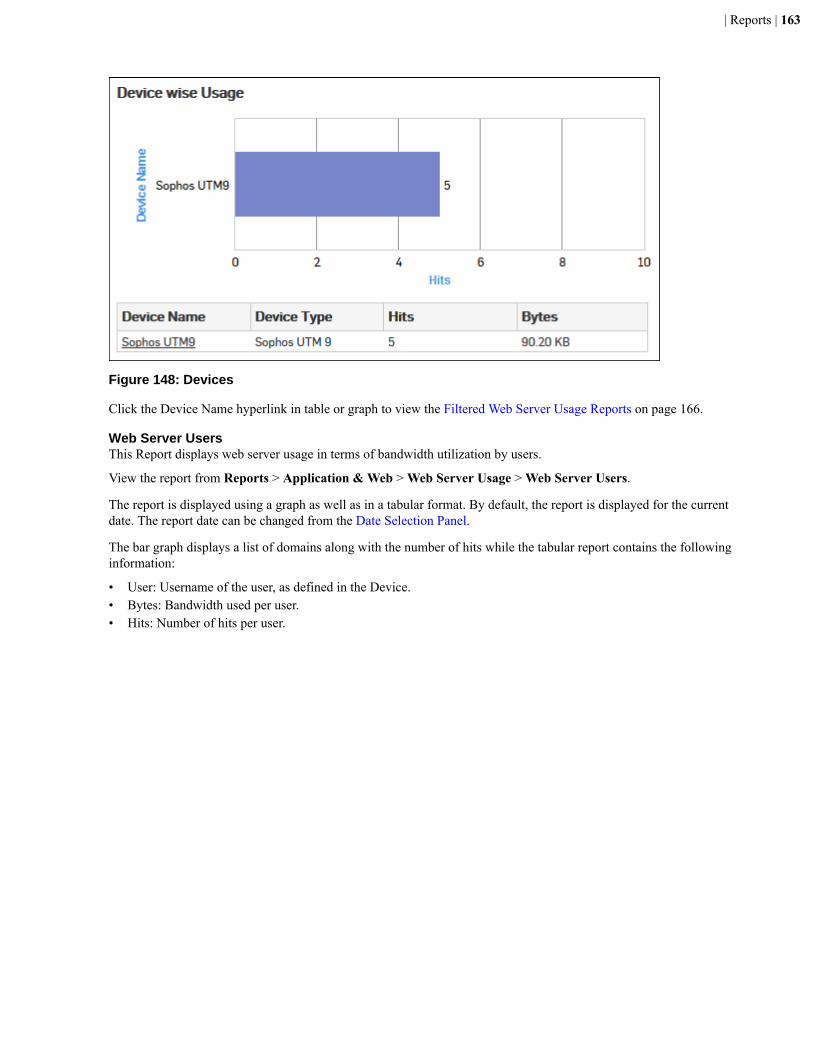
| Reports | 163
Figure 148: Devices
Click the Device Name hyperlink in table or graph to view the Filtered Web Server Usage Reports on page 166.
Web Server UsersThis Report displays web server usage in terms of bandwidth utilization by users.
View the report from Reports > Application & Web > Web Server Usage > Web Server Users.
The report is displayed using a graph as well as in a tabular format. By default, the report is displayed for the currentdate. The report date can be changed from the Date Selection Panel.
The bar graph displays a list of domains along with the number of hits while the tabular report contains the followinginformation:
• User: Username of the user, as defined in the Device.• Bytes: Bandwidth used per user.• Hits: Number of hits per user.
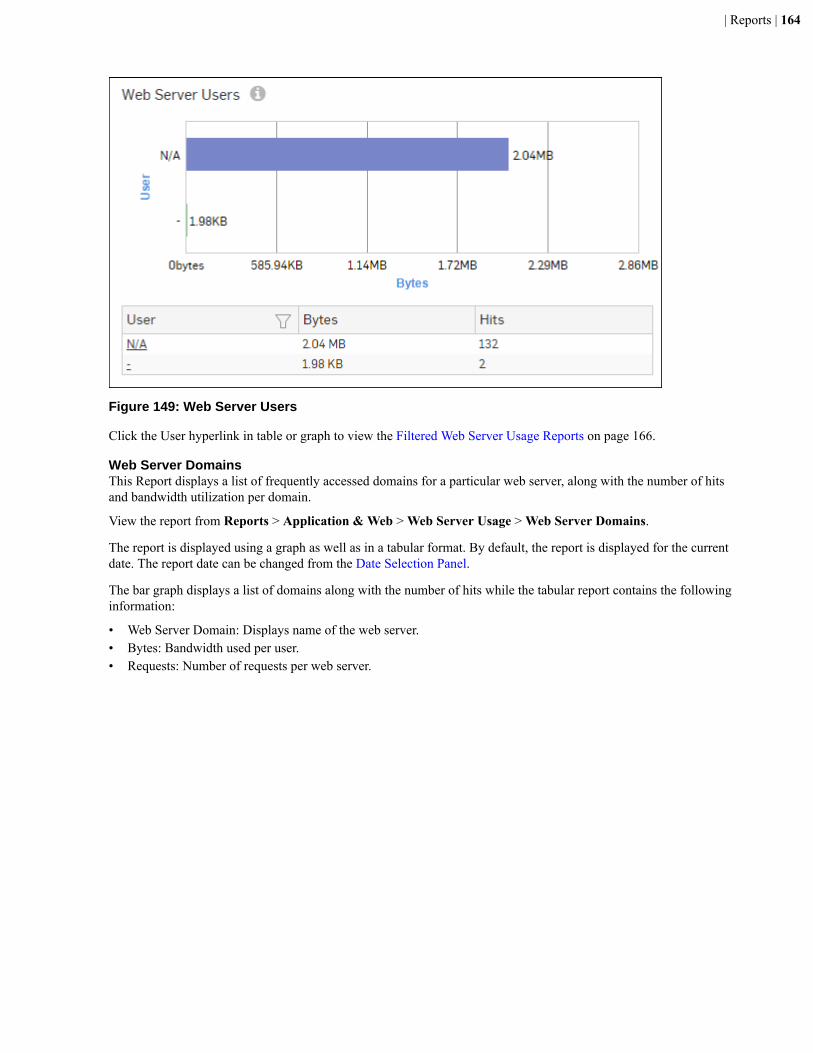
| Reports | 164
Figure 149: Web Server Users
Click the User hyperlink in table or graph to view the Filtered Web Server Usage Reports on page 166.
Web Server DomainsThis Report displays a list of frequently accessed domains for a particular web server, along with the number of hitsand bandwidth utilization per domain.
View the report from Reports > Application & Web > Web Server Usage > Web Server Domains.
The report is displayed using a graph as well as in a tabular format. By default, the report is displayed for the currentdate. The report date can be changed from the Date Selection Panel.
The bar graph displays a list of domains along with the number of hits while the tabular report contains the followinginformation:
• Web Server Domain: Displays name of the web server.• Bytes: Bandwidth used per user.• Requests: Number of requests per web server.
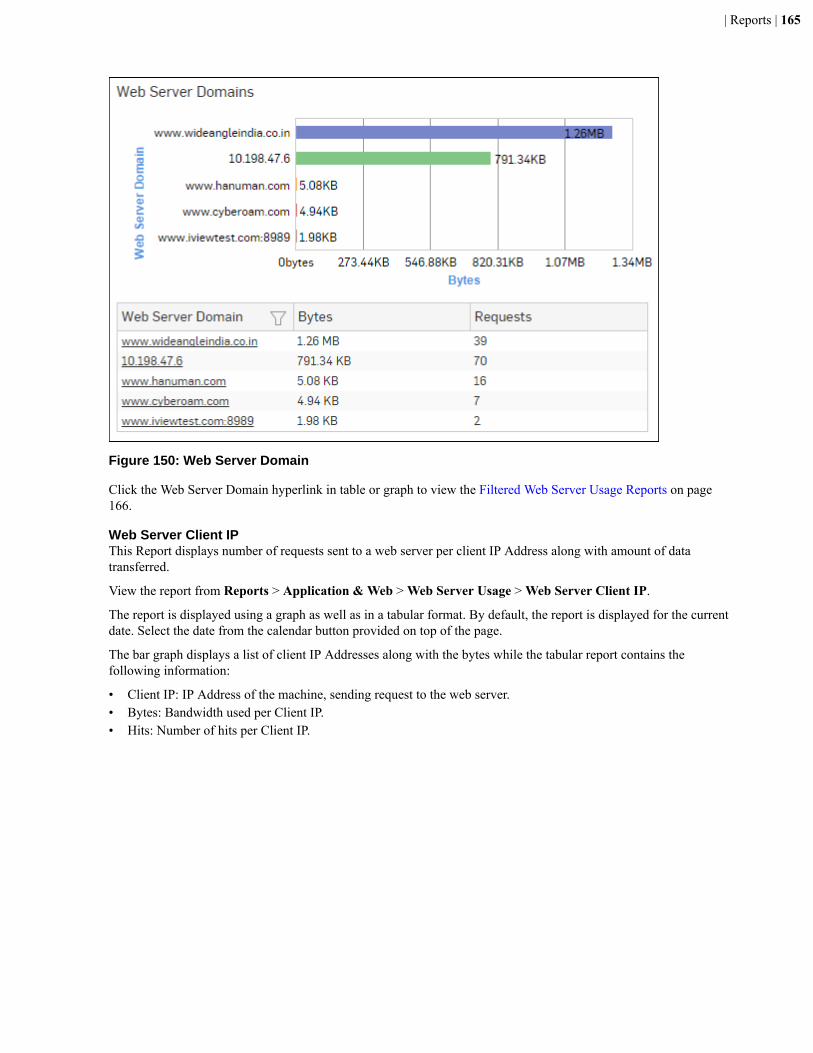
| Reports | 165
Figure 150: Web Server Domain
Click the Web Server Domain hyperlink in table or graph to view the Filtered Web Server Usage Reports on page166.
Web Server Client IPThis Report displays number of requests sent to a web server per client IP Address along with amount of datatransferred.
View the report from Reports > Application & Web > Web Server Usage > Web Server Client IP.
The report is displayed using a graph as well as in a tabular format. By default, the report is displayed for the currentdate. Select the date from the calendar button provided on top of the page.
The bar graph displays a list of client IP Addresses along with the bytes while the tabular report contains thefollowing information:
• Client IP: IP Address of the machine, sending request to the web server.• Bytes: Bandwidth used per Client IP.• Hits: Number of hits per Client IP.
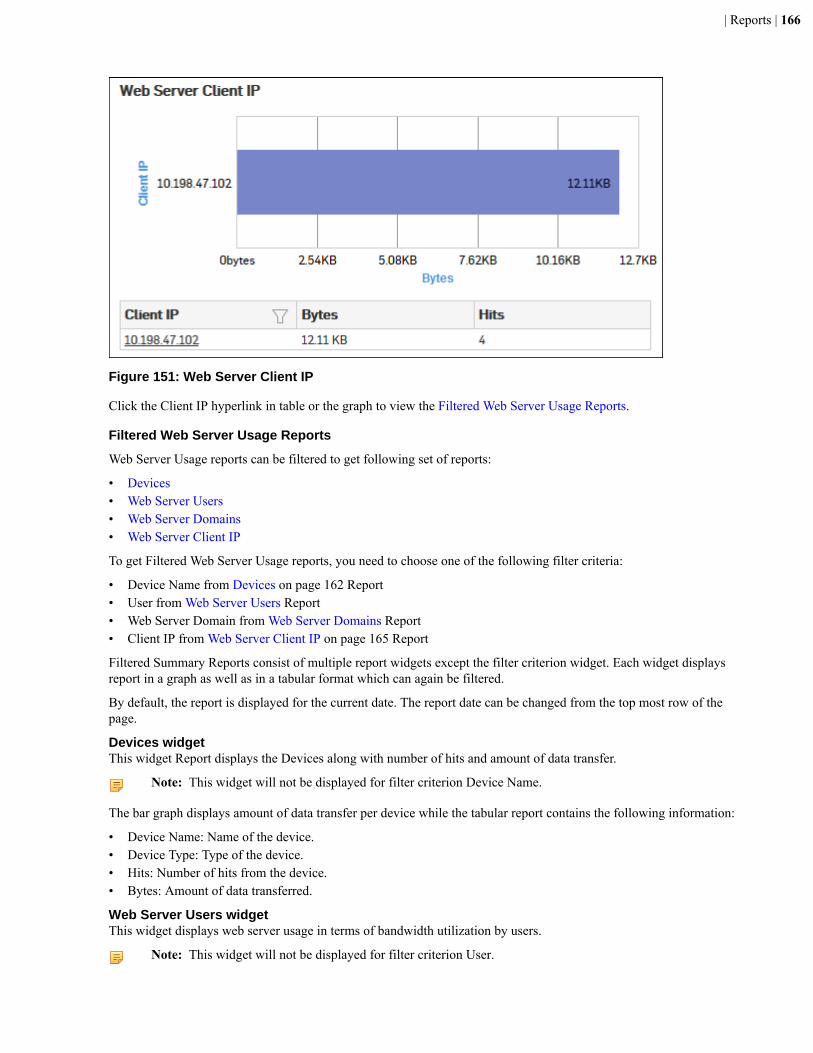
| Reports | 166
Figure 151: Web Server Client IP
Click the Client IP hyperlink in table or the graph to view the Filtered Web Server Usage Reports.
Filtered Web Server Usage Reports
Web Server Usage reports can be filtered to get following set of reports:
• Devices• Web Server Users• Web Server Domains• Web Server Client IP
To get Filtered Web Server Usage reports, you need to choose one of the following filter criteria:
• Device Name from Devices on page 162 Report• User from Web Server Users Report• Web Server Domain from Web Server Domains Report• Client IP from Web Server Client IP on page 165 Report
Filtered Summary Reports consist of multiple report widgets except the filter criterion widget. Each widget displaysreport in a graph as well as in a tabular format which can again be filtered.
By default, the report is displayed for the current date. The report date can be changed from the top most row of thepage.
Devices widgetThis widget Report displays the Devices along with number of hits and amount of data transfer.
Note: This widget will not be displayed for filter criterion Device Name.
The bar graph displays amount of data transfer per device while the tabular report contains the following information:
• Device Name: Name of the device.• Device Type: Type of the device.• Hits: Number of hits from the device.• Bytes: Amount of data transferred.
Web Server Users widgetThis widget displays web server usage in terms of bandwidth utilization by users.
Note: This widget will not be displayed for filter criterion User.
| Reports | 167
The bar graph displays a list of domains along with the number of hits while the tabular report contains the followinginformation:
• User: Username of the user, as defined in the Device.• Bytes: Bandwidth used per user.• Hits: Number of hits per user.
Web Server Domains widgetThis widget displays a list of frequently accessed domains for a particular web server, along with the number of hitsand bandwidth utilization per domain.
Note: This widget will not be displayed for filter criterion Domain.
The bar graph displays a list of domains along with the number of hits while the tabular report contains the followinginformation:
• Domain: Displays domain name.• Bytes: Bandwidth used per user.• Requests: Number of requests per web server.
Web Server Client IP widget
This Report displays number of requests sent to a web server per client IP Address along with amount of datatransferred.
Note: This widget will not be displayed for filter criterion Client IP.
The bar graph displays a list of client IP Addresses along with the bytes while the tabular report contains thefollowing information:
• Client IP: IP Address of the machine, sending request to the web server.• Bytes: Bandwidth used per Client IP.• Hits: Number of hits per Client IP.
Web Server ProtectionWeb Server Protection reports dashboard provide security status about your hosted web servers in terms of attackedweb servers and attacks, users, sources blocked by the Device .
View the Web Server Protection reports dashboard from Reports > Application & Web > Web Server Protection.
Web Server Protection reports dashboard provide visibility of:
• Devices on page 167• Attacked Web Server Domains• Blocked Web Server Requests• Web Server Attack Source• Web Server Virus
DevicesThis Report displays list of integrated devices along with the number of hits and amount of data transferred perdevice.
View the report from Reports > Application & Web > Web Server Protection > Devices.
The report is displayed using a graph as well as in a tabular format. By default, the report is displayed for the currentdate. The report date can be changed from the Date Selection Panel.
The bar graph displays amount of data transfer per device while the tabular report contains the following information:
• Device Name: Name of the device.• Device Type: Type of the device.• Hits: Number of hits from the device.
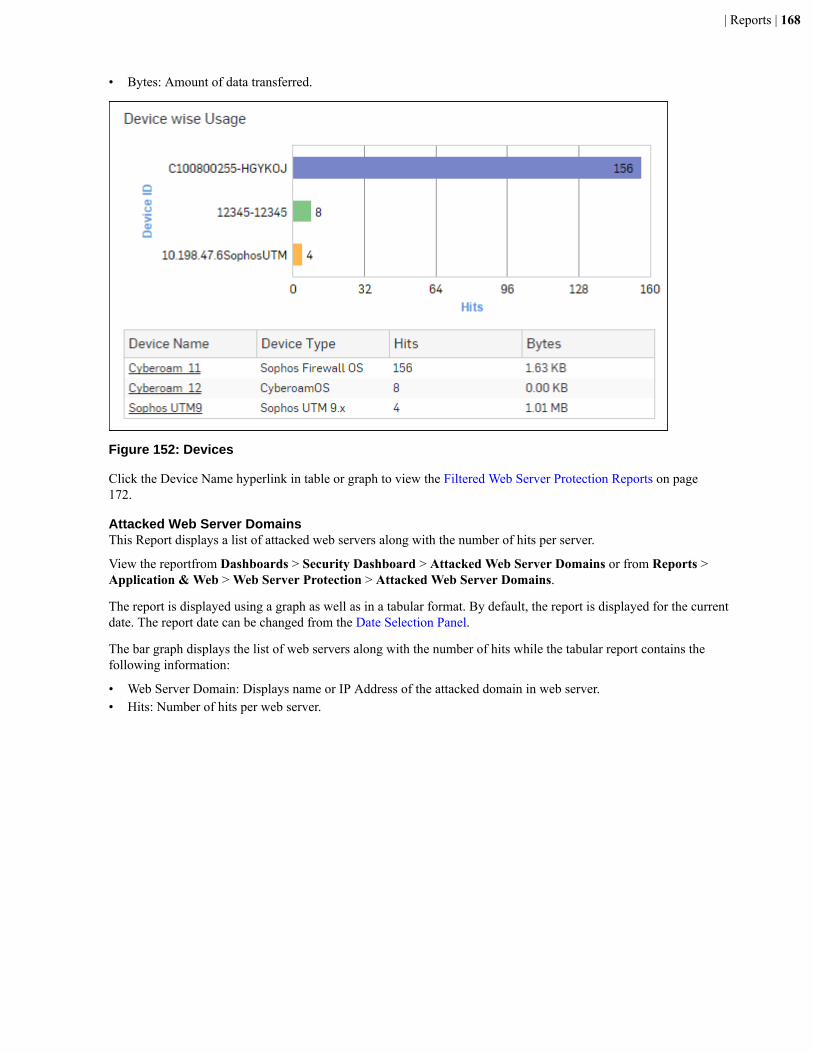
| Reports | 168
• Bytes: Amount of data transferred.
Figure 152: Devices
Click the Device Name hyperlink in table or graph to view the Filtered Web Server Protection Reports on page172.
Attacked Web Server DomainsThis Report displays a list of attacked web servers along with the number of hits per server.
View the reportfrom Dashboards > Security Dashboard > Attacked Web Server Domains or from Reports >Application & Web > Web Server Protection > Attacked Web Server Domains.
The report is displayed using a graph as well as in a tabular format. By default, the report is displayed for the currentdate. The report date can be changed from the Date Selection Panel.
The bar graph displays the list of web servers along with the number of hits while the tabular report contains thefollowing information:
• Web Server Domain: Displays name or IP Address of the attacked domain in web server.• Hits: Number of hits per web server.
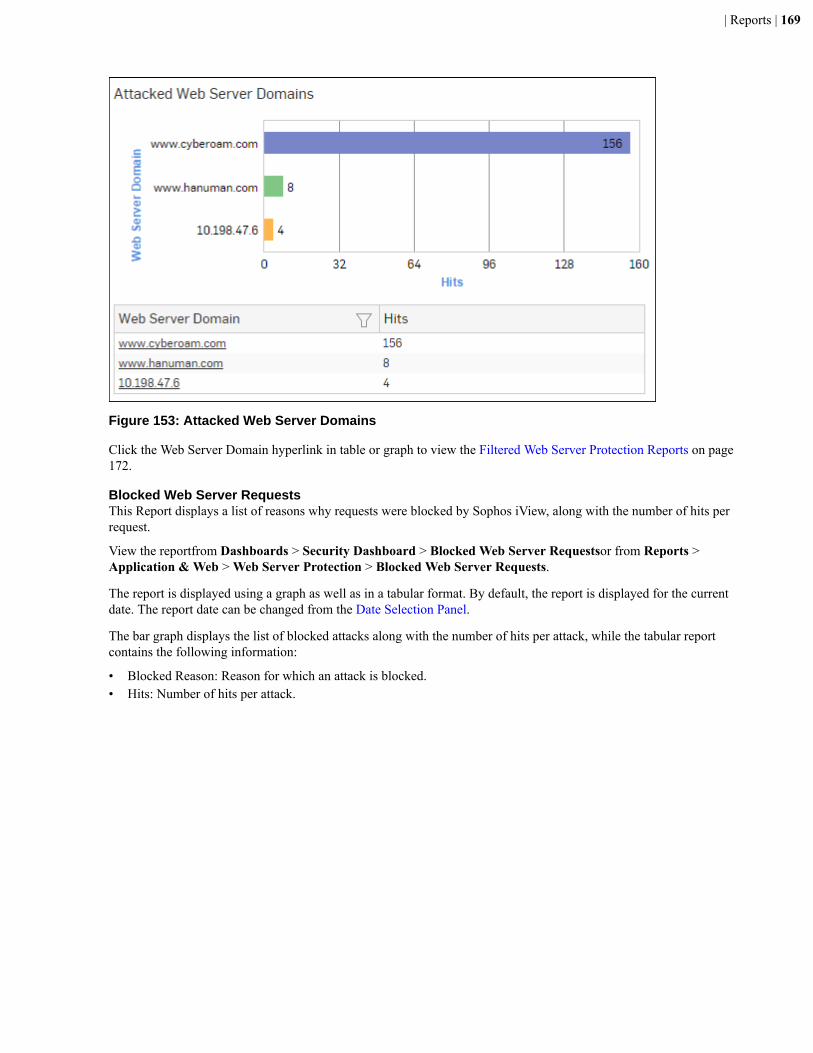
| Reports | 169
Figure 153: Attacked Web Server Domains
Click the Web Server Domain hyperlink in table or graph to view the Filtered Web Server Protection Reports on page172.
Blocked Web Server RequestsThis Report displays a list of reasons why requests were blocked by Sophos iView, along with the number of hits perrequest.
View the reportfrom Dashboards > Security Dashboard > Blocked Web Server Requestsor from Reports >Application & Web > Web Server Protection > Blocked Web Server Requests.
The report is displayed using a graph as well as in a tabular format. By default, the report is displayed for the currentdate. The report date can be changed from the Date Selection Panel.
The bar graph displays the list of blocked attacks along with the number of hits per attack, while the tabular reportcontains the following information:
• Blocked Reason: Reason for which an attack is blocked.• Hits: Number of hits per attack.
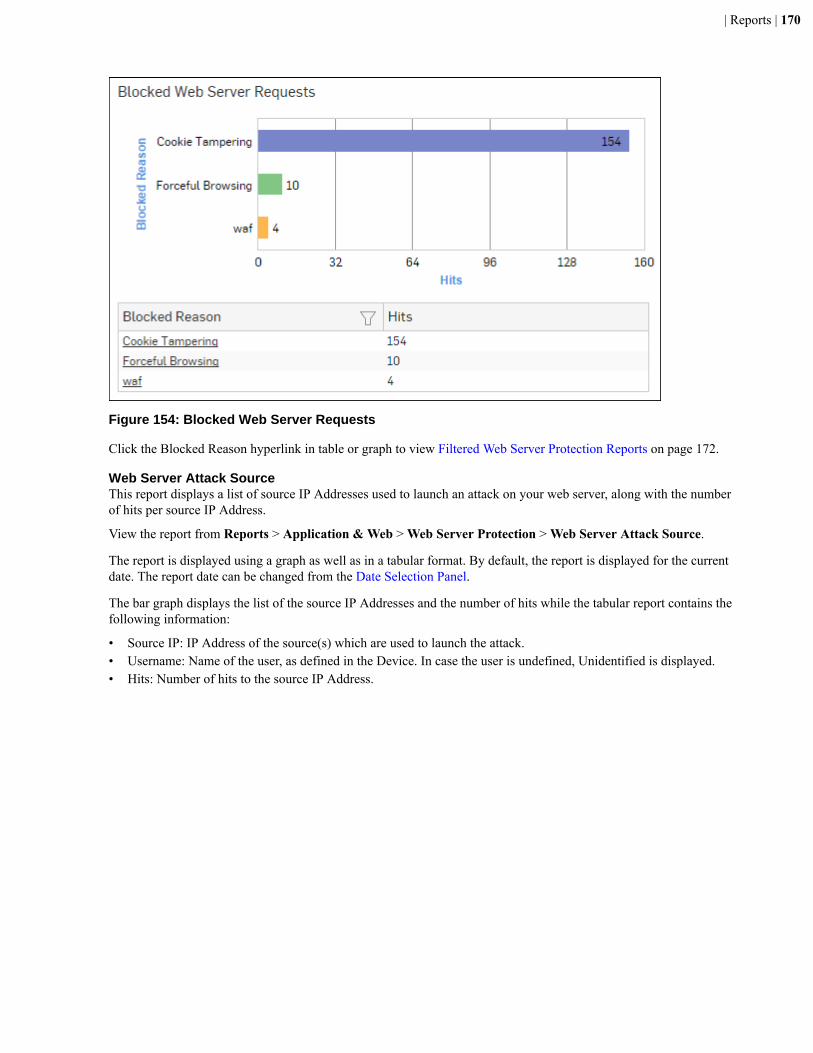
| Reports | 170
Figure 154: Blocked Web Server Requests
Click the Blocked Reason hyperlink in table or graph to view Filtered Web Server Protection Reports on page 172.
Web Server Attack SourceThis report displays a list of source IP Addresses used to launch an attack on your web server, along with the numberof hits per source IP Address.
View the report from Reports > Application & Web > Web Server Protection > Web Server Attack Source.
The report is displayed using a graph as well as in a tabular format. By default, the report is displayed for the currentdate. The report date can be changed from the Date Selection Panel.
The bar graph displays the list of the source IP Addresses and the number of hits while the tabular report contains thefollowing information:
• Source IP: IP Address of the source(s) which are used to launch the attack.• Username: Name of the user, as defined in the Device. In case the user is undefined, Unidentified is displayed.• Hits: Number of hits to the source IP Address.
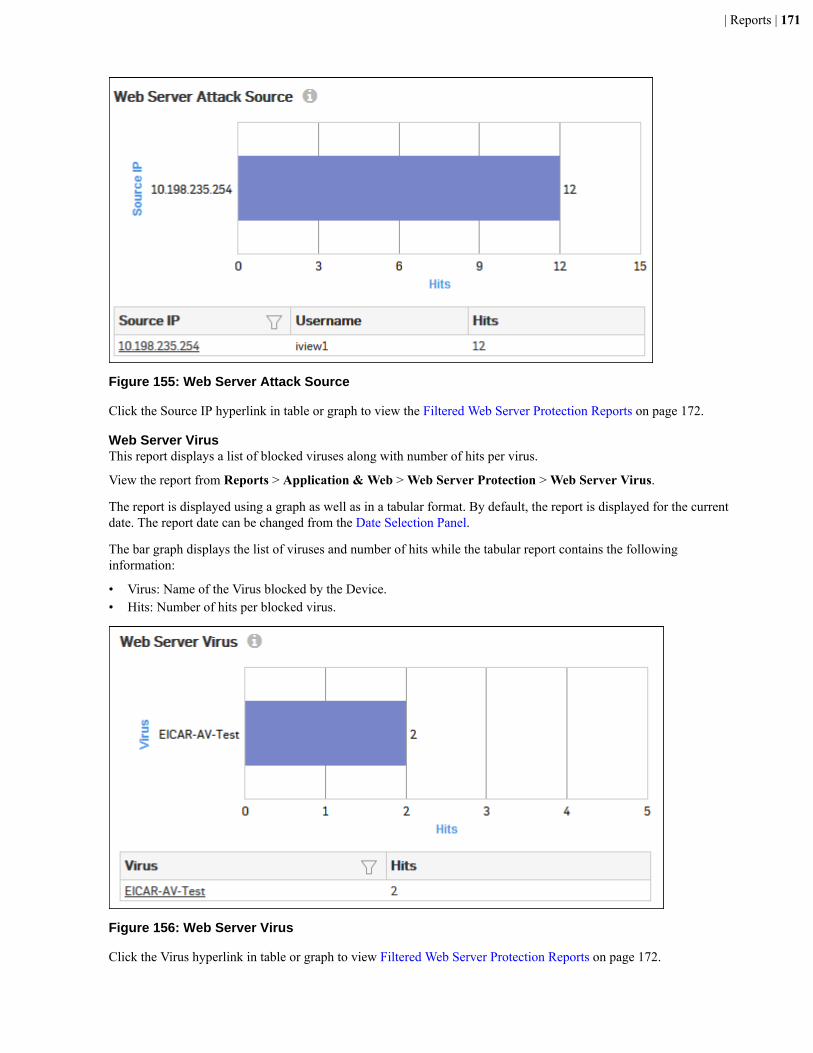
| Reports | 171
Figure 155: Web Server Attack Source
Click the Source IP hyperlink in table or graph to view the Filtered Web Server Protection Reports on page 172.
Web Server VirusThis report displays a list of blocked viruses along with number of hits per virus.
View the report from Reports > Application & Web > Web Server Protection > Web Server Virus.
The report is displayed using a graph as well as in a tabular format. By default, the report is displayed for the currentdate. The report date can be changed from the Date Selection Panel.
The bar graph displays the list of viruses and number of hits while the tabular report contains the followinginformation:
• Virus: Name of the Virus blocked by the Device.• Hits: Number of hits per blocked virus.
Figure 156: Web Server Virus
Click the Virus hyperlink in table or graph to view Filtered Web Server Protection Reports on page 172.
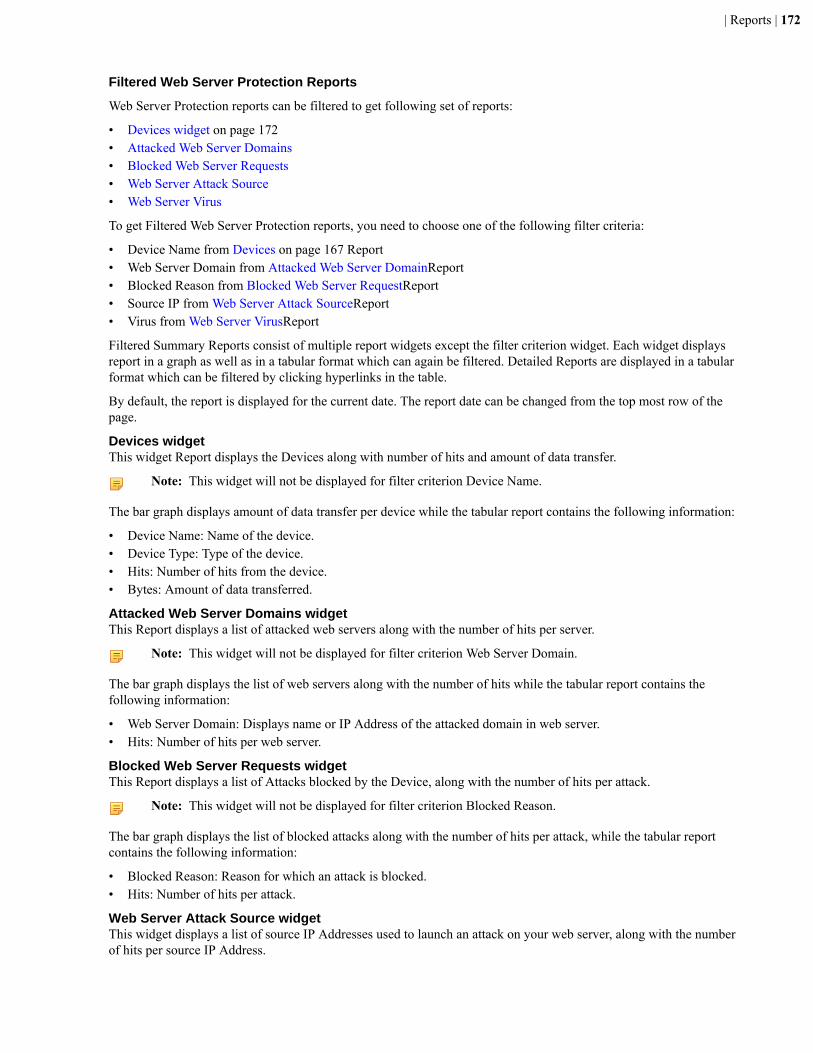
| Reports | 172
Filtered Web Server Protection Reports
Web Server Protection reports can be filtered to get following set of reports:
• Devices widget on page 172• Attacked Web Server Domains• Blocked Web Server Requests• Web Server Attack Source• Web Server Virus
To get Filtered Web Server Protection reports, you need to choose one of the following filter criteria:
• Device Name from Devices on page 167 Report• Web Server Domain from Attacked Web Server DomainReport• Blocked Reason from Blocked Web Server RequestReport• Source IP from Web Server Attack SourceReport• Virus from Web Server VirusReport
Filtered Summary Reports consist of multiple report widgets except the filter criterion widget. Each widget displaysreport in a graph as well as in a tabular format which can again be filtered. Detailed Reports are displayed in a tabularformat which can be filtered by clicking hyperlinks in the table.
By default, the report is displayed for the current date. The report date can be changed from the top most row of thepage.
Devices widgetThis widget Report displays the Devices along with number of hits and amount of data transfer.
Note: This widget will not be displayed for filter criterion Device Name.
The bar graph displays amount of data transfer per device while the tabular report contains the following information:
• Device Name: Name of the device.• Device Type: Type of the device.• Hits: Number of hits from the device.• Bytes: Amount of data transferred.
Attacked Web Server Domains widgetThis Report displays a list of attacked web servers along with the number of hits per server.
Note: This widget will not be displayed for filter criterion Web Server Domain.
The bar graph displays the list of web servers along with the number of hits while the tabular report contains thefollowing information:
• Web Server Domain: Displays name or IP Address of the attacked domain in web server.• Hits: Number of hits per web server.
Blocked Web Server Requests widgetThis Report displays a list of Attacks blocked by the Device, along with the number of hits per attack.
Note: This widget will not be displayed for filter criterion Blocked Reason.
The bar graph displays the list of blocked attacks along with the number of hits per attack, while the tabular reportcontains the following information:
• Blocked Reason: Reason for which an attack is blocked.• Hits: Number of hits per attack.
Web Server Attack Source widgetThis widget displays a list of source IP Addresses used to launch an attack on your web server, along with the numberof hits per source IP Address.
| Reports | 173
Note: This widget will not be displayed for filter criterion Source IP.
The bar graph displays the list of the source IP Addresses and the number of hits while the tabular report contains thefollowing information:
• Source IP: IP Address of the source(s) which are used to launch the attack.• Username: Username of the source(s) which are used to launch the attack.• Hits: Number of hits to the source IP Address.
Web Server Virus widgetThis widget displays a list of blocked viruses along with number of hits per virus.
Note: This widget will not be displayed for filter criterion Virus.
The bar graph displays the list of viruses and number of hits while the tabular report contains the followinginformation:
• Virus: Name of the Virus blocked by the Device.• Hits: Number of hits per blocked virus.
User Data Transfer ReportThe User Data Transfer reports dashboard provide a snapshot of the Internet traffic in terms of data transfer throughyour network.
Note: If the option to exclude data accounting from the Security Policies of Sophos Firewall(s) is enabled,then the User Data Transfer for the specific user will not be accounted for.
View the reportfrom Reports > Application & Web > User Data Transfer Report.
The User Data Transfer reports dashboard enables to view the following reports:
• Devices on page 173• User Groups• Users• Date-wise Usage Report• Client-types
DevicesThis Report displays list of integrated devices along with the number of hits and amount of data transferred perdevice.
View the reportfrom Reports > Application & Web > User Data Transfer Report > Devices.
The report is displayed using a graph as well as in a tabular format. By default, the report is displayed for the currentdate. The report date can be changed from the Date Selection Panel.
The bar graph displays amount of data transfer per device while the tabular report contains the following information:
• Device Name: Name of the device.• Device Type: Type of the device.• Bytes: Amount of data transferred.
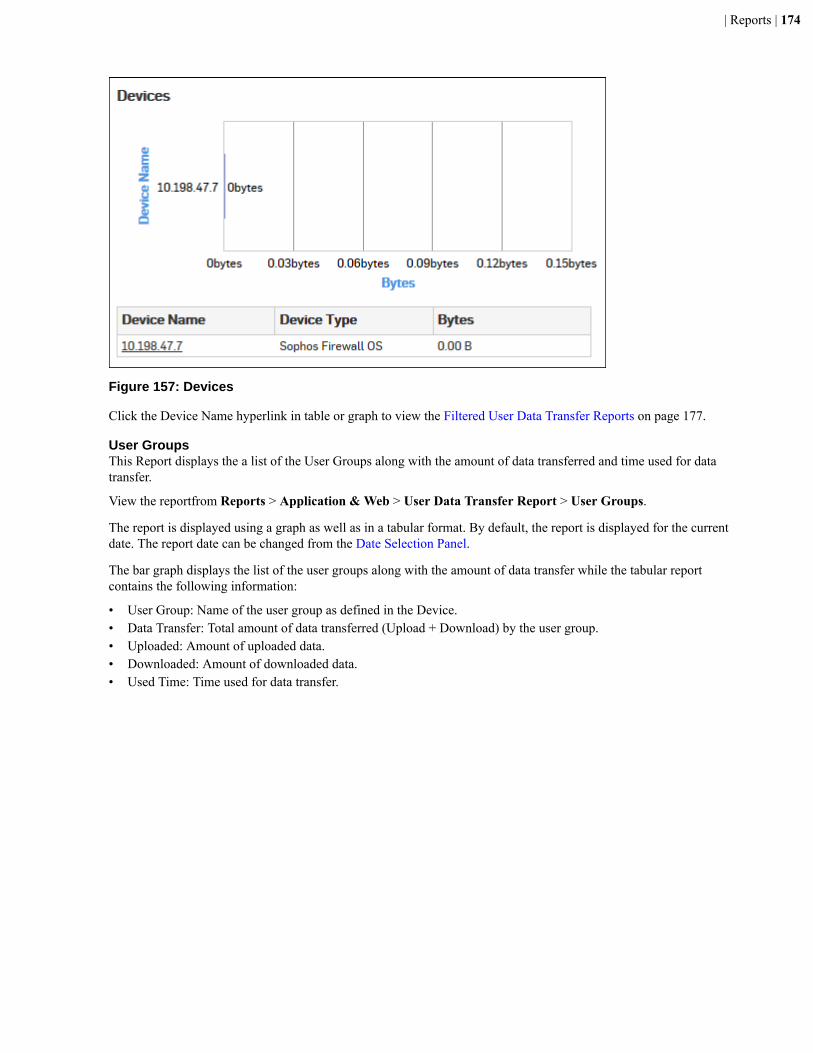
| Reports | 174
Figure 157: Devices
Click the Device Name hyperlink in table or graph to view the Filtered User Data Transfer Reports on page 177.
User GroupsThis Report displays the a list of the User Groups along with the amount of data transferred and time used for datatransfer.
View the reportfrom Reports > Application & Web > User Data Transfer Report > User Groups.
The report is displayed using a graph as well as in a tabular format. By default, the report is displayed for the currentdate. The report date can be changed from the Date Selection Panel.
The bar graph displays the list of the user groups along with the amount of data transfer while the tabular reportcontains the following information:
• User Group: Name of the user group as defined in the Device.• Data Transfer: Total amount of data transferred (Upload + Download) by the user group.• Uploaded: Amount of uploaded data.• Downloaded: Amount of downloaded data.• Used Time: Time used for data transfer.
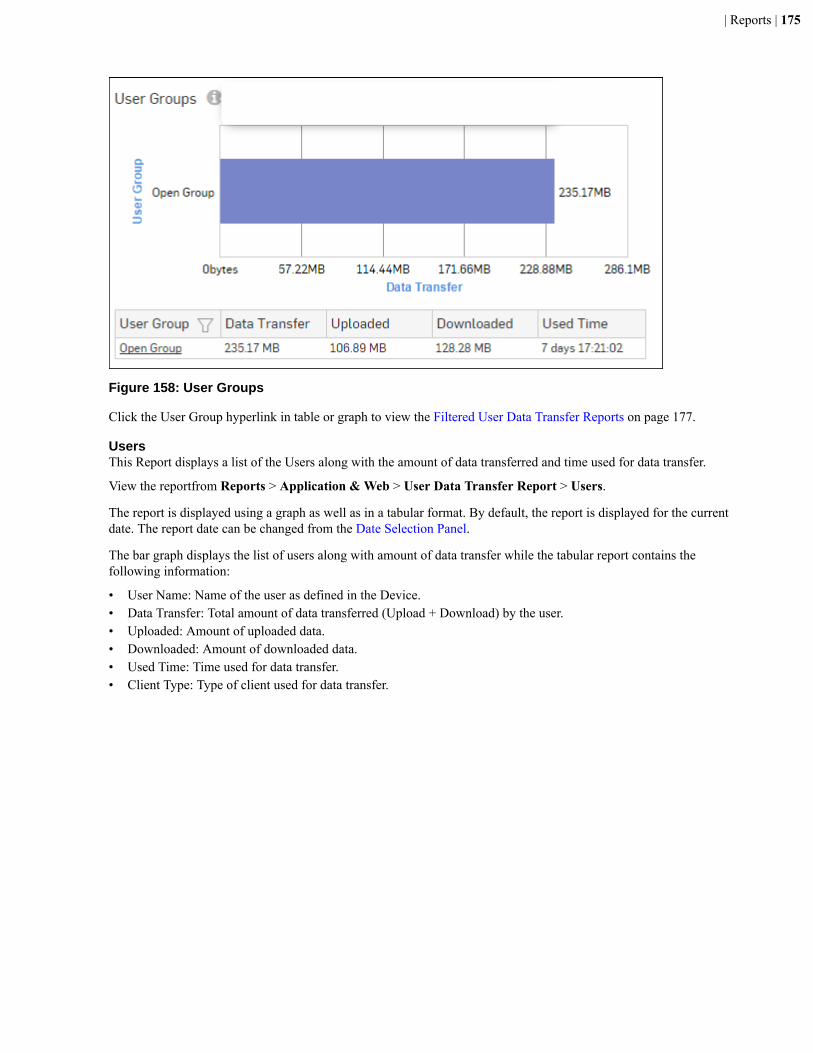
| Reports | 175
Figure 158: User Groups
Click the User Group hyperlink in table or graph to view the Filtered User Data Transfer Reports on page 177.
UsersThis Report displays a list of the Users along with the amount of data transferred and time used for data transfer.
View the reportfrom Reports > Application & Web > User Data Transfer Report > Users.
The report is displayed using a graph as well as in a tabular format. By default, the report is displayed for the currentdate. The report date can be changed from the Date Selection Panel.
The bar graph displays the list of users along with amount of data transfer while the tabular report contains thefollowing information:
• User Name: Name of the user as defined in the Device.• Data Transfer: Total amount of data transferred (Upload + Download) by the user.• Uploaded: Amount of uploaded data.• Downloaded: Amount of downloaded data.• Used Time: Time used for data transfer.• Client Type: Type of client used for data transfer.
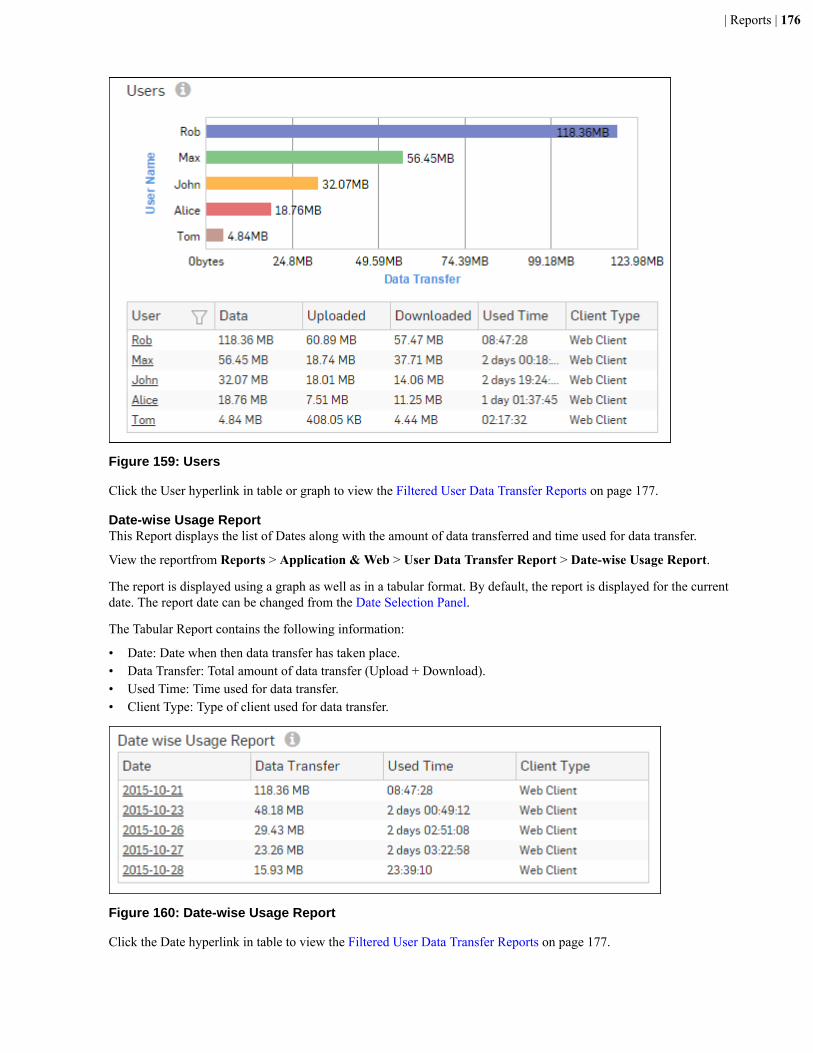
| Reports | 176
Figure 159: Users
Click the User hyperlink in table or graph to view the Filtered User Data Transfer Reports on page 177.
Date-wise Usage ReportThis Report displays the list of Dates along with the amount of data transferred and time used for data transfer.
View the reportfrom Reports > Application & Web > User Data Transfer Report > Date-wise Usage Report.
The report is displayed using a graph as well as in a tabular format. By default, the report is displayed for the currentdate. The report date can be changed from the Date Selection Panel.
The Tabular Report contains the following information:
• Date: Date when then data transfer has taken place.• Data Transfer: Total amount of data transfer (Upload + Download).• Used Time: Time used for data transfer.• Client Type: Type of client used for data transfer.
Figure 160: Date-wise Usage Report
Click the Date hyperlink in table to view the Filtered User Data Transfer Reports on page 177.
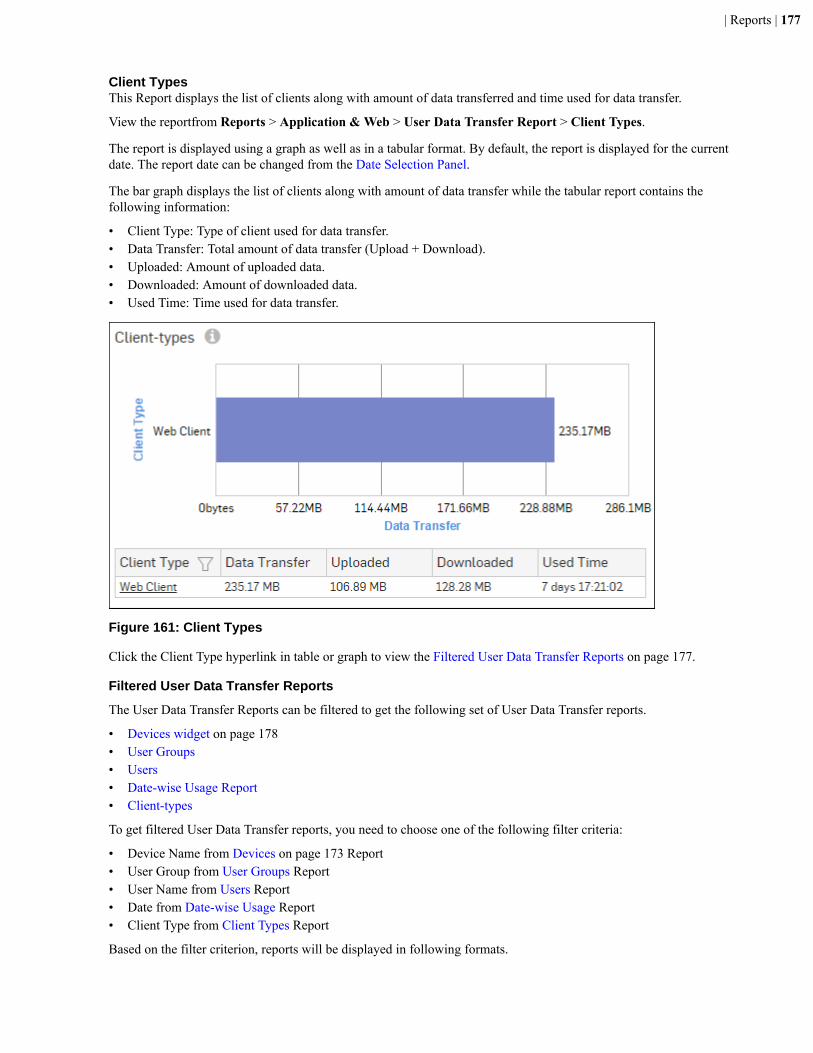
| Reports | 177
Client TypesThis Report displays the list of clients along with amount of data transferred and time used for data transfer.
View the reportfrom Reports > Application & Web > User Data Transfer Report > Client Types.
The report is displayed using a graph as well as in a tabular format. By default, the report is displayed for the currentdate. The report date can be changed from the Date Selection Panel.
The bar graph displays the list of clients along with amount of data transfer while the tabular report contains thefollowing information:
• Client Type: Type of client used for data transfer.• Data Transfer: Total amount of data transfer (Upload + Download).• Uploaded: Amount of uploaded data.• Downloaded: Amount of downloaded data.• Used Time: Time used for data transfer.
Figure 161: Client Types
Click the Client Type hyperlink in table or graph to view the Filtered User Data Transfer Reports on page 177.
Filtered User Data Transfer Reports
The User Data Transfer Reports can be filtered to get the following set of User Data Transfer reports.
• Devices widget on page 178• User Groups• Users• Date-wise Usage Report• Client-types
To get filtered User Data Transfer reports, you need to choose one of the following filter criteria:
• Device Name from Devices on page 173 Report• User Group from User Groups Report• User Name from Users Report• Date from Date-wise Usage Report• Client Type from Client Types Report
Based on the filter criterion, reports will be displayed in following formats.
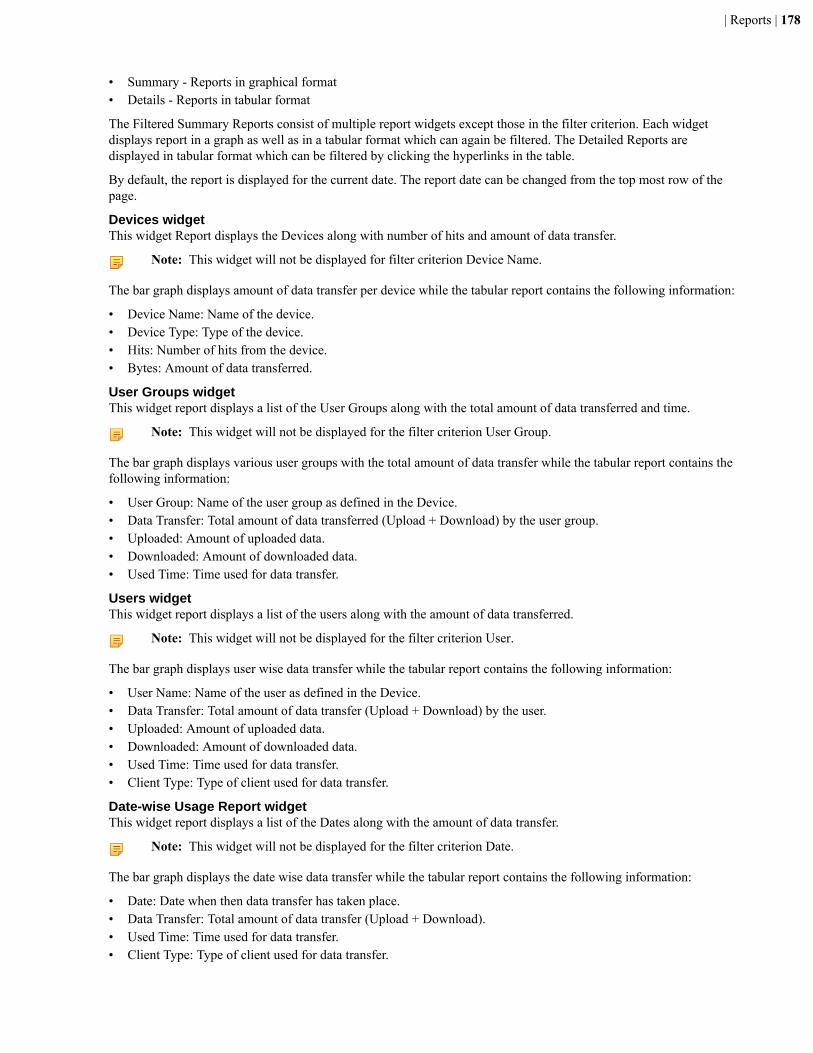
| Reports | 178
• Summary - Reports in graphical format• Details - Reports in tabular format
The Filtered Summary Reports consist of multiple report widgets except those in the filter criterion. Each widgetdisplays report in a graph as well as in a tabular format which can again be filtered. The Detailed Reports aredisplayed in tabular format which can be filtered by clicking the hyperlinks in the table.
By default, the report is displayed for the current date. The report date can be changed from the top most row of thepage.
Devices widgetThis widget Report displays the Devices along with number of hits and amount of data transfer.
Note: This widget will not be displayed for filter criterion Device Name.
The bar graph displays amount of data transfer per device while the tabular report contains the following information:
• Device Name: Name of the device.• Device Type: Type of the device.• Hits: Number of hits from the device.• Bytes: Amount of data transferred.
User Groups widgetThis widget report displays a list of the User Groups along with the total amount of data transferred and time.
Note: This widget will not be displayed for the filter criterion User Group.
The bar graph displays various user groups with the total amount of data transfer while the tabular report contains thefollowing information:
• User Group: Name of the user group as defined in the Device.• Data Transfer: Total amount of data transferred (Upload + Download) by the user group.• Uploaded: Amount of uploaded data.• Downloaded: Amount of downloaded data.• Used Time: Time used for data transfer.
Users widgetThis widget report displays a list of the users along with the amount of data transferred.
Note: This widget will not be displayed for the filter criterion User.
The bar graph displays user wise data transfer while the tabular report contains the following information:
• User Name: Name of the user as defined in the Device.• Data Transfer: Total amount of data transfer (Upload + Download) by the user.• Uploaded: Amount of uploaded data.• Downloaded: Amount of downloaded data.• Used Time: Time used for data transfer.• Client Type: Type of client used for data transfer.
Date-wise Usage Report widgetThis widget report displays a list of the Dates along with the amount of data transfer.
Note: This widget will not be displayed for the filter criterion Date.
The bar graph displays the date wise data transfer while the tabular report contains the following information:
• Date: Date when then data transfer has taken place.• Data Transfer: Total amount of data transfer (Upload + Download).• Used Time: Time used for data transfer.• Client Type: Type of client used for data transfer.
| Reports | 179
Client-type widgetThis Widget report displays a list of the clients along with the amount of data transferred.
Note: This widget will not be displayed for the filter criterion Client Type.
The bar graph displays client type wise data transfer while the tabular report contains the following information:
• Client Type: Type of client used for data transfer.• Data Transfer: Total amount of data transfer (Upload + Download).• Uploaded: Amount of uploaded data.• Downloaded: Amount of downloaded data.• Used Time: Time used for data transfer.
FTP UsageThe FTP Usage reports dashboard gives an insight about the FTP activity - uploads and downloads; thus giving aclear picture of the FTP traffic volume over the selected time period.
The reports dashboard provide statistics based on the traffic generated by various hosts, users and servers.
View FTP Usage reports dashboard from Reports > Application & Web > FTP Usage.
The FTP Usage reports dashboard enables to view the FTP traffic generated by:
• Devices on page 179• Files Transferred via FTP• FTP Users• FTP Hosts• FTP Servers• Direction
DevicesThis Report displays list of integrated devices along with the number of files and amount of data transferred perdevice.
View the report from Reports > Application & Web > FTP Usage > Devices.
The report is displayed using a graph as well as in a tabular format. By default, the report is displayed for the currentdate. The report date can be changed from the Date Selection Panel.
The bar graph displays amount of data transfer per device while the tabular report contains the following information:
• Device Name: Name of the device.• Device Type: Type of the device.• File count: Number of files per device.• Bytes: Amount of data transferred.
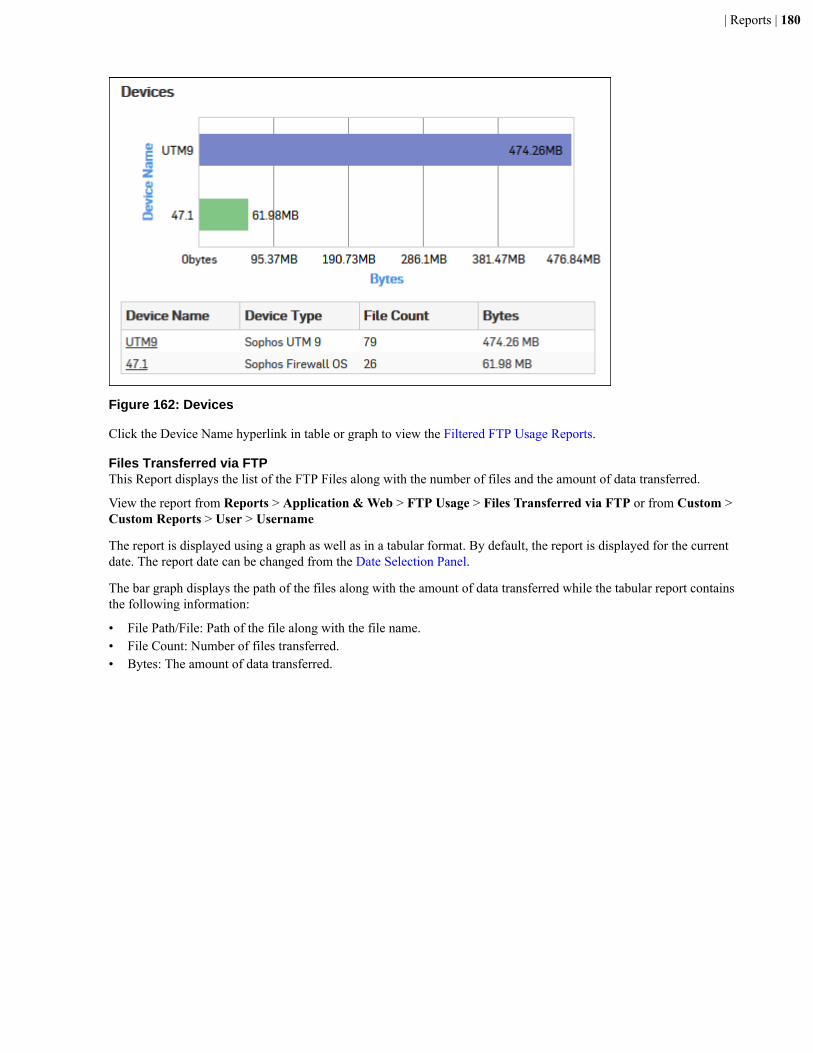
| Reports | 180
Figure 162: Devices
Click the Device Name hyperlink in table or graph to view the Filtered FTP Usage Reports.
Files Transferred via FTPThis Report displays the list of the FTP Files along with the number of files and the amount of data transferred.
View the report from Reports > Application & Web > FTP Usage > Files Transferred via FTP or from Custom >Custom Reports > User > Username
The report is displayed using a graph as well as in a tabular format. By default, the report is displayed for the currentdate. The report date can be changed from the Date Selection Panel.
The bar graph displays the path of the files along with the amount of data transferred while the tabular report containsthe following information:
• File Path/File: Path of the file along with the file name.• File Count: Number of files transferred.• Bytes: The amount of data transferred.
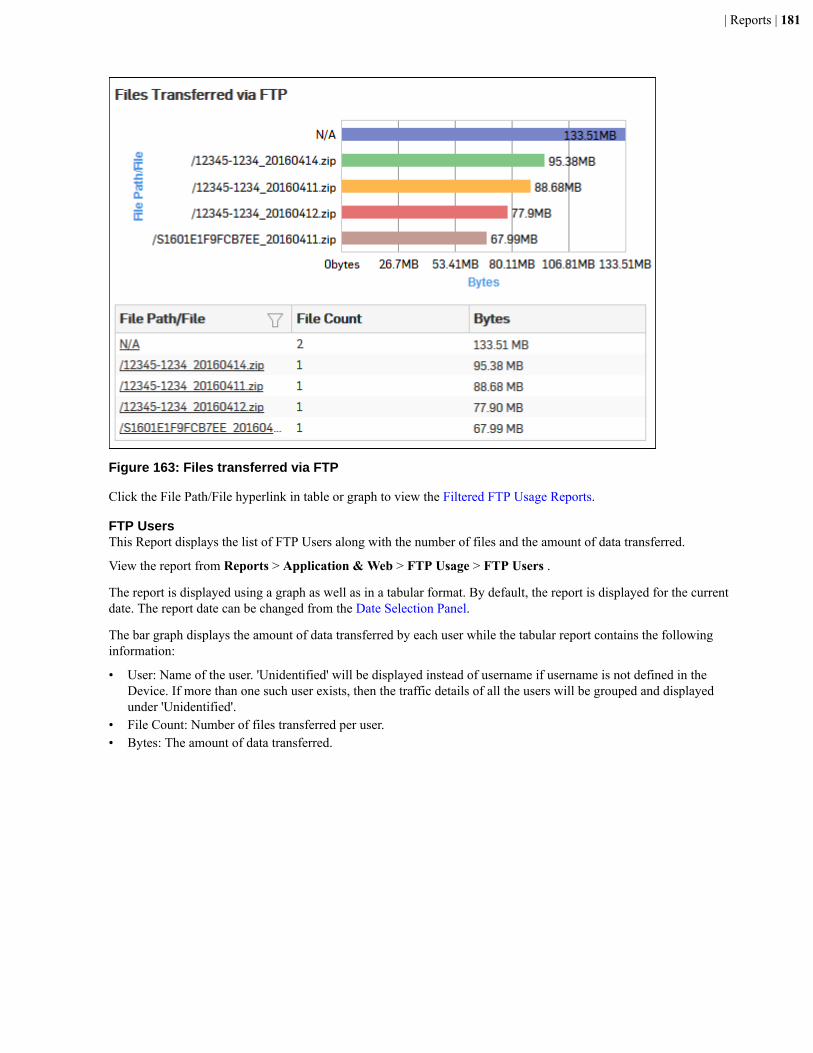
| Reports | 181
Figure 163: Files transferred via FTP
Click the File Path/File hyperlink in table or graph to view the Filtered FTP Usage Reports.
FTP UsersThis Report displays the list of FTP Users along with the number of files and the amount of data transferred.
View the report from Reports > Application & Web > FTP Usage > FTP Users .
The report is displayed using a graph as well as in a tabular format. By default, the report is displayed for the currentdate. The report date can be changed from the Date Selection Panel.
The bar graph displays the amount of data transferred by each user while the tabular report contains the followinginformation:
• User: Name of the user. 'Unidentified' will be displayed instead of username if username is not defined in theDevice. If more than one such user exists, then the traffic details of all the users will be grouped and displayedunder 'Unidentified'.
• File Count: Number of files transferred per user.• Bytes: The amount of data transferred.

| Reports | 182
Figure 164: FTP Users
Click the User hyperlink in table or graph to view the Filtered FTP Usage Reports.
FTP HostsThis Report displays the list of the Hosts along with the number of files and the amount of data transferred.
View the report from Reports > Application & Web > FTP Usage > FTP Hosts.
The report is displayed using a graph as well as in a tabular format. By default, the report is displayed for the currentdate. The report date can be changed from the Date Selection Panel.
The bar graph displays the amount of data transferred by each host while the tabular report contains the followinginformation:
• Host: Host IP Address through which the file is uploaded.• File Count: Number of files transferred per host.• Bytes: Amount of data transferred.
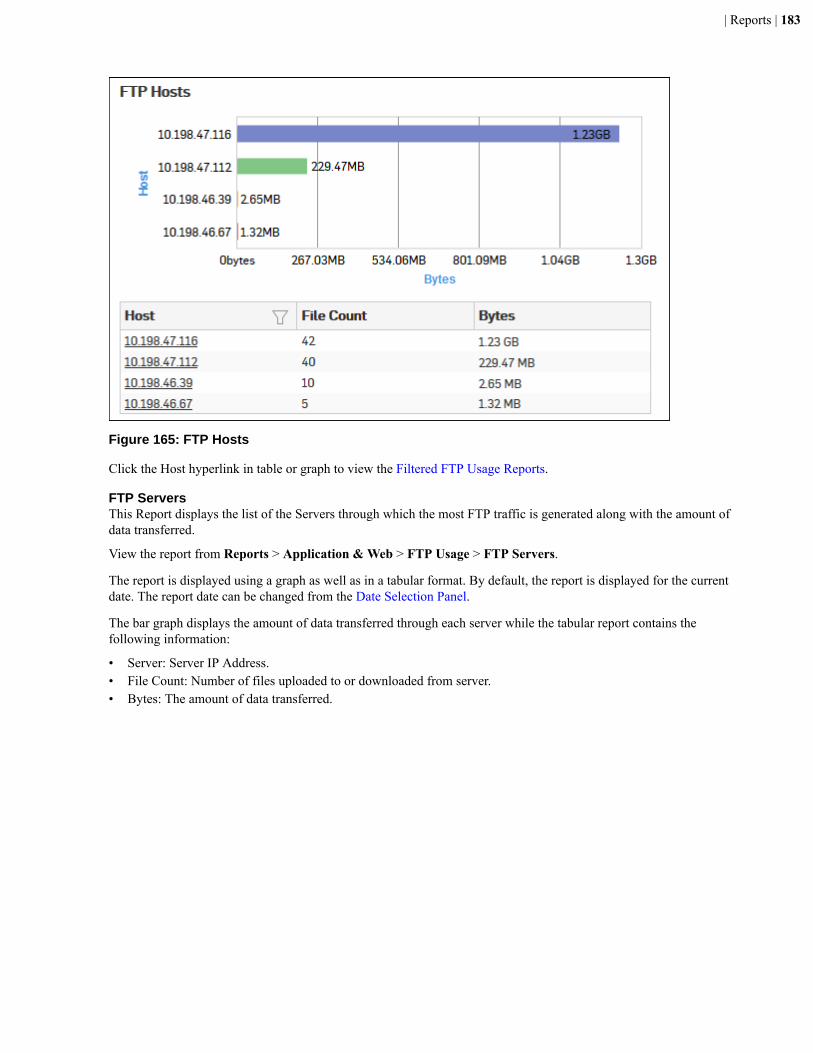
| Reports | 183
Figure 165: FTP Hosts
Click the Host hyperlink in table or graph to view the Filtered FTP Usage Reports.
FTP ServersThis Report displays the list of the Servers through which the most FTP traffic is generated along with the amount ofdata transferred.
View the report from Reports > Application & Web > FTP Usage > FTP Servers.
The report is displayed using a graph as well as in a tabular format. By default, the report is displayed for the currentdate. The report date can be changed from the Date Selection Panel.
The bar graph displays the amount of data transferred through each server while the tabular report contains thefollowing information:
• Server: Server IP Address.• File Count: Number of files uploaded to or downloaded from server.• Bytes: The amount of data transferred.
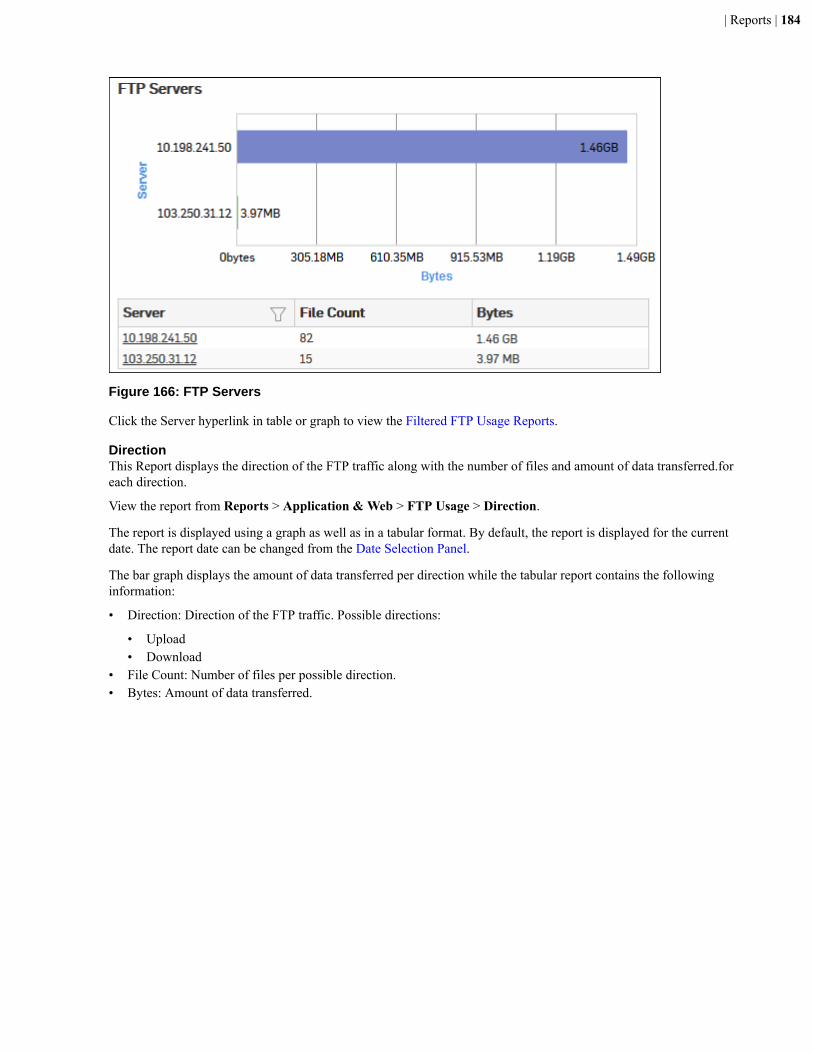
| Reports | 184
Figure 166: FTP Servers
Click the Server hyperlink in table or graph to view the Filtered FTP Usage Reports.
DirectionThis Report displays the direction of the FTP traffic along with the number of files and amount of data transferred.foreach direction.
View the report from Reports > Application & Web > FTP Usage > Direction.
The report is displayed using a graph as well as in a tabular format. By default, the report is displayed for the currentdate. The report date can be changed from the Date Selection Panel.
The bar graph displays the amount of data transferred per direction while the tabular report contains the followinginformation:
• Direction: Direction of the FTP traffic. Possible directions:
• Upload• Download
• File Count: Number of files per possible direction.• Bytes: Amount of data transferred.
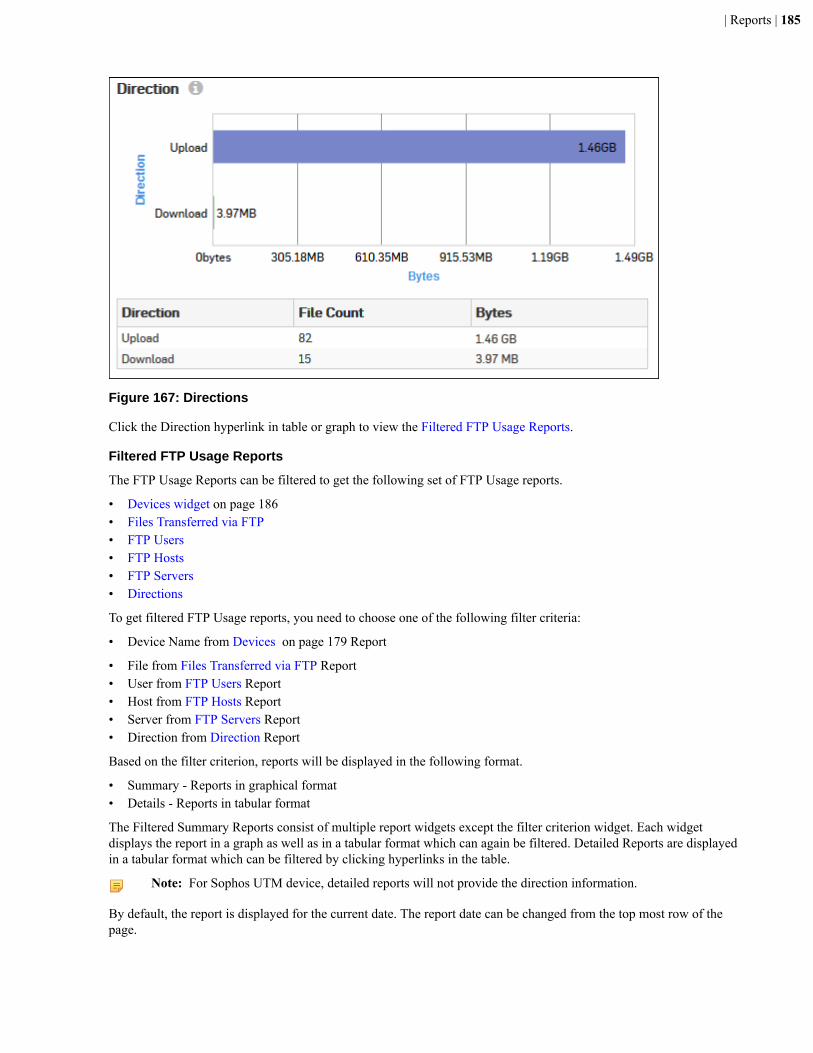
| Reports | 185
Figure 167: Directions
Click the Direction hyperlink in table or graph to view the Filtered FTP Usage Reports.
Filtered FTP Usage Reports
The FTP Usage Reports can be filtered to get the following set of FTP Usage reports.
• Devices widget on page 186• Files Transferred via FTP• FTP Users• FTP Hosts• FTP Servers• Directions
To get filtered FTP Usage reports, you need to choose one of the following filter criteria:
• Device Name from Devices on page 179 Report
• File from Files Transferred via FTP Report• User from FTP Users Report• Host from FTP Hosts Report• Server from FTP Servers Report• Direction from Direction Report
Based on the filter criterion, reports will be displayed in the following format.
• Summary - Reports in graphical format• Details - Reports in tabular format
The Filtered Summary Reports consist of multiple report widgets except the filter criterion widget. Each widgetdisplays the report in a graph as well as in a tabular format which can again be filtered. Detailed Reports are displayedin a tabular format which can be filtered by clicking hyperlinks in the table.
Note: For Sophos UTM device, detailed reports will not provide the direction information.
By default, the report is displayed for the current date. The report date can be changed from the top most row of thepage.

| Reports | 186
Devices widgetThis widget Report displays the Devices along with number of files and amount of data transfer.
Note: This widget will not be displayed for filter criterion Device Name.
The bar graph displays amount of data transfer per device while the tabular report contains the following information:
• Device Name: Name of the device.• Device Type: Type of the device.• File count: Number of files per device.• Bytes: Amount of data transferred.
Files Tansferred via FTP widgetThis Widget Report displays the list of FTP Files along with the number of files and the amount of data transferred.
Note: This widget will not be displayed for filter criterion File Path/File.
The bar graph displays the path of the files along with the amount of data transferred while the tabular report containsthe following information:
• File Path/File: Path of the file along with the file name.• File Count: Number of files transferred.• Bytes: The amount of data transferred.
FTP Users widgetThis Widget Report displays a list of FTP users along with the number of files and the amount of data transferred.
Note: This widget will not be displayed for filter criterion User.
The bar graph displays the amount of data uploaded by the users while the tabular report contains the followinginformation:
• Users: Name of the user. 'Unidentified' will be displayed instead of username if username is not defined in theDevice.
• File Count: Number of files transferred per user.• Bytes: The amount of data transferred.
FTP Hosts widgetThis Widget Report displays the amount of data transferred through each Host.
Note: This widget will not be displayed for filter criterion Host.
The bar graph displays the amount of data transferred by each host while the tabular report contains the followinginformation:
• Host: Hosts through which file is uploaded.• File Count: Number of files transferred per host.• Bytes: Amount of data uploaded.
FTP Servers widgetThis Widget Report displays the amount of data transfer through each server.
Note: This widget will not be displayed for filter criterion Server.
The bar graph displays the amount of data transferred through server while the tabular report contains the followinginformation:
• Server: IP Address of the FTP server.• File Count: Number of files uploaded to or downloaded from server.• Bytes: Amount of data downloaded.
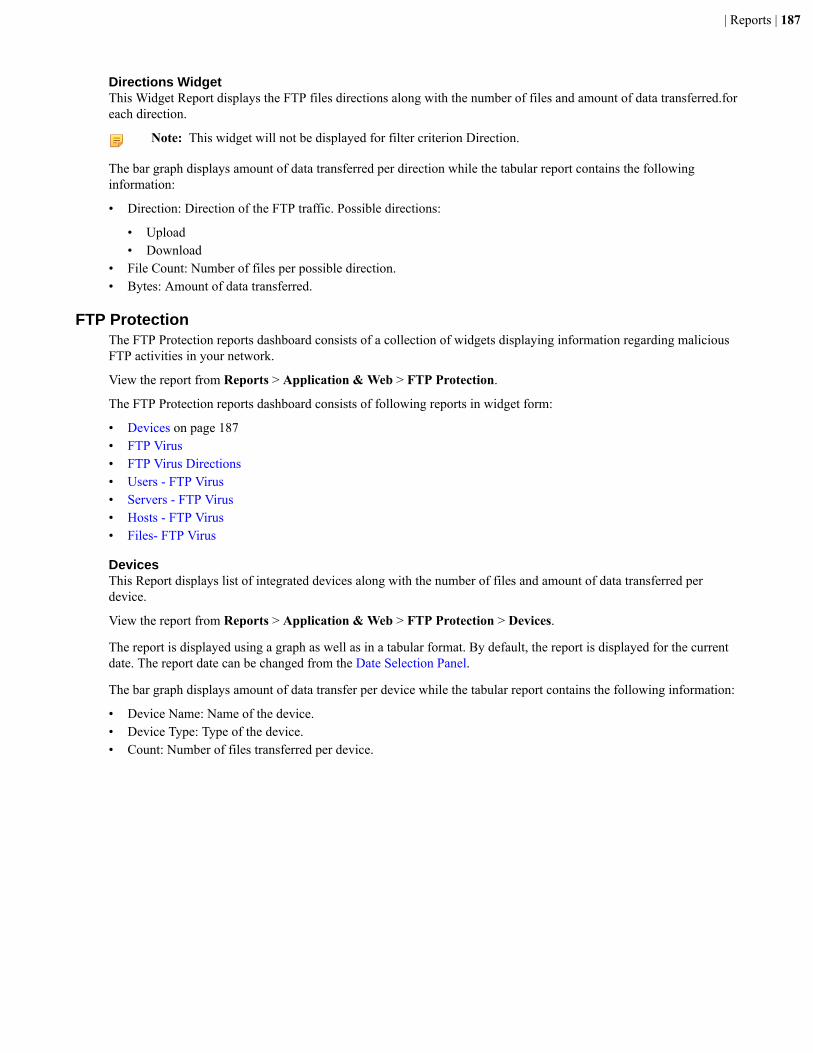
| Reports | 187
Directions WidgetThis Widget Report displays the FTP files directions along with the number of files and amount of data transferred.foreach direction.
Note: This widget will not be displayed for filter criterion Direction.
The bar graph displays amount of data transferred per direction while the tabular report contains the followinginformation:
• Direction: Direction of the FTP traffic. Possible directions:
• Upload• Download
• File Count: Number of files per possible direction.• Bytes: Amount of data transferred.
FTP ProtectionThe FTP Protection reports dashboard consists of a collection of widgets displaying information regarding maliciousFTP activities in your network.
View the report from Reports > Application & Web > FTP Protection.
The FTP Protection reports dashboard consists of following reports in widget form:
• Devices on page 187• FTP Virus• FTP Virus Directions• Users - FTP Virus• Servers - FTP Virus• Hosts - FTP Virus• Files- FTP Virus
DevicesThis Report displays list of integrated devices along with the number of files and amount of data transferred perdevice.
View the report from Reports > Application & Web > FTP Protection > Devices.
The report is displayed using a graph as well as in a tabular format. By default, the report is displayed for the currentdate. The report date can be changed from the Date Selection Panel.
The bar graph displays amount of data transfer per device while the tabular report contains the following information:
• Device Name: Name of the device.• Device Type: Type of the device.• Count: Number of files transferred per device.
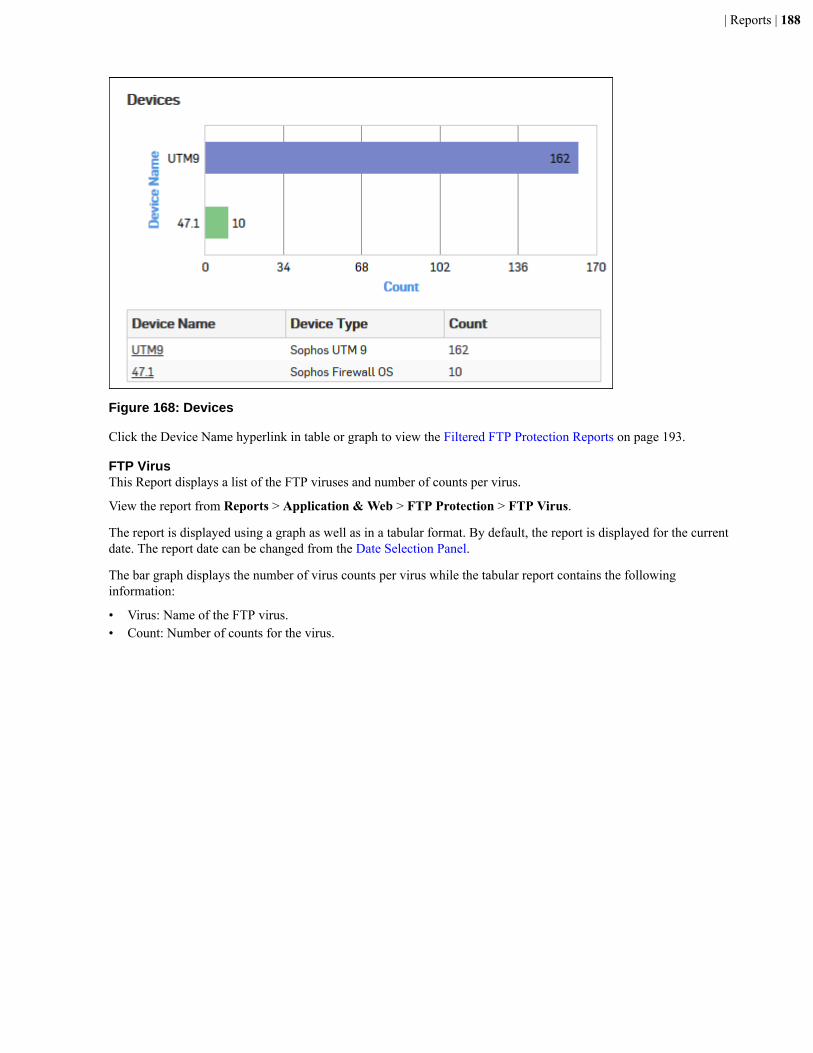
| Reports | 188
Figure 168: Devices
Click the Device Name hyperlink in table or graph to view the Filtered FTP Protection Reports on page 193.
FTP VirusThis Report displays a list of the FTP viruses and number of counts per virus.
View the report from Reports > Application & Web > FTP Protection > FTP Virus.
The report is displayed using a graph as well as in a tabular format. By default, the report is displayed for the currentdate. The report date can be changed from the Date Selection Panel.
The bar graph displays the number of virus counts per virus while the tabular report contains the followinginformation:
• Virus: Name of the FTP virus.• Count: Number of counts for the virus.
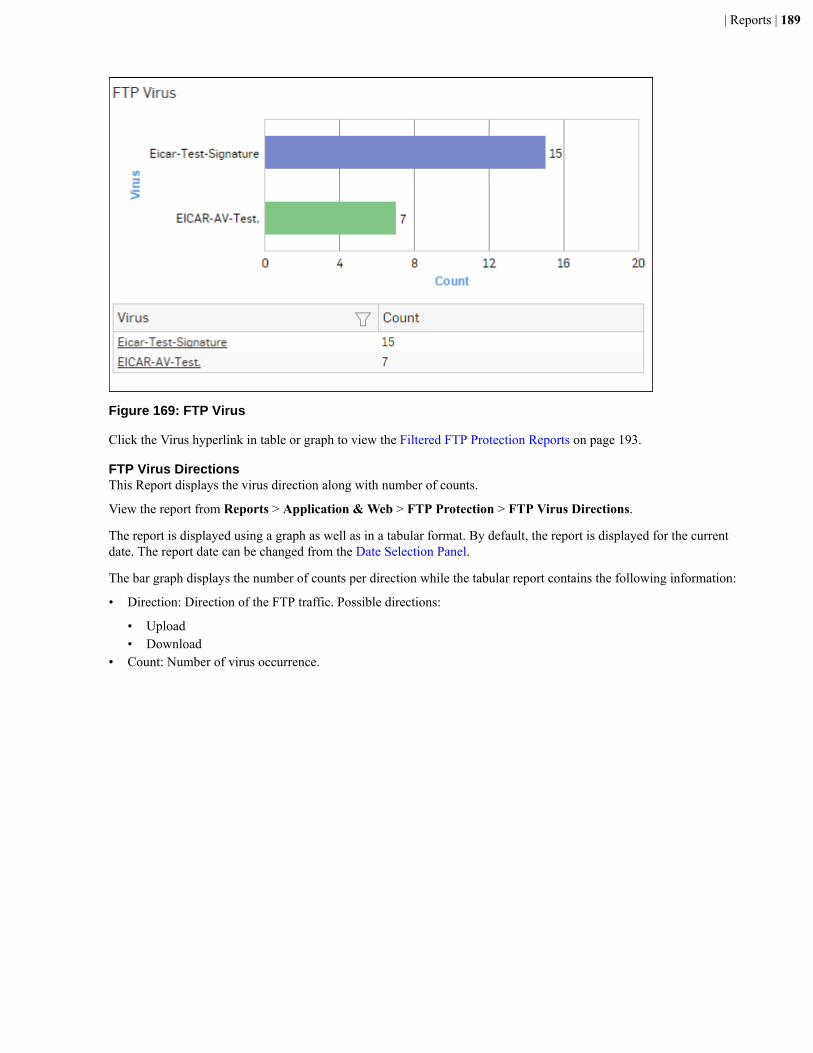
| Reports | 189
Figure 169: FTP Virus
Click the Virus hyperlink in table or graph to view the Filtered FTP Protection Reports on page 193.
FTP Virus DirectionsThis Report displays the virus direction along with number of counts.
View the report from Reports > Application & Web > FTP Protection > FTP Virus Directions.
The report is displayed using a graph as well as in a tabular format. By default, the report is displayed for the currentdate. The report date can be changed from the Date Selection Panel.
The bar graph displays the number of counts per direction while the tabular report contains the following information:
• Direction: Direction of the FTP traffic. Possible directions:
• Upload• Download
• Count: Number of virus occurrence.
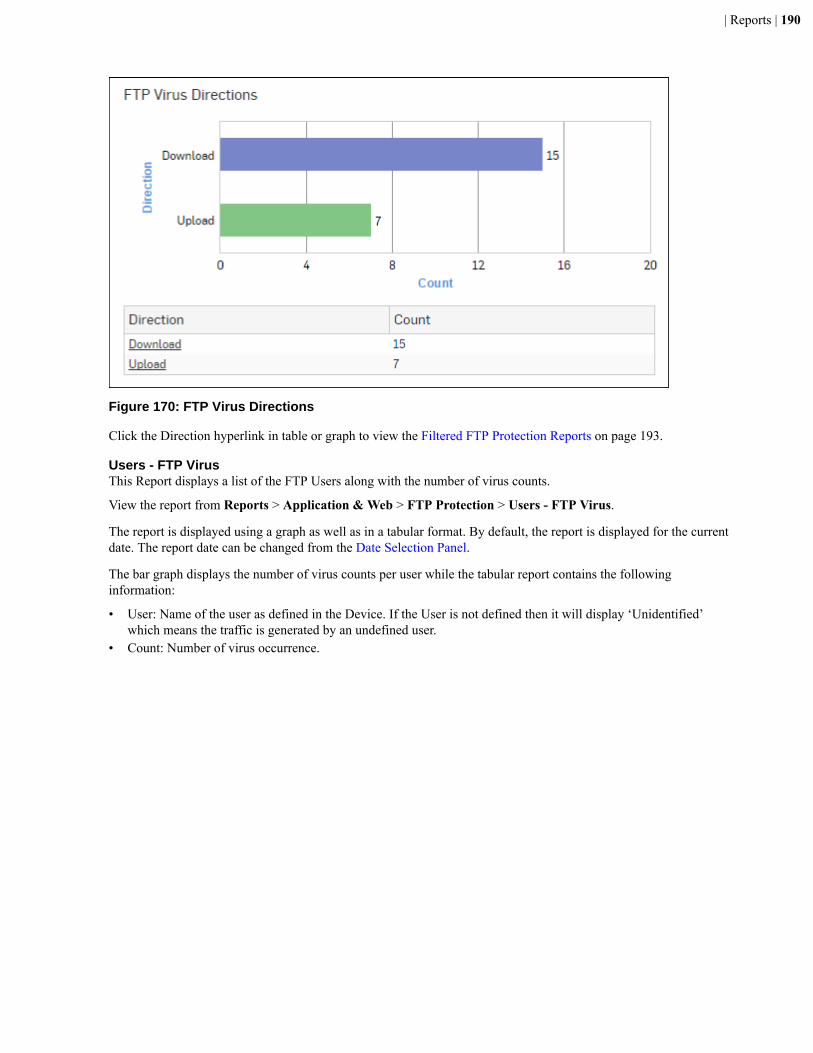
| Reports | 190
Figure 170: FTP Virus Directions
Click the Direction hyperlink in table or graph to view the Filtered FTP Protection Reports on page 193.
Users - FTP VirusThis Report displays a list of the FTP Users along with the number of virus counts.
View the report from Reports > Application & Web > FTP Protection > Users - FTP Virus.
The report is displayed using a graph as well as in a tabular format. By default, the report is displayed for the currentdate. The report date can be changed from the Date Selection Panel.
The bar graph displays the number of virus counts per user while the tabular report contains the followinginformation:
• User: Name of the user as defined in the Device. If the User is not defined then it will display ‘Unidentified’which means the traffic is generated by an undefined user.
• Count: Number of virus occurrence.
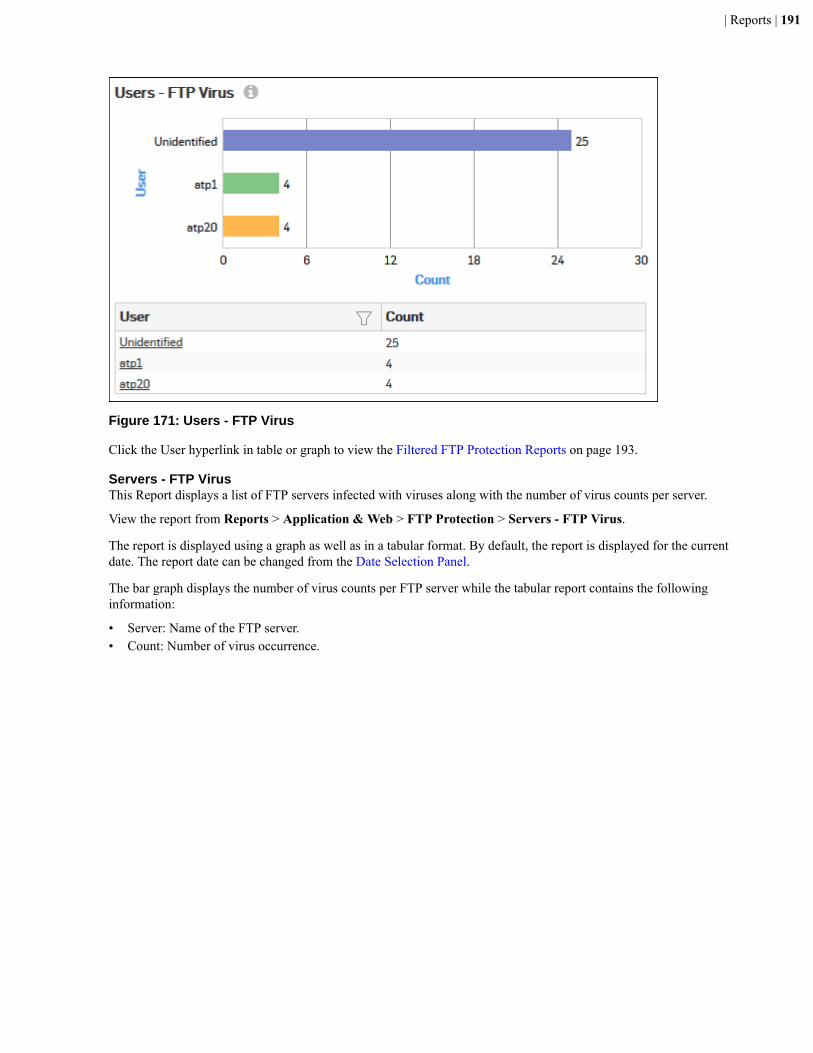
| Reports | 191
Figure 171: Users - FTP Virus
Click the User hyperlink in table or graph to view the Filtered FTP Protection Reports on page 193.
Servers - FTP VirusThis Report displays a list of FTP servers infected with viruses along with the number of virus counts per server.
View the report from Reports > Application & Web > FTP Protection > Servers - FTP Virus.
The report is displayed using a graph as well as in a tabular format. By default, the report is displayed for the currentdate. The report date can be changed from the Date Selection Panel.
The bar graph displays the number of virus counts per FTP server while the tabular report contains the followinginformation:
• Server: Name of the FTP server.• Count: Number of virus occurrence.
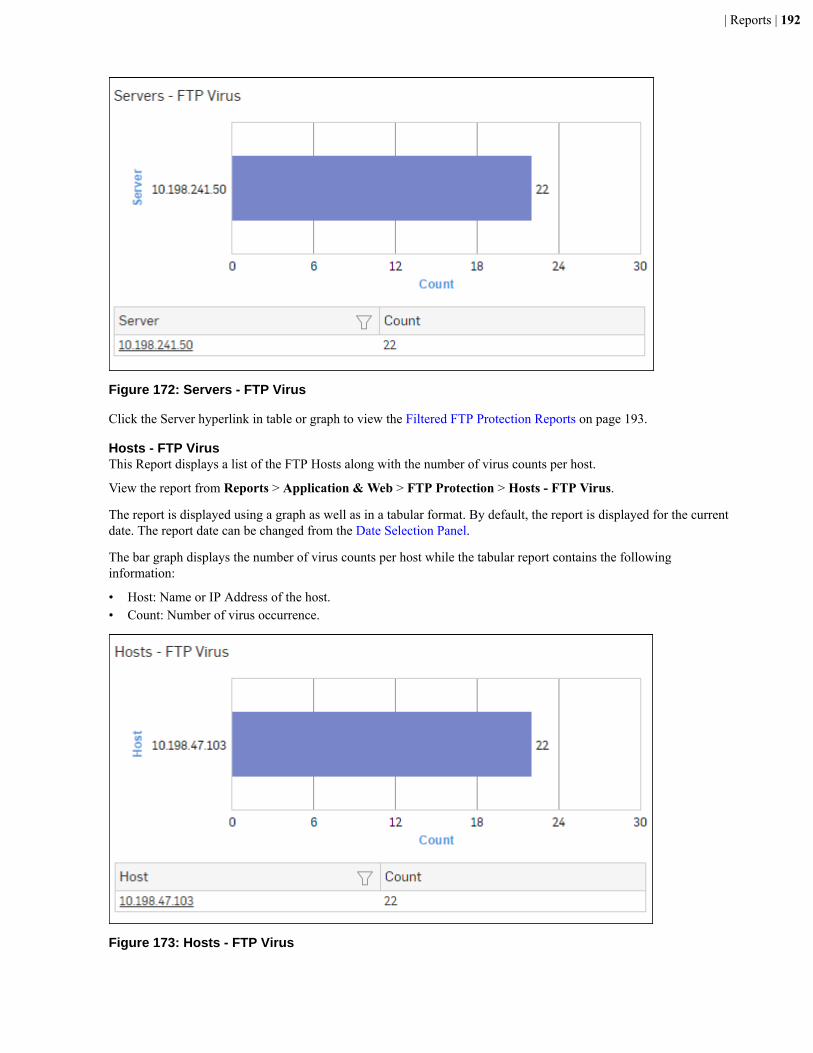
| Reports | 192
Figure 172: Servers - FTP Virus
Click the Server hyperlink in table or graph to view the Filtered FTP Protection Reports on page 193.
Hosts - FTP VirusThis Report displays a list of the FTP Hosts along with the number of virus counts per host.
View the report from Reports > Application & Web > FTP Protection > Hosts - FTP Virus.
The report is displayed using a graph as well as in a tabular format. By default, the report is displayed for the currentdate. The report date can be changed from the Date Selection Panel.
The bar graph displays the number of virus counts per host while the tabular report contains the followinginformation:
• Host: Name or IP Address of the host.• Count: Number of virus occurrence.
Figure 173: Hosts - FTP Virus
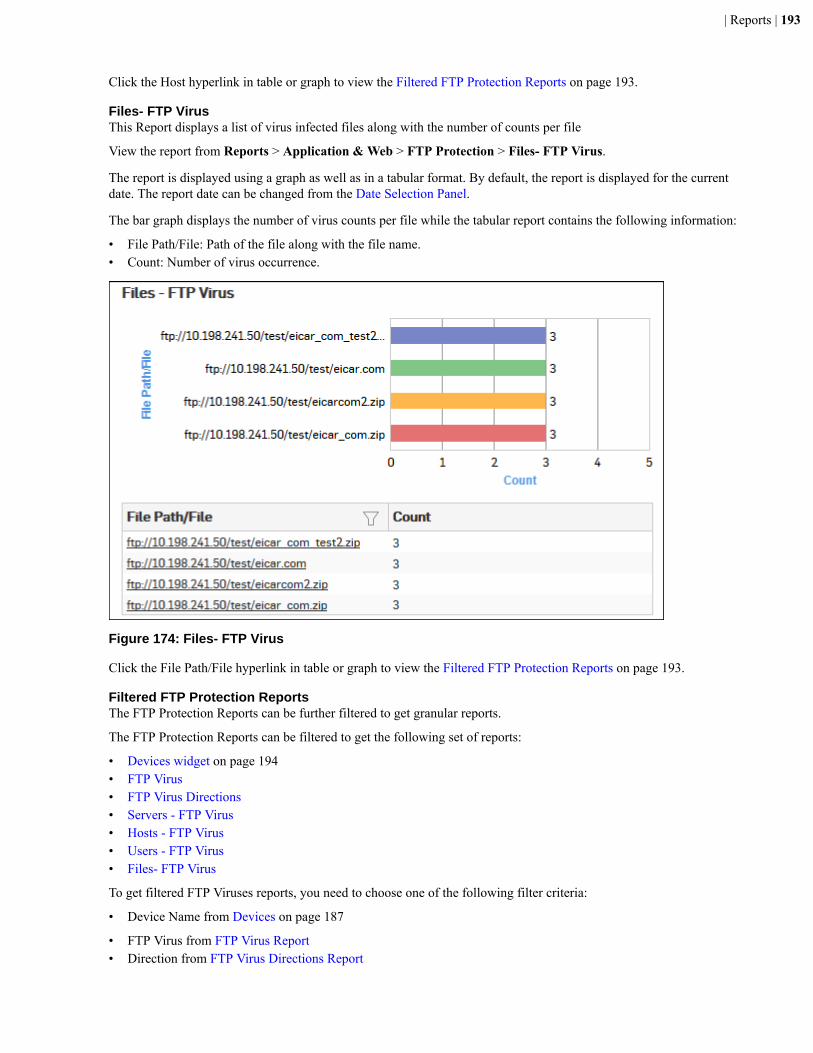
| Reports | 193
Click the Host hyperlink in table or graph to view the Filtered FTP Protection Reports on page 193.
Files- FTP VirusThis Report displays a list of virus infected files along with the number of counts per file
View the report from Reports > Application & Web > FTP Protection > Files- FTP Virus.
The report is displayed using a graph as well as in a tabular format. By default, the report is displayed for the currentdate. The report date can be changed from the Date Selection Panel.
The bar graph displays the number of virus counts per file while the tabular report contains the following information:
• File Path/File: Path of the file along with the file name.• Count: Number of virus occurrence.
Figure 174: Files- FTP Virus
Click the File Path/File hyperlink in table or graph to view the Filtered FTP Protection Reports on page 193.
Filtered FTP Protection ReportsThe FTP Protection Reports can be further filtered to get granular reports.
The FTP Protection Reports can be filtered to get the following set of reports:
• Devices widget on page 194• FTP Virus• FTP Virus Directions• Servers - FTP Virus• Hosts - FTP Virus• Users - FTP Virus• Files- FTP Virus
To get filtered FTP Viruses reports, you need to choose one of the following filter criteria:
• Device Name from Devices on page 187
• FTP Virus from FTP Virus Report• Direction from FTP Virus Directions Report
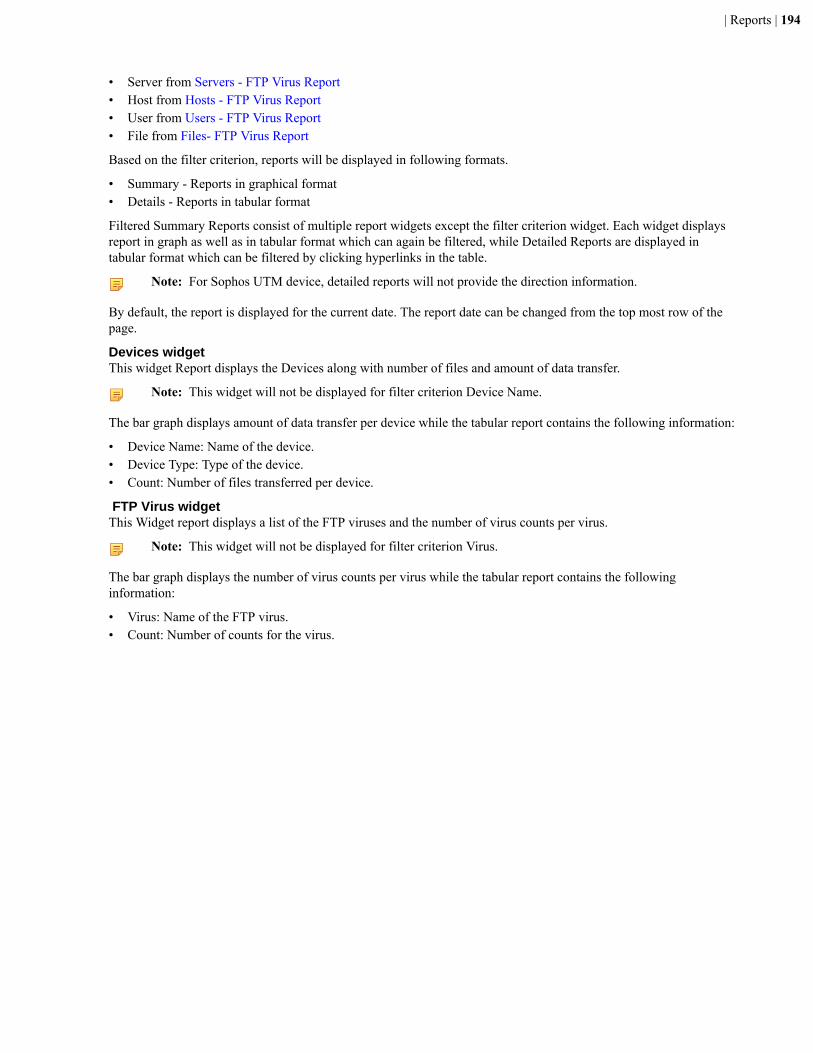
| Reports | 194
• Server from Servers - FTP Virus Report• Host from Hosts - FTP Virus Report• User from Users - FTP Virus Report• File from Files- FTP Virus Report
Based on the filter criterion, reports will be displayed in following formats.
• Summary - Reports in graphical format• Details - Reports in tabular format
Filtered Summary Reports consist of multiple report widgets except the filter criterion widget. Each widget displaysreport in graph as well as in tabular format which can again be filtered, while Detailed Reports are displayed intabular format which can be filtered by clicking hyperlinks in the table.
Note: For Sophos UTM device, detailed reports will not provide the direction information.
By default, the report is displayed for the current date. The report date can be changed from the top most row of thepage.
Devices widgetThis widget Report displays the Devices along with number of files and amount of data transfer.
Note: This widget will not be displayed for filter criterion Device Name.
The bar graph displays amount of data transfer per device while the tabular report contains the following information:
• Device Name: Name of the device.• Device Type: Type of the device.• Count: Number of files transferred per device.
FTP Virus widgetThis Widget report displays a list of the FTP viruses and the number of virus counts per virus.
Note: This widget will not be displayed for filter criterion Virus.
The bar graph displays the number of virus counts per virus while the tabular report contains the followinginformation:
• Virus: Name of the FTP virus.• Count: Number of counts for the virus.
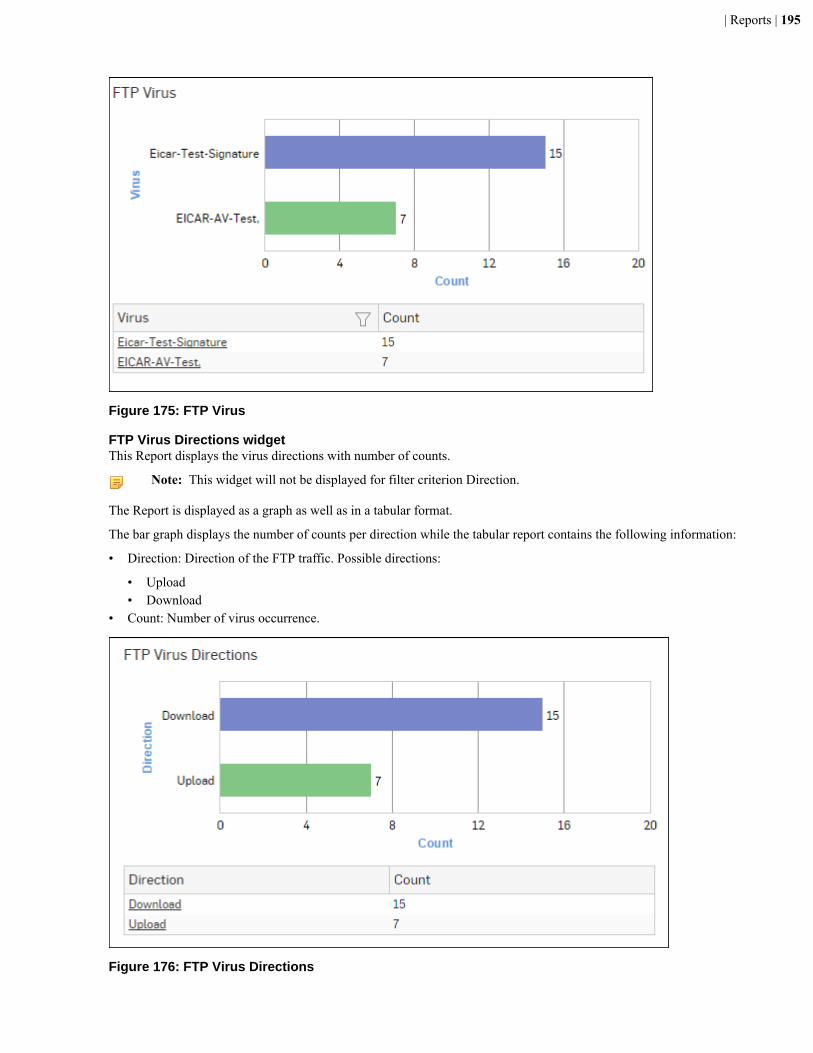
| Reports | 195
Figure 175: FTP Virus
FTP Virus Directions widgetThis Report displays the virus directions with number of counts.
Note: This widget will not be displayed for filter criterion Direction.
The Report is displayed as a graph as well as in a tabular format.
The bar graph displays the number of counts per direction while the tabular report contains the following information:
• Direction: Direction of the FTP traffic. Possible directions:
• Upload• Download
• Count: Number of virus occurrence.
Figure 176: FTP Virus Directions
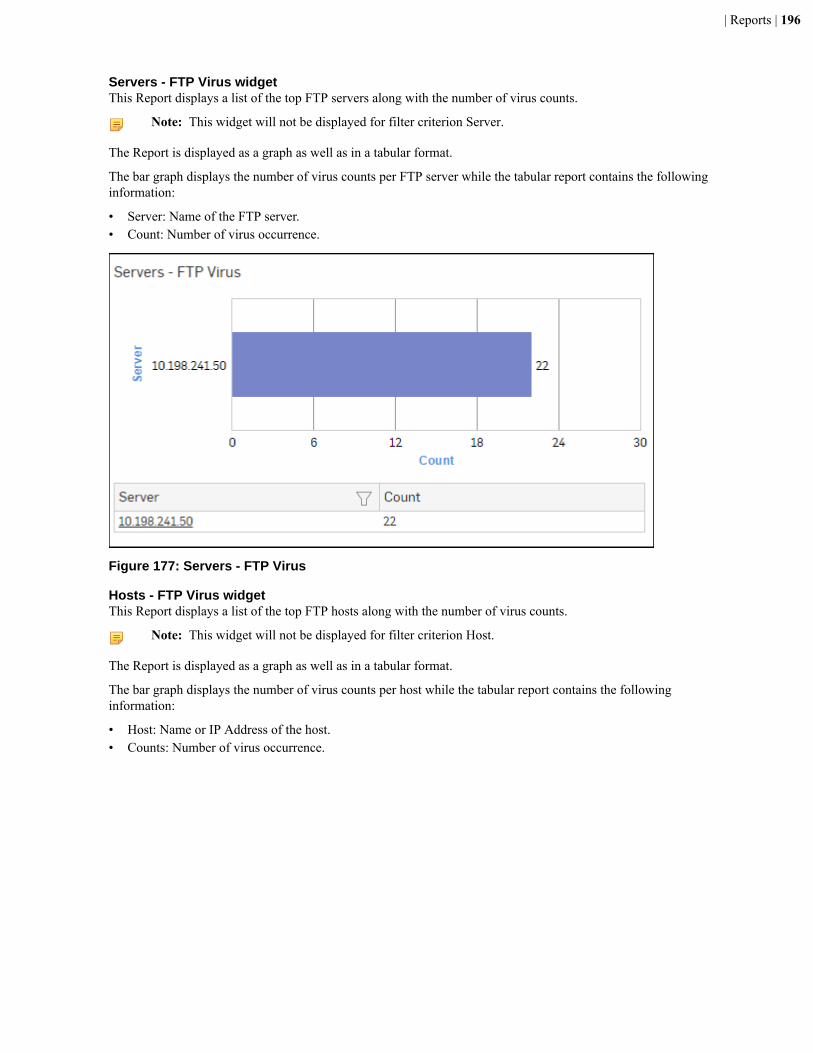
| Reports | 196
Servers - FTP Virus widgetThis Report displays a list of the top FTP servers along with the number of virus counts.
Note: This widget will not be displayed for filter criterion Server.
The Report is displayed as a graph as well as in a tabular format.
The bar graph displays the number of virus counts per FTP server while the tabular report contains the followinginformation:
• Server: Name of the FTP server.• Count: Number of virus occurrence.
Figure 177: Servers - FTP Virus
Hosts - FTP Virus widgetThis Report displays a list of the top FTP hosts along with the number of virus counts.
Note: This widget will not be displayed for filter criterion Host.
The Report is displayed as a graph as well as in a tabular format.
The bar graph displays the number of virus counts per host while the tabular report contains the followinginformation:
• Host: Name or IP Address of the host.• Counts: Number of virus occurrence.
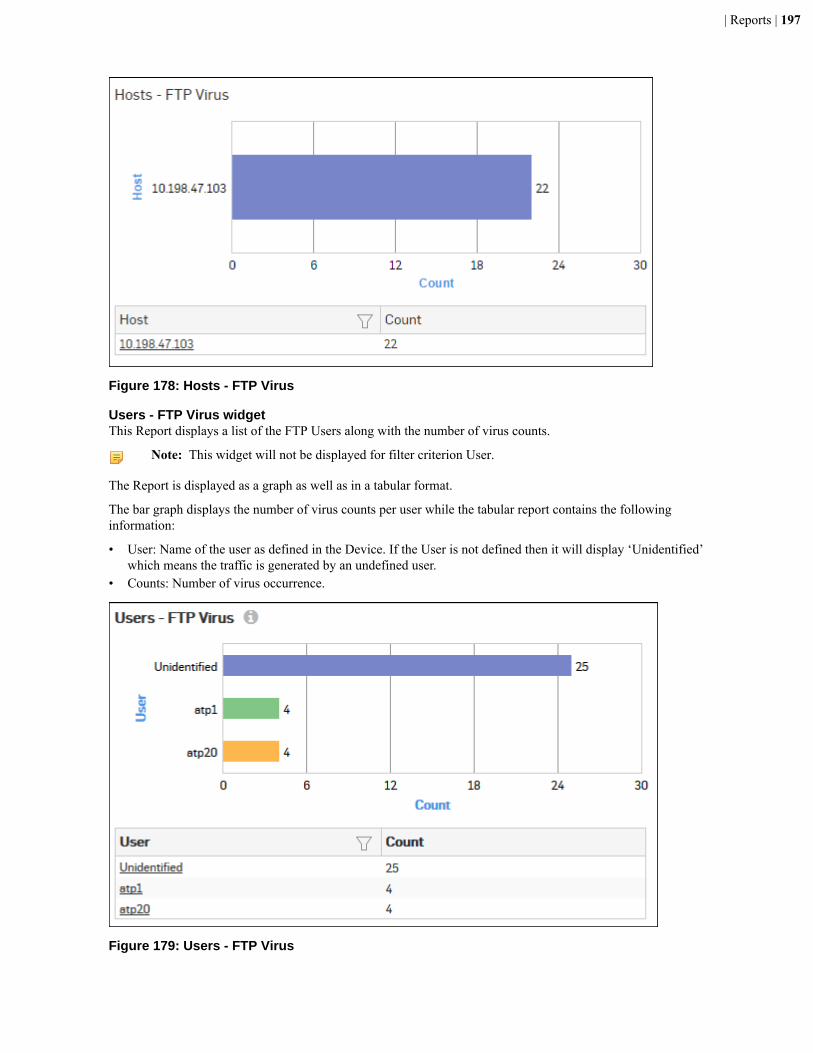
| Reports | 197
Figure 178: Hosts - FTP Virus
Users - FTP Virus widgetThis Report displays a list of the FTP Users along with the number of virus counts.
Note: This widget will not be displayed for filter criterion User.
The Report is displayed as a graph as well as in a tabular format.
The bar graph displays the number of virus counts per user while the tabular report contains the followinginformation:
• User: Name of the user as defined in the Device. If the User is not defined then it will display ‘Unidentified’which means the traffic is generated by an undefined user.
• Counts: Number of virus occurrence.
Figure 179: Users - FTP Virus
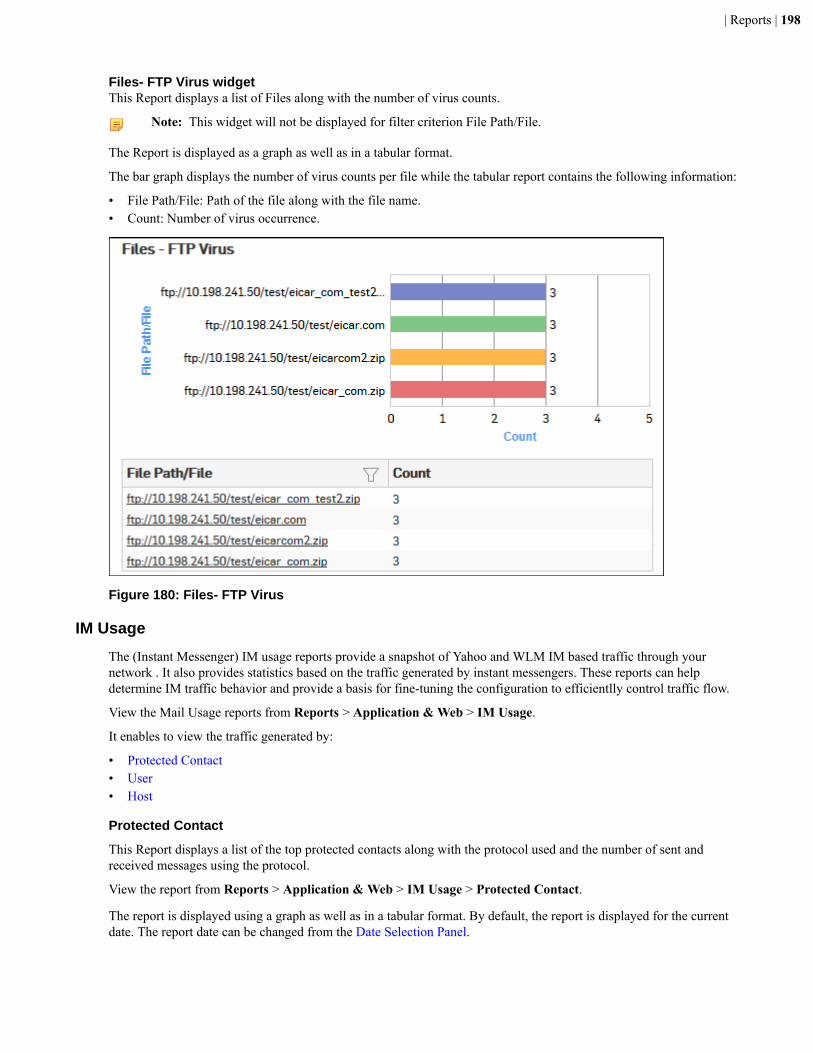
| Reports | 198
Files- FTP Virus widgetThis Report displays a list of Files along with the number of virus counts.
Note: This widget will not be displayed for filter criterion File Path/File.
The Report is displayed as a graph as well as in a tabular format.
The bar graph displays the number of virus counts per file while the tabular report contains the following information:
• File Path/File: Path of the file along with the file name.• Count: Number of virus occurrence.
Figure 180: Files- FTP Virus
IM Usage
The (Instant Messenger) IM usage reports provide a snapshot of Yahoo and WLM IM based traffic through yournetwork . It also provides statistics based on the traffic generated by instant messengers. These reports can helpdetermine IM traffic behavior and provide a basis for fine-tuning the configuration to efficientlly control traffic flow.
View the Mail Usage reports from Reports > Application & Web > IM Usage.
It enables to view the traffic generated by:
• Protected Contact• User• Host
Protected Contact
This Report displays a list of the top protected contacts along with the protocol used and the number of sent andreceived messages using the protocol.
View the report from Reports > Application & Web > IM Usage > Protected Contact.
The report is displayed using a graph as well as in a tabular format. By default, the report is displayed for the currentdate. The report date can be changed from the Date Selection Panel.
| Reports | 199
The bar graph displays the total number of IM messages sent and received by each protected contact while the tabularreport contains the following information:
• Protected Contact: IM Username of the user who is protected and whose Internet traffic is passing through theDevice.
• Protocol: Name of IM protocol. IM usage reports are provided for Yahoo and WLM instant messengers.• #Messages: Total number of IM messages sent and received by the protected contact.
Click the Protected Contact hyperlink in table or graph to view the Filtered User Data Transfer Reports on page177.
User
This Report displays a list of the top IM Users along with the number of sent and received messages from that user.
View the report from Reports > Application & Web > IM Usage > User.
The report is displayed using a graph as well as in a tabular format. By default, the report is displayed for the currentdate. The report date can be changed from the Date Selection Panel.
The bar graph displays the total number of IM messages sent and received by each user while the tabular reportcontains the following information:
• User: IM Username of the user whose Internet traffic is passing through the Device.• #Messages: Total number of IM messages sent and received by the user.
Click the User hyperlink in table or graph to view the Filtered User Data Transfer Reports on page 177.
Host
This Report displays a list of the top Hosts using IM along with the number of sent and received messages from thathost.
View the report from Reports > Application & Web > IM Usage > Host.
The report is displayed using a graph as well as in a tabular format. By default, the report is displayed for the currentdate. The report date can be changed from the Date Selection Panel.
The bar graph displays the total number of IM messages sent and received by each host while the tabular reportcontains the following information:
• Host: IP Address of the host using IM and whose Internet traffic is passing through the Device.• #Messages: Total number of IM messages sent and received by the host.
Click the Host hyperlink in table or graph to view the Filtered User Data Transfer Reports on page 177.
Filtered IM Usage Reports
The IM Usage Reports can be filtered to get the following set of IM Usage reports.
• User• Host• Protected Contact• Protocol• Conversation• Files Sent• Files Received• Webcam Request Sent• Webcam Request Received
To get filtered IM Usage reports, you need to choose one of the following filter criteria:
• Protected Contact from Protected Contact Report
| Reports | 200
• User from User Report• Host from Host Report
Based on the filter criterion, reports will be displayed in the following format.
• Summary - Reports in graphical format• Details - Reports in tabular format
The Filtered Summary Reports consist of multiple report widgets except the filter criterion widget. Each widgetdisplays the report in a graph as well as in a tabular format which can again be filtered. Detailed Reports are displayedin a tabular format which can be filtered by clicking hyperlinks in the table.
By default, the report is displayed for the current date. The report date can be changed from the Date Selection Panel.
User widget
This Widget Report displays a list of top IM Users along with the number of sent and received messages from thatuser.
Note: This widget will not be displayed for filter criterion User.
The bar graph displays the total number of IM messages sent and received by each user while the tabular reportcontains the following information:
• User: IM Username of the user whose Internet traffic is passing through the Device.• #Messages: Total number of IM messages sent and received by the user.
Host widget
This Widget Report displays a list of the top Hosts using IM along with the number of sent and received messagesfrom that host.
Note: This widget will not be displayed for filter criterion Host.
The bar graph displays the total number of IM messages sent and received by each host while the tabular reportcontains the following information:
• Host: IP Address of the host using IM and whose Internet traffic is passing through the Device.• #Messages: Total number of IM messages sent and received by the host.
Protected Contact widget
This Widget Report displays a list of the top protected contacts along with the protocol used and the number of sentand received messages using the protocol.
Note: This widget will not be displayed for filter criterion Protected Contact.
The bar graph displays the total number of IM messages sent and received by each protected contact while the tabularreport contains the following information:
• Protected Contact: IM Username of the user who is protected and whose Internet traffic is passing through theDevice.
• Protocol: Name of IM protocol. IM usage reports are provided for Yahoo and WLM instant messengers.• #Messages: Total number of IM messages sent and received by the protected contact.
Protocol widget
This Widget Report displays a list of the protocols along with the number of messages for the protocol.
Note: This widget will not be displayed for filter criterion Protocol.
The bar graph displays number of messages for a particular protocol while the tabular report contains the followinginformation:
• Protocol: Name of IM protocol. Possible protocols: Yahoo or MSN
| Reports | 201
• #Messages: Total number of messages.
Conversations widget
This Widget Report displays a list of the peer contacts and total the number of sent and the received message for theconversation.
The bar graph displays the IM username of the peer contact and the total number of IM messages for the peer contactwhile the tabular report contains the following information:
• Peer Contact: IM Username of Peer contact.• #Messages: Total number of IM messages.
Files Sent widget
This Widget Report displays a list of Top Files Sent along with the recipient and the number of times the file has beensent.
The bar graph displays the number of times the file has been sent while the tabular report contains the followinginformation:
• File Name: Name of the file.• Sent to: IM username of the file recipient.• #Count: Number of times the file has been sent.
Files Received widget
This Widget Report displays a list of the Files Received along with the sender and number of times the file has beenreceived.
The bar graph displays the number of times the file has been received while the tabular report contains the followinginformation:
• File Name: Name of the file.• Received from: IM username of the file sender.• #Count: Number of times the file has been received.
Webcam Request Sent widget
This Widget Report displays a list of the recipients of webcam request along with the number of webcam requests.
The bar graph displays number of webcam requests to a particular recipient while the tabular report contains thefollowing information:
• Request sent to: IM username of the webcam request recipient.• #Messages: Number of webcam requests.
Webcam Requests Received widget
This Widget Report displays a list of the sender of webcam request along with the number of webcam requests.
The bar graph displays the number of webcam requests from a particular sender while the tabular report contains thefollowing information:
• Request sent from: IM username of the webcam request sender.• #Messages: Number of webcam requests.
Blocked IM Attempts
The Blocked IM Attempts Reports gives an insight about the unsuccessful attempts made by users to access Yahooand WLM instant messengers WLM instant messengers.
View Blocked IM Reports from Reports > Application & Web > Blocked IM Attempts.
It enables to view traffic generated by:
• Blocked Protected Contact
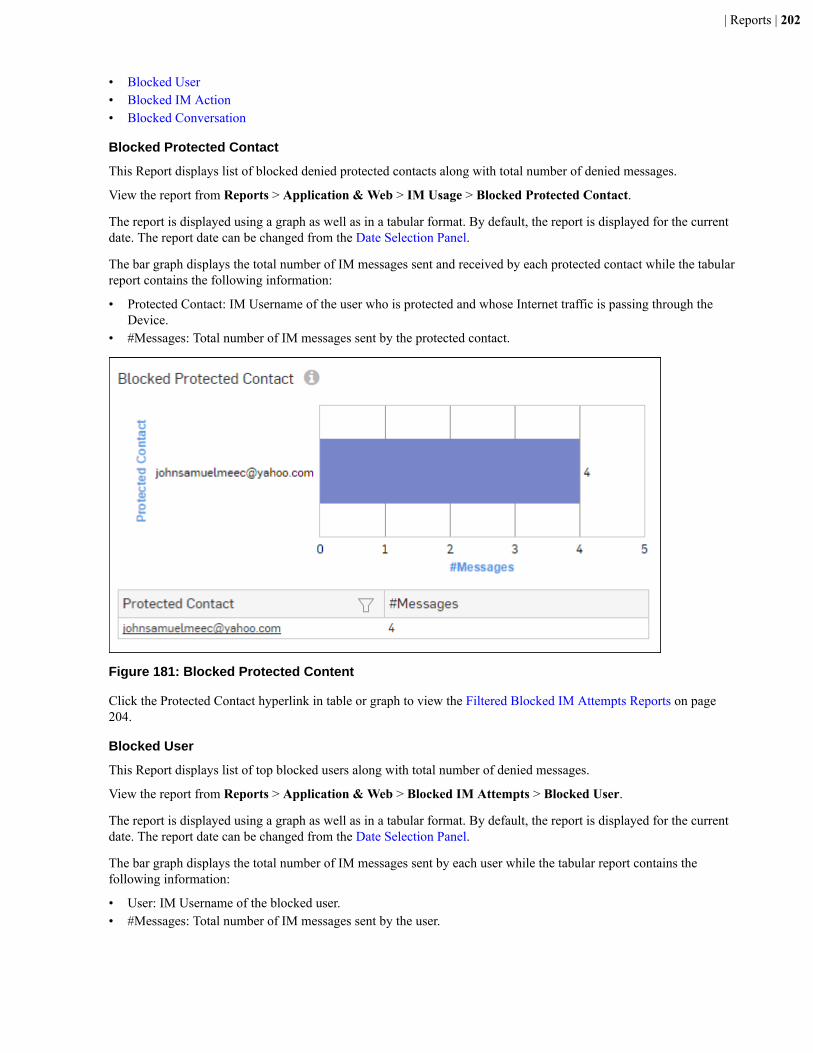
| Reports | 202
• Blocked User• Blocked IM Action• Blocked Conversation
Blocked Protected Contact
This Report displays list of blocked denied protected contacts along with total number of denied messages.
View the report from Reports > Application & Web > IM Usage > Blocked Protected Contact.
The report is displayed using a graph as well as in a tabular format. By default, the report is displayed for the currentdate. The report date can be changed from the Date Selection Panel.
The bar graph displays the total number of IM messages sent and received by each protected contact while the tabularreport contains the following information:
• Protected Contact: IM Username of the user who is protected and whose Internet traffic is passing through theDevice.
• #Messages: Total number of IM messages sent by the protected contact.
Figure 181: Blocked Protected Content
Click the Protected Contact hyperlink in table or graph to view the Filtered Blocked IM Attempts Reports on page204.
Blocked User
This Report displays list of top blocked users along with total number of denied messages.
View the report from Reports > Application & Web > Blocked IM Attempts > Blocked User.
The report is displayed using a graph as well as in a tabular format. By default, the report is displayed for the currentdate. The report date can be changed from the Date Selection Panel.
The bar graph displays the total number of IM messages sent by each user while the tabular report contains thefollowing information:
• User: IM Username of the blocked user.• #Messages: Total number of IM messages sent by the user.
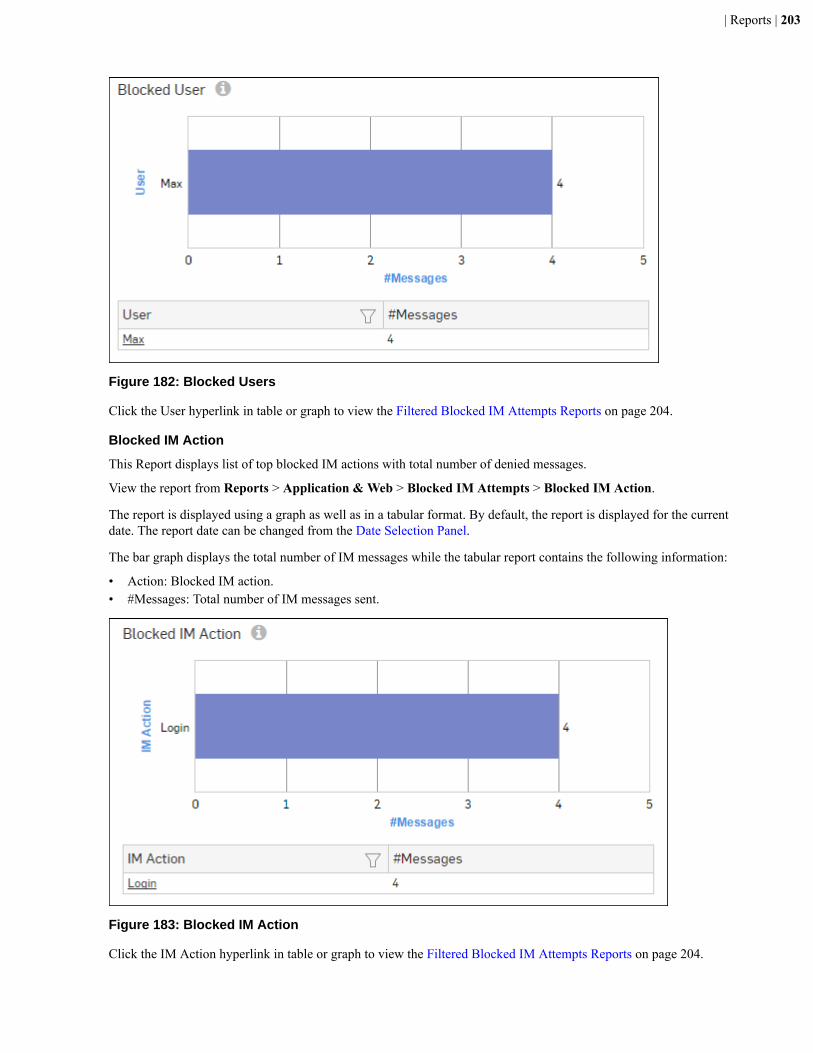
| Reports | 203
Figure 182: Blocked Users
Click the User hyperlink in table or graph to view the Filtered Blocked IM Attempts Reports on page 204.
Blocked IM Action
This Report displays list of top blocked IM actions with total number of denied messages.
View the report from Reports > Application & Web > Blocked IM Attempts > Blocked IM Action.
The report is displayed using a graph as well as in a tabular format. By default, the report is displayed for the currentdate. The report date can be changed from the Date Selection Panel.
The bar graph displays the total number of IM messages while the tabular report contains the following information:
• Action: Blocked IM action.• #Messages: Total number of IM messages sent.
Figure 183: Blocked IM Action
Click the IM Action hyperlink in table or graph to view the Filtered Blocked IM Attempts Reports on page 204.

| Reports | 204
Blocked Conversation
This Report displays list of top blocked conversations with total number of denied messages.
View the report from Reports > Application & Web > Blocked IM Attempts > Blocked Conversation.
The report is displayed using a graph as well as in a tabular format. By default, the report is displayed for the currentdate. The report date can be changed from the Date Selection Panel.
The bar graph displays the total number of IM messages while the tabular report contains the following information:
• Peer Contact: The contact with whom conversation is blocked.• #Messages: Total number of IM messages sent.
Figure 184: Blocked Conversation
Click the Peer Contact hyperlink in table or graph to view the Filtered Blocked IM Attempts Reports on page 204.
Filtered Blocked IM Attempts Reports
The IM Usage Reports can be filtered to get the following set of IM Usage reports.
• Blocked Protected Contact• Blocked User• Blocked IM Action• Blocked Conversation
To get filtered IM Usage reports, you need to choose one of the following filter criteria:
• Protected Contact from Blocked Protected Contact Report• User from Blocked User Report• IM Action from Blocked IM Action• Peer Contact from Blocked Conversation
Based on the filter criterion, reports will be displayed in the following format.
• Summary - Reports in graphical format• Details - Reports in tabular format
The Filtered Summary Reports consist of multiple report widgets except the filter criterion widget. Each widgetdisplays the report in a graph as well as in a tabular format which can again be filtered. Detailed Reports are displayedin a tabular format which can be filtered by clicking hyperlinks in the table.
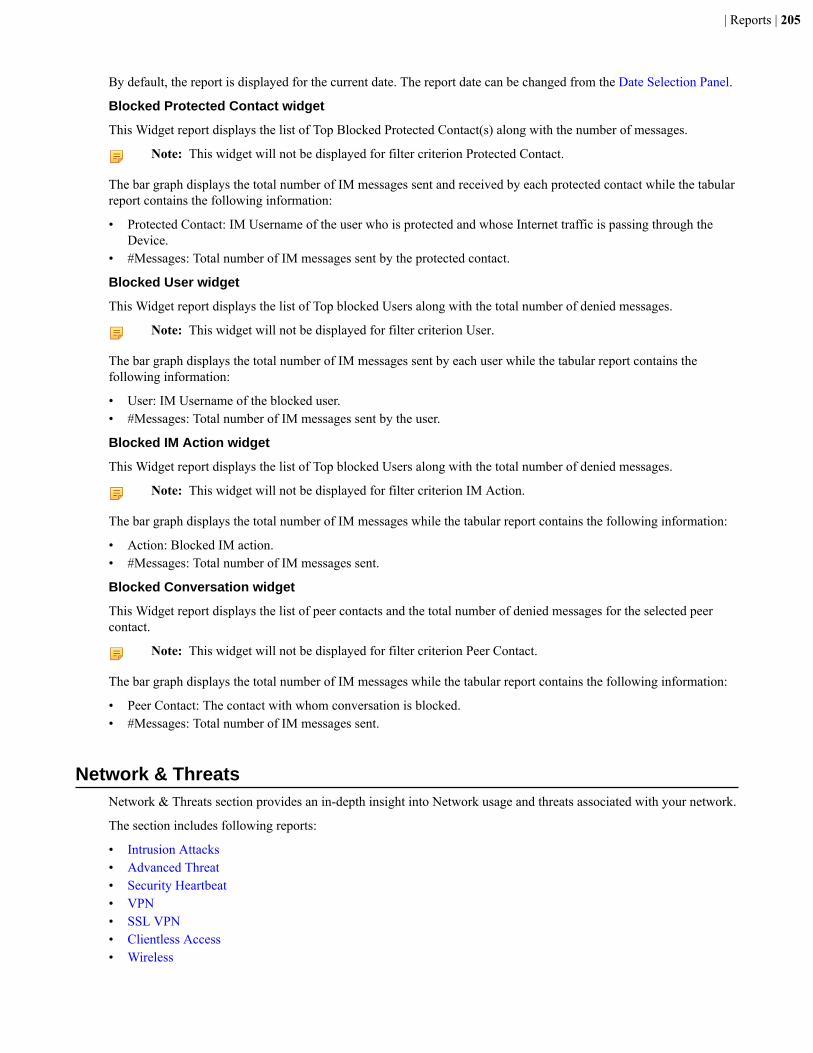
| Reports | 205
By default, the report is displayed for the current date. The report date can be changed from the Date Selection Panel.
Blocked Protected Contact widget
This Widget report displays the list of Top Blocked Protected Contact(s) along with the number of messages.
Note: This widget will not be displayed for filter criterion Protected Contact.
The bar graph displays the total number of IM messages sent and received by each protected contact while the tabularreport contains the following information:
• Protected Contact: IM Username of the user who is protected and whose Internet traffic is passing through theDevice.
• #Messages: Total number of IM messages sent by the protected contact.
Blocked User widget
This Widget report displays the list of Top blocked Users along with the total number of denied messages.
Note: This widget will not be displayed for filter criterion User.
The bar graph displays the total number of IM messages sent by each user while the tabular report contains thefollowing information:
• User: IM Username of the blocked user.• #Messages: Total number of IM messages sent by the user.
Blocked IM Action widget
This Widget report displays the list of Top blocked Users along with the total number of denied messages.
Note: This widget will not be displayed for filter criterion IM Action.
The bar graph displays the total number of IM messages while the tabular report contains the following information:
• Action: Blocked IM action.• #Messages: Total number of IM messages sent.
Blocked Conversation widget
This Widget report displays the list of peer contacts and the total number of denied messages for the selected peercontact.
Note: This widget will not be displayed for filter criterion Peer Contact.
The bar graph displays the total number of IM messages while the tabular report contains the following information:
• Peer Contact: The contact with whom conversation is blocked.• #Messages: Total number of IM messages sent.
Network & ThreatsNetwork & Threats section provides an in-depth insight into Network usage and threats associated with your network.
The section includes following reports:
• Intrusion Attacks• Advanced Threat• Security Heartbeat• VPN• SSL VPN• Clientless Access• Wireless

| Reports | 206
• Rule Usage• Sandstorm on page 274
Intrusion AttacksIntrusion Attacks reports dashboard provide an insight of the attack attempts in your network.
The reports provide complete statistics about the attacks and attackers with concise reports on victims andapplications through which the attack was launched.
These reports can facilitate an administrator in determining the severity of the attack and thus provides the basis forfine tuning the intrusion prevention policies.
View the Attacks reports dashboard from Reports > Network & Threats > Intrusion Attacks.
It enables to view the break up for various attacks as:
• Devices on page 206• Attack Categories• Attacked Platforms• Attack Targets• Severity wise Attacks• Intrusion Attacks• Attacks detected and allowed• Intrusion Sources• Intrusion Destinations• Users• Applications used for Attacks• Source Countries• Trend - Intrusion Attacks
Devices
This Report displays list of integrated devices along with the number of hits and amount of data transferred perdevice.
View the report from Reports > Network & Threats > Intrusion Attacks > Devices.
The report is displayed using a graph as well as in a tabular format. By default, the report is displayed for the currentdate. The report date can be changed from the Date Selection Panel.
The bar graph displays amount of data transfer per device while the tabular report contains the following information:
• Device Name: Name of the device.• Device Type: Type of the device• Hits: Amount of data transferred.
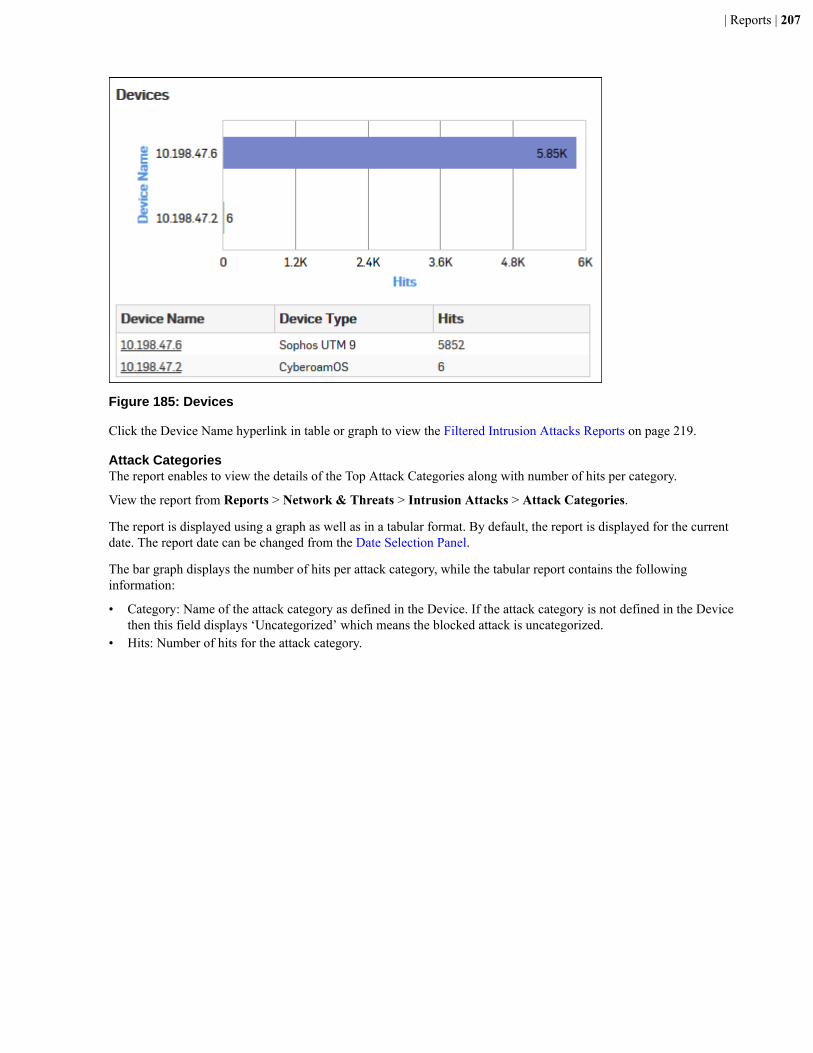
| Reports | 207
Figure 185: Devices
Click the Device Name hyperlink in table or graph to view the Filtered Intrusion Attacks Reports on page 219.
Attack CategoriesThe report enables to view the details of the Top Attack Categories along with number of hits per category.
View the report from Reports > Network & Threats > Intrusion Attacks > Attack Categories.
The report is displayed using a graph as well as in a tabular format. By default, the report is displayed for the currentdate. The report date can be changed from the Date Selection Panel.
The bar graph displays the number of hits per attack category, while the tabular report contains the followinginformation:
• Category: Name of the attack category as defined in the Device. If the attack category is not defined in the Devicethen this field displays ‘Uncategorized’ which means the blocked attack is uncategorized.
• Hits: Number of hits for the attack category.
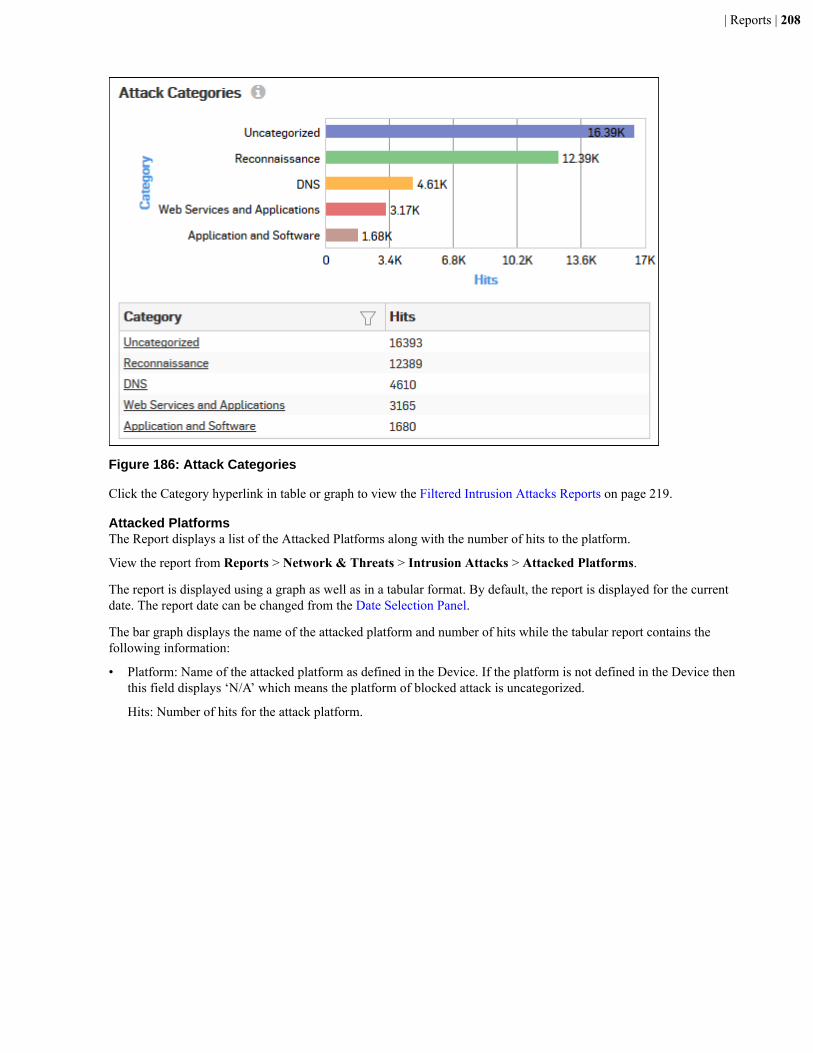
| Reports | 208
Figure 186: Attack Categories
Click the Category hyperlink in table or graph to view the Filtered Intrusion Attacks Reports on page 219.
Attacked PlatformsThe Report displays a list of the Attacked Platforms along with the number of hits to the platform.
View the report from Reports > Network & Threats > Intrusion Attacks > Attacked Platforms.
The report is displayed using a graph as well as in a tabular format. By default, the report is displayed for the currentdate. The report date can be changed from the Date Selection Panel.
The bar graph displays the name of the attacked platform and number of hits while the tabular report contains thefollowing information:
• Platform: Name of the attacked platform as defined in the Device. If the platform is not defined in the Device thenthis field displays ‘N/A’ which means the platform of blocked attack is uncategorized.
Hits: Number of hits for the attack platform.
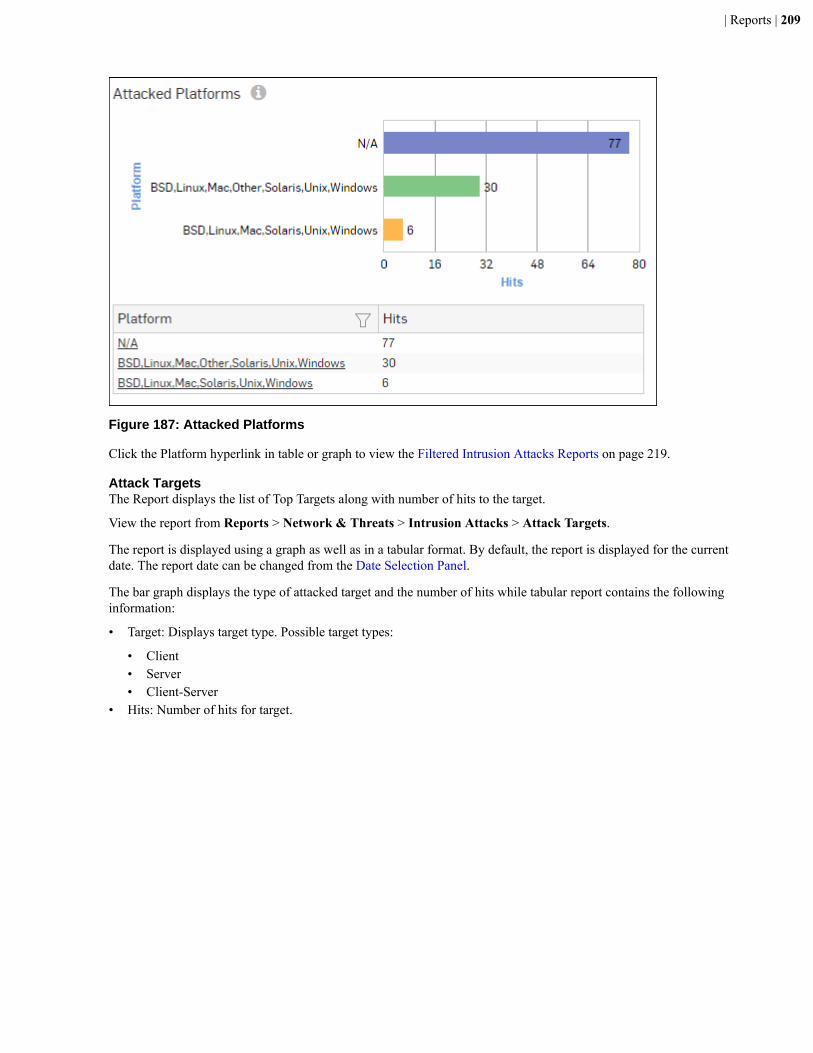
| Reports | 209
Figure 187: Attacked Platforms
Click the Platform hyperlink in table or graph to view the Filtered Intrusion Attacks Reports on page 219.
Attack TargetsThe Report displays the list of Top Targets along with number of hits to the target.
View the report from Reports > Network & Threats > Intrusion Attacks > Attack Targets.
The report is displayed using a graph as well as in a tabular format. By default, the report is displayed for the currentdate. The report date can be changed from the Date Selection Panel.
The bar graph displays the type of attacked target and the number of hits while tabular report contains the followinginformation:
• Target: Displays target type. Possible target types:
• Client• Server• Client-Server
• Hits: Number of hits for target.

| Reports | 210
Figure 188: Attacked Targets
Click the Target hyperlink in table or graph to view the Filtered Intrusion Attacks Reports on page 219.
Severity wise AttacksThe Report enables to view the severity of the attack that has hit the system and gives a detailed disintegration of theattacks, attackers, victims and applications through individual reports under severity.
View the report from Reports > Network & Threats > Intrusion Attacks > Severity wise Attacks.
The report is displayed using a graph as well as in a tabular format. By default, the report is displayed for the currentdate. The report date can be changed from the Date Selection Panel.
The bar graph displays the number of hits under each severity, while the tabular report contains the followinginformation:
• Severity: Severity level of the attack attempt. Predefined level are:
• EMERGENCY - System is not usable• ALERT - Action must be taken immediately• CRITICAL - Critical condition• ERROR - Error condition• WARNING - Warning condition• NOTICE - Normal but significant condition• INFORMATION – Informational• DEBUG - Debug level messages
• Hits: Number of hits under each severity.

| Reports | 211
Figure 189: Severity wise Attacks
Click the Severity hyperlink in table or graph to view the Filtered Intrusion Attacks Reports on page 219.
Intrusion AttacksThe Report enables to view the details of the attack that has hit the system and gives the detailed disintegration ofattackers, victims and applications through individual reports.
View the report from Reports > Network & Threats > Intrusion Attacks > Intrusion Attacks.
The report is displayed using a graph as well as in a tabular format. By default, the report is displayed for the currentdate. The report date can be changed from the Date Selection Panel.
Note: You can view this report from Security Dashboard as well.
The bar graph displays the number of hits under each attack, while the tabular report contains the followinginformation:
• Attack: Name of the attack launched.• Hits: Number of hits for each attack.
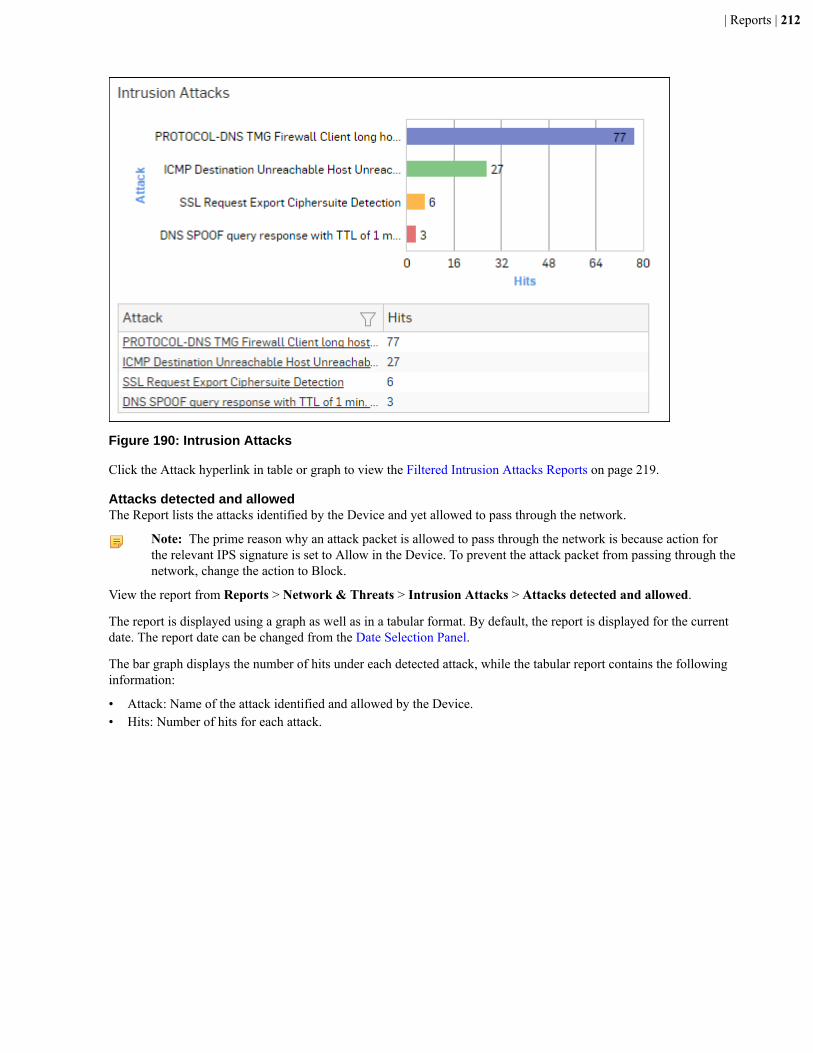
| Reports | 212
Figure 190: Intrusion Attacks
Click the Attack hyperlink in table or graph to view the Filtered Intrusion Attacks Reports on page 219.
Attacks detected and allowedThe Report lists the attacks identified by the Device and yet allowed to pass through the network.
Note: The prime reason why an attack packet is allowed to pass through the network is because action forthe relevant IPS signature is set to Allow in the Device. To prevent the attack packet from passing through thenetwork, change the action to Block.
View the report from Reports > Network & Threats > Intrusion Attacks > Attacks detected and allowed.
The report is displayed using a graph as well as in a tabular format. By default, the report is displayed for the currentdate. The report date can be changed from the Date Selection Panel.
The bar graph displays the number of hits under each detected attack, while the tabular report contains the followinginformation:
• Attack: Name of the attack identified and allowed by the Device.• Hits: Number of hits for each attack.
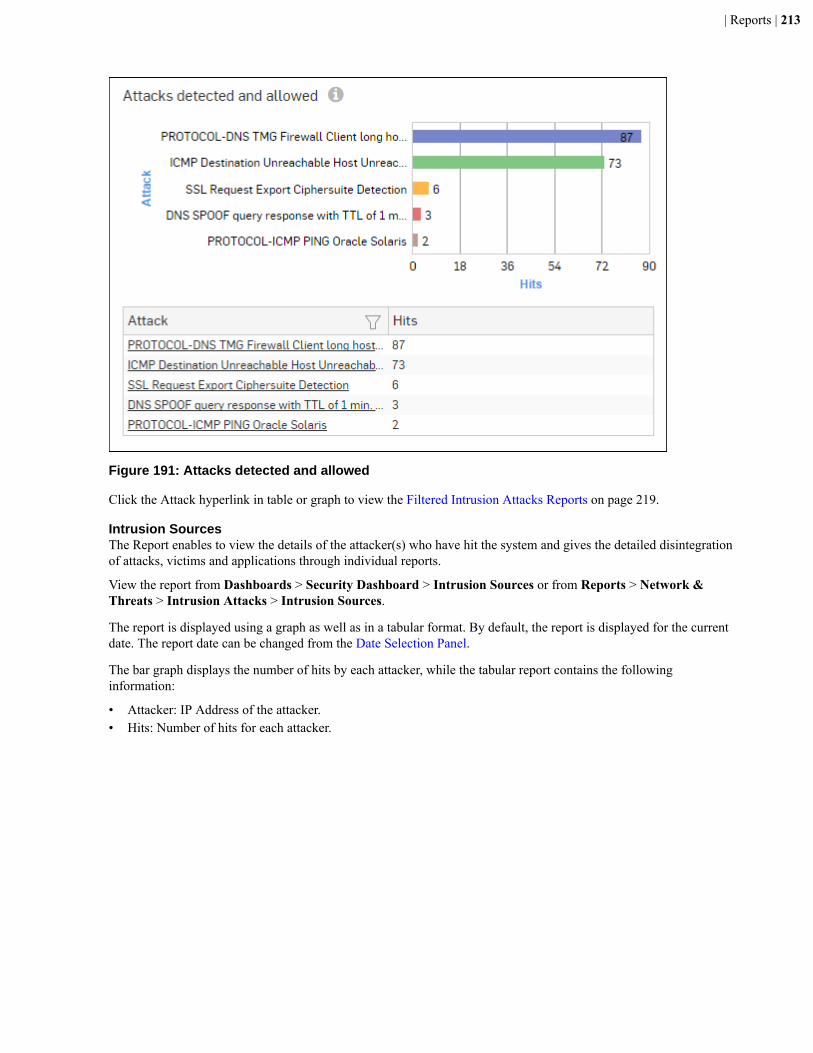
| Reports | 213
Figure 191: Attacks detected and allowed
Click the Attack hyperlink in table or graph to view the Filtered Intrusion Attacks Reports on page 219.
Intrusion SourcesThe Report enables to view the details of the attacker(s) who have hit the system and gives the detailed disintegrationof attacks, victims and applications through individual reports.
View the report from Dashboards > Security Dashboard > Intrusion Sources or from Reports > Network &Threats > Intrusion Attacks > Intrusion Sources.
The report is displayed using a graph as well as in a tabular format. By default, the report is displayed for the currentdate. The report date can be changed from the Date Selection Panel.
The bar graph displays the number of hits by each attacker, while the tabular report contains the followinginformation:
• Attacker: IP Address of the attacker.• Hits: Number of hits for each attacker.
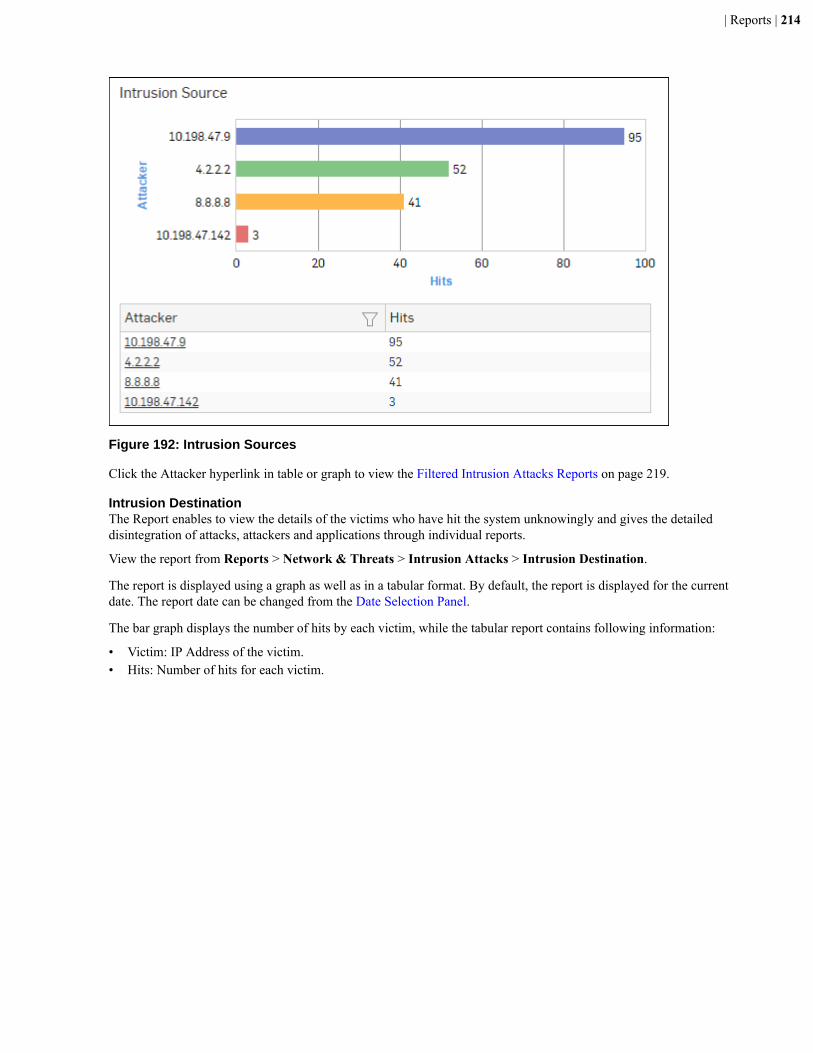
| Reports | 214
Figure 192: Intrusion Sources
Click the Attacker hyperlink in table or graph to view the Filtered Intrusion Attacks Reports on page 219.
Intrusion DestinationThe Report enables to view the details of the victims who have hit the system unknowingly and gives the detaileddisintegration of attacks, attackers and applications through individual reports.
View the report from Reports > Network & Threats > Intrusion Attacks > Intrusion Destination.
The report is displayed using a graph as well as in a tabular format. By default, the report is displayed for the currentdate. The report date can be changed from the Date Selection Panel.
The bar graph displays the number of hits by each victim, while the tabular report contains following information:
• Victim: IP Address of the victim.• Hits: Number of hits for each victim.
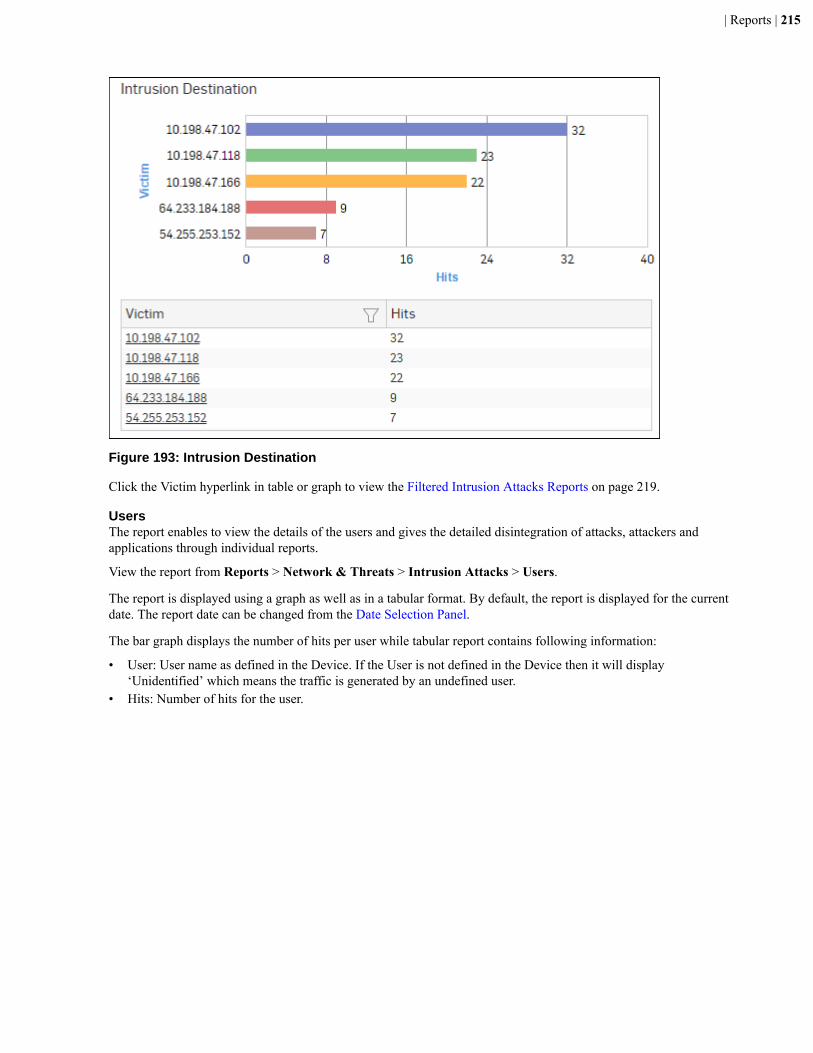
| Reports | 215
Figure 193: Intrusion Destination
Click the Victim hyperlink in table or graph to view the Filtered Intrusion Attacks Reports on page 219.
UsersThe report enables to view the details of the users and gives the detailed disintegration of attacks, attackers andapplications through individual reports.
View the report from Reports > Network & Threats > Intrusion Attacks > Users.
The report is displayed using a graph as well as in a tabular format. By default, the report is displayed for the currentdate. The report date can be changed from the Date Selection Panel.
The bar graph displays the number of hits per user while tabular report contains following information:
• User: User name as defined in the Device. If the User is not defined in the Device then it will display‘Unidentified’ which means the traffic is generated by an undefined user.
• Hits: Number of hits for the user.
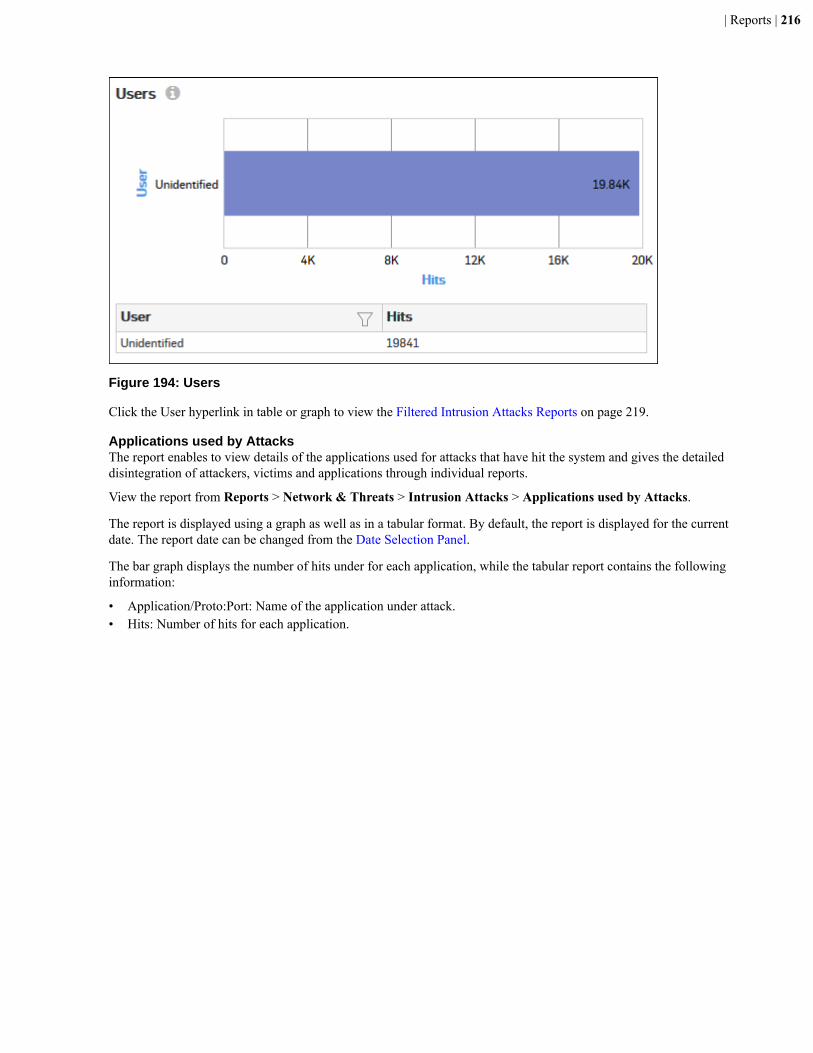
| Reports | 216
Figure 194: Users
Click the User hyperlink in table or graph to view the Filtered Intrusion Attacks Reports on page 219.
Applications used by AttacksThe report enables to view details of the applications used for attacks that have hit the system and gives the detaileddisintegration of attackers, victims and applications through individual reports.
View the report from Reports > Network & Threats > Intrusion Attacks > Applications used by Attacks.
The report is displayed using a graph as well as in a tabular format. By default, the report is displayed for the currentdate. The report date can be changed from the Date Selection Panel.
The bar graph displays the number of hits under for each application, while the tabular report contains the followinginformation:
• Application/Proto:Port: Name of the application under attack.• Hits: Number of hits for each application.
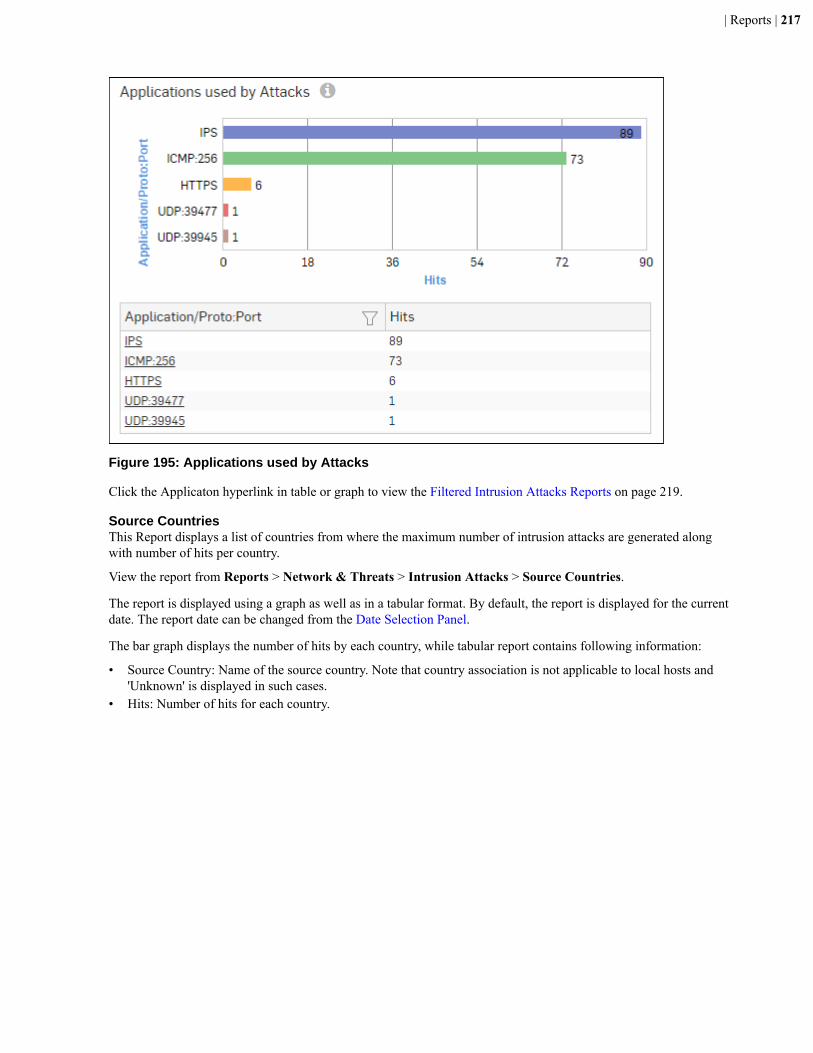
| Reports | 217
Figure 195: Applications used by Attacks
Click the Applicaton hyperlink in table or graph to view the Filtered Intrusion Attacks Reports on page 219.
Source CountriesThis Report displays a list of countries from where the maximum number of intrusion attacks are generated alongwith number of hits per country.
View the report from Reports > Network & Threats > Intrusion Attacks > Source Countries.
The report is displayed using a graph as well as in a tabular format. By default, the report is displayed for the currentdate. The report date can be changed from the Date Selection Panel.
The bar graph displays the number of hits by each country, while tabular report contains following information:
• Source Country: Name of the source country. Note that country association is not applicable to local hosts and'Unknown' is displayed in such cases.
• Hits: Number of hits for each country.

| Reports | 218
Figure 196: Source Countries
Click the Source Country hyperlink in table or graph to view the Filtered Intrusion Attacks Reports on page 219.
Trend - Intrusion AttacksThe Report provides an overview of IPS trends observed in the network during the selected time period.
View the report from Reports > Network & Threats > Intrusion Attacks > Trend - Intrusion Attacks.
The report is displayed using a graph as well as in a tabular format. By default, the report is displayed for the currentdate. The report date can be changed from the Date Selection Panel.
The bar graph displays the number of hits under each detected attack, while the tabular report contains the followinginformation:
• Time: Time of the event in YYYY:MM:DD HH:MM:SS format.• Event Type: Name of the event type.• Event: Number of occurrence of the event per time period.
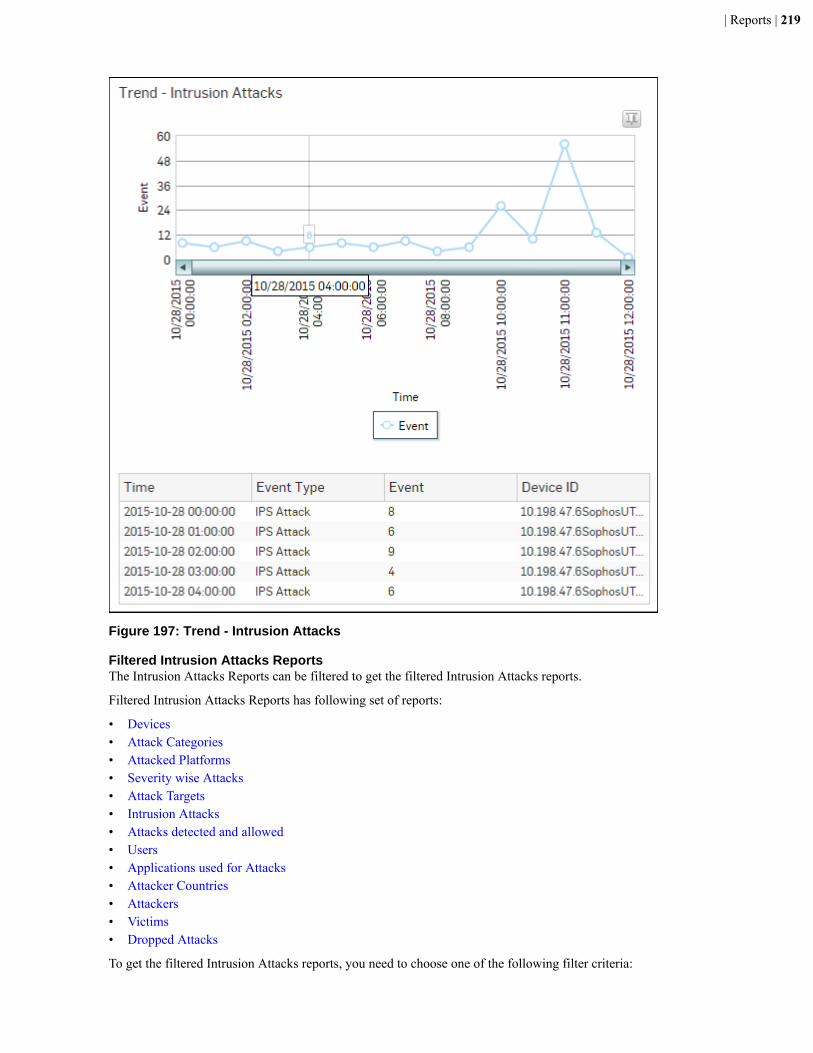
| Reports | 219
Figure 197: Trend - Intrusion Attacks
Filtered Intrusion Attacks ReportsThe Intrusion Attacks Reports can be filtered to get the filtered Intrusion Attacks reports.
Filtered Intrusion Attacks Reports has following set of reports:
• Devices• Attack Categories• Attacked Platforms• Severity wise Attacks• Attack Targets• Intrusion Attacks• Attacks detected and allowed• Users• Applications used for Attacks• Attacker Countries• Attackers• Victims• Dropped Attacks
To get the filtered Intrusion Attacks reports, you need to choose one of the following filter criteria:
| Reports | 220
• Device Name from Devices on page 206• Category from Attack Categories Report• Platform from Attacked Platforms Report• Target from Attack Targets Report• Severity from Severity wise break-down Report• Attack from Intrusion Attacks Report• Attack from Attacks detected and allowed Report• Attacker from Intrusion Sources Report• Victim from Intrusion Destinations Report• User from Users Report• Application from Applications used for Attacks Report• Country from Source Countries Report
Filtered Reports consist of multiple report widgets. Each widget displays the report in graph as well as in a tabularformat which can again be filtered.
By default, the report is displayed for the current date. The report date can be changed from the top most row of thepage.
Devices widgetThis widget Report displays the Devices along with number of hits and amount of data transfer.
Note: This widget will not be displayed for filter criterion Device Name.
The bar graph displays amount of data transfer per device while the tabular report contains the following information:
• Device Name: Name of the device.• Device Type: Type of the device• Hits: Amount of data transferred.
Attack Categories widgetThis Widget Report displays a list of Attack Categories along with number of hits to the category.
Note: This widget will not be displayed for the filter criterion Category.
The bar graph displays the name of attack category and number of hits while tabular report contains followinginformation:
• Category: Name of the attack category as defined in the Device. If the attack category is not defined in the Devicethen this field displays ‘Uncategorized’ which means the blocked attack is uncategorized.
• Hits: Number of hits for the attack category.
Attacked Platforms widgetThis Widget Report displays a list of Attacked Platforms along with the number of hits to the platform.
Note: This widget will not be displayed for the filter criterion Platform.
The bar graph displays the name of the attack platform and the number of hits while the tabular report contains thefollowing information:
• Platform: Name of the attack platform as defined in the Device. If the platform is not defined in the Device thenthis field displays ‘N/A’ which means the platform of blocked attack is uncategorized.
• Hits: Number of hits for the attack category.
Attack Targets widgetThis Widget Report displays target type wise number of hits.
Note: This widget will not be displayed for the filter criterion Target.
The bar graph displays the type of attack target and the number of hits while the tabular report contains the followinginformation:

| Reports | 221
• Target: Displays target type. Possible target types:
• Client• Server• Client-Server
• Hits: Number of hits for target.
Severity wise Attacks widgetThe Severity wise break-down Report enables to view the severity level of the attack and the number of hits for theseverity level.
Note: This widget will not be displayed for the filter criterion Severity.
The Report is displayed as a graph as well as in a tabular format. By default, the report is displayed for the currentdate. The report date can be changed from the top most row of the page.
The bar graph displays the number of hits under each severity, while the tabular report contains the followinginformation:
• Severity: Severity level of the attack attempt.• Hits: Number of hits for each severity level.
Intrusion Attacks widgetThis Widget Report displays the number of hits for every intrusion attack.
Note: This widget will not be displayed for the filter criterion Attack.
The bar graph displays the type of attack while the tabular report contains the following information:
• Attack: Name of the intrusion attack.• Hits: Number of hits for the attack.
Attacks detected and allowed widgetThe Report lists the attacks identified by the Device and yet allowed to pass through the network.
Note: This widget will not be displayed for the filter criterion Attack.
Note: The prime reason why an attack packet is allowed to pass through the network is because action forthe relevant IPS signature is set to Allow in the Device. To prevent the attack packet from passing through thenetwork, change the action to Block.
The Report is displayed as a graph as well as in a tabular format.
The bar graph displays the number of hits under each detected attack, while the tabular report contains the followinginformation:
• Attack: Name of the attack identified and allowed by the Device.• Hits: Number of hits for each attack.
Attackers widget
This Widget Report displays the number of hits from every attacker.
The bar graph displays the number of hits while the tabular report contains the following information:
• Attacker: IP Address of the attacker.• Hits: Number of hits from the attacker.
Victims widget
This Widget Report displays the number of hits on each victim.
The bar graph displays the number of hits while the tabular report contains the following information:
• Victim: IP Address of the victim.• Hits: Number of hits from the attacker.
| Reports | 222
Applications used for Attacks widgetThis Widget report displays a list of the Top Applications and number of hits for every application.
Note: This widget will not be displayed for the filter criterion Application.
The bar graph displays the name of the application under attack, while the tabular report contains the followinginformation:
• Application: Name of the application as defined in the Device. If the User is not defined in the Device then it willdisplay ‘Unclassified’ which means the traffic is generated by an undefined user.
• Hits: Number of hits for the application.
Attacker Countries widgetThis widget displays a list of countries from where the maximum number of intrusion attacks are generated alongwith number of hits per country.
Note: This widget will not be displayed for the filter criterion Source Country.
The bar graph displays the number of hits per country while the tabular report contains the following information:
• Source Country: Name of attacker country. Note that country association is not applicable to local hosts and'Unknown' is displayed in such cases.
• Hits: Number of hits for the country.
Users widgetThis Report displays a list of the Top Users along with the number of hits to the user.
Note: This widget will not be displayed for the filter criterion User.
The bar graph displays the number of hits per user while the tabular report contains the following information:
• User: User name as defined in the Device. If the User is not defined in the Device then it will display‘Unidentified’ which means the traffic is generated by an undefined user.
• Hits: Number of hits for the user.
Dropped Attacks widgetThis Widget Report displays the number of hits for every dropped intrusion attack.
The bar graph displays the type of attack while the tabular report contains the following information:
• Attack: Name of the dropped intrusion attack.• Hits: Number of hits for the attack.
Advanced ThreatsAdvanced Threat Protection (ATP) reports dashboard provide a snapshot of advanced threats in your network. It helpsto identify clients/hosts within your network that are infected or part of botnet.
ATP analyzes network traffic, e.g., DNS requests, HTTP requests, or data packets in general, coming from and goingto all networks for possible threats. The database used to identify threats is updated constantly by a CnC/Botnet datafeed from Sophos Labs through signature updates.
Based on this data, the ATP reports can help administrators to quickly identify infected hosts and their communicationwith command-and-control (CnC) servers. This in turn, provides a basis for fine-tuning the configuration to efficientlycontrol network traffic flow.
View the reportfrom Reports > Network & Threats > Advanced Threats.
ATP reports dashboard enable viewing of traffic generated by:
• Devices on page 223• Hosts - ATP• Advanced Threats• Users - ATP
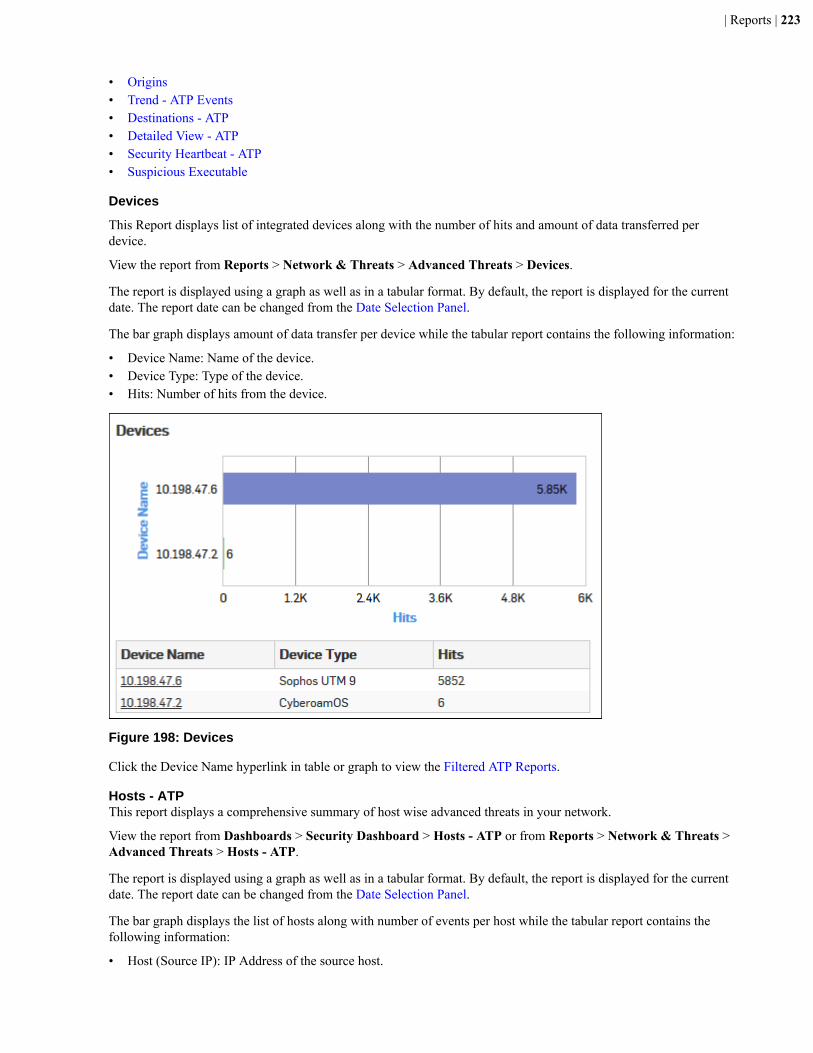
| Reports | 223
• Origins• Trend - ATP Events• Destinations - ATP• Detailed View - ATP• Security Heartbeat - ATP• Suspicious Executable
Devices
This Report displays list of integrated devices along with the number of hits and amount of data transferred perdevice.
View the report from Reports > Network & Threats > Advanced Threats > Devices.
The report is displayed using a graph as well as in a tabular format. By default, the report is displayed for the currentdate. The report date can be changed from the Date Selection Panel.
The bar graph displays amount of data transfer per device while the tabular report contains the following information:
• Device Name: Name of the device.• Device Type: Type of the device.• Hits: Number of hits from the device.
Figure 198: Devices
Click the Device Name hyperlink in table or graph to view the Filtered ATP Reports.
Hosts - ATPThis report displays a comprehensive summary of host wise advanced threats in your network.
View the report from Dashboards > Security Dashboard > Hosts - ATP or from Reports > Network & Threats >Advanced Threats > Hosts - ATP.
The report is displayed using a graph as well as in a tabular format. By default, the report is displayed for the currentdate. The report date can be changed from the Date Selection Panel.
The bar graph displays the list of hosts along with number of events per host while the tabular report contains thefollowing information:
• Host (Source IP): IP Address of the source host.
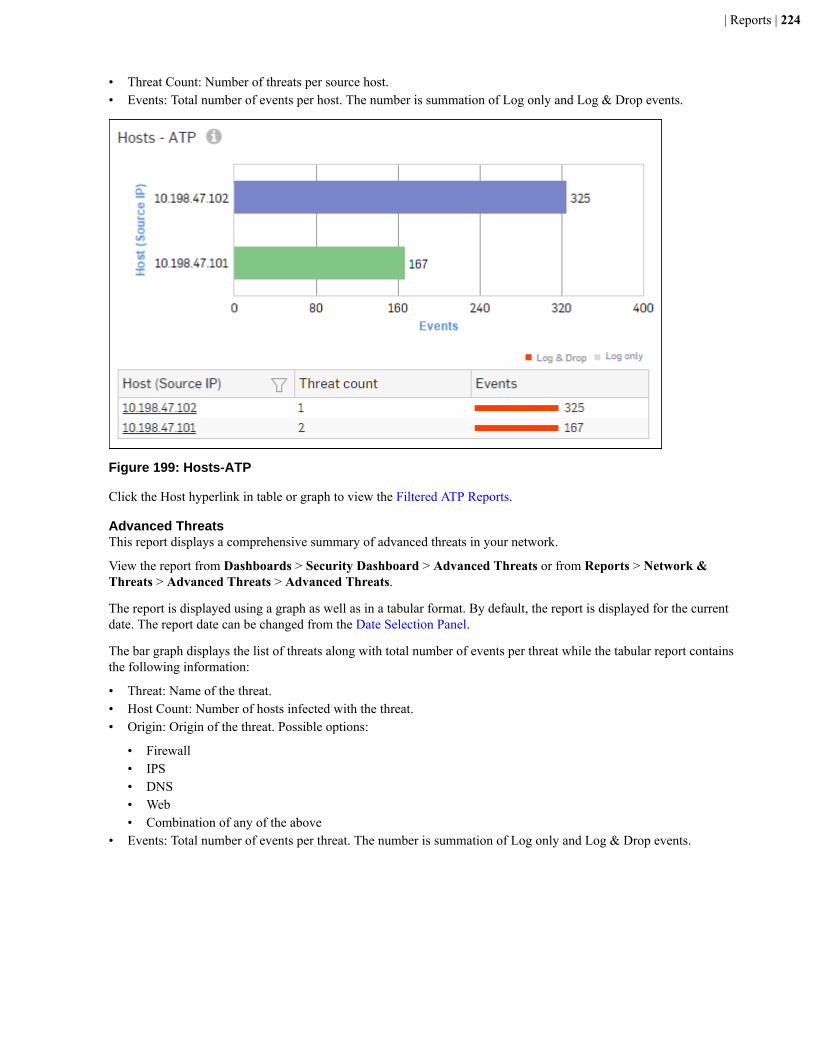
| Reports | 224
• Threat Count: Number of threats per source host.• Events: Total number of events per host. The number is summation of Log only and Log & Drop events.
Figure 199: Hosts-ATP
Click the Host hyperlink in table or graph to view the Filtered ATP Reports.
Advanced ThreatsThis report displays a comprehensive summary of advanced threats in your network.
View the report from Dashboards > Security Dashboard > Advanced Threats or from Reports > Network &Threats > Advanced Threats > Advanced Threats.
The report is displayed using a graph as well as in a tabular format. By default, the report is displayed for the currentdate. The report date can be changed from the Date Selection Panel.
The bar graph displays the list of threats along with total number of events per threat while the tabular report containsthe following information:
• Threat: Name of the threat.• Host Count: Number of hosts infected with the threat.• Origin: Origin of the threat. Possible options:
• Firewall• IPS• DNS• Web• Combination of any of the above
• Events: Total number of events per threat. The number is summation of Log only and Log & Drop events.
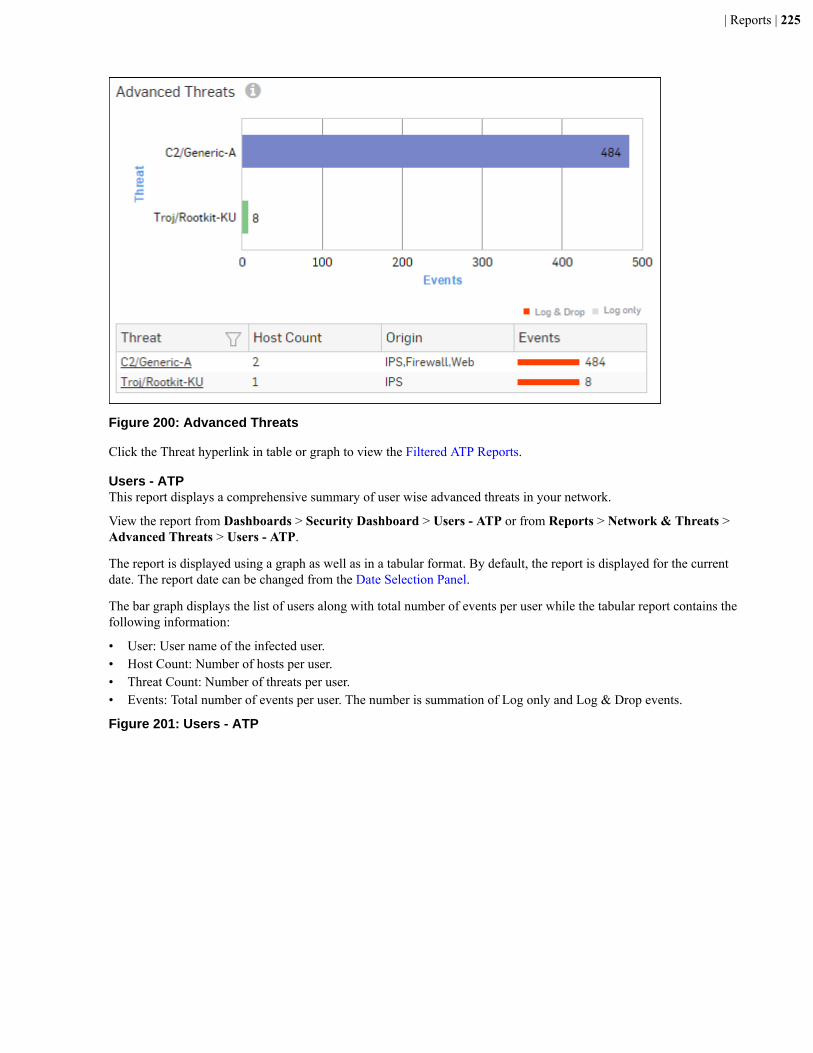
| Reports | 225
Figure 200: Advanced Threats
Click the Threat hyperlink in table or graph to view the Filtered ATP Reports.
Users - ATPThis report displays a comprehensive summary of user wise advanced threats in your network.
View the report from Dashboards > Security Dashboard > Users - ATP or from Reports > Network & Threats >Advanced Threats > Users - ATP.
The report is displayed using a graph as well as in a tabular format. By default, the report is displayed for the currentdate. The report date can be changed from the Date Selection Panel.
The bar graph displays the list of users along with total number of events per user while the tabular report contains thefollowing information:
• User: User name of the infected user.• Host Count: Number of hosts per user.• Threat Count: Number of threats per user.• Events: Total number of events per user. The number is summation of Log only and Log & Drop events.
Figure 201: Users - ATP
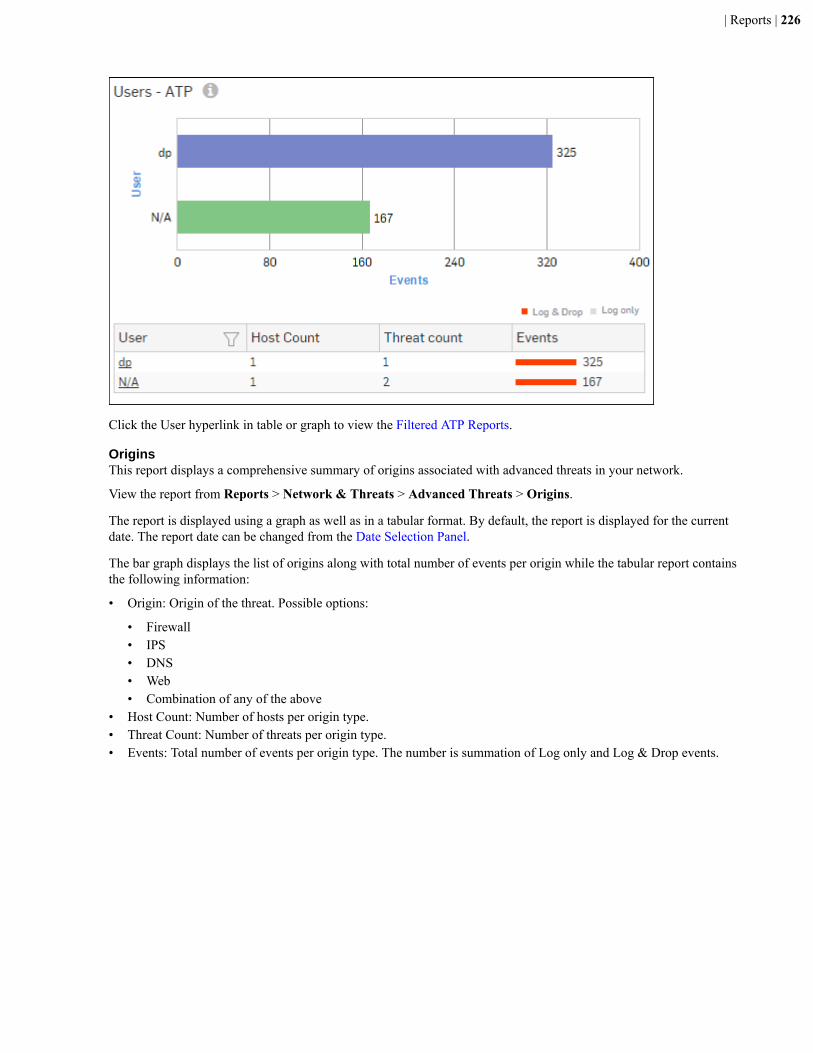
| Reports | 226
Click the User hyperlink in table or graph to view the Filtered ATP Reports.
OriginsThis report displays a comprehensive summary of origins associated with advanced threats in your network.
View the report from Reports > Network & Threats > Advanced Threats > Origins.
The report is displayed using a graph as well as in a tabular format. By default, the report is displayed for the currentdate. The report date can be changed from the Date Selection Panel.
The bar graph displays the list of origins along with total number of events per origin while the tabular report containsthe following information:
• Origin: Origin of the threat. Possible options:
• Firewall• IPS• DNS• Web• Combination of any of the above
• Host Count: Number of hosts per origin type.• Threat Count: Number of threats per origin type.• Events: Total number of events per origin type. The number is summation of Log only and Log & Drop events.
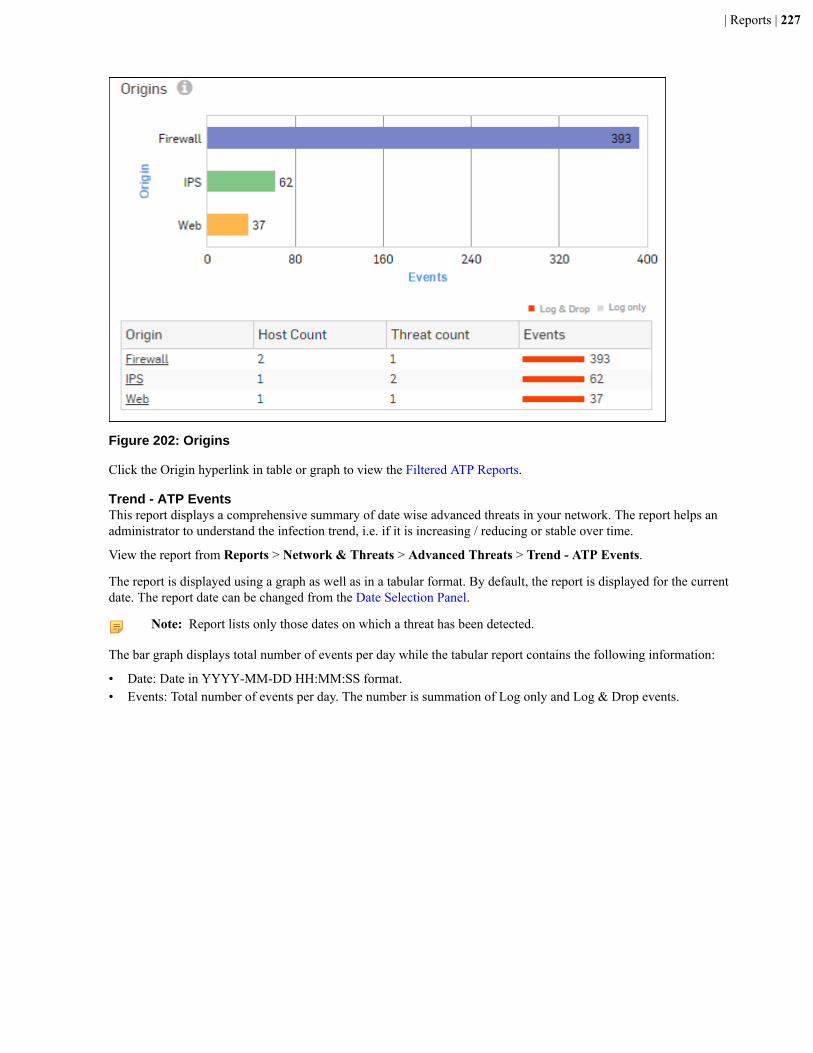
| Reports | 227
Figure 202: Origins
Click the Origin hyperlink in table or graph to view the Filtered ATP Reports.
Trend - ATP EventsThis report displays a comprehensive summary of date wise advanced threats in your network. The report helps anadministrator to understand the infection trend, i.e. if it is increasing / reducing or stable over time.
View the report from Reports > Network & Threats > Advanced Threats > Trend - ATP Events.
The report is displayed using a graph as well as in a tabular format. By default, the report is displayed for the currentdate. The report date can be changed from the Date Selection Panel.
Note: Report lists only those dates on which a threat has been detected.
The bar graph displays total number of events per day while the tabular report contains the following information:
• Date: Date in YYYY-MM-DD HH:MM:SS format.• Events: Total number of events per day. The number is summation of Log only and Log & Drop events.
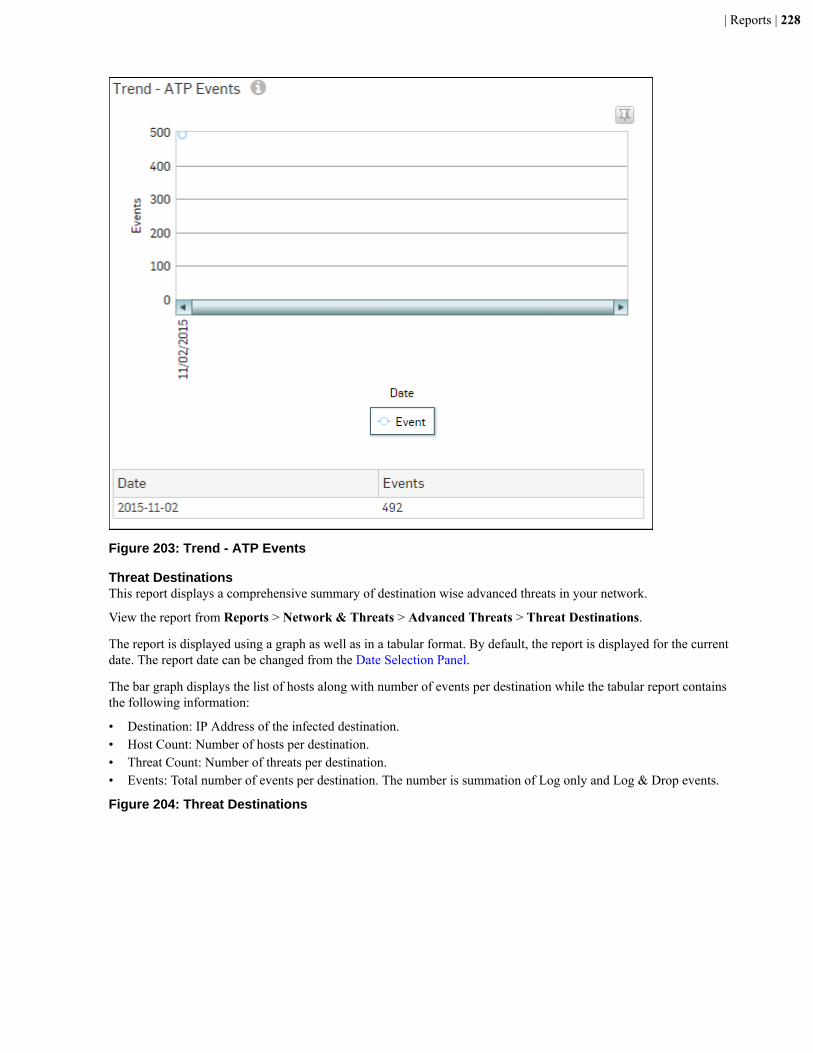
| Reports | 228
Figure 203: Trend - ATP Events
Threat DestinationsThis report displays a comprehensive summary of destination wise advanced threats in your network.
View the report from Reports > Network & Threats > Advanced Threats > Threat Destinations.
The report is displayed using a graph as well as in a tabular format. By default, the report is displayed for the currentdate. The report date can be changed from the Date Selection Panel.
The bar graph displays the list of hosts along with number of events per destination while the tabular report containsthe following information:
• Destination: IP Address of the infected destination.• Host Count: Number of hosts per destination.• Threat Count: Number of threats per destination.• Events: Total number of events per destination. The number is summation of Log only and Log & Drop events.
Figure 204: Threat Destinations
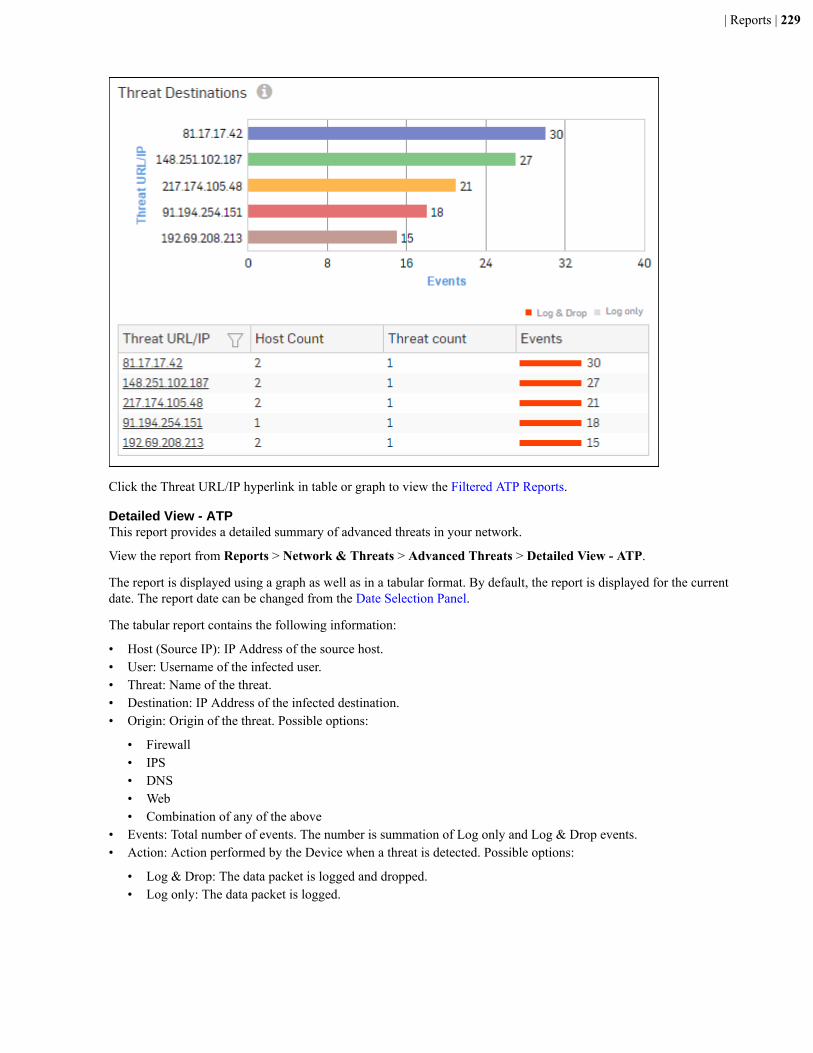
| Reports | 229
Click the Threat URL/IP hyperlink in table or graph to view the Filtered ATP Reports.
Detailed View - ATPThis report provides a detailed summary of advanced threats in your network.
View the report from Reports > Network & Threats > Advanced Threats > Detailed View - ATP.
The report is displayed using a graph as well as in a tabular format. By default, the report is displayed for the currentdate. The report date can be changed from the Date Selection Panel.
The tabular report contains the following information:
• Host (Source IP): IP Address of the source host.• User: Username of the infected user.• Threat: Name of the threat.• Destination: IP Address of the infected destination.• Origin: Origin of the threat. Possible options:
• Firewall• IPS• DNS• Web• Combination of any of the above
• Events: Total number of events. The number is summation of Log only and Log & Drop events.• Action: Action performed by the Device when a threat is detected. Possible options:
• Log & Drop: The data packet is logged and dropped.• Log only: The data packet is logged.
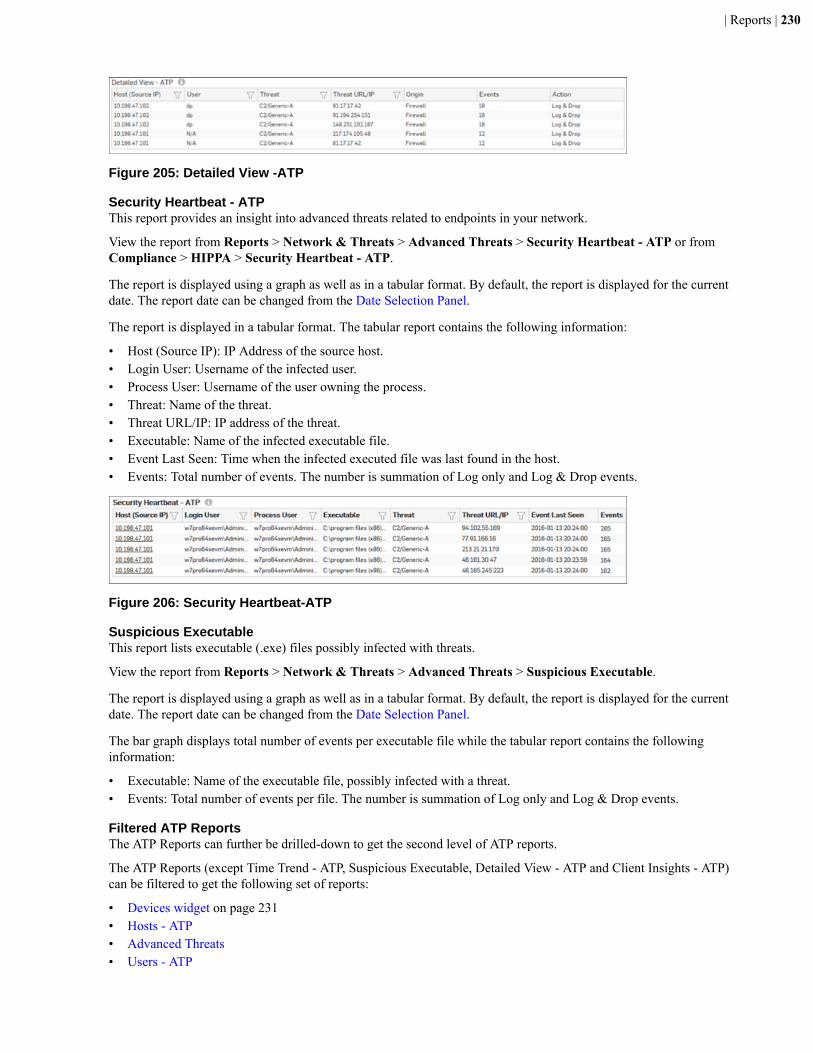
| Reports | 230
Figure 205: Detailed View -ATP
Security Heartbeat - ATPThis report provides an insight into advanced threats related to endpoints in your network.
View the report from Reports > Network & Threats > Advanced Threats > Security Heartbeat - ATP or fromCompliance > HIPPA > Security Heartbeat - ATP.
The report is displayed using a graph as well as in a tabular format. By default, the report is displayed for the currentdate. The report date can be changed from the Date Selection Panel.
The report is displayed in a tabular format. The tabular report contains the following information:
• Host (Source IP): IP Address of the source host.• Login User: Username of the infected user.• Process User: Username of the user owning the process.• Threat: Name of the threat.• Threat URL/IP: IP address of the threat.• Executable: Name of the infected executable file.• Event Last Seen: Time when the infected executed file was last found in the host.• Events: Total number of events. The number is summation of Log only and Log & Drop events.
Figure 206: Security Heartbeat-ATP
Suspicious ExecutableThis report lists executable (.exe) files possibly infected with threats.
View the report from Reports > Network & Threats > Advanced Threats > Suspicious Executable.
The report is displayed using a graph as well as in a tabular format. By default, the report is displayed for the currentdate. The report date can be changed from the Date Selection Panel.
The bar graph displays total number of events per executable file while the tabular report contains the followinginformation:
• Executable: Name of the executable file, possibly infected with a threat.• Events: Total number of events per file. The number is summation of Log only and Log & Drop events.
Filtered ATP ReportsThe ATP Reports can further be drilled-down to get the second level of ATP reports.
The ATP Reports (except Time Trend - ATP, Suspicious Executable, Detailed View - ATP and Client Insights - ATP)can be filtered to get the following set of reports:
• Devices widget on page 231• Hosts - ATP• Advanced Threats• Users - ATP
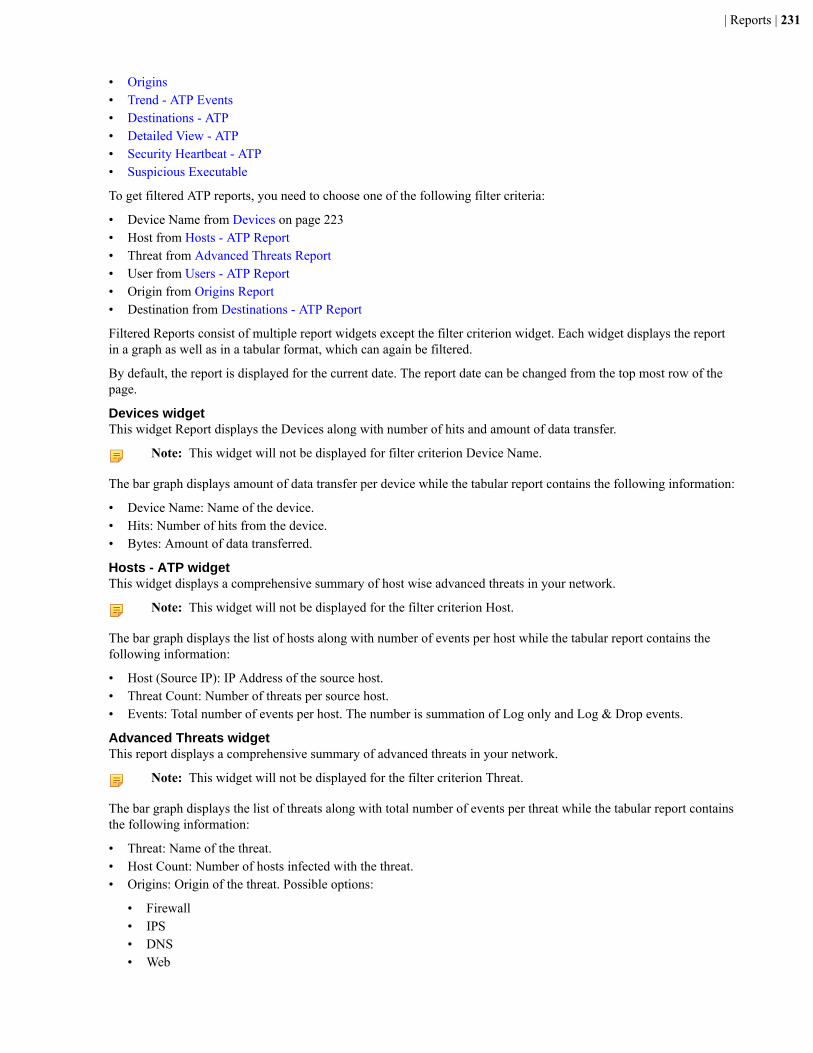
| Reports | 231
• Origins• Trend - ATP Events• Destinations - ATP• Detailed View - ATP• Security Heartbeat - ATP• Suspicious Executable
To get filtered ATP reports, you need to choose one of the following filter criteria:
• Device Name from Devices on page 223• Host from Hosts - ATP Report• Threat from Advanced Threats Report• User from Users - ATP Report• Origin from Origins Report• Destination from Destinations - ATP Report
Filtered Reports consist of multiple report widgets except the filter criterion widget. Each widget displays the reportin a graph as well as in a tabular format, which can again be filtered.
By default, the report is displayed for the current date. The report date can be changed from the top most row of thepage.
Devices widgetThis widget Report displays the Devices along with number of hits and amount of data transfer.
Note: This widget will not be displayed for filter criterion Device Name.
The bar graph displays amount of data transfer per device while the tabular report contains the following information:
• Device Name: Name of the device.• Hits: Number of hits from the device.• Bytes: Amount of data transferred.
Hosts - ATP widgetThis widget displays a comprehensive summary of host wise advanced threats in your network.
Note: This widget will not be displayed for the filter criterion Host.
The bar graph displays the list of hosts along with number of events per host while the tabular report contains thefollowing information:
• Host (Source IP): IP Address of the source host.• Threat Count: Number of threats per source host.• Events: Total number of events per host. The number is summation of Log only and Log & Drop events.
Advanced Threats widgetThis report displays a comprehensive summary of advanced threats in your network.
Note: This widget will not be displayed for the filter criterion Threat.
The bar graph displays the list of threats along with total number of events per threat while the tabular report containsthe following information:
• Threat: Name of the threat.• Host Count: Number of hosts infected with the threat.• Origins: Origin of the threat. Possible options:
• Firewall• IPS• DNS• Web
| Reports | 232
• Combination of any of the above• Events: Total number of events per threat. The number is summation of Log only and Log & Drop events.
Users - ATP widgetThis widget displays a comprehensive summary of user wise advanced threats in your network.
Note: This widget will not be displayed for the filter criterion User.
The bar graph displays the list of users along with total number of events per user while the tabular report contains thefollowing information:
• User: User name of the infected user.• Host Count: Number of hosts per user.• Threat Count: Number of threats per user.• Events: Total number of events per user. The number is summation of Log only and Log & Drop events.
Origins widgetThis widget displays a comprehensive summary of origins associated with advanced threats in your network.
Note: This widget will not be displayed for the filter criterion Origin.
The bar graph displays the list of origins along with total number of events per origin while the tabular report containsthe following information:
• Origins: Origin of the threat. Possible options:
• Firewall• IPS• DNS• Web• Combination of any of the above
• Host Count: Number of hosts per origin.• Threat Count: Number of threats per origin.• Attempts: Total number of events per origin. The number is summation of Log only and Log & Drop events.
Trend - ATP Events widgetThis report displays a comprehensive summary of date wise advanced threats in your network. The report helps anadministrator to understand the infection trend, i.e. if it is increasing / reducing or stable over time.
The bar graph displays total number of attempts per day while the tabular report contains the following information:
• Date: Date in YYYY-MM-DD HH:MM:SS format.• Events: Total number of events per day. The number is summation of Log only and Log & Drop events.
Threat Destinations widgetThis widget displays a comprehensive summary of destination wise advanced threats in your network.
Note: This widget will not be displayed for the filter criterion Destination.
The bar graph displays the list of hosts along with number of events per destination while the tabular report containsthe following information:
• Destination: IP Address of the infected destination.• Host Count: Number of hosts per destination.• Threat Count: Number of threats per destination.• Events: Total number of attempts per destination. The number is summation of Log only and Log & Drop events.
Detailed View - ATP widgetThis report provides a detailed summary of advanced threats in your network.

| Reports | 233
The report is displayed in a tabular format.
The tabular report contains the following information:
• Action: Action performed by the Device when a threat is detected. Possible options:
• Log & Drop: The data packet is logged and dropped.• Log only: The data packet is logged.
• Host (Source IP): IP Address of the source host.• User: Username of the infected user.• Destination: IP Address of the infected destination.• Threat: Name of the threat.• Origin: Origin of the threat. Possible options:
• Firewall• IPS• DNS• HTTP Proxy• Combination of any of the above
• Events: Total number of events. The number is summation of Log only and Log & Drop events.
Security Heartbeat - ATP widgetThis report provides an insight into advanced threats related to endpoints in your network.
The report is displayed in a tabular format. The tabular report contains the following information:
• Action: Action performed by the Device when a threat is detected. Possible options:
• Log & Drop: The data packet is logged and dropped.• Log only: The data packet is logged.
• Host (Source IP): IP Address of the source host.• Login User: Username of the infected user.• Process User: Username of the user owning the process.• Destination: IP Address of the infected destination.• Threat: Name of the threat.• Executable: Name of the infected executable file.• Last Seen: Time when the infected executed file was last found in the host.• Events: Total number of events. The number is summation of Log only and Log & Drop events.
Suspicious Executable widgetThis report lists executable (.exe) files possibly infected with threats.
The report is displayed using a graph as well as in a tabular format.
The bar graph displays total number of attempts per executable file while the tabular report contains the followinginformation:
• Executable: Name of the executable file, possibly infected with a threat.• Events: Total number of events per file. The number is summation of Log only and Log & Drop events.
Security HeartbeatSecurity Heartbeat reports dashboard provide an insight into health of endpoints in your network based on the datacollected by the Device from communication between an endpoint and Sophos Cloud.
Note: An endpoint must be managed by Sophos Cloud to be able to view its Health Insight reports.
These reports can facilitate an administrator in determining the health status of various endpoints in the network andthus provides a basis for fine tuning the network access policies.
View the reportfrom Reports > Network & Threats > Security Heartbeat.
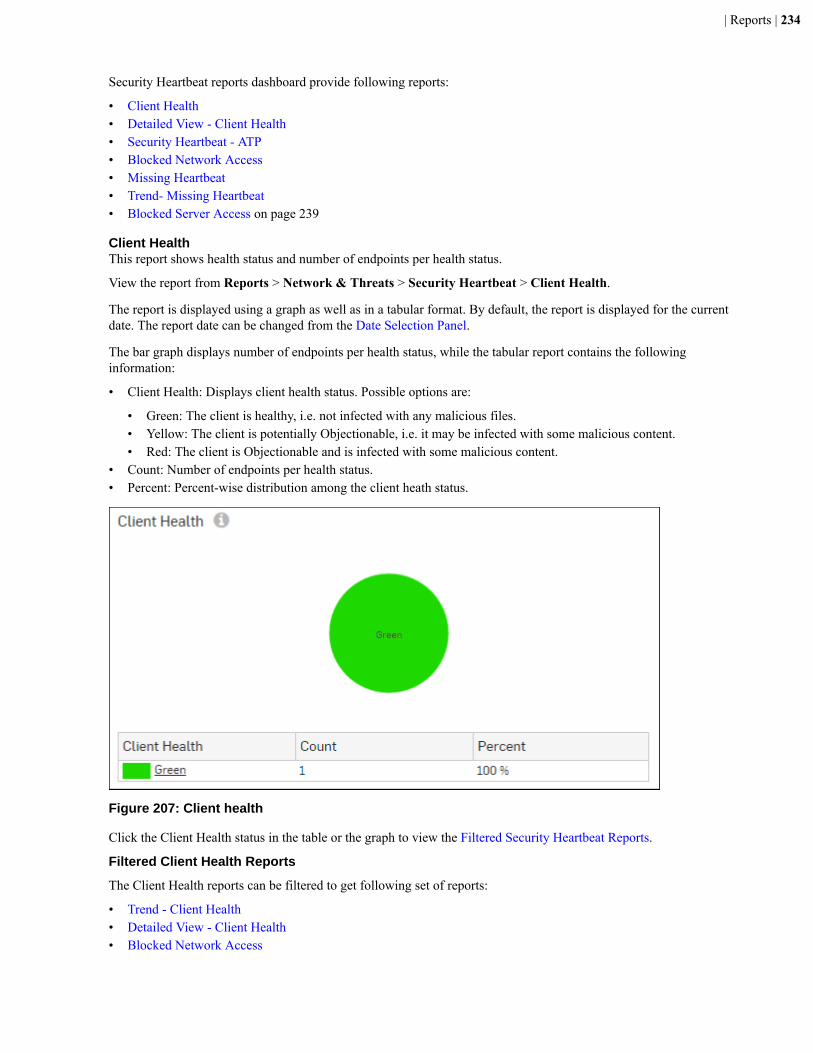
| Reports | 234
Security Heartbeat reports dashboard provide following reports:
• Client Health• Detailed View - Client Health• Security Heartbeat - ATP• Blocked Network Access• Missing Heartbeat• Trend- Missing Heartbeat• Blocked Server Access on page 239
Client HealthThis report shows health status and number of endpoints per health status.
View the report from Reports > Network & Threats > Security Heartbeat > Client Health.
The report is displayed using a graph as well as in a tabular format. By default, the report is displayed for the currentdate. The report date can be changed from the Date Selection Panel.
The bar graph displays number of endpoints per health status, while the tabular report contains the followinginformation:
• Client Health: Displays client health status. Possible options are:
• Green: The client is healthy, i.e. not infected with any malicious files.• Yellow: The client is potentially Objectionable, i.e. it may be infected with some malicious content.• Red: The client is Objectionable and is infected with some malicious content.
• Count: Number of endpoints per health status.• Percent: Percent-wise distribution among the client heath status.
Figure 207: Client health
Click the Client Health status in the table or the graph to view the Filtered Security Heartbeat Reports.
Filtered Client Health Reports
The Client Health reports can be filtered to get following set of reports:
• Trend - Client Health• Detailed View - Client Health• Blocked Network Access

| Reports | 235
By default, the report is displayed for the current date. The report date can be changed from the top most row of thepage.
Trend - Client Health widgetThis widget report displays day-wise break-up of number of endpoints with the selected Health status.
Note: This widget is displayed only when the Client Health report is drill-downed by selecting a Healthstatus.
The report is displayed as a graph as well as in a tabular format.
The bar graph displays day-wise break-up of number of endpoints with the selected Health status while the tabularreport contains the following information:
• Date: Date in YYYY-MM-DD format.• Client Count: Number of endpoints with the selected Health status for each date.
Detailed View - Client Health widgetThis widget report shows in-depth information regarding health status of endpoints in your network.
The Report is displayed in a tabular format.
The tabular report contains the following information:
• Host (Source IP): IP Address of the endpoint.• Host Name: Name of the client.• Health - Last Seen: Displays latest health status of the selected endpoint. Possible options are:
• Green: The client is healthy, i.e. not infected with any malicious files.• Yellow: The client is potentially Objectionable, i.e. it may be infected with some malicious content.• Red: The client is Objectionable and is infected with some malicious content.
• Last Health Changed: Displays the date in YYYY-MM-DD HH:MM:SS format when the health of the host waslast changed.
Blocked Network Access widgetThis widget report lists hosts that were denied to access the network due to health reasons.
The Report is displayed in a tabular format.
The tabular report contains the following information:
• Host (Source IP): IP Address of the endpoint.• User: User name of the user logged into the endpoint.• Destination: IP Address of the destination.• Events: Total number of attempts per host. The number is summation of Log only and Log & Drop attempts.• Health Reason: Displays health status. Possible options are:
• Green: The client is healthy, i.e. not infected with any malicious files.• Yellow: The client is potentially Objectionable, i.e. it may be infected with some malicious content.• Red: The client is Objectionable and is infected with some malicious content.
Detailed View - Client HealthThis report shows in-depth information regarding health status of endpoints in your network.
View the report from Dashboards > Security Dashboard > Detailed View - Client Health or from Reports >Network & Threats > Security Heartbeat > Detailed View - Client Health.
The report is displayed using a graph as well as in a tabular format. By default, the report is displayed for the currentdate. The report date can be changed from the Date Selection Panel.
The tabular report contains the following information:
• Host (Source IP): IP Address of the endpoint.• Host Name: Name of the client.
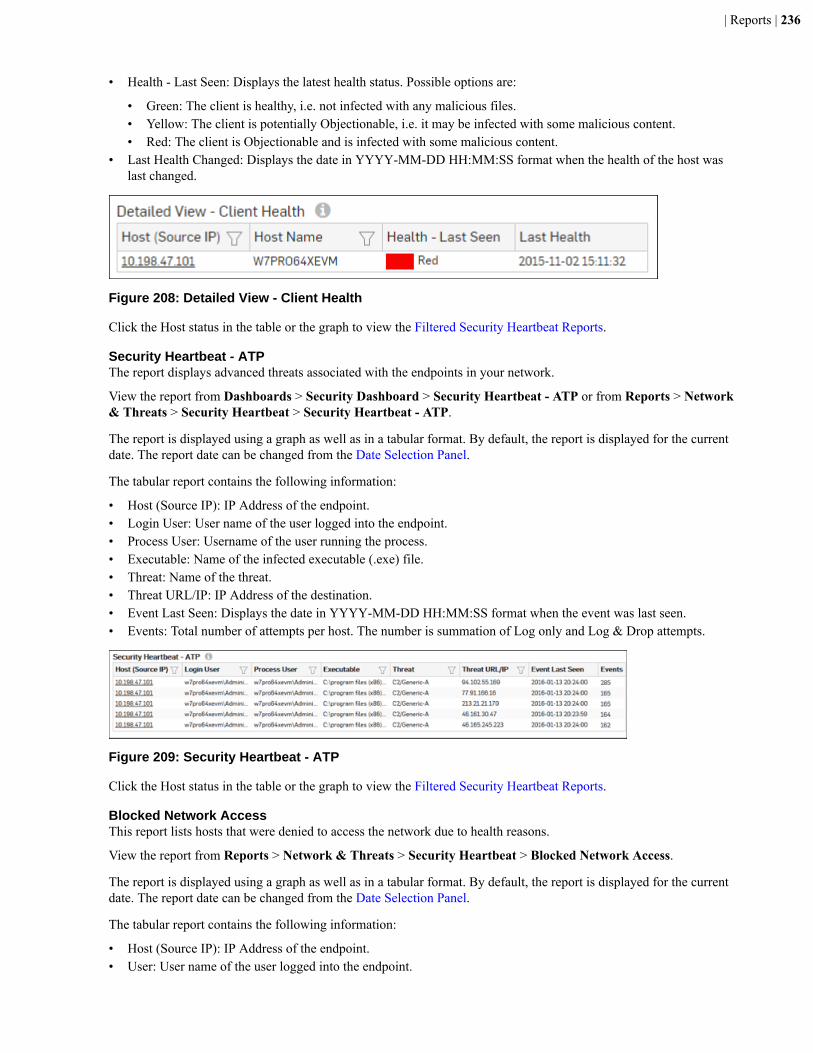
| Reports | 236
• Health - Last Seen: Displays the latest health status. Possible options are:
• Green: The client is healthy, i.e. not infected with any malicious files.• Yellow: The client is potentially Objectionable, i.e. it may be infected with some malicious content.• Red: The client is Objectionable and is infected with some malicious content.
• Last Health Changed: Displays the date in YYYY-MM-DD HH:MM:SS format when the health of the host waslast changed.
Figure 208: Detailed View - Client Health
Click the Host status in the table or the graph to view the Filtered Security Heartbeat Reports.
Security Heartbeat - ATPThe report displays advanced threats associated with the endpoints in your network.
View the report from Dashboards > Security Dashboard > Security Heartbeat - ATP or from Reports > Network& Threats > Security Heartbeat > Security Heartbeat - ATP.
The report is displayed using a graph as well as in a tabular format. By default, the report is displayed for the currentdate. The report date can be changed from the Date Selection Panel.
The tabular report contains the following information:
• Host (Source IP): IP Address of the endpoint.• Login User: User name of the user logged into the endpoint.• Process User: Username of the user running the process.• Executable: Name of the infected executable (.exe) file.• Threat: Name of the threat.• Threat URL/IP: IP Address of the destination.• Event Last Seen: Displays the date in YYYY-MM-DD HH:MM:SS format when the event was last seen.• Events: Total number of attempts per host. The number is summation of Log only and Log & Drop attempts.
Figure 209: Security Heartbeat - ATP
Click the Host status in the table or the graph to view the Filtered Security Heartbeat Reports.
Blocked Network AccessThis report lists hosts that were denied to access the network due to health reasons.
View the report from Reports > Network & Threats > Security Heartbeat > Blocked Network Access.
The report is displayed using a graph as well as in a tabular format. By default, the report is displayed for the currentdate. The report date can be changed from the Date Selection Panel.
The tabular report contains the following information:
• Host (Source IP): IP Address of the endpoint.• User: User name of the user logged into the endpoint.
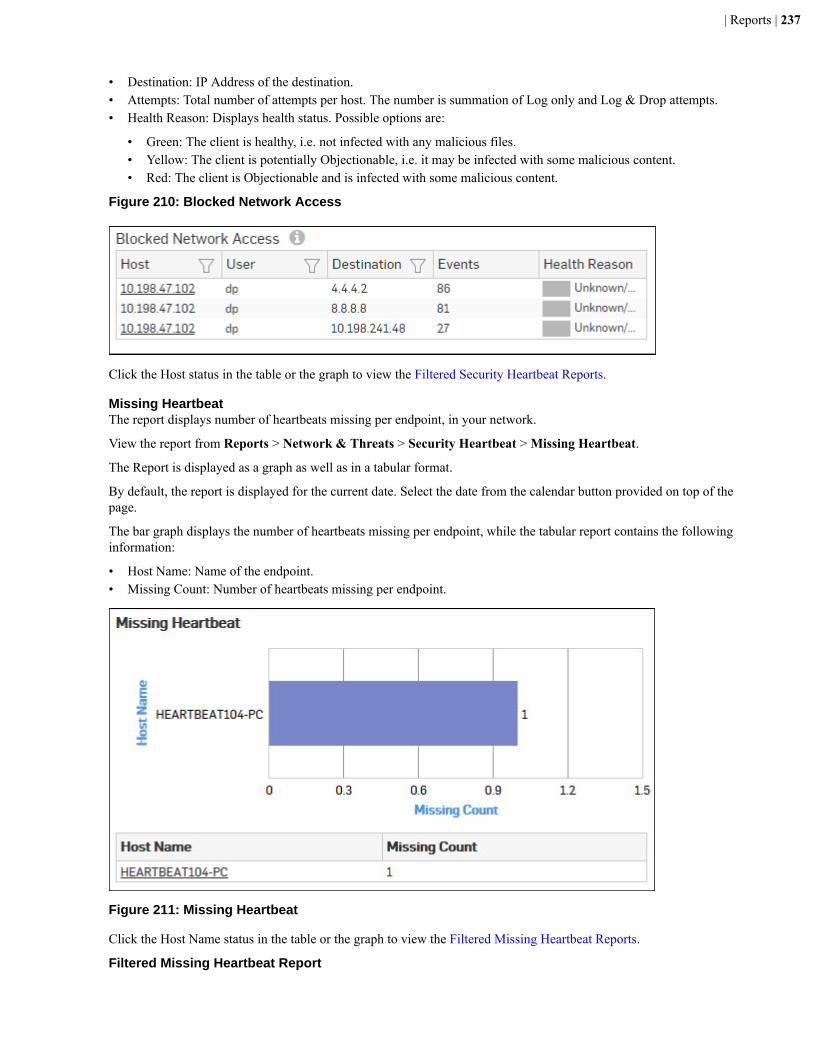
| Reports | 237
• Destination: IP Address of the destination.• Attempts: Total number of attempts per host. The number is summation of Log only and Log & Drop attempts.• Health Reason: Displays health status. Possible options are:
• Green: The client is healthy, i.e. not infected with any malicious files.• Yellow: The client is potentially Objectionable, i.e. it may be infected with some malicious content.• Red: The client is Objectionable and is infected with some malicious content.
Figure 210: Blocked Network Access
Click the Host status in the table or the graph to view the Filtered Security Heartbeat Reports.
Missing HeartbeatThe report displays number of heartbeats missing per endpoint, in your network.
View the report from Reports > Network & Threats > Security Heartbeat > Missing Heartbeat.
The Report is displayed as a graph as well as in a tabular format.
By default, the report is displayed for the current date. Select the date from the calendar button provided on top of thepage.
The bar graph displays the number of heartbeats missing per endpoint, while the tabular report contains the followinginformation:
• Host Name: Name of the endpoint.• Missing Count: Number of heartbeats missing per endpoint.
Figure 211: Missing Heartbeat
Click the Host Name status in the table or the graph to view the Filtered Missing Heartbeat Reports.
Filtered Missing Heartbeat Report
| Reports | 238
The Missing Heartbeat report can be filtered to get following report:
• Missing Heartbeat.
Missing Heartbeat widgetThe report displays details of heartbeats missing from an endpoint to the server over a selected period of time.
Note: This widget is displayed only when the Missing Heartbeat report is filtered by selecting a Host Name.
The report is displayed in a tabular format.
By default, the report is displayed for the current date. Select the date from the calendar button provided on top of thepage.
The tabular report contains the following information:
• Host IP: IP Address of the endpoint.• Missing From: Displays time in YYYY-MM-DD HH:MM:SS format.• Duration: Displays duration in HH:MM:SS format.
Trend - Missing HeartbeatThis report displays number of endpoints not connected to Sophos UTM during the selected time period..
View the report from Reports > Network & Threats > Security Heartbeat > Trend - Missing Heartbeat.
The Report is displayed as a graph as well as in a tabular format.
By default, the report is displayed for the current date. Report date can be changed from the top most row of the page.
The bar graph displays the number of endpoints not connected to Sophos UTM during a selected time period, whilethe tabular report contains the following information:
• Time: Displays time in YYYY-MM-DD HH:MM:SS format.• Host Count: Number of endpoints not connected to Sophos UTM.
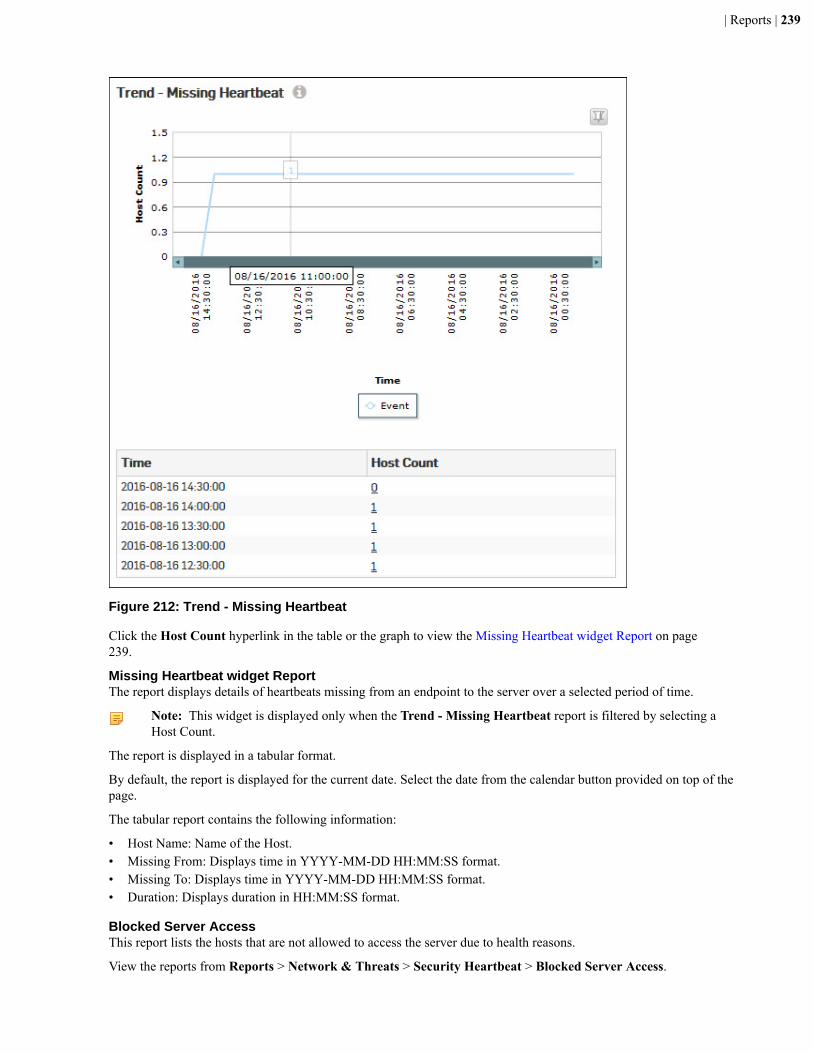
| Reports | 239
Figure 212: Trend - Missing Heartbeat
Click the Host Count hyperlink in the table or the graph to view the Missing Heartbeat widget Report on page239.
Missing Heartbeat widget ReportThe report displays details of heartbeats missing from an endpoint to the server over a selected period of time.
Note: This widget is displayed only when the Trend - Missing Heartbeat report is filtered by selecting aHost Count.
The report is displayed in a tabular format.
By default, the report is displayed for the current date. Select the date from the calendar button provided on top of thepage.
The tabular report contains the following information:
• Host Name: Name of the Host.• Missing From: Displays time in YYYY-MM-DD HH:MM:SS format.• Missing To: Displays time in YYYY-MM-DD HH:MM:SS format.• Duration: Displays duration in HH:MM:SS format.
Blocked Server AccessThis report lists the hosts that are not allowed to access the server due to health reasons.
View the reports from Reports > Network & Threats > Security Heartbeat > Blocked Server Access.
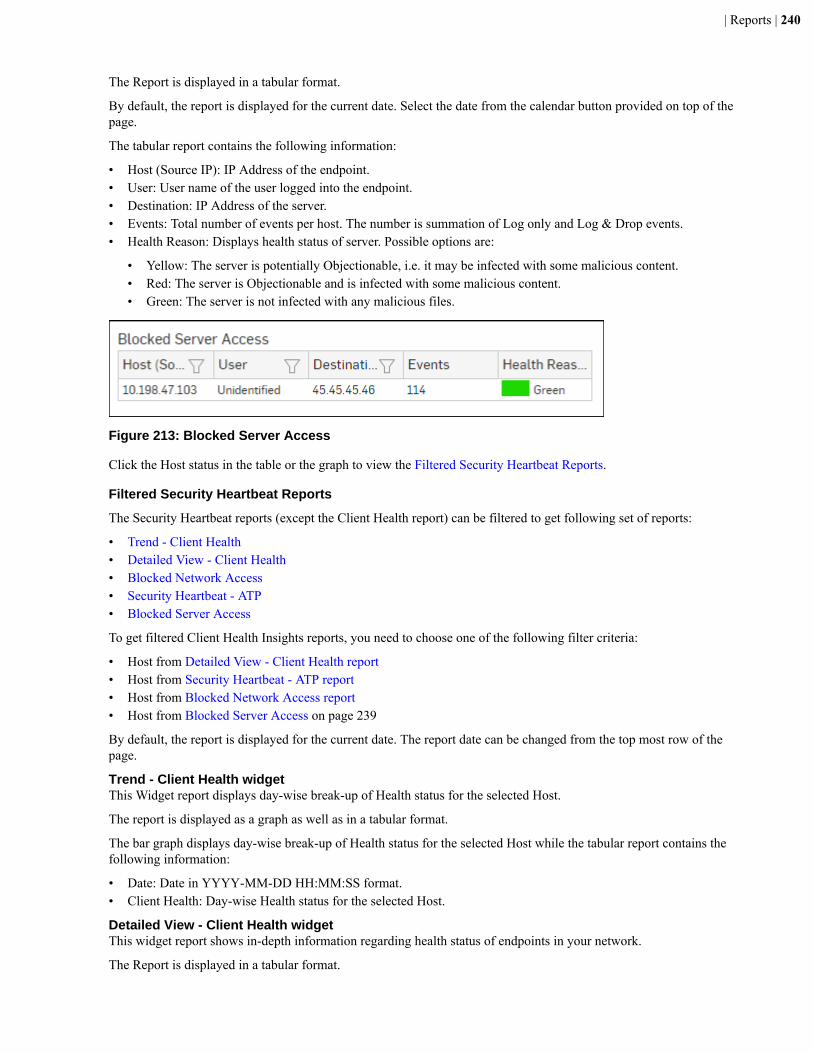
| Reports | 240
The Report is displayed in a tabular format.
By default, the report is displayed for the current date. Select the date from the calendar button provided on top of thepage.
The tabular report contains the following information:
• Host (Source IP): IP Address of the endpoint.• User: User name of the user logged into the endpoint.• Destination: IP Address of the server.• Events: Total number of events per host. The number is summation of Log only and Log & Drop events.• Health Reason: Displays health status of server. Possible options are:
• Yellow: The server is potentially Objectionable, i.e. it may be infected with some malicious content.• Red: The server is Objectionable and is infected with some malicious content.• Green: The server is not infected with any malicious files.
Figure 213: Blocked Server Access
Click the Host status in the table or the graph to view the Filtered Security Heartbeat Reports.
Filtered Security Heartbeat Reports
The Security Heartbeat reports (except the Client Health report) can be filtered to get following set of reports:
• Trend - Client Health• Detailed View - Client Health• Blocked Network Access• Security Heartbeat - ATP• Blocked Server Access
To get filtered Client Health Insights reports, you need to choose one of the following filter criteria:
• Host from Detailed View - Client Health report• Host from Security Heartbeat - ATP report• Host from Blocked Network Access report• Host from Blocked Server Access on page 239
By default, the report is displayed for the current date. The report date can be changed from the top most row of thepage.
Trend - Client Health widgetThis Widget report displays day-wise break-up of Health status for the selected Host.
The report is displayed as a graph as well as in a tabular format.
The bar graph displays day-wise break-up of Health status for the selected Host while the tabular report contains thefollowing information:
• Date: Date in YYYY-MM-DD HH:MM:SS format.• Client Health: Day-wise Health status for the selected Host.
Detailed View - Client Health widgetThis widget report shows in-depth information regarding health status of endpoints in your network.
The Report is displayed in a tabular format.
| Reports | 241
The tabular report contains the following information:
• Host (Source IP): IP Address of the endpoint.• Host Name: Name of the client.• Health - Last Seen: Displays latest health status of the selected endpoint. Possible options are:
• Green: The client is healthy, i.e. not infected with any malicious files.• Yellow: The client is potentially Objectionable, i.e. it may be infected with some malicious content.• Red: The client is Objectionable and is infected with some malicious content.
• Last Health Changed: Displays the date in YYYY-MM-DD HH:MM:SS format when the health of the host waslast changed.
Blocked Network Access widgetThis widget report lists hosts that were denied to access the network due to health reasons.
The Report is displayed in a tabular format.
The tabular report contains the following information:
• Host (Source IP): IP Address of the endpoint.• User: User name of the user logged into the endpoint.• Destination: IP Address of the destination.• Events: Total number of attempts per host. The number is summation of Log only and Log & Drop attempts.• Health Reason: Displays health status. Possible options are:
• Green: The client is healthy, i.e. not infected with any malicious files.• Yellow: The client is potentially Objectionable, i.e. it may be infected with some malicious content.• Red: The client is Objectionable and is infected with some malicious content.
Security Heartbeat - ATP widgetThe report displays advanced threats associated with the endpoints in your network.
Note: This widget is displayed for all Client Health Insights reports except Clint Health.
The Report is displayed in a tabular format.
By default, the report is displayed for the current date. The report date can be changed from the top most row of thepage.
The tabular report contains the following information:
• Host (Source IP): IP Address of the endpoint.• Login User: User name of the user logged into the endpoint.• Process User: Username of the user running the process.• Executable: Name of the infected executable (.exe) file.• Threat: Name of the threat.• Destination: IP Address of the destination.• Event Last Seen: Displays the date in YYYY-MM-DD HH:MM:SS format when the event was last seen.• Attempts: Total number of attempts per host. The number is summation of Log only and Log & Drop attempts.
Blocked Server Access widgetThis report lists hosts that are not allowed to access the server due to health reasons.
The Report is displayed in a tabular format.
The tabular report contains the following information:
• Host: IP Address of the endpoint.• User: User name of the user logged into the endpoint.• Destination: IP Address of the server.• Events: Total number of events per host. The number is summation of Log only and Log & Drop events.
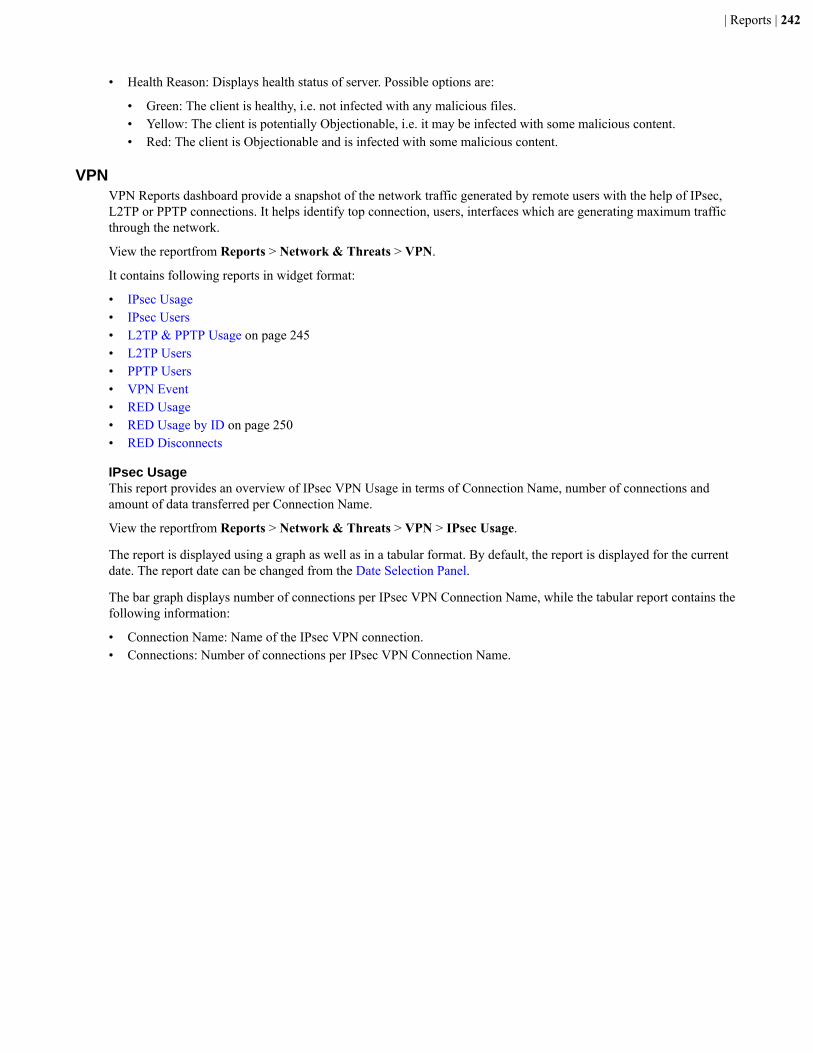
| Reports | 242
• Health Reason: Displays health status of server. Possible options are:
• Green: The client is healthy, i.e. not infected with any malicious files.• Yellow: The client is potentially Objectionable, i.e. it may be infected with some malicious content.• Red: The client is Objectionable and is infected with some malicious content.
VPNVPN Reports dashboard provide a snapshot of the network traffic generated by remote users with the help of IPsec,L2TP or PPTP connections. It helps identify top connection, users, interfaces which are generating maximum trafficthrough the network.
View the reportfrom Reports > Network & Threats > VPN.
It contains following reports in widget format:
• IPsec Usage• IPsec Users• L2TP & PPTP Usage on page 245• L2TP Users• PPTP Users• VPN Event• RED Usage• RED Usage by ID on page 250• RED Disconnects
IPsec UsageThis report provides an overview of IPsec VPN Usage in terms of Connection Name, number of connections andamount of data transferred per Connection Name.
View the reportfrom Reports > Network & Threats > VPN > IPsec Usage.
The report is displayed using a graph as well as in a tabular format. By default, the report is displayed for the currentdate. The report date can be changed from the Date Selection Panel.
The bar graph displays number of connections per IPsec VPN Connection Name, while the tabular report contains thefollowing information:
• Connection Name: Name of the IPsec VPN connection.• Connections: Number of connections per IPsec VPN Connection Name.
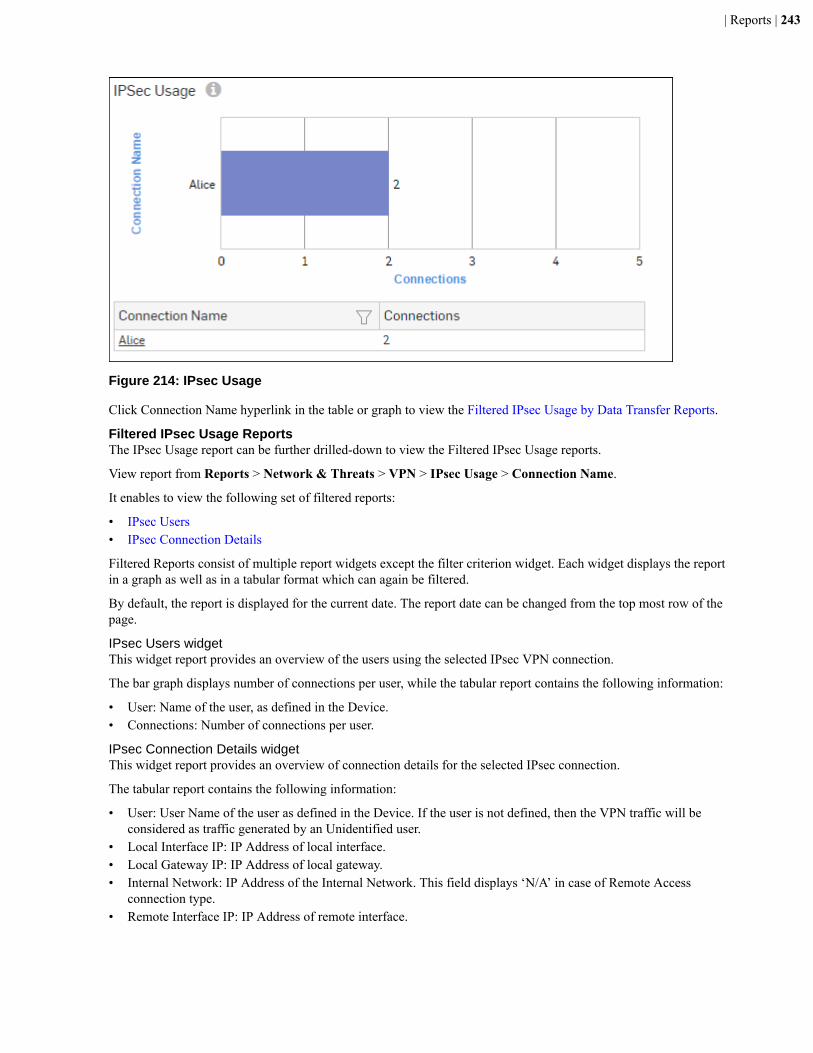
| Reports | 243
Figure 214: IPsec Usage
Click Connection Name hyperlink in the table or graph to view the Filtered IPsec Usage by Data Transfer Reports.
Filtered IPsec Usage ReportsThe IPsec Usage report can be further drilled-down to view the Filtered IPsec Usage reports.
View report from Reports > Network & Threats > VPN > IPsec Usage > Connection Name.
It enables to view the following set of filtered reports:
• IPsec Users• IPsec Connection Details
Filtered Reports consist of multiple report widgets except the filter criterion widget. Each widget displays the reportin a graph as well as in a tabular format which can again be filtered.
By default, the report is displayed for the current date. The report date can be changed from the top most row of thepage.
IPsec Users widgetThis widget report provides an overview of the users using the selected IPsec VPN connection.
The bar graph displays number of connections per user, while the tabular report contains the following information:
• User: Name of the user, as defined in the Device.• Connections: Number of connections per user.
IPsec Connection Details widgetThis widget report provides an overview of connection details for the selected IPsec connection.
The tabular report contains the following information:
• User: User Name of the user as defined in the Device. If the user is not defined, then the VPN traffic will beconsidered as traffic generated by an Unidentified user.
• Local Interface IP: IP Address of local interface.• Local Gateway IP: IP Address of local gateway.• Internal Network: IP Address of the Internal Network. This field displays ‘N/A’ in case of Remote Access
connection type.• Remote Interface IP: IP Address of remote interface.
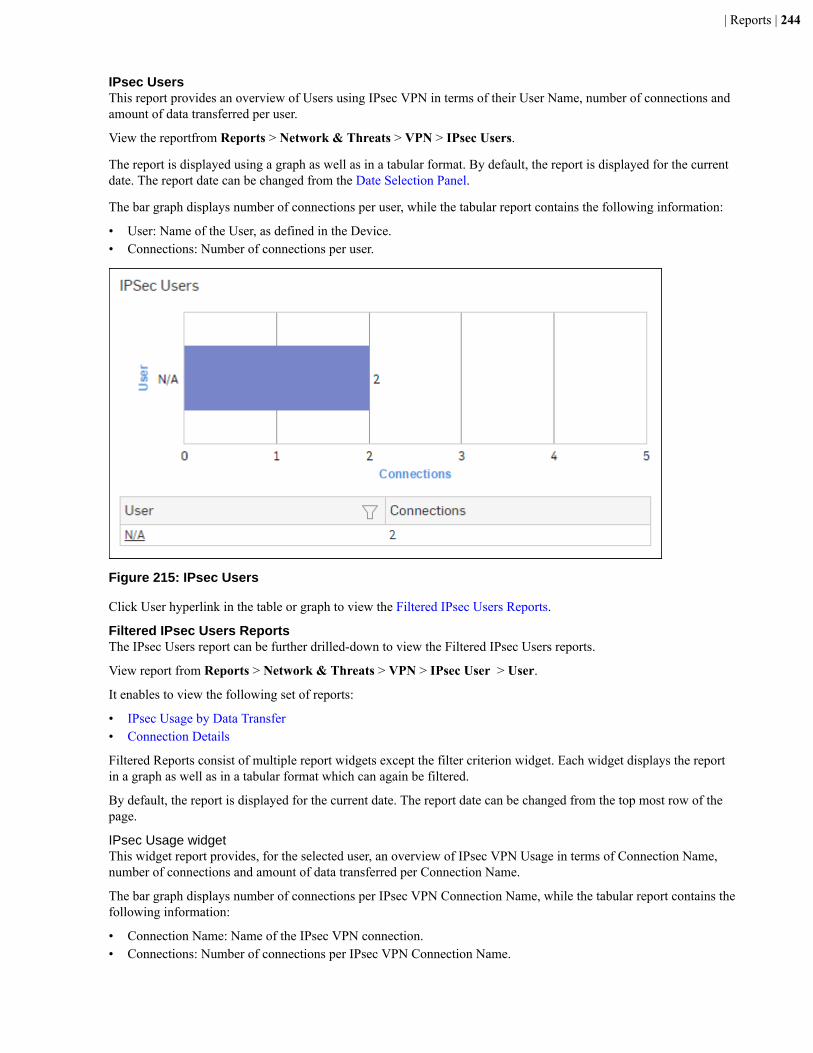
| Reports | 244
IPsec UsersThis report provides an overview of Users using IPsec VPN in terms of their User Name, number of connections andamount of data transferred per user.
View the reportfrom Reports > Network & Threats > VPN > IPsec Users.
The report is displayed using a graph as well as in a tabular format. By default, the report is displayed for the currentdate. The report date can be changed from the Date Selection Panel.
The bar graph displays number of connections per user, while the tabular report contains the following information:
• User: Name of the User, as defined in the Device.• Connections: Number of connections per user.
Figure 215: IPsec Users
Click User hyperlink in the table or graph to view the Filtered IPsec Users Reports.
Filtered IPsec Users ReportsThe IPsec Users report can be further drilled-down to view the Filtered IPsec Users reports.
View report from Reports > Network & Threats > VPN > IPsec User > User.
It enables to view the following set of reports:
• IPsec Usage by Data Transfer• Connection Details
Filtered Reports consist of multiple report widgets except the filter criterion widget. Each widget displays the reportin a graph as well as in a tabular format which can again be filtered.
By default, the report is displayed for the current date. The report date can be changed from the top most row of thepage.
IPsec Usage widgetThis widget report provides, for the selected user, an overview of IPsec VPN Usage in terms of Connection Name,number of connections and amount of data transferred per Connection Name.
The bar graph displays number of connections per IPsec VPN Connection Name, while the tabular report contains thefollowing information:
• Connection Name: Name of the IPsec VPN connection.• Connections: Number of connections per IPsec VPN Connection Name.

| Reports | 245
IPsec Connection Details widgetThis widget report provides an overview of IPsec VPN connection details for the selected user.
The tabular report contains the following information:
• Connection Name: Name of the IPsec VPN connection.• Local Interface IP: IP Address of local interface.• Local Gateway IP: IP Address of local gateway.• Internal Network: IP Address of the Internal Network. This field displays ‘N/A’ in case of Remote Access
connection type.• Remote Interface IP: IP Address of remote interface.
L2TP & PPTP UsageThis report provides an overview of L2TP & PPTP Usage in terms of VPN connection type, number of connectionsand amount of data transferred per VPN type.
View the reportfrom Reports > Network & Threats > VPN > L2TP & PPTP Usage.
The Report is displayed as a graph as well as in a tabular format.
By default, the report is displayed for the current date. Report date can be changed from the top most row of the page.
The bar graph displays the amount of data transfer per VPN connection type, while the tabular report contains thefollowing information:
• VPN Type: Type of VPN connection. Possible options are:
• PPTP• L2TP
• Connections: Number of connections per VPN Type.• Data Transfer: Amount of data transferred (Bytes Sent + Bytes Received) per VPN Type.
Figure 216: L2TP & PPTP Usage
Click VPN Type hyperlink in the table or graph to view the Filtered L2TP & PPTP Usage Reports.
Filtered L2TP & PPTP Usage ReportsThe VPN Usage report can be further drilled-down to view the Filtered VPN Usage Reports.
View report from Reports > Network & Threats > VPN > VPN Usage > VPN Type.
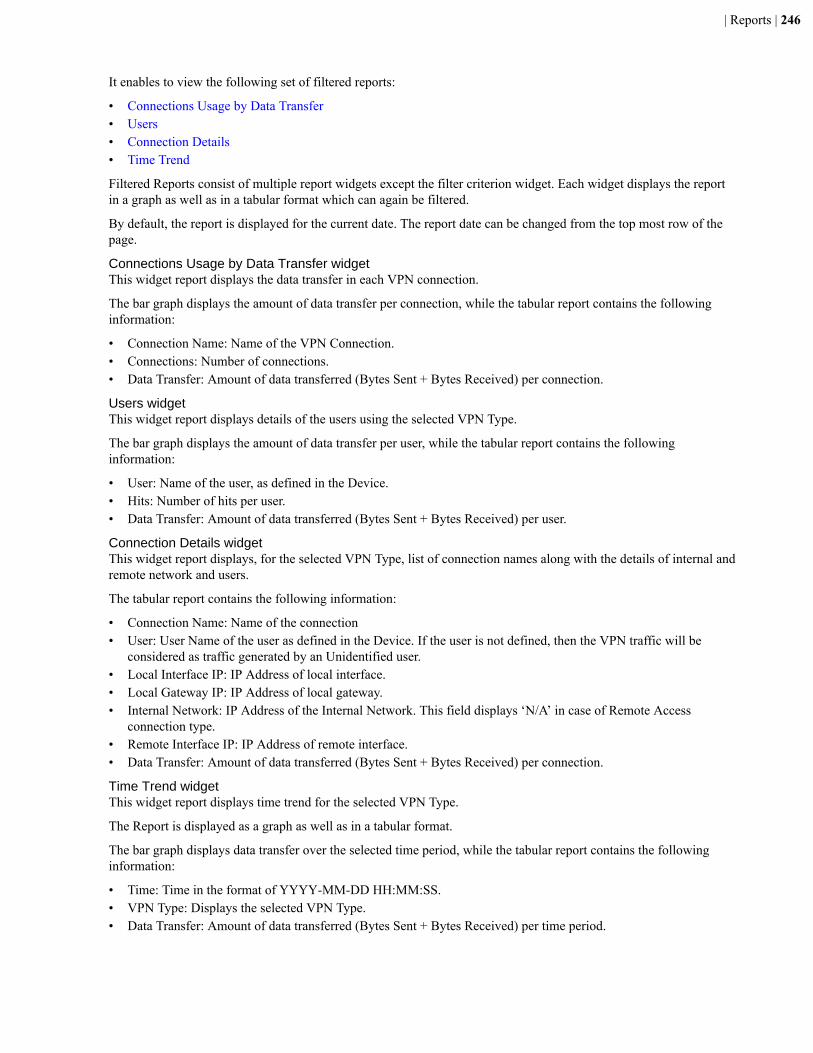
| Reports | 246
It enables to view the following set of filtered reports:
• Connections Usage by Data Transfer• Users• Connection Details• Time Trend
Filtered Reports consist of multiple report widgets except the filter criterion widget. Each widget displays the reportin a graph as well as in a tabular format which can again be filtered.
By default, the report is displayed for the current date. The report date can be changed from the top most row of thepage.
Connections Usage by Data Transfer widgetThis widget report displays the data transfer in each VPN connection.
The bar graph displays the amount of data transfer per connection, while the tabular report contains the followinginformation:
• Connection Name: Name of the VPN Connection.• Connections: Number of connections.• Data Transfer: Amount of data transferred (Bytes Sent + Bytes Received) per connection.
Users widgetThis widget report displays details of the users using the selected VPN Type.
The bar graph displays the amount of data transfer per user, while the tabular report contains the followinginformation:
• User: Name of the user, as defined in the Device.• Hits: Number of hits per user.• Data Transfer: Amount of data transferred (Bytes Sent + Bytes Received) per user.
Connection Details widgetThis widget report displays, for the selected VPN Type, list of connection names along with the details of internal andremote network and users.
The tabular report contains the following information:
• Connection Name: Name of the connection• User: User Name of the user as defined in the Device. If the user is not defined, then the VPN traffic will be
considered as traffic generated by an Unidentified user.• Local Interface IP: IP Address of local interface.• Local Gateway IP: IP Address of local gateway.• Internal Network: IP Address of the Internal Network. This field displays ‘N/A’ in case of Remote Access
connection type.• Remote Interface IP: IP Address of remote interface.• Data Transfer: Amount of data transferred (Bytes Sent + Bytes Received) per connection.
Time Trend widgetThis widget report displays time trend for the selected VPN Type.
The Report is displayed as a graph as well as in a tabular format.
The bar graph displays data transfer over the selected time period, while the tabular report contains the followinginformation:
• Time: Time in the format of YYYY-MM-DD HH:MM:SS.• VPN Type: Displays the selected VPN Type.• Data Transfer: Amount of data transferred (Bytes Sent + Bytes Received) per time period.
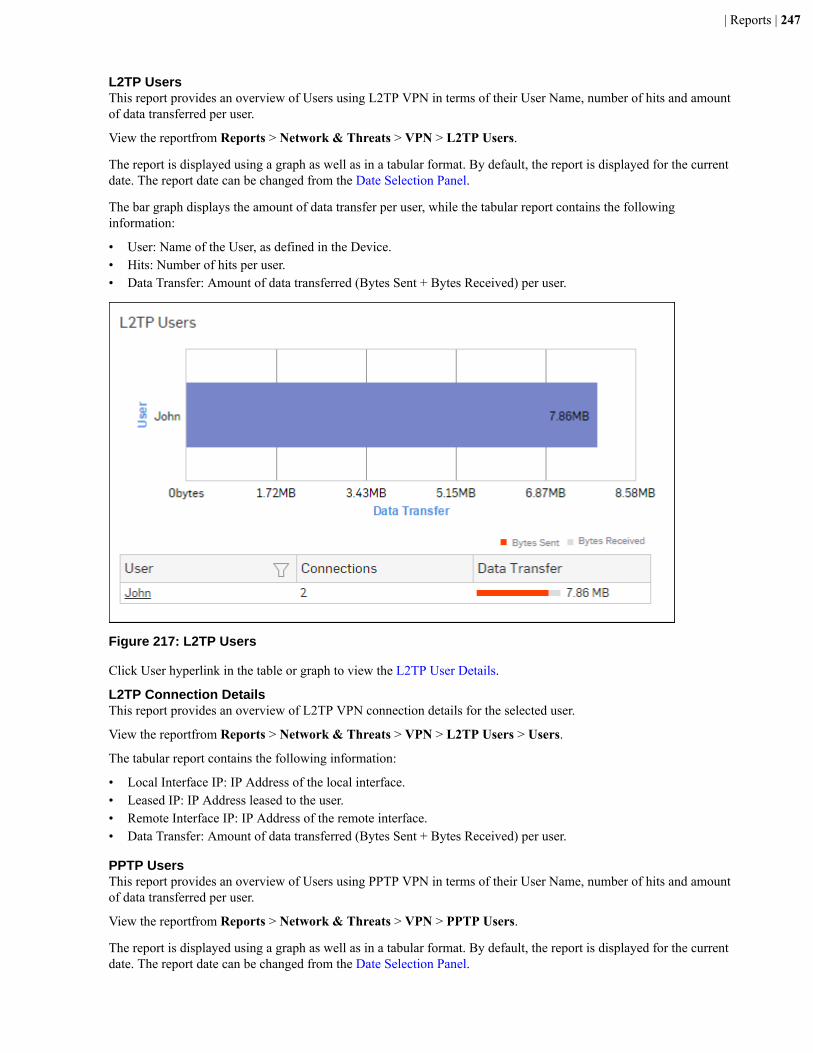
| Reports | 247
L2TP UsersThis report provides an overview of Users using L2TP VPN in terms of their User Name, number of hits and amountof data transferred per user.
View the reportfrom Reports > Network & Threats > VPN > L2TP Users.
The report is displayed using a graph as well as in a tabular format. By default, the report is displayed for the currentdate. The report date can be changed from the Date Selection Panel.
The bar graph displays the amount of data transfer per user, while the tabular report contains the followinginformation:
• User: Name of the User, as defined in the Device.• Hits: Number of hits per user.• Data Transfer: Amount of data transferred (Bytes Sent + Bytes Received) per user.
Figure 217: L2TP Users
Click User hyperlink in the table or graph to view the L2TP User Details.
L2TP Connection DetailsThis report provides an overview of L2TP VPN connection details for the selected user.
View the reportfrom Reports > Network & Threats > VPN > L2TP Users > Users.
The tabular report contains the following information:
• Local Interface IP: IP Address of the local interface.• Leased IP: IP Address leased to the user.• Remote Interface IP: IP Address of the remote interface.• Data Transfer: Amount of data transferred (Bytes Sent + Bytes Received) per user.
PPTP UsersThis report provides an overview of Users using PPTP VPN in terms of their User Name, number of hits and amountof data transferred per user.
View the reportfrom Reports > Network & Threats > VPN > PPTP Users.
The report is displayed using a graph as well as in a tabular format. By default, the report is displayed for the currentdate. The report date can be changed from the Date Selection Panel.
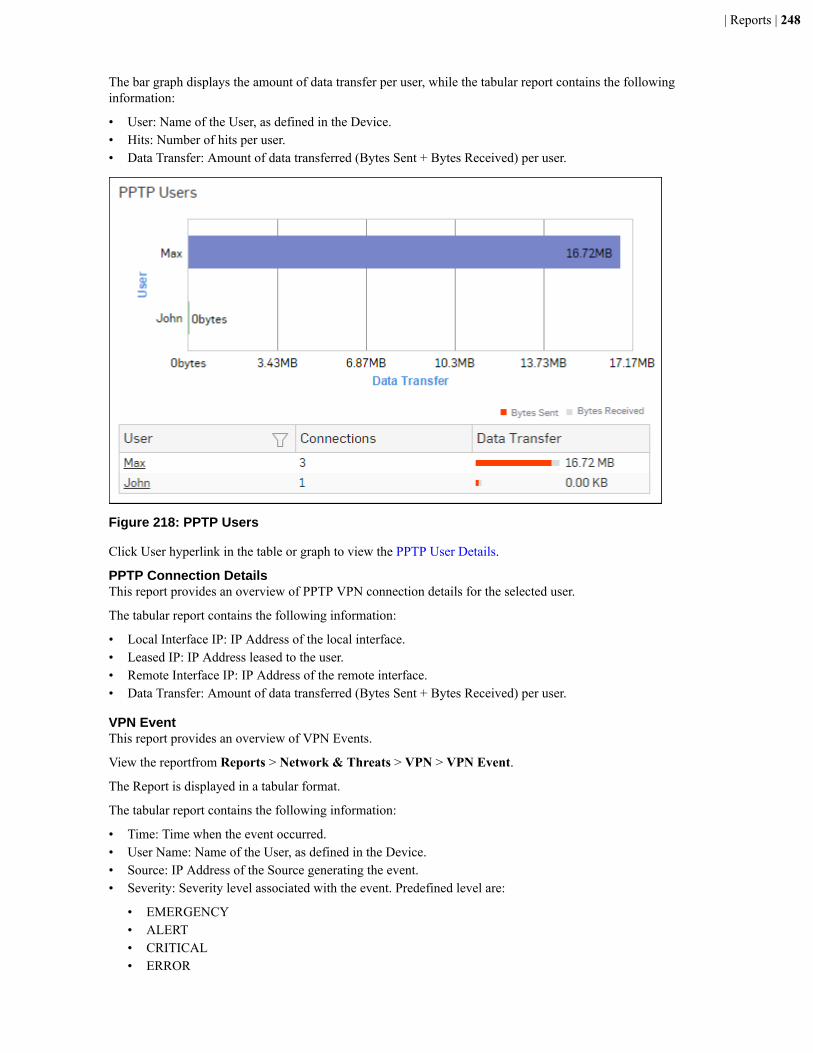
| Reports | 248
The bar graph displays the amount of data transfer per user, while the tabular report contains the followinginformation:
• User: Name of the User, as defined in the Device.• Hits: Number of hits per user.• Data Transfer: Amount of data transferred (Bytes Sent + Bytes Received) per user.
Figure 218: PPTP Users
Click User hyperlink in the table or graph to view the PPTP User Details.
PPTP Connection DetailsThis report provides an overview of PPTP VPN connection details for the selected user.
The tabular report contains the following information:
• Local Interface IP: IP Address of the local interface.• Leased IP: IP Address leased to the user.• Remote Interface IP: IP Address of the remote interface.• Data Transfer: Amount of data transferred (Bytes Sent + Bytes Received) per user.
VPN EventThis report provides an overview of VPN Events.
View the reportfrom Reports > Network & Threats > VPN > VPN Event.
The Report is displayed in a tabular format.
The tabular report contains the following information:
• Time: Time when the event occurred.• User Name: Name of the User, as defined in the Device.• Source: IP Address of the Source generating the event.• Severity: Severity level associated with the event. Predefined level are:
• EMERGENCY• ALERT• CRITICAL• ERROR
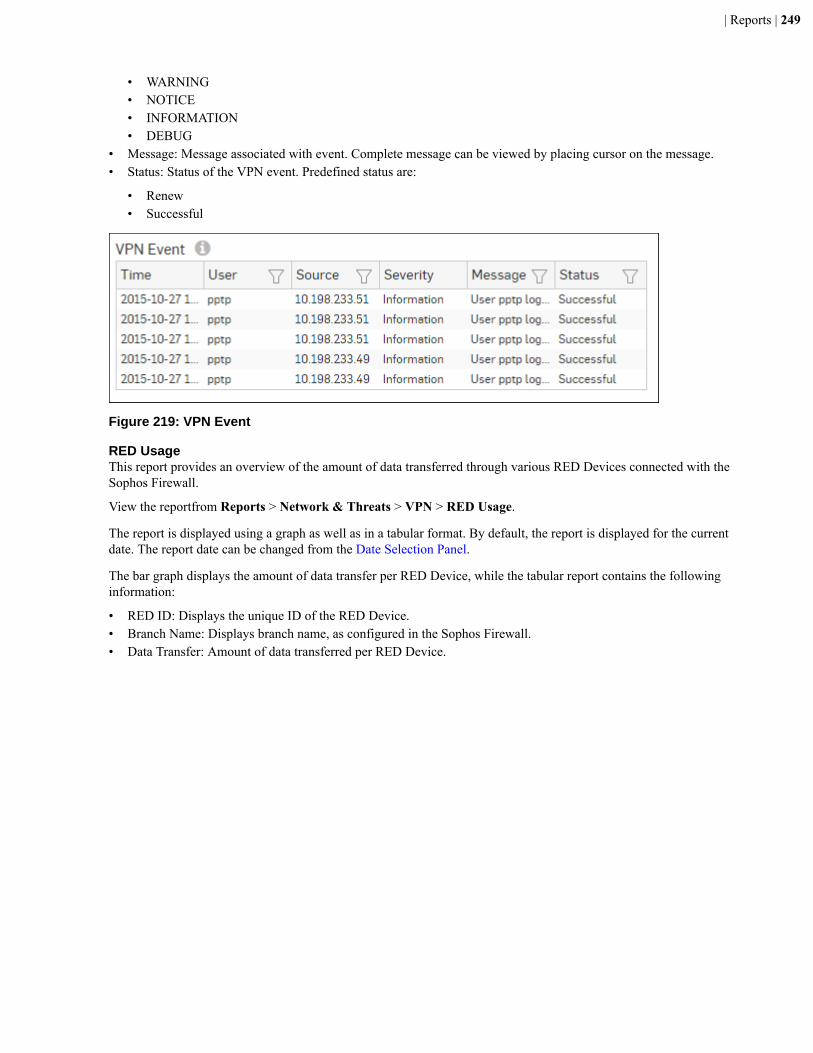
| Reports | 249
• WARNING• NOTICE• INFORMATION• DEBUG
• Message: Message associated with event. Complete message can be viewed by placing cursor on the message.• Status: Status of the VPN event. Predefined status are:
• Renew• Successful
Figure 219: VPN Event
RED UsageThis report provides an overview of the amount of data transferred through various RED Devices connected with theSophos Firewall.
View the reportfrom Reports > Network & Threats > VPN > RED Usage.
The report is displayed using a graph as well as in a tabular format. By default, the report is displayed for the currentdate. The report date can be changed from the Date Selection Panel.
The bar graph displays the amount of data transfer per RED Device, while the tabular report contains the followinginformation:
• RED ID: Displays the unique ID of the RED Device.• Branch Name: Displays branch name, as configured in the Sophos Firewall.• Data Transfer: Amount of data transferred per RED Device.
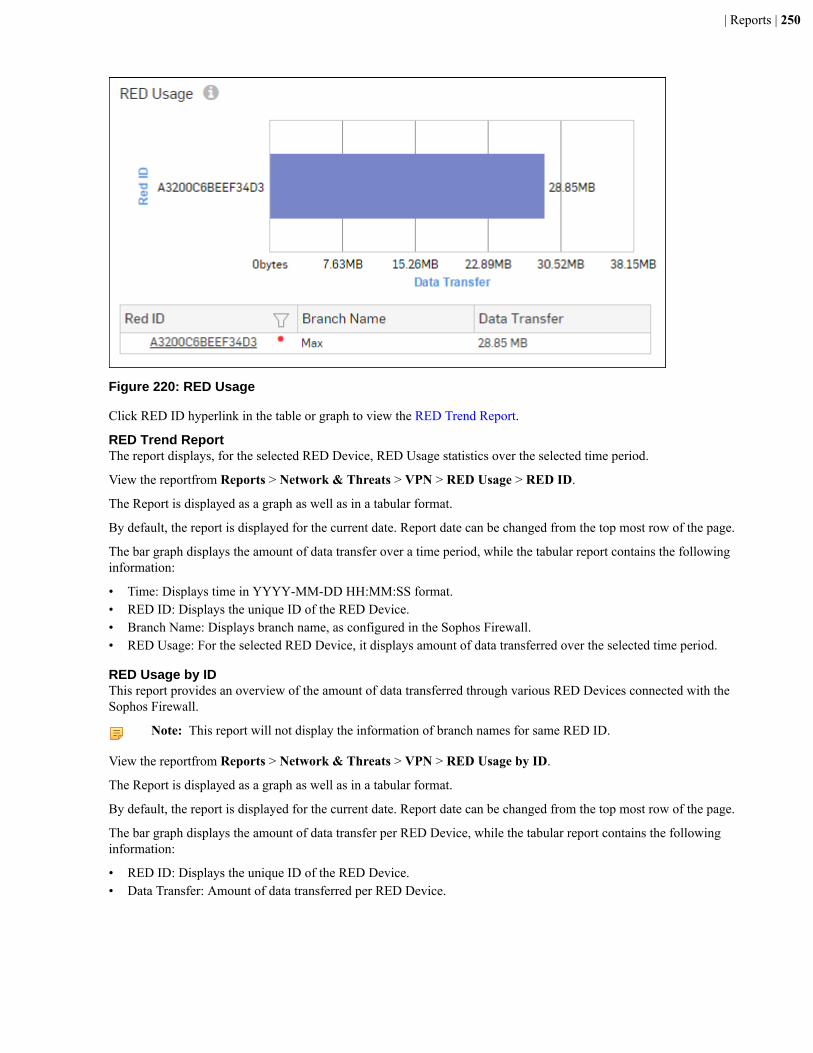
| Reports | 250
Figure 220: RED Usage
Click RED ID hyperlink in the table or graph to view the RED Trend Report.
RED Trend ReportThe report displays, for the selected RED Device, RED Usage statistics over the selected time period.
View the reportfrom Reports > Network & Threats > VPN > RED Usage > RED ID.
The Report is displayed as a graph as well as in a tabular format.
By default, the report is displayed for the current date. Report date can be changed from the top most row of the page.
The bar graph displays the amount of data transfer over a time period, while the tabular report contains the followinginformation:
• Time: Displays time in YYYY-MM-DD HH:MM:SS format.• RED ID: Displays the unique ID of the RED Device.• Branch Name: Displays branch name, as configured in the Sophos Firewall.• RED Usage: For the selected RED Device, it displays amount of data transferred over the selected time period.
RED Usage by IDThis report provides an overview of the amount of data transferred through various RED Devices connected with theSophos Firewall.
Note: This report will not display the information of branch names for same RED ID.
View the reportfrom Reports > Network & Threats > VPN > RED Usage by ID.
The Report is displayed as a graph as well as in a tabular format.
By default, the report is displayed for the current date. Report date can be changed from the top most row of the page.
The bar graph displays the amount of data transfer per RED Device, while the tabular report contains the followinginformation:
• RED ID: Displays the unique ID of the RED Device.• Data Transfer: Amount of data transferred per RED Device.
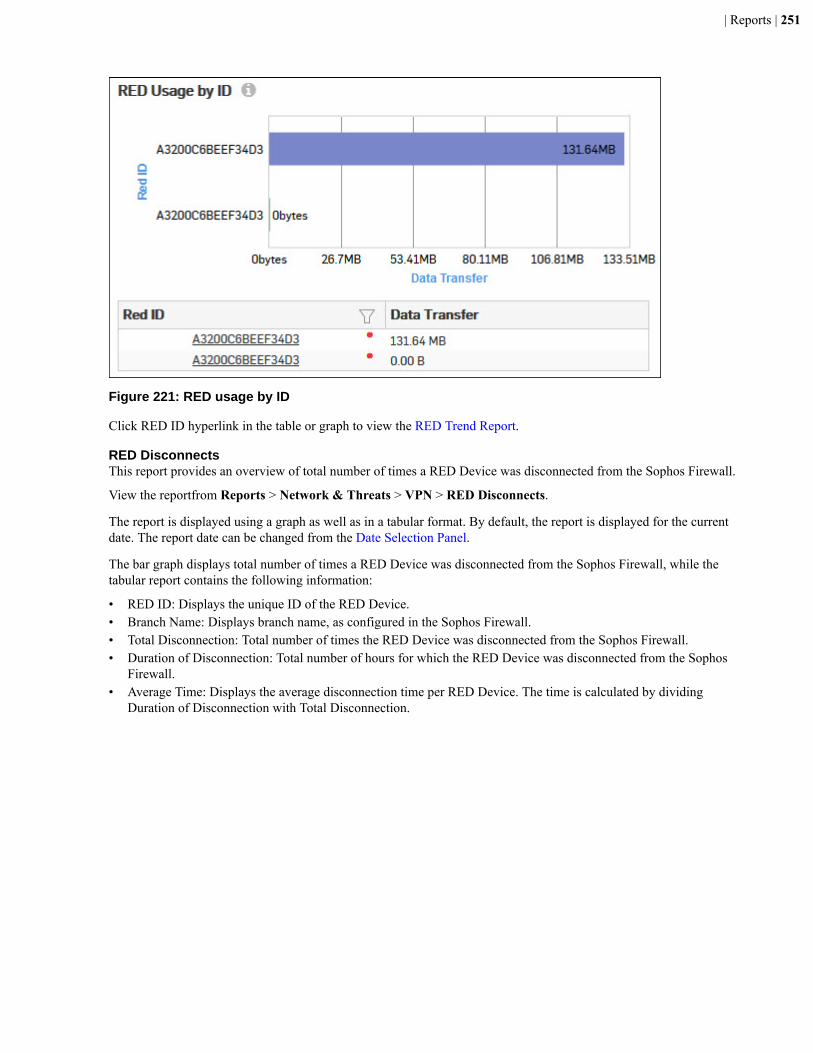
| Reports | 251
Figure 221: RED usage by ID
Click RED ID hyperlink in the table or graph to view the RED Trend Report.
RED DisconnectsThis report provides an overview of total number of times a RED Device was disconnected from the Sophos Firewall.
View the reportfrom Reports > Network & Threats > VPN > RED Disconnects.
The report is displayed using a graph as well as in a tabular format. By default, the report is displayed for the currentdate. The report date can be changed from the Date Selection Panel.
The bar graph displays total number of times a RED Device was disconnected from the Sophos Firewall, while thetabular report contains the following information:
• RED ID: Displays the unique ID of the RED Device.• Branch Name: Displays branch name, as configured in the Sophos Firewall.• Total Disconnection: Total number of times the RED Device was disconnected from the Sophos Firewall.• Duration of Disconnection: Total number of hours for which the RED Device was disconnected from the Sophos
Firewall.• Average Time: Displays the average disconnection time per RED Device. The time is calculated by dividing
Duration of Disconnection with Total Disconnection.
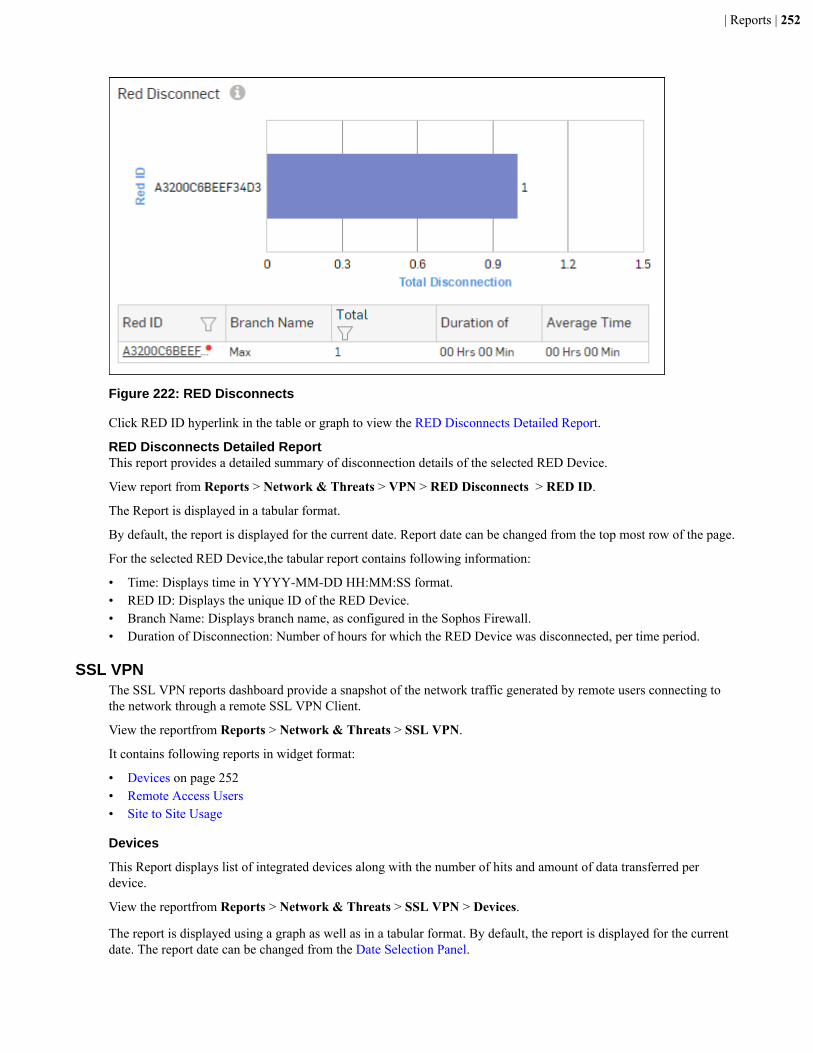
| Reports | 252
Figure 222: RED Disconnects
Click RED ID hyperlink in the table or graph to view the RED Disconnects Detailed Report.
RED Disconnects Detailed ReportThis report provides a detailed summary of disconnection details of the selected RED Device.
View report from Reports > Network & Threats > VPN > RED Disconnects > RED ID.
The Report is displayed in a tabular format.
By default, the report is displayed for the current date. Report date can be changed from the top most row of the page.
For the selected RED Device,the tabular report contains following information:
• Time: Displays time in YYYY-MM-DD HH:MM:SS format.• RED ID: Displays the unique ID of the RED Device.• Branch Name: Displays branch name, as configured in the Sophos Firewall.• Duration of Disconnection: Number of hours for which the RED Device was disconnected, per time period.
SSL VPNThe SSL VPN reports dashboard provide a snapshot of the network traffic generated by remote users connecting tothe network through a remote SSL VPN Client.
View the reportfrom Reports > Network & Threats > SSL VPN.
It contains following reports in widget format:
• Devices on page 252• Remote Access Users• Site to Site Usage
Devices
This Report displays list of integrated devices along with the number of hits and amount of data transferred perdevice.
View the reportfrom Reports > Network & Threats > SSL VPN > Devices.
The report is displayed using a graph as well as in a tabular format. By default, the report is displayed for the currentdate. The report date can be changed from the Date Selection Panel.

| Reports | 253
The bar graph displays amount of data transfer per device while the tabular report contains the following information:
• Device Name: Name of the device.• Device Type: Type of the device.• Hits: Number of hits from the device.• Bytes: Amount of data transferred.
Figure 223: Devices
Remote Access UsersThis report displays details of the users using the Remote Access VPN Type.
View the reportfrom Reports > Network & Threats > SSL VPN > Remote Access Users.
The Report is displayed as a graph as well as in a tabular format.
By default, the report is displayed for the current date. Report date can be changed from the top most row of the page.
The bar graph displays the amount of data transfer per user, while the tabular report contains the followinginformation:
• User Name: Name of the user, as defined in the Device.• Connections: Number of connections per user.• Data Transfer: Amount of data transferred (Bytes Sent + Bytes Received) per user.
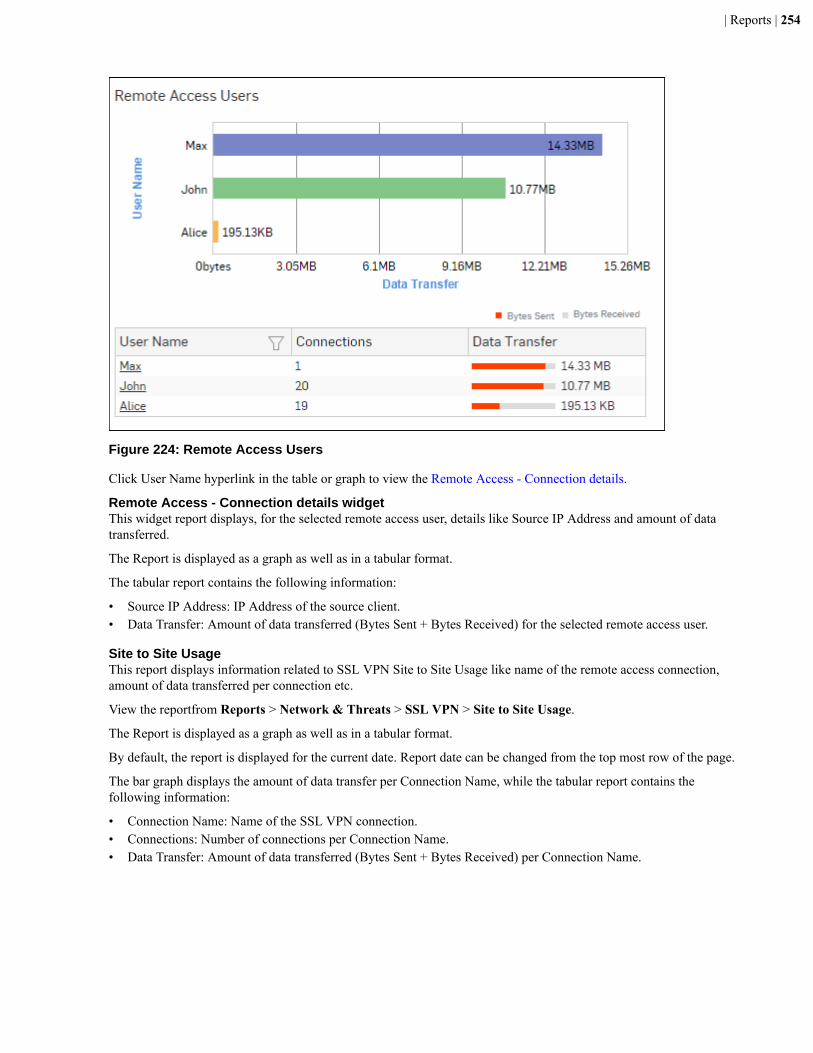
| Reports | 254
Figure 224: Remote Access Users
Click User Name hyperlink in the table or graph to view the Remote Access - Connection details.
Remote Access - Connection details widgetThis widget report displays, for the selected remote access user, details like Source IP Address and amount of datatransferred.
The Report is displayed as a graph as well as in a tabular format.
The tabular report contains the following information:
• Source IP Address: IP Address of the source client.• Data Transfer: Amount of data transferred (Bytes Sent + Bytes Received) for the selected remote access user.
Site to Site UsageThis report displays information related to SSL VPN Site to Site Usage like name of the remote access connection,amount of data transferred per connection etc.
View the reportfrom Reports > Network & Threats > SSL VPN > Site to Site Usage.
The Report is displayed as a graph as well as in a tabular format.
By default, the report is displayed for the current date. Report date can be changed from the top most row of the page.
The bar graph displays the amount of data transfer per Connection Name, while the tabular report contains thefollowing information:
• Connection Name: Name of the SSL VPN connection.• Connections: Number of connections per Connection Name.• Data Transfer: Amount of data transferred (Bytes Sent + Bytes Received) per Connection Name.
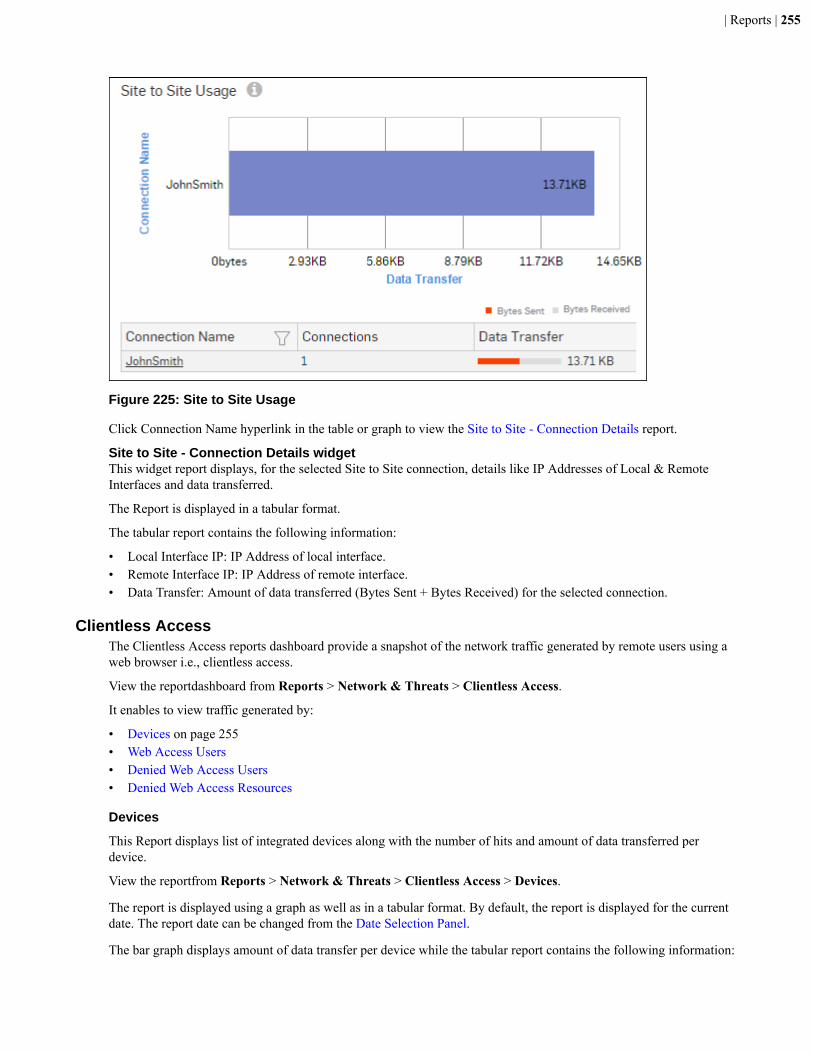
| Reports | 255
Figure 225: Site to Site Usage
Click Connection Name hyperlink in the table or graph to view the Site to Site - Connection Details report.
Site to Site - Connection Details widgetThis widget report displays, for the selected Site to Site connection, details like IP Addresses of Local & RemoteInterfaces and data transferred.
The Report is displayed in a tabular format.
The tabular report contains the following information:
• Local Interface IP: IP Address of local interface.• Remote Interface IP: IP Address of remote interface.• Data Transfer: Amount of data transferred (Bytes Sent + Bytes Received) for the selected connection.
Clientless AccessThe Clientless Access reports dashboard provide a snapshot of the network traffic generated by remote users using aweb browser i.e., clientless access.
View the reportdashboard from Reports > Network & Threats > Clientless Access.
It enables to view traffic generated by:
• Devices on page 255• Web Access Users• Denied Web Access Users• Denied Web Access Resources
Devices
This Report displays list of integrated devices along with the number of hits and amount of data transferred perdevice.
View the reportfrom Reports > Network & Threats > Clientless Access > Devices.
The report is displayed using a graph as well as in a tabular format. By default, the report is displayed for the currentdate. The report date can be changed from the Date Selection Panel.
The bar graph displays amount of data transfer per device while the tabular report contains the following information:
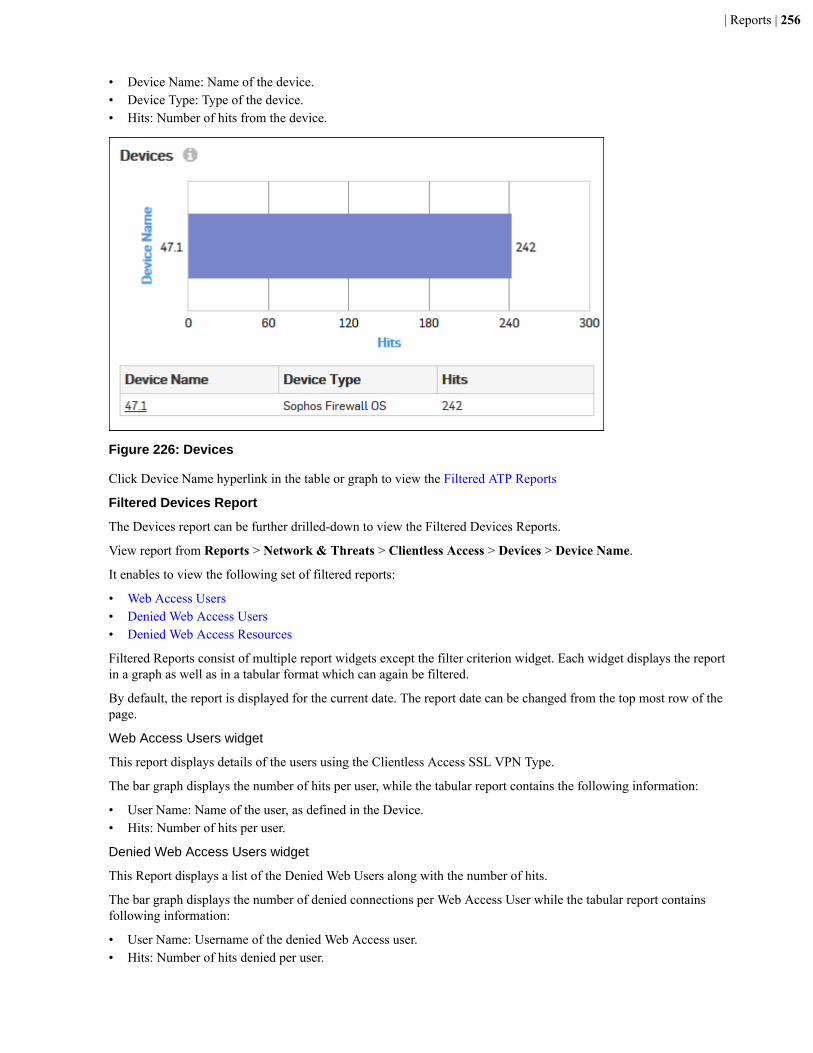
| Reports | 256
• Device Name: Name of the device.• Device Type: Type of the device.• Hits: Number of hits from the device.
Figure 226: Devices
Click Device Name hyperlink in the table or graph to view the Filtered ATP Reports
Filtered Devices Report
The Devices report can be further drilled-down to view the Filtered Devices Reports.
View report from Reports > Network & Threats > Clientless Access > Devices > Device Name.
It enables to view the following set of filtered reports:
• Web Access Users• Denied Web Access Users• Denied Web Access Resources
Filtered Reports consist of multiple report widgets except the filter criterion widget. Each widget displays the reportin a graph as well as in a tabular format which can again be filtered.
By default, the report is displayed for the current date. The report date can be changed from the top most row of thepage.
Web Access Users widget
This report displays details of the users using the Clientless Access SSL VPN Type.
The bar graph displays the number of hits per user, while the tabular report contains the following information:
• User Name: Name of the user, as defined in the Device.• Hits: Number of hits per user.
Denied Web Access Users widget
This Report displays a list of the Denied Web Users along with the number of hits.
The bar graph displays the number of denied connections per Web Access User while the tabular report containsfollowing information:
• User Name: Username of the denied Web Access user.• Hits: Number of hits denied per user.
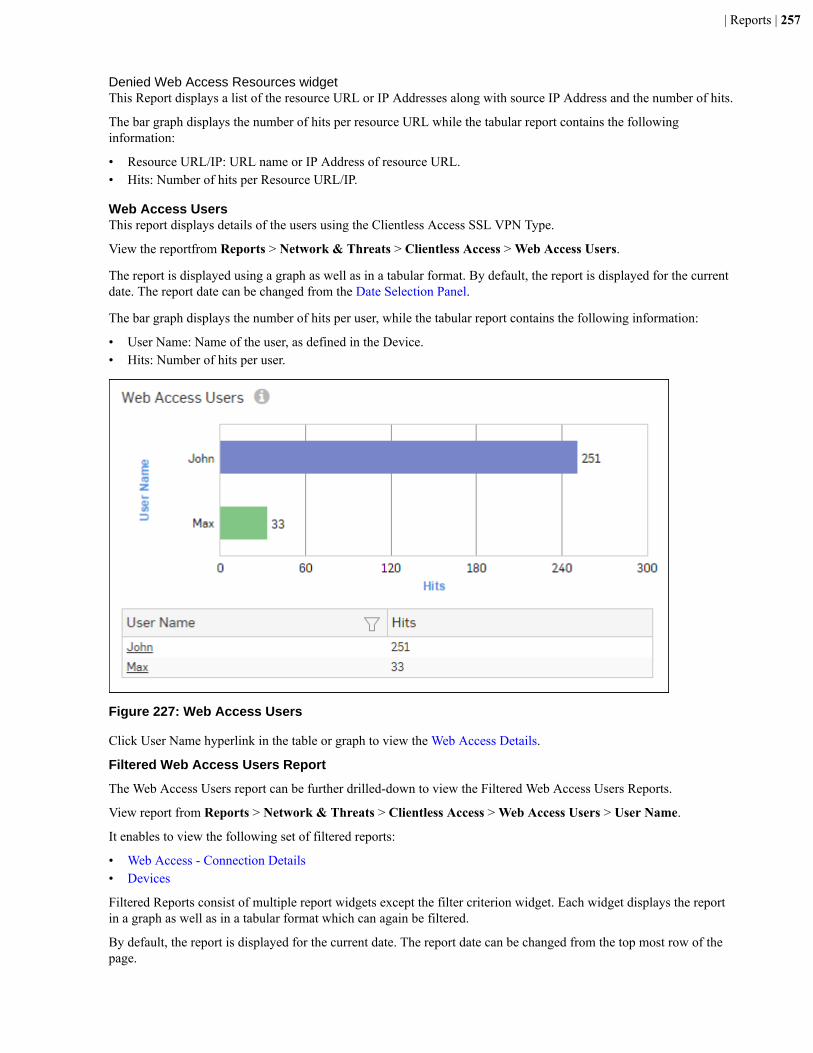
| Reports | 257
Denied Web Access Resources widgetThis Report displays a list of the resource URL or IP Addresses along with source IP Address and the number of hits.
The bar graph displays the number of hits per resource URL while the tabular report contains the followinginformation:
• Resource URL/IP: URL name or IP Address of resource URL.• Hits: Number of hits per Resource URL/IP.
Web Access UsersThis report displays details of the users using the Clientless Access SSL VPN Type.
View the reportfrom Reports > Network & Threats > Clientless Access > Web Access Users.
The report is displayed using a graph as well as in a tabular format. By default, the report is displayed for the currentdate. The report date can be changed from the Date Selection Panel.
The bar graph displays the number of hits per user, while the tabular report contains the following information:
• User Name: Name of the user, as defined in the Device.• Hits: Number of hits per user.
Figure 227: Web Access Users
Click User Name hyperlink in the table or graph to view the Web Access Details.
Filtered Web Access Users Report
The Web Access Users report can be further drilled-down to view the Filtered Web Access Users Reports.
View report from Reports > Network & Threats > Clientless Access > Web Access Users > User Name.
It enables to view the following set of filtered reports:
• Web Access - Connection Details• Devices
Filtered Reports consist of multiple report widgets except the filter criterion widget. Each widget displays the reportin a graph as well as in a tabular format which can again be filtered.
By default, the report is displayed for the current date. The report date can be changed from the top most row of thepage.
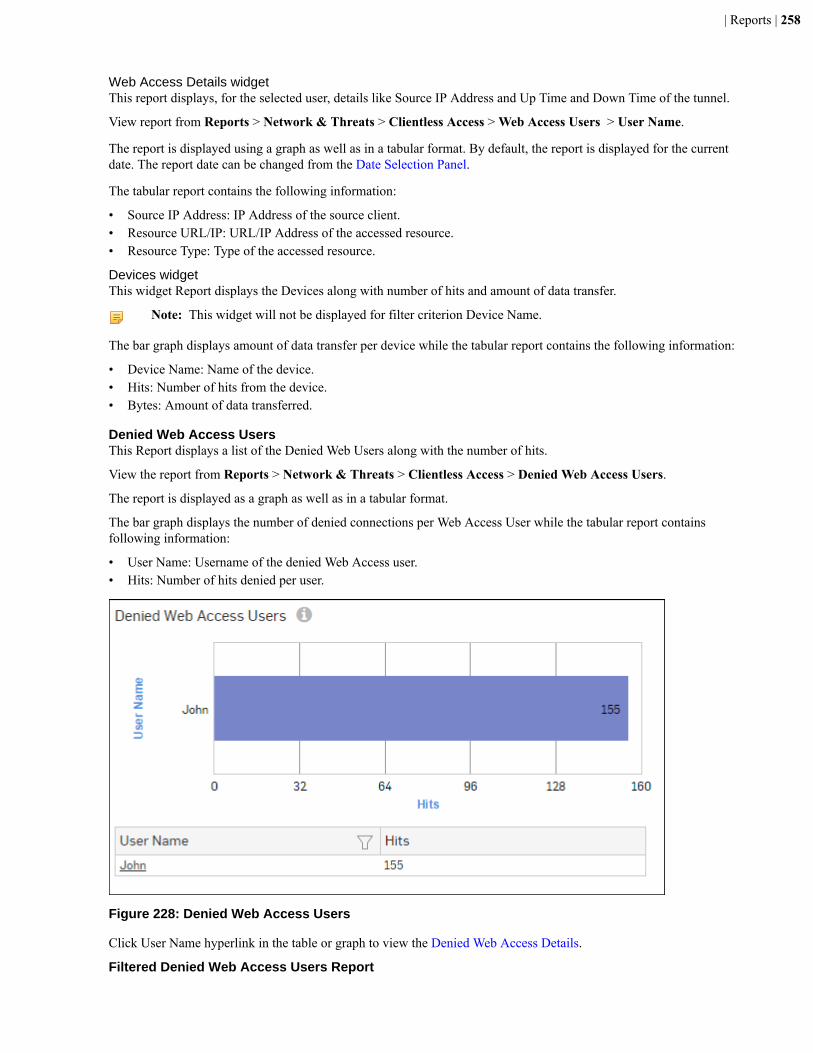
| Reports | 258
Web Access Details widgetThis report displays, for the selected user, details like Source IP Address and Up Time and Down Time of the tunnel.
View report from Reports > Network & Threats > Clientless Access > Web Access Users > User Name.
The report is displayed using a graph as well as in a tabular format. By default, the report is displayed for the currentdate. The report date can be changed from the Date Selection Panel.
The tabular report contains the following information:
• Source IP Address: IP Address of the source client.• Resource URL/IP: URL/IP Address of the accessed resource.• Resource Type: Type of the accessed resource.
Devices widgetThis widget Report displays the Devices along with number of hits and amount of data transfer.
Note: This widget will not be displayed for filter criterion Device Name.
The bar graph displays amount of data transfer per device while the tabular report contains the following information:
• Device Name: Name of the device.• Hits: Number of hits from the device.• Bytes: Amount of data transferred.
Denied Web Access UsersThis Report displays a list of the Denied Web Users along with the number of hits.
View the report from Reports > Network & Threats > Clientless Access > Denied Web Access Users.
The report is displayed as a graph as well as in a tabular format.
The bar graph displays the number of denied connections per Web Access User while the tabular report containsfollowing information:
• User Name: Username of the denied Web Access user.• Hits: Number of hits denied per user.
Figure 228: Denied Web Access Users
Click User Name hyperlink in the table or graph to view the Denied Web Access Details.
Filtered Denied Web Access Users Report
| Reports | 259
The Denied Web Access Users report can be further drilled-down to view the Filtered Denied Web Access UsersReports.
View report from Reports > Network & Threats > Clientless Access > Denied Web Access Users > User Name.
It enables to view the following set of filtered reports:
• Denied Web Access - Connection Details• Devices
Filtered Reports consist of multiple report widgets except the filter criterion widget. Each widget displays the reportin a graph as well as in a tabular format which can again be filtered.
By default, the report is displayed for the current date. The report date can be changed from the top most row of thepage.
Devices widgetThis widget Report displays the Devices along with number of hits.
Note: This widget will not be displayed for filter criterion Device Name.
The bar graph displays amount of data transfer per device while the tabular report contains the following information:
• Device Name: Name of the device.• Device Type: Type of the device.• Hits: Number of hits from the device.
Denied Web Access Connection DetailsThis Report displays a list of the resource URL/ IP Address along with the source IP Address and the number of hits.
View the report from Reports > Network & Threats > Clientless Access > Denied Web Access Users > UserName.
The bar graph displays the number of times the access to a particular resource URL was denied while the tabularreport contains the following information:
• Resource URL/IP: URL name or IP Address of the resource URL.• Source IP: IP Address of the source.• Hits: Number of denied hits per resource.
Denied Web Access ResourcesThis Report displays a list of the resource URL or IP Addresses along with source IP Address and the number of hits.
View report from Reports > Network & Threats > Clientless Access > Denied Web Access Resources.
The report is displayed as a graph as well as in a tabular format.
The bar graph displays the number of hits per resource URL while the tabular report contains the followinginformation:
• Resource URL/IP: URL name or IP Address of resource URL.• Hits: Number of hits per Resource URL/IP.

| Reports | 260
Figure 229: Denied Wed Access Resources
Click Device Name hyperlink in the table or graph to view the Denied Web Access Details.
Filtered Denied Web Access Resources Report
The Denied Web Access Resources report can be further drilled-down to view the Filtered Denied Web AccessResources Reports.
View report from Reports > Network & Threats > Clientless Access > Denied Web Access Resources > ResourceURL/IP.
It enables to view the following set of filtered reports:
• Devices• Denied Web Access Details
Filtered Reports consist of multiple report widgets except the filter criterion widget. Each widget displays the reportin a graph as well as in a tabular format which can again be filtered.
By default, the report is displayed for the current date. The report date can be changed from the top most row of thepage.
Devices widgetThis widget Report displays the Devices along with number of hits and amount of data transfer.
Note: This widget will not be displayed for filter criterion Device Name.
The bar graph displays amount of data transfer per device while the tabular report contains the following information:
• Device Name: Name of the device.• Device Type: Type of the device.• Hits: Number of hits from the device.
Denied Web Access DetailsThis Report displays a list of the resource URL/ IP Address along with the source IP Address and the number of hits.
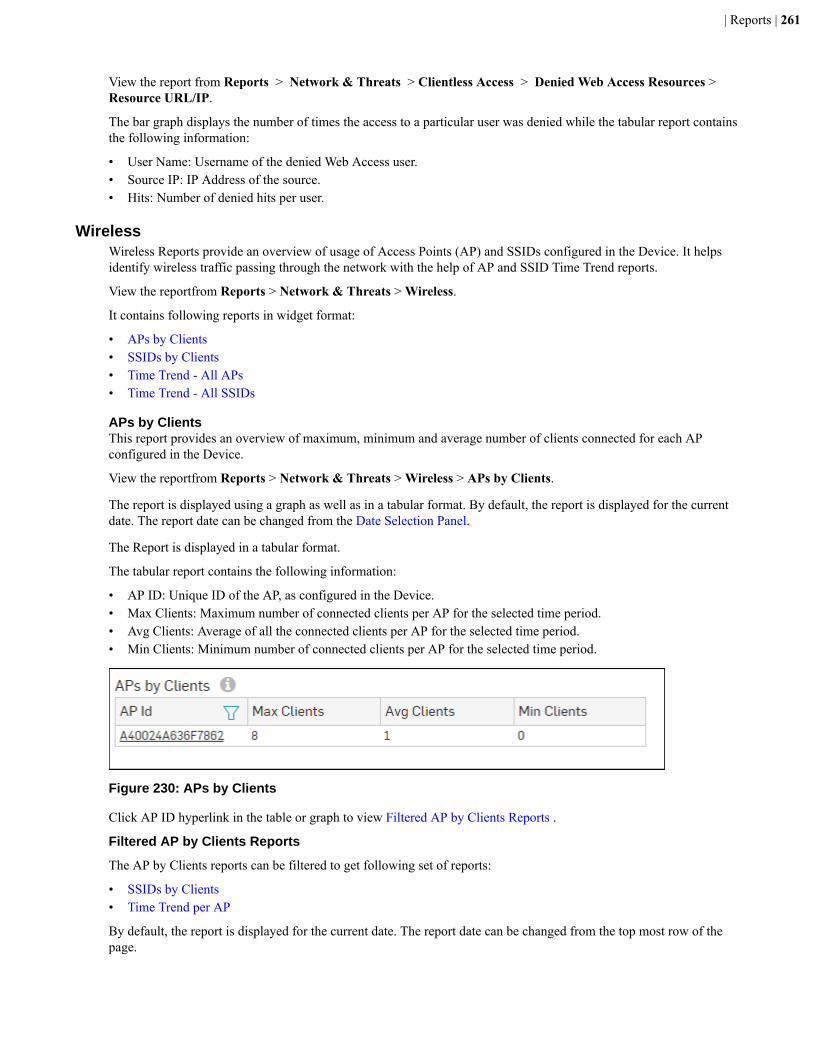
| Reports | 261
View the report from Reports > Network & Threats > Clientless Access > Denied Web Access Resources >Resource URL/IP.
The bar graph displays the number of times the access to a particular user was denied while the tabular report containsthe following information:
• User Name: Username of the denied Web Access user.• Source IP: IP Address of the source.• Hits: Number of denied hits per user.
WirelessWireless Reports provide an overview of usage of Access Points (AP) and SSIDs configured in the Device. It helpsidentify wireless traffic passing through the network with the help of AP and SSID Time Trend reports.
View the reportfrom Reports > Network & Threats > Wireless.
It contains following reports in widget format:
• APs by Clients• SSIDs by Clients• Time Trend - All APs• Time Trend - All SSIDs
APs by ClientsThis report provides an overview of maximum, minimum and average number of clients connected for each APconfigured in the Device.
View the reportfrom Reports > Network & Threats > Wireless > APs by Clients.
The report is displayed using a graph as well as in a tabular format. By default, the report is displayed for the currentdate. The report date can be changed from the Date Selection Panel.
The Report is displayed in a tabular format.
The tabular report contains the following information:
• AP ID: Unique ID of the AP, as configured in the Device.• Max Clients: Maximum number of connected clients per AP for the selected time period.• Avg Clients: Average of all the connected clients per AP for the selected time period.• Min Clients: Minimum number of connected clients per AP for the selected time period.
Figure 230: APs by Clients
Click AP ID hyperlink in the table or graph to view Filtered AP by Clients Reports .
Filtered AP by Clients Reports
The AP by Clients reports can be filtered to get following set of reports:
• SSIDs by Clients• Time Trend per AP
By default, the report is displayed for the current date. The report date can be changed from the top most row of thepage.
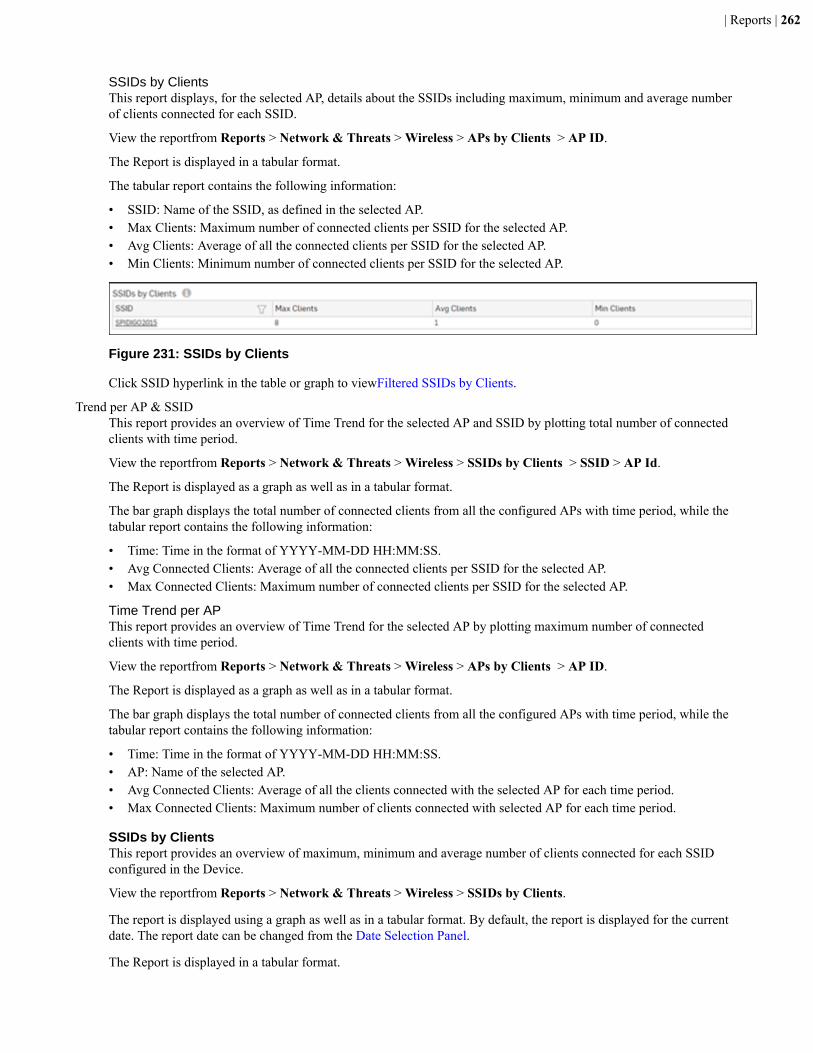
| Reports | 262
SSIDs by ClientsThis report displays, for the selected AP, details about the SSIDs including maximum, minimum and average numberof clients connected for each SSID.
View the reportfrom Reports > Network & Threats > Wireless > APs by Clients > AP ID.
The Report is displayed in a tabular format.
The tabular report contains the following information:
• SSID: Name of the SSID, as defined in the selected AP.• Max Clients: Maximum number of connected clients per SSID for the selected AP.• Avg Clients: Average of all the connected clients per SSID for the selected AP.• Min Clients: Minimum number of connected clients per SSID for the selected AP.
Figure 231: SSIDs by Clients
Click SSID hyperlink in the table or graph to viewFiltered SSIDs by Clients.
Trend per AP & SSIDThis report provides an overview of Time Trend for the selected AP and SSID by plotting total number of connectedclients with time period.
View the reportfrom Reports > Network & Threats > Wireless > SSIDs by Clients > SSID > AP Id.
The Report is displayed as a graph as well as in a tabular format.
The bar graph displays the total number of connected clients from all the configured APs with time period, while thetabular report contains the following information:
• Time: Time in the format of YYYY-MM-DD HH:MM:SS.• Avg Connected Clients: Average of all the connected clients per SSID for the selected AP.• Max Connected Clients: Maximum number of connected clients per SSID for the selected AP.
Time Trend per APThis report provides an overview of Time Trend for the selected AP by plotting maximum number of connectedclients with time period.
View the reportfrom Reports > Network & Threats > Wireless > APs by Clients > AP ID.
The Report is displayed as a graph as well as in a tabular format.
The bar graph displays the total number of connected clients from all the configured APs with time period, while thetabular report contains the following information:
• Time: Time in the format of YYYY-MM-DD HH:MM:SS.• AP: Name of the selected AP.• Avg Connected Clients: Average of all the clients connected with the selected AP for each time period.• Max Connected Clients: Maximum number of clients connected with selected AP for each time period.
SSIDs by ClientsThis report provides an overview of maximum, minimum and average number of clients connected for each SSIDconfigured in the Device.
View the reportfrom Reports > Network & Threats > Wireless > SSIDs by Clients.
The report is displayed using a graph as well as in a tabular format. By default, the report is displayed for the currentdate. The report date can be changed from the Date Selection Panel.
The Report is displayed in a tabular format.
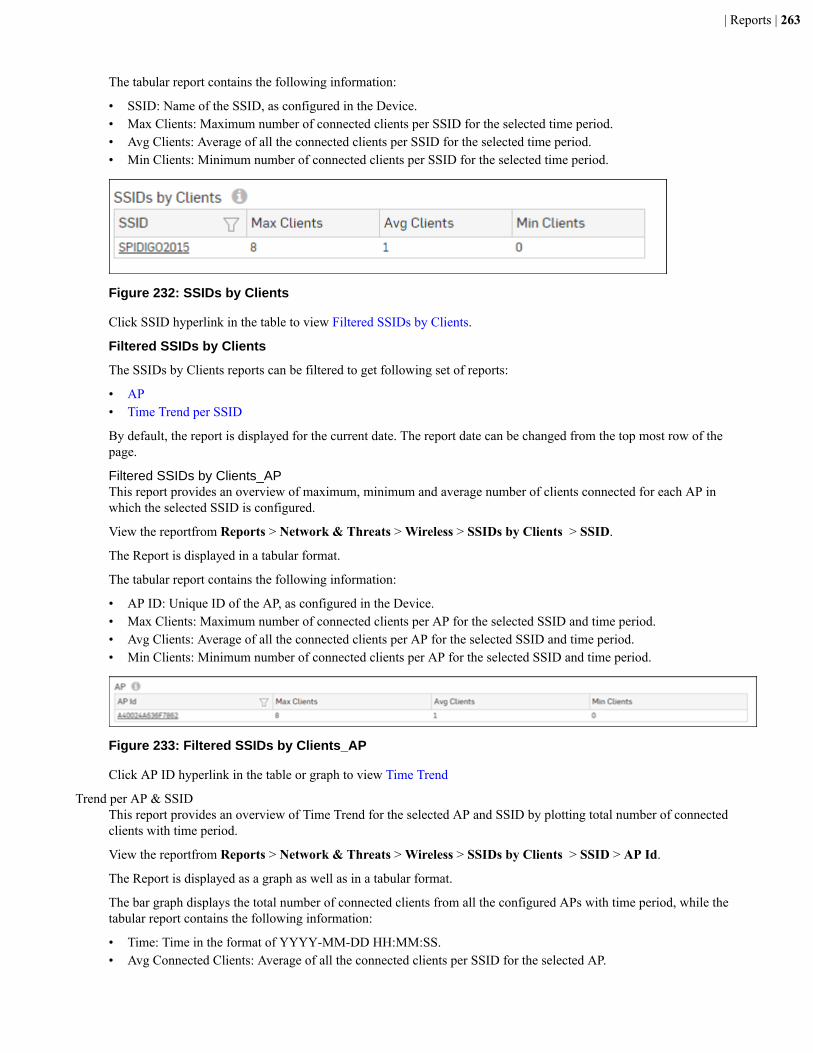
| Reports | 263
The tabular report contains the following information:
• SSID: Name of the SSID, as configured in the Device.• Max Clients: Maximum number of connected clients per SSID for the selected time period.• Avg Clients: Average of all the connected clients per SSID for the selected time period.• Min Clients: Minimum number of connected clients per SSID for the selected time period.
Figure 232: SSIDs by Clients
Click SSID hyperlink in the table to view Filtered SSIDs by Clients.
Filtered SSIDs by Clients
The SSIDs by Clients reports can be filtered to get following set of reports:
• AP• Time Trend per SSID
By default, the report is displayed for the current date. The report date can be changed from the top most row of thepage.
Filtered SSIDs by Clients_APThis report provides an overview of maximum, minimum and average number of clients connected for each AP inwhich the selected SSID is configured.
View the reportfrom Reports > Network & Threats > Wireless > SSIDs by Clients > SSID.
The Report is displayed in a tabular format.
The tabular report contains the following information:
• AP ID: Unique ID of the AP, as configured in the Device.• Max Clients: Maximum number of connected clients per AP for the selected SSID and time period.• Avg Clients: Average of all the connected clients per AP for the selected SSID and time period.• Min Clients: Minimum number of connected clients per AP for the selected SSID and time period.
Figure 233: Filtered SSIDs by Clients_AP
Click AP ID hyperlink in the table or graph to view Time Trend
Trend per AP & SSIDThis report provides an overview of Time Trend for the selected AP and SSID by plotting total number of connectedclients with time period.
View the reportfrom Reports > Network & Threats > Wireless > SSIDs by Clients > SSID > AP Id.
The Report is displayed as a graph as well as in a tabular format.
The bar graph displays the total number of connected clients from all the configured APs with time period, while thetabular report contains the following information:
• Time: Time in the format of YYYY-MM-DD HH:MM:SS.• Avg Connected Clients: Average of all the connected clients per SSID for the selected AP.
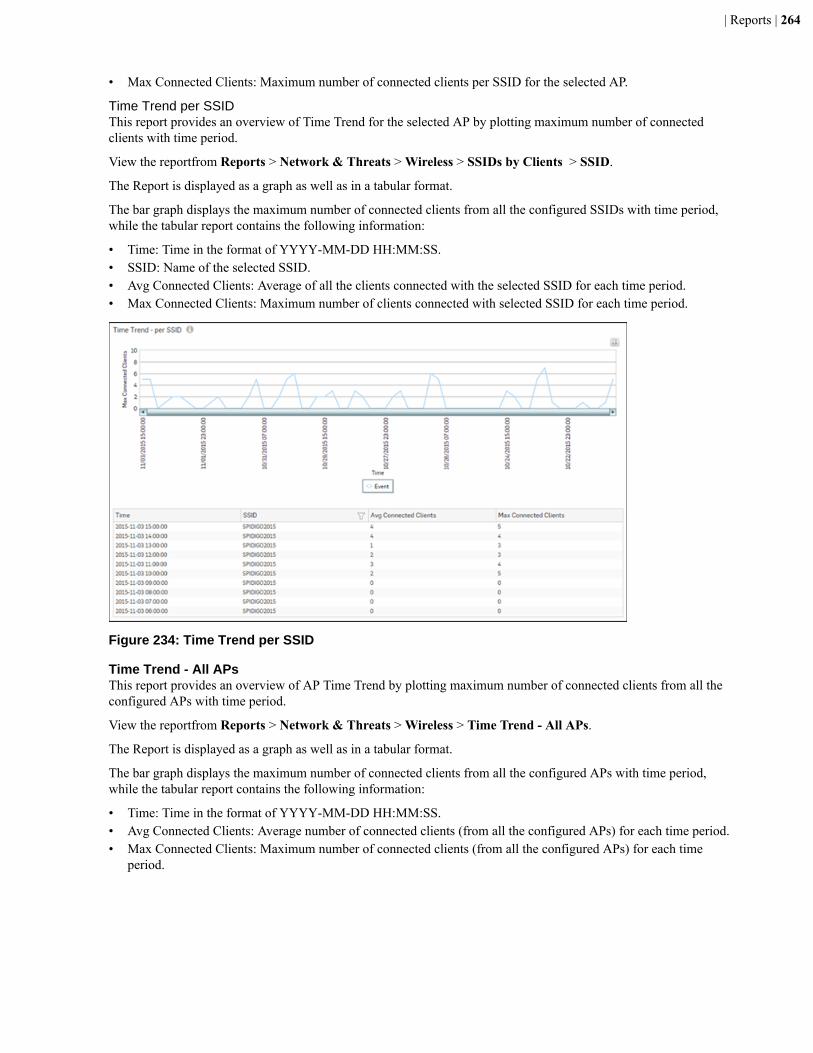
| Reports | 264
• Max Connected Clients: Maximum number of connected clients per SSID for the selected AP.
Time Trend per SSIDThis report provides an overview of Time Trend for the selected AP by plotting maximum number of connectedclients with time period.
View the reportfrom Reports > Network & Threats > Wireless > SSIDs by Clients > SSID.
The Report is displayed as a graph as well as in a tabular format.
The bar graph displays the maximum number of connected clients from all the configured SSIDs with time period,while the tabular report contains the following information:
• Time: Time in the format of YYYY-MM-DD HH:MM:SS.• SSID: Name of the selected SSID.• Avg Connected Clients: Average of all the clients connected with the selected SSID for each time period.• Max Connected Clients: Maximum number of clients connected with selected SSID for each time period.
Figure 234: Time Trend per SSID
Time Trend - All APsThis report provides an overview of AP Time Trend by plotting maximum number of connected clients from all theconfigured APs with time period.
View the reportfrom Reports > Network & Threats > Wireless > Time Trend - All APs.
The Report is displayed as a graph as well as in a tabular format.
The bar graph displays the maximum number of connected clients from all the configured APs with time period,while the tabular report contains the following information:
• Time: Time in the format of YYYY-MM-DD HH:MM:SS.• Avg Connected Clients: Average number of connected clients (from all the configured APs) for each time period.• Max Connected Clients: Maximum number of connected clients (from all the configured APs) for each time
period.
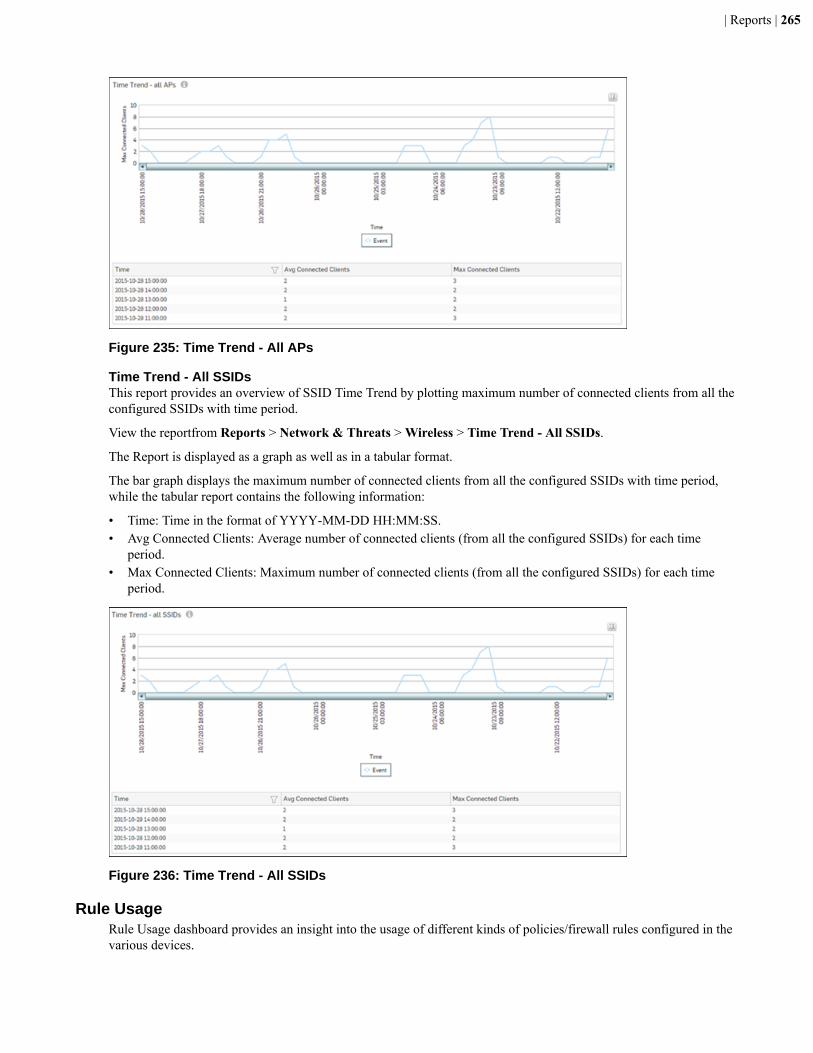
| Reports | 265
Figure 235: Time Trend - All APs
Time Trend - All SSIDsThis report provides an overview of SSID Time Trend by plotting maximum number of connected clients from all theconfigured SSIDs with time period.
View the reportfrom Reports > Network & Threats > Wireless > Time Trend - All SSIDs.
The Report is displayed as a graph as well as in a tabular format.
The bar graph displays the maximum number of connected clients from all the configured SSIDs with time period,while the tabular report contains the following information:
• Time: Time in the format of YYYY-MM-DD HH:MM:SS.• Avg Connected Clients: Average number of connected clients (from all the configured SSIDs) for each time
period.• Max Connected Clients: Maximum number of connected clients (from all the configured SSIDs) for each time
period.
Figure 236: Time Trend - All SSIDs
Rule UsageRule Usage dashboard provides an insight into the usage of different kinds of policies/firewall rules configured in thevarious devices.
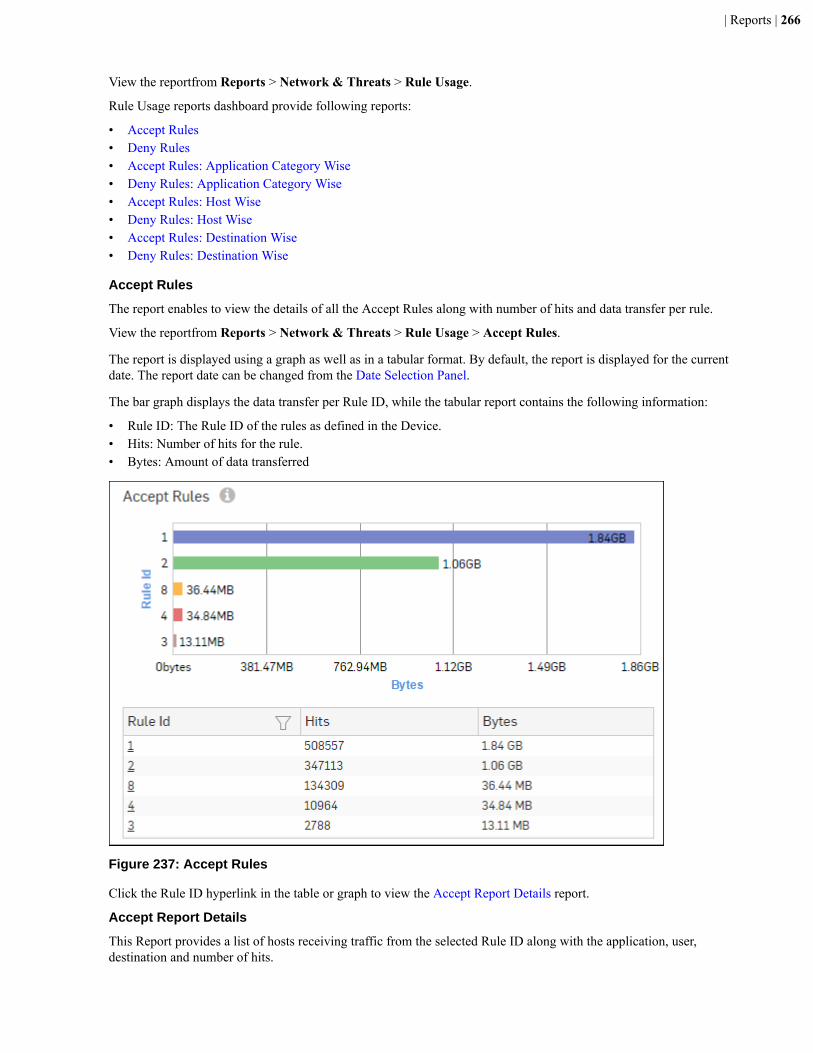
| Reports | 266
View the reportfrom Reports > Network & Threats > Rule Usage.
Rule Usage reports dashboard provide following reports:
• Accept Rules• Deny Rules• Accept Rules: Application Category Wise• Deny Rules: Application Category Wise• Accept Rules: Host Wise• Deny Rules: Host Wise• Accept Rules: Destination Wise• Deny Rules: Destination Wise
Accept Rules
The report enables to view the details of all the Accept Rules along with number of hits and data transfer per rule.
View the reportfrom Reports > Network & Threats > Rule Usage > Accept Rules.
The report is displayed using a graph as well as in a tabular format. By default, the report is displayed for the currentdate. The report date can be changed from the Date Selection Panel.
The bar graph displays the data transfer per Rule ID, while the tabular report contains the following information:
• Rule ID: The Rule ID of the rules as defined in the Device.• Hits: Number of hits for the rule.• Bytes: Amount of data transferred
Figure 237: Accept Rules
Click the Rule ID hyperlink in the table or graph to view the Accept Report Details report.
Accept Report Details
This Report provides a list of hosts receiving traffic from the selected Rule ID along with the application, user,destination and number of hits.
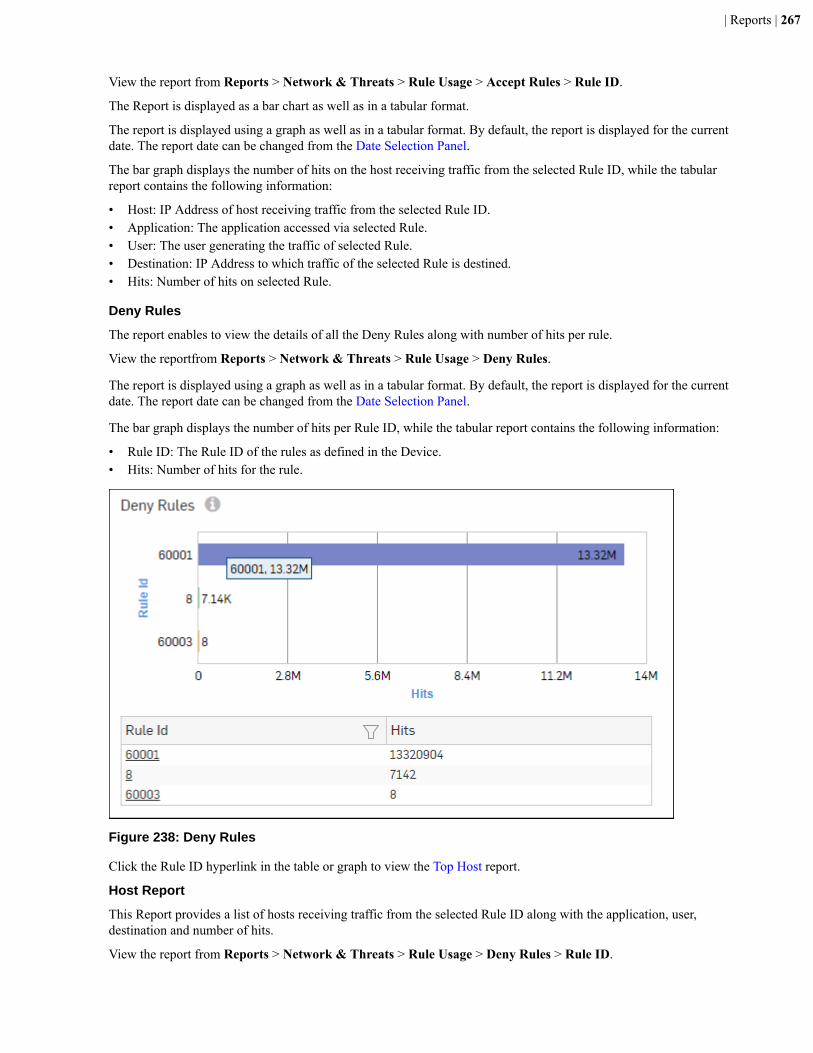
| Reports | 267
View the report from Reports > Network & Threats > Rule Usage > Accept Rules > Rule ID.
The Report is displayed as a bar chart as well as in a tabular format.
The report is displayed using a graph as well as in a tabular format. By default, the report is displayed for the currentdate. The report date can be changed from the Date Selection Panel.
The bar graph displays the number of hits on the host receiving traffic from the selected Rule ID, while the tabularreport contains the following information:
• Host: IP Address of host receiving traffic from the selected Rule ID.• Application: The application accessed via selected Rule.• User: The user generating the traffic of selected Rule.• Destination: IP Address to which traffic of the selected Rule is destined.• Hits: Number of hits on selected Rule.
Deny Rules
The report enables to view the details of all the Deny Rules along with number of hits per rule.
View the reportfrom Reports > Network & Threats > Rule Usage > Deny Rules.
The report is displayed using a graph as well as in a tabular format. By default, the report is displayed for the currentdate. The report date can be changed from the Date Selection Panel.
The bar graph displays the number of hits per Rule ID, while the tabular report contains the following information:
• Rule ID: The Rule ID of the rules as defined in the Device.• Hits: Number of hits for the rule.
Figure 238: Deny Rules
Click the Rule ID hyperlink in the table or graph to view the Top Host report.
Host Report
This Report provides a list of hosts receiving traffic from the selected Rule ID along with the application, user,destination and number of hits.
View the report from Reports > Network & Threats > Rule Usage > Deny Rules > Rule ID.
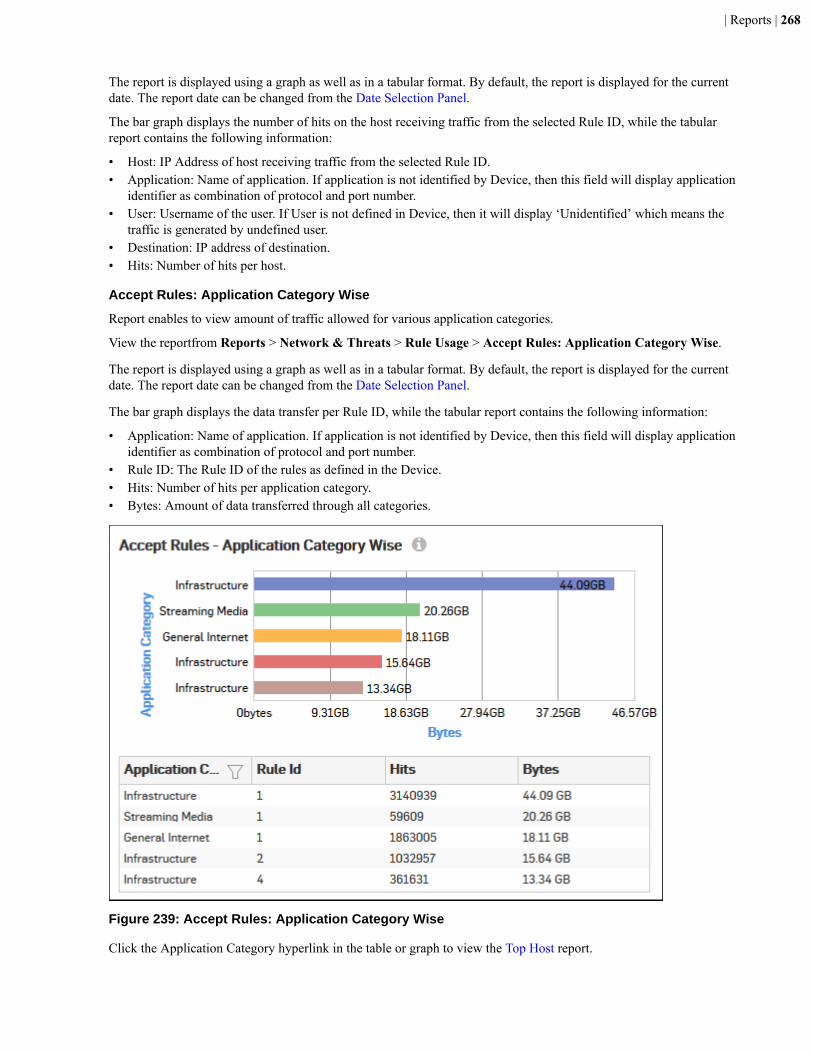
| Reports | 268
The report is displayed using a graph as well as in a tabular format. By default, the report is displayed for the currentdate. The report date can be changed from the Date Selection Panel.
The bar graph displays the number of hits on the host receiving traffic from the selected Rule ID, while the tabularreport contains the following information:
• Host: IP Address of host receiving traffic from the selected Rule ID.• Application: Name of application. If application is not identified by Device, then this field will display application
identifier as combination of protocol and port number.• User: Username of the user. If User is not defined in Device, then it will display ‘Unidentified’ which means the
traffic is generated by undefined user.• Destination: IP address of destination.• Hits: Number of hits per host.
Accept Rules: Application Category Wise
Report enables to view amount of traffic allowed for various application categories.
View the reportfrom Reports > Network & Threats > Rule Usage > Accept Rules: Application Category Wise.
The report is displayed using a graph as well as in a tabular format. By default, the report is displayed for the currentdate. The report date can be changed from the Date Selection Panel.
The bar graph displays the data transfer per Rule ID, while the tabular report contains the following information:
• Application: Name of application. If application is not identified by Device, then this field will display applicationidentifier as combination of protocol and port number.
• Rule ID: The Rule ID of the rules as defined in the Device.• Hits: Number of hits per application category.• Bytes: Amount of data transferred through all categories.
Figure 239: Accept Rules: Application Category Wise
Click the Application Category hyperlink in the table or graph to view the Top Host report.
| Reports | 269
Host Report
This Report provides a list of hosts receiving traffic from the selected application category along with the application,user, destination and number of hits.
View the report from Reports > Network & Threats > Rule Usage > Accept Rules: Application Category Wise >Application Category.
The report is displayed using a graph as well as in a tabular format. By default, the report is displayed for the currentdate. The report date can be changed from the Date Selection Panel.
The bar graph displays the number of hits on the host receiving traffic from the selected Rule ID, while the tabularreport contains the following information:
• Host: IP Address of host receiving traffic from the selected application category.• Application: Name of application. If application is not identified by Device, then this field will display application
identifier as combination of protocol and port number.• User: Username of the user. If User is not defined in Device, then it will display ‘Unidentified’ which means the
traffic is generated by undefined user.• Destination: IP address of destination.• Hits: Number of hits per host.
Deny Rules: Application Category Wise
Report enables to view amount of traffic blocked for various application categories.
View the reportfrom Reports > Network & Threats > Rule Usage > Deny Rules: Application Category Wise.
The report is displayed using a graph as well as in a tabular format. By default, the report is displayed for the currentdate. The report date can be changed from the Date Selection Panel.
The bar graph displays the data transfer per application category, while the tabular report contains the followinginformation:
• Application: Name of application. If application is not identified by Device, then this field will display applicationidentifier as combination of protocol and port number.
• Rule ID: The Rule ID of the rules as defined in the Device.• Hits: Number of hits per application category.
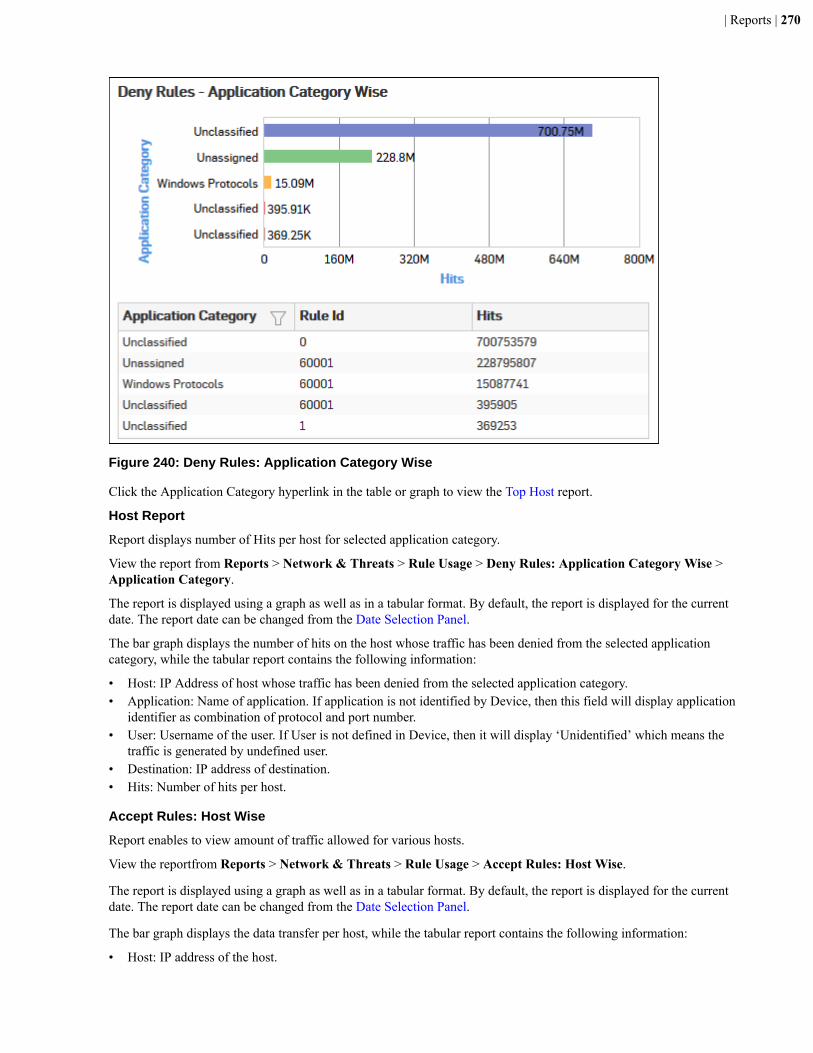
| Reports | 270
Figure 240: Deny Rules: Application Category Wise
Click the Application Category hyperlink in the table or graph to view the Top Host report.
Host Report
Report displays number of Hits per host for selected application category.
View the report from Reports > Network & Threats > Rule Usage > Deny Rules: Application Category Wise >Application Category.
The report is displayed using a graph as well as in a tabular format. By default, the report is displayed for the currentdate. The report date can be changed from the Date Selection Panel.
The bar graph displays the number of hits on the host whose traffic has been denied from the selected applicationcategory, while the tabular report contains the following information:
• Host: IP Address of host whose traffic has been denied from the selected application category.• Application: Name of application. If application is not identified by Device, then this field will display application
identifier as combination of protocol and port number.• User: Username of the user. If User is not defined in Device, then it will display ‘Unidentified’ which means the
traffic is generated by undefined user.• Destination: IP address of destination.• Hits: Number of hits per host.
Accept Rules: Host Wise
Report enables to view amount of traffic allowed for various hosts.
View the reportfrom Reports > Network & Threats > Rule Usage > Accept Rules: Host Wise.
The report is displayed using a graph as well as in a tabular format. By default, the report is displayed for the currentdate. The report date can be changed from the Date Selection Panel.
The bar graph displays the data transfer per host, while the tabular report contains the following information:
• Host: IP address of the host.

| Reports | 271
• Rule ID: Rule ID as defined in Device. If ID is not defined, then it will display policy name.• Hits: Number of hits per host.• Bytes: Amount of data transferred through host.
Figure 241: Accept Rules: Host Wise
Click the Host hyperlink in the table or graph to view the Accept Report Details report.
Accept Report Details
Report displays number of Hits per destination for selected host.
View the report from Reports > Network & Threats > Rule Usage > Accept Rules: Host Wise > Host.
The report is displayed using a graph as well as in a tabular format. By default, the report is displayed for the currentdate. The report date can be changed from the Date Selection Panel.
The bar graph displays the number of hits on the destination, while the tabular report contains the followinginformation:
• Destination: IP address of destination.• Application: Name of application. If application is not identified by Device, then this field will display application
identifier as combination of protocol and port number.• User: Username of the user. If User is not defined in Device, then it will display ‘Unidentified’ which means the
traffic is generated by undefined user.• Hits: Number of hits per destination.
Deny Rules: Host Wise
Report enables to view traffic denied for various hosts.
View the reportfrom Reports > Network & Threats > Rule Usage > Deny Rules: Host Wise.
The report is displayed using a graph as well as in a tabular format. By default, the report is displayed for the currentdate. The report date can be changed from the Date Selection Panel.
The bar graph displays the data transfer per host, while the tabular report contains the following information:

| Reports | 272
• Host: IP address of the host.• Rule ID: Rule ID as defined in Device. If ID is not defined, then it will display policy name.• Hits: Number of hits per host.
Figure 242: Deny Rules: Host Wise
Click the Host hyperlink in the table or graph to view the Deny Report Details report.
Deny Report Details
Report displays number of Hits per destination for selected host.
View the report from Reports > Network & Threats > Rule Usage > Deny Rules: Host Wise > Host.
The report is displayed using a graph as well as in a tabular format. By default, the report is displayed for the currentdate. The report date can be changed from the Date Selection Panel.
The bar graph displays the number of hits on the destination, while the tabular report contains the followinginformation:
• Destination: IP address of destination.• Application: Name of application. If application is not identified by Device, then this field will display application
identifier as combination of protocol and port number.• User: Username of the user. If User is not defined in Device, then it will display ‘Unidentified’ which means the
traffic is generated by undefined user.• Hits: Number of hits per destination.
Accept Rules: Destination Wise
Report enables to view amount of traffic allowed for various destinations.
View the reportfrom Reports > Network & Threats > Rule Usage > Accept Rules: Destination Wise.
The report is displayed using a graph as well as in a tabular format. By default, the report is displayed for the currentdate. The report date can be changed from the Date Selection Panel.
The bar graph displays the data transfer per host, while the tabular report contains the following information:

| Reports | 273
• Destination: IP address of the destination.• Rule ID: Rule ID as defined in Device. If ID is not defined, then it will display policy name.• Hits: Number of hits per host.• Bytes: Amount of data transferred through host.
Figure 243: Accept Rules: Destination Wise
Click the Destination hyperlink in the table or graph to view the Accept Report Details report.
Accept Report Details
Report displays number of Hits per host for selected destination.
View the report from Reports > Network & Threats > Rule Usage > Accept Rules: Destination Wise >Destination.
The report is displayed using a graph as well as in a tabular format. By default, the report is displayed for the currentdate. The report date can be changed from the Date Selection Panel.
The bar graph displays the number of hits on the host, while the tabular report contains the following information:
• Host: IP address of the host.• Application: Name of application. If application is not identified by Device, then this field will display application
identifier as combination of protocol and port number.• User: Username of the user. If User is not defined in Device, then it will display ‘Unidentified’ which means the
traffic is generated by undefined user.• Hits: Number of hits per host.
Deny Rules: Destination Wise
Report enables to view amount of traffic denied for various destinations.
View the reportfrom Reports > Network & Threats > Rule Usage > Deny Rules: Destination Wise.
The report is displayed using a graph as well as in a tabular format. By default, the report is displayed for the currentdate. The report date can be changed from the Date Selection Panel.
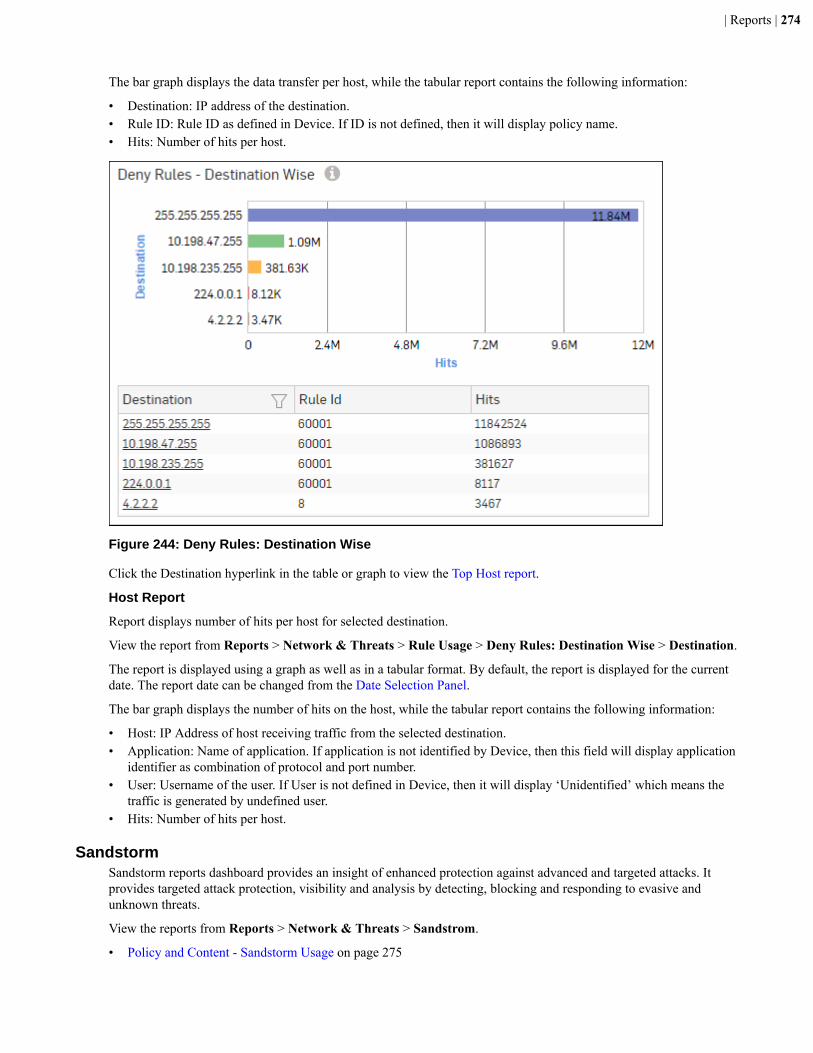
| Reports | 274
The bar graph displays the data transfer per host, while the tabular report contains the following information:
• Destination: IP address of the destination.• Rule ID: Rule ID as defined in Device. If ID is not defined, then it will display policy name.• Hits: Number of hits per host.
Figure 244: Deny Rules: Destination Wise
Click the Destination hyperlink in the table or graph to view the Top Host report.
Host Report
Report displays number of hits per host for selected destination.
View the report from Reports > Network & Threats > Rule Usage > Deny Rules: Destination Wise > Destination.
The report is displayed using a graph as well as in a tabular format. By default, the report is displayed for the currentdate. The report date can be changed from the Date Selection Panel.
The bar graph displays the number of hits on the host, while the tabular report contains the following information:
• Host: IP Address of host receiving traffic from the selected destination.• Application: Name of application. If application is not identified by Device, then this field will display application
identifier as combination of protocol and port number.• User: Username of the user. If User is not defined in Device, then it will display ‘Unidentified’ which means the
traffic is generated by undefined user.• Hits: Number of hits per host.
SandstormSandstorm reports dashboard provides an insight of enhanced protection against advanced and targeted attacks. Itprovides targeted attack protection, visibility and analysis by detecting, blocking and responding to evasive andunknown threats.
View the reports from Reports > Network & Threats > Sandstrom.
• Policy and Content - Sandstorm Usage on page 275
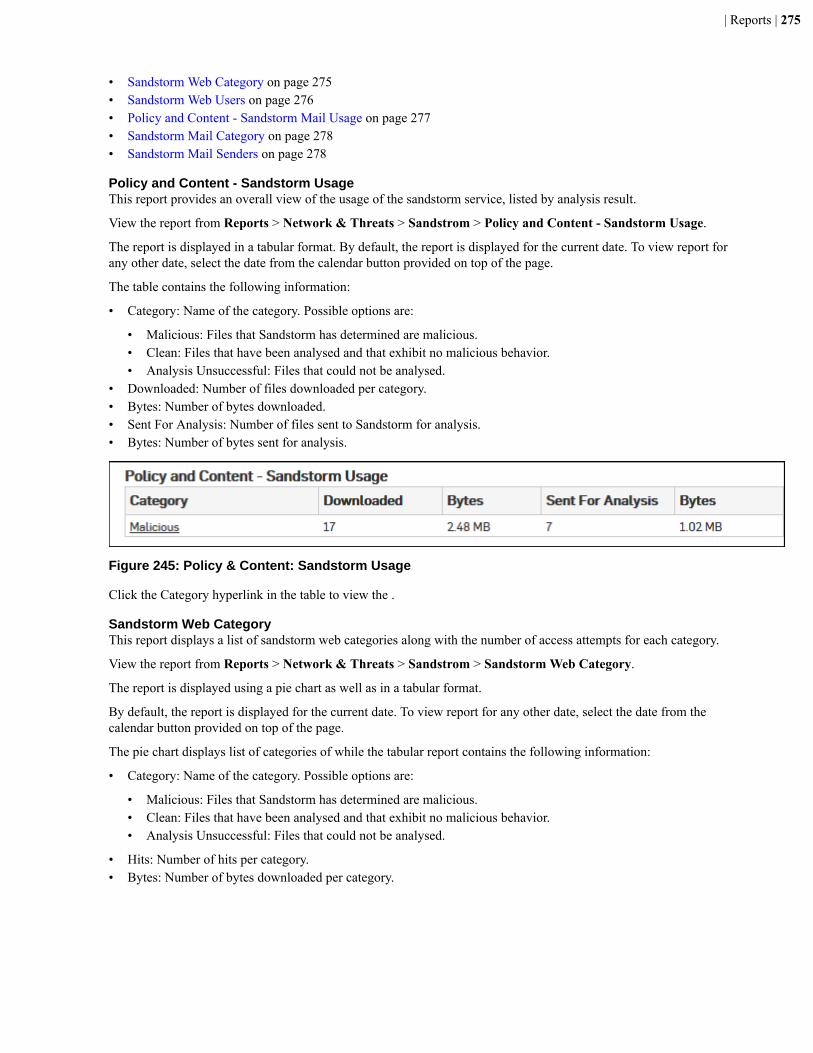
| Reports | 275
• Sandstorm Web Category on page 275• Sandstorm Web Users on page 276• Policy and Content - Sandstorm Mail Usage on page 277• Sandstorm Mail Category on page 278• Sandstorm Mail Senders on page 278
Policy and Content - Sandstorm UsageThis report provides an overall view of the usage of the sandstorm service, listed by analysis result.
View the report from Reports > Network & Threats > Sandstrom > Policy and Content - Sandstorm Usage.
The report is displayed in a tabular format. By default, the report is displayed for the current date. To view report forany other date, select the date from the calendar button provided on top of the page.
The table contains the following information:
• Category: Name of the category. Possible options are:
• Malicious: Files that Sandstorm has determined are malicious.• Clean: Files that have been analysed and that exhibit no malicious behavior.• Analysis Unsuccessful: Files that could not be analysed.
• Downloaded: Number of files downloaded per category.• Bytes: Number of bytes downloaded.• Sent For Analysis: Number of files sent to Sandstorm for analysis.• Bytes: Number of bytes sent for analysis.
Figure 245: Policy & Content: Sandstorm Usage
Click the Category hyperlink in the table to view the .
Sandstorm Web CategoryThis report displays a list of sandstorm web categories along with the number of access attempts for each category.
View the report from Reports > Network & Threats > Sandstrom > Sandstorm Web Category.
The report is displayed using a pie chart as well as in a tabular format.
By default, the report is displayed for the current date. To view report for any other date, select the date from thecalendar button provided on top of the page.
The pie chart displays list of categories of while the tabular report contains the following information:
• Category: Name of the category. Possible options are:
• Malicious: Files that Sandstorm has determined are malicious.• Clean: Files that have been analysed and that exhibit no malicious behavior.• Analysis Unsuccessful: Files that could not be analysed.
• Hits: Number of hits per category.• Bytes: Number of bytes downloaded per category.

| Reports | 276
Figure 246: Sandstorm Web Category
Click the Category hyperlink in the table or pie chart to view the .
Sandstorm Web UsersThis report displays a list of users whose maximum files are sent to Sandstorm for analysis, each shown as apercentage of the total number of files flagged as suspicious.
View the report from Reports > Network & Threats > Sandstrom > Sandstorm Web Users.
The report is displayed using a pie chart as well as in a tabular format.
By default, the report is displayed for the current date. To view report for any other date, select the date from thecalendar button provided on top of the page.
The pie chart displays list of categories of while the tabular report contains the following information:
• User: Name of the user.
• Hits: Number of hits per user.• Bytes: Number of bytes downloaded per user.
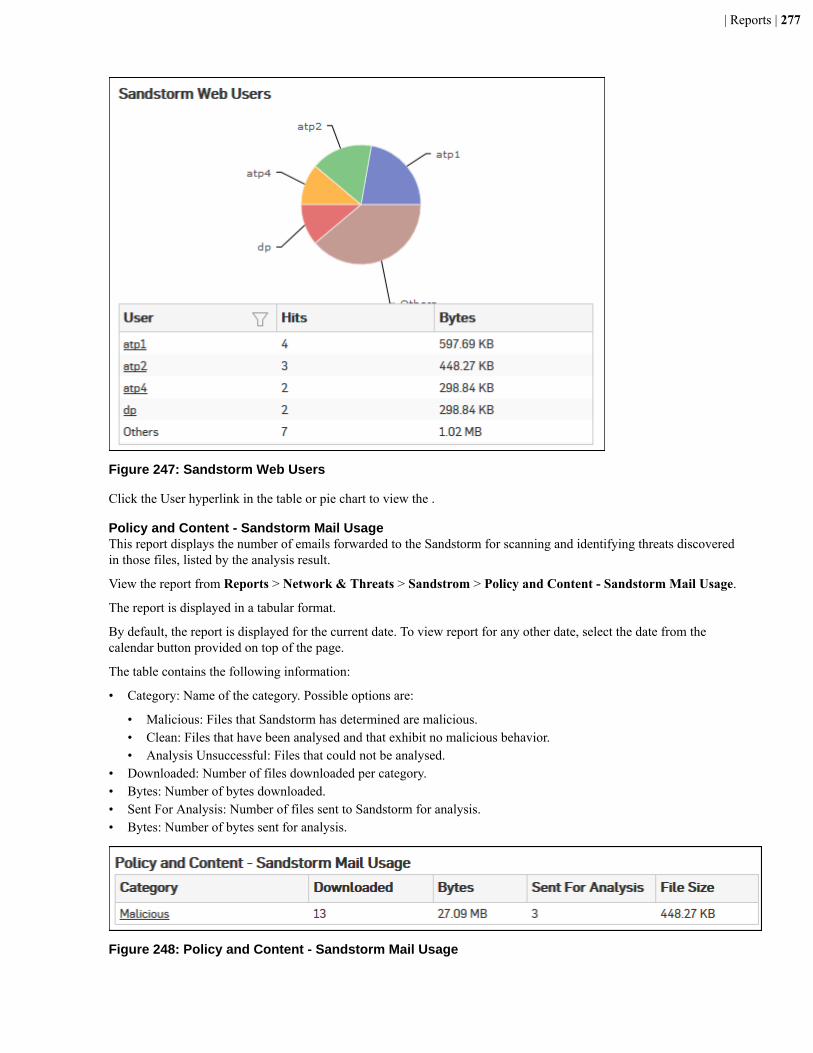
| Reports | 277
Figure 247: Sandstorm Web Users
Click the User hyperlink in the table or pie chart to view the .
Policy and Content - Sandstorm Mail UsageThis report displays the number of emails forwarded to the Sandstorm for scanning and identifying threats discoveredin those files, listed by the analysis result.
View the report from Reports > Network & Threats > Sandstrom > Policy and Content - Sandstorm Mail Usage.
The report is displayed in a tabular format.
By default, the report is displayed for the current date. To view report for any other date, select the date from thecalendar button provided on top of the page.
The table contains the following information:
• Category: Name of the category. Possible options are:
• Malicious: Files that Sandstorm has determined are malicious.• Clean: Files that have been analysed and that exhibit no malicious behavior.• Analysis Unsuccessful: Files that could not be analysed.
• Downloaded: Number of files downloaded per category.• Bytes: Number of bytes downloaded.• Sent For Analysis: Number of files sent to Sandstorm for analysis.• Bytes: Number of bytes sent for analysis.
Figure 248: Policy and Content - Sandstorm Mail Usage
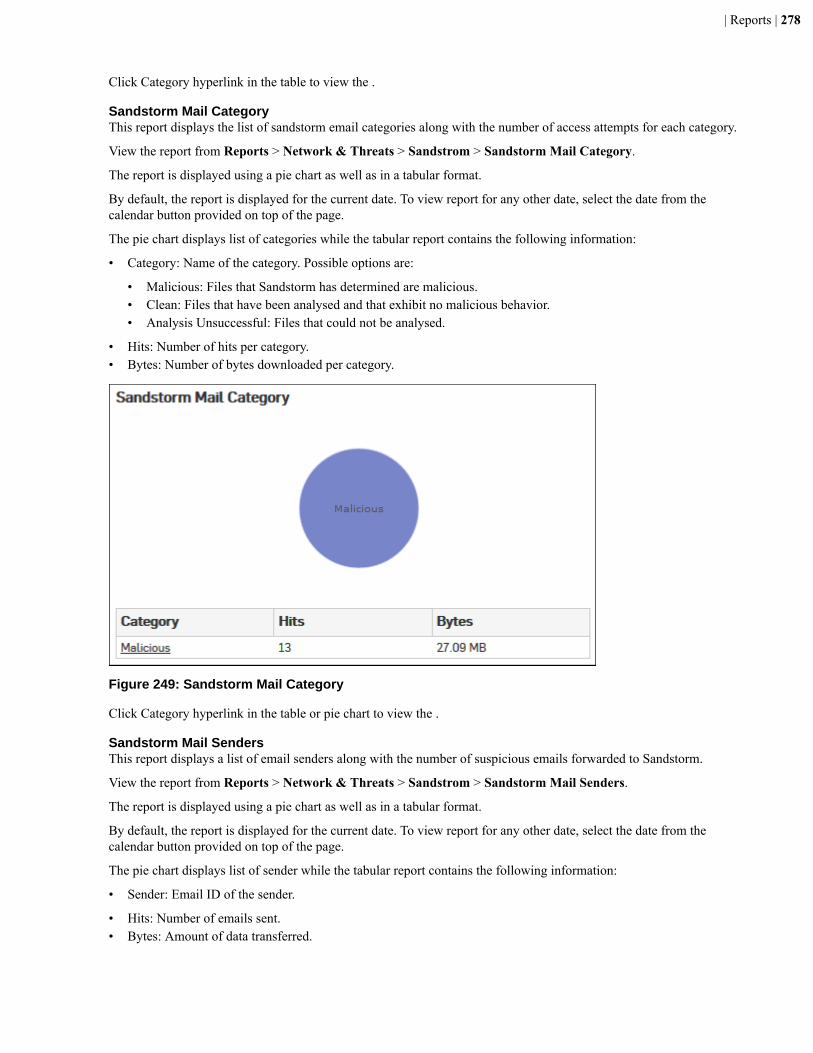
| Reports | 278
Click Category hyperlink in the table to view the .
Sandstorm Mail CategoryThis report displays the list of sandstorm email categories along with the number of access attempts for each category.
View the report from Reports > Network & Threats > Sandstrom > Sandstorm Mail Category.
The report is displayed using a pie chart as well as in a tabular format.
By default, the report is displayed for the current date. To view report for any other date, select the date from thecalendar button provided on top of the page.
The pie chart displays list of categories while the tabular report contains the following information:
• Category: Name of the category. Possible options are:
• Malicious: Files that Sandstorm has determined are malicious.• Clean: Files that have been analysed and that exhibit no malicious behavior.• Analysis Unsuccessful: Files that could not be analysed.
• Hits: Number of hits per category.• Bytes: Number of bytes downloaded per category.
Figure 249: Sandstorm Mail Category
Click Category hyperlink in the table or pie chart to view the .
Sandstorm Mail SendersThis report displays a list of email senders along with the number of suspicious emails forwarded to Sandstorm.
View the report from Reports > Network & Threats > Sandstrom > Sandstorm Mail Senders.
The report is displayed using a pie chart as well as in a tabular format.
By default, the report is displayed for the current date. To view report for any other date, select the date from thecalendar button provided on top of the page.
The pie chart displays list of sender while the tabular report contains the following information:
• Sender: Email ID of the sender.
• Hits: Number of emails sent.• Bytes: Amount of data transferred.
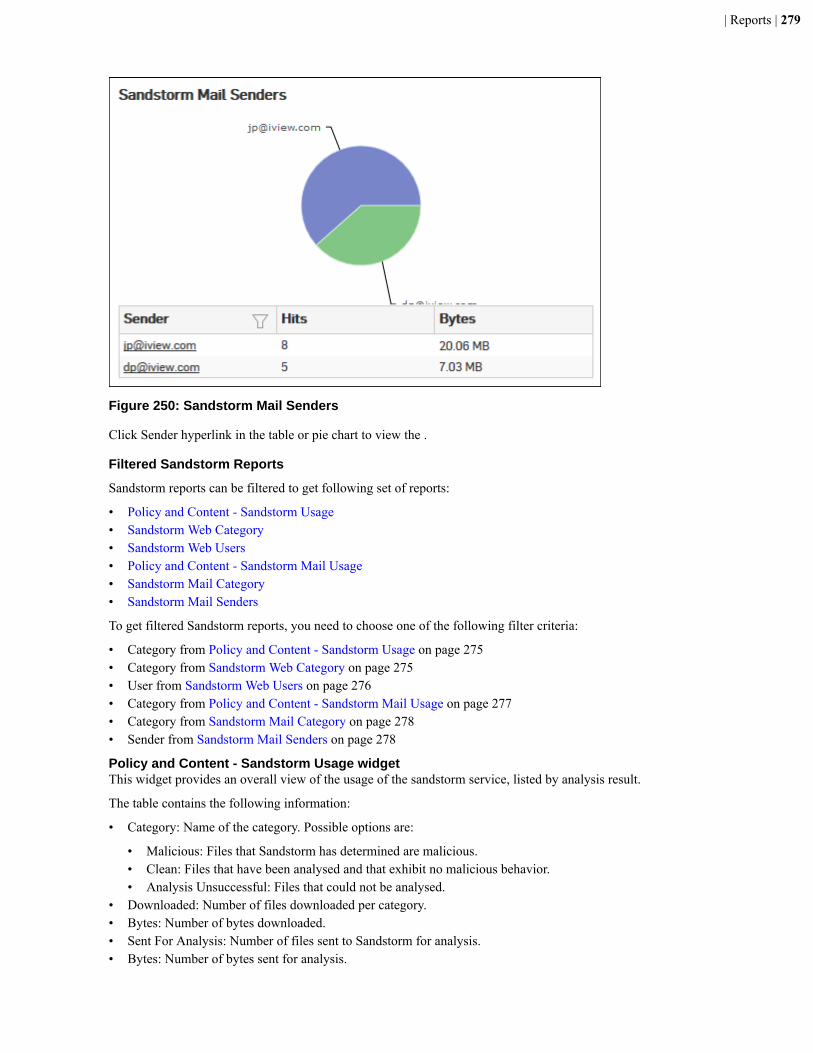
| Reports | 279
Figure 250: Sandstorm Mail Senders
Click Sender hyperlink in the table or pie chart to view the .
Filtered Sandstorm Reports
Sandstorm reports can be filtered to get following set of reports:
• Policy and Content - Sandstorm Usage• Sandstorm Web Category• Sandstorm Web Users• Policy and Content - Sandstorm Mail Usage• Sandstorm Mail Category• Sandstorm Mail Senders
To get filtered Sandstorm reports, you need to choose one of the following filter criteria:
• Category from Policy and Content - Sandstorm Usage on page 275• Category from Sandstorm Web Category on page 275• User from Sandstorm Web Users on page 276• Category from Policy and Content - Sandstorm Mail Usage on page 277• Category from Sandstorm Mail Category on page 278• Sender from Sandstorm Mail Senders on page 278
Policy and Content - Sandstorm Usage widgetThis widget provides an overall view of the usage of the sandstorm service, listed by analysis result.
The table contains the following information:
• Category: Name of the category. Possible options are:
• Malicious: Files that Sandstorm has determined are malicious.• Clean: Files that have been analysed and that exhibit no malicious behavior.• Analysis Unsuccessful: Files that could not be analysed.
• Downloaded: Number of files downloaded per category.• Bytes: Number of bytes downloaded.• Sent For Analysis: Number of files sent to Sandstorm for analysis.• Bytes: Number of bytes sent for analysis.
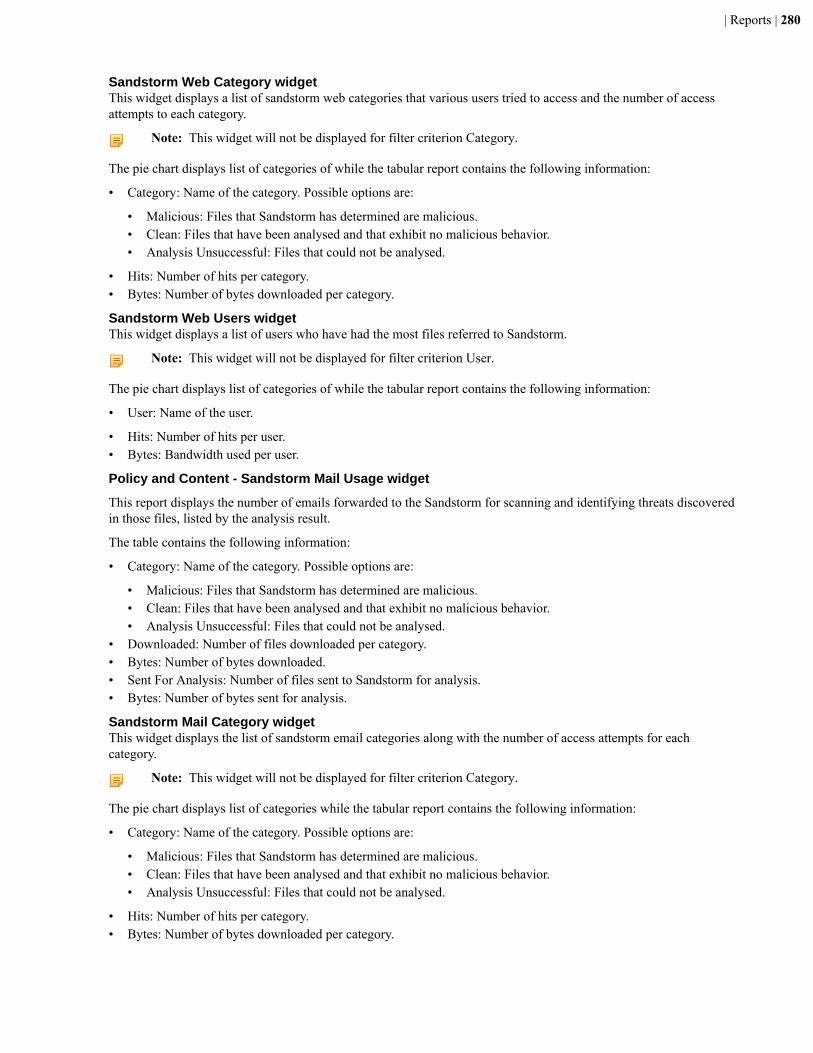
| Reports | 280
Sandstorm Web Category widgetThis widget displays a list of sandstorm web categories that various users tried to access and the number of accessattempts to each category.
Note: This widget will not be displayed for filter criterion Category.
The pie chart displays list of categories of while the tabular report contains the following information:
• Category: Name of the category. Possible options are:
• Malicious: Files that Sandstorm has determined are malicious.• Clean: Files that have been analysed and that exhibit no malicious behavior.• Analysis Unsuccessful: Files that could not be analysed.
• Hits: Number of hits per category.• Bytes: Number of bytes downloaded per category.
Sandstorm Web Users widgetThis widget displays a list of users who have had the most files referred to Sandstorm.
Note: This widget will not be displayed for filter criterion User.
The pie chart displays list of categories of while the tabular report contains the following information:
• User: Name of the user.
• Hits: Number of hits per user.• Bytes: Bandwidth used per user.
Policy and Content - Sandstorm Mail Usage widget
This report displays the number of emails forwarded to the Sandstorm for scanning and identifying threats discoveredin those files, listed by the analysis result.
The table contains the following information:
• Category: Name of the category. Possible options are:
• Malicious: Files that Sandstorm has determined are malicious.• Clean: Files that have been analysed and that exhibit no malicious behavior.• Analysis Unsuccessful: Files that could not be analysed.
• Downloaded: Number of files downloaded per category.• Bytes: Number of bytes downloaded.• Sent For Analysis: Number of files sent to Sandstorm for analysis.• Bytes: Number of bytes sent for analysis.
Sandstorm Mail Category widgetThis widget displays the list of sandstorm email categories along with the number of access attempts for eachcategory.
Note: This widget will not be displayed for filter criterion Category.
The pie chart displays list of categories while the tabular report contains the following information:
• Category: Name of the category. Possible options are:
• Malicious: Files that Sandstorm has determined are malicious.• Clean: Files that have been analysed and that exhibit no malicious behavior.• Analysis Unsuccessful: Files that could not be analysed.
• Hits: Number of hits per category.• Bytes: Number of bytes downloaded per category.
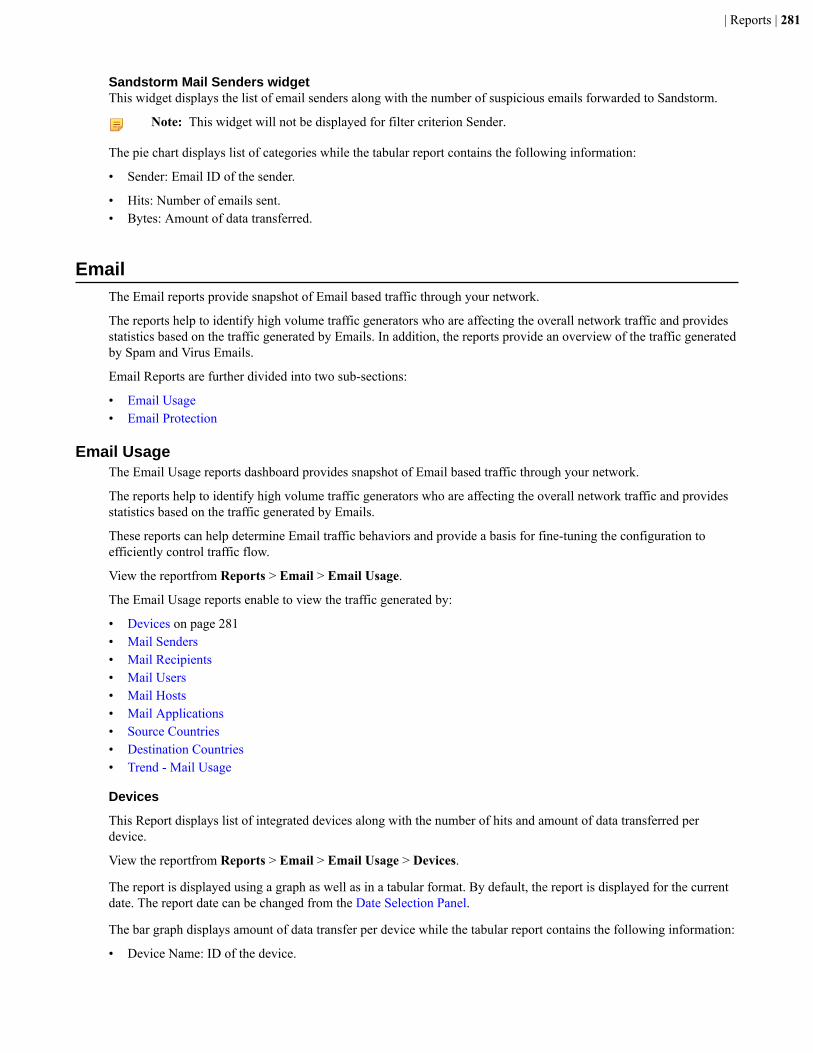
| Reports | 281
Sandstorm Mail Senders widgetThis widget displays the list of email senders along with the number of suspicious emails forwarded to Sandstorm.
Note: This widget will not be displayed for filter criterion Sender.
The pie chart displays list of categories while the tabular report contains the following information:
• Sender: Email ID of the sender.
• Hits: Number of emails sent.• Bytes: Amount of data transferred.
EmailThe Email reports provide snapshot of Email based traffic through your network.
The reports help to identify high volume traffic generators who are affecting the overall network traffic and providesstatistics based on the traffic generated by Emails. In addition, the reports provide an overview of the traffic generatedby Spam and Virus Emails.
Email Reports are further divided into two sub-sections:
• Email Usage• Email Protection
Email UsageThe Email Usage reports dashboard provides snapshot of Email based traffic through your network.
The reports help to identify high volume traffic generators who are affecting the overall network traffic and providesstatistics based on the traffic generated by Emails.
These reports can help determine Email traffic behaviors and provide a basis for fine-tuning the configuration toefficiently control traffic flow.
View the reportfrom Reports > Email > Email Usage.
The Email Usage reports enable to view the traffic generated by:
• Devices on page 281• Mail Senders• Mail Recipients• Mail Users• Mail Hosts• Mail Applications• Source Countries• Destination Countries• Trend - Mail Usage
Devices
This Report displays list of integrated devices along with the number of hits and amount of data transferred perdevice.
View the reportfrom Reports > Email > Email Usage > Devices.
The report is displayed using a graph as well as in a tabular format. By default, the report is displayed for the currentdate. The report date can be changed from the Date Selection Panel.
The bar graph displays amount of data transfer per device while the tabular report contains the following information:
• Device Name: ID of the device.
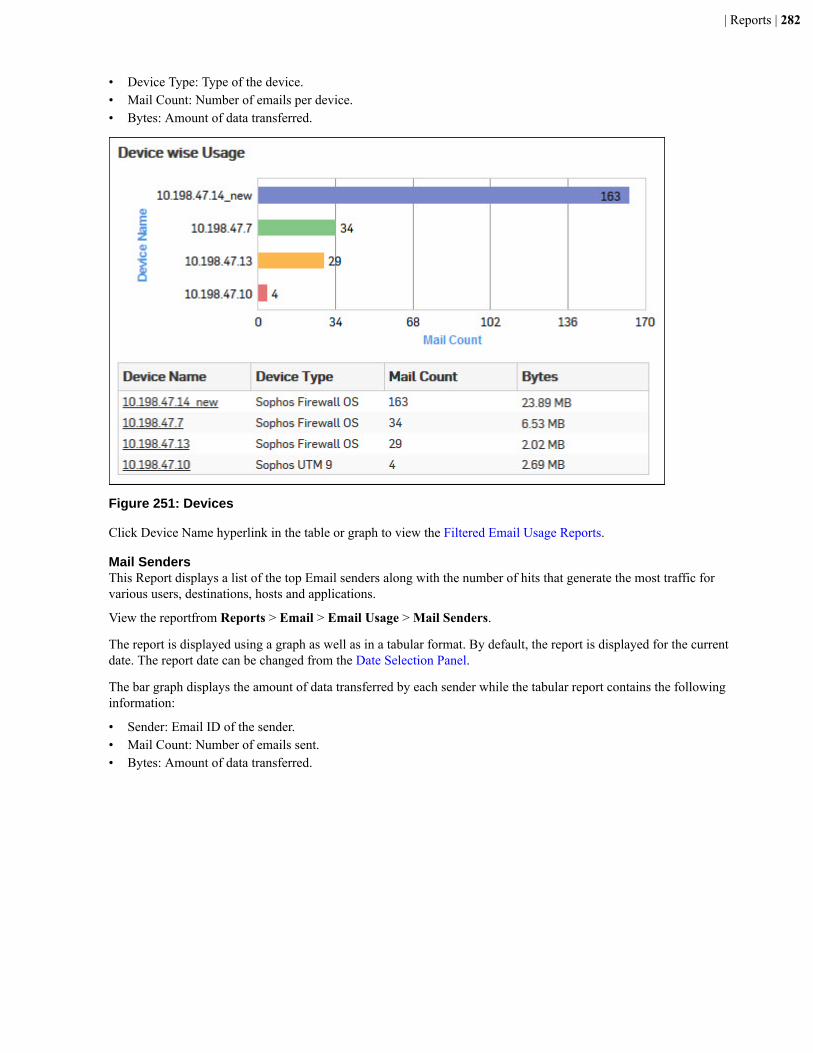
| Reports | 282
• Device Type: Type of the device.• Mail Count: Number of emails per device.• Bytes: Amount of data transferred.
Figure 251: Devices
Click Device Name hyperlink in the table or graph to view the Filtered Email Usage Reports.
Mail SendersThis Report displays a list of the top Email senders along with the number of hits that generate the most traffic forvarious users, destinations, hosts and applications.
View the reportfrom Reports > Email > Email Usage > Mail Senders.
The report is displayed using a graph as well as in a tabular format. By default, the report is displayed for the currentdate. The report date can be changed from the Date Selection Panel.
The bar graph displays the amount of data transferred by each sender while the tabular report contains the followinginformation:
• Sender: Email ID of the sender.• Mail Count: Number of emails sent.• Bytes: Amount of data transferred.
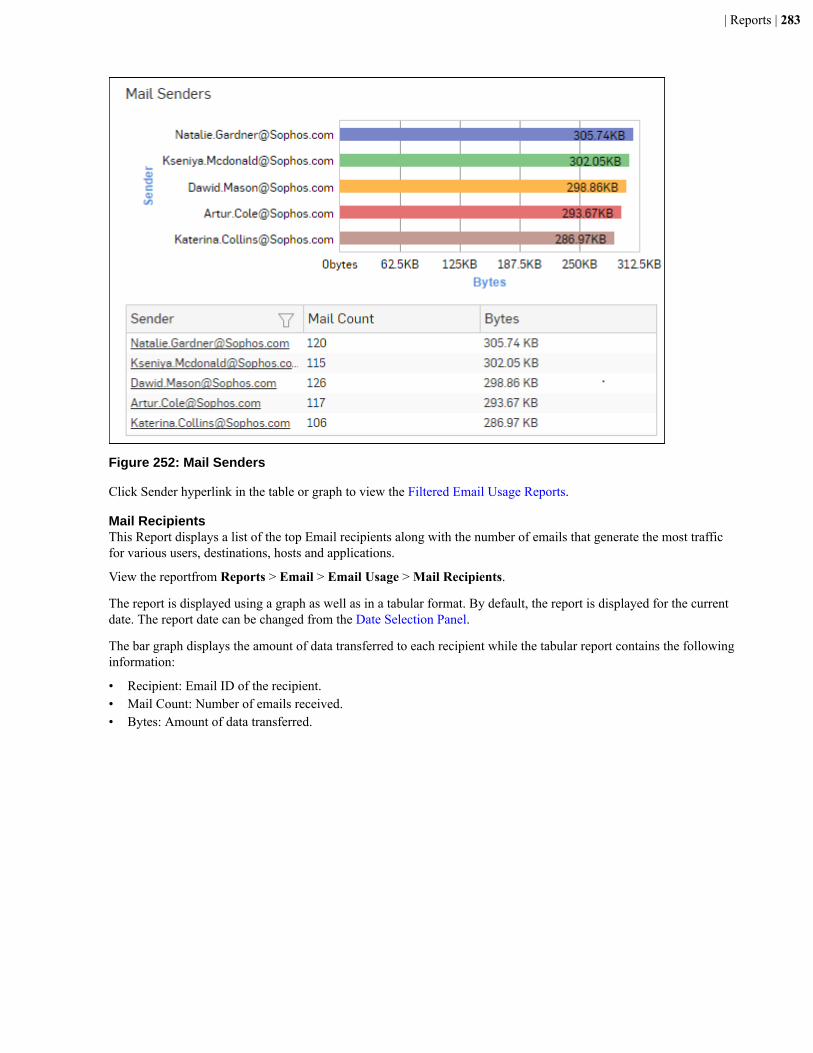
| Reports | 283
Figure 252: Mail Senders
Click Sender hyperlink in the table or graph to view the Filtered Email Usage Reports.
Mail RecipientsThis Report displays a list of the top Email recipients along with the number of emails that generate the most trafficfor various users, destinations, hosts and applications.
View the reportfrom Reports > Email > Email Usage > Mail Recipients.
The report is displayed using a graph as well as in a tabular format. By default, the report is displayed for the currentdate. The report date can be changed from the Date Selection Panel.
The bar graph displays the amount of data transferred to each recipient while the tabular report contains the followinginformation:
• Recipient: Email ID of the recipient.• Mail Count: Number of emails received.• Bytes: Amount of data transferred.
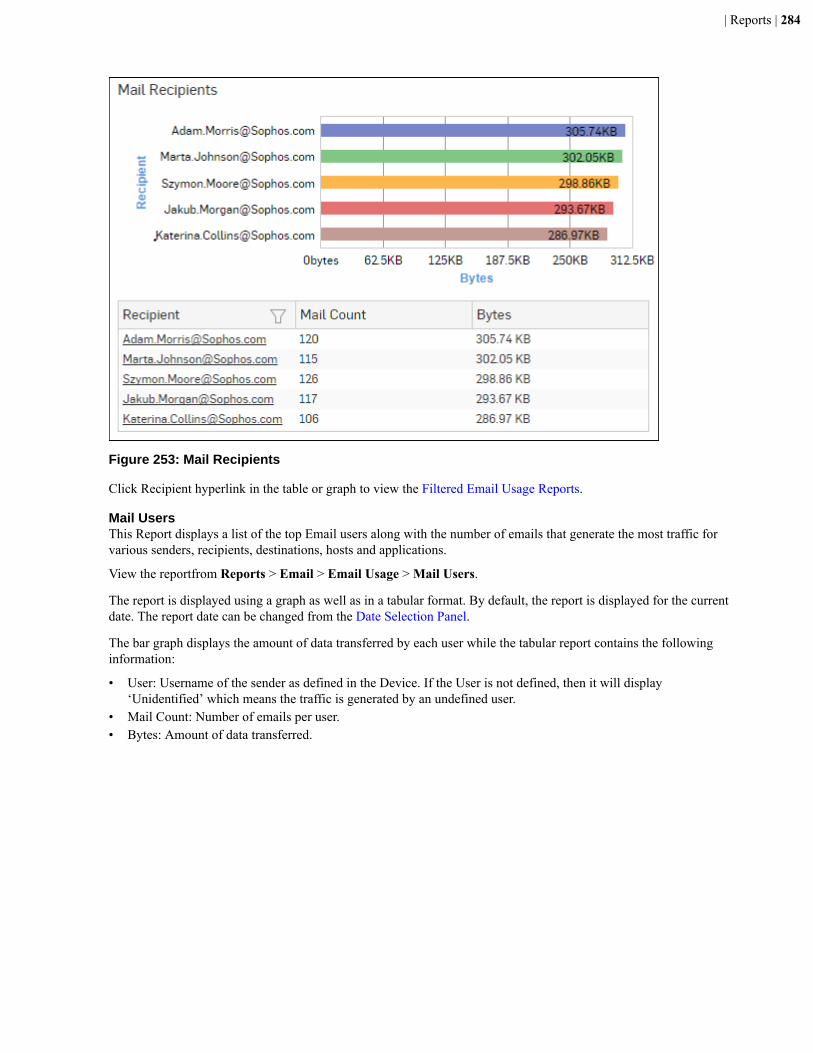
| Reports | 284
Figure 253: Mail Recipients
Click Recipient hyperlink in the table or graph to view the Filtered Email Usage Reports.
Mail UsersThis Report displays a list of the top Email users along with the number of emails that generate the most traffic forvarious senders, recipients, destinations, hosts and applications.
View the reportfrom Reports > Email > Email Usage > Mail Users.
The report is displayed using a graph as well as in a tabular format. By default, the report is displayed for the currentdate. The report date can be changed from the Date Selection Panel.
The bar graph displays the amount of data transferred by each user while the tabular report contains the followinginformation:
• User: Username of the sender as defined in the Device. If the User is not defined, then it will display‘Unidentified’ which means the traffic is generated by an undefined user.
• Mail Count: Number of emails per user.• Bytes: Amount of data transferred.
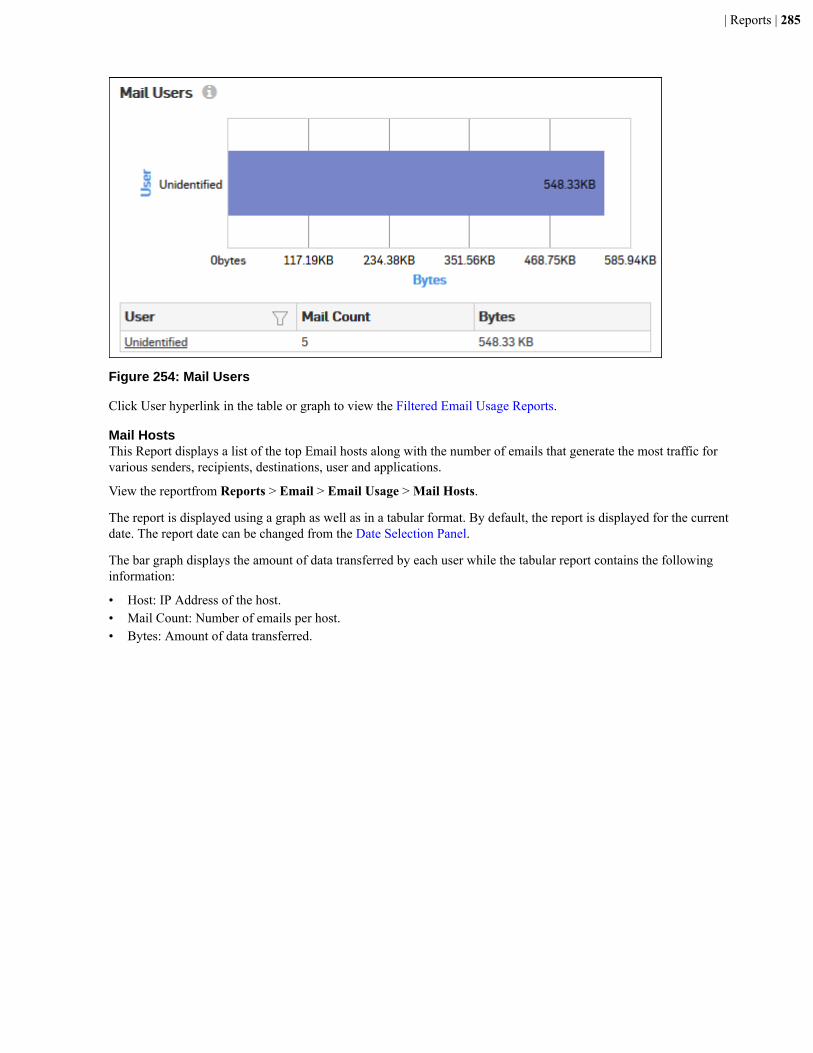
| Reports | 285
Figure 254: Mail Users
Click User hyperlink in the table or graph to view the Filtered Email Usage Reports.
Mail HostsThis Report displays a list of the top Email hosts along with the number of emails that generate the most traffic forvarious senders, recipients, destinations, user and applications.
View the reportfrom Reports > Email > Email Usage > Mail Hosts.
The report is displayed using a graph as well as in a tabular format. By default, the report is displayed for the currentdate. The report date can be changed from the Date Selection Panel.
The bar graph displays the amount of data transferred by each user while the tabular report contains the followinginformation:
• Host: IP Address of the host.• Mail Count: Number of emails per host.• Bytes: Amount of data transferred.
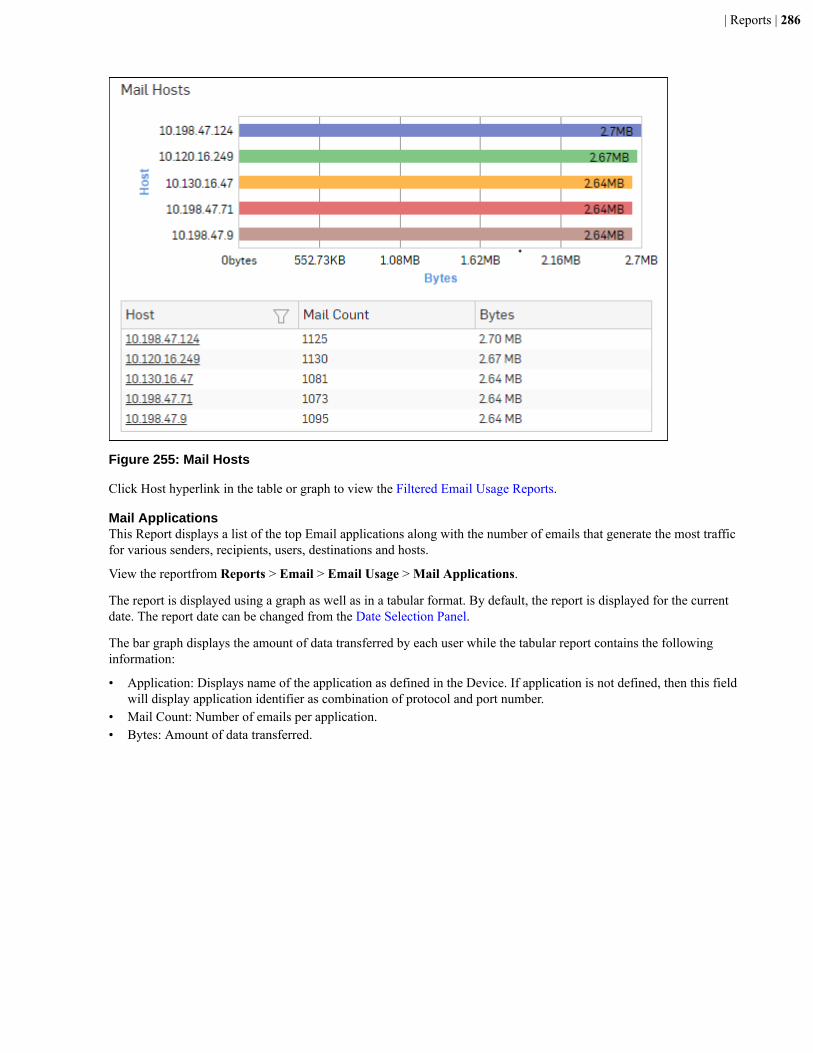
| Reports | 286
Figure 255: Mail Hosts
Click Host hyperlink in the table or graph to view the Filtered Email Usage Reports.
Mail ApplicationsThis Report displays a list of the top Email applications along with the number of emails that generate the most trafficfor various senders, recipients, users, destinations and hosts.
View the reportfrom Reports > Email > Email Usage > Mail Applications.
The report is displayed using a graph as well as in a tabular format. By default, the report is displayed for the currentdate. The report date can be changed from the Date Selection Panel.
The bar graph displays the amount of data transferred by each user while the tabular report contains the followinginformation:
• Application: Displays name of the application as defined in the Device. If application is not defined, then this fieldwill display application identifier as combination of protocol and port number.
• Mail Count: Number of emails per application.• Bytes: Amount of data transferred.
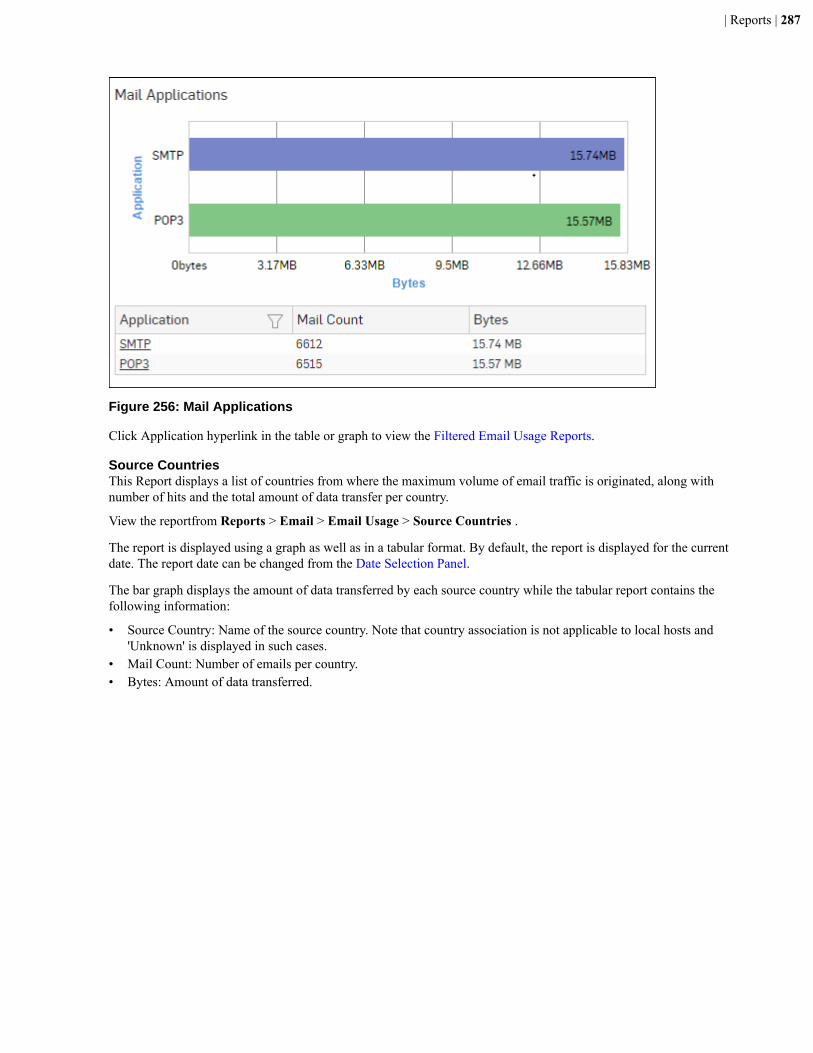
| Reports | 287
Figure 256: Mail Applications
Click Application hyperlink in the table or graph to view the Filtered Email Usage Reports.
Source CountriesThis Report displays a list of countries from where the maximum volume of email traffic is originated, along withnumber of hits and the total amount of data transfer per country.
View the reportfrom Reports > Email > Email Usage > Source Countries .
The report is displayed using a graph as well as in a tabular format. By default, the report is displayed for the currentdate. The report date can be changed from the Date Selection Panel.
The bar graph displays the amount of data transferred by each source country while the tabular report contains thefollowing information:
• Source Country: Name of the source country. Note that country association is not applicable to local hosts and'Unknown' is displayed in such cases.
• Mail Count: Number of emails per country.• Bytes: Amount of data transferred.
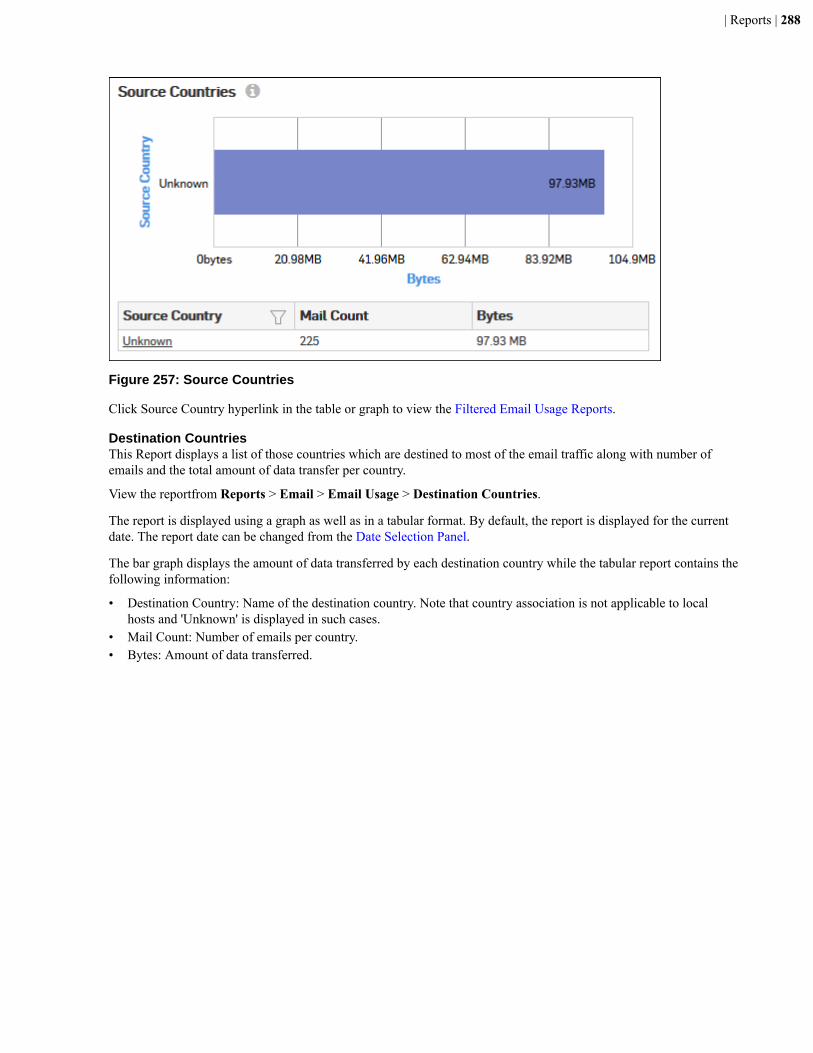
| Reports | 288
Figure 257: Source Countries
Click Source Country hyperlink in the table or graph to view the Filtered Email Usage Reports.
Destination CountriesThis Report displays a list of those countries which are destined to most of the email traffic along with number ofemails and the total amount of data transfer per country.
View the reportfrom Reports > Email > Email Usage > Destination Countries.
The report is displayed using a graph as well as in a tabular format. By default, the report is displayed for the currentdate. The report date can be changed from the Date Selection Panel.
The bar graph displays the amount of data transferred by each destination country while the tabular report contains thefollowing information:
• Destination Country: Name of the destination country. Note that country association is not applicable to localhosts and 'Unknown' is displayed in such cases.
• Mail Count: Number of emails per country.• Bytes: Amount of data transferred.

| Reports | 289
Figure 258: Destination Countries
Click Destination Country hyperlink in the table or graph to view the Filtered Email Usage Reports.
Trend - Mail UsageThis report provides mail usage trend in terms of number of mail usage event per time period.
View the reportfrom Reports > Email > Email Usage > Trend - Mail Usage.
The report is displayed using a graph as well as in a tabular format. By default, the report is displayed for the currentdate. The report date can be changed from the Date Selection Panel.
The bar graph displays mail usage event trend per time while the tabular report displays following information:
• Time: Time in the format of YYYY-MM-DD HH:MM:SS.• Event Type: Displays event type i.e. Mail Usage.• Event: Number of events per time period.

| Reports | 290
Figure 259: Trend - Mail Usage
Filtered Email Usage Reports
The Email Usage Reports can be filtered to get the following set of reports.
• Mail Senders• Mail Recipients• Mail Users• Mail Hosts• Mail Applications• Source Countries• Destination Countries
To view the Filtered Email Usage reports, you need to choose one of the following filter criteria:
• Sender from Mail Senders Report• Recipient from Mail Recipients Report• User from Mail Users Report• Host from Mail Hosts Report• Application from Mail Applications Report• Country from Source Countries Reports
| Reports | 291
• Country from Destination Countries Report
Based on the filter criterion, reports will be displayed in the following format:
• Summary - Reports in graphical format• Details - Reports in tabular format
The Filtered Summary Reports consist of multiple report widgets except the filter criterion widget. Each widgetdisplays the report in a graph as well as in a tabular format which can again be filtered. Detailed Reports are displayedin tabular format which can be filtered by clicking hyperlinks in the table.
By default, the report is displayed for the current date. The report date can be changed from the top most row of thepage.
Mail Senders widgetThis Widget Report displays a list of the top Email senders along with the number of emails and amount of datatransfer.
Note: This widget will not be displayed for filter criterion Sender.
The bar graph displays the amount of data transferred by each sender while the tabular report contains the followinginformation:
• Sender: Email ID of the sender.• Mail Count: Number of emails sent.• Bytes: Amount of data transferred.
Mail Recipients widgetThis Widget Report displays a list of the top Email recipients along with the number of emails and amount of datatransfer.
Note: This widget will not be displayed for filter criterion ‘Recipient.
The bar graph displays the amount of data transferred by each recipient while the tabular report contains the followinginformation:
• Recipient: Email ID of the recipient.• Mail Count: Number of emails received.• Bytes: Amount of data transferred.
Mail Users widgetThis Widget Report displays a list of the top Email users along with the number of emails and amount of data transfer.
Note: This widget will not be displayed for filter criterion User.
The bar graph displays the amount of data transferred by each user while the tabular report contains the followinginformation:
• User: User name as defined in the Device.• Mail Count: Number of emails per user.• Bytes: Amount of data transferred.
Mail Hosts widgetThis Widget Report displays a list of the top Email hosts along with the number of emails and amount of data transfer.
Note: This widget will not be displayed for filter criterion Host.
The bar graph displays the amount of data transferred by each host while the tabular report contains the followinginformation:
• Host: Host IP Address of the host.• Mail Count: Number of emails per host.• Bytes: Amount of data transferred.
| Reports | 292
Mail Applications widgetThis Widget Report displays a list of the top applications along with the number of emails and amount of datatransfer.
Note: This widget will not be displayed for filter criterion Application.
The bar graph displays the amount of data transferred by each application while the tabular report contains thefollowing information:
• Application/Proto:Port: Name of the application.• Mail Count: Number of emails per application.• Bytes: Amount of data transferred.
Source Countries widgetThis widget displays a list of countries from where the maximum volume of email traffic is originated, along withnumber of emails and the total amount of data transfer per country.
Note: This widget will not be displayed for filter criterion Source Country.
The bar graph displays the amount of data transferred by each source country while the tabular report contains thefollowing information:
• Source Country: Name of the source country. Note that country association is not applicable to local hosts and'Unknown' is displayed in such cases.
• Mail Count: Number of emails per country.• Bytes: Amount of data transferred.
Destination Countries widgetThis widget displays a list of those countries which are destined to most of the email traffic along with number ofemails and the total amount of data transfer per country.
Note: This widget will not be displayed for filter criterion Destination Country.
The bar graph displays the amount of data transferred by each destination country while the tabular report contains thefollowing information:
• Destination Country: Name of the destination country. Note that country association is not applicable to localhosts and 'Unknown' is displayed in such cases.
• Mail Count: Number of emails per country.• Bytes: Amount of data transferred.
Email ProtectionThe Email Protection reports dashboard provides a snapshot of Virus and Spam infected mail traffic through yournetwork.
The reports provide an overview of the traffic generated by SPX, Spam and Virus Emails.
These reports can help determine Email traffic behavior and provide a basis for fine-tuning the configuration toefficiently control traffic flow.
View the reportfrom Reports > Email > Email Protection.
The Email Protection reports dashboard enables to view the traffic generated by:
• Spam Recipients• Spam Senders• Outbound Spam Recipients• Outbound Spam Senders• Applications used for Spam• Spam Sending Countries• Spam Receiving Countries
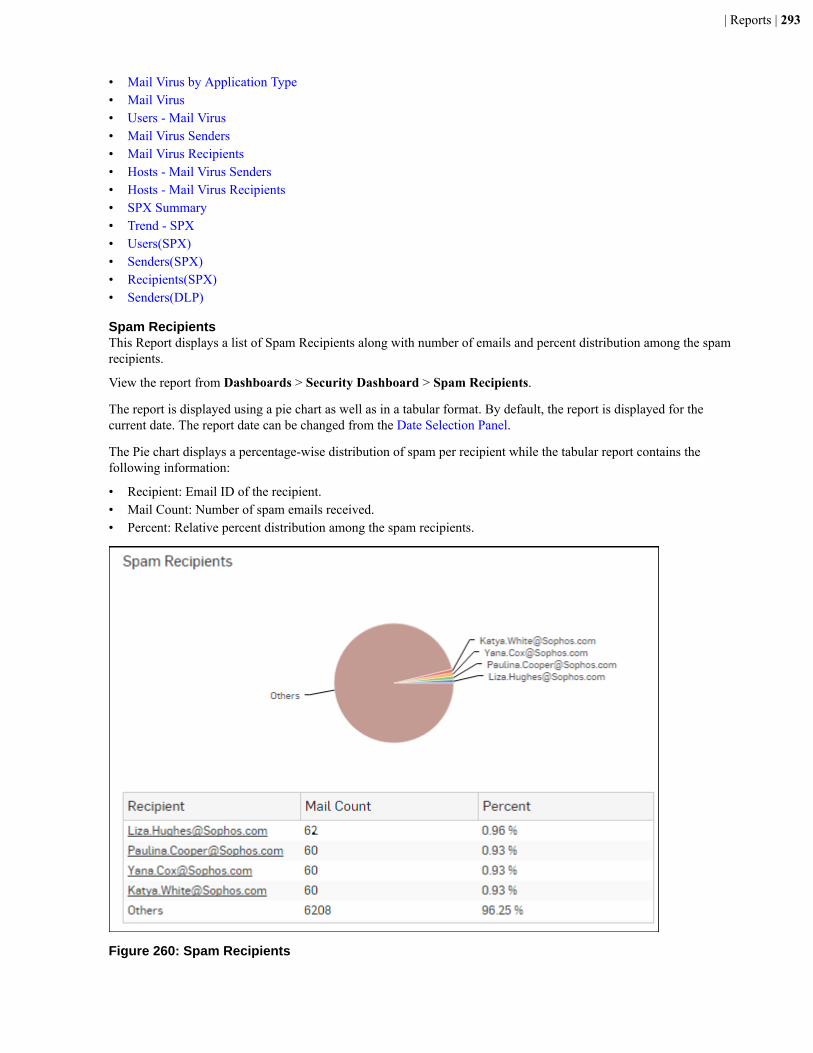
| Reports | 293
• Mail Virus by Application Type• Mail Virus• Users - Mail Virus• Mail Virus Senders• Mail Virus Recipients• Hosts - Mail Virus Senders• Hosts - Mail Virus Recipients• SPX Summary• Trend - SPX• Users(SPX)• Senders(SPX)• Recipients(SPX)• Senders(DLP)
Spam RecipientsThis Report displays a list of Spam Recipients along with number of emails and percent distribution among the spamrecipients.
View the report from Dashboards > Security Dashboard > Spam Recipients.
The report is displayed using a pie chart as well as in a tabular format. By default, the report is displayed for thecurrent date. The report date can be changed from the Date Selection Panel.
The Pie chart displays a percentage-wise distribution of spam per recipient while the tabular report contains thefollowing information:
• Recipient: Email ID of the recipient.• Mail Count: Number of spam emails received.• Percent: Relative percent distribution among the spam recipients.
Figure 260: Spam Recipients
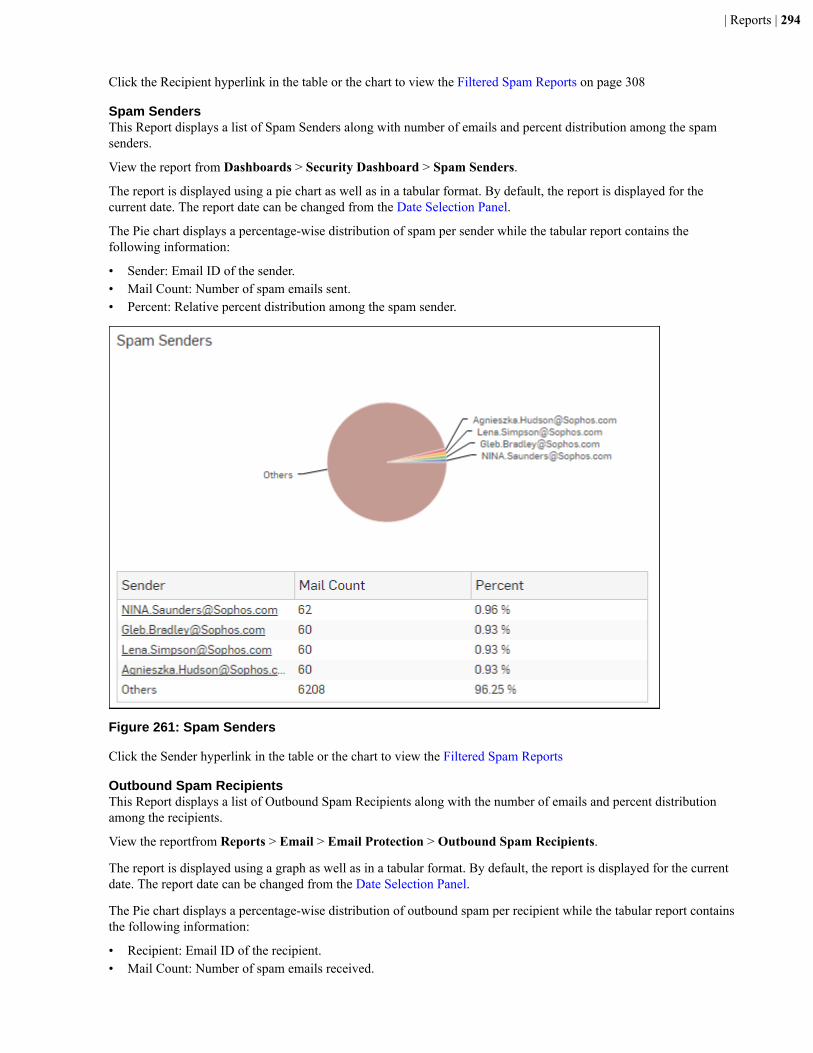
| Reports | 294
Click the Recipient hyperlink in the table or the chart to view the Filtered Spam Reports on page 308
Spam SendersThis Report displays a list of Spam Senders along with number of emails and percent distribution among the spamsenders.
View the report from Dashboards > Security Dashboard > Spam Senders.
The report is displayed using a pie chart as well as in a tabular format. By default, the report is displayed for thecurrent date. The report date can be changed from the Date Selection Panel.
The Pie chart displays a percentage-wise distribution of spam per sender while the tabular report contains thefollowing information:
• Sender: Email ID of the sender.• Mail Count: Number of spam emails sent.• Percent: Relative percent distribution among the spam sender.
Figure 261: Spam Senders
Click the Sender hyperlink in the table or the chart to view the Filtered Spam Reports
Outbound Spam RecipientsThis Report displays a list of Outbound Spam Recipients along with the number of emails and percent distributionamong the recipients.
View the reportfrom Reports > Email > Email Protection > Outbound Spam Recipients.
The report is displayed using a graph as well as in a tabular format. By default, the report is displayed for the currentdate. The report date can be changed from the Date Selection Panel.
The Pie chart displays a percentage-wise distribution of outbound spam per recipient while the tabular report containsthe following information:
• Recipient: Email ID of the recipient.• Mail Count: Number of spam emails received.
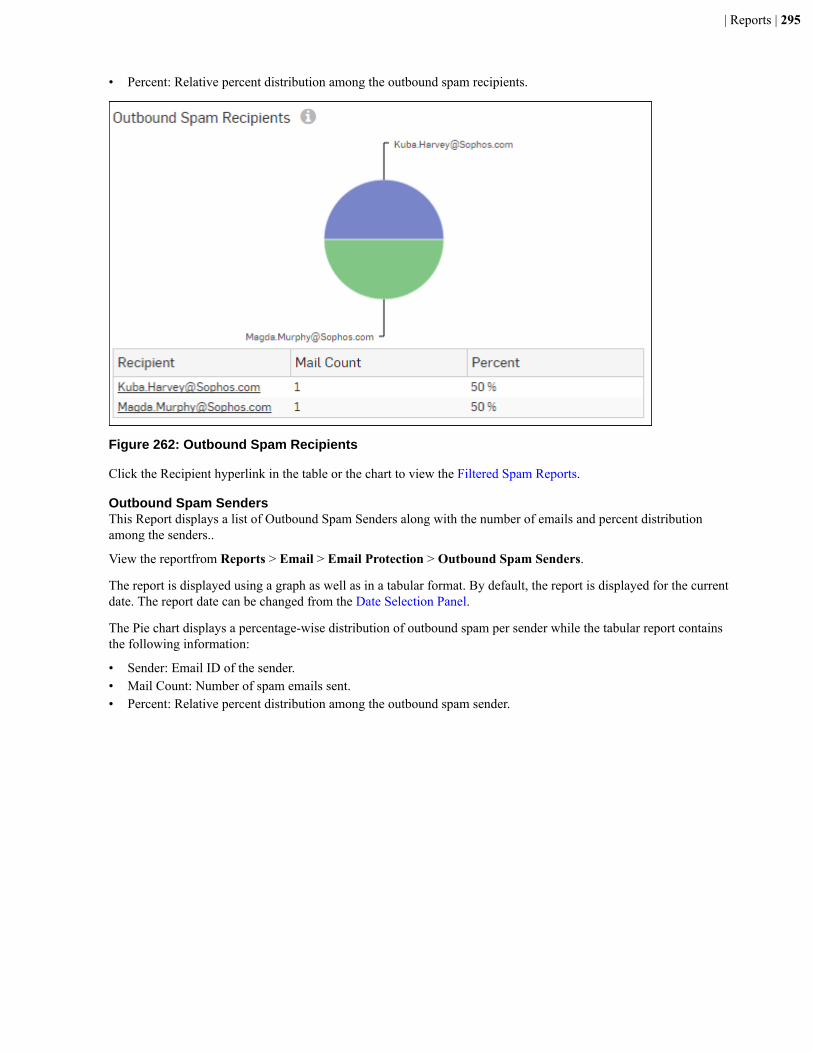
| Reports | 295
• Percent: Relative percent distribution among the outbound spam recipients.
Figure 262: Outbound Spam Recipients
Click the Recipient hyperlink in the table or the chart to view the Filtered Spam Reports.
Outbound Spam SendersThis Report displays a list of Outbound Spam Senders along with the number of emails and percent distributionamong the senders..
View the reportfrom Reports > Email > Email Protection > Outbound Spam Senders.
The report is displayed using a graph as well as in a tabular format. By default, the report is displayed for the currentdate. The report date can be changed from the Date Selection Panel.
The Pie chart displays a percentage-wise distribution of outbound spam per sender while the tabular report containsthe following information:
• Sender: Email ID of the sender.• Mail Count: Number of spam emails sent.• Percent: Relative percent distribution among the outbound spam sender.
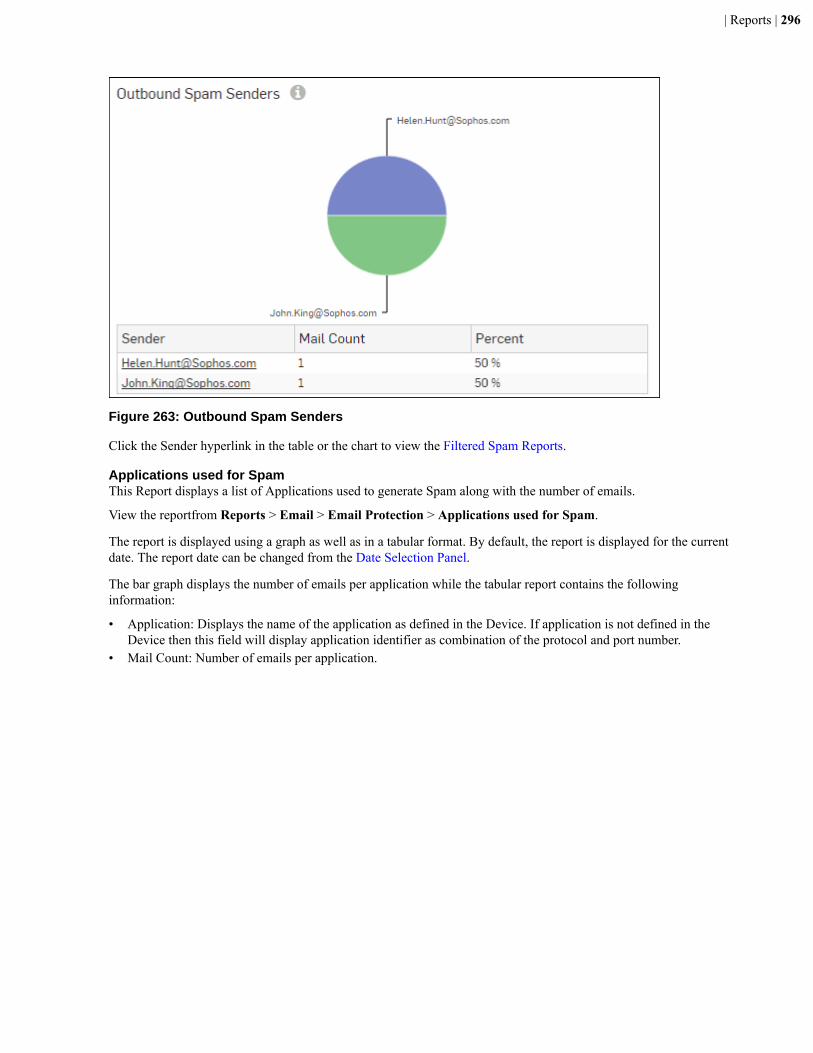
| Reports | 296
Figure 263: Outbound Spam Senders
Click the Sender hyperlink in the table or the chart to view the Filtered Spam Reports.
Applications used for SpamThis Report displays a list of Applications used to generate Spam along with the number of emails.
View the reportfrom Reports > Email > Email Protection > Applications used for Spam.
The report is displayed using a graph as well as in a tabular format. By default, the report is displayed for the currentdate. The report date can be changed from the Date Selection Panel.
The bar graph displays the number of emails per application while the tabular report contains the followinginformation:
• Application: Displays the name of the application as defined in the Device. If application is not defined in theDevice then this field will display application identifier as combination of the protocol and port number.
• Mail Count: Number of emails per application.
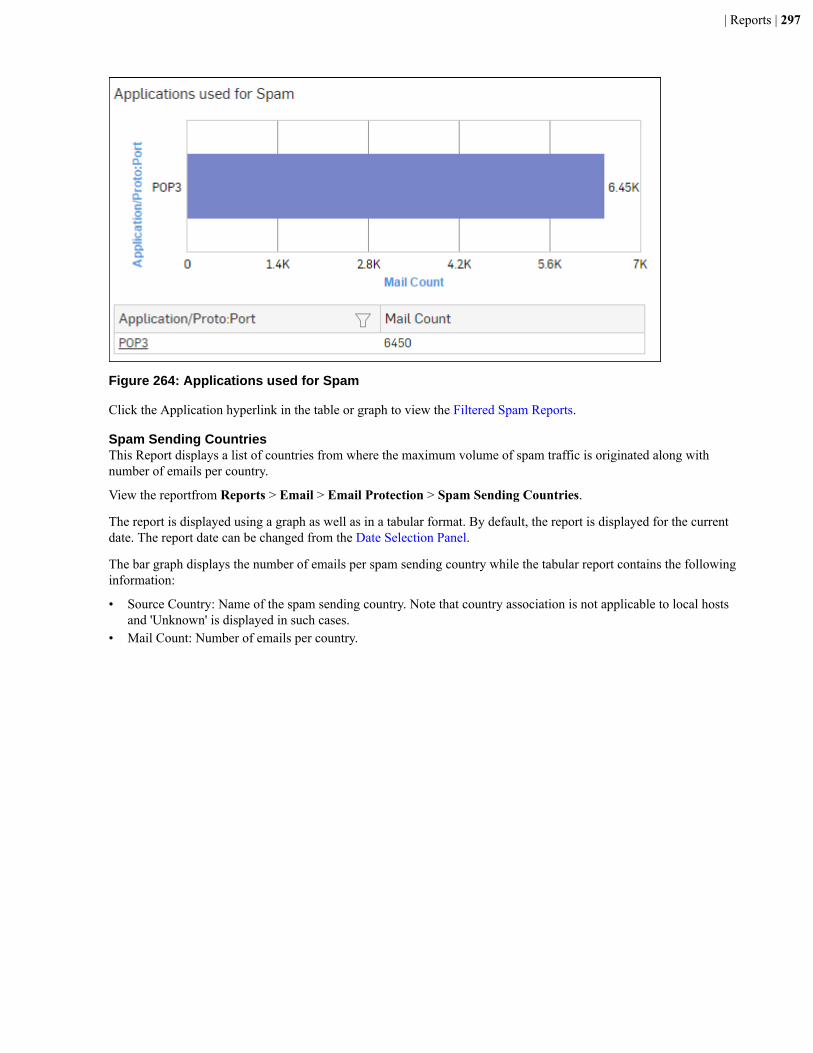
| Reports | 297
Figure 264: Applications used for Spam
Click the Application hyperlink in the table or graph to view the Filtered Spam Reports.
Spam Sending CountriesThis Report displays a list of countries from where the maximum volume of spam traffic is originated along withnumber of emails per country.
View the reportfrom Reports > Email > Email Protection > Spam Sending Countries.
The report is displayed using a graph as well as in a tabular format. By default, the report is displayed for the currentdate. The report date can be changed from the Date Selection Panel.
The bar graph displays the number of emails per spam sending country while the tabular report contains the followinginformation:
• Source Country: Name of the spam sending country. Note that country association is not applicable to local hostsand 'Unknown' is displayed in such cases.
• Mail Count: Number of emails per country.
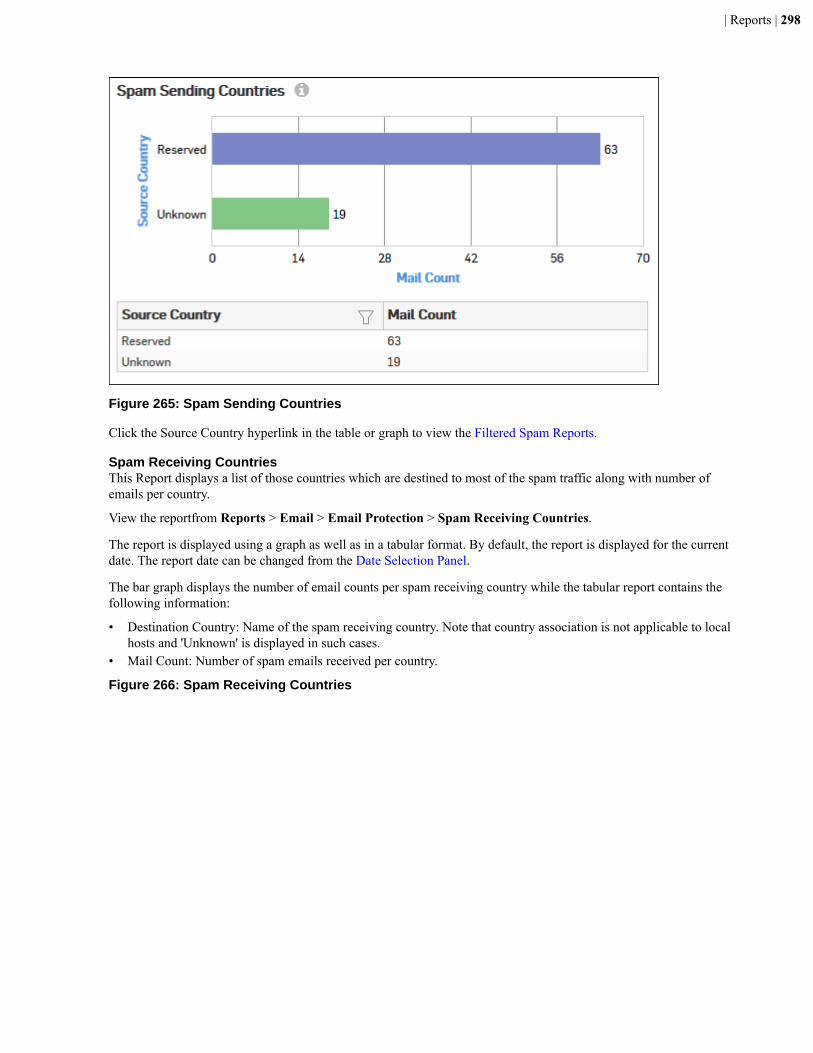
| Reports | 298
Figure 265: Spam Sending Countries
Click the Source Country hyperlink in the table or graph to view the Filtered Spam Reports.
Spam Receiving CountriesThis Report displays a list of those countries which are destined to most of the spam traffic along with number ofemails per country.
View the reportfrom Reports > Email > Email Protection > Spam Receiving Countries.
The report is displayed using a graph as well as in a tabular format. By default, the report is displayed for the currentdate. The report date can be changed from the Date Selection Panel.
The bar graph displays the number of email counts per spam receiving country while the tabular report contains thefollowing information:
• Destination Country: Name of the spam receiving country. Note that country association is not applicable to localhosts and 'Unknown' is displayed in such cases.
• Mail Count: Number of spam emails received per country.
Figure 266: Spam Receiving Countries
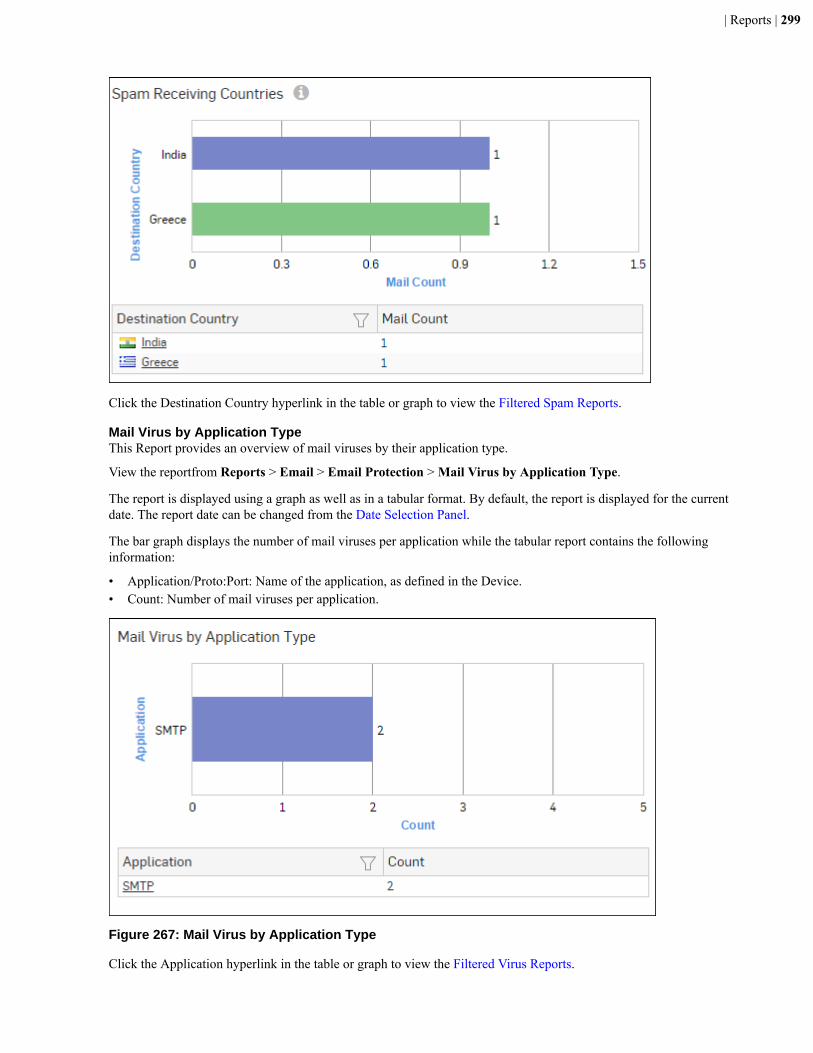
| Reports | 299
Click the Destination Country hyperlink in the table or graph to view the Filtered Spam Reports.
Mail Virus by Application TypeThis Report provides an overview of mail viruses by their application type.
View the reportfrom Reports > Email > Email Protection > Mail Virus by Application Type.
The report is displayed using a graph as well as in a tabular format. By default, the report is displayed for the currentdate. The report date can be changed from the Date Selection Panel.
The bar graph displays the number of mail viruses per application while the tabular report contains the followinginformation:
• Application/Proto:Port: Name of the application, as defined in the Device.• Count: Number of mail viruses per application.
Figure 267: Mail Virus by Application Type
Click the Application hyperlink in the table or graph to view the Filtered Virus Reports.

| Reports | 300
Mail VirusThis Report displays Viruses detected in your network along with number of hits per Virus.
View the reportfrom Reports > Email > Email Protection > Mail Virus.
The report is displayed using a graph as well as in a tabular format. By default, the report is displayed for the currentdate. The report date can be changed from the Date Selection Panel.
The bar graph displays the number of counts per mail virus while the tabular report contains the followinginformation:
• Virus: Name of the virus.• Count: Number of counts per mail virus.
Figure 268: Mail Virus
Click the Virus hyperlink in the table or graph to view the Filtered Virus Reports.
Users - Mail VirusThis Report provides an overview of mail virus users along with number of hits per user.
View the reportfrom Reports > Email > Email Protection > Users - Mail Virus.
The report is displayed using a graph as well as in a tabular format. By default, the report is displayed for the currentdate. The report date can be changed from the Date Selection Panel.
The bar graph displays the number of counts per mail virus user while the tabular report contains the followinginformation:
• User: Name of the mail virus user.• Count: Number of counts per mail virus user.

| Reports | 301
Figure 269: Users - Mail Virus
Click the Username hyperlink in the table or graph to view the Filtered Virus Reports.
Mail Virus SendersThis Report displays mail virus senders along with number of hits per sender.
View the reportfrom Reports > Email > Email Protection > Mail Virus Senders.
The report is displayed using a graph as well as in a tabular format. By default, the report is displayed for the currentdate. The report date can be changed from the Date Selection Panel.
The bar graph displays the number of counts per mail virus sender while the tabular report contains the followinginformation:
• Sender: Name of the mail virus sender.• Count: Number of counts per mail virus sender.
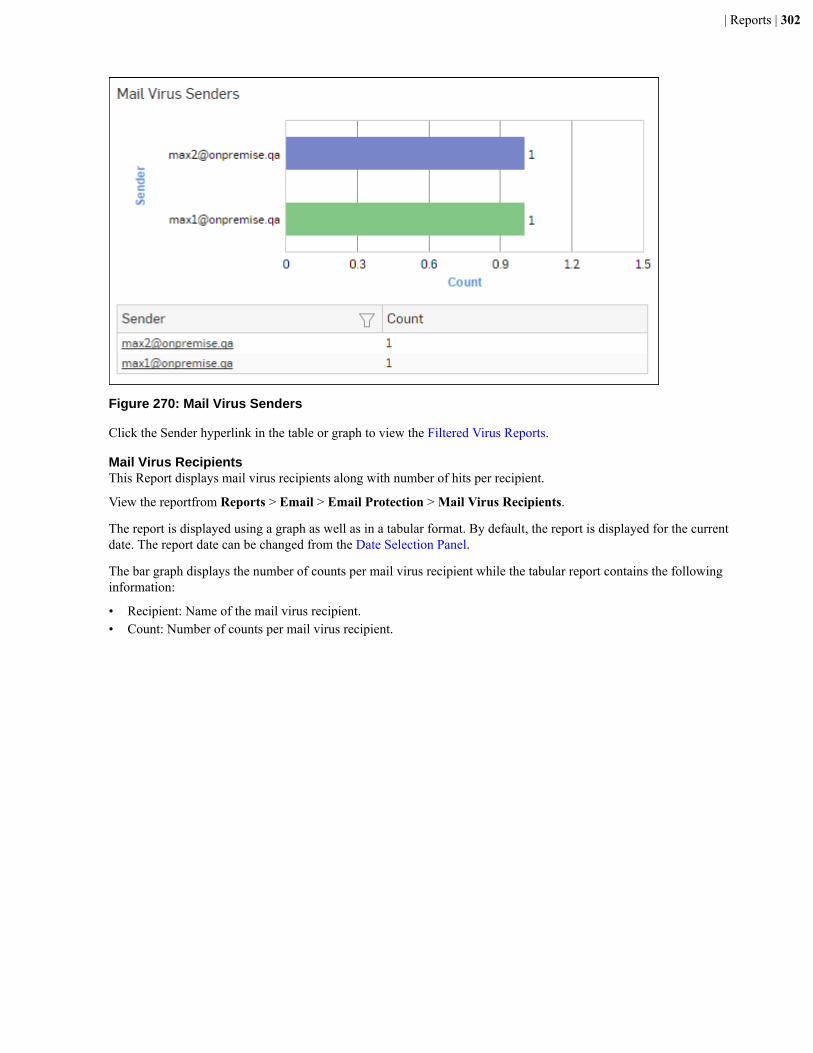
| Reports | 302
Figure 270: Mail Virus Senders
Click the Sender hyperlink in the table or graph to view the Filtered Virus Reports.
Mail Virus RecipientsThis Report displays mail virus recipients along with number of hits per recipient.
View the reportfrom Reports > Email > Email Protection > Mail Virus Recipients.
The report is displayed using a graph as well as in a tabular format. By default, the report is displayed for the currentdate. The report date can be changed from the Date Selection Panel.
The bar graph displays the number of counts per mail virus recipient while the tabular report contains the followinginformation:
• Recipient: Name of the mail virus recipient.• Count: Number of counts per mail virus recipient.
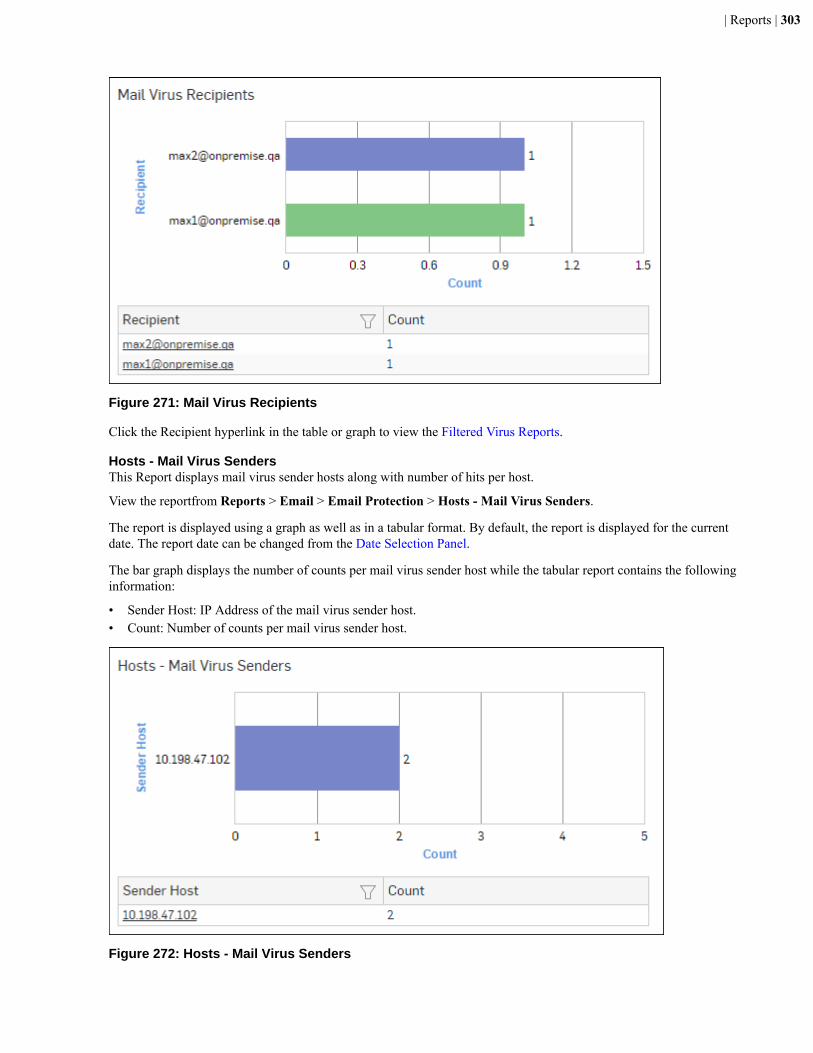
| Reports | 303
Figure 271: Mail Virus Recipients
Click the Recipient hyperlink in the table or graph to view the Filtered Virus Reports.
Hosts - Mail Virus SendersThis Report displays mail virus sender hosts along with number of hits per host.
View the reportfrom Reports > Email > Email Protection > Hosts - Mail Virus Senders.
The report is displayed using a graph as well as in a tabular format. By default, the report is displayed for the currentdate. The report date can be changed from the Date Selection Panel.
The bar graph displays the number of counts per mail virus sender host while the tabular report contains the followinginformation:
• Sender Host: IP Address of the mail virus sender host.• Count: Number of counts per mail virus sender host.
Figure 272: Hosts - Mail Virus Senders
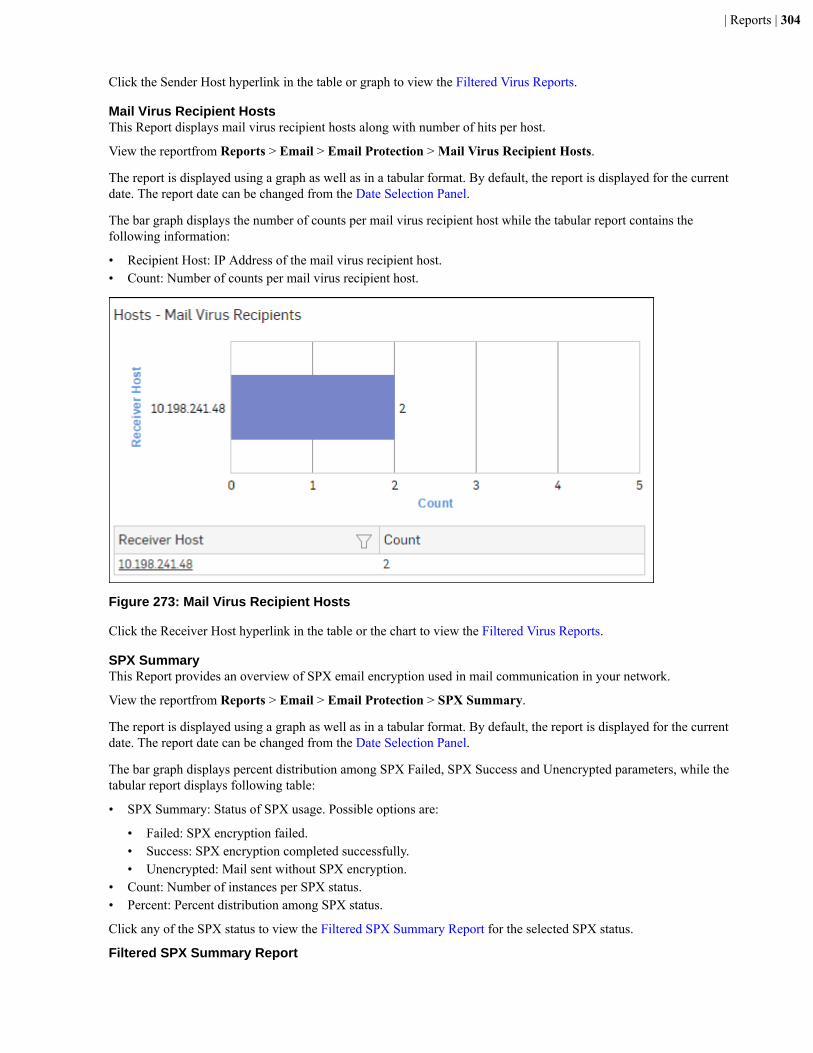
| Reports | 304
Click the Sender Host hyperlink in the table or graph to view the Filtered Virus Reports.
Mail Virus Recipient HostsThis Report displays mail virus recipient hosts along with number of hits per host.
View the reportfrom Reports > Email > Email Protection > Mail Virus Recipient Hosts.
The report is displayed using a graph as well as in a tabular format. By default, the report is displayed for the currentdate. The report date can be changed from the Date Selection Panel.
The bar graph displays the number of counts per mail virus recipient host while the tabular report contains thefollowing information:
• Recipient Host: IP Address of the mail virus recipient host.• Count: Number of counts per mail virus recipient host.
Figure 273: Mail Virus Recipient Hosts
Click the Receiver Host hyperlink in the table or the chart to view the Filtered Virus Reports.
SPX SummaryThis Report provides an overview of SPX email encryption used in mail communication in your network.
View the reportfrom Reports > Email > Email Protection > SPX Summary.
The report is displayed using a graph as well as in a tabular format. By default, the report is displayed for the currentdate. The report date can be changed from the Date Selection Panel.
The bar graph displays percent distribution among SPX Failed, SPX Success and Unencrypted parameters, while thetabular report displays following table:
• SPX Summary: Status of SPX usage. Possible options are:
• Failed: SPX encryption failed.• Success: SPX encryption completed successfully.• Unencrypted: Mail sent without SPX encryption.
• Count: Number of instances per SPX status.• Percent: Percent distribution among SPX status.
Click any of the SPX status to view the Filtered SPX Summary Report for the selected SPX status.
Filtered SPX Summary Report
| Reports | 305
The SPX Summary Reports can be drilled down to get the following set of Filtered SPX Summary Reports in widgetformat:
• SPX Success_Users• SPX Success_Senders• SPX Success_Recipients• SPX Failed_Users• SPX Failed_Senders• SPX Failed_Recipients• Unencrypted_Users• Unencrypted_Sender• Unencrypted_Recipients
To view the Filtered SPX reports, you need to choose one of the following filter criteria:
• SPX Failed from SPX Summary Report• SPX Success from SPX Summary Report• Unencrypted from SPX Summary Report
The Filtered SPX Reports consist of multiple report widgets except the filter criterion widget. Each widget displaysthe report in a graph as well as in a tabular format which can again be filtered.
By default, the report is displayed for the current date. The report date can be changed from the top most row of thepage.
SPX Success_Users widgetThis widget report provides an overview of users who have successfully used SPX email encryption along withnumber of such mails per user.
View the report from Reports > Email > Email Protection > SPX Summary > SPX Success.
The Report is displayed as a pie chart as well as in a tabular format.
The bar graph displays the number of mail count per user while the tabular report contains the following information:
• User: Name of the user using SPX email encryption.• Mail Count: Number of mails (sent + received) with SPX email encryption, per user.
SPX Success_Senders widgetThis widget report displays Email IDs of the users who have successfully sent mails encrypted with SPX encryptionalong with number of such mails sent per user.
View the report from Reports > Email > Email Protection > SPX Summary > SPX Success.
The Report is displayed as a pie chart as well as in a tabular format.
The bar graph displays the number of Email sent using SPX per user while the tabular report contains the followinginformation:
• Sender: Email ID of the user using SPX email encryption.• Mail Count: Number of mails sent using SPX email encryption, per user.
SPX Success_Recipients widgetThis Widget report displays Email IDs of the users who have successfully received mails encrypted with SPXencryption along with number of such mails received per user.
View the report from Reports > Email > Email Protection > SPX Summary > SPX Success.
The Report is displayed as a pie chart as well as in a tabular format.
The bar graph displays the number of mails encrypted with Secure PDF Exchange (SPX) received per user while thetabular report contains the following information:
• Recipient: Email ID of the user receiving mails encrypted with SPX.

| Reports | 306
• Mail Count: Number of SPX encrypted mail received per user.
SPX Failed_Users widgetThis Widget report provides an overview of users who have failed to use SPX email encryption along with number ofsuch mails per user.
View the report from Reports > Email > Email Protection > SPX Summary > SPX Failed.
The Report is displayed as a pie chart as well as in a tabular format.
The bar graph displays the number of mail count per user while the tabular report contains the following information:
• User: Name of the user failed to use SPX email encryption.• Mail Count: Number of times the SPX email encryption failed, per user.
SPX Failed_Senders widgetThis Widget report displays Email IDs of the users who have failed to use SPX email encryption along with numberof such mails sent per user.
View the report from Reports > Email > Email Protection > SPX Summary > SPX Failed.
The Report is displayed as a pie chart as well as in a tabular format.
The bar graph displays the number of failed attempts to use SPX email encryption per sender Email ID while thetabular report contains the following information:
• Sender: Email ID of the mail sender who failed to use SPX email encryption.• Mail Count: Number of times the SPX email encryption failed, per Email ID.
SPX Failed_Recipients widgetThis Widget report displays Email IDs of the users who failed to use SPX email encryption along with number ofsuch mails sent per user.
View the report from Reports > Email > Email Protection > SPX Summary > SPX Failed.
The Report is displayed as a pie chart as well as in a tabular format.
The bar graph displays the number of failed attempts to use SPX email encryption per Recipient Email ID while thetabular report contains the following information:
• Recipient: Email ID of the mail recipient user who failed to use SPX email encryption.• Mail Count: Number of times the SPX email encryption failed, per Email ID.
Unencrypted_Users widgetThis Widget report displays users who have sent/received emails without SPX email encryption along with number ofsuch mails per user.
View the report from Reports > Email > Email Protection > SPX Summary > Unencrypted.
The Report is displayed as a pie chart as well as in a tabular format.
The bar graph displays the number of mail count per user while the tabular report contains the following information:
• User: Name of the user who have sent/received email without SPX email encryption.• Mail Count: Number of times the user has sent email without SPX email encryption.
Unencrypted_Sender widgetThis Widget report displays Email IDs of the users who have not sent emails with SPX email encryption along withnumber of such mails sent per user.
View the report from Reports > Email > Email Protection > SPX Summary > Unencrypted.
The Report is displayed as a pie chart as well as in a tabular format.
The bar graph displays the number of emails sent by a user without SPX email encryption while the tabular reportcontains the following information:
• Sender: Email ID of the mail sender who have sent mails without SPX email encryption.
| Reports | 307
• Mail Count: Number of times the sender has sent mails without SPX email encryption .
Unencrypted_Recipients widgetThis Widget report displays Email IDs of the users who have received emails without SPX email encryption alongwith number of such mails sent per user.
View the report from Reports > Email > Email Protection > SPX Summary > Unencrypted.
The Report is displayed as a pie chart as well as in a tabular format.
The bar graph displays the number of unencrypted emails received per user while the tabular report contains thefollowing information:
• Recipient: Email ID of the mail recipient who have received mails without SPX email encryption.• Mail Count: Number of times the recipient has received mails sent without SPX email encryption .
Trend - SPXThis report provides SPX usage time trend in terms of number of SPX events per time period.
View the reportfrom Reports > Email > Email Protection > Trend - SPX.
The report is displayed using a graph as well as in a tabular format. By default, the report is displayed for the currentdate. The report date can be changed from the Date Selection Panel.
The bar graph displays number of SPX usage events per time period while the tabular report displays followinginformation:
• Time: Time in the format of YYYY-MM-DD HH:MM:SS.• Event: Number of events per time period.
Users (SPX)This Report provides an overview of users using Secure PDF Exchange (SPX) email encryption along with number ofsuch mails per user.
View the reportfrom Reports > Email > Email Protection > Users (SPX).
The report is displayed using a graph as well as in a tabular format. By default, the report is displayed for the currentdate. The report date can be changed from the Date Selection Panel.
The bar graph displays the number of mail count per user while the tabular report contains the following information:
• User: Name of the user using SPX email encryption.• Mail Count: Number of mails (sent + received) with SPX email encryption, per user.
Click the User hyperlink in the table or the chart to view the Filtered SPX Reports.
Senders (SPX)This Report provides an overview of users using Secure PDF Exchange (SPX) email encryption for sending Emailsalong with number of such mails sent per user.
View the reportfrom Reports > Email > Email Protection > Senders (SPX).
The report is displayed using a graph as well as in a tabular format. By default, the report is displayed for the currentdate. The report date can be changed from the Date Selection Panel.
The bar graph displays the number of Email sent using SPX per user while the tabular report contains the followinginformation:
• Sender: Email ID of the user using SPX email encryption.• Mail Count: Number of mails sent using SPX email encryption, per user.
Click the Sender hyperlink in the table or the chart to view the Filtered SPX Reports.
| Reports | 308
Recipients (SPX)This Report provides an overview of users receiving mails encrypted with Secure PDF Exchange (SPX) along withnumber of such mails received per user.
View the reportfrom Reports > Email > Email Protection > Recipients (SPX).
The report is displayed using a graph as well as in a tabular format. By default, the report is displayed for the currentdate. The report date can be changed from the Date Selection Panel.
The bar graph displays the number of mails encrypted with Secure PDF Exchange (SPX) received per user while thetabular report contains the following information:
• Recipient: Email ID of the user receiving mails encrypted with Secure PDF Exchange (SPX).• Mail Count: Number of SPX encrypted mail received per user.
Click the Recipient hyperlink in the table or the chart to view the Filtered SPX Reports.
Senders (DLP)This Report provides an overview of users sending mails protected with Data Protection feature along with number ofsuch mails sent per user.
The Data Protection scans outgoing emails including subject line, message body and attachments for sensitive orconfidential information. Based on the outcome, the email can be encrypted using SPX encryption, or the email canbe rejected or sent.
View the reportfrom Reports > Email > Email Protection > Senders (DLP).
The report is displayed using a graph as well as in a tabular format. By default, the report is displayed for the currentdate. The report date can be changed from the Date Selection Panel.
The bar graph displays the number of mails protected with Data Protection sent per user while the tabular reportcontains the following information:
• Sender: Email ID of the user sending mails protected with Data Protection.• Count: Number such mails sent per user.
Click the Sender hyperlink in the table or the chart to view the Recipients (DLP) report.
Recipients (DLP)This Report provides a list of users receiving mails from the selected mail sender along with number of mails receivedper Recipients' Email ID.
View the report from Reports > Email > Email Protection > Senders (DLP) > Sender.
The Report is displayed as a pie chart as well as in a tabular format.
By default, the report is displayed for the current date. The report date can be changed from the top most row of thepage.
The bar graph displays the number of mails a recipient received from the selected mail sender, while the tabular reportcontains the following information:
• Recipients (DLP): Email ID of the user receiving mails (protected with Data Protection) from the selected mailsender.
• Count: Number such mails received per user.
Filtered Spam Reports
The Email Protection Reports can be drilled down to get the following set of Filtered Spam Reports in widget format:
• Spam Recipients• Spam Senders• Applications used for Spam• Spam Sending Countries
| Reports | 309
• Outbound Spam Recipients• Outbound Spam Sender• Spam Receiving Countries
To view the Filtered Email Usage reports, you need to choose one of the following filter criteria:
• Recipient from Spam Recipients Report• Sender from Spam Senders Report• Application from Applications used for Spam Report• Country from Spam Sending Countries Report• Recipient from Outbound Spam Recipients Report• Sender from Outbound Spam Sender Report• Country from Spam Receiving Countries Report
Based on the filter criterion, reports will be displayed in the following format:
• Summary - Reports in graphical format• Details - Reports in tabular format
The Filtered Summary Reports consist of multiple report widgets except the filter criterion widget. Each widgetdisplays the report in a graph as well as in a tabular format which can again be filtered. Detailed Reports are displayedin tabular format which can be filtered by clicking hyperlinks in the table.
By default, the report is displayed for the current date. The report date can be changed from the top most row of thepage.
Spam Recipients widgetThis widget report displays a list of Spam Recipients along with number of emails per spam recipient.
Note: This widget will not be displayed for filter criterion Recipient.
The Pie chart displays number of hits per spam per recipient while the tabular report contains the followinginformation:
• Recipient: Email ID of the recipient.• Mail Count: Number of spam emails received.
Spam Senders widgetThis widget report displays a list of Spam Senders along with number of hits per spam sender.
Note: This widget will not be displayed for filter criterion Sender.
The Pie chart displays number of hits per spam per sender while the tabular report contains the following information:
• Sender: Email ID of the sender.• Mail Count: Number of spam emails sent.
Applications used for Spam widgetThis widget report displays a list of Applications used to generate Spam along with the number of emails.
Note: This widget will not be displayed for filter criterion Application.
The report is displayed as a pie chart as well as in a tabular format.
The bar graph displays number of hits per application while the tabular report contains the following information:
• Application: Displays the name of the application as defined in the Device. If application is not defined in theDevice then this field will display application identifier as combination of the protocol and port number.
• Mail Count: Number of emails per application.
Spam Sending Countries widgetThis widget displays a list of countries from where the maximum volume of spam traffic is originated along withnumber of emails per country.
| Reports | 310
Note: This widget will not be displayed for filter criterion Source Country.
The Report is displayed as a pie chart as well as in a tabular format.
The bar graph displays the number of hits per spam sending country while the tabular report contains the followinginformation:
• Source Country: Name of the spam sending country. Note that country association is not applicable to local hostsand 'Unknown' is displayed in such cases.
• Mail Count: Number of emails per country.
Outbound Spam Recipients widgetThis widget report displays a list of Outbound Spam Recipients along with number of emails per spam recipient.
Note: This widget will not be displayed for filter criterion Recipient.
The Report is displayed as a pie chart as well as in a tabular format.
The Pie chart displays number of hits per recipient while the tabular report contains the following information:
• Recipient: Email ID of the recipient.• Mail Count: Number of spam emails received.
Outbound Spam Sender widgetThis widget report displays a list of Outbound Spam Senders along with number of emails per spam sender.
Note: This widget will not be displayed for filter criterion Sender.
The Report is displayed as a pie chart as well as in a tabular format.
The Pie chart displays number of hits per sender while the tabular report contains the following information:
• Sender: Email ID of the recipient.• Mail Count: Number of spam emails sent.
Spam Receiving Countries widgetThis widget displays a list of those countries which are destined to most of the spam traffic along with number ofemails per country.
Note: This widget will not be displayed for filter criterion Destination Country.
The Report is displayed as a pie chart as well as in a tabular format.
The bar graph displays the number of hits per spam receiving country while the tabular report contains the followinginformation:
• Destination Country: Name of the spam receiving country. Note that country association is not applicable to localhosts and 'Unknown' is displayed in such cases.
• Mail Count: Number of spam emails received per country.
Filtered Virus Reports
The Email Protection Reports can be drilled down to get the following set of Filtered Virus Reports in widget format:
• Mail Virus by Application Type• Mail Virus• Users - Mail Virus• Mail Virus Senders• Mail Virus Recipients• Hosts - Mail Virus Senders• Hosts - Mail Virus Recipients
To view the Filtered Email Usage reports, you need to choose one of the following filter criteria:
| Reports | 311
• Application from Mail Virus by Application Type Report• Virus from Mail Virus Report• User from Users - Mail Virus Report• Sender from Mail Virus Senders Report• Recipient from Mail Virus Recipients Report• Host from Hosts - Mail Virus Senders Report• Host from Hosts - Mail Virus Recipients Report
Based on the filter criterion, reports will be displayed in the following format:
• Summary - Reports in graphical format• Details - Reports in tabular format
The Filtered Summary Reports consist of multiple report widgets except the filter criterion widget. Each widgetdisplays the report in a graph as well as in a tabular format which can again be filtered. Detailed Reports are displayedin tabular format which can be filtered by clicking hyperlinks in the table.
By default, the report is displayed for the current date. The report date can be changed from the top most row of thepage.
Mail Virus by Application Type widgetThis Widget report provides an overview of mail viruses by their application type.
Note: This widget will not be displayed for filter criterion Application.
The Report is displayed as a pie chart as well as in a tabular format.
The bar graph displays the number of mail viruses per application while the tabular report contains the followinginformation:
• Application:Port: Name of the application, as defined in the Device.• Count: Number of mail viruses per application.
Mail Virus widgetThis Widget report displays Viruses detected in your network along with number of hits per virus.
Note: This widget will not be displayed for filter criterion Virus.
The Report is displayed as a pie chart as well as in a tabular format.
The bar graph displays the number of counts per mail virus while the tabular report contains the followinginformation:
• Virus: Name of the virus.• Count: Number of counts per mail virus.
Users - Mail Virus widgetThis Widget report provides an overview of mail virus users along with number of hits per user.
Note: This widget will not be displayed for filter criterion User.
The Report is displayed as a pie chart as well as in a tabular format.
The bar graph displays the number of counts per mail virus user while the tabular report contains the followinginformation:
• User: Name of the mail virus user.• Count: Number of counts per mail virus user.
Mail Virus Senders widgetThis Widget report displays mail virus senders along with number of hits per sender.
Note: This widget will not be displayed for filter criterion Sender.
| Reports | 312
The Report is displayed as a pie chart as well as in a tabular format.
The bar graph displays the number of counts per mail virus sender while the tabular report contains the followinginformation:
• Sender: Name of the mail virus sender.• Count: Number of counts per mail virus sender.
Mail Virus Recipients widgetThis Widget report displays mail virus recipients along with number of hits per recipient.
Note: This widget will not be displayed for filter criterion Recipient.
The Report is displayed as a pie chart as well as in a tabular format.
The bar graph displays the number of counts per mail virus recipient while the tabular report contains the followinginformation:
• Recipient: Name of the mail virus recipient.• Count: Number of counts per mail virus recipient.
Hosts - Mail Virus Senders widgetThis Widget report displays mail virus sender hosts along with number of hits per host.
Note: This widget will not be displayed for filter criterion Sender Host.
The Report is displayed as a pie chart as well as in a tabular format.
The bar graph displays the number of counts per mail virus sender host while the tabular report contains the followinginformation:
• Sender Host: IP Address of the mail virus sender host.• Count: Number of counts per mail virus sender host.
Hosts - Mail Virus Recipients widgetThis Widget report displays mail virus recipient hosts along with number of hits per host.
Note: This widget will not be displayed for filter criterion Recipient Host.
The Report is displayed as a pie chart as well as in a tabular format.
The bar graph displays the number of counts per mail virus recipient host while the tabular report contains thefollowing information:
• Recipient Host: IP Address of the mail virus recipient host.• Count: Number of counts per mail virus recipient host.
Filtered SPX Reports
The Users (SPX), Senders (SPX) and Recipients (SPX) Reports can be drilled down to get the following set ofFiltered SPX Reports in widget format:
• Users (SPX)• Senders (SPX)• Recipients (SPX)
To view the Filtered SPX reports, you need to choose one of the following filter criteria:
• User from Users (SPX) Report• Sender from Senders (SPX) Report• Recipient from Recipients (SPX) Report
The Filtered SPX Reports consist of multiple report widgets except the filter criterion widget. Each widget displaysthe report in a graph as well as in a tabular format which can again be filtered.

| Compliance | 313
By default, the report is displayed for the current date. The report date can be changed from the top most row of thepage.
Users (SPX) widgetThis Report provides an overview of users using SPX email encryption along with number of such mails per user.
Note: This widget is not displayed for the filter criterion User.
The Report is displayed as a pie chart as well as in a tabular format.
The bar graph displays the number of mail count per user while the tabular report contains the following information:
• User: Name of the user using SPX email encryption.• Mail Count: Number of mails (sent + received) with SPX email encryption, per user.
Senders (SPX) widgetThis Report provides an overview of Email IDs using SPX email encryption for sending Emails along with number ofsuch mails sent per user.
Note: This widget is not displayed for the filter criterion Sender.
The Report is displayed as a pie chart as well as in a tabular format.
The bar graph displays the number of Email sent using SPX per Email ID while the tabular report contains thefollowing information:
• Sender: Email ID of the user using SPX email encryption.• Mail Count: Number of mails sent using SPX email encryption, per user.
Recipients (SPX) widgetThis Report provides an overview of Email IDs receiving mails encrypted with SPX along with number of such mailsreceived per user.
Note: This widget is not displayed for the filter criterion Recipient.
The Report is displayed as a pie chart as well as in a tabular format.
The bar graph displays the number of mails encrypted with Secure PDF Exchange (SPX) received per Email ID whilethe tabular report contains the following information:
• Recipient: Email ID of the user receiving mails encrypted with Secure PDF Exchange (SPX).• Mail Count: Number of SPX encrypted mail received per user.
Compliance
Regulatory compliance has become a priority for organizations, requiring overwhelming effort, time and cost inthe form of retrieval and storage of logs and reports from multiple devices. Correlating the vast amount of logs andreports to complete the compliance picture is a complicated and time-consuming task.
The Device Reports enable organizations to meet the requirements of following compliance:
• HIPAA• GLBA• SOX• FISMA• PCI• NERC CIP v3• CIPA• Events
| Compliance | 314
Compliance Reports
Compliance section allows you to view following reports:
• HIPAA on page 314
• GLBA on page 329• SOX on page 344• FISMA on page 359• PCI on page 371• NERC CIP v3 on page 383• CIPA on page 398• Events on page 405
HIPAAHIPAA report is the grouping of various network security reports, which ensures compliance with Health InsurancePortability and Accountability Act (HIPAA).
The HIPAA security standards are mandatory to follow when an organization stores and transmits health informationof the patients in electronic form.
View HIPAA reports from Compliance > HIPAA.
It enables to view the following reports:
• Spam Recipients• Spam Senders• Web Virus• Virus Summary• Mail Virus• Mail Virus by Application Type• Web Server Virus• FTP Virus• Intrusion Attacks• Intrusion Source• Web Server Users• Blocked Web Server Requests on page 60• Admin Events• Authentication Events• Hosts - ATP• Detailed View - Client Health• Detailed View - ATP• Security Heartbeat - ATP
Spam RecipientsThis Report displays a list of Spam Recipients along with number of emails and percent distribution among the spamrecipients.
View the report from Dashboards > Security Dashboard > Spam Recipients.
The report is displayed using a pie chart as well as in a tabular format. By default, the report is displayed for thecurrent date. The report date can be changed from the Date Selection Panel.
The Pie chart displays a percentage-wise distribution of spam per recipient while the tabular report contains thefollowing information:
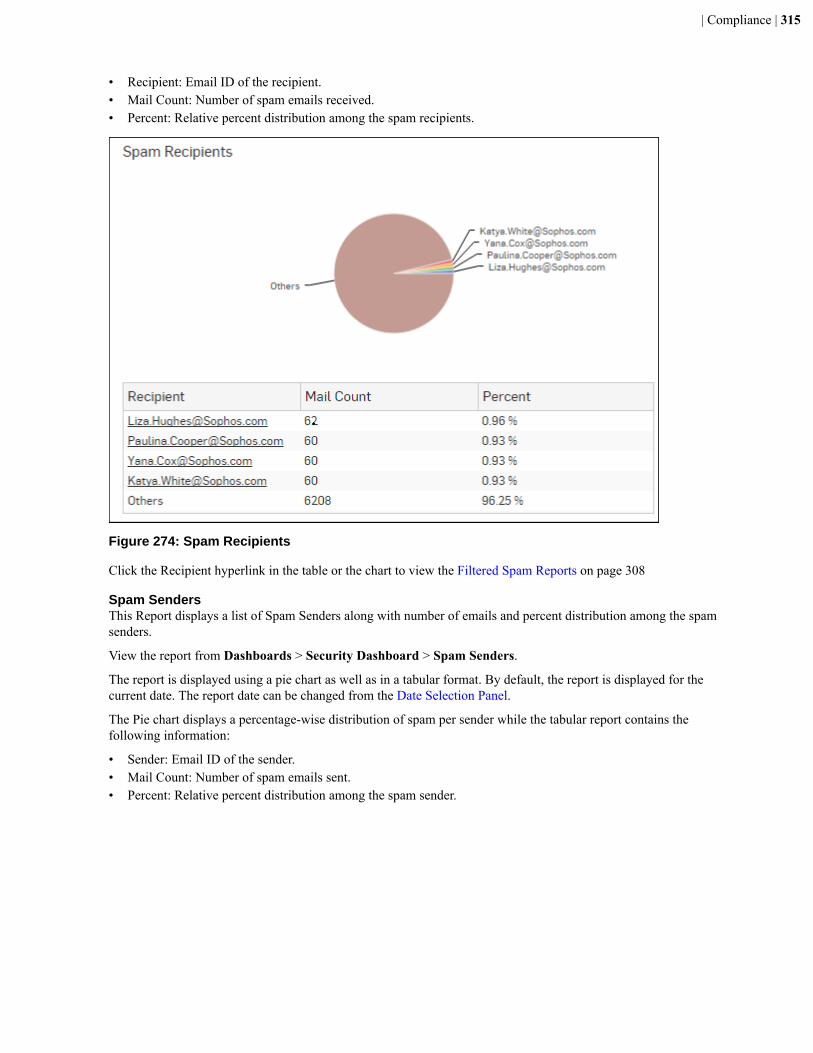
| Compliance | 315
• Recipient: Email ID of the recipient.• Mail Count: Number of spam emails received.• Percent: Relative percent distribution among the spam recipients.
Figure 274: Spam Recipients
Click the Recipient hyperlink in the table or the chart to view the Filtered Spam Reports on page 308
Spam SendersThis Report displays a list of Spam Senders along with number of emails and percent distribution among the spamsenders.
View the report from Dashboards > Security Dashboard > Spam Senders.
The report is displayed using a pie chart as well as in a tabular format. By default, the report is displayed for thecurrent date. The report date can be changed from the Date Selection Panel.
The Pie chart displays a percentage-wise distribution of spam per sender while the tabular report contains thefollowing information:
• Sender: Email ID of the sender.• Mail Count: Number of spam emails sent.• Percent: Relative percent distribution among the spam sender.
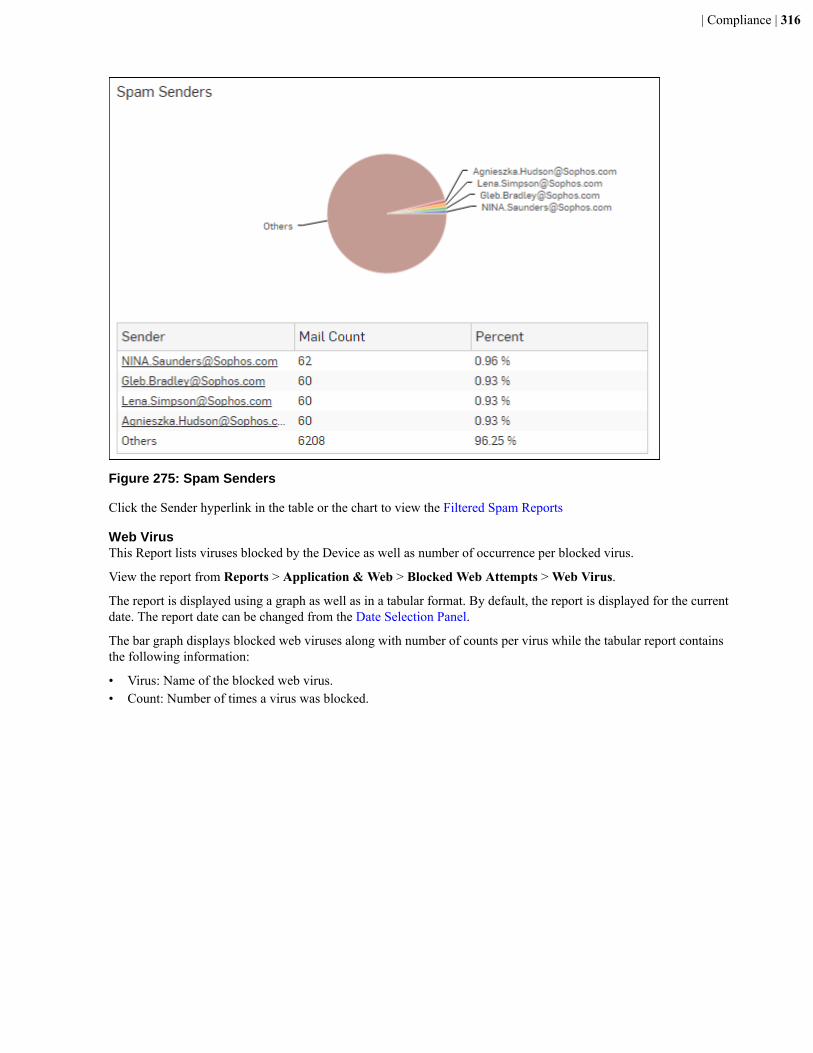
| Compliance | 316
Figure 275: Spam Senders
Click the Sender hyperlink in the table or the chart to view the Filtered Spam Reports
Web VirusThis Report lists viruses blocked by the Device as well as number of occurrence per blocked virus.
View the report from Reports > Application & Web > Blocked Web Attempts > Web Virus.
The report is displayed using a graph as well as in a tabular format. By default, the report is displayed for the currentdate. The report date can be changed from the Date Selection Panel.
The bar graph displays blocked web viruses along with number of counts per virus while the tabular report containsthe following information:
• Virus: Name of the blocked web virus.• Count: Number of times a virus was blocked.

| Compliance | 317
Figure 276: Web Virus
Click the Virus hyperlink in table or graph to view Filtered Blocked Web Attempts Reports - Virus on page 158.
Virus SummaryThis Report provides an overview of Virus traffic in your network, in terms of protocols through which viruses wereintroduced in the network as well as number of counts per protocol.
View the report from Dashboards > Security Dashboard > Virus Summary.
The report is displayed using a pie chart as well as in a tabular format. By default, the report is displayed for thecurrent date. The report date can be changed from the Date Selection Panel.
The pie chart displays number of hits per protocol through which viruses were introduced in the network, while thetabular report contains following information:
• Application/Proto:Port: Name of the protocol through which viruses were introduced in the network.• Count: Number of counts per protocol.

| Compliance | 318
Figure 277: Virus Summary
Click the Application hyperlink in table or graph to view Filtered Blocked Web Attempts Reports - Virus on page158.
Mail VirusThis Report displays Viruses detected in your network along with number of hits per Virus.
View the reportfrom Reports > Email > Email Protection > Mail Virus.
The report is displayed using a graph as well as in a tabular format. By default, the report is displayed for the currentdate. The report date can be changed from the Date Selection Panel.
The bar graph displays the number of counts per mail virus while the tabular report contains the followinginformation:
• Virus: Name of the virus.• Count: Number of counts per mail virus.
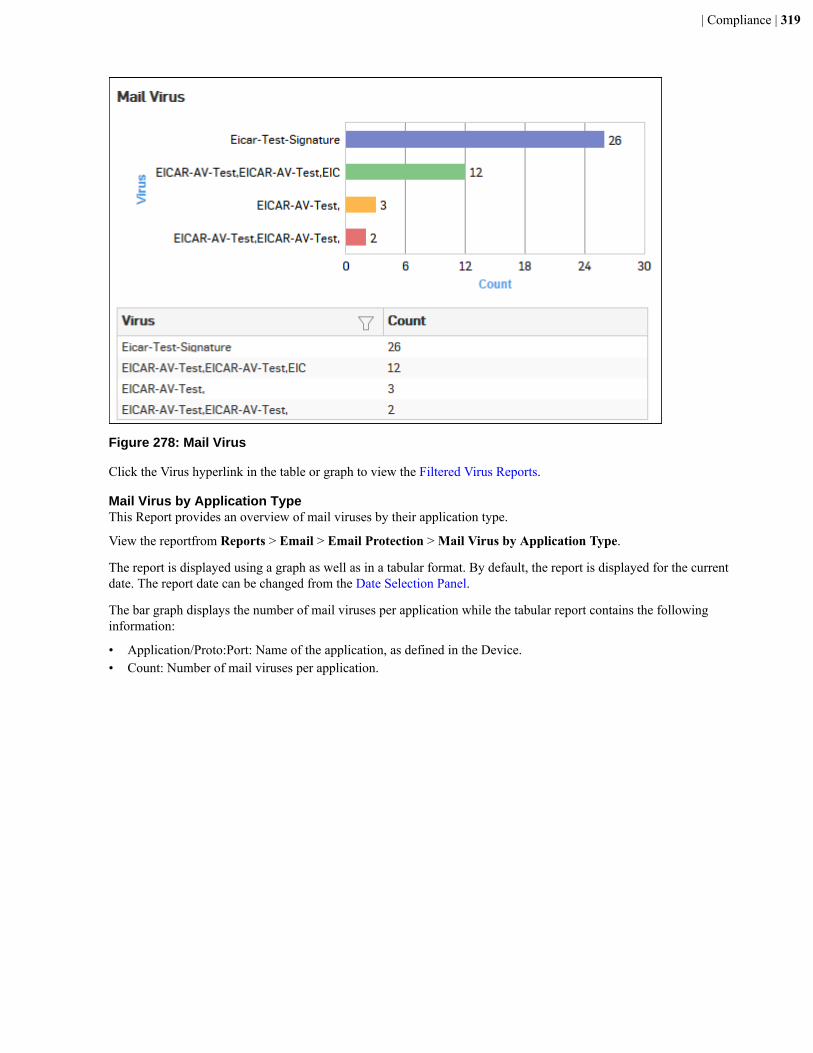
| Compliance | 319
Figure 278: Mail Virus
Click the Virus hyperlink in the table or graph to view the Filtered Virus Reports.
Mail Virus by Application TypeThis Report provides an overview of mail viruses by their application type.
View the reportfrom Reports > Email > Email Protection > Mail Virus by Application Type.
The report is displayed using a graph as well as in a tabular format. By default, the report is displayed for the currentdate. The report date can be changed from the Date Selection Panel.
The bar graph displays the number of mail viruses per application while the tabular report contains the followinginformation:
• Application/Proto:Port: Name of the application, as defined in the Device.• Count: Number of mail viruses per application.

| Compliance | 320
Figure 279: Mail Virus by Application Type
Click the Application hyperlink in the table or graph to view the Filtered Virus Reports.
Web Server VirusThis report displays a list of blocked viruses along with number of hits per virus.
View the report from Reports > Application & Web > Web Server Protection > Web Server Virus.
The report is displayed using a graph as well as in a tabular format. By default, the report is displayed for the currentdate. The report date can be changed from the Date Selection Panel.
The bar graph displays the list of viruses and number of hits while the tabular report contains the followinginformation:
• Virus: Name of the Virus blocked by the Device.• Hits: Number of hits per blocked virus.
Figure 280: Web Server Virus
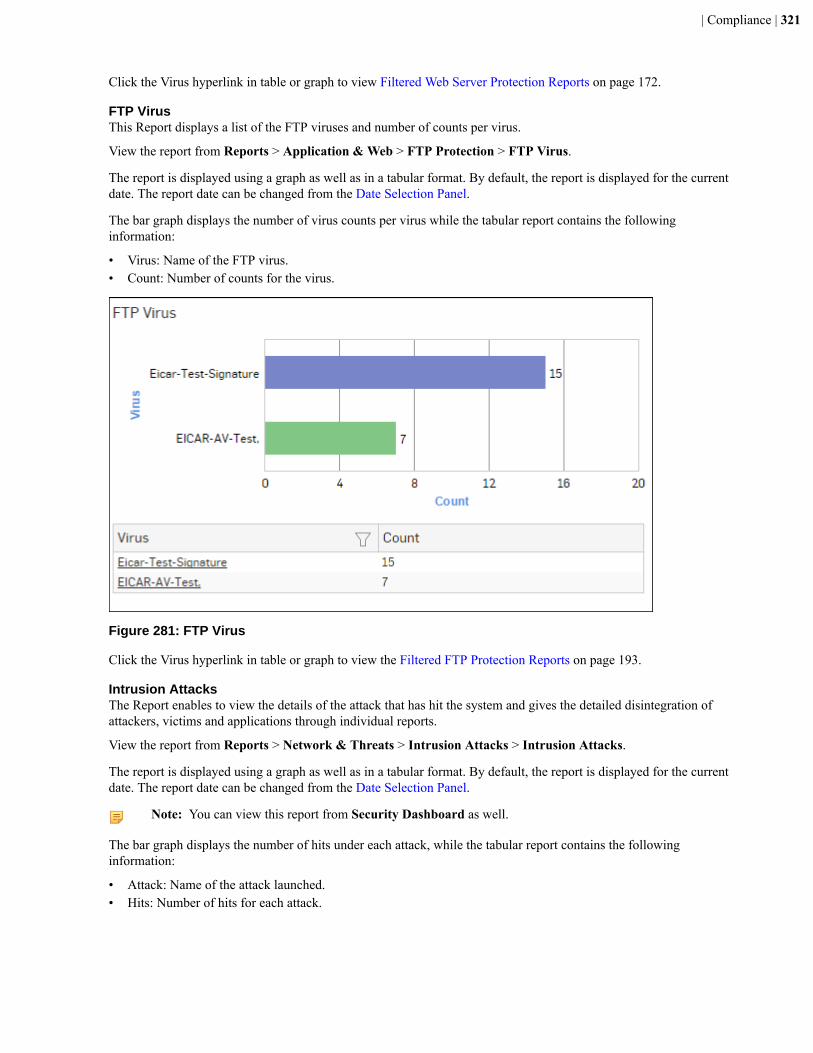
| Compliance | 321
Click the Virus hyperlink in table or graph to view Filtered Web Server Protection Reports on page 172.
FTP VirusThis Report displays a list of the FTP viruses and number of counts per virus.
View the report from Reports > Application & Web > FTP Protection > FTP Virus.
The report is displayed using a graph as well as in a tabular format. By default, the report is displayed for the currentdate. The report date can be changed from the Date Selection Panel.
The bar graph displays the number of virus counts per virus while the tabular report contains the followinginformation:
• Virus: Name of the FTP virus.• Count: Number of counts for the virus.
Figure 281: FTP Virus
Click the Virus hyperlink in table or graph to view the Filtered FTP Protection Reports on page 193.
Intrusion AttacksThe Report enables to view the details of the attack that has hit the system and gives the detailed disintegration ofattackers, victims and applications through individual reports.
View the report from Reports > Network & Threats > Intrusion Attacks > Intrusion Attacks.
The report is displayed using a graph as well as in a tabular format. By default, the report is displayed for the currentdate. The report date can be changed from the Date Selection Panel.
Note: You can view this report from Security Dashboard as well.
The bar graph displays the number of hits under each attack, while the tabular report contains the followinginformation:
• Attack: Name of the attack launched.• Hits: Number of hits for each attack.

| Compliance | 322
Figure 282: Intrusion Attacks
Click the Attack hyperlink in table or graph to view the Filtered Intrusion Attacks Reports on page 219.
Intrusion SourcesThe Report enables to view the details of the attacker(s) who have hit the system and gives the detailed disintegrationof attacks, victims and applications through individual reports.
View the report from Dashboards > Security Dashboard > Intrusion Sources or from Reports > Network &Threats > Intrusion Attacks > Intrusion Sources.
The report is displayed using a graph as well as in a tabular format. By default, the report is displayed for the currentdate. The report date can be changed from the Date Selection Panel.
The bar graph displays the number of hits by each attacker, while the tabular report contains the followinginformation:
• Attacker: IP Address of the attacker.• Hits: Number of hits for each attacker.

| Compliance | 323
Figure 283: Intrusion Sources
Click the Attacker hyperlink in table or graph to view the Filtered Intrusion Attacks Reports on page 219.
Web Server UsersThis Report displays web server usage in terms of bandwidth utilization by users.
View the report from Reports > Application & Web > Web Server Usage > Web Server Users.
The report is displayed using a graph as well as in a tabular format. By default, the report is displayed for the currentdate. The report date can be changed from the Date Selection Panel.
The bar graph displays a list of domains along with the number of hits while the tabular report contains the followinginformation:
• User: Username of the user, as defined in the Device.• Bytes: Bandwidth used per user.• Hits: Number of hits per user.

| Compliance | 324
Figure 284: Web Server Users
Click the User hyperlink in table or graph to view the Filtered Web Server Usage Reports on page 166.
Blocked Web Server RequestsThis Report displays a list of reasons why requests were blocked by Sophos iView, along with the number of hits perrequest.
View the reportfrom Dashboards > Security Dashboard > Blocked Web Server Requestsor from Reports >Application & Web > Web Server Protection > Blocked Web Server Requests.
The report is displayed using a graph as well as in a tabular format. By default, the report is displayed for the currentdate. The report date can be changed from the Date Selection Panel.
The bar graph displays the list of blocked attacks along with the number of hits per attack, while the tabular reportcontains the following information:
• Blocked Reason: Reason for which an attack is blocked.• Hits: Number of hits per attack.

| Compliance | 325
Figure 285: Blocked Web Server Requests
Click the Blocked Reason hyperlink in table or graph to view Filtered Web Server Protection Reports on page 172.
Admin EventsThis Report displays the Admin Event details including time, event type, severity, message, username, source andstatus.
View the report from Compliance > Events > Admin Events.
The tabular report contains the following information:
• Time: Date and time of the event.• Event Type: Type of the event. Possible event types are :
• GUI• CLI• Console• SFM
• Severity: Severity level of the events. Predefined level are:
• EMERGENCY - System is not usable• ALERT - Action must be taken immediately• CRITICAL - Critical condition• ERROR - Error condition• WARNING - Warning condition• NOTICE - Normal but significant condition• INFORMATION - Informational• DEBUG - Debug - level messages
• Message: Message associated with event. Complete message can be viewed by placing cursor on the message.• User Name: Name of the user associated with the event.• Source: IP Address of the event generator.• Status: Status of the event. Possible status are:
• Failed• Successful

| Compliance | 326
Figure 286: Admin Events
Authentication EventsThis Report displays the Authentication Events detail including time, event type, severity, message, username, sourceand status.
View the report from Compliance > Events > Authentication Events.
Tabular report contains following information:
• Time: Date and time of the event.• Event Type: Type of the event. Possible event types are :
• Firewall Authentication• My Account Authentication• VPN Authentication• SSL VPN Authentication• Dial-in Authentication
• Severity: Severity level of the events. Predefined level are:
• EMERGENCY - System is not usable• ALERT - Action must be taken immediately• CRITICAL - Critical condition• ERROR - Error condition• WARNING - Warning condition• NOTICE - Normal but significant condition• INFORMATION - Informational• DEBUG - Debug - level messages
• Message: Message associated with event. Complete message can be viewed by placing cursor on the message.• User Name: Name of the user associated with the event.• Source: IP Address of the event generator.• Status: Status of the event. Possible status are:
• Failed• Successful
Figure 287: Authentication Events
Hosts - ATPThis report displays a comprehensive summary of host wise advanced threats in your network.
View the report from Dashboards > Security Dashboard > Hosts - ATP or from Reports > Network & Threats >Advanced Threats > Hosts - ATP.
The report is displayed using a graph as well as in a tabular format. By default, the report is displayed for the currentdate. The report date can be changed from the Date Selection Panel.

| Compliance | 327
The bar graph displays the list of hosts along with number of events per host while the tabular report contains thefollowing information:
• Host (Source IP): IP Address of the source host.• Threat Count: Number of threats per source host.• Events: Total number of events per host. The number is summation of Log only and Log & Drop events.
Figure 288: Hosts-ATP
Click the Host hyperlink in table or graph to view the Filtered ATP Reports.
Detailed View - Client HealthThis report shows in-depth information regarding health status of endpoints in your network.
View the report from Dashboards > Security Dashboard > Detailed View - Client Health or from Reports >Network & Threats > Security Heartbeat > Detailed View - Client Health.
The report is displayed using a graph as well as in a tabular format. By default, the report is displayed for the currentdate. The report date can be changed from the Date Selection Panel.
The tabular report contains the following information:
• Host (Source IP): IP Address of the endpoint.• Host Name: Name of the client.• Health - Last Seen: Displays the latest health status. Possible options are:
• Green: The client is healthy, i.e. not infected with any malicious files.• Yellow: The client is potentially Objectionable, i.e. it may be infected with some malicious content.• Red: The client is Objectionable and is infected with some malicious content.
• Last Health Changed: Displays the date in YYYY-MM-DD HH:MM:SS format when the health of the host waslast changed.

| Compliance | 328
Figure 289: Detailed View - Client Health
Click the Host status in the table or the graph to view the Filtered Security Heartbeat Reports.
Detailed View - ATPThis report provides a detailed summary of advanced threats in your network.
View the report from Reports > Network & Threats > Advanced Threats > Detailed View - ATP.
The report is displayed using a graph as well as in a tabular format. By default, the report is displayed for the currentdate. The report date can be changed from the Date Selection Panel.
The tabular report contains the following information:
• Host (Source IP): IP Address of the source host.• User: Username of the infected user.• Threat: Name of the threat.• Destination: IP Address of the infected destination.• Origin: Origin of the threat. Possible options:
• Firewall• IPS• DNS• Web• Combination of any of the above
• Events: Total number of events. The number is summation of Log only and Log & Drop events.• Action: Action performed by the Device when a threat is detected. Possible options:
• Log & Drop: The data packet is logged and dropped.• Log only: The data packet is logged.
Figure 290: Detailed View -ATP
Security Heartbeat - ATPThis report provides an insight into advanced threats related to endpoints in your network.
View the report from Reports > Network & Threats > Advanced Threats > Security Heartbeat - ATP or fromCompliance > HIPPA > Security Heartbeat - ATP.
The report is displayed using a graph as well as in a tabular format. By default, the report is displayed for the currentdate. The report date can be changed from the Date Selection Panel.
The report is displayed in a tabular format. The tabular report contains the following information:
• Host (Source IP): IP Address of the source host.• Login User: Username of the infected user.• Process User: Username of the user owning the process.• Threat: Name of the threat.

| Compliance | 329
• Threat URL/IP: IP address of the threat.• Executable: Name of the infected executable file.• Event Last Seen: Time when the infected executed file was last found in the host.• Events: Total number of events. The number is summation of Log only and Log & Drop events.
Figure 291: Security Heartbeat-ATP
GLBAGLBA report is the grouping of various network security reports which ensures compliance with Gramm-LeachBliley Act (GLBA).
The GLBA security standards are mandatory to follow when an organization stores and transmits financialinformation of the users in electronic form.
View GLBA reports from Compliance > GLBA.
It enables to view the following reports:
• Spam Recipients• Spam Senders• Web Virus• Virus Summary• Mail Virus• Mail Virus by Application Type• Web Server Virus• FTP Virus• Intrusion Attacks• Intrusion Source• Web Server Users• Blocked Web Server Requests on page 60• Admin Events• Authentication Events• Hosts - ATP• Detailed View - Client Health• Detailed View - ATP• Security Heartbeat - ATP
Spam RecipientsThis Report displays a list of Spam Recipients along with number of emails and percent distribution among the spamrecipients.
View the report from Dashboards > Security Dashboard > Spam Recipients.
The report is displayed using a pie chart as well as in a tabular format. By default, the report is displayed for thecurrent date. The report date can be changed from the Date Selection Panel.
The Pie chart displays a percentage-wise distribution of spam per recipient while the tabular report contains thefollowing information:
• Recipient: Email ID of the recipient.• Mail Count: Number of spam emails received.

| Compliance | 330
• Percent: Relative percent distribution among the spam recipients.
Figure 292: Spam Recipients
Click the Recipient hyperlink in the table or the chart to view the Filtered Spam Reports on page 308
Spam SendersThis Report displays a list of Spam Senders along with number of emails and percent distribution among the spamsenders.
View the report from Dashboards > Security Dashboard > Spam Senders.
The report is displayed using a pie chart as well as in a tabular format. By default, the report is displayed for thecurrent date. The report date can be changed from the Date Selection Panel.
The Pie chart displays a percentage-wise distribution of spam per sender while the tabular report contains thefollowing information:
• Sender: Email ID of the sender.• Mail Count: Number of spam emails sent.• Percent: Relative percent distribution among the spam sender.

| Compliance | 331
Figure 293: Spam Senders
Click the Sender hyperlink in the table or the chart to view the Filtered Spam Reports
Web VirusThis Report lists viruses blocked by the Device as well as number of occurrence per blocked virus.
View the report from Reports > Application & Web > Blocked Web Attempts > Web Virus.
The report is displayed using a graph as well as in a tabular format. By default, the report is displayed for the currentdate. The report date can be changed from the Date Selection Panel.
The bar graph displays blocked web viruses along with number of counts per virus while the tabular report containsthe following information:
• Virus: Name of the blocked web virus.• Count: Number of times a virus was blocked.

| Compliance | 332
Figure 294: Web Virus
Click the Virus hyperlink in table or graph to view Filtered Blocked Web Attempts Reports - Virus on page 158.
Virus SummaryThis Report provides an overview of Virus traffic in your network, in terms of protocols through which viruses wereintroduced in the network as well as number of counts per protocol.
View the report from Dashboards > Security Dashboard > Virus Summary.
The report is displayed using a pie chart as well as in a tabular format. By default, the report is displayed for thecurrent date. The report date can be changed from the Date Selection Panel.
The pie chart displays number of hits per protocol through which viruses were introduced in the network, while thetabular report contains following information:
• Application/Proto:Port: Name of the protocol through which viruses were introduced in the network.• Count: Number of counts per protocol.

| Compliance | 333
Figure 295: Virus Summary
Click the Application hyperlink in table or graph to view Filtered Blocked Web Attempts Reports - Virus on page158.
Mail VirusThis Report displays Viruses detected in your network along with number of hits per Virus.
View the reportfrom Reports > Email > Email Protection > Mail Virus.
The report is displayed using a graph as well as in a tabular format. By default, the report is displayed for the currentdate. The report date can be changed from the Date Selection Panel.
The bar graph displays the number of counts per mail virus while the tabular report contains the followinginformation:
• Virus: Name of the virus.• Count: Number of counts per mail virus.

| Compliance | 334
Figure 296: Mail Virus
Click the Virus hyperlink in the table or graph to view the Filtered Virus Reports.
Mail Virus by Application TypeThis Report provides an overview of mail viruses by their application type.
View the reportfrom Reports > Email > Email Protection > Mail Virus by Application Type.
The report is displayed using a graph as well as in a tabular format. By default, the report is displayed for the currentdate. The report date can be changed from the Date Selection Panel.
The bar graph displays the number of mail viruses per application while the tabular report contains the followinginformation:
• Application/Proto:Port: Name of the application, as defined in the Device.• Count: Number of mail viruses per application.
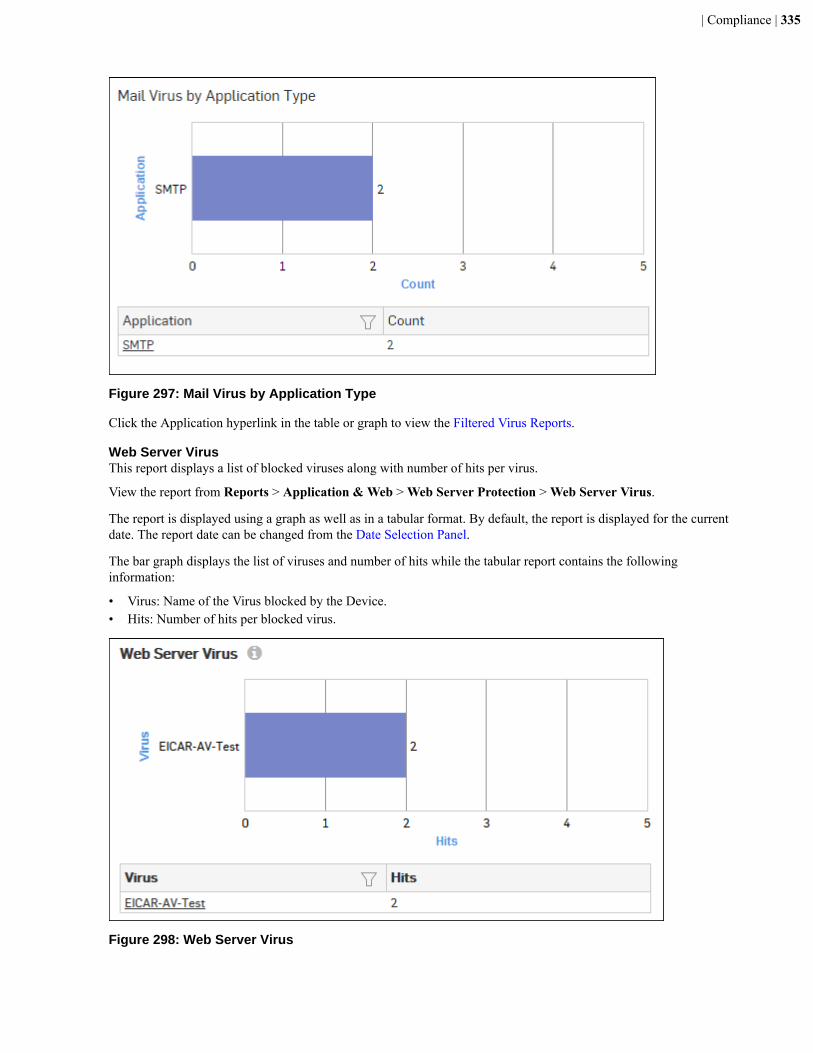
| Compliance | 335
Figure 297: Mail Virus by Application Type
Click the Application hyperlink in the table or graph to view the Filtered Virus Reports.
Web Server VirusThis report displays a list of blocked viruses along with number of hits per virus.
View the report from Reports > Application & Web > Web Server Protection > Web Server Virus.
The report is displayed using a graph as well as in a tabular format. By default, the report is displayed for the currentdate. The report date can be changed from the Date Selection Panel.
The bar graph displays the list of viruses and number of hits while the tabular report contains the followinginformation:
• Virus: Name of the Virus blocked by the Device.• Hits: Number of hits per blocked virus.
Figure 298: Web Server Virus

| Compliance | 336
Click the Virus hyperlink in table or graph to view Filtered Web Server Protection Reports on page 172.
FTP VirusThis Report displays a list of the FTP viruses and number of counts per virus.
View the report from Reports > Application & Web > FTP Protection > FTP Virus.
The report is displayed using a graph as well as in a tabular format. By default, the report is displayed for the currentdate. The report date can be changed from the Date Selection Panel.
The bar graph displays the number of virus counts per virus while the tabular report contains the followinginformation:
• Virus: Name of the FTP virus.• Count: Number of counts for the virus.
Figure 299: FTP Virus
Click the Virus hyperlink in table or graph to view the Filtered FTP Protection Reports on page 193.
Intrusion AttacksThe Report enables to view the details of the attack that has hit the system and gives the detailed disintegration ofattackers, victims and applications through individual reports.
View the report from Reports > Network & Threats > Intrusion Attacks > Intrusion Attacks.
The report is displayed using a graph as well as in a tabular format. By default, the report is displayed for the currentdate. The report date can be changed from the Date Selection Panel.
Note: You can view this report from Security Dashboard as well.
The bar graph displays the number of hits under each attack, while the tabular report contains the followinginformation:
• Attack: Name of the attack launched.• Hits: Number of hits for each attack.
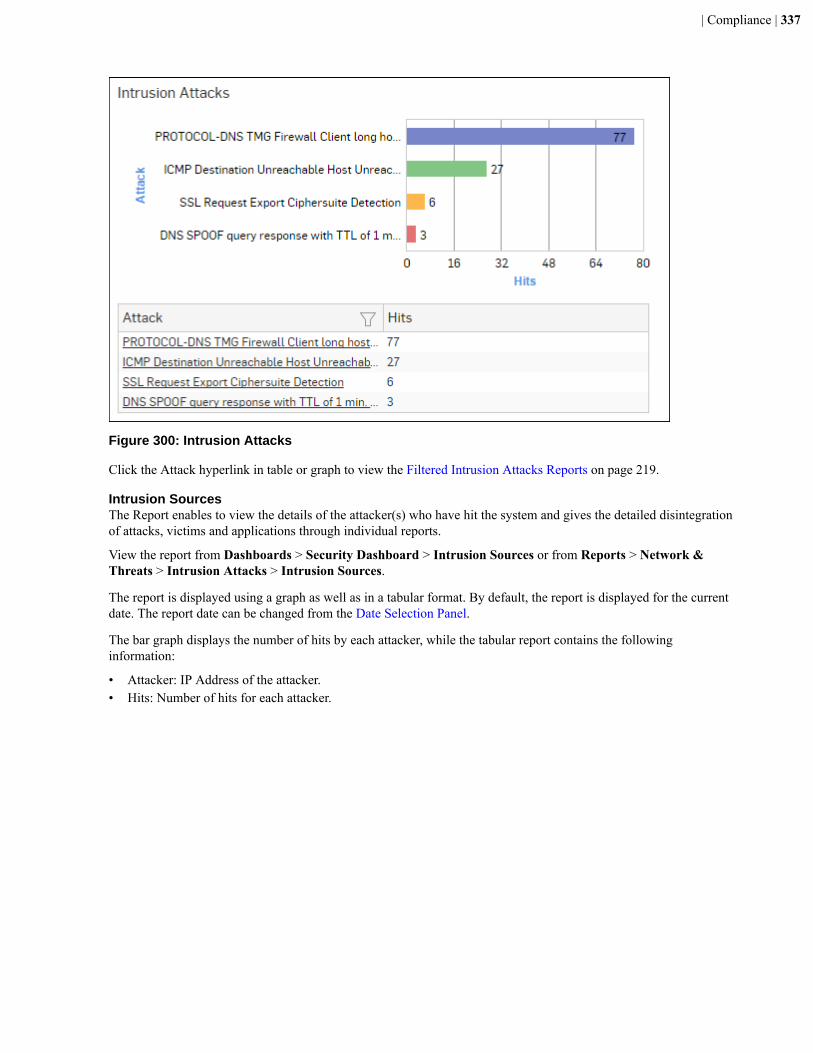
| Compliance | 337
Figure 300: Intrusion Attacks
Click the Attack hyperlink in table or graph to view the Filtered Intrusion Attacks Reports on page 219.
Intrusion SourcesThe Report enables to view the details of the attacker(s) who have hit the system and gives the detailed disintegrationof attacks, victims and applications through individual reports.
View the report from Dashboards > Security Dashboard > Intrusion Sources or from Reports > Network &Threats > Intrusion Attacks > Intrusion Sources.
The report is displayed using a graph as well as in a tabular format. By default, the report is displayed for the currentdate. The report date can be changed from the Date Selection Panel.
The bar graph displays the number of hits by each attacker, while the tabular report contains the followinginformation:
• Attacker: IP Address of the attacker.• Hits: Number of hits for each attacker.

| Compliance | 338
Figure 301: Intrusion Sources
Click the Attacker hyperlink in table or graph to view the Filtered Intrusion Attacks Reports on page 219.
Web Server UsersThis Report displays web server usage in terms of bandwidth utilization by users.
View the report from Reports > Application & Web > Web Server Usage > Web Server Users.
The report is displayed using a graph as well as in a tabular format. By default, the report is displayed for the currentdate. The report date can be changed from the Date Selection Panel.
The bar graph displays a list of domains along with the number of hits while the tabular report contains the followinginformation:
• User: Username of the user, as defined in the Device.• Bytes: Bandwidth used per user.• Hits: Number of hits per user.

| Compliance | 339
Figure 302: Web Server Users
Click the User hyperlink in table or graph to view the Filtered Web Server Usage Reports on page 166.
Blocked Web Server RequestsThis Report displays a list of reasons why requests were blocked by Sophos iView, along with the number of hits perrequest.
View the reportfrom Dashboards > Security Dashboard > Blocked Web Server Requestsor from Reports >Application & Web > Web Server Protection > Blocked Web Server Requests.
The report is displayed using a graph as well as in a tabular format. By default, the report is displayed for the currentdate. The report date can be changed from the Date Selection Panel.
The bar graph displays the list of blocked attacks along with the number of hits per attack, while the tabular reportcontains the following information:
• Blocked Reason: Reason for which an attack is blocked.• Hits: Number of hits per attack.
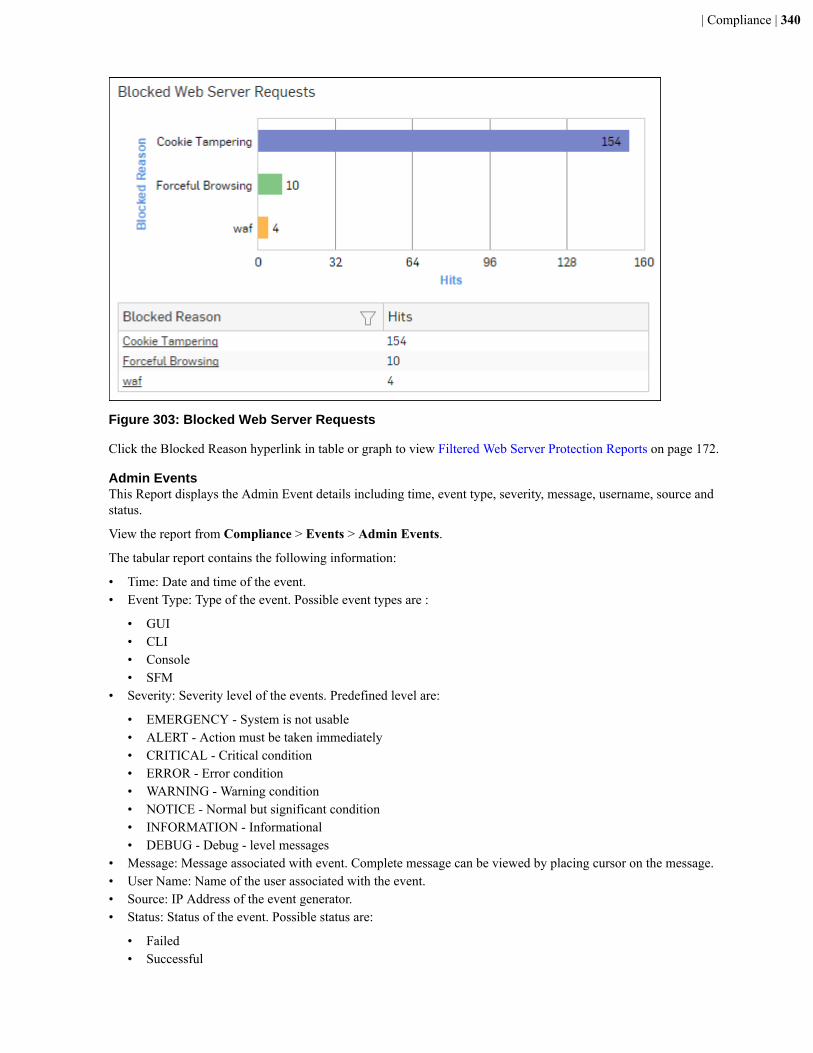
| Compliance | 340
Figure 303: Blocked Web Server Requests
Click the Blocked Reason hyperlink in table or graph to view Filtered Web Server Protection Reports on page 172.
Admin EventsThis Report displays the Admin Event details including time, event type, severity, message, username, source andstatus.
View the report from Compliance > Events > Admin Events.
The tabular report contains the following information:
• Time: Date and time of the event.• Event Type: Type of the event. Possible event types are :
• GUI• CLI• Console• SFM
• Severity: Severity level of the events. Predefined level are:
• EMERGENCY - System is not usable• ALERT - Action must be taken immediately• CRITICAL - Critical condition• ERROR - Error condition• WARNING - Warning condition• NOTICE - Normal but significant condition• INFORMATION - Informational• DEBUG - Debug - level messages
• Message: Message associated with event. Complete message can be viewed by placing cursor on the message.• User Name: Name of the user associated with the event.• Source: IP Address of the event generator.• Status: Status of the event. Possible status are:
• Failed• Successful

| Compliance | 341
Figure 304: Admin Events
Authentication EventsThis Report displays the Authentication Events detail including time, event type, severity, message, username, sourceand status.
View the report from Compliance > Events > Authentication Events.
Tabular report contains following information:
• Time: Date and time of the event.• Event Type: Type of the event. Possible event types are :
• Firewall Authentication• My Account Authentication• VPN Authentication• SSL VPN Authentication• Dial-in Authentication
• Severity: Severity level of the events. Predefined level are:
• EMERGENCY - System is not usable• ALERT - Action must be taken immediately• CRITICAL - Critical condition• ERROR - Error condition• WARNING - Warning condition• NOTICE - Normal but significant condition• INFORMATION - Informational• DEBUG - Debug - level messages
• Message: Message associated with event. Complete message can be viewed by placing cursor on the message.• User Name: Name of the user associated with the event.• Source: IP Address of the event generator.• Status: Status of the event. Possible status are:
• Failed• Successful
Figure 305: Authentication Events
Hosts - ATPThis report displays a comprehensive summary of host wise advanced threats in your network.
View the report from Dashboards > Security Dashboard > Hosts - ATP or from Reports > Network & Threats >Advanced Threats > Hosts - ATP.
The report is displayed using a graph as well as in a tabular format. By default, the report is displayed for the currentdate. The report date can be changed from the Date Selection Panel.

| Compliance | 342
The bar graph displays the list of hosts along with number of events per host while the tabular report contains thefollowing information:
• Host (Source IP): IP Address of the source host.• Threat Count: Number of threats per source host.• Events: Total number of events per host. The number is summation of Log only and Log & Drop events.
Figure 306: Hosts-ATP
Click the Host hyperlink in table or graph to view the Filtered ATP Reports.
Detailed View - Client HealthThis report shows in-depth information regarding health status of endpoints in your network.
View the report from Dashboards > Security Dashboard > Detailed View - Client Health or from Reports >Network & Threats > Security Heartbeat > Detailed View - Client Health.
The report is displayed using a graph as well as in a tabular format. By default, the report is displayed for the currentdate. The report date can be changed from the Date Selection Panel.
The tabular report contains the following information:
• Host (Source IP): IP Address of the endpoint.• Host Name: Name of the client.• Health - Last Seen: Displays the latest health status. Possible options are:
• Green: The client is healthy, i.e. not infected with any malicious files.• Yellow: The client is potentially Objectionable, i.e. it may be infected with some malicious content.• Red: The client is Objectionable and is infected with some malicious content.
• Last Health Changed: Displays the date in YYYY-MM-DD HH:MM:SS format when the health of the host waslast changed.
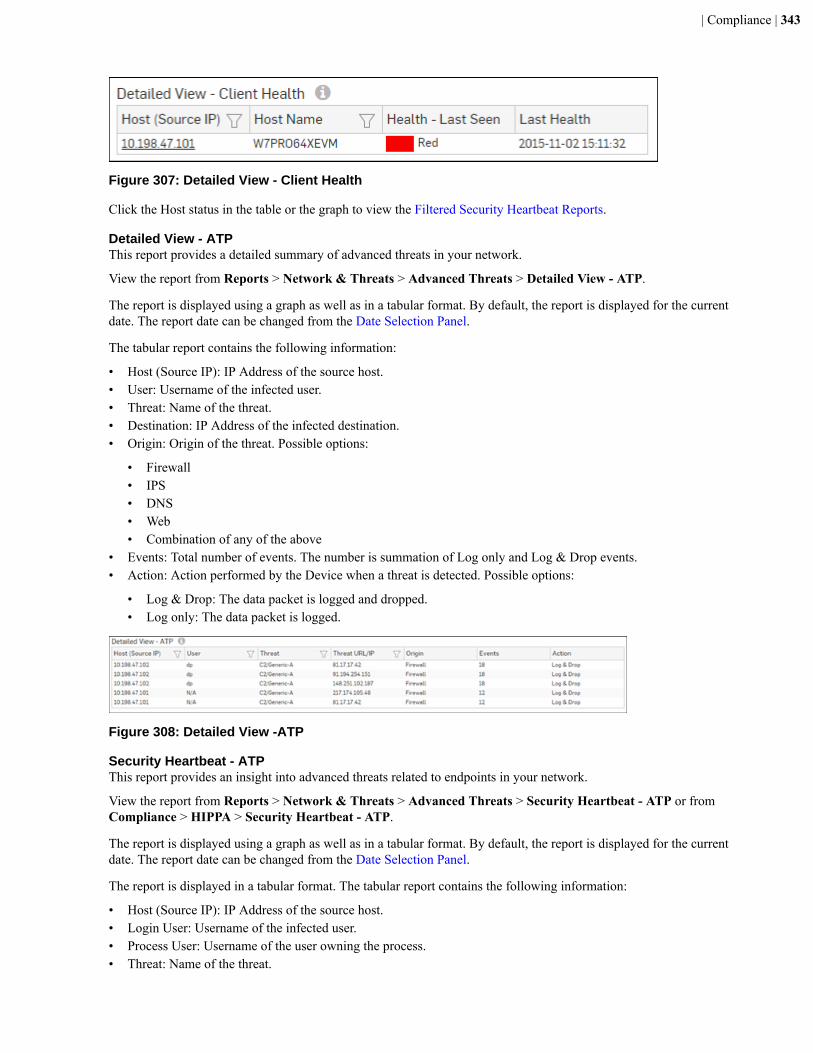
| Compliance | 343
Figure 307: Detailed View - Client Health
Click the Host status in the table or the graph to view the Filtered Security Heartbeat Reports.
Detailed View - ATPThis report provides a detailed summary of advanced threats in your network.
View the report from Reports > Network & Threats > Advanced Threats > Detailed View - ATP.
The report is displayed using a graph as well as in a tabular format. By default, the report is displayed for the currentdate. The report date can be changed from the Date Selection Panel.
The tabular report contains the following information:
• Host (Source IP): IP Address of the source host.• User: Username of the infected user.• Threat: Name of the threat.• Destination: IP Address of the infected destination.• Origin: Origin of the threat. Possible options:
• Firewall• IPS• DNS• Web• Combination of any of the above
• Events: Total number of events. The number is summation of Log only and Log & Drop events.• Action: Action performed by the Device when a threat is detected. Possible options:
• Log & Drop: The data packet is logged and dropped.• Log only: The data packet is logged.
Figure 308: Detailed View -ATP
Security Heartbeat - ATPThis report provides an insight into advanced threats related to endpoints in your network.
View the report from Reports > Network & Threats > Advanced Threats > Security Heartbeat - ATP or fromCompliance > HIPPA > Security Heartbeat - ATP.
The report is displayed using a graph as well as in a tabular format. By default, the report is displayed for the currentdate. The report date can be changed from the Date Selection Panel.
The report is displayed in a tabular format. The tabular report contains the following information:
• Host (Source IP): IP Address of the source host.• Login User: Username of the infected user.• Process User: Username of the user owning the process.• Threat: Name of the threat.
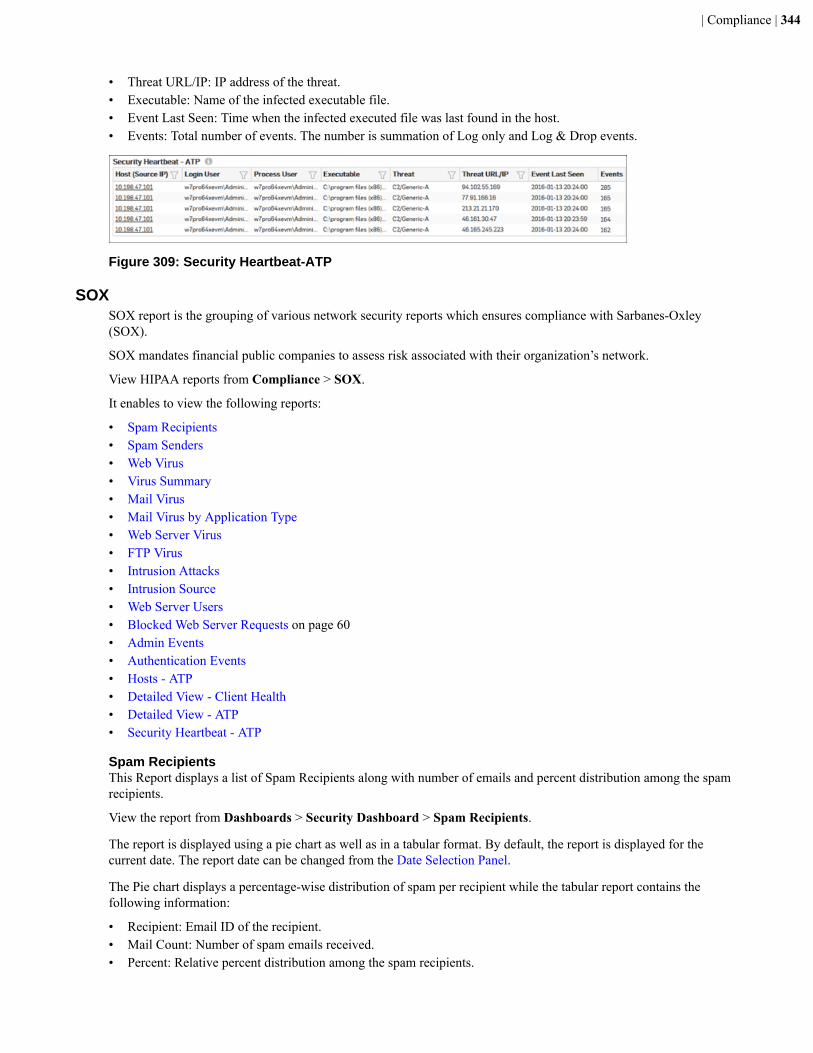
| Compliance | 344
• Threat URL/IP: IP address of the threat.• Executable: Name of the infected executable file.• Event Last Seen: Time when the infected executed file was last found in the host.• Events: Total number of events. The number is summation of Log only and Log & Drop events.
Figure 309: Security Heartbeat-ATP
SOXSOX report is the grouping of various network security reports which ensures compliance with Sarbanes-Oxley(SOX).
SOX mandates financial public companies to assess risk associated with their organization’s network.
View HIPAA reports from Compliance > SOX.
It enables to view the following reports:
• Spam Recipients• Spam Senders• Web Virus• Virus Summary• Mail Virus• Mail Virus by Application Type• Web Server Virus• FTP Virus• Intrusion Attacks• Intrusion Source• Web Server Users• Blocked Web Server Requests on page 60• Admin Events• Authentication Events• Hosts - ATP• Detailed View - Client Health• Detailed View - ATP• Security Heartbeat - ATP
Spam RecipientsThis Report displays a list of Spam Recipients along with number of emails and percent distribution among the spamrecipients.
View the report from Dashboards > Security Dashboard > Spam Recipients.
The report is displayed using a pie chart as well as in a tabular format. By default, the report is displayed for thecurrent date. The report date can be changed from the Date Selection Panel.
The Pie chart displays a percentage-wise distribution of spam per recipient while the tabular report contains thefollowing information:
• Recipient: Email ID of the recipient.• Mail Count: Number of spam emails received.• Percent: Relative percent distribution among the spam recipients.
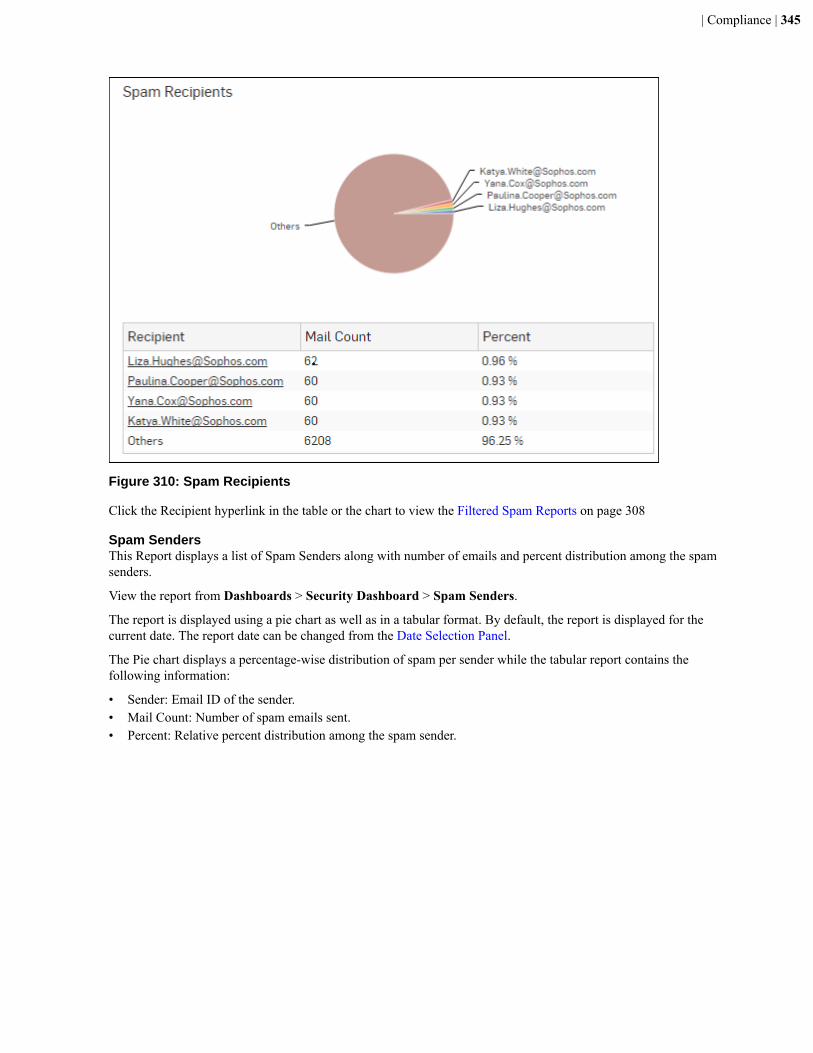
| Compliance | 345
Figure 310: Spam Recipients
Click the Recipient hyperlink in the table or the chart to view the Filtered Spam Reports on page 308
Spam SendersThis Report displays a list of Spam Senders along with number of emails and percent distribution among the spamsenders.
View the report from Dashboards > Security Dashboard > Spam Senders.
The report is displayed using a pie chart as well as in a tabular format. By default, the report is displayed for thecurrent date. The report date can be changed from the Date Selection Panel.
The Pie chart displays a percentage-wise distribution of spam per sender while the tabular report contains thefollowing information:
• Sender: Email ID of the sender.• Mail Count: Number of spam emails sent.• Percent: Relative percent distribution among the spam sender.

| Compliance | 346
Figure 311: Spam Senders
Click the Sender hyperlink in the table or the chart to view the Filtered Spam Reports
Web VirusThis Report lists viruses blocked by the Device as well as number of occurrence per blocked virus.
View the report from Reports > Application & Web > Blocked Web Attempts > Web Virus.
The report is displayed using a graph as well as in a tabular format. By default, the report is displayed for the currentdate. The report date can be changed from the Date Selection Panel.
The bar graph displays blocked web viruses along with number of counts per virus while the tabular report containsthe following information:
• Virus: Name of the blocked web virus.• Count: Number of times a virus was blocked.

| Compliance | 347
Figure 312: Web Virus
Click the Virus hyperlink in table or graph to view Filtered Blocked Web Attempts Reports - Virus on page 158.
Virus SummaryThis Report provides an overview of Virus traffic in your network, in terms of protocols through which viruses wereintroduced in the network as well as number of counts per protocol.
View the report from Dashboards > Security Dashboard > Virus Summary.
The report is displayed using a pie chart as well as in a tabular format. By default, the report is displayed for thecurrent date. The report date can be changed from the Date Selection Panel.
The pie chart displays number of hits per protocol through which viruses were introduced in the network, while thetabular report contains following information:
• Application/Proto:Port: Name of the protocol through which viruses were introduced in the network.• Count: Number of counts per protocol.
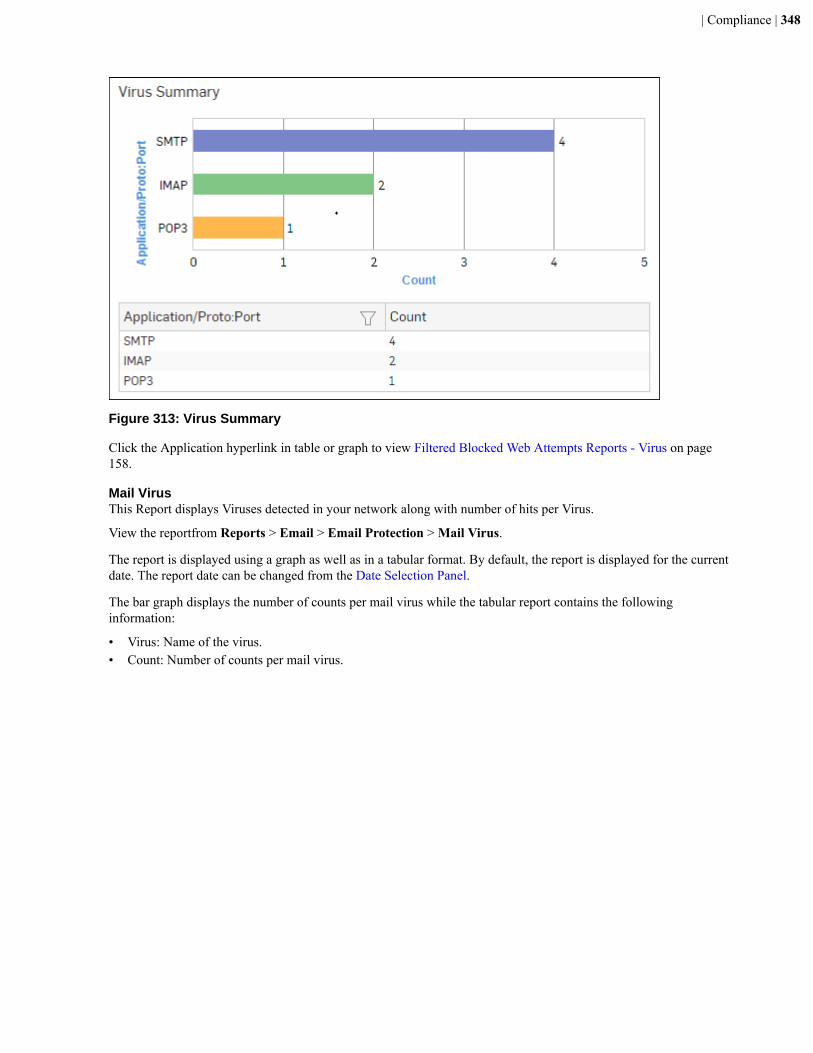
| Compliance | 348
Figure 313: Virus Summary
Click the Application hyperlink in table or graph to view Filtered Blocked Web Attempts Reports - Virus on page158.
Mail VirusThis Report displays Viruses detected in your network along with number of hits per Virus.
View the reportfrom Reports > Email > Email Protection > Mail Virus.
The report is displayed using a graph as well as in a tabular format. By default, the report is displayed for the currentdate. The report date can be changed from the Date Selection Panel.
The bar graph displays the number of counts per mail virus while the tabular report contains the followinginformation:
• Virus: Name of the virus.• Count: Number of counts per mail virus.

| Compliance | 349
Figure 314: Mail Virus
Click the Virus hyperlink in the table or graph to view the Filtered Virus Reports.
Mail Virus by Application TypeThis Report provides an overview of mail viruses by their application type.
View the reportfrom Reports > Email > Email Protection > Mail Virus by Application Type.
The report is displayed using a graph as well as in a tabular format. By default, the report is displayed for the currentdate. The report date can be changed from the Date Selection Panel.
The bar graph displays the number of mail viruses per application while the tabular report contains the followinginformation:
• Application/Proto:Port: Name of the application, as defined in the Device.• Count: Number of mail viruses per application.

| Compliance | 350
Figure 315: Mail Virus by Application Type
Click the Application hyperlink in the table or graph to view the Filtered Virus Reports.
Web Server VirusThis report displays a list of blocked viruses along with number of hits per virus.
View the report from Reports > Application & Web > Web Server Protection > Web Server Virus.
The report is displayed using a graph as well as in a tabular format. By default, the report is displayed for the currentdate. The report date can be changed from the Date Selection Panel.
The bar graph displays the list of viruses and number of hits while the tabular report contains the followinginformation:
• Virus: Name of the Virus blocked by the Device.• Hits: Number of hits per blocked virus.
Figure 316: Web Server Virus

| Compliance | 351
Click the Virus hyperlink in table or graph to view Filtered Web Server Protection Reports on page 172.
FTP VirusThis Report displays a list of the FTP viruses and number of counts per virus.
View the report from Reports > Application & Web > FTP Protection > FTP Virus.
The report is displayed using a graph as well as in a tabular format. By default, the report is displayed for the currentdate. The report date can be changed from the Date Selection Panel.
The bar graph displays the number of virus counts per virus while the tabular report contains the followinginformation:
• Virus: Name of the FTP virus.• Count: Number of counts for the virus.
Figure 317: FTP Virus
Click the Virus hyperlink in table or graph to view the Filtered FTP Protection Reports on page 193.
Intrusion AttacksThe Report enables to view the details of the attack that has hit the system and gives the detailed disintegration ofattackers, victims and applications through individual reports.
View the report from Reports > Network & Threats > Intrusion Attacks > Intrusion Attacks.
The report is displayed using a graph as well as in a tabular format. By default, the report is displayed for the currentdate. The report date can be changed from the Date Selection Panel.
Note: You can view this report from Security Dashboard as well.
The bar graph displays the number of hits under each attack, while the tabular report contains the followinginformation:
• Attack: Name of the attack launched.• Hits: Number of hits for each attack.

| Compliance | 352
Figure 318: Intrusion Attacks
Click the Attack hyperlink in table or graph to view the Filtered Intrusion Attacks Reports on page 219.
Intrusion SourcesThe Report enables to view the details of the attacker(s) who have hit the system and gives the detailed disintegrationof attacks, victims and applications through individual reports.
View the report from Dashboards > Security Dashboard > Intrusion Sources or from Reports > Network &Threats > Intrusion Attacks > Intrusion Sources.
The report is displayed using a graph as well as in a tabular format. By default, the report is displayed for the currentdate. The report date can be changed from the Date Selection Panel.
The bar graph displays the number of hits by each attacker, while the tabular report contains the followinginformation:
• Attacker: IP Address of the attacker.• Hits: Number of hits for each attacker.
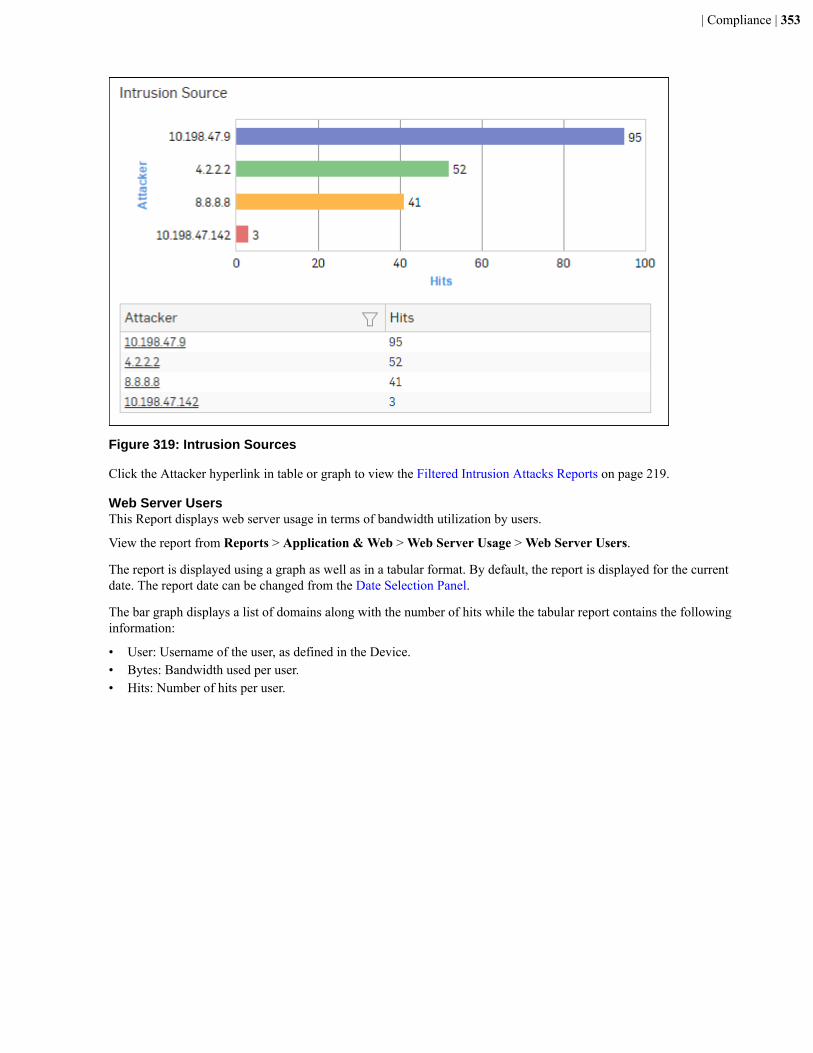
| Compliance | 353
Figure 319: Intrusion Sources
Click the Attacker hyperlink in table or graph to view the Filtered Intrusion Attacks Reports on page 219.
Web Server UsersThis Report displays web server usage in terms of bandwidth utilization by users.
View the report from Reports > Application & Web > Web Server Usage > Web Server Users.
The report is displayed using a graph as well as in a tabular format. By default, the report is displayed for the currentdate. The report date can be changed from the Date Selection Panel.
The bar graph displays a list of domains along with the number of hits while the tabular report contains the followinginformation:
• User: Username of the user, as defined in the Device.• Bytes: Bandwidth used per user.• Hits: Number of hits per user.

| Compliance | 354
Figure 320: Web Server Users
Click the User hyperlink in table or graph to view the Filtered Web Server Usage Reports on page 166.
Blocked Web Server RequestsThis Report displays a list of reasons why requests were blocked by Sophos iView, along with the number of hits perrequest.
View the reportfrom Dashboards > Security Dashboard > Blocked Web Server Requestsor from Reports >Application & Web > Web Server Protection > Blocked Web Server Requests.
The report is displayed using a graph as well as in a tabular format. By default, the report is displayed for the currentdate. The report date can be changed from the Date Selection Panel.
The bar graph displays the list of blocked attacks along with the number of hits per attack, while the tabular reportcontains the following information:
• Blocked Reason: Reason for which an attack is blocked.• Hits: Number of hits per attack.
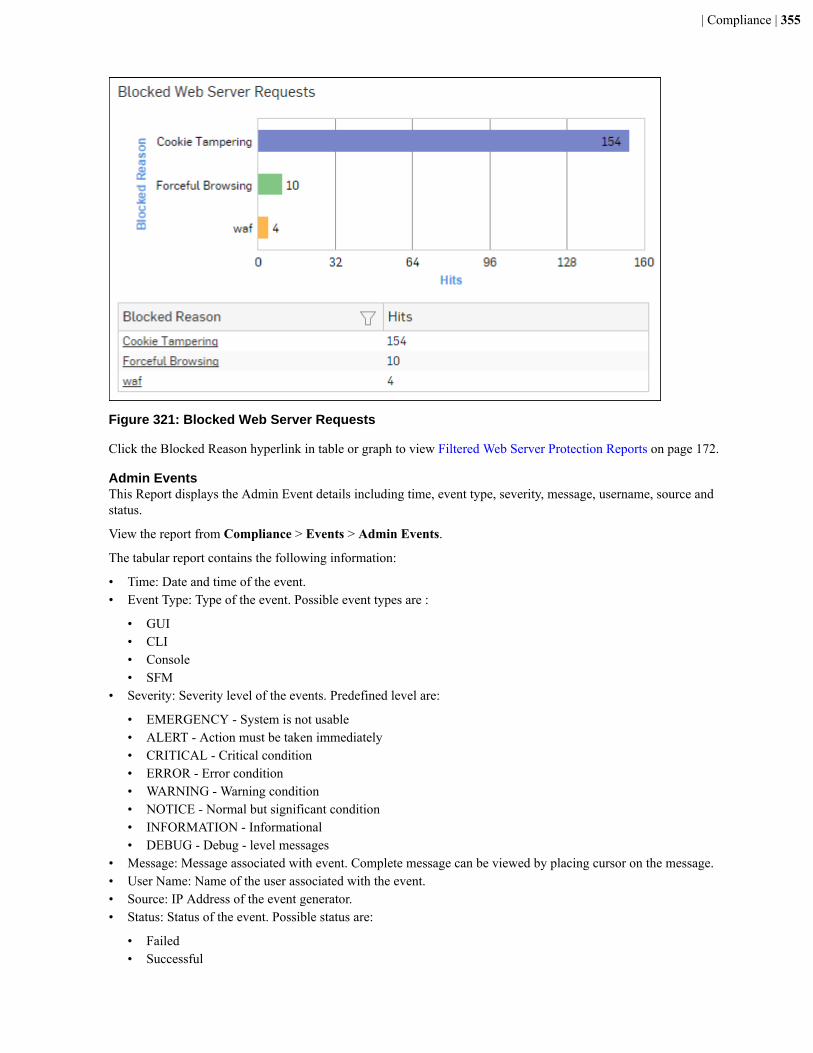
| Compliance | 355
Figure 321: Blocked Web Server Requests
Click the Blocked Reason hyperlink in table or graph to view Filtered Web Server Protection Reports on page 172.
Admin EventsThis Report displays the Admin Event details including time, event type, severity, message, username, source andstatus.
View the report from Compliance > Events > Admin Events.
The tabular report contains the following information:
• Time: Date and time of the event.• Event Type: Type of the event. Possible event types are :
• GUI• CLI• Console• SFM
• Severity: Severity level of the events. Predefined level are:
• EMERGENCY - System is not usable• ALERT - Action must be taken immediately• CRITICAL - Critical condition• ERROR - Error condition• WARNING - Warning condition• NOTICE - Normal but significant condition• INFORMATION - Informational• DEBUG - Debug - level messages
• Message: Message associated with event. Complete message can be viewed by placing cursor on the message.• User Name: Name of the user associated with the event.• Source: IP Address of the event generator.• Status: Status of the event. Possible status are:
• Failed• Successful
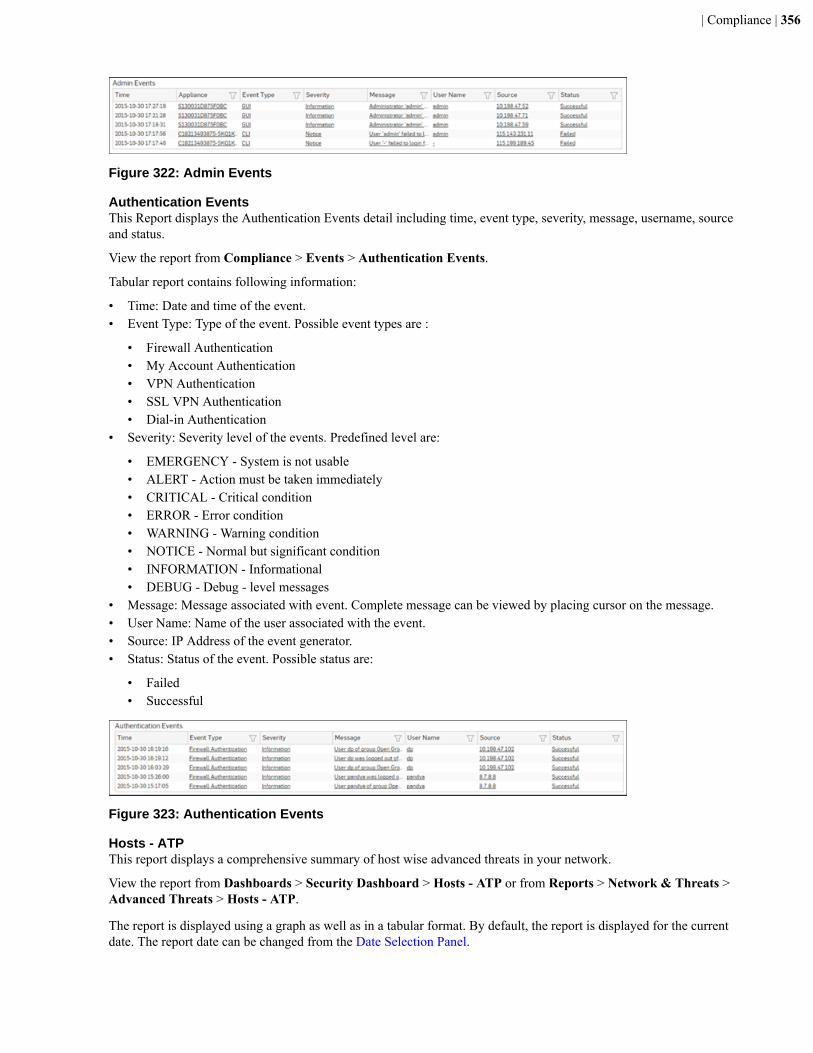
| Compliance | 356
Figure 322: Admin Events
Authentication EventsThis Report displays the Authentication Events detail including time, event type, severity, message, username, sourceand status.
View the report from Compliance > Events > Authentication Events.
Tabular report contains following information:
• Time: Date and time of the event.• Event Type: Type of the event. Possible event types are :
• Firewall Authentication• My Account Authentication• VPN Authentication• SSL VPN Authentication• Dial-in Authentication
• Severity: Severity level of the events. Predefined level are:
• EMERGENCY - System is not usable• ALERT - Action must be taken immediately• CRITICAL - Critical condition• ERROR - Error condition• WARNING - Warning condition• NOTICE - Normal but significant condition• INFORMATION - Informational• DEBUG - Debug - level messages
• Message: Message associated with event. Complete message can be viewed by placing cursor on the message.• User Name: Name of the user associated with the event.• Source: IP Address of the event generator.• Status: Status of the event. Possible status are:
• Failed• Successful
Figure 323: Authentication Events
Hosts - ATPThis report displays a comprehensive summary of host wise advanced threats in your network.
View the report from Dashboards > Security Dashboard > Hosts - ATP or from Reports > Network & Threats >Advanced Threats > Hosts - ATP.
The report is displayed using a graph as well as in a tabular format. By default, the report is displayed for the currentdate. The report date can be changed from the Date Selection Panel.
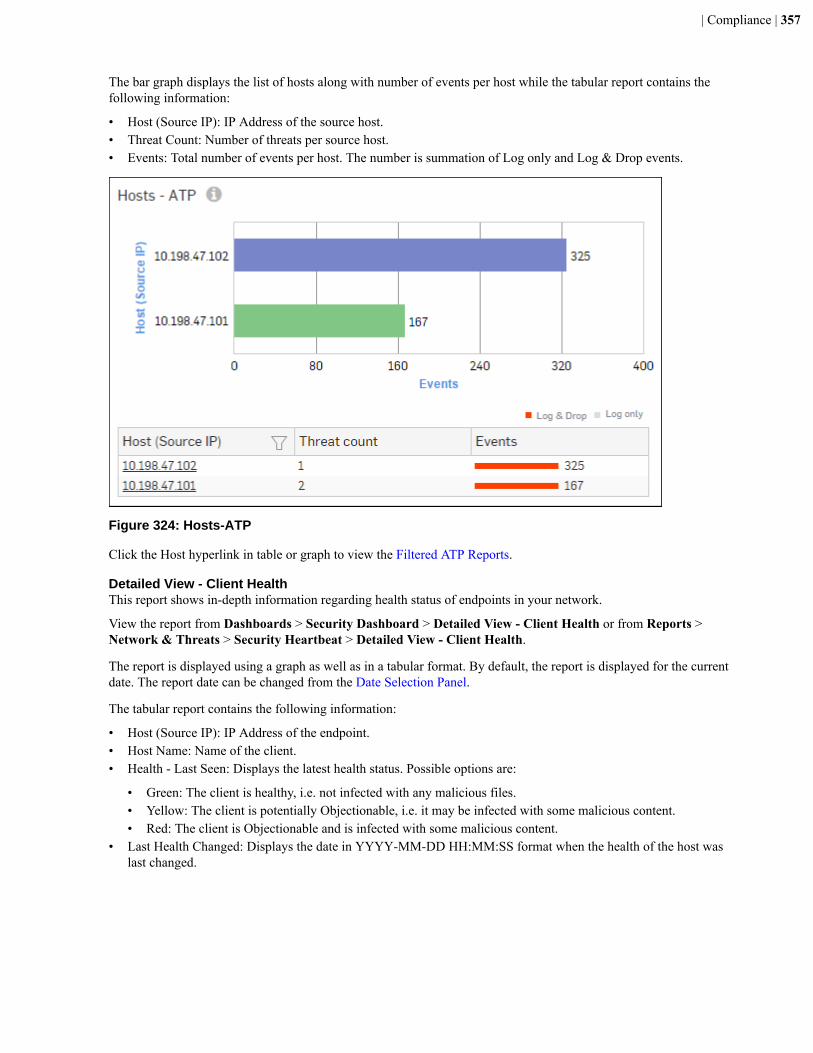
| Compliance | 357
The bar graph displays the list of hosts along with number of events per host while the tabular report contains thefollowing information:
• Host (Source IP): IP Address of the source host.• Threat Count: Number of threats per source host.• Events: Total number of events per host. The number is summation of Log only and Log & Drop events.
Figure 324: Hosts-ATP
Click the Host hyperlink in table or graph to view the Filtered ATP Reports.
Detailed View - Client HealthThis report shows in-depth information regarding health status of endpoints in your network.
View the report from Dashboards > Security Dashboard > Detailed View - Client Health or from Reports >Network & Threats > Security Heartbeat > Detailed View - Client Health.
The report is displayed using a graph as well as in a tabular format. By default, the report is displayed for the currentdate. The report date can be changed from the Date Selection Panel.
The tabular report contains the following information:
• Host (Source IP): IP Address of the endpoint.• Host Name: Name of the client.• Health - Last Seen: Displays the latest health status. Possible options are:
• Green: The client is healthy, i.e. not infected with any malicious files.• Yellow: The client is potentially Objectionable, i.e. it may be infected with some malicious content.• Red: The client is Objectionable and is infected with some malicious content.
• Last Health Changed: Displays the date in YYYY-MM-DD HH:MM:SS format when the health of the host waslast changed.

| Compliance | 358
Figure 325: Detailed View - Client Health
Click the Host status in the table or the graph to view the Filtered Security Heartbeat Reports.
Detailed View - ATPThis report provides a detailed summary of advanced threats in your network.
View the report from Reports > Network & Threats > Advanced Threats > Detailed View - ATP.
The report is displayed using a graph as well as in a tabular format. By default, the report is displayed for the currentdate. The report date can be changed from the Date Selection Panel.
The tabular report contains the following information:
• Host (Source IP): IP Address of the source host.• User: Username of the infected user.• Threat: Name of the threat.• Destination: IP Address of the infected destination.• Origin: Origin of the threat. Possible options:
• Firewall• IPS• DNS• Web• Combination of any of the above
• Events: Total number of events. The number is summation of Log only and Log & Drop events.• Action: Action performed by the Device when a threat is detected. Possible options:
• Log & Drop: The data packet is logged and dropped.• Log only: The data packet is logged.
Figure 326: Detailed View -ATP
Security Heartbeat - ATPThis report provides an insight into advanced threats related to endpoints in your network.
View the report from Reports > Network & Threats > Advanced Threats > Security Heartbeat - ATP or fromCompliance > HIPPA > Security Heartbeat - ATP.
The report is displayed using a graph as well as in a tabular format. By default, the report is displayed for the currentdate. The report date can be changed from the Date Selection Panel.
The report is displayed in a tabular format. The tabular report contains the following information:
• Host (Source IP): IP Address of the source host.• Login User: Username of the infected user.• Process User: Username of the user owning the process.• Threat: Name of the threat.
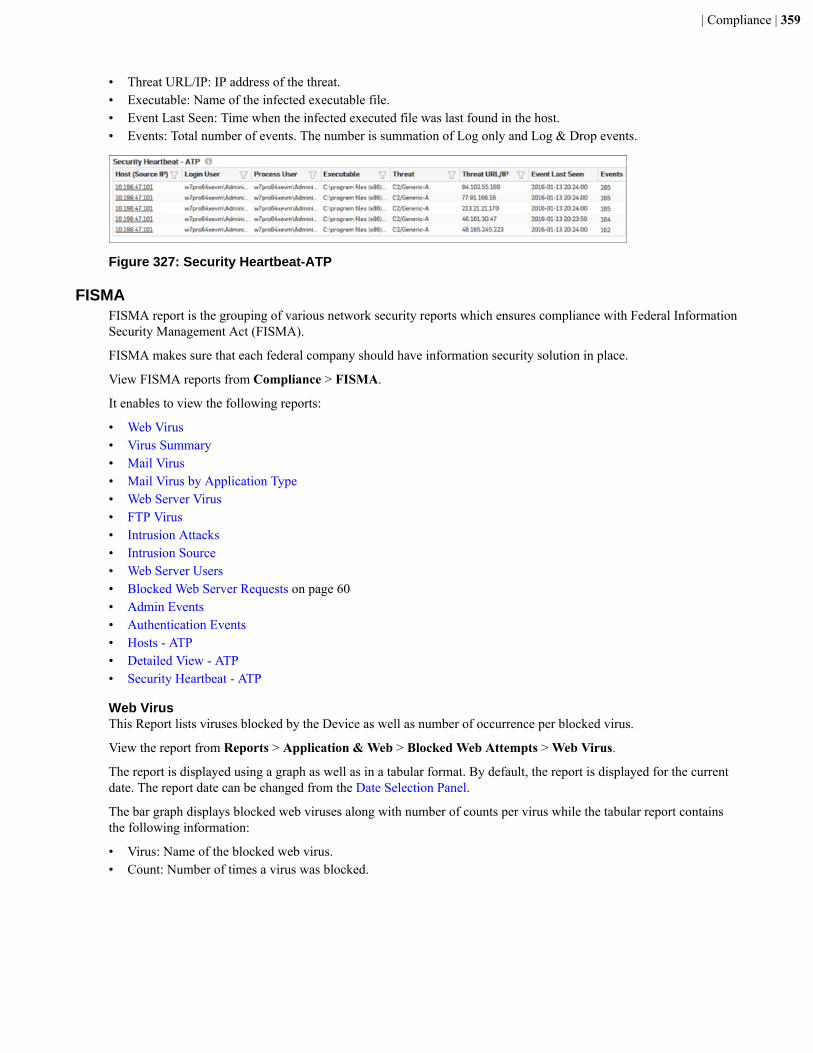
| Compliance | 359
• Threat URL/IP: IP address of the threat.• Executable: Name of the infected executable file.• Event Last Seen: Time when the infected executed file was last found in the host.• Events: Total number of events. The number is summation of Log only and Log & Drop events.
Figure 327: Security Heartbeat-ATP
FISMAFISMA report is the grouping of various network security reports which ensures compliance with Federal InformationSecurity Management Act (FISMA).
FISMA makes sure that each federal company should have information security solution in place.
View FISMA reports from Compliance > FISMA.
It enables to view the following reports:
• Web Virus• Virus Summary• Mail Virus• Mail Virus by Application Type• Web Server Virus• FTP Virus• Intrusion Attacks• Intrusion Source• Web Server Users• Blocked Web Server Requests on page 60• Admin Events• Authentication Events• Hosts - ATP• Detailed View - ATP• Security Heartbeat - ATP
Web VirusThis Report lists viruses blocked by the Device as well as number of occurrence per blocked virus.
View the report from Reports > Application & Web > Blocked Web Attempts > Web Virus.
The report is displayed using a graph as well as in a tabular format. By default, the report is displayed for the currentdate. The report date can be changed from the Date Selection Panel.
The bar graph displays blocked web viruses along with number of counts per virus while the tabular report containsthe following information:
• Virus: Name of the blocked web virus.• Count: Number of times a virus was blocked.
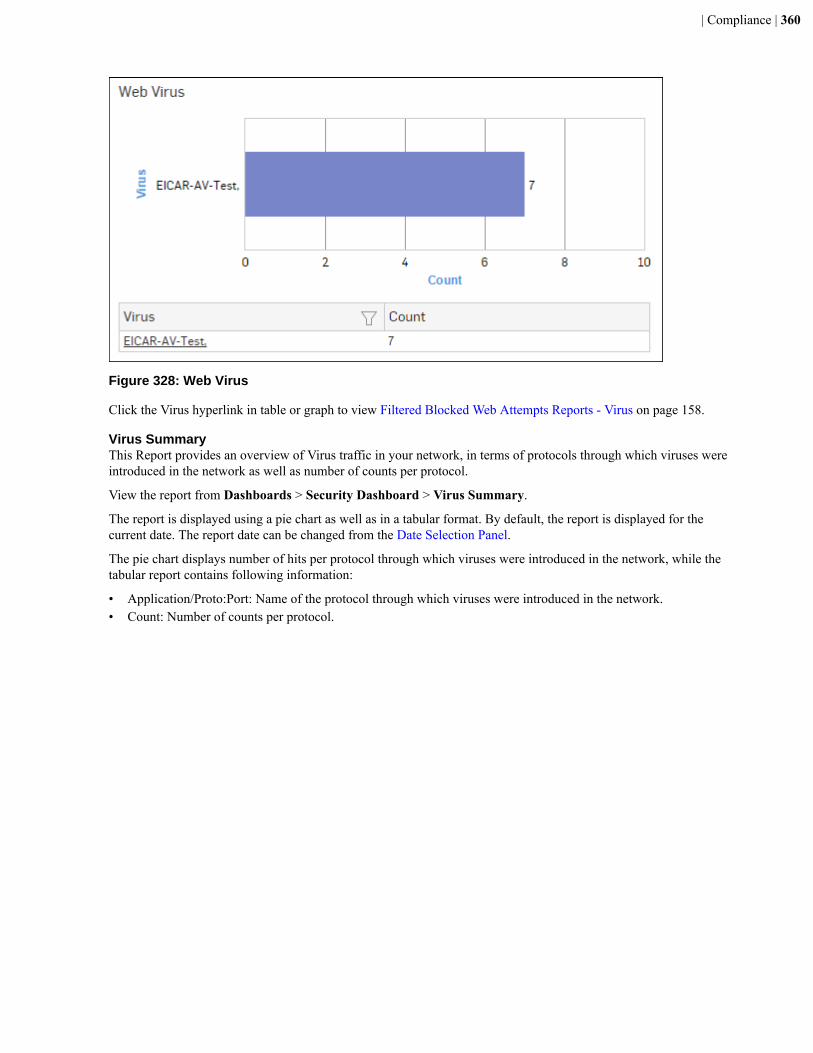
| Compliance | 360
Figure 328: Web Virus
Click the Virus hyperlink in table or graph to view Filtered Blocked Web Attempts Reports - Virus on page 158.
Virus SummaryThis Report provides an overview of Virus traffic in your network, in terms of protocols through which viruses wereintroduced in the network as well as number of counts per protocol.
View the report from Dashboards > Security Dashboard > Virus Summary.
The report is displayed using a pie chart as well as in a tabular format. By default, the report is displayed for thecurrent date. The report date can be changed from the Date Selection Panel.
The pie chart displays number of hits per protocol through which viruses were introduced in the network, while thetabular report contains following information:
• Application/Proto:Port: Name of the protocol through which viruses were introduced in the network.• Count: Number of counts per protocol.

| Compliance | 361
Figure 329: Virus Summary
Click the Application hyperlink in table or graph to view Filtered Blocked Web Attempts Reports - Virus on page158.
Mail VirusThis Report displays Viruses detected in your network along with number of hits per Virus.
View the reportfrom Reports > Email > Email Protection > Mail Virus.
The report is displayed using a graph as well as in a tabular format. By default, the report is displayed for the currentdate. The report date can be changed from the Date Selection Panel.
The bar graph displays the number of counts per mail virus while the tabular report contains the followinginformation:
• Virus: Name of the virus.• Count: Number of counts per mail virus.

| Compliance | 362
Figure 330: Mail Virus
Click the Virus hyperlink in the table or graph to view the Filtered Virus Reports.
Mail Virus by Application TypeThis Report provides an overview of mail viruses by their application type.
View the reportfrom Reports > Email > Email Protection > Mail Virus by Application Type.
The report is displayed using a graph as well as in a tabular format. By default, the report is displayed for the currentdate. The report date can be changed from the Date Selection Panel.
The bar graph displays the number of mail viruses per application while the tabular report contains the followinginformation:
• Application/Proto:Port: Name of the application, as defined in the Device.• Count: Number of mail viruses per application.

| Compliance | 363
Figure 331: Mail Virus by Application Type
Click the Application hyperlink in the table or graph to view the Filtered Virus Reports.
Web Server VirusThis report displays a list of blocked viruses along with number of hits per virus.
View the report from Reports > Application & Web > Web Server Protection > Web Server Virus.
The report is displayed using a graph as well as in a tabular format. By default, the report is displayed for the currentdate. The report date can be changed from the Date Selection Panel.
The bar graph displays the list of viruses and number of hits while the tabular report contains the followinginformation:
• Virus: Name of the Virus blocked by the Device.• Hits: Number of hits per blocked virus.
Figure 332: Web Server Virus

| Compliance | 364
Click the Virus hyperlink in table or graph to view Filtered Web Server Protection Reports on page 172.
FTP VirusThis Report displays a list of the FTP viruses and number of counts per virus.
View the report from Reports > Application & Web > FTP Protection > FTP Virus.
The report is displayed using a graph as well as in a tabular format. By default, the report is displayed for the currentdate. The report date can be changed from the Date Selection Panel.
The bar graph displays the number of virus counts per virus while the tabular report contains the followinginformation:
• Virus: Name of the FTP virus.• Count: Number of counts for the virus.
Figure 333: FTP Virus
Click the Virus hyperlink in table or graph to view the Filtered FTP Protection Reports on page 193.
Intrusion AttacksThe Report enables to view the details of the attack that has hit the system and gives the detailed disintegration ofattackers, victims and applications through individual reports.
View the report from Reports > Network & Threats > Intrusion Attacks > Intrusion Attacks.
The report is displayed using a graph as well as in a tabular format. By default, the report is displayed for the currentdate. The report date can be changed from the Date Selection Panel.
Note: You can view this report from Security Dashboard as well.
The bar graph displays the number of hits under each attack, while the tabular report contains the followinginformation:
• Attack: Name of the attack launched.• Hits: Number of hits for each attack.
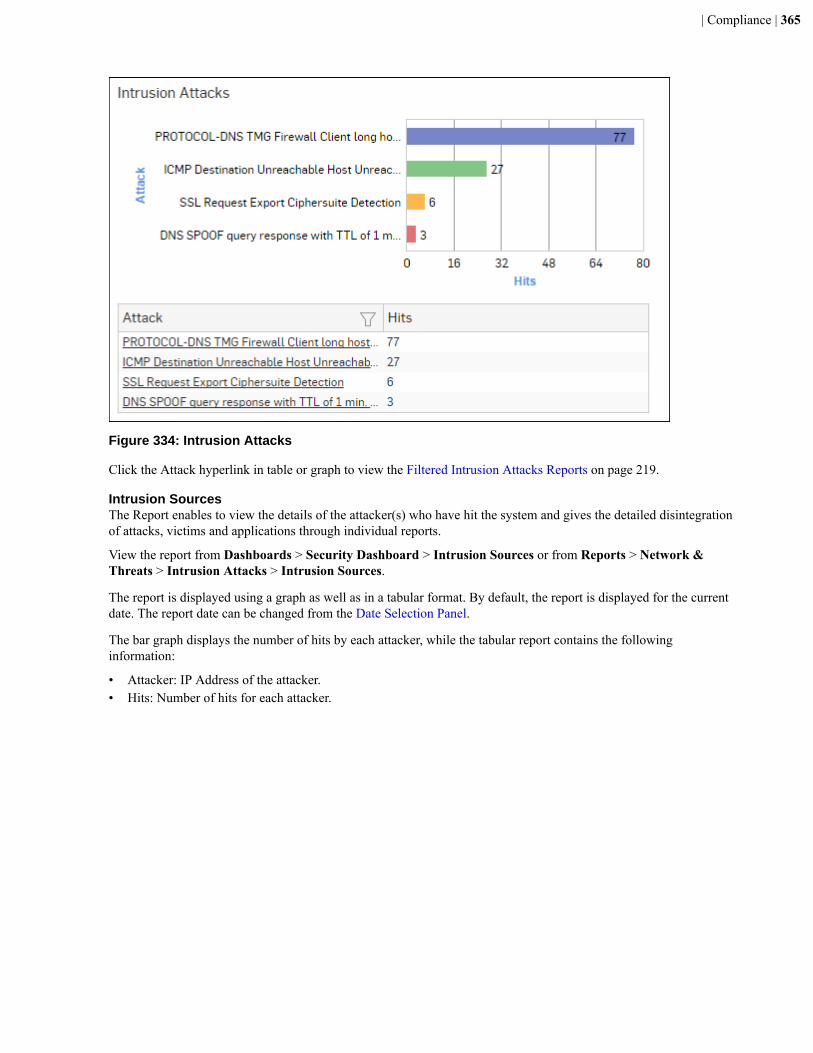
| Compliance | 365
Figure 334: Intrusion Attacks
Click the Attack hyperlink in table or graph to view the Filtered Intrusion Attacks Reports on page 219.
Intrusion SourcesThe Report enables to view the details of the attacker(s) who have hit the system and gives the detailed disintegrationof attacks, victims and applications through individual reports.
View the report from Dashboards > Security Dashboard > Intrusion Sources or from Reports > Network &Threats > Intrusion Attacks > Intrusion Sources.
The report is displayed using a graph as well as in a tabular format. By default, the report is displayed for the currentdate. The report date can be changed from the Date Selection Panel.
The bar graph displays the number of hits by each attacker, while the tabular report contains the followinginformation:
• Attacker: IP Address of the attacker.• Hits: Number of hits for each attacker.

| Compliance | 366
Figure 335: Intrusion Sources
Click the Attacker hyperlink in table or graph to view the Filtered Intrusion Attacks Reports on page 219.
Web Server UsersThis Report displays web server usage in terms of bandwidth utilization by users.
View the report from Reports > Application & Web > Web Server Usage > Web Server Users.
The report is displayed using a graph as well as in a tabular format. By default, the report is displayed for the currentdate. The report date can be changed from the Date Selection Panel.
The bar graph displays a list of domains along with the number of hits while the tabular report contains the followinginformation:
• User: Username of the user, as defined in the Device.• Bytes: Bandwidth used per user.• Hits: Number of hits per user.
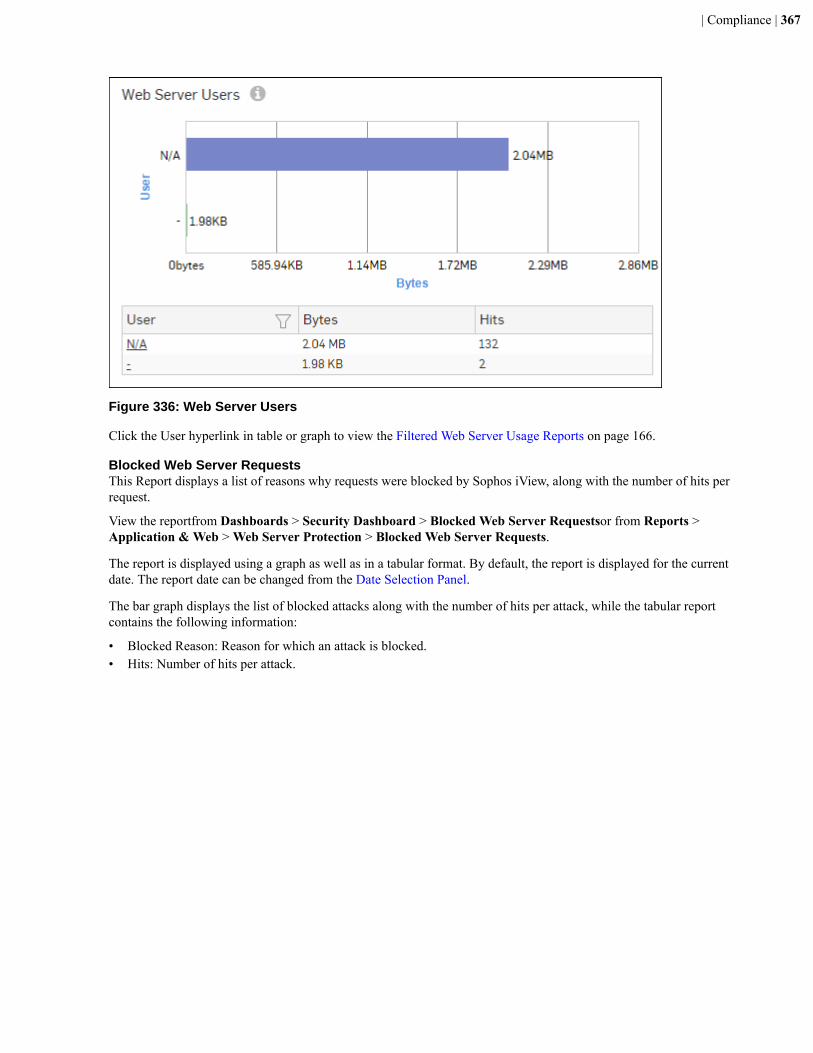
| Compliance | 367
Figure 336: Web Server Users
Click the User hyperlink in table or graph to view the Filtered Web Server Usage Reports on page 166.
Blocked Web Server RequestsThis Report displays a list of reasons why requests were blocked by Sophos iView, along with the number of hits perrequest.
View the reportfrom Dashboards > Security Dashboard > Blocked Web Server Requestsor from Reports >Application & Web > Web Server Protection > Blocked Web Server Requests.
The report is displayed using a graph as well as in a tabular format. By default, the report is displayed for the currentdate. The report date can be changed from the Date Selection Panel.
The bar graph displays the list of blocked attacks along with the number of hits per attack, while the tabular reportcontains the following information:
• Blocked Reason: Reason for which an attack is blocked.• Hits: Number of hits per attack.

| Compliance | 368
Figure 337: Blocked Web Server Requests
Click the Blocked Reason hyperlink in table or graph to view Filtered Web Server Protection Reports on page 172.
Security Heartbeat - ATPThis report provides an insight into advanced threats related to endpoints in your network.
View the report from Reports > Network & Threats > Advanced Threats > Security Heartbeat - ATP or fromCompliance > HIPPA > Security Heartbeat - ATP.
The report is displayed using a graph as well as in a tabular format. By default, the report is displayed for the currentdate. The report date can be changed from the Date Selection Panel.
The report is displayed in a tabular format. The tabular report contains the following information:
• Host (Source IP): IP Address of the source host.• Login User: Username of the infected user.• Process User: Username of the user owning the process.• Threat: Name of the threat.• Threat URL/IP: IP address of the threat.• Executable: Name of the infected executable file.• Event Last Seen: Time when the infected executed file was last found in the host.• Events: Total number of events. The number is summation of Log only and Log & Drop events.
Figure 338: Security Heartbeat-ATP
Admin EventsThis Report displays the Admin Event details including time, event type, severity, message, username, source andstatus.
View the report from Compliance > Events > Admin Events.

| Compliance | 369
The tabular report contains the following information:
• Time: Date and time of the event.• Event Type: Type of the event. Possible event types are :
• GUI• CLI• Console• SFM
• Severity: Severity level of the events. Predefined level are:
• EMERGENCY - System is not usable• ALERT - Action must be taken immediately• CRITICAL - Critical condition• ERROR - Error condition• WARNING - Warning condition• NOTICE - Normal but significant condition• INFORMATION - Informational• DEBUG - Debug - level messages
• Message: Message associated with event. Complete message can be viewed by placing cursor on the message.• User Name: Name of the user associated with the event.• Source: IP Address of the event generator.• Status: Status of the event. Possible status are:
• Failed• Successful
Figure 339: Admin Events
Authentication EventsThis Report displays the Authentication Events detail including time, event type, severity, message, username, sourceand status.
View the report from Compliance > Events > Authentication Events.
Tabular report contains following information:
• Time: Date and time of the event.• Event Type: Type of the event. Possible event types are :
• Firewall Authentication• My Account Authentication• VPN Authentication• SSL VPN Authentication• Dial-in Authentication
• Severity: Severity level of the events. Predefined level are:
• EMERGENCY - System is not usable• ALERT - Action must be taken immediately• CRITICAL - Critical condition• ERROR - Error condition• WARNING - Warning condition
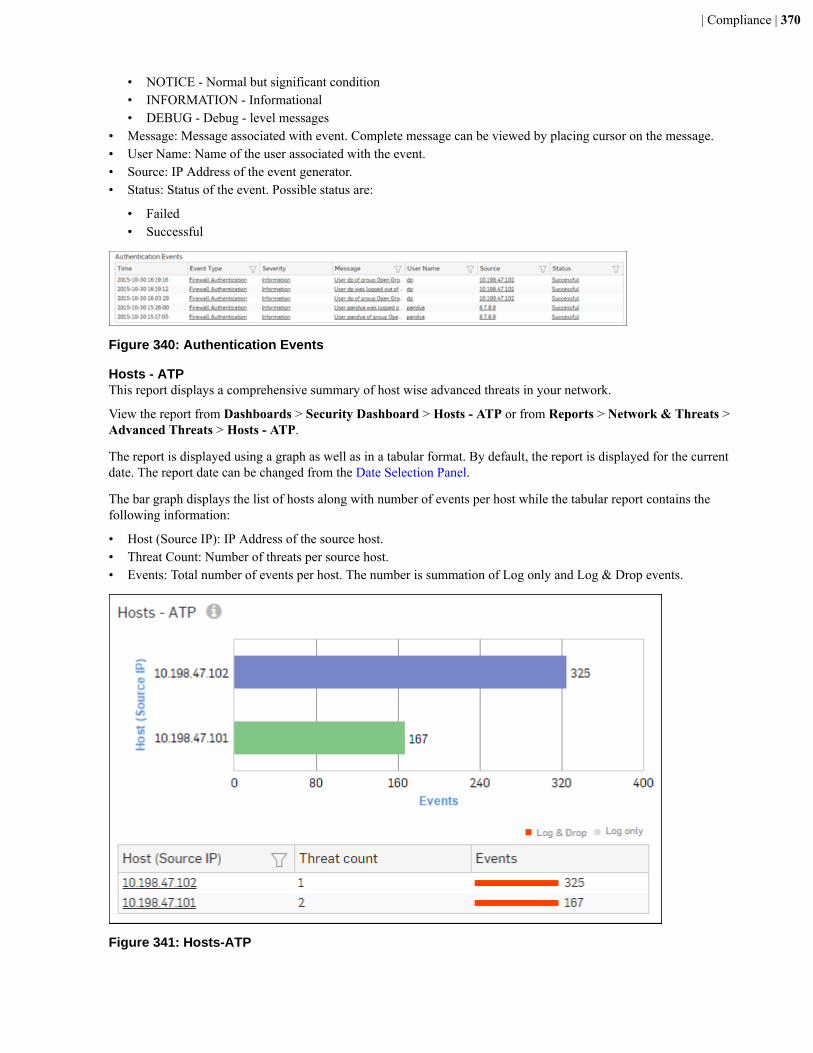
| Compliance | 370
• NOTICE - Normal but significant condition• INFORMATION - Informational• DEBUG - Debug - level messages
• Message: Message associated with event. Complete message can be viewed by placing cursor on the message.• User Name: Name of the user associated with the event.• Source: IP Address of the event generator.• Status: Status of the event. Possible status are:
• Failed• Successful
Figure 340: Authentication Events
Hosts - ATPThis report displays a comprehensive summary of host wise advanced threats in your network.
View the report from Dashboards > Security Dashboard > Hosts - ATP or from Reports > Network & Threats >Advanced Threats > Hosts - ATP.
The report is displayed using a graph as well as in a tabular format. By default, the report is displayed for the currentdate. The report date can be changed from the Date Selection Panel.
The bar graph displays the list of hosts along with number of events per host while the tabular report contains thefollowing information:
• Host (Source IP): IP Address of the source host.• Threat Count: Number of threats per source host.• Events: Total number of events per host. The number is summation of Log only and Log & Drop events.
Figure 341: Hosts-ATP
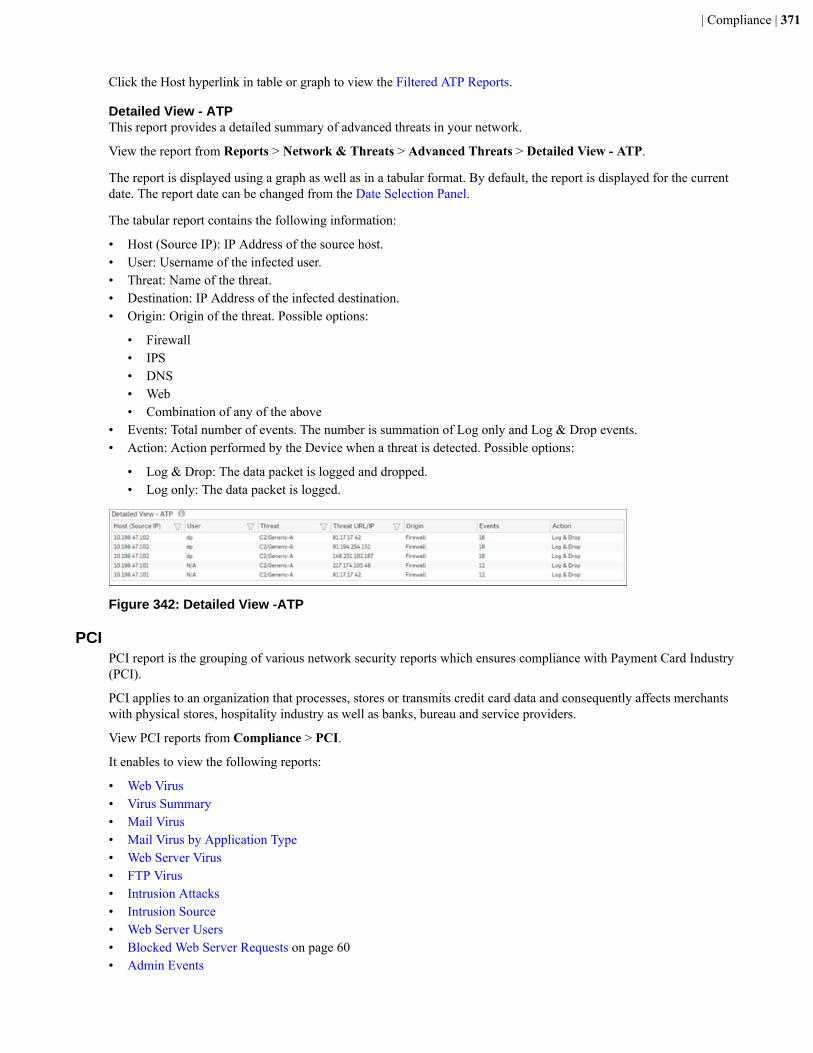
| Compliance | 371
Click the Host hyperlink in table or graph to view the Filtered ATP Reports.
Detailed View - ATPThis report provides a detailed summary of advanced threats in your network.
View the report from Reports > Network & Threats > Advanced Threats > Detailed View - ATP.
The report is displayed using a graph as well as in a tabular format. By default, the report is displayed for the currentdate. The report date can be changed from the Date Selection Panel.
The tabular report contains the following information:
• Host (Source IP): IP Address of the source host.• User: Username of the infected user.• Threat: Name of the threat.• Destination: IP Address of the infected destination.• Origin: Origin of the threat. Possible options:
• Firewall• IPS• DNS• Web• Combination of any of the above
• Events: Total number of events. The number is summation of Log only and Log & Drop events.• Action: Action performed by the Device when a threat is detected. Possible options:
• Log & Drop: The data packet is logged and dropped.• Log only: The data packet is logged.
Figure 342: Detailed View -ATP
PCIPCI report is the grouping of various network security reports which ensures compliance with Payment Card Industry(PCI).
PCI applies to an organization that processes, stores or transmits credit card data and consequently affects merchantswith physical stores, hospitality industry as well as banks, bureau and service providers.
View PCI reports from Compliance > PCI.
It enables to view the following reports:
• Web Virus• Virus Summary• Mail Virus• Mail Virus by Application Type• Web Server Virus• FTP Virus• Intrusion Attacks• Intrusion Source• Web Server Users• Blocked Web Server Requests on page 60• Admin Events
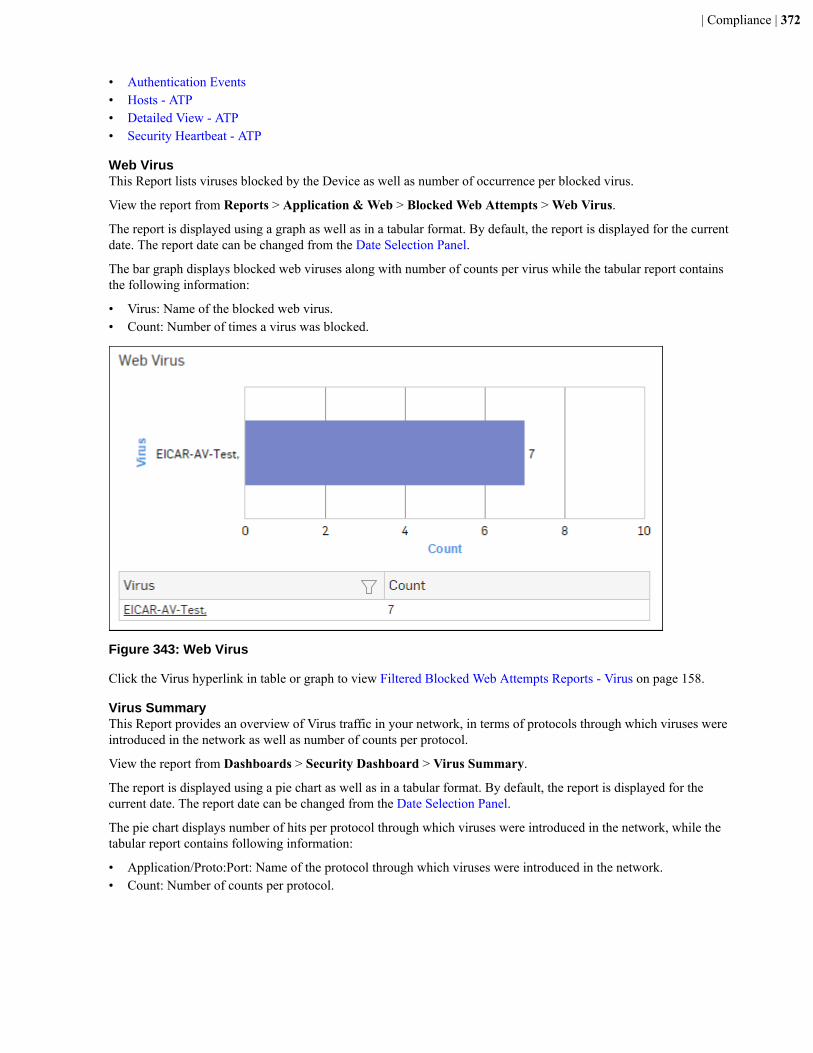
| Compliance | 372
• Authentication Events• Hosts - ATP• Detailed View - ATP• Security Heartbeat - ATP
Web VirusThis Report lists viruses blocked by the Device as well as number of occurrence per blocked virus.
View the report from Reports > Application & Web > Blocked Web Attempts > Web Virus.
The report is displayed using a graph as well as in a tabular format. By default, the report is displayed for the currentdate. The report date can be changed from the Date Selection Panel.
The bar graph displays blocked web viruses along with number of counts per virus while the tabular report containsthe following information:
• Virus: Name of the blocked web virus.• Count: Number of times a virus was blocked.
Figure 343: Web Virus
Click the Virus hyperlink in table or graph to view Filtered Blocked Web Attempts Reports - Virus on page 158.
Virus SummaryThis Report provides an overview of Virus traffic in your network, in terms of protocols through which viruses wereintroduced in the network as well as number of counts per protocol.
View the report from Dashboards > Security Dashboard > Virus Summary.
The report is displayed using a pie chart as well as in a tabular format. By default, the report is displayed for thecurrent date. The report date can be changed from the Date Selection Panel.
The pie chart displays number of hits per protocol through which viruses were introduced in the network, while thetabular report contains following information:
• Application/Proto:Port: Name of the protocol through which viruses were introduced in the network.• Count: Number of counts per protocol.

| Compliance | 373
Figure 344: Virus Summary
Click the Application hyperlink in table or graph to view Filtered Blocked Web Attempts Reports - Virus on page158.
Mail VirusThis Report displays Viruses detected in your network along with number of hits per Virus.
View the reportfrom Reports > Email > Email Protection > Mail Virus.
The report is displayed using a graph as well as in a tabular format. By default, the report is displayed for the currentdate. The report date can be changed from the Date Selection Panel.
The bar graph displays the number of counts per mail virus while the tabular report contains the followinginformation:
• Virus: Name of the virus.• Count: Number of counts per mail virus.

| Compliance | 374
Figure 345: Mail Virus
Click the Virus hyperlink in the table or graph to view the Filtered Virus Reports.
Mail Virus by Application TypeThis Report provides an overview of mail viruses by their application type.
View the reportfrom Reports > Email > Email Protection > Mail Virus by Application Type.
The report is displayed using a graph as well as in a tabular format. By default, the report is displayed for the currentdate. The report date can be changed from the Date Selection Panel.
The bar graph displays the number of mail viruses per application while the tabular report contains the followinginformation:
• Application/Proto:Port: Name of the application, as defined in the Device.• Count: Number of mail viruses per application.

| Compliance | 375
Figure 346: Mail Virus by Application Type
Click the Application hyperlink in the table or graph to view the Filtered Virus Reports.
Web Server VirusThis report displays a list of blocked viruses along with number of hits per virus.
View the report from Reports > Application & Web > Web Server Protection > Web Server Virus.
The report is displayed using a graph as well as in a tabular format. By default, the report is displayed for the currentdate. The report date can be changed from the Date Selection Panel.
The bar graph displays the list of viruses and number of hits while the tabular report contains the followinginformation:
• Virus: Name of the Virus blocked by the Device.• Hits: Number of hits per blocked virus.
Figure 347: Web Server Virus

| Compliance | 376
Click the Virus hyperlink in table or graph to view Filtered Web Server Protection Reports on page 172.
FTP VirusThis Report displays a list of the FTP viruses and number of counts per virus.
View the report from Reports > Application & Web > FTP Protection > FTP Virus.
The report is displayed using a graph as well as in a tabular format. By default, the report is displayed for the currentdate. The report date can be changed from the Date Selection Panel.
The bar graph displays the number of virus counts per virus while the tabular report contains the followinginformation:
• Virus: Name of the FTP virus.• Count: Number of counts for the virus.
Figure 348: FTP Virus
Click the Virus hyperlink in table or graph to view the Filtered FTP Protection Reports on page 193.
Intrusion AttacksThe Report enables to view the details of the attack that has hit the system and gives the detailed disintegration ofattackers, victims and applications through individual reports.
View the report from Reports > Network & Threats > Intrusion Attacks > Intrusion Attacks.
The report is displayed using a graph as well as in a tabular format. By default, the report is displayed for the currentdate. The report date can be changed from the Date Selection Panel.
Note: You can view this report from Security Dashboard as well.
The bar graph displays the number of hits under each attack, while the tabular report contains the followinginformation:
• Attack: Name of the attack launched.• Hits: Number of hits for each attack.

| Compliance | 377
Figure 349: Intrusion Attacks
Click the Attack hyperlink in table or graph to view the Filtered Intrusion Attacks Reports on page 219.
Intrusion SourcesThe Report enables to view the details of the attacker(s) who have hit the system and gives the detailed disintegrationof attacks, victims and applications through individual reports.
View the report from Dashboards > Security Dashboard > Intrusion Sources or from Reports > Network &Threats > Intrusion Attacks > Intrusion Sources.
The report is displayed using a graph as well as in a tabular format. By default, the report is displayed for the currentdate. The report date can be changed from the Date Selection Panel.
The bar graph displays the number of hits by each attacker, while the tabular report contains the followinginformation:
• Attacker: IP Address of the attacker.• Hits: Number of hits for each attacker.

| Compliance | 378
Figure 350: Intrusion Sources
Click the Attacker hyperlink in table or graph to view the Filtered Intrusion Attacks Reports on page 219.
Web Server UsersThis Report displays web server usage in terms of bandwidth utilization by users.
View the report from Reports > Application & Web > Web Server Usage > Web Server Users.
The report is displayed using a graph as well as in a tabular format. By default, the report is displayed for the currentdate. The report date can be changed from the Date Selection Panel.
The bar graph displays a list of domains along with the number of hits while the tabular report contains the followinginformation:
• User: Username of the user, as defined in the Device.• Bytes: Bandwidth used per user.• Hits: Number of hits per user.

| Compliance | 379
Figure 351: Web Server Users
Click the User hyperlink in table or graph to view the Filtered Web Server Usage Reports on page 166.
Blocked Web Server RequestsThis Report displays a list of reasons why requests were blocked by Sophos iView, along with the number of hits perrequest.
View the reportfrom Dashboards > Security Dashboard > Blocked Web Server Requestsor from Reports >Application & Web > Web Server Protection > Blocked Web Server Requests.
The report is displayed using a graph as well as in a tabular format. By default, the report is displayed for the currentdate. The report date can be changed from the Date Selection Panel.
The bar graph displays the list of blocked attacks along with the number of hits per attack, while the tabular reportcontains the following information:
• Blocked Reason: Reason for which an attack is blocked.• Hits: Number of hits per attack.
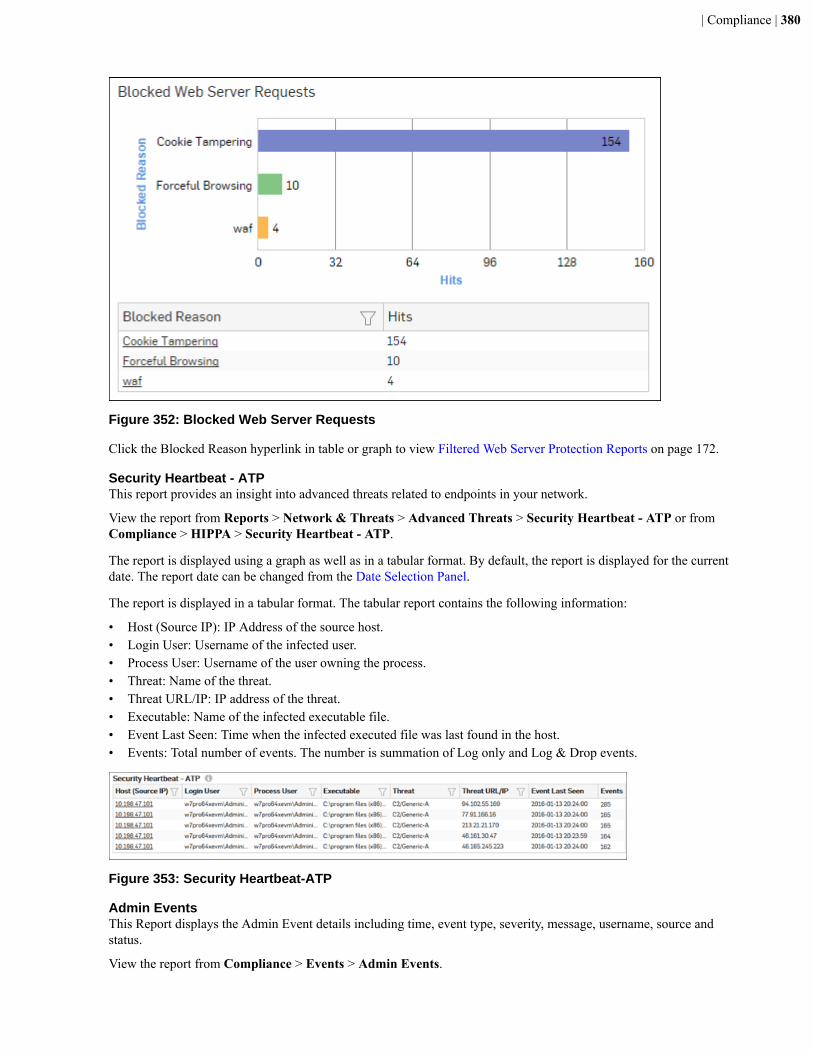
| Compliance | 380
Figure 352: Blocked Web Server Requests
Click the Blocked Reason hyperlink in table or graph to view Filtered Web Server Protection Reports on page 172.
Security Heartbeat - ATPThis report provides an insight into advanced threats related to endpoints in your network.
View the report from Reports > Network & Threats > Advanced Threats > Security Heartbeat - ATP or fromCompliance > HIPPA > Security Heartbeat - ATP.
The report is displayed using a graph as well as in a tabular format. By default, the report is displayed for the currentdate. The report date can be changed from the Date Selection Panel.
The report is displayed in a tabular format. The tabular report contains the following information:
• Host (Source IP): IP Address of the source host.• Login User: Username of the infected user.• Process User: Username of the user owning the process.• Threat: Name of the threat.• Threat URL/IP: IP address of the threat.• Executable: Name of the infected executable file.• Event Last Seen: Time when the infected executed file was last found in the host.• Events: Total number of events. The number is summation of Log only and Log & Drop events.
Figure 353: Security Heartbeat-ATP
Admin EventsThis Report displays the Admin Event details including time, event type, severity, message, username, source andstatus.
View the report from Compliance > Events > Admin Events.
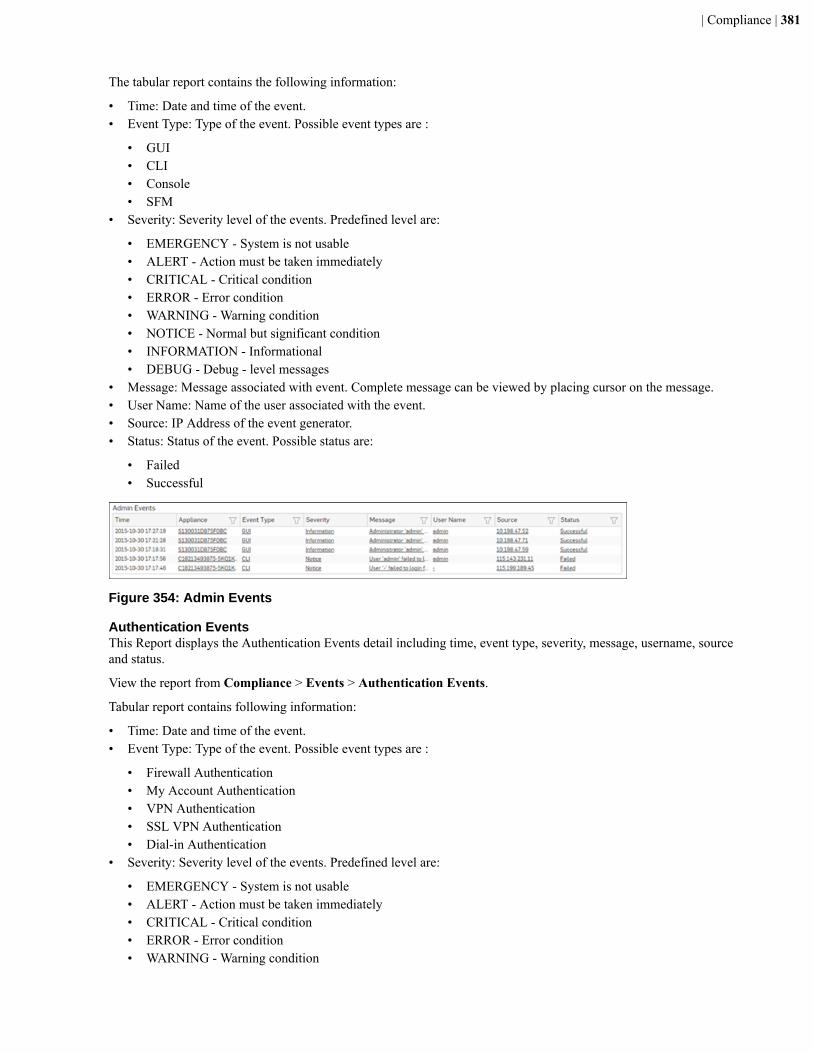
| Compliance | 381
The tabular report contains the following information:
• Time: Date and time of the event.• Event Type: Type of the event. Possible event types are :
• GUI• CLI• Console• SFM
• Severity: Severity level of the events. Predefined level are:
• EMERGENCY - System is not usable• ALERT - Action must be taken immediately• CRITICAL - Critical condition• ERROR - Error condition• WARNING - Warning condition• NOTICE - Normal but significant condition• INFORMATION - Informational• DEBUG - Debug - level messages
• Message: Message associated with event. Complete message can be viewed by placing cursor on the message.• User Name: Name of the user associated with the event.• Source: IP Address of the event generator.• Status: Status of the event. Possible status are:
• Failed• Successful
Figure 354: Admin Events
Authentication EventsThis Report displays the Authentication Events detail including time, event type, severity, message, username, sourceand status.
View the report from Compliance > Events > Authentication Events.
Tabular report contains following information:
• Time: Date and time of the event.• Event Type: Type of the event. Possible event types are :
• Firewall Authentication• My Account Authentication• VPN Authentication• SSL VPN Authentication• Dial-in Authentication
• Severity: Severity level of the events. Predefined level are:
• EMERGENCY - System is not usable• ALERT - Action must be taken immediately• CRITICAL - Critical condition• ERROR - Error condition• WARNING - Warning condition

| Compliance | 382
• NOTICE - Normal but significant condition• INFORMATION - Informational• DEBUG - Debug - level messages
• Message: Message associated with event. Complete message can be viewed by placing cursor on the message.• User Name: Name of the user associated with the event.• Source: IP Address of the event generator.• Status: Status of the event. Possible status are:
• Failed• Successful
Figure 355: Authentication Events
Hosts - ATPThis report displays a comprehensive summary of host wise advanced threats in your network.
View the report from Dashboards > Security Dashboard > Hosts - ATP or from Reports > Network & Threats >Advanced Threats > Hosts - ATP.
The report is displayed using a graph as well as in a tabular format. By default, the report is displayed for the currentdate. The report date can be changed from the Date Selection Panel.
The bar graph displays the list of hosts along with number of events per host while the tabular report contains thefollowing information:
• Host (Source IP): IP Address of the source host.• Threat Count: Number of threats per source host.• Events: Total number of events per host. The number is summation of Log only and Log & Drop events.
Figure 356: Hosts-ATP

| Compliance | 383
Click the Host hyperlink in table or graph to view the Filtered ATP Reports.
Detailed View - ATPThis report provides a detailed summary of advanced threats in your network.
View the report from Reports > Network & Threats > Advanced Threats > Detailed View - ATP.
The report is displayed using a graph as well as in a tabular format. By default, the report is displayed for the currentdate. The report date can be changed from the Date Selection Panel.
The tabular report contains the following information:
• Host (Source IP): IP Address of the source host.• User: Username of the infected user.• Threat: Name of the threat.• Destination: IP Address of the infected destination.• Origin: Origin of the threat. Possible options:
• Firewall• IPS• DNS• Web• Combination of any of the above
• Events: Total number of events. The number is summation of Log only and Log & Drop events.• Action: Action performed by the Device when a threat is detected. Possible options:
• Log & Drop: The data packet is logged and dropped.• Log only: The data packet is logged.
Figure 357: Detailed View -ATP
NERC CIP v3NERC CIP v3 report is the grouping of various network security reports that helps organizations with criticalinfrastructures like ICS, Power Systems etc. to match some of the key cyber security requirements of NERC’s CIP v3standards.
To mitigate the security risks associated with critical infrastructures North American Electric Reliability Corporation(NERC) has established various standards to be followed by all users which are part of eco-system of these criticalinfrastructures.
Critical Infrastructure Protection Version 3 (CIP 001 to 009) standard is one of mandatory standards of NERC whichdeals with physical and cyber security of components which are functional in operating Bulk Power Systems.
View NERC CIP v3 reports from Compliance > NERC CIP v3.
It enables to view the following reports:
• Applications• Intrusion Source• Admin Events• Hosts - ATP• Security Heartbeat - ATP• Detailed View - Client Health• Blocked Application Users

| Compliance | 384
• Detailed View - ATP on page 229• Web Server Attacks• Web Server Virus• Blocked Applications• Virus Summary• Authentication Events• Application Users• Mail Virus by Application Type• Intrusion Attacks• FTP Virus• Web Server Users
ApplicationsThis report displays a list of Applications along with the number of hits per application and the total amount of datatransfer using that application.
View the reportdashboard from Reports > Application & Web > aApp Risks & Usage > Applications.
The report is displayed using a graph as well as in a tabular format. By default, the report is displayed for the currentdate. The report date can be changed from the Date Selection Panel.
The bar graph displays the list of applications along with the data transfer while the tabular report contains thefollowing information:
• Application/Proto: Port: Displays name of the Application as defined in the Device. If the application is notdefined in the Device then this field will display the application identifier as a combination of the protocol andport number.
• Risk: Level of risk associated with the application.• Category: Name of the associated application category.• Hits: Number of hits per application.• Bytes: Amount of data transfer through the application, in bytes.
Figure 358: Applications
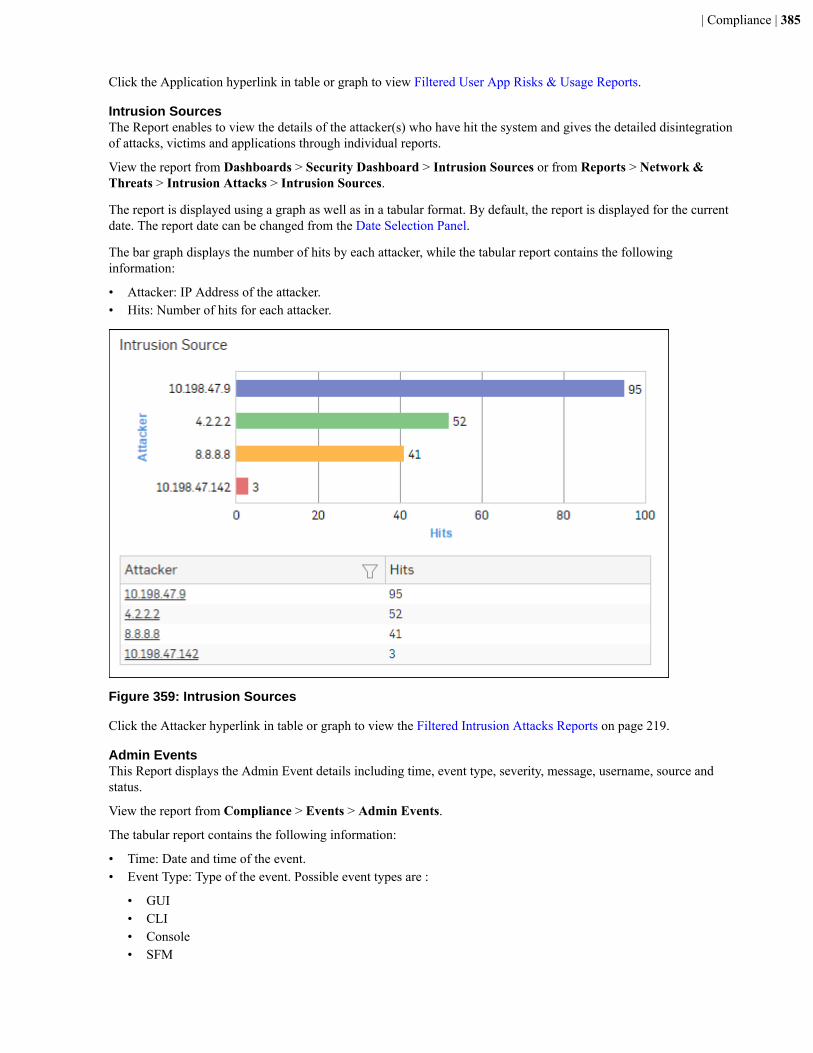
| Compliance | 385
Click the Application hyperlink in table or graph to view Filtered User App Risks & Usage Reports.
Intrusion SourcesThe Report enables to view the details of the attacker(s) who have hit the system and gives the detailed disintegrationof attacks, victims and applications through individual reports.
View the report from Dashboards > Security Dashboard > Intrusion Sources or from Reports > Network &Threats > Intrusion Attacks > Intrusion Sources.
The report is displayed using a graph as well as in a tabular format. By default, the report is displayed for the currentdate. The report date can be changed from the Date Selection Panel.
The bar graph displays the number of hits by each attacker, while the tabular report contains the followinginformation:
• Attacker: IP Address of the attacker.• Hits: Number of hits for each attacker.
Figure 359: Intrusion Sources
Click the Attacker hyperlink in table or graph to view the Filtered Intrusion Attacks Reports on page 219.
Admin EventsThis Report displays the Admin Event details including time, event type, severity, message, username, source andstatus.
View the report from Compliance > Events > Admin Events.
The tabular report contains the following information:
• Time: Date and time of the event.• Event Type: Type of the event. Possible event types are :
• GUI• CLI• Console• SFM
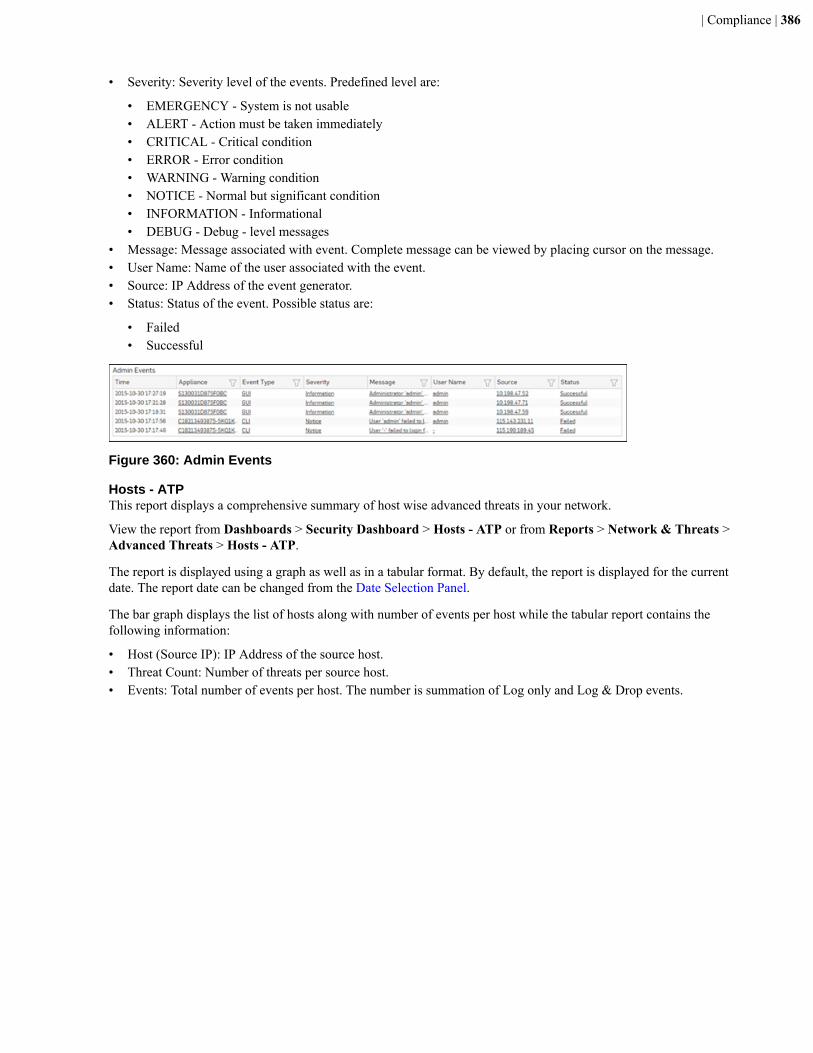
| Compliance | 386
• Severity: Severity level of the events. Predefined level are:
• EMERGENCY - System is not usable• ALERT - Action must be taken immediately• CRITICAL - Critical condition• ERROR - Error condition• WARNING - Warning condition• NOTICE - Normal but significant condition• INFORMATION - Informational• DEBUG - Debug - level messages
• Message: Message associated with event. Complete message can be viewed by placing cursor on the message.• User Name: Name of the user associated with the event.• Source: IP Address of the event generator.• Status: Status of the event. Possible status are:
• Failed• Successful
Figure 360: Admin Events
Hosts - ATPThis report displays a comprehensive summary of host wise advanced threats in your network.
View the report from Dashboards > Security Dashboard > Hosts - ATP or from Reports > Network & Threats >Advanced Threats > Hosts - ATP.
The report is displayed using a graph as well as in a tabular format. By default, the report is displayed for the currentdate. The report date can be changed from the Date Selection Panel.
The bar graph displays the list of hosts along with number of events per host while the tabular report contains thefollowing information:
• Host (Source IP): IP Address of the source host.• Threat Count: Number of threats per source host.• Events: Total number of events per host. The number is summation of Log only and Log & Drop events.
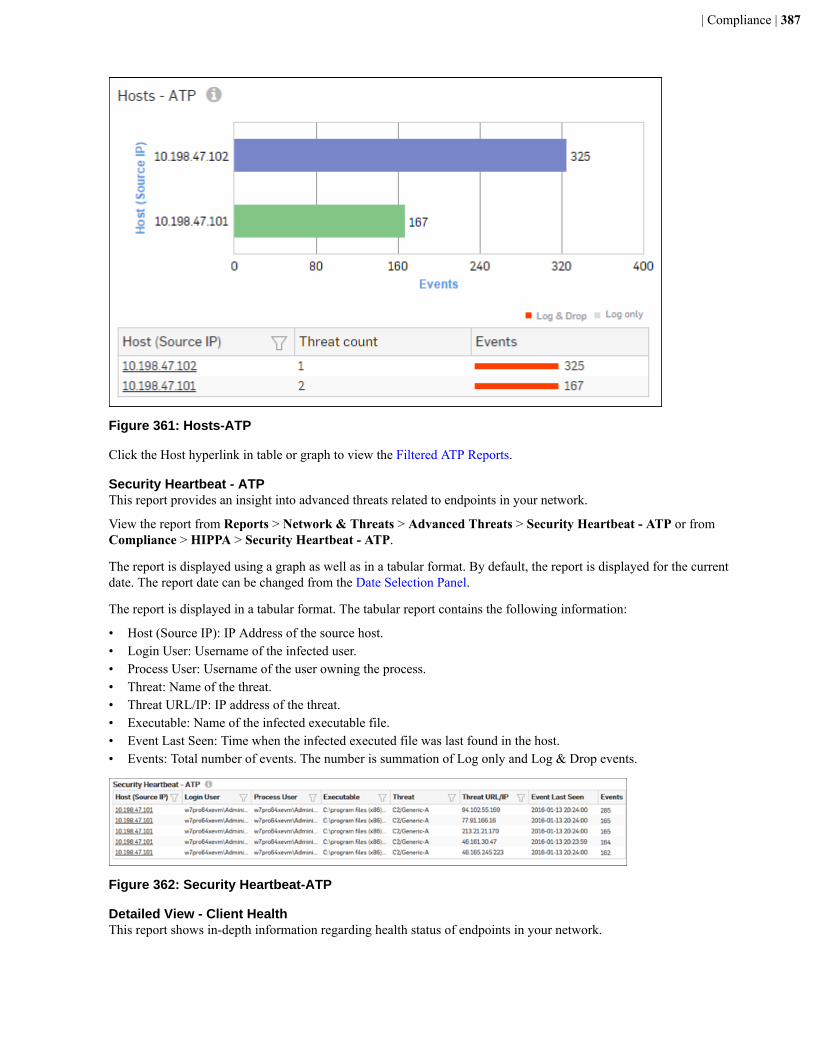
| Compliance | 387
Figure 361: Hosts-ATP
Click the Host hyperlink in table or graph to view the Filtered ATP Reports.
Security Heartbeat - ATPThis report provides an insight into advanced threats related to endpoints in your network.
View the report from Reports > Network & Threats > Advanced Threats > Security Heartbeat - ATP or fromCompliance > HIPPA > Security Heartbeat - ATP.
The report is displayed using a graph as well as in a tabular format. By default, the report is displayed for the currentdate. The report date can be changed from the Date Selection Panel.
The report is displayed in a tabular format. The tabular report contains the following information:
• Host (Source IP): IP Address of the source host.• Login User: Username of the infected user.• Process User: Username of the user owning the process.• Threat: Name of the threat.• Threat URL/IP: IP address of the threat.• Executable: Name of the infected executable file.• Event Last Seen: Time when the infected executed file was last found in the host.• Events: Total number of events. The number is summation of Log only and Log & Drop events.
Figure 362: Security Heartbeat-ATP
Detailed View - Client HealthThis report shows in-depth information regarding health status of endpoints in your network.
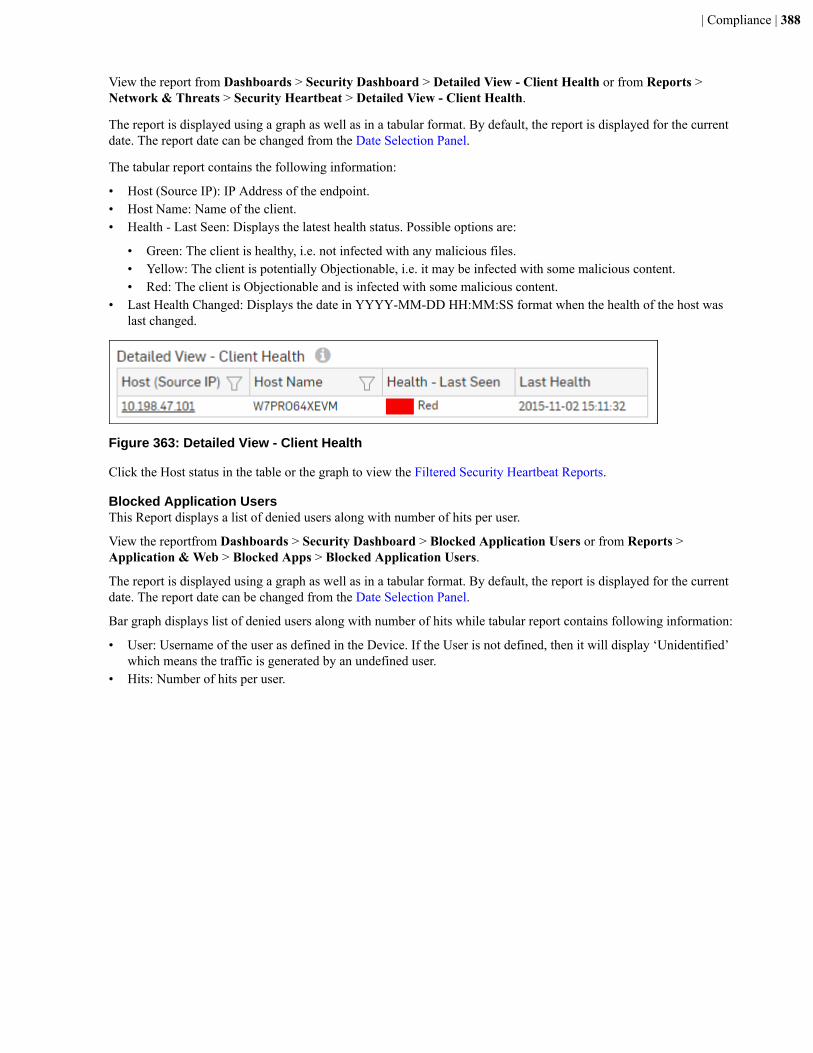
| Compliance | 388
View the report from Dashboards > Security Dashboard > Detailed View - Client Health or from Reports >Network & Threats > Security Heartbeat > Detailed View - Client Health.
The report is displayed using a graph as well as in a tabular format. By default, the report is displayed for the currentdate. The report date can be changed from the Date Selection Panel.
The tabular report contains the following information:
• Host (Source IP): IP Address of the endpoint.• Host Name: Name of the client.• Health - Last Seen: Displays the latest health status. Possible options are:
• Green: The client is healthy, i.e. not infected with any malicious files.• Yellow: The client is potentially Objectionable, i.e. it may be infected with some malicious content.• Red: The client is Objectionable and is infected with some malicious content.
• Last Health Changed: Displays the date in YYYY-MM-DD HH:MM:SS format when the health of the host waslast changed.
Figure 363: Detailed View - Client Health
Click the Host status in the table or the graph to view the Filtered Security Heartbeat Reports.
Blocked Application UsersThis Report displays a list of denied users along with number of hits per user.
View the reportfrom Dashboards > Security Dashboard > Blocked Application Users or from Reports >Application & Web > Blocked Apps > Blocked Application Users.
The report is displayed using a graph as well as in a tabular format. By default, the report is displayed for the currentdate. The report date can be changed from the Date Selection Panel.
Bar graph displays list of denied users along with number of hits while tabular report contains following information:
• User: Username of the user as defined in the Device. If the User is not defined, then it will display ‘Unidentified’which means the traffic is generated by an undefined user.
• Hits: Number of hits per user.
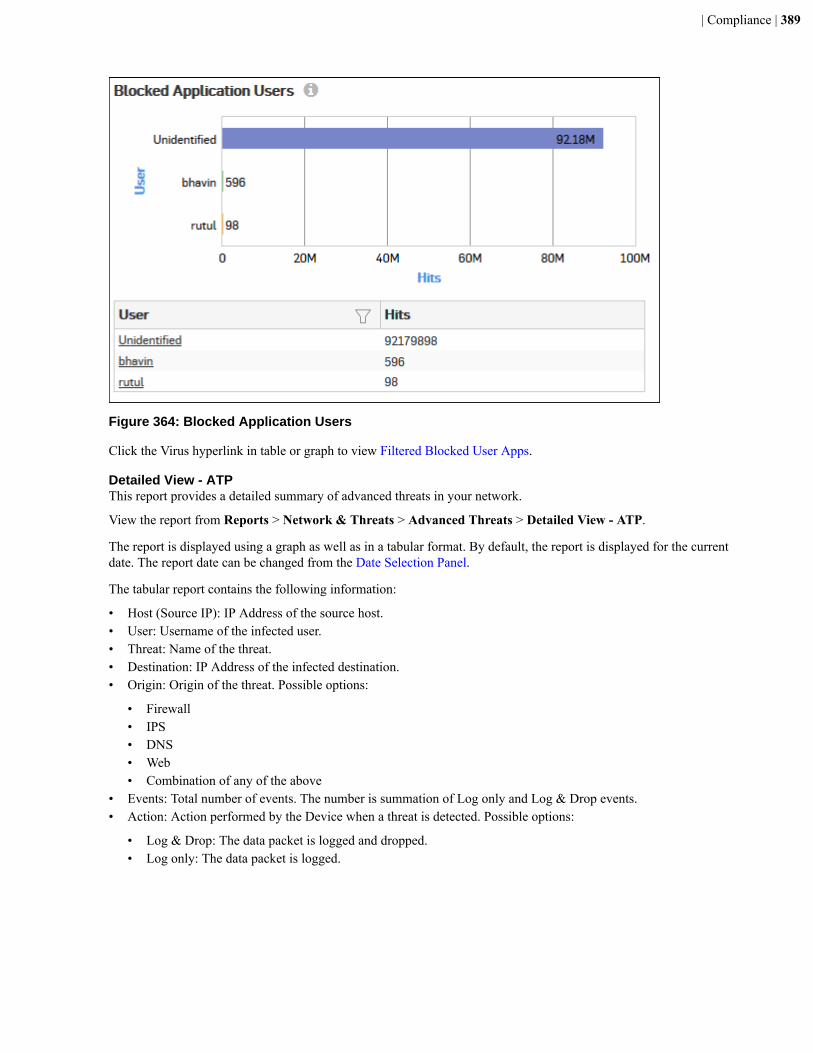
| Compliance | 389
Figure 364: Blocked Application Users
Click the Virus hyperlink in table or graph to view Filtered Blocked User Apps.
Detailed View - ATPThis report provides a detailed summary of advanced threats in your network.
View the report from Reports > Network & Threats > Advanced Threats > Detailed View - ATP.
The report is displayed using a graph as well as in a tabular format. By default, the report is displayed for the currentdate. The report date can be changed from the Date Selection Panel.
The tabular report contains the following information:
• Host (Source IP): IP Address of the source host.• User: Username of the infected user.• Threat: Name of the threat.• Destination: IP Address of the infected destination.• Origin: Origin of the threat. Possible options:
• Firewall• IPS• DNS• Web• Combination of any of the above
• Events: Total number of events. The number is summation of Log only and Log & Drop events.• Action: Action performed by the Device when a threat is detected. Possible options:
• Log & Drop: The data packet is logged and dropped.• Log only: The data packet is logged.
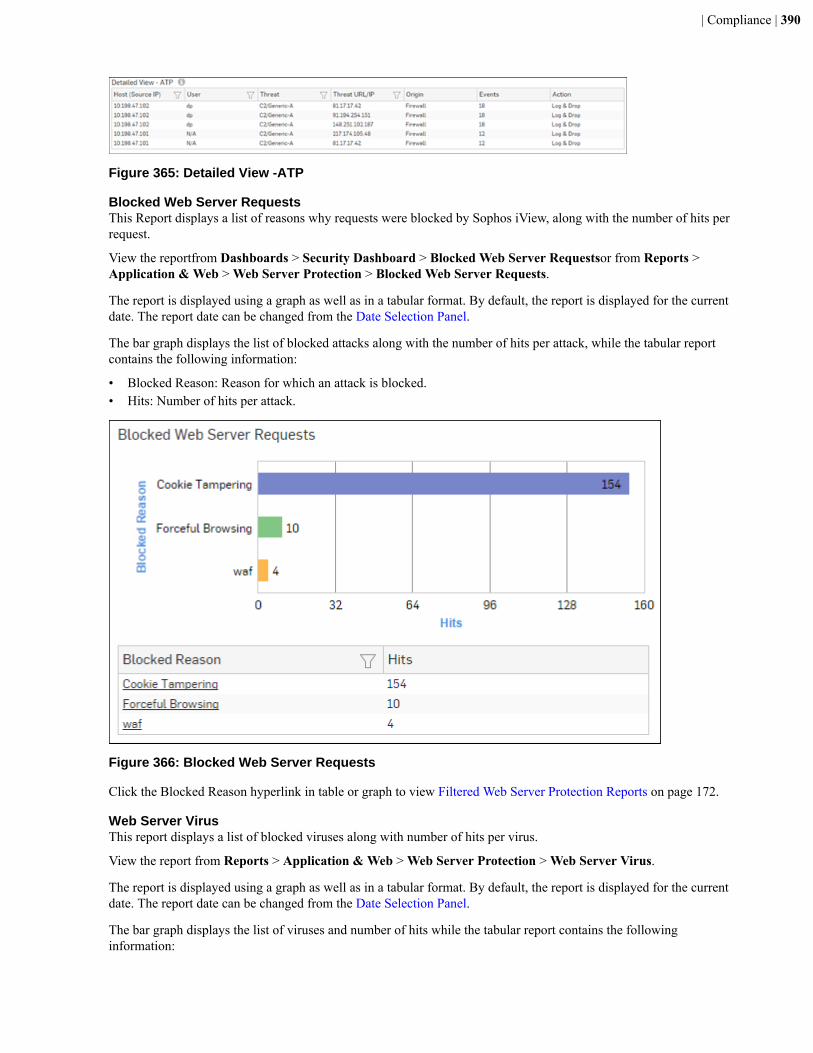
| Compliance | 390
Figure 365: Detailed View -ATP
Blocked Web Server RequestsThis Report displays a list of reasons why requests were blocked by Sophos iView, along with the number of hits perrequest.
View the reportfrom Dashboards > Security Dashboard > Blocked Web Server Requestsor from Reports >Application & Web > Web Server Protection > Blocked Web Server Requests.
The report is displayed using a graph as well as in a tabular format. By default, the report is displayed for the currentdate. The report date can be changed from the Date Selection Panel.
The bar graph displays the list of blocked attacks along with the number of hits per attack, while the tabular reportcontains the following information:
• Blocked Reason: Reason for which an attack is blocked.• Hits: Number of hits per attack.
Figure 366: Blocked Web Server Requests
Click the Blocked Reason hyperlink in table or graph to view Filtered Web Server Protection Reports on page 172.
Web Server VirusThis report displays a list of blocked viruses along with number of hits per virus.
View the report from Reports > Application & Web > Web Server Protection > Web Server Virus.
The report is displayed using a graph as well as in a tabular format. By default, the report is displayed for the currentdate. The report date can be changed from the Date Selection Panel.
The bar graph displays the list of viruses and number of hits while the tabular report contains the followinginformation:
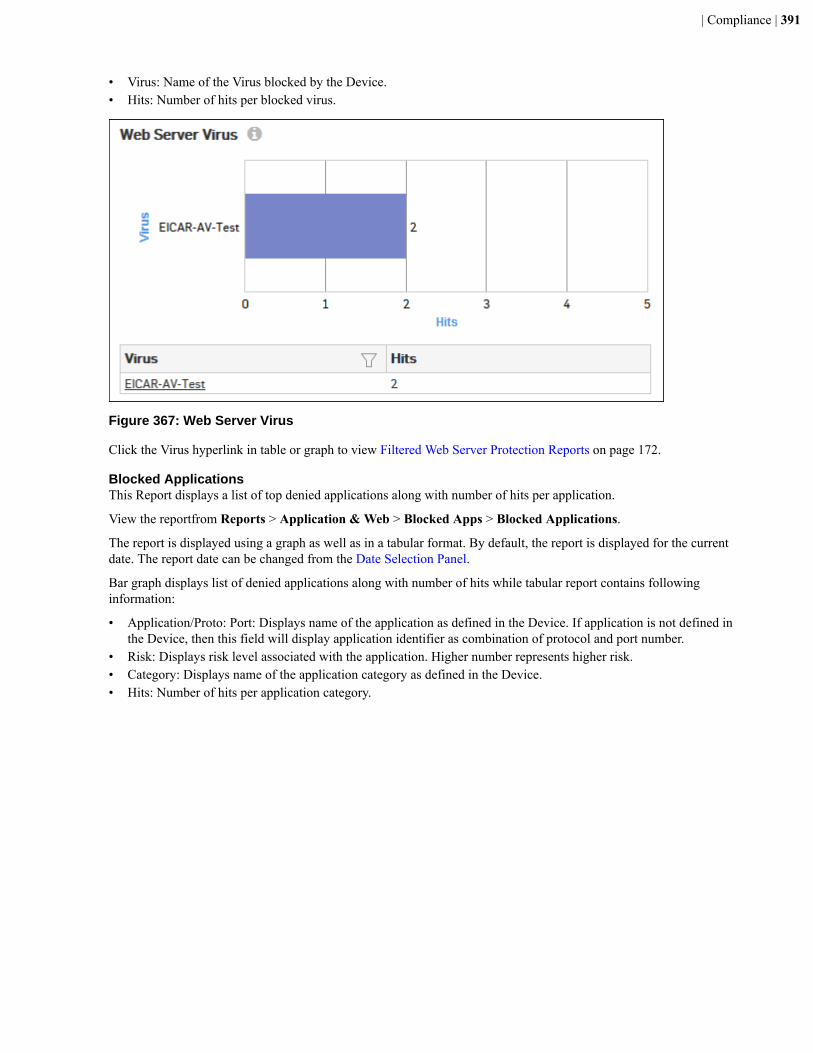
| Compliance | 391
• Virus: Name of the Virus blocked by the Device.• Hits: Number of hits per blocked virus.
Figure 367: Web Server Virus
Click the Virus hyperlink in table or graph to view Filtered Web Server Protection Reports on page 172.
Blocked ApplicationsThis Report displays a list of top denied applications along with number of hits per application.
View the reportfrom Reports > Application & Web > Blocked Apps > Blocked Applications.
The report is displayed using a graph as well as in a tabular format. By default, the report is displayed for the currentdate. The report date can be changed from the Date Selection Panel.
Bar graph displays list of denied applications along with number of hits while tabular report contains followinginformation:
• Application/Proto: Port: Displays name of the application as defined in the Device. If application is not defined inthe Device, then this field will display application identifier as combination of protocol and port number.
• Risk: Displays risk level associated with the application. Higher number represents higher risk.• Category: Displays name of the application category as defined in the Device.• Hits: Number of hits per application category.
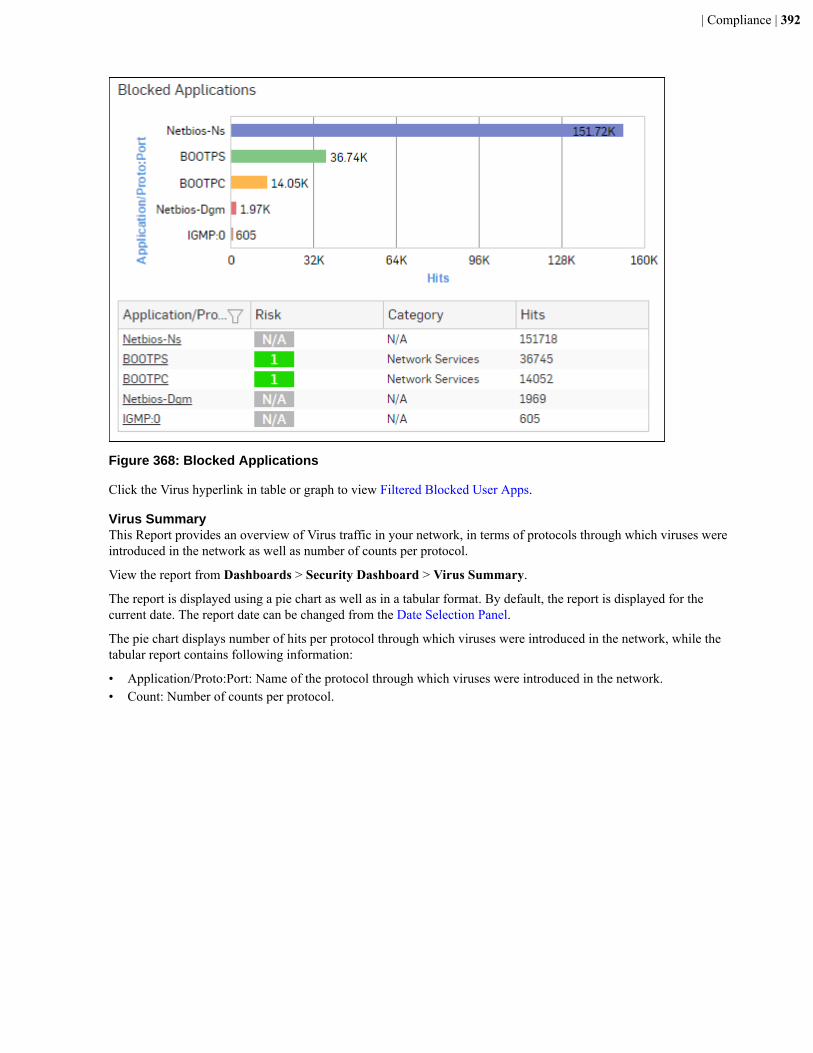
| Compliance | 392
Figure 368: Blocked Applications
Click the Virus hyperlink in table or graph to view Filtered Blocked User Apps.
Virus SummaryThis Report provides an overview of Virus traffic in your network, in terms of protocols through which viruses wereintroduced in the network as well as number of counts per protocol.
View the report from Dashboards > Security Dashboard > Virus Summary.
The report is displayed using a pie chart as well as in a tabular format. By default, the report is displayed for thecurrent date. The report date can be changed from the Date Selection Panel.
The pie chart displays number of hits per protocol through which viruses were introduced in the network, while thetabular report contains following information:
• Application/Proto:Port: Name of the protocol through which viruses were introduced in the network.• Count: Number of counts per protocol.
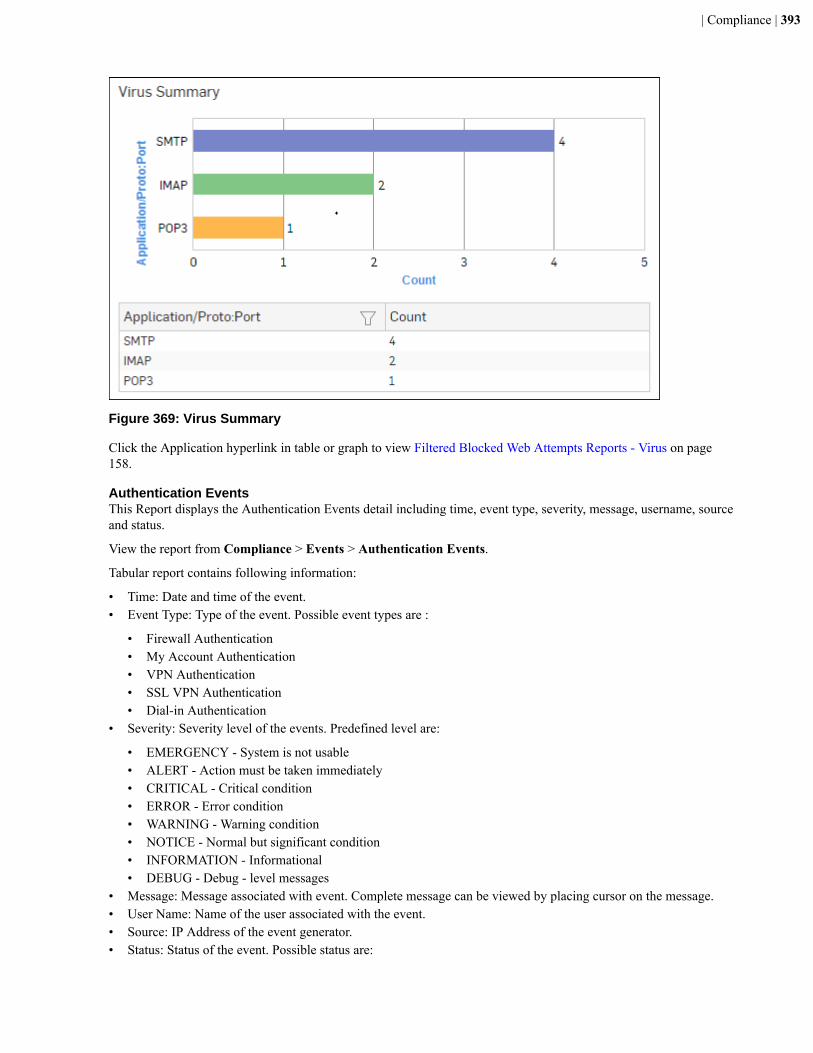
| Compliance | 393
Figure 369: Virus Summary
Click the Application hyperlink in table or graph to view Filtered Blocked Web Attempts Reports - Virus on page158.
Authentication EventsThis Report displays the Authentication Events detail including time, event type, severity, message, username, sourceand status.
View the report from Compliance > Events > Authentication Events.
Tabular report contains following information:
• Time: Date and time of the event.• Event Type: Type of the event. Possible event types are :
• Firewall Authentication• My Account Authentication• VPN Authentication• SSL VPN Authentication• Dial-in Authentication
• Severity: Severity level of the events. Predefined level are:
• EMERGENCY - System is not usable• ALERT - Action must be taken immediately• CRITICAL - Critical condition• ERROR - Error condition• WARNING - Warning condition• NOTICE - Normal but significant condition• INFORMATION - Informational• DEBUG - Debug - level messages
• Message: Message associated with event. Complete message can be viewed by placing cursor on the message.• User Name: Name of the user associated with the event.• Source: IP Address of the event generator.• Status: Status of the event. Possible status are:
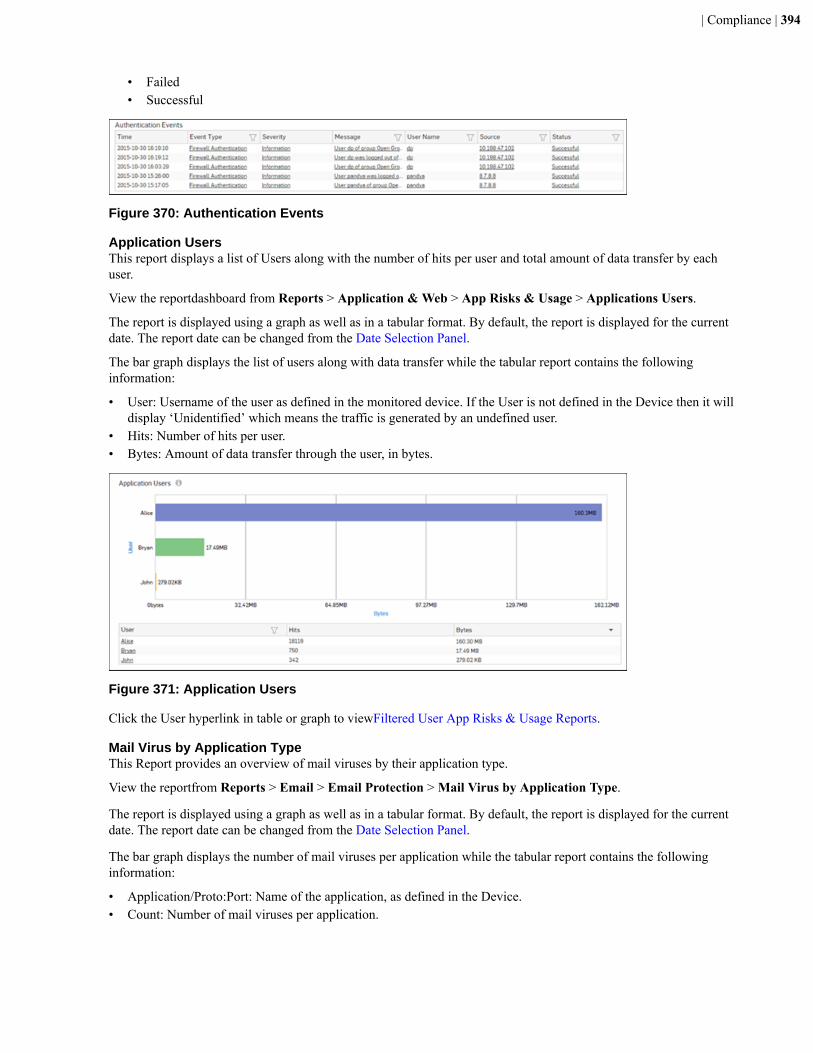
| Compliance | 394
• Failed• Successful
Figure 370: Authentication Events
Application UsersThis report displays a list of Users along with the number of hits per user and total amount of data transfer by eachuser.
View the reportdashboard from Reports > Application & Web > App Risks & Usage > Applications Users.
The report is displayed using a graph as well as in a tabular format. By default, the report is displayed for the currentdate. The report date can be changed from the Date Selection Panel.
The bar graph displays the list of users along with data transfer while the tabular report contains the followinginformation:
• User: Username of the user as defined in the monitored device. If the User is not defined in the Device then it willdisplay ‘Unidentified’ which means the traffic is generated by an undefined user.
• Hits: Number of hits per user.• Bytes: Amount of data transfer through the user, in bytes.
Figure 371: Application Users
Click the User hyperlink in table or graph to viewFiltered User App Risks & Usage Reports.
Mail Virus by Application TypeThis Report provides an overview of mail viruses by their application type.
View the reportfrom Reports > Email > Email Protection > Mail Virus by Application Type.
The report is displayed using a graph as well as in a tabular format. By default, the report is displayed for the currentdate. The report date can be changed from the Date Selection Panel.
The bar graph displays the number of mail viruses per application while the tabular report contains the followinginformation:
• Application/Proto:Port: Name of the application, as defined in the Device.• Count: Number of mail viruses per application.

| Compliance | 395
Figure 372: Mail Virus by Application Type
Click the Application hyperlink in the table or graph to view the Filtered Virus Reports.
Intrusion AttacksThe Report enables to view the details of the attack that has hit the system and gives the detailed disintegration ofattackers, victims and applications through individual reports.
View the report from Reports > Network & Threats > Intrusion Attacks > Intrusion Attacks.
The report is displayed using a graph as well as in a tabular format. By default, the report is displayed for the currentdate. The report date can be changed from the Date Selection Panel.
Note: You can view this report from Security Dashboard as well.
The bar graph displays the number of hits under each attack, while the tabular report contains the followinginformation:
• Attack: Name of the attack launched.• Hits: Number of hits for each attack.
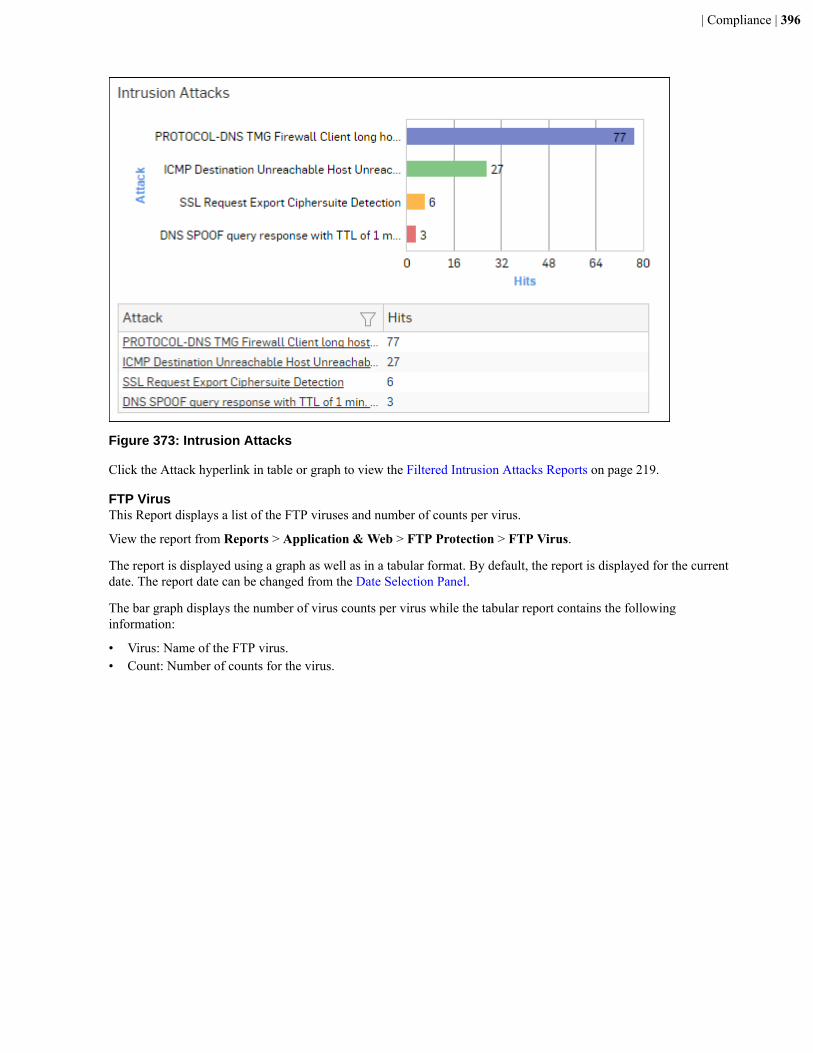
| Compliance | 396
Figure 373: Intrusion Attacks
Click the Attack hyperlink in table or graph to view the Filtered Intrusion Attacks Reports on page 219.
FTP VirusThis Report displays a list of the FTP viruses and number of counts per virus.
View the report from Reports > Application & Web > FTP Protection > FTP Virus.
The report is displayed using a graph as well as in a tabular format. By default, the report is displayed for the currentdate. The report date can be changed from the Date Selection Panel.
The bar graph displays the number of virus counts per virus while the tabular report contains the followinginformation:
• Virus: Name of the FTP virus.• Count: Number of counts for the virus.
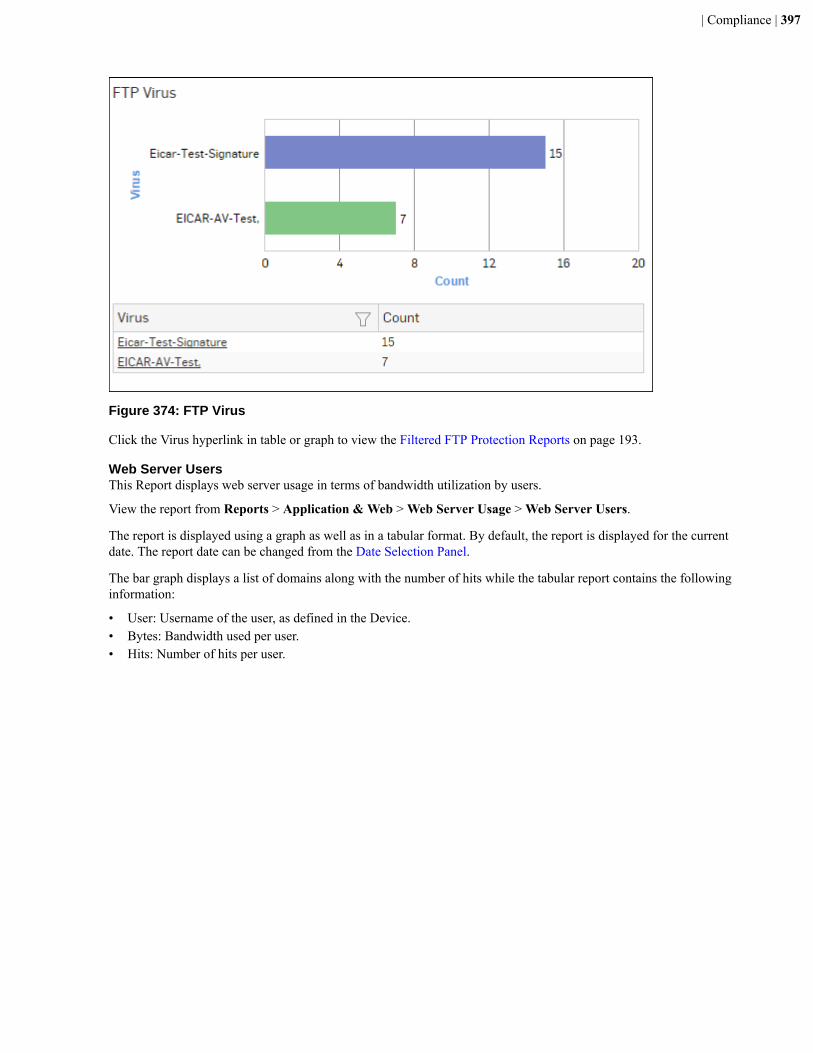
| Compliance | 397
Figure 374: FTP Virus
Click the Virus hyperlink in table or graph to view the Filtered FTP Protection Reports on page 193.
Web Server UsersThis Report displays web server usage in terms of bandwidth utilization by users.
View the report from Reports > Application & Web > Web Server Usage > Web Server Users.
The report is displayed using a graph as well as in a tabular format. By default, the report is displayed for the currentdate. The report date can be changed from the Date Selection Panel.
The bar graph displays a list of domains along with the number of hits while the tabular report contains the followinginformation:
• User: Username of the user, as defined in the Device.• Bytes: Bandwidth used per user.• Hits: Number of hits per user.
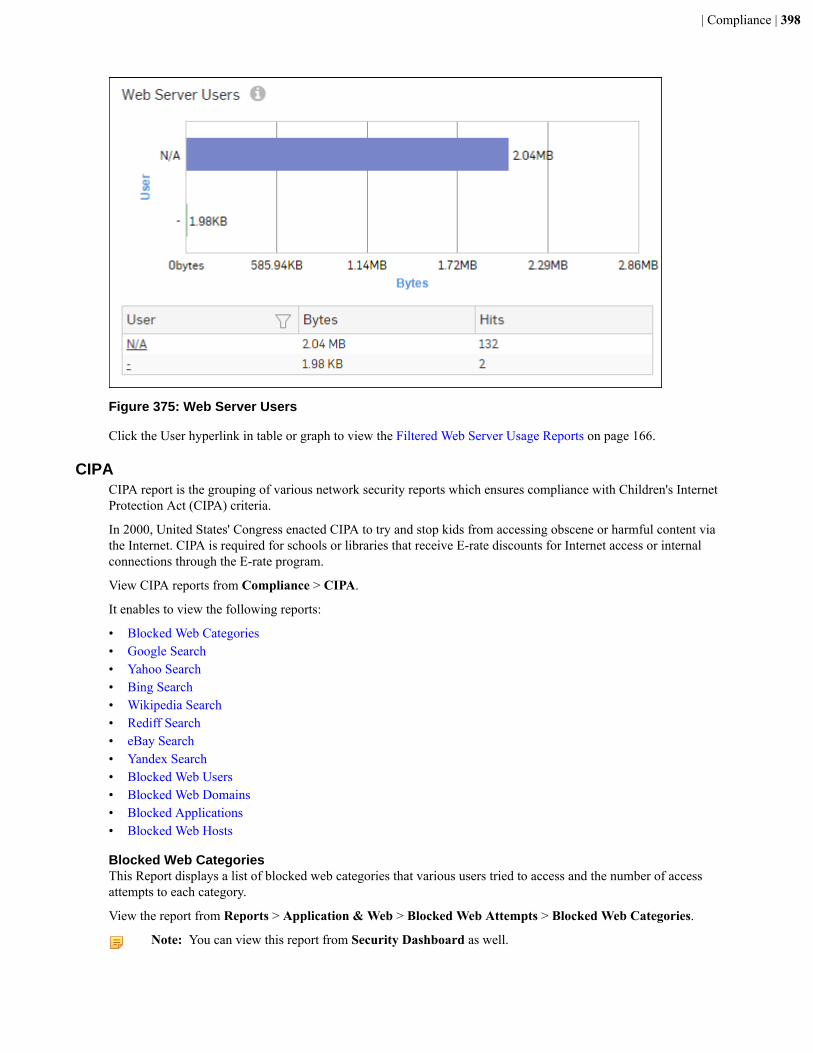
| Compliance | 398
Figure 375: Web Server Users
Click the User hyperlink in table or graph to view the Filtered Web Server Usage Reports on page 166.
CIPACIPA report is the grouping of various network security reports which ensures compliance with Children's InternetProtection Act (CIPA) criteria.
In 2000, United States' Congress enacted CIPA to try and stop kids from accessing obscene or harmful content viathe Internet. CIPA is required for schools or libraries that receive E-rate discounts for Internet access or internalconnections through the E-rate program.
View CIPA reports from Compliance > CIPA.
It enables to view the following reports:
• Blocked Web Categories• Google Search• Yahoo Search• Bing Search• Wikipedia Search• Rediff Search• eBay Search• Yandex Search• Blocked Web Users• Blocked Web Domains• Blocked Applications• Blocked Web Hosts
Blocked Web CategoriesThis Report displays a list of blocked web categories that various users tried to access and the number of accessattempts to each category.
View the report from Reports > Application & Web > Blocked Web Attempts > Blocked Web Categories.
Note: You can view this report from Security Dashboard as well.
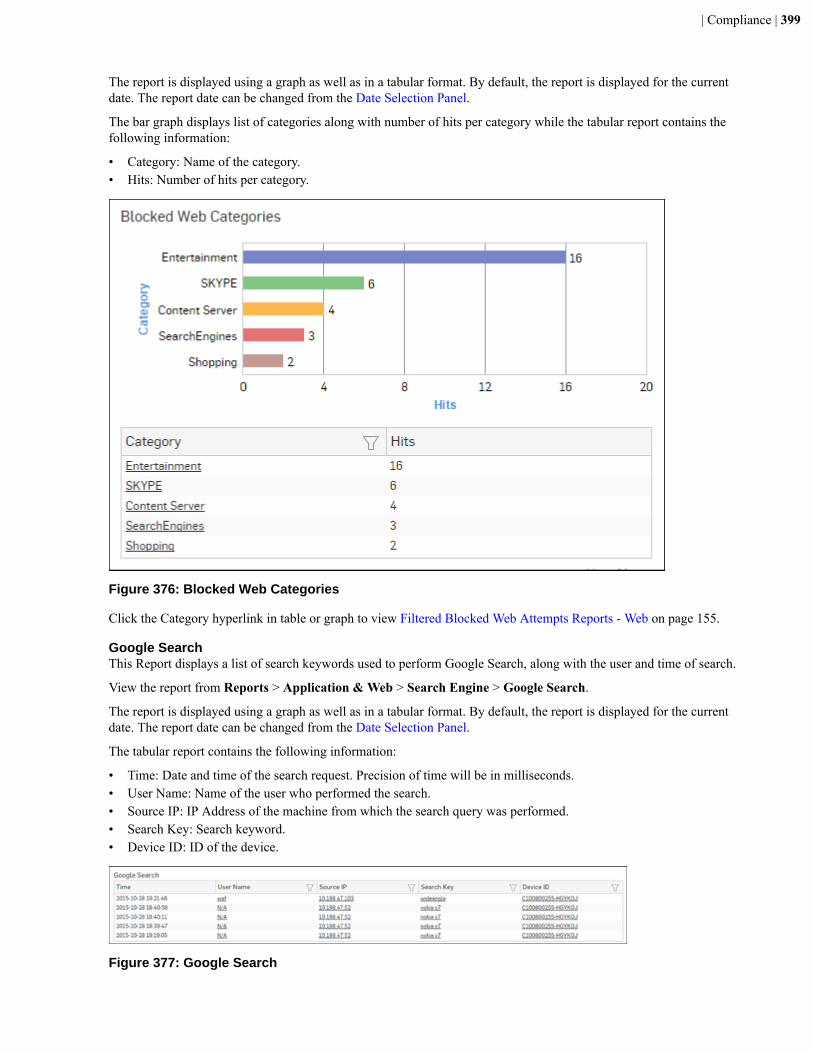
| Compliance | 399
The report is displayed using a graph as well as in a tabular format. By default, the report is displayed for the currentdate. The report date can be changed from the Date Selection Panel.
The bar graph displays list of categories along with number of hits per category while the tabular report contains thefollowing information:
• Category: Name of the category.• Hits: Number of hits per category.
Figure 376: Blocked Web Categories
Click the Category hyperlink in table or graph to view Filtered Blocked Web Attempts Reports - Web on page 155.
Google SearchThis Report displays a list of search keywords used to perform Google Search, along with the user and time of search.
View the report from Reports > Application & Web > Search Engine > Google Search.
The report is displayed using a graph as well as in a tabular format. By default, the report is displayed for the currentdate. The report date can be changed from the Date Selection Panel.
The tabular report contains the following information:
• Time: Date and time of the search request. Precision of time will be in milliseconds.• User Name: Name of the user who performed the search.• Source IP: IP Address of the machine from which the search query was performed.• Search Key: Search keyword.• Device ID: ID of the device.
Figure 377: Google Search
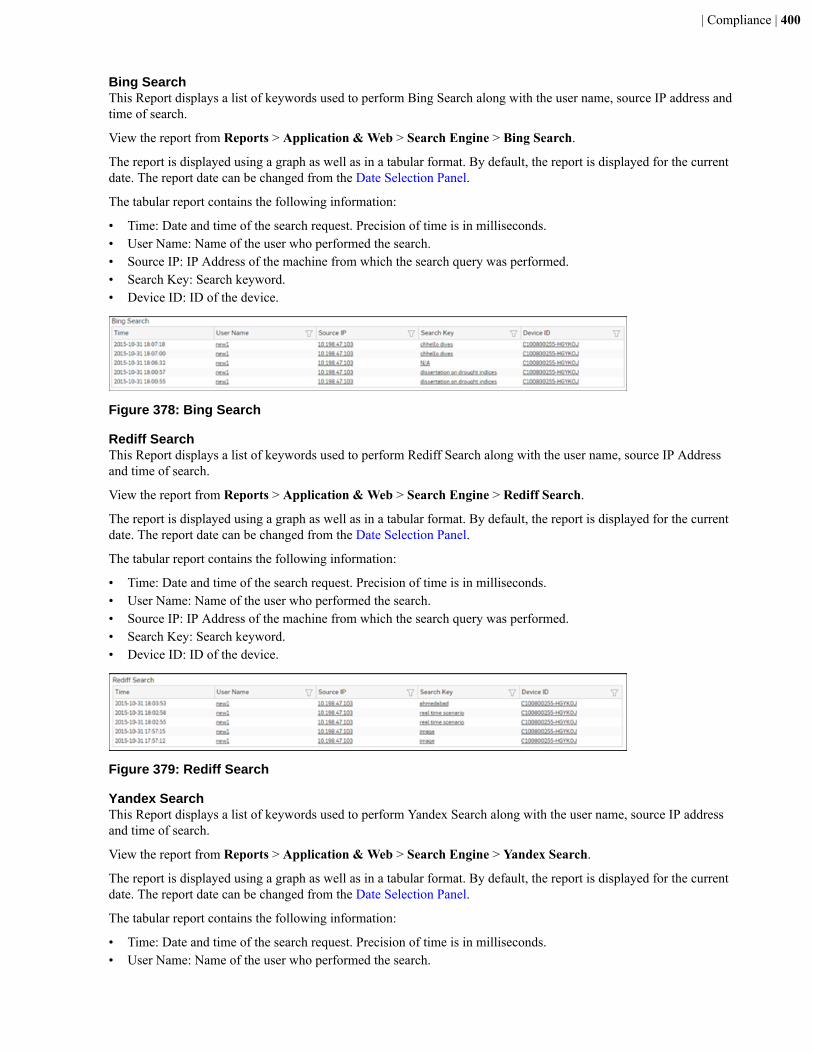
| Compliance | 400
Bing SearchThis Report displays a list of keywords used to perform Bing Search along with the user name, source IP address andtime of search.
View the report from Reports > Application & Web > Search Engine > Bing Search.
The report is displayed using a graph as well as in a tabular format. By default, the report is displayed for the currentdate. The report date can be changed from the Date Selection Panel.
The tabular report contains the following information:
• Time: Date and time of the search request. Precision of time is in milliseconds.• User Name: Name of the user who performed the search.• Source IP: IP Address of the machine from which the search query was performed.• Search Key: Search keyword.• Device ID: ID of the device.
Figure 378: Bing Search
Rediff SearchThis Report displays a list of keywords used to perform Rediff Search along with the user name, source IP Addressand time of search.
View the report from Reports > Application & Web > Search Engine > Rediff Search.
The report is displayed using a graph as well as in a tabular format. By default, the report is displayed for the currentdate. The report date can be changed from the Date Selection Panel.
The tabular report contains the following information:
• Time: Date and time of the search request. Precision of time is in milliseconds.• User Name: Name of the user who performed the search.• Source IP: IP Address of the machine from which the search query was performed.• Search Key: Search keyword.• Device ID: ID of the device.
Figure 379: Rediff Search
Yandex SearchThis Report displays a list of keywords used to perform Yandex Search along with the user name, source IP addressand time of search.
View the report from Reports > Application & Web > Search Engine > Yandex Search.
The report is displayed using a graph as well as in a tabular format. By default, the report is displayed for the currentdate. The report date can be changed from the Date Selection Panel.
The tabular report contains the following information:
• Time: Date and time of the search request. Precision of time is in milliseconds.• User Name: Name of the user who performed the search.
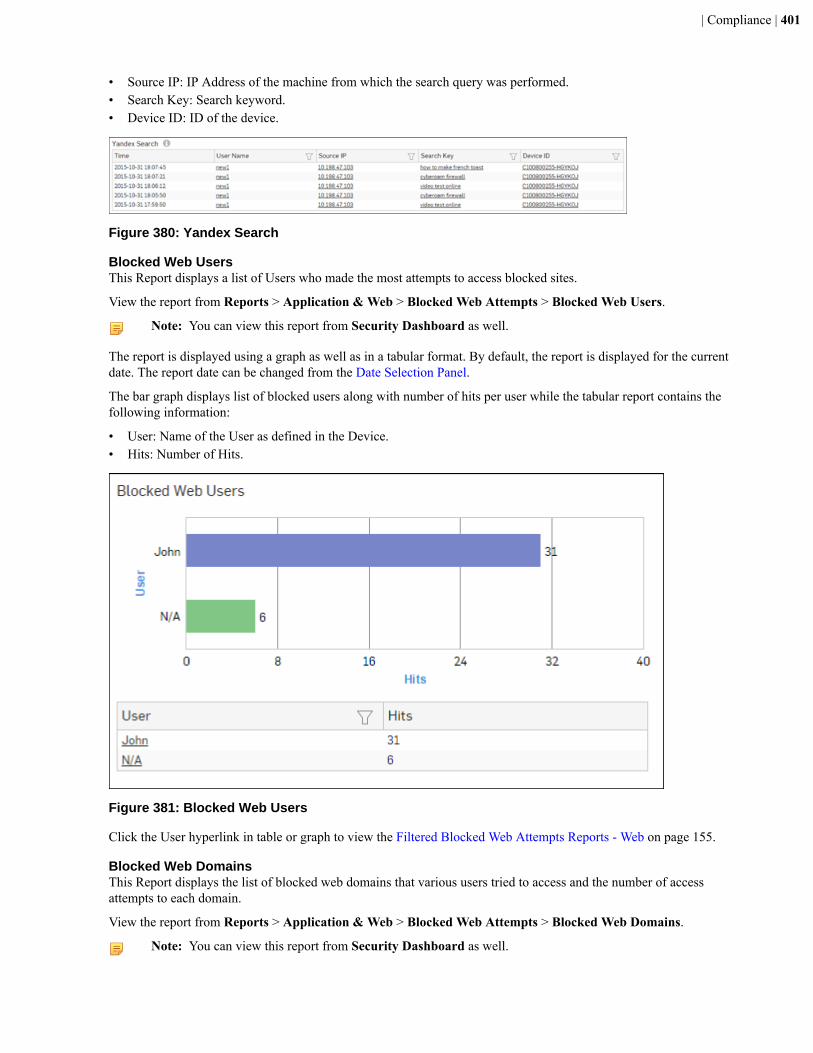
| Compliance | 401
• Source IP: IP Address of the machine from which the search query was performed.• Search Key: Search keyword.• Device ID: ID of the device.
Figure 380: Yandex Search
Blocked Web UsersThis Report displays a list of Users who made the most attempts to access blocked sites.
View the report from Reports > Application & Web > Blocked Web Attempts > Blocked Web Users.
Note: You can view this report from Security Dashboard as well.
The report is displayed using a graph as well as in a tabular format. By default, the report is displayed for the currentdate. The report date can be changed from the Date Selection Panel.
The bar graph displays list of blocked users along with number of hits per user while the tabular report contains thefollowing information:
• User: Name of the User as defined in the Device.• Hits: Number of Hits.
Figure 381: Blocked Web Users
Click the User hyperlink in table or graph to view the Filtered Blocked Web Attempts Reports - Web on page 155.
Blocked Web DomainsThis Report displays the list of blocked web domains that various users tried to access and the number of accessattempts to each domain.
View the report from Reports > Application & Web > Blocked Web Attempts > Blocked Web Domains.
Note: You can view this report from Security Dashboard as well.
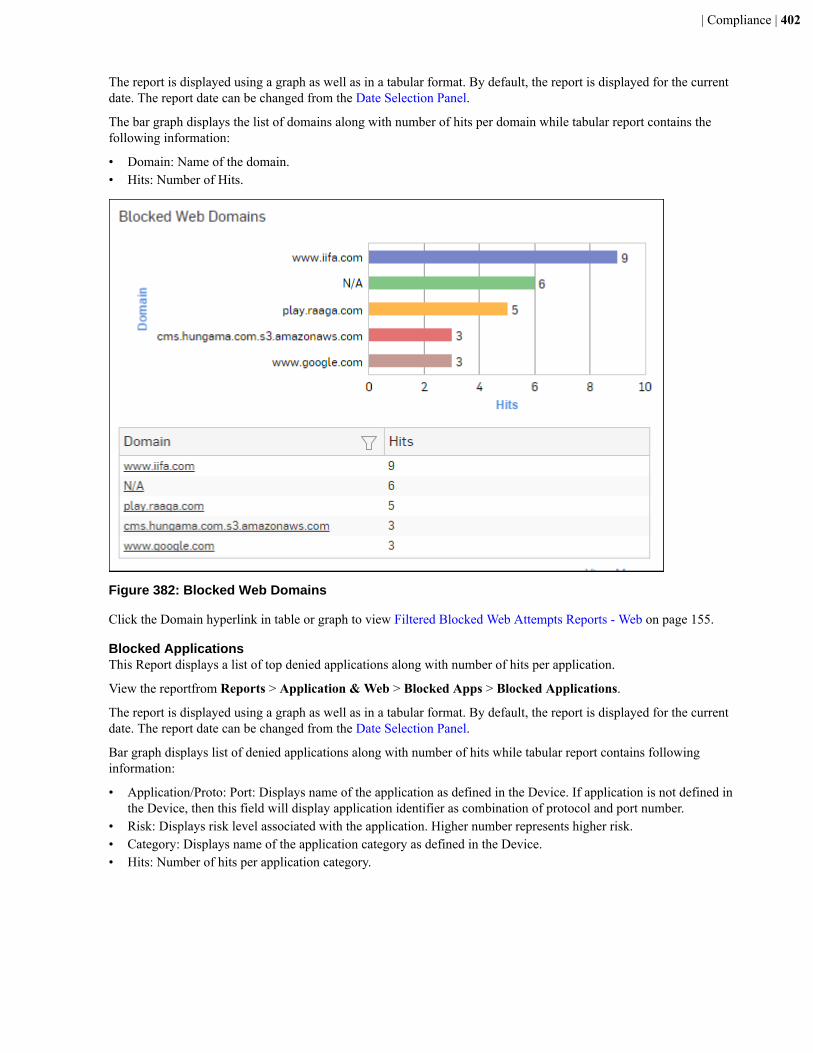
| Compliance | 402
The report is displayed using a graph as well as in a tabular format. By default, the report is displayed for the currentdate. The report date can be changed from the Date Selection Panel.
The bar graph displays the list of domains along with number of hits per domain while tabular report contains thefollowing information:
• Domain: Name of the domain.• Hits: Number of Hits.
Figure 382: Blocked Web Domains
Click the Domain hyperlink in table or graph to view Filtered Blocked Web Attempts Reports - Web on page 155.
Blocked ApplicationsThis Report displays a list of top denied applications along with number of hits per application.
View the reportfrom Reports > Application & Web > Blocked Apps > Blocked Applications.
The report is displayed using a graph as well as in a tabular format. By default, the report is displayed for the currentdate. The report date can be changed from the Date Selection Panel.
Bar graph displays list of denied applications along with number of hits while tabular report contains followinginformation:
• Application/Proto: Port: Displays name of the application as defined in the Device. If application is not defined inthe Device, then this field will display application identifier as combination of protocol and port number.
• Risk: Displays risk level associated with the application. Higher number represents higher risk.• Category: Displays name of the application category as defined in the Device.• Hits: Number of hits per application category.
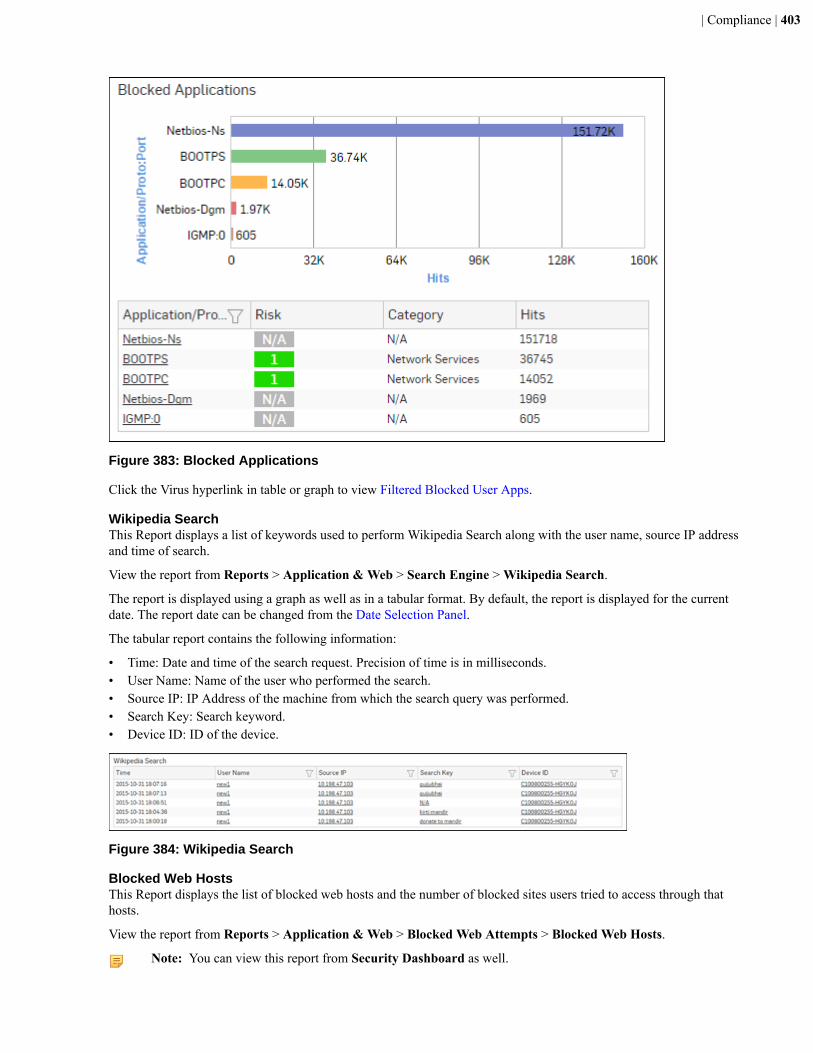
| Compliance | 403
Figure 383: Blocked Applications
Click the Virus hyperlink in table or graph to view Filtered Blocked User Apps.
Wikipedia SearchThis Report displays a list of keywords used to perform Wikipedia Search along with the user name, source IP addressand time of search.
View the report from Reports > Application & Web > Search Engine > Wikipedia Search.
The report is displayed using a graph as well as in a tabular format. By default, the report is displayed for the currentdate. The report date can be changed from the Date Selection Panel.
The tabular report contains the following information:
• Time: Date and time of the search request. Precision of time is in milliseconds.• User Name: Name of the user who performed the search.• Source IP: IP Address of the machine from which the search query was performed.• Search Key: Search keyword.• Device ID: ID of the device.
Figure 384: Wikipedia Search
Blocked Web HostsThis Report displays the list of blocked web hosts and the number of blocked sites users tried to access through thathosts.
View the report from Reports > Application & Web > Blocked Web Attempts > Blocked Web Hosts.
Note: You can view this report from Security Dashboard as well.
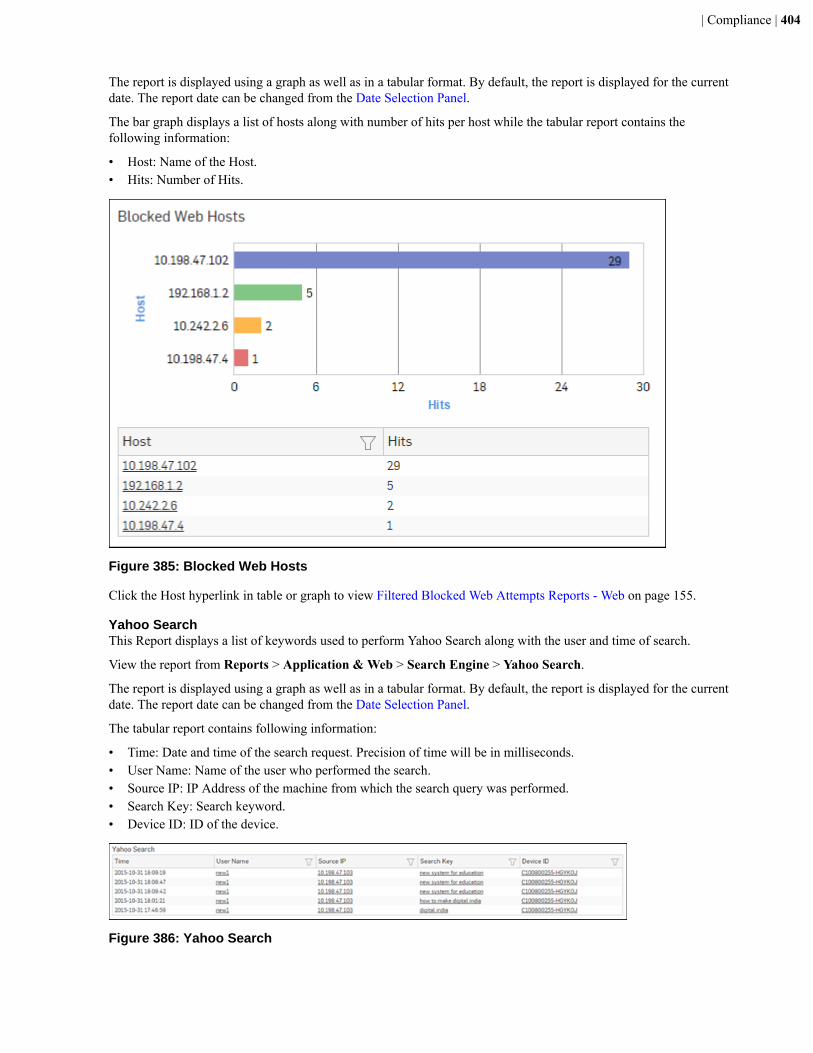
| Compliance | 404
The report is displayed using a graph as well as in a tabular format. By default, the report is displayed for the currentdate. The report date can be changed from the Date Selection Panel.
The bar graph displays a list of hosts along with number of hits per host while the tabular report contains thefollowing information:
• Host: Name of the Host.• Hits: Number of Hits.
Figure 385: Blocked Web Hosts
Click the Host hyperlink in table or graph to view Filtered Blocked Web Attempts Reports - Web on page 155.
Yahoo SearchThis Report displays a list of keywords used to perform Yahoo Search along with the user and time of search.
View the report from Reports > Application & Web > Search Engine > Yahoo Search.
The report is displayed using a graph as well as in a tabular format. By default, the report is displayed for the currentdate. The report date can be changed from the Date Selection Panel.
The tabular report contains following information:
• Time: Date and time of the search request. Precision of time will be in milliseconds.• User Name: Name of the user who performed the search.• Source IP: IP Address of the machine from which the search query was performed.• Search Key: Search keyword.• Device ID: ID of the device.
Figure 386: Yahoo Search

| Compliance | 405
eBay SearchThis Report displays a list of keywords used to perform eBay Search along with the user name, source IP address andtime of search.
View the report from Reports > Application & Web > Search Engine > eBay Search.
The report is displayed using a graph as well as in a tabular format. By default, the report is displayed for the currentdate. The report date can be changed from the Date Selection Panel.
The tabular report contains the following information:
• Time: Date and time of the search request. Precision of time is in milliseconds.• User Name: Name of the user who performed the search.• Source IP: IP Address of the machine from which the search query was performed.• Search Key: Search keyword.• Device ID: ID of the device.
Figure 387: eBay Search
EventsEvents provide a snapshot of the network events along with their severity. It helps identify events which are critical tothe network.
These reports can help assessing risk on the network and help to take corrective action.
View Event reports from Compliance > Events.
It enables to view below event details:
• Event Summary• Admin Events• Authentication Events• System Events
Event SummaryThis Report displays the list of Events along with the number of counts with the details event.
View the report from Compliance > Events > Event Summary.
The report is displayed using a graph as well as in a tabular format.By default, the report is displayed for the current date. The report date can be changed from the top most row of thepage.
The Bar graph displays the number of counts per event while the tabular report contains the following information:
• Severity: Severity level of the events. Predefined level are:
• EMERGENCY - System is not usable• ALERT - Action must be taken immediately• CRITICAL - Critical condition• ERROR - Error condition• WARNING - Warning condition• NOTICE - Normal but significant condition• INFORMATION - Informational• DEBUG - Debug - level messages
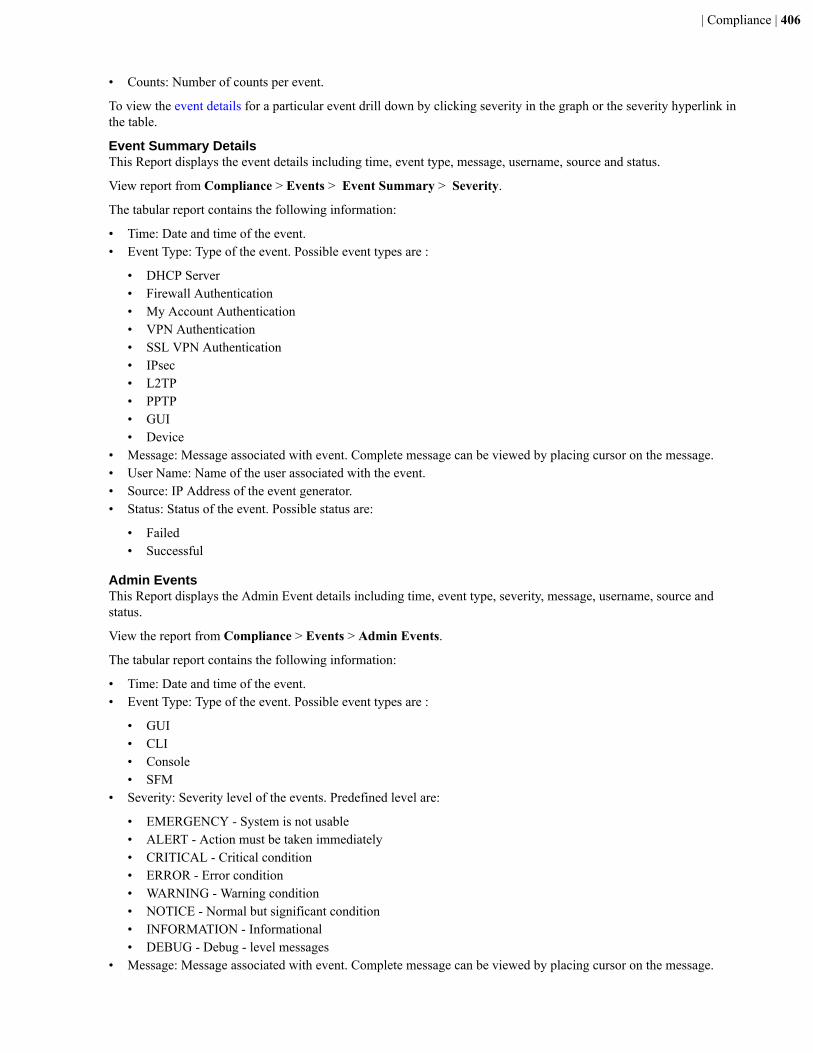
| Compliance | 406
• Counts: Number of counts per event.
To view the event details for a particular event drill down by clicking severity in the graph or the severity hyperlink inthe table.
Event Summary DetailsThis Report displays the event details including time, event type, message, username, source and status.
View report from Compliance > Events > Event Summary > Severity.
The tabular report contains the following information:
• Time: Date and time of the event.• Event Type: Type of the event. Possible event types are :
• DHCP Server• Firewall Authentication• My Account Authentication• VPN Authentication• SSL VPN Authentication• IPsec• L2TP• PPTP• GUI• Device
• Message: Message associated with event. Complete message can be viewed by placing cursor on the message.• User Name: Name of the user associated with the event.• Source: IP Address of the event generator.• Status: Status of the event. Possible status are:
• Failed• Successful
Admin EventsThis Report displays the Admin Event details including time, event type, severity, message, username, source andstatus.
View the report from Compliance > Events > Admin Events.
The tabular report contains the following information:
• Time: Date and time of the event.• Event Type: Type of the event. Possible event types are :
• GUI• CLI• Console• SFM
• Severity: Severity level of the events. Predefined level are:
• EMERGENCY - System is not usable• ALERT - Action must be taken immediately• CRITICAL - Critical condition• ERROR - Error condition• WARNING - Warning condition• NOTICE - Normal but significant condition• INFORMATION - Informational• DEBUG - Debug - level messages
• Message: Message associated with event. Complete message can be viewed by placing cursor on the message.

| Compliance | 407
• User Name: Name of the user associated with the event.• Source: IP Address of the event generator.• Status: Status of the event. Possible status are:
• Failed• Successful
Figure 388: Admin Events
Authentication EventsThis Report displays the Authentication Events detail including time, event type, severity, message, username, sourceand status.
View the report from Compliance > Events > Authentication Events.
Tabular report contains following information:
• Time: Date and time of the event.• Event Type: Type of the event. Possible event types are :
• Firewall Authentication• My Account Authentication• VPN Authentication• SSL VPN Authentication• Dial-in Authentication
• Severity: Severity level of the events. Predefined level are:
• EMERGENCY - System is not usable• ALERT - Action must be taken immediately• CRITICAL - Critical condition• ERROR - Error condition• WARNING - Warning condition• NOTICE - Normal but significant condition• INFORMATION - Informational• DEBUG - Debug - level messages
• Message: Message associated with event. Complete message can be viewed by placing cursor on the message.• User Name: Name of the user associated with the event.• Source: IP Address of the event generator.• Status: Status of the event. Possible status are:
• Failed• Successful
Figure 389: Authentication Events
System EventsThis Report displays the System Events detail including time, event type, severity and message.
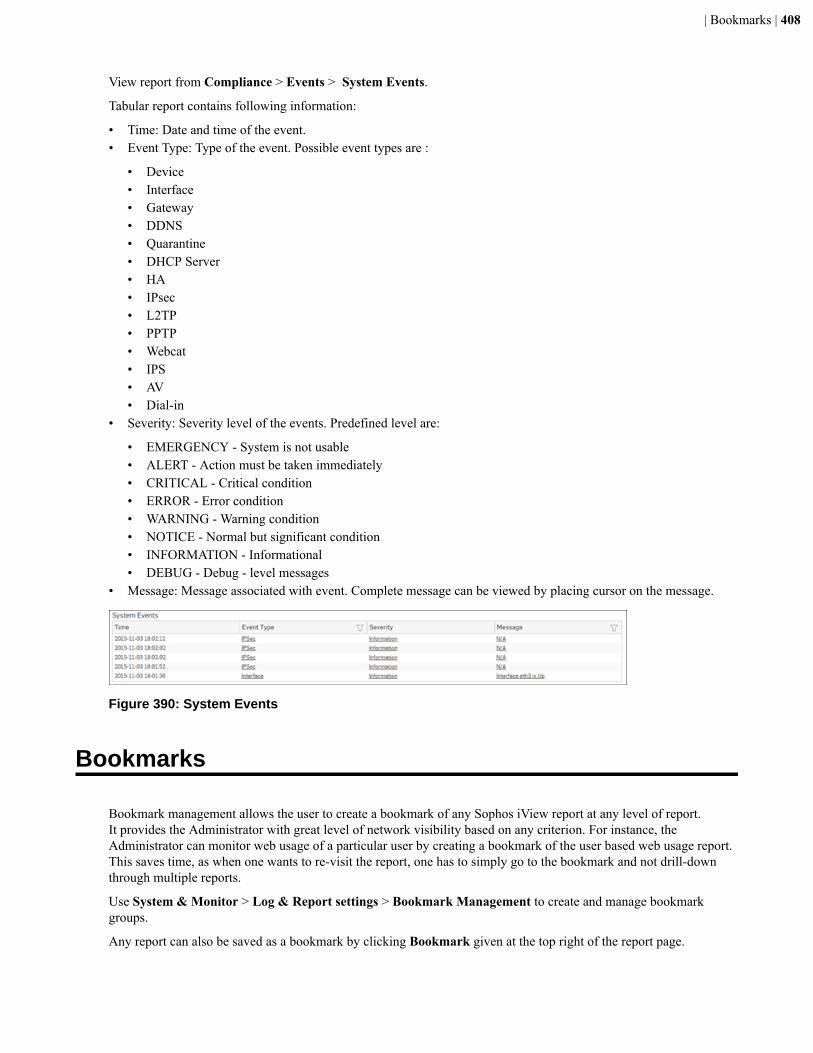
| Bookmarks | 408
View report from Compliance > Events > System Events.
Tabular report contains following information:
• Time: Date and time of the event.• Event Type: Type of the event. Possible event types are :
• Device• Interface• Gateway• DDNS• Quarantine• DHCP Server• HA• IPsec• L2TP• PPTP• Webcat• IPS• AV• Dial-in
• Severity: Severity level of the events. Predefined level are:
• EMERGENCY - System is not usable• ALERT - Action must be taken immediately• CRITICAL - Critical condition• ERROR - Error condition• WARNING - Warning condition• NOTICE - Normal but significant condition• INFORMATION - Informational• DEBUG - Debug - level messages
• Message: Message associated with event. Complete message can be viewed by placing cursor on the message.
Figure 390: System Events
Bookmarks
Bookmark management allows the user to create a bookmark of any Sophos iView report at any level of report.It provides the Administrator with great level of network visibility based on any criterion. For instance, theAdministrator can monitor web usage of a particular user by creating a bookmark of the user based web usage report.This saves time, as when one wants to re-visit the report, one has to simply go to the bookmark and not drill-downthrough multiple reports.
Use System & Monitor > Log & Report settings > Bookmark Management to create and manage bookmarkgroups.
Any report can also be saved as a bookmark by clicking Bookmark given at the top right of the report page.
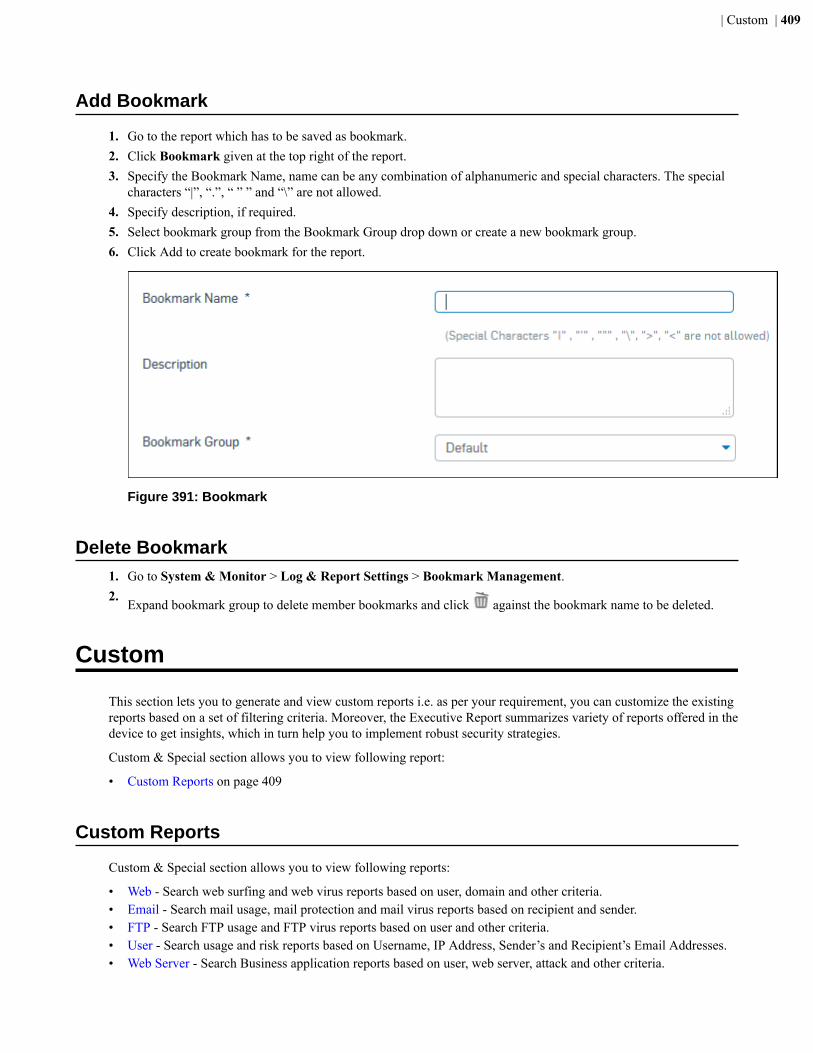
| Custom | 409
Add Bookmark
1. Go to the report which has to be saved as bookmark.2. Click Bookmark given at the top right of the report.3. Specify the Bookmark Name, name can be any combination of alphanumeric and special characters. The special
characters “|”, “.”, “ ” ” and “\” are not allowed.4. Specify description, if required.5. Select bookmark group from the Bookmark Group drop down or create a new bookmark group.6. Click Add to create bookmark for the report.
Figure 391: Bookmark
Delete Bookmark1. Go to System & Monitor > Log & Report Settings > Bookmark Management.2.
Expand bookmark group to delete member bookmarks and click against the bookmark name to be deleted.
Custom
This section lets you to generate and view custom reports i.e. as per your requirement, you can customize the existingreports based on a set of filtering criteria. Moreover, the Executive Report summarizes variety of reports offered in thedevice to get insights, which in turn help you to implement robust security strategies.
Custom & Special section allows you to view following report:
• Custom Reports on page 409
Custom Reports
Custom & Special section allows you to view following reports:
• Web - Search web surfing and web virus reports based on user, domain and other criteria.• Email - Search mail usage, mail protection and mail virus reports based on recipient and sender.• FTP - Search FTP usage and FTP virus reports based on user and other criteria.• User - Search usage and risk reports based on Username, IP Address, Sender’s and Recipient’s Email Addresses.• Web Server - Search Business application reports based on user, web server, attack and other criteria.
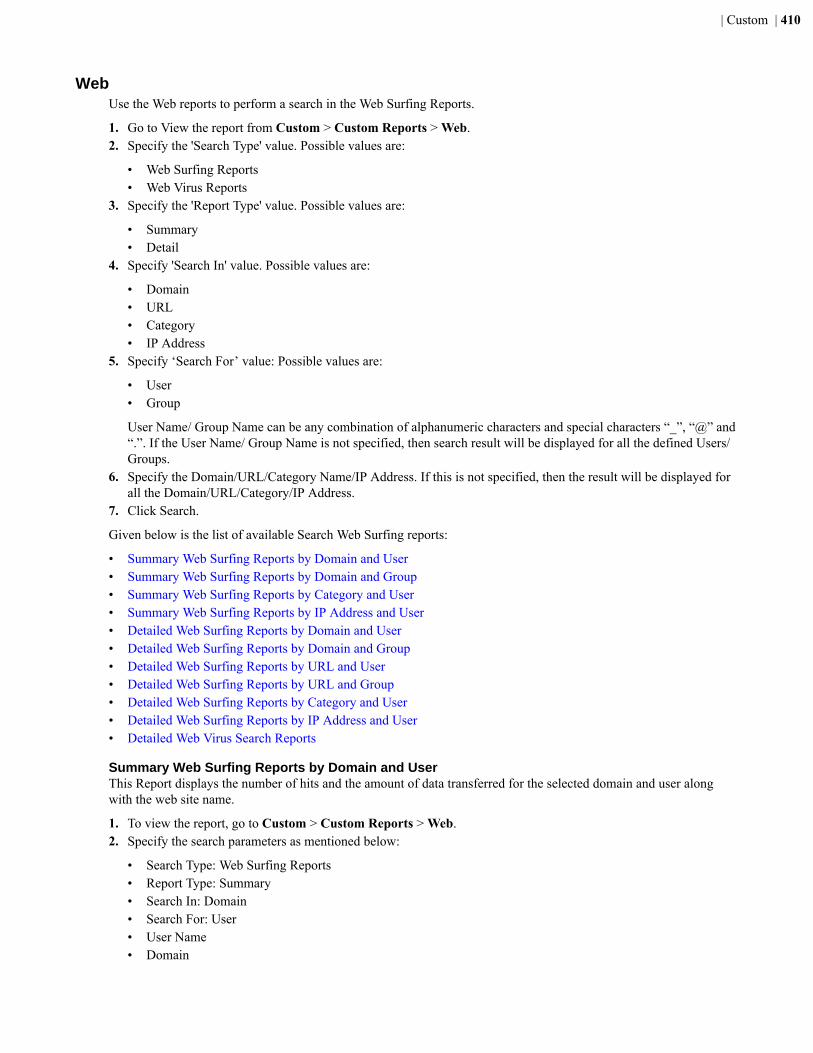
| Custom | 410
WebUse the Web reports to perform a search in the Web Surfing Reports.
1. Go to View the report from Custom > Custom Reports > Web.2. Specify the 'Search Type' value. Possible values are:
• Web Surfing Reports• Web Virus Reports
3. Specify the 'Report Type' value. Possible values are:
• Summary• Detail
4. Specify 'Search In' value. Possible values are:
• Domain• URL• Category• IP Address
5. Specify ‘Search For’ value: Possible values are:
• User• Group
User Name/ Group Name can be any combination of alphanumeric characters and special characters “_”, “@” and“.”. If the User Name/ Group Name is not specified, then search result will be displayed for all the defined Users/Groups.
6. Specify the Domain/URL/Category Name/IP Address. If this is not specified, then the result will be displayed forall the Domain/URL/Category/IP Address.
7. Click Search.
Given below is the list of available Search Web Surfing reports:
• Summary Web Surfing Reports by Domain and User• Summary Web Surfing Reports by Domain and Group• Summary Web Surfing Reports by Category and User• Summary Web Surfing Reports by IP Address and User• Detailed Web Surfing Reports by Domain and User• Detailed Web Surfing Reports by Domain and Group• Detailed Web Surfing Reports by URL and User• Detailed Web Surfing Reports by URL and Group• Detailed Web Surfing Reports by Category and User• Detailed Web Surfing Reports by IP Address and User• Detailed Web Virus Search Reports
Summary Web Surfing Reports by Domain and UserThis Report displays the number of hits and the amount of data transferred for the selected domain and user alongwith the web site name.
1. To view the report, go to Custom > Custom Reports > Web.2. Specify the search parameters as mentioned below:
• Search Type: Web Surfing Reports• Report Type: Summary• Search In: Domain• Search For: User• User Name• Domain
| Custom | 411
The Tabular Report contains the following information:
• User Name: Username of the user as defined in the Device. If the User is not defined, then it will be considered astraffic generated by an ‘Unidentified’ user.
• Domain: URLs of the website visited by the user.• Hits: Number of hits to the user.• Bytes: Amount of data transferred, in bytes.
Figure 392: Surfing Report by Domain and User
Summary Web Surfing Reports by Domain and GroupThis Report displays the number of hits and the amount of data transferred for the selected domain and group alongwith the web site name.
1. To view the report, go to Custom > Custom Reports > Web.2. Specify the search parameters as mentioned below:
• Search Type: Web Surfing Reports• Report Type: Summary• Search In: Domain• Search For: Group• Group Name• Domain
The Tabular Report contains the following information:
• User Group: Group name of the user group as defined in the Device. If the group is not defined, then it will beconsidered as traffic generated by an ‘Unidentified’ group.
• Domain: URLs of the website visited by the user group.• Hits: Number of hits to the user group.• Bytes: Amount of data transferred.
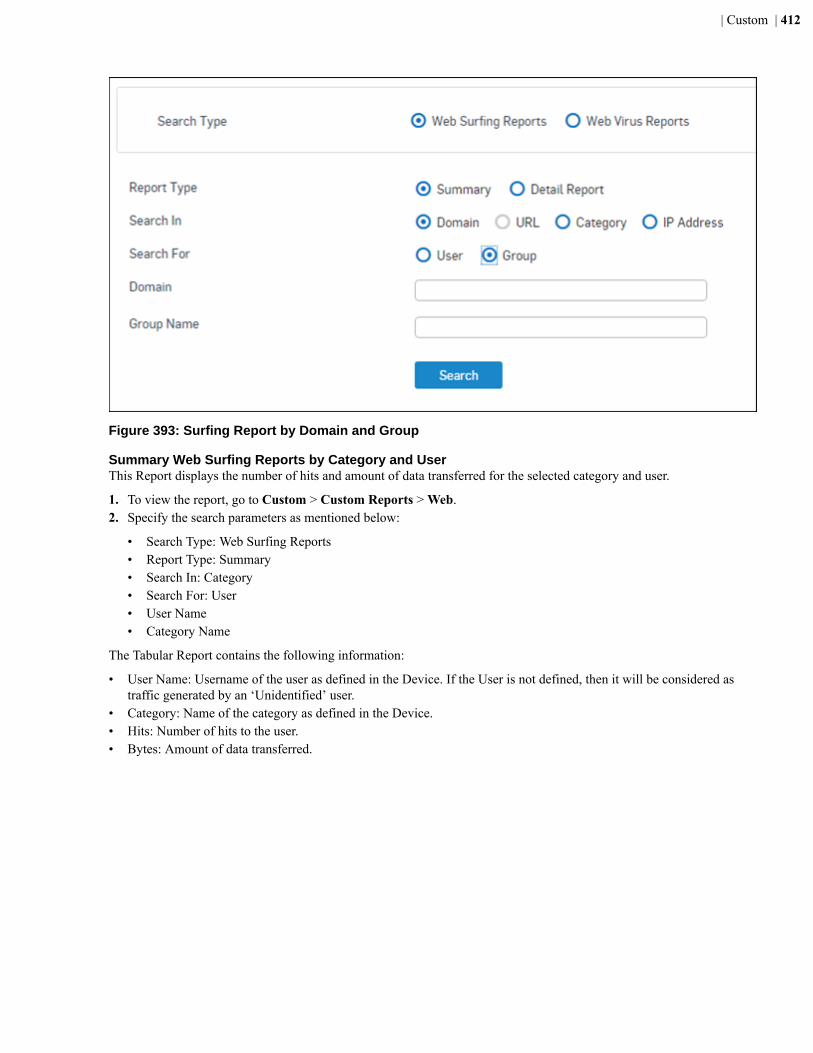
| Custom | 412
Figure 393: Surfing Report by Domain and Group
Summary Web Surfing Reports by Category and UserThis Report displays the number of hits and amount of data transferred for the selected category and user.
1. To view the report, go to Custom > Custom Reports > Web.2. Specify the search parameters as mentioned below:
• Search Type: Web Surfing Reports• Report Type: Summary• Search In: Category• Search For: User• User Name• Category Name
The Tabular Report contains the following information:
• User Name: Username of the user as defined in the Device. If the User is not defined, then it will be considered astraffic generated by an ‘Unidentified’ user.
• Category: Name of the category as defined in the Device.• Hits: Number of hits to the user.• Bytes: Amount of data transferred.
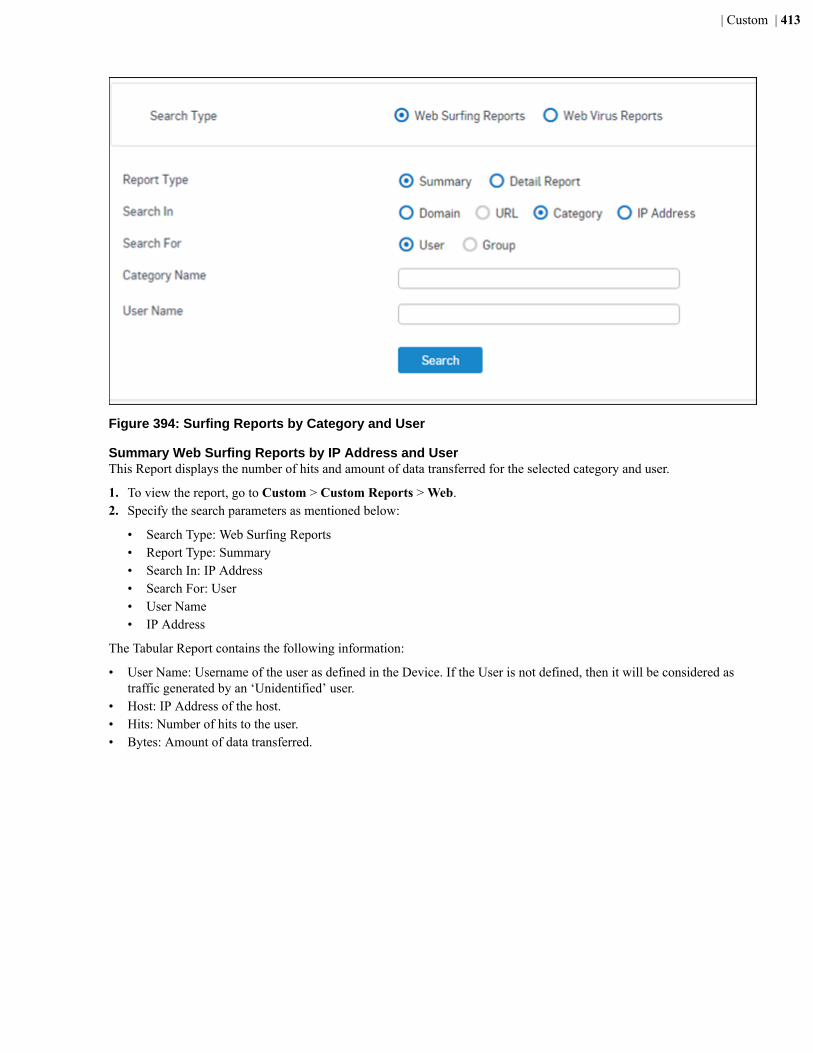
| Custom | 413
Figure 394: Surfing Reports by Category and User
Summary Web Surfing Reports by IP Address and UserThis Report displays the number of hits and amount of data transferred for the selected category and user.
1. To view the report, go to Custom > Custom Reports > Web.2. Specify the search parameters as mentioned below:
• Search Type: Web Surfing Reports• Report Type: Summary• Search In: IP Address• Search For: User• User Name• IP Address
The Tabular Report contains the following information:
• User Name: Username of the user as defined in the Device. If the User is not defined, then it will be considered astraffic generated by an ‘Unidentified’ user.
• Host: IP Address of the host.• Hits: Number of hits to the user.• Bytes: Amount of data transferred.
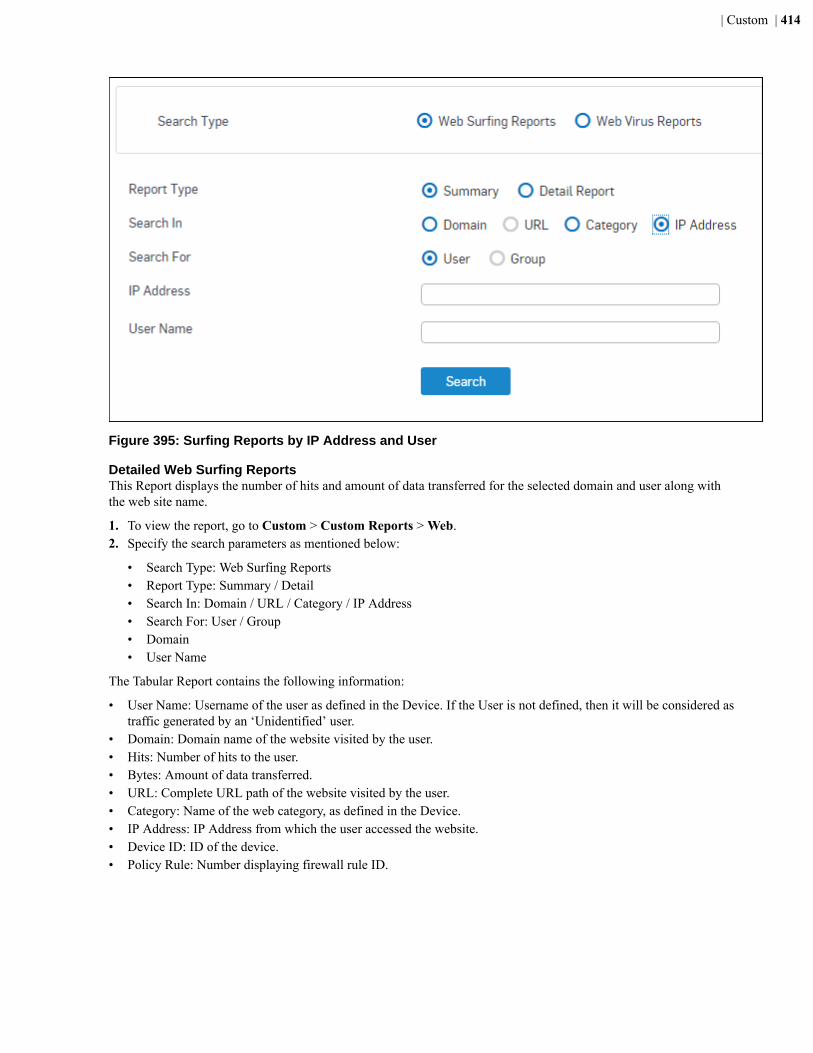
| Custom | 414
Figure 395: Surfing Reports by IP Address and User
Detailed Web Surfing ReportsThis Report displays the number of hits and amount of data transferred for the selected domain and user along withthe web site name.
1. To view the report, go to Custom > Custom Reports > Web.2. Specify the search parameters as mentioned below:
• Search Type: Web Surfing Reports• Report Type: Summary / Detail• Search In: Domain / URL / Category / IP Address• Search For: User / Group• Domain• User Name
The Tabular Report contains the following information:
• User Name: Username of the user as defined in the Device. If the User is not defined, then it will be considered astraffic generated by an ‘Unidentified’ user.
• Domain: Domain name of the website visited by the user.• Hits: Number of hits to the user.• Bytes: Amount of data transferred.• URL: Complete URL path of the website visited by the user.• Category: Name of the web category, as defined in the Device.• IP Address: IP Address from which the user accessed the website.• Device ID: ID of the device.• Policy Rule: Number displaying firewall rule ID.
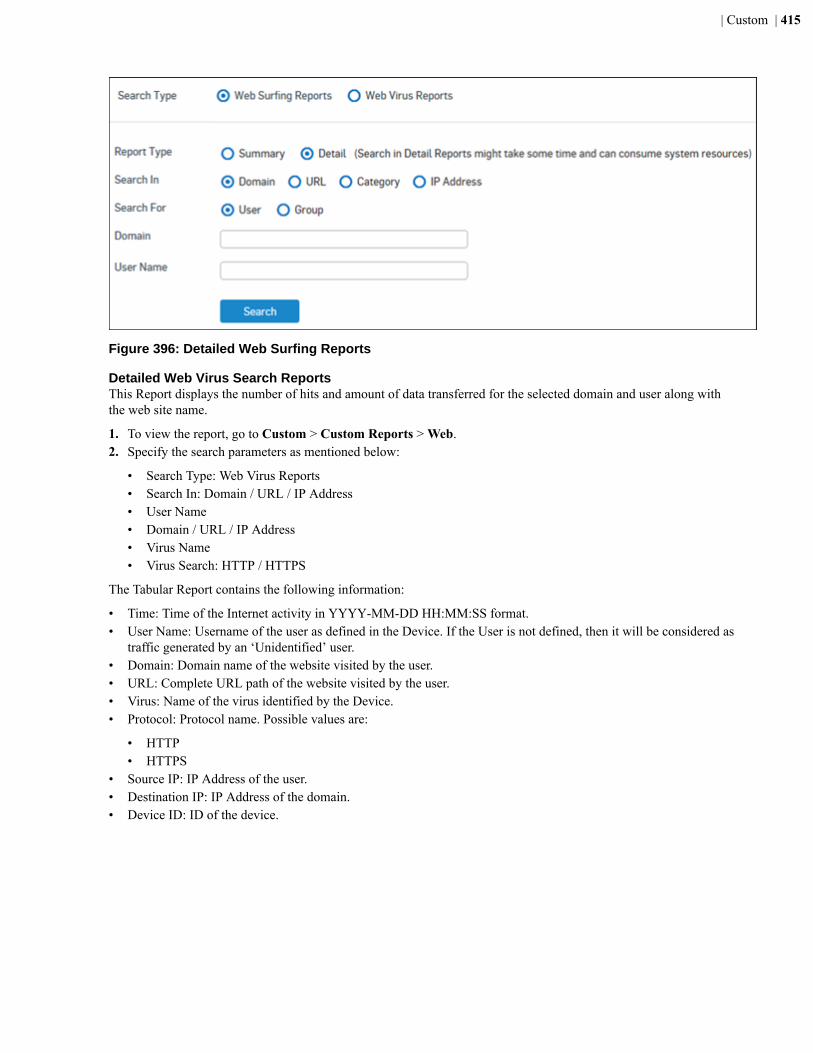
| Custom | 415
Figure 396: Detailed Web Surfing Reports
Detailed Web Virus Search ReportsThis Report displays the number of hits and amount of data transferred for the selected domain and user along withthe web site name.
1. To view the report, go to Custom > Custom Reports > Web.2. Specify the search parameters as mentioned below:
• Search Type: Web Virus Reports• Search In: Domain / URL / IP Address• User Name• Domain / URL / IP Address• Virus Name• Virus Search: HTTP / HTTPS
The Tabular Report contains the following information:
• Time: Time of the Internet activity in YYYY-MM-DD HH:MM:SS format.• User Name: Username of the user as defined in the Device. If the User is not defined, then it will be considered as
traffic generated by an ‘Unidentified’ user.• Domain: Domain name of the website visited by the user.• URL: Complete URL path of the website visited by the user.• Virus: Name of the virus identified by the Device.• Protocol: Protocol name. Possible values are:
• HTTP• HTTPS
• Source IP: IP Address of the user.• Destination IP: IP Address of the domain.• Device ID: ID of the device.
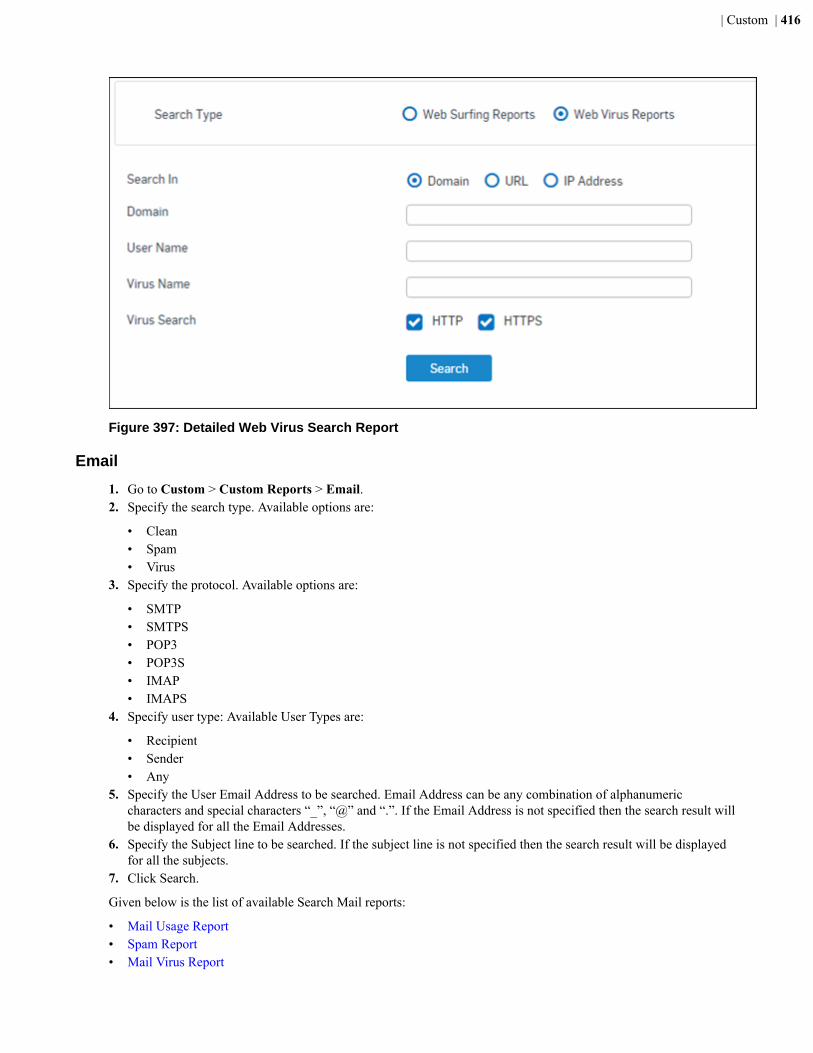
| Custom | 416
Figure 397: Detailed Web Virus Search Report
1. Go to Custom > Custom Reports > Email.2. Specify the search type. Available options are:
• Clean• Spam• Virus
3. Specify the protocol. Available options are:
• SMTP• SMTPS• POP3• POP3S• IMAP• IMAPS
4. Specify user type: Available User Types are:
• Recipient• Sender• Any
5. Specify the User Email Address to be searched. Email Address can be any combination of alphanumericcharacters and special characters “_”, “@” and “.”. If the Email Address is not specified then the search result willbe displayed for all the Email Addresses.
6. Specify the Subject line to be searched. If the subject line is not specified then the search result will be displayedfor all the subjects.
7. Click Search.
Given below is the list of available Search Mail reports:
• Mail Usage Report• Spam Report• Mail Virus Report
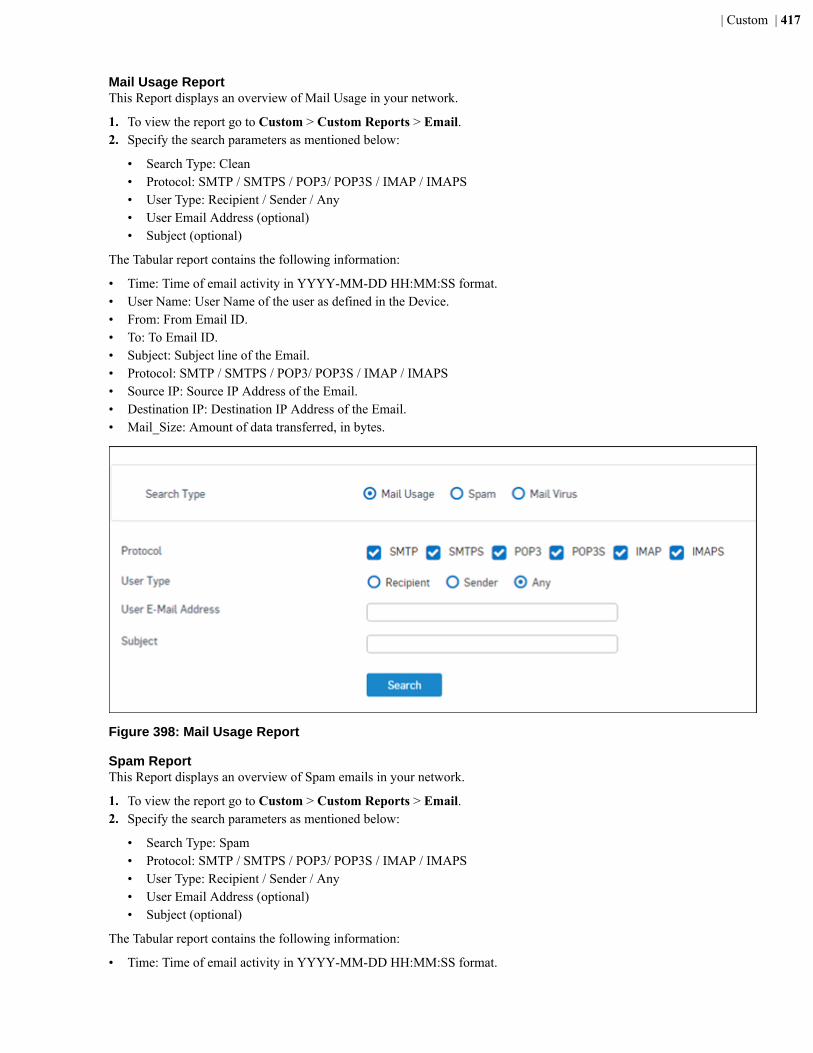
| Custom | 417
Mail Usage ReportThis Report displays an overview of Mail Usage in your network.
1. To view the report go to Custom > Custom Reports > Email.2. Specify the search parameters as mentioned below:
• Search Type: Clean• Protocol: SMTP / SMTPS / POP3/ POP3S / IMAP / IMAPS• User Type: Recipient / Sender / Any• User Email Address (optional)• Subject (optional)
The Tabular report contains the following information:
• Time: Time of email activity in YYYY-MM-DD HH:MM:SS format.• User Name: User Name of the user as defined in the Device.• From: From Email ID.• To: To Email ID.• Subject: Subject line of the Email.• Protocol: SMTP / SMTPS / POP3/ POP3S / IMAP / IMAPS• Source IP: Source IP Address of the Email.• Destination IP: Destination IP Address of the Email.• Mail_Size: Amount of data transferred, in bytes.
Figure 398: Mail Usage Report
Spam ReportThis Report displays an overview of Spam emails in your network.
1. To view the report go to Custom > Custom Reports > Email.2. Specify the search parameters as mentioned below:
• Search Type: Spam• Protocol: SMTP / SMTPS / POP3/ POP3S / IMAP / IMAPS• User Type: Recipient / Sender / Any• User Email Address (optional)• Subject (optional)
The Tabular report contains the following information:
• Time: Time of email activity in YYYY-MM-DD HH:MM:SS format.
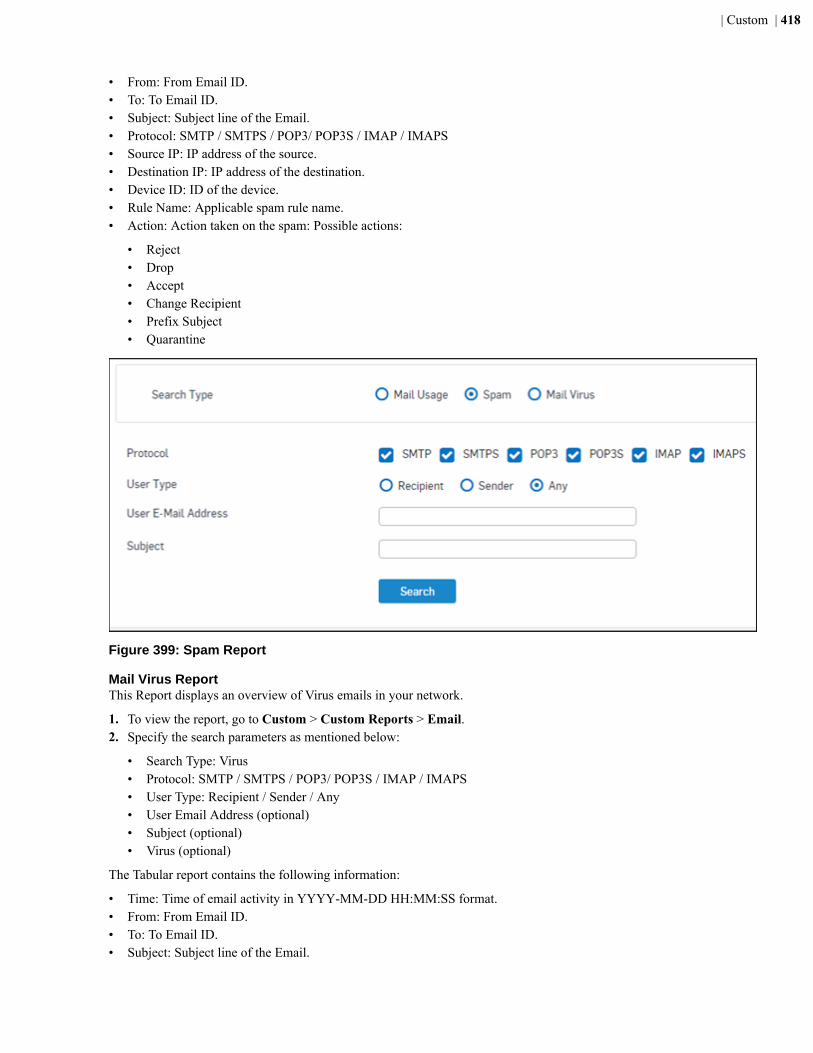
| Custom | 418
• From: From Email ID.• To: To Email ID.• Subject: Subject line of the Email.• Protocol: SMTP / SMTPS / POP3/ POP3S / IMAP / IMAPS• Source IP: IP address of the source.• Destination IP: IP address of the destination.• Device ID: ID of the device.• Rule Name: Applicable spam rule name.• Action: Action taken on the spam: Possible actions:
• Reject• Drop• Accept• Change Recipient• Prefix Subject• Quarantine
Figure 399: Spam Report
Mail Virus ReportThis Report displays an overview of Virus emails in your network.
1. To view the report, go to Custom > Custom Reports > Email.2. Specify the search parameters as mentioned below:
• Search Type: Virus• Protocol: SMTP / SMTPS / POP3/ POP3S / IMAP / IMAPS• User Type: Recipient / Sender / Any• User Email Address (optional)• Subject (optional)• Virus (optional)
The Tabular report contains the following information:
• Time: Time of email activity in YYYY-MM-DD HH:MM:SS format.• From: From Email ID.• To: To Email ID.• Subject: Subject line of the Email.
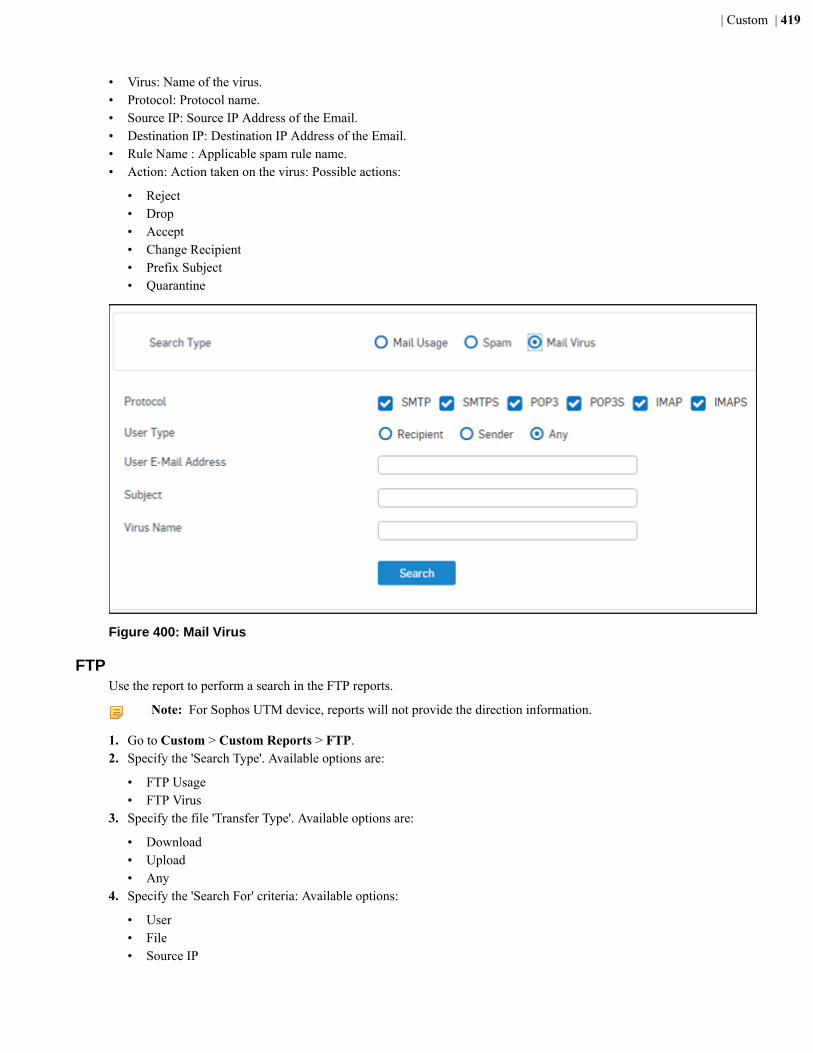
| Custom | 419
• Virus: Name of the virus.• Protocol: Protocol name.• Source IP: Source IP Address of the Email.• Destination IP: Destination IP Address of the Email.• Rule Name : Applicable spam rule name.• Action: Action taken on the virus: Possible actions:
• Reject• Drop• Accept• Change Recipient• Prefix Subject• Quarantine
Figure 400: Mail Virus
FTPUse the report to perform a search in the FTP reports.
Note: For Sophos UTM device, reports will not provide the direction information.
1. Go to Custom > Custom Reports > FTP.2. Specify the 'Search Type'. Available options are:
• FTP Usage• FTP Virus
3. Specify the file 'Transfer Type'. Available options are:
• Download• Upload• Any
4. Specify the 'Search For' criteria: Available options:
• User• File• Source IP
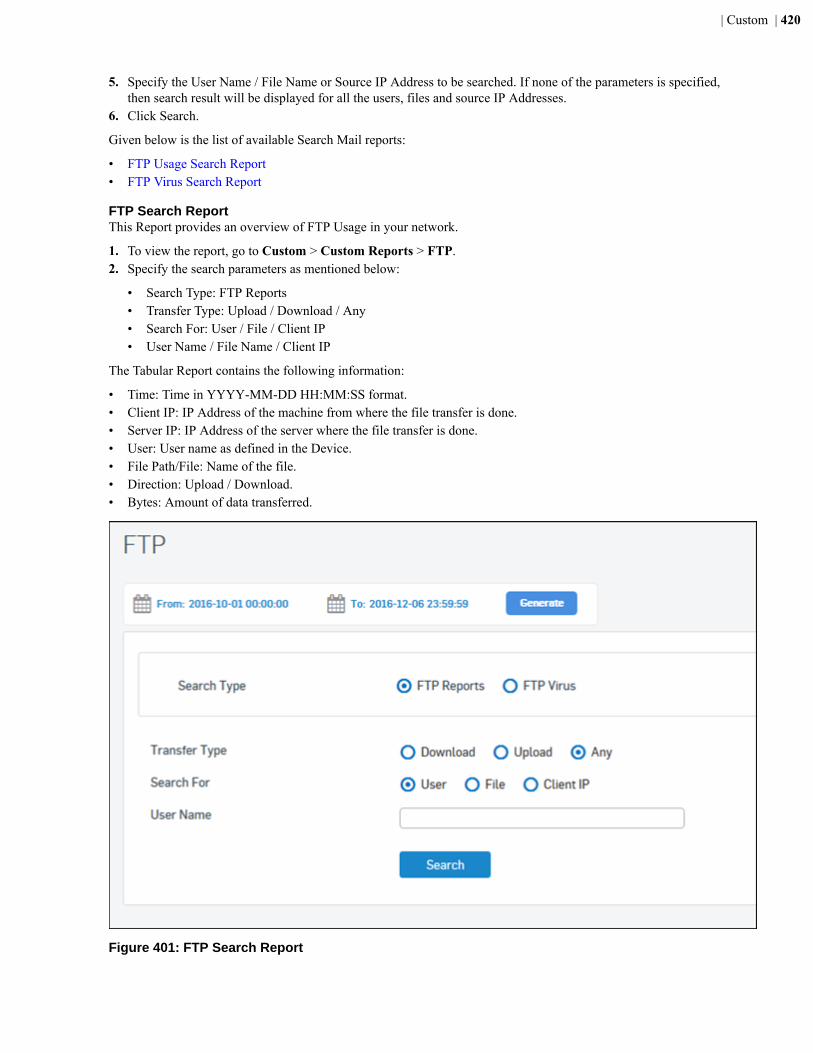
| Custom | 420
5. Specify the User Name / File Name or Source IP Address to be searched. If none of the parameters is specified,then search result will be displayed for all the users, files and source IP Addresses.
6. Click Search.
Given below is the list of available Search Mail reports:
• FTP Usage Search Report• FTP Virus Search Report
FTP Search ReportThis Report provides an overview of FTP Usage in your network.
1. To view the report, go to Custom > Custom Reports > FTP.2. Specify the search parameters as mentioned below:
• Search Type: FTP Reports• Transfer Type: Upload / Download / Any• Search For: User / File / Client IP• User Name / File Name / Client IP
The Tabular Report contains the following information:
• Time: Time in YYYY-MM-DD HH:MM:SS format.• Client IP: IP Address of the machine from where the file transfer is done.• Server IP: IP Address of the server where the file transfer is done.• User: User name as defined in the Device.• File Path/File: Name of the file.• Direction: Upload / Download.• Bytes: Amount of data transferred.
Figure 401: FTP Search Report
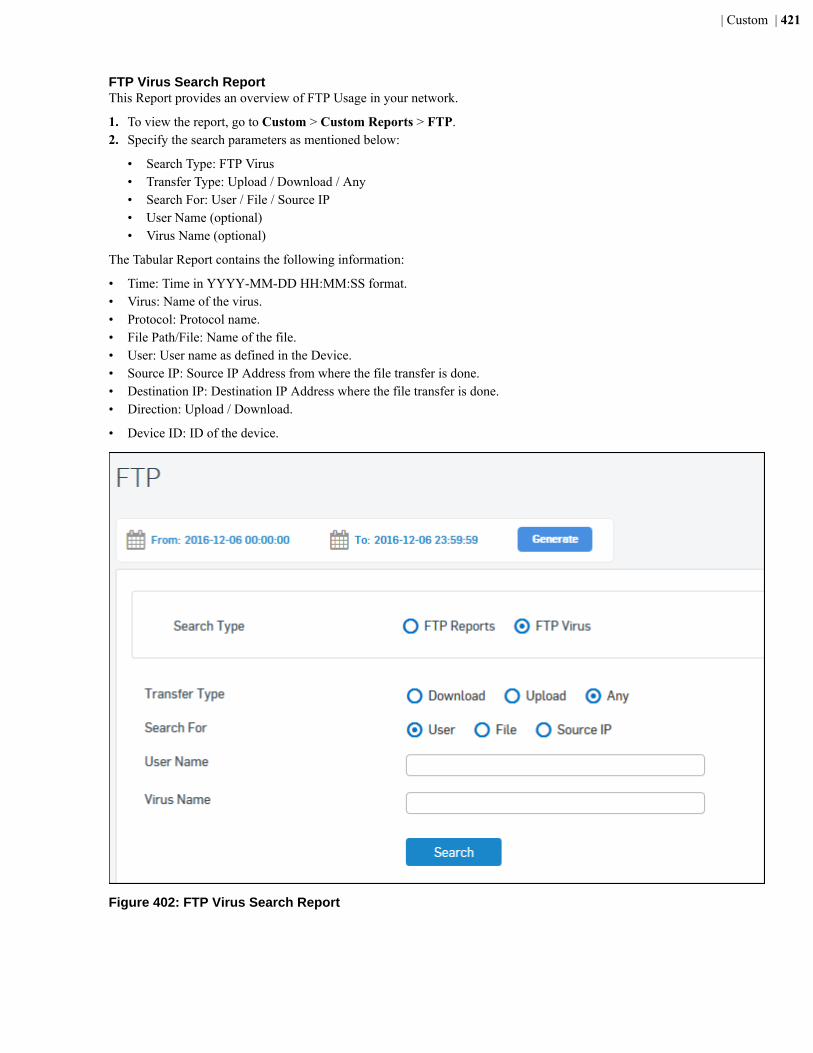
| Custom | 421
FTP Virus Search ReportThis Report provides an overview of FTP Usage in your network.
1. To view the report, go to Custom > Custom Reports > FTP.2. Specify the search parameters as mentioned below:
• Search Type: FTP Virus• Transfer Type: Upload / Download / Any• Search For: User / File / Source IP• User Name (optional)• Virus Name (optional)
The Tabular Report contains the following information:
• Time: Time in YYYY-MM-DD HH:MM:SS format.• Virus: Name of the virus.• Protocol: Protocol name.• File Path/File: Name of the file.• User: User name as defined in the Device.• Source IP: Source IP Address from where the file transfer is done.• Destination IP: Destination IP Address where the file transfer is done.• Direction: Upload / Download.
• Device ID: ID of the device.
Figure 402: FTP Virus Search Report
| Custom | 422
UserUse the report to view custom reports by Username, Source Host, Sender's Email Address and Recipient's EmailAddress.
View the report from Custom > Custom Reports > User.
Custom User Report contains following dashboards:
• Username• Source Host• Sender's Email Address• Recipient's Email Address
Select the criteria (username, source host, sender's Email Address and Recipient's Email Address) to view respectiveCustom User Reports dashboards.
Custom User Report by UsernameThe Custom User Report by Username dashboard provides a snapshot of network activities by the specified user.
• Go to Custom > Custom Reports > User.• Select the criteria Username and specify it in the adjacent space provided.• Click Go to view the customized dashboard.
The dashboard consists of the following reports in widget form:
• High Risk Applications• Objectionable Web Domains• Web Categories• Virus Summary• Unproductive Web Domains• Applications• Web Domains• Spam Senders• Spam Recipients• Advanced Threats• Web Server Usage• Files Transferred via FTP• Severity Level• Web Virus• Internet Usage
High Risk ApplicationsThe widget report displays applications with high risk level, accessed by the selected user.
View the report from Custom > Custom Reports > User > > Username.
The Report is displayed as a graph as well as in a tabular format.
The bar graph displays number of hits per application while the tabular report contains the following information:
• Application/Proto:Port: Displays name of the Application as defined in the Device. If the application is notdefined in the Device, then this field will display the application identifier as a combination of the protocol andport number associated with the application.
• Risk: Level of risk associated with the application.• Hits: Number of hits per application.• Bytes: Amount of data transferred through the application, in bytes.
Note: Click on an application to view the Filtered User App Risks & Usage Reports
Figure 403: High Risk Applications
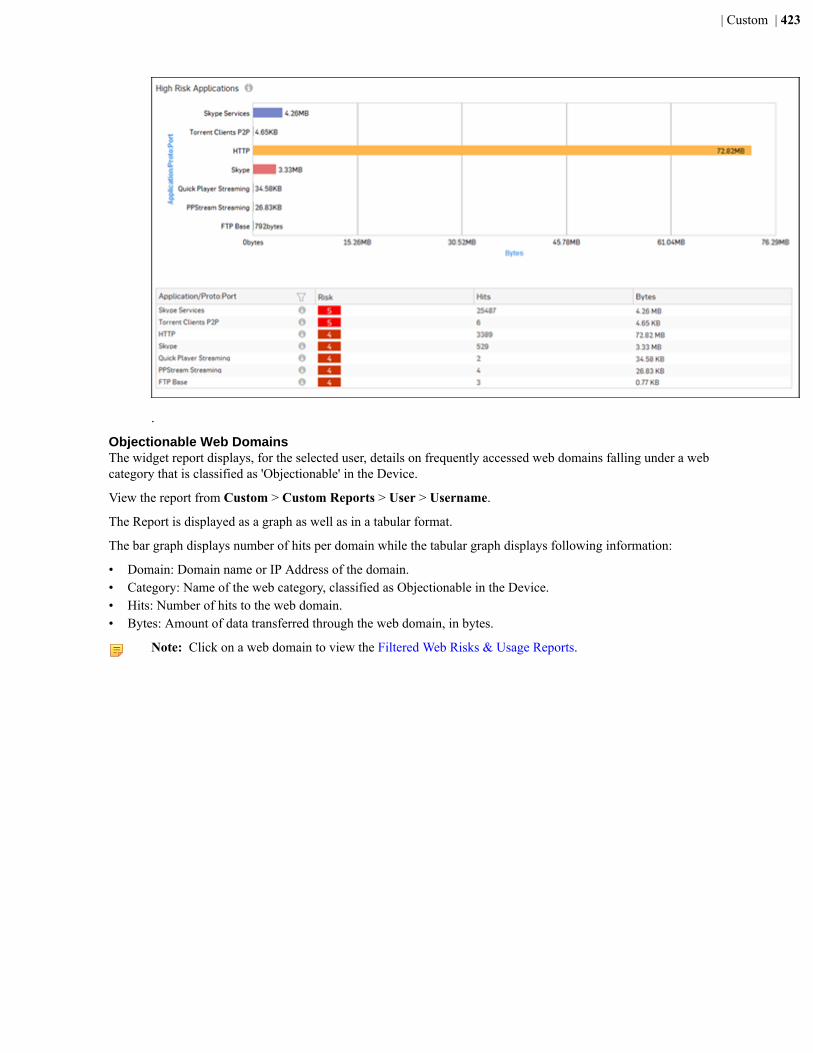
| Custom | 423
.
Objectionable Web DomainsThe widget report displays, for the selected user, details on frequently accessed web domains falling under a webcategory that is classified as 'Objectionable' in the Device.
View the report from Custom > Custom Reports > User > Username.
The Report is displayed as a graph as well as in a tabular format.
The bar graph displays number of hits per domain while the tabular graph displays following information:
• Domain: Domain name or IP Address of the domain.• Category: Name of the web category, classified as Objectionable in the Device.• Hits: Number of hits to the web domain.• Bytes: Amount of data transferred through the web domain, in bytes.
Note: Click on a web domain to view the Filtered Web Risks & Usage Reports.
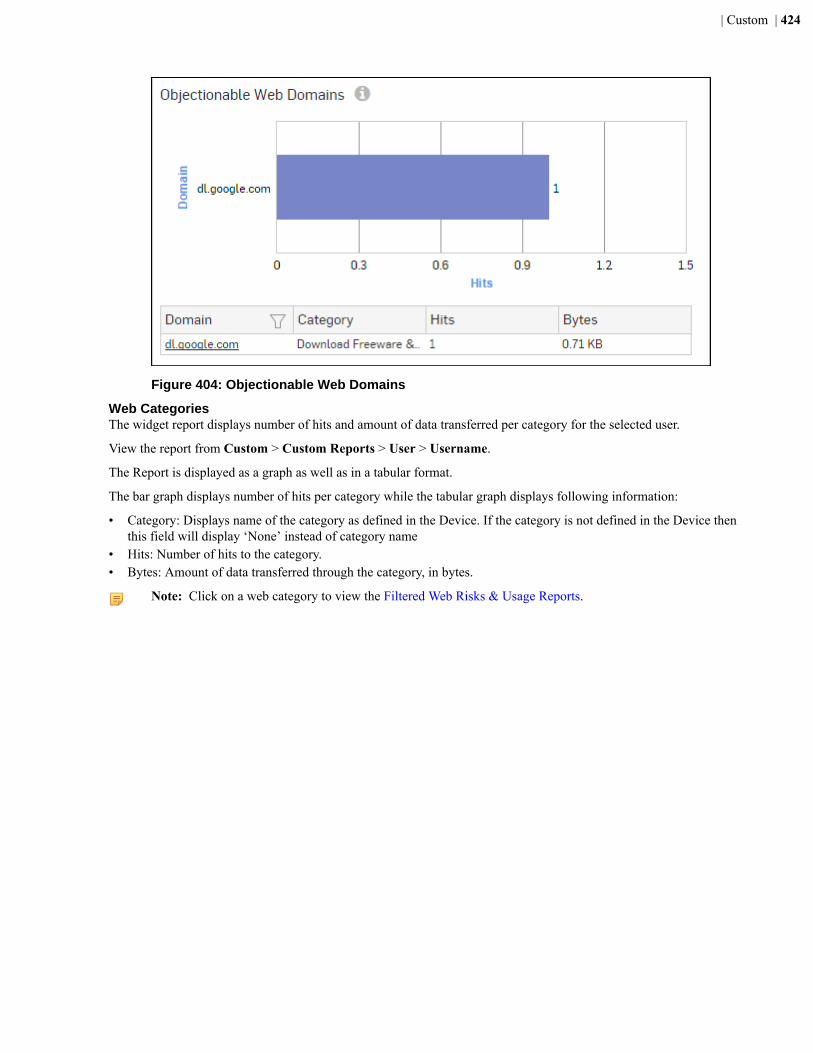
| Custom | 424
Figure 404: Objectionable Web Domains
Web CategoriesThe widget report displays number of hits and amount of data transferred per category for the selected user.
View the report from Custom > Custom Reports > User > Username.
The Report is displayed as a graph as well as in a tabular format.
The bar graph displays number of hits per category while the tabular graph displays following information:
• Category: Displays name of the category as defined in the Device. If the category is not defined in the Device thenthis field will display ‘None’ instead of category name
• Hits: Number of hits to the category.• Bytes: Amount of data transferred through the category, in bytes.
Note: Click on a web category to view the Filtered Web Risks & Usage Reports.
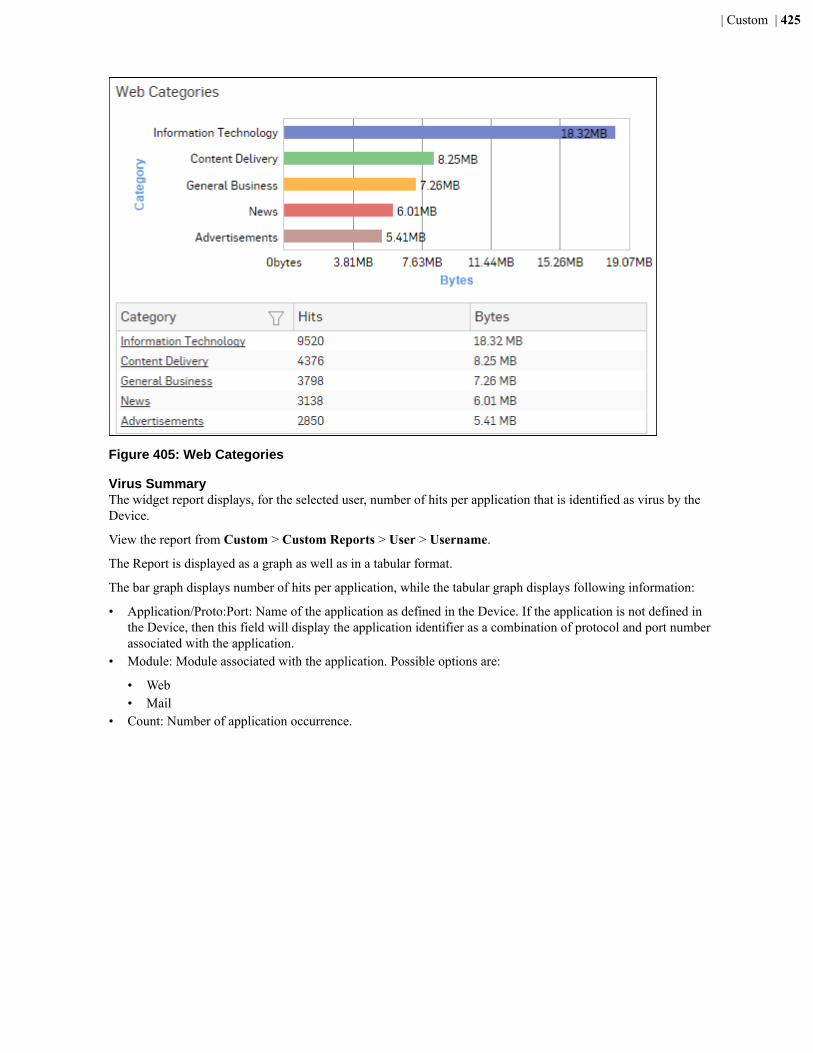
| Custom | 425
Figure 405: Web Categories
Virus SummaryThe widget report displays, for the selected user, number of hits per application that is identified as virus by theDevice.
View the report from Custom > Custom Reports > User > Username.
The Report is displayed as a graph as well as in a tabular format.
The bar graph displays number of hits per application, while the tabular graph displays following information:
• Application/Proto:Port: Name of the application as defined in the Device. If the application is not defined inthe Device, then this field will display the application identifier as a combination of protocol and port numberassociated with the application.
• Module: Module associated with the application. Possible options are:
• Web• Mail
• Count: Number of application occurrence.
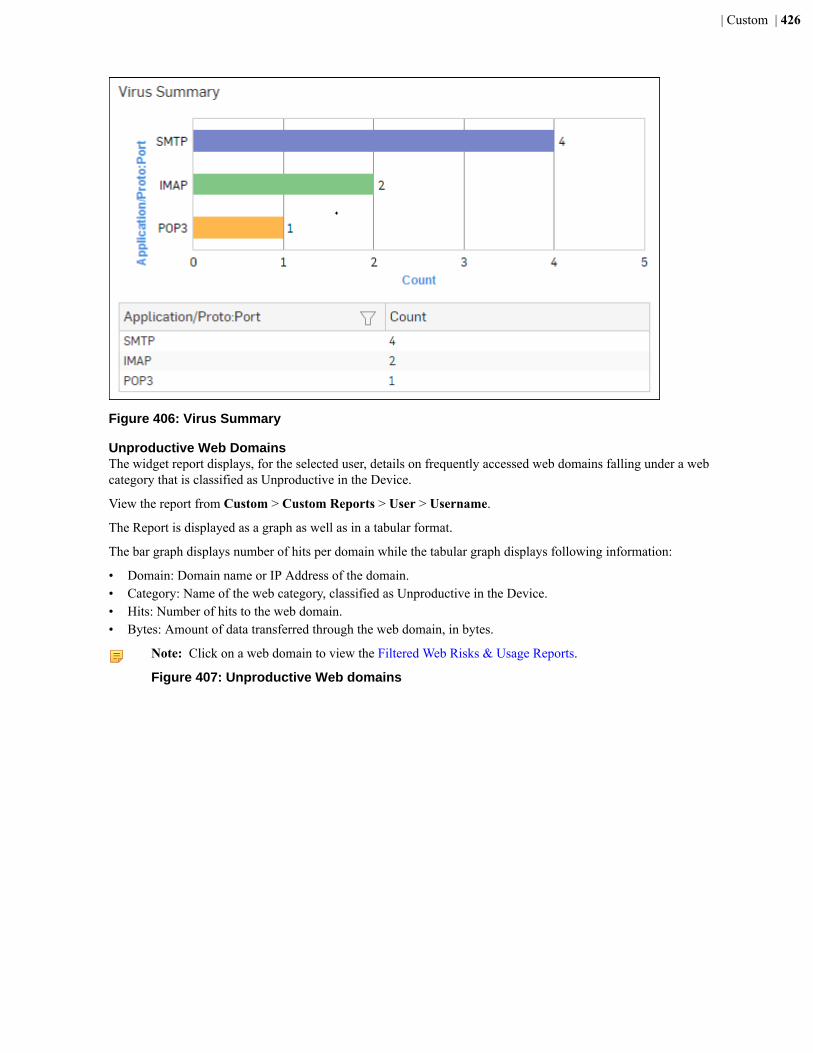
| Custom | 426
Figure 406: Virus Summary
Unproductive Web DomainsThe widget report displays, for the selected user, details on frequently accessed web domains falling under a webcategory that is classified as Unproductive in the Device.
View the report from Custom > Custom Reports > User > Username.
The Report is displayed as a graph as well as in a tabular format.
The bar graph displays number of hits per domain while the tabular graph displays following information:
• Domain: Domain name or IP Address of the domain.• Category: Name of the web category, classified as Unproductive in the Device.• Hits: Number of hits to the web domain.• Bytes: Amount of data transferred through the web domain, in bytes.
Note: Click on a web domain to view the Filtered Web Risks & Usage Reports.
Figure 407: Unproductive Web domains
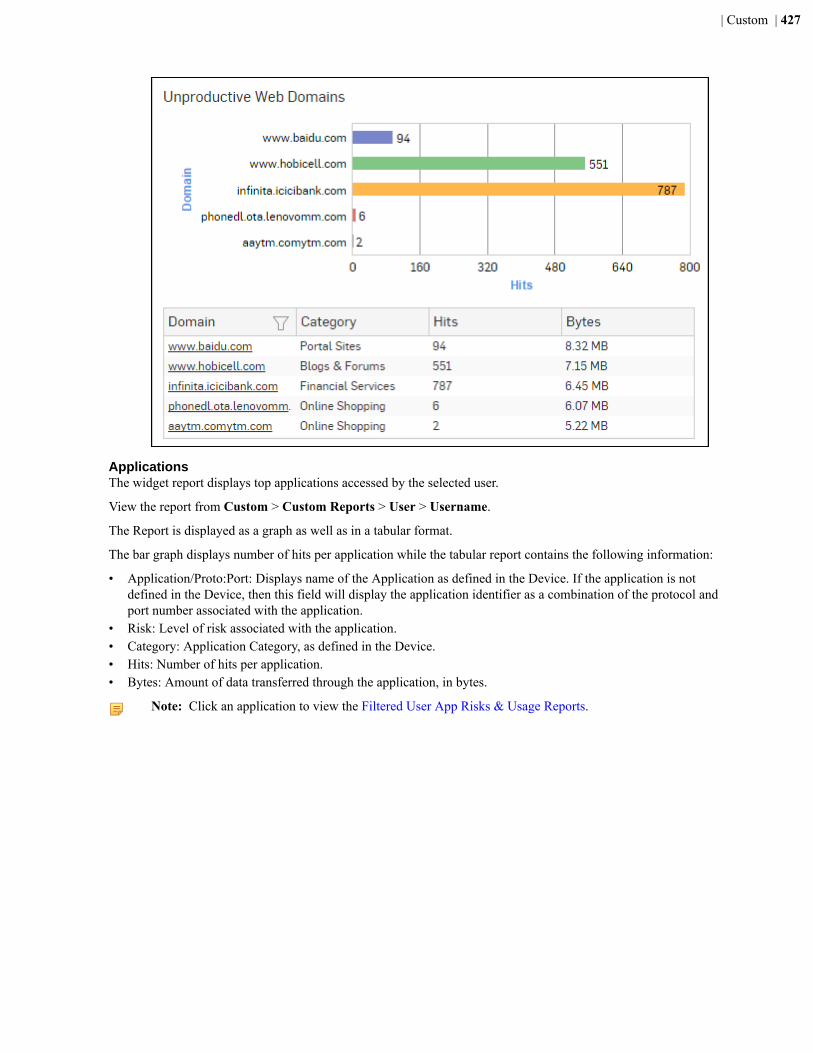
| Custom | 427
ApplicationsThe widget report displays top applications accessed by the selected user.
View the report from Custom > Custom Reports > User > Username.
The Report is displayed as a graph as well as in a tabular format.
The bar graph displays number of hits per application while the tabular report contains the following information:
• Application/Proto:Port: Displays name of the Application as defined in the Device. If the application is notdefined in the Device, then this field will display the application identifier as a combination of the protocol andport number associated with the application.
• Risk: Level of risk associated with the application.• Category: Application Category, as defined in the Device.• Hits: Number of hits per application.• Bytes: Amount of data transferred through the application, in bytes.
Note: Click an application to view the Filtered User App Risks & Usage Reports.
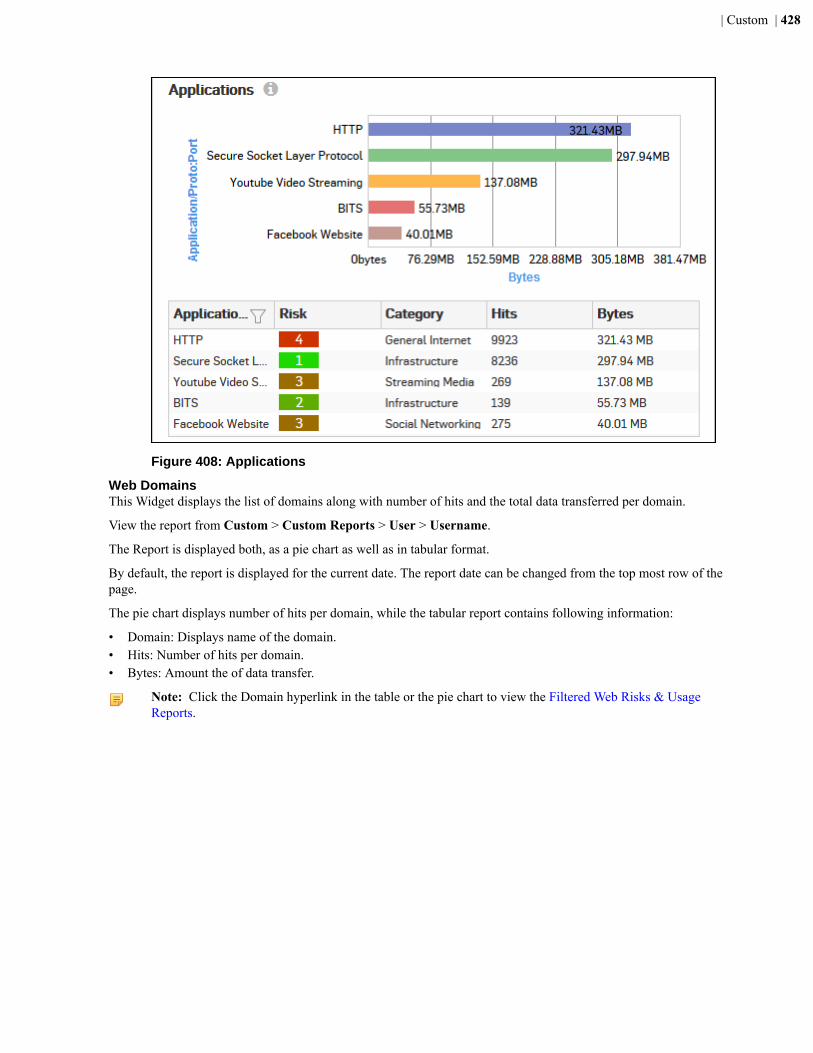
| Custom | 428
Figure 408: Applications
Web DomainsThis Widget displays the list of domains along with number of hits and the total data transferred per domain.
View the report from Custom > Custom Reports > User > Username.
The Report is displayed both, as a pie chart as well as in tabular format.
By default, the report is displayed for the current date. The report date can be changed from the top most row of thepage.
The pie chart displays number of hits per domain, while the tabular report contains following information:
• Domain: Displays name of the domain.• Hits: Number of hits per domain.• Bytes: Amount the of data transfer.
Note: Click the Domain hyperlink in the table or the pie chart to view the Filtered Web Risks & UsageReports.
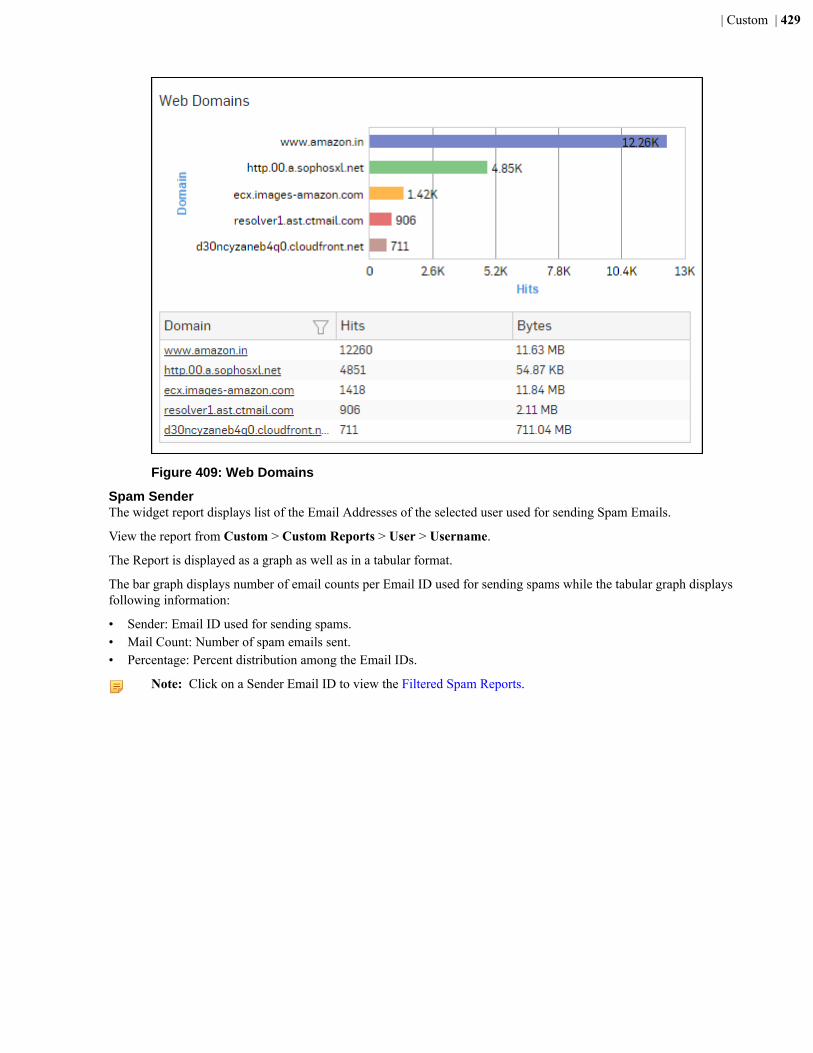
| Custom | 429
Figure 409: Web Domains
Spam SenderThe widget report displays list of the Email Addresses of the selected user used for sending Spam Emails.
View the report from Custom > Custom Reports > User > Username.
The Report is displayed as a graph as well as in a tabular format.
The bar graph displays number of email counts per Email ID used for sending spams while the tabular graph displaysfollowing information:
• Sender: Email ID used for sending spams.• Mail Count: Number of spam emails sent.• Percentage: Percent distribution among the Email IDs.
Note: Click on a Sender Email ID to view the Filtered Spam Reports.
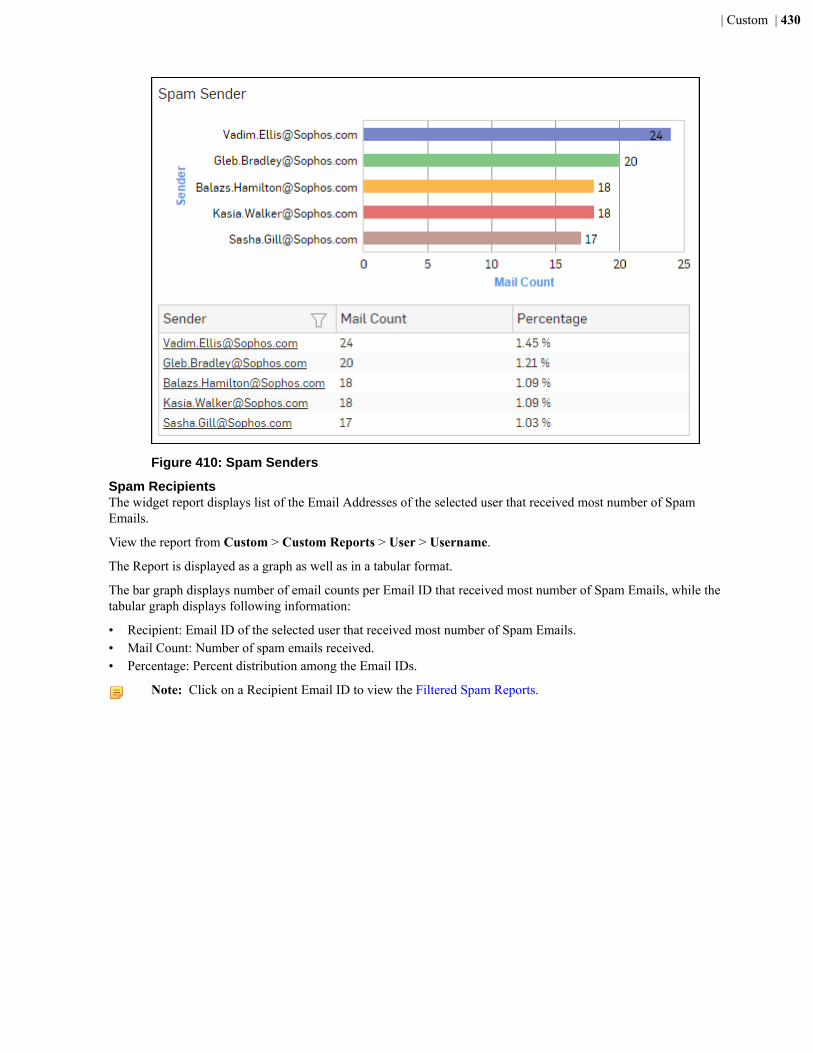
| Custom | 430
Figure 410: Spam Senders
Spam RecipientsThe widget report displays list of the Email Addresses of the selected user that received most number of SpamEmails.
View the report from Custom > Custom Reports > User > Username.
The Report is displayed as a graph as well as in a tabular format.
The bar graph displays number of email counts per Email ID that received most number of Spam Emails, while thetabular graph displays following information:
• Recipient: Email ID of the selected user that received most number of Spam Emails.• Mail Count: Number of spam emails received.• Percentage: Percent distribution among the Email IDs.
Note: Click on a Recipient Email ID to view the Filtered Spam Reports.

| Custom | 431
Figure 411: Spam Recipients
Advanced ThreatsThis widget report displays a comprehensive summary of advanced threats in your network.
View the report from Custom > Custom Reports > User > Username.
The report is displayed using a graph as well as in a tabular format.
By default, the report is displayed for the current date. The report date can be changed from the top most row of thepage.
The bar graph displays total number of attempts per threat while the tabular report contains following information:
• Threat: Name of the threat.• Host Count: Number of hosts infected with the threat.• Origin: Origin of the threat. Possible options:
• Firewall• IPS• DNS• HTTP Proxy• Combination of any of the above
• Attempts: Total number of attempts per threat. The number is summation of Log only and Log & Drop attempts.
Note: Click on a threat hyperlink in the table or the graph to view the Filtered ATP Reports.
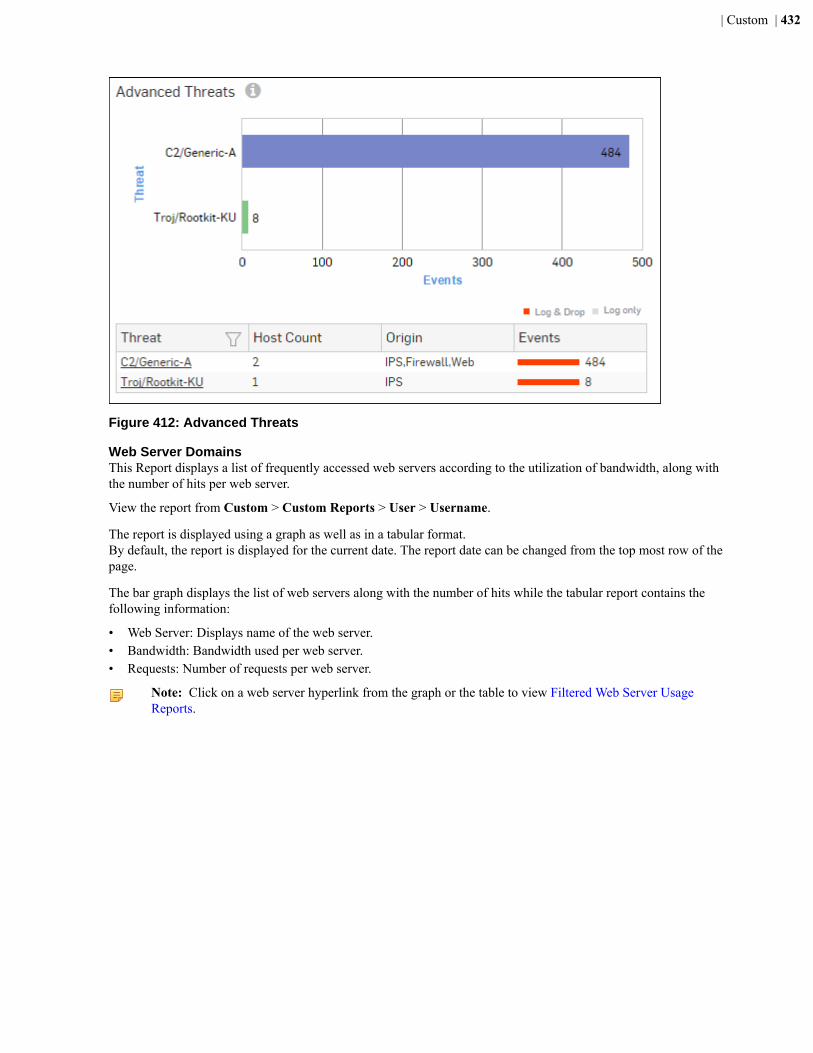
| Custom | 432
Figure 412: Advanced Threats
Web Server DomainsThis Report displays a list of frequently accessed web servers according to the utilization of bandwidth, along withthe number of hits per web server.
View the report from Custom > Custom Reports > User > Username.
The report is displayed using a graph as well as in a tabular format.By default, the report is displayed for the current date. The report date can be changed from the top most row of thepage.
The bar graph displays the list of web servers along with the number of hits while the tabular report contains thefollowing information:
• Web Server: Displays name of the web server.• Bandwidth: Bandwidth used per web server.• Requests: Number of requests per web server.
Note: Click on a web server hyperlink from the graph or the table to view Filtered Web Server UsageReports.
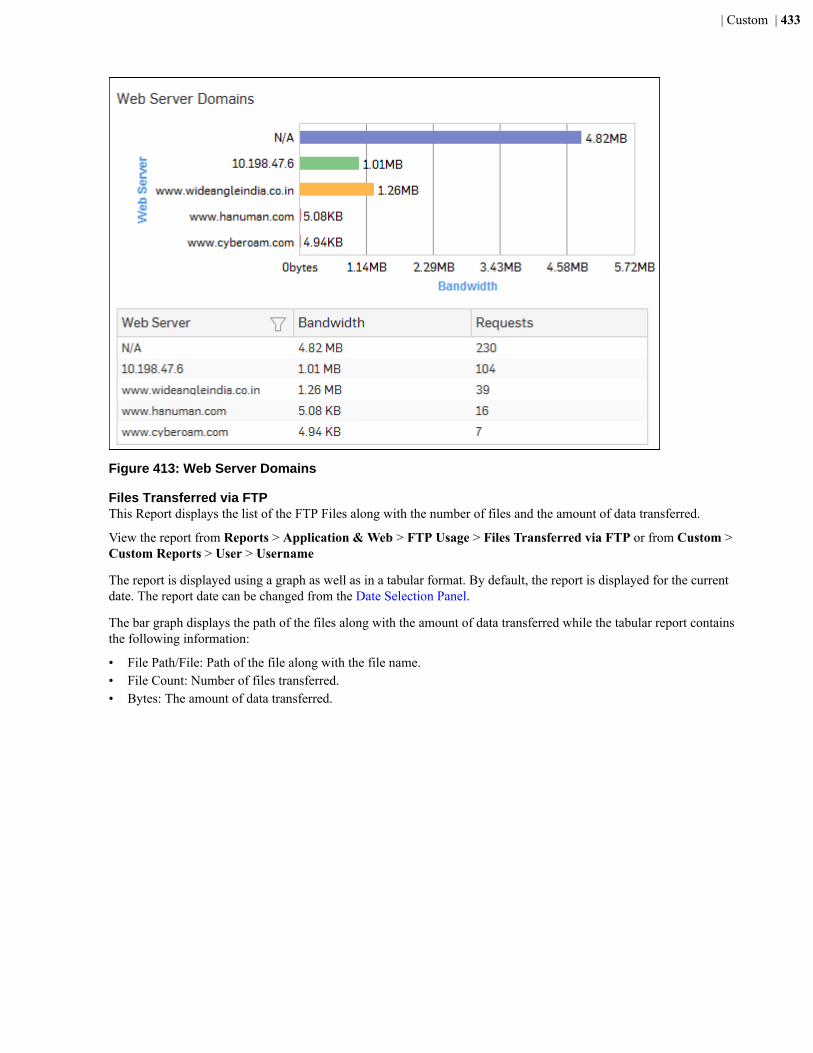
| Custom | 433
Figure 413: Web Server Domains
Files Transferred via FTPThis Report displays the list of the FTP Files along with the number of files and the amount of data transferred.
View the report from Reports > Application & Web > FTP Usage > Files Transferred via FTP or from Custom >Custom Reports > User > Username
The report is displayed using a graph as well as in a tabular format. By default, the report is displayed for the currentdate. The report date can be changed from the Date Selection Panel.
The bar graph displays the path of the files along with the amount of data transferred while the tabular report containsthe following information:
• File Path/File: Path of the file along with the file name.• File Count: Number of files transferred.• Bytes: The amount of data transferred.
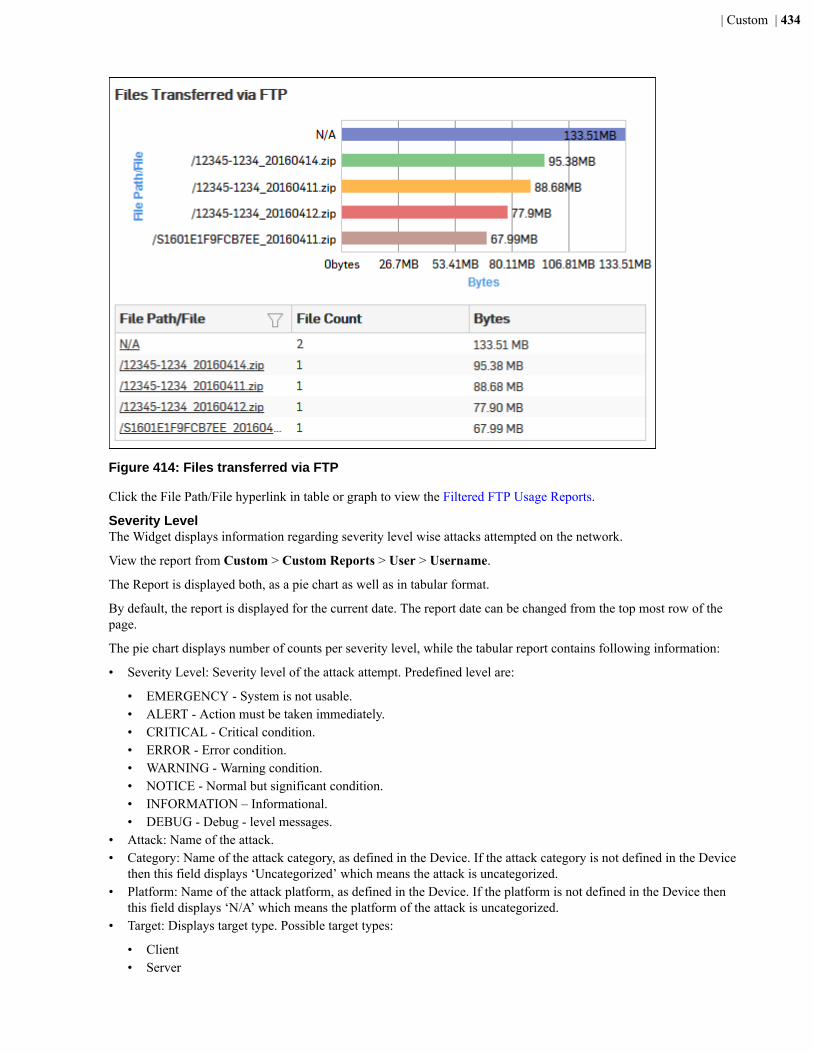
| Custom | 434
Figure 414: Files transferred via FTP
Click the File Path/File hyperlink in table or graph to view the Filtered FTP Usage Reports.
Severity LevelThe Widget displays information regarding severity level wise attacks attempted on the network.
View the report from Custom > Custom Reports > User > Username.
The Report is displayed both, as a pie chart as well as in tabular format.
By default, the report is displayed for the current date. The report date can be changed from the top most row of thepage.
The pie chart displays number of counts per severity level, while the tabular report contains following information:
• Severity Level: Severity level of the attack attempt. Predefined level are:
• EMERGENCY - System is not usable.• ALERT - Action must be taken immediately.• CRITICAL - Critical condition.• ERROR - Error condition.• WARNING - Warning condition.• NOTICE - Normal but significant condition.• INFORMATION – Informational.• DEBUG - Debug - level messages.
• Attack: Name of the attack.• Category: Name of the attack category, as defined in the Device. If the attack category is not defined in the Device
then this field displays ‘Uncategorized’ which means the attack is uncategorized.• Platform: Name of the attack platform, as defined in the Device. If the platform is not defined in the Device then
this field displays ‘N/A’ which means the platform of the attack is uncategorized.• Target: Displays target type. Possible target types:
• Client• Server
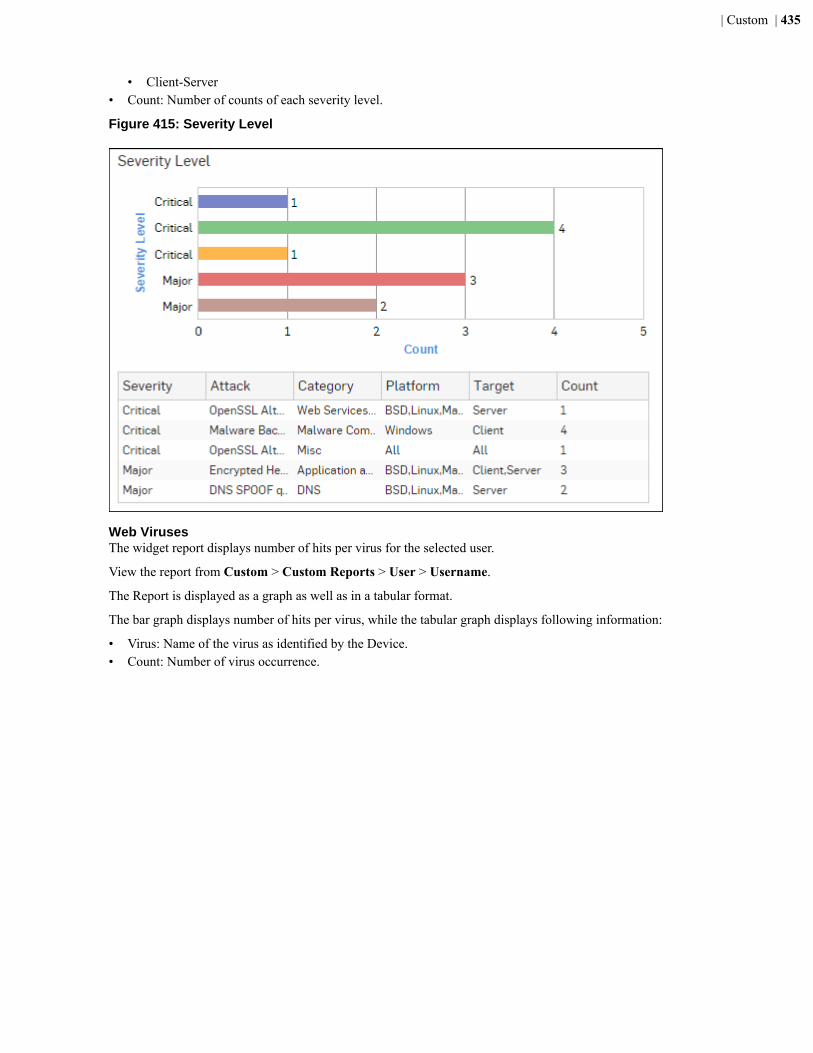
| Custom | 435
• Client-Server• Count: Number of counts of each severity level.
Figure 415: Severity Level
Web VirusesThe widget report displays number of hits per virus for the selected user.
View the report from Custom > Custom Reports > User > Username.
The Report is displayed as a graph as well as in a tabular format.
The bar graph displays number of hits per virus, while the tabular graph displays following information:
• Virus: Name of the virus as identified by the Device.• Count: Number of virus occurrence.

| Custom | 436
Figure 416: Web Viruses
Internet UsageThe widget report displays total amount of data transfer and surfing time for the selected user.
View the report from Custom > Custom Reports > User > Username.
The Report is displayed as a graph as well as in a tabular format.
The bar graph displays total amount of data transfer per user, while the tabular graph displays following information:
• User Name: Name of the user as defined in the Device.• Data Transfer: Total amount of data transfer.• Used Time: Total surfing time.
Note: Click user name hyperlink from the graph or the table to view the Filtered User Data Transfer Reports.
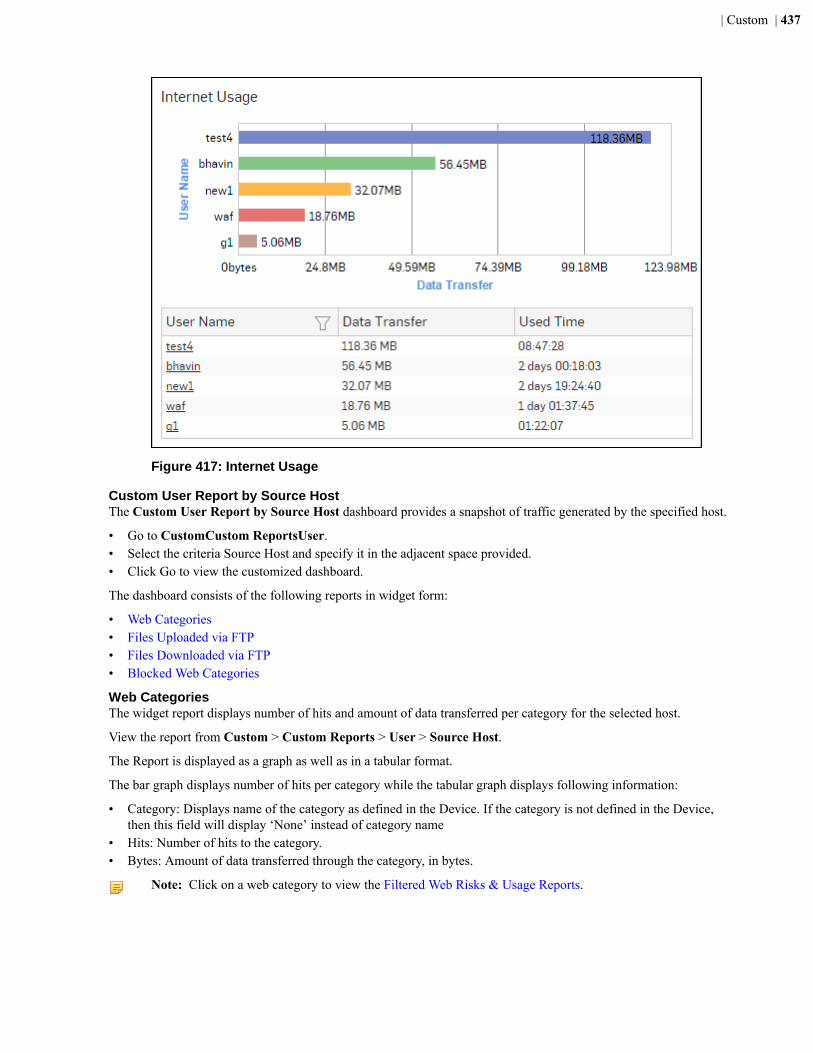
| Custom | 437
Figure 417: Internet Usage
Custom User Report by Source HostThe Custom User Report by Source Host dashboard provides a snapshot of traffic generated by the specified host.
• Go to CustomCustom ReportsUser.• Select the criteria Source Host and specify it in the adjacent space provided.• Click Go to view the customized dashboard.
The dashboard consists of the following reports in widget form:
• Web Categories• Files Uploaded via FTP• Files Downloaded via FTP• Blocked Web Categories
Web CategoriesThe widget report displays number of hits and amount of data transferred per category for the selected host.
View the report from Custom > Custom Reports > User > Source Host.
The Report is displayed as a graph as well as in a tabular format.
The bar graph displays number of hits per category while the tabular graph displays following information:
• Category: Displays name of the category as defined in the Device. If the category is not defined in the Device,then this field will display ‘None’ instead of category name
• Hits: Number of hits to the category.• Bytes: Amount of data transferred through the category, in bytes.
Note: Click on a web category to view the Filtered Web Risks & Usage Reports.
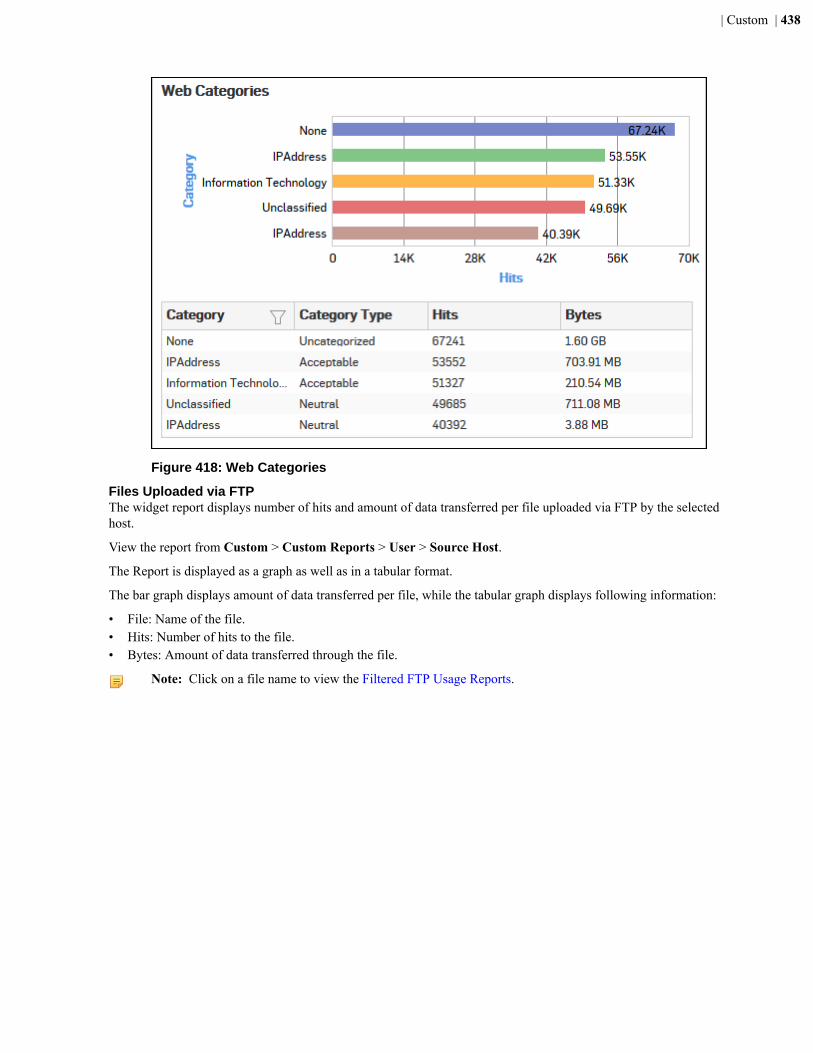
| Custom | 438
Figure 418: Web Categories
Files Uploaded via FTPThe widget report displays number of hits and amount of data transferred per file uploaded via FTP by the selectedhost.
View the report from Custom > Custom Reports > User > Source Host.
The Report is displayed as a graph as well as in a tabular format.
The bar graph displays amount of data transferred per file, while the tabular graph displays following information:
• File: Name of the file.• Hits: Number of hits to the file.• Bytes: Amount of data transferred through the file.
Note: Click on a file name to view the Filtered FTP Usage Reports.
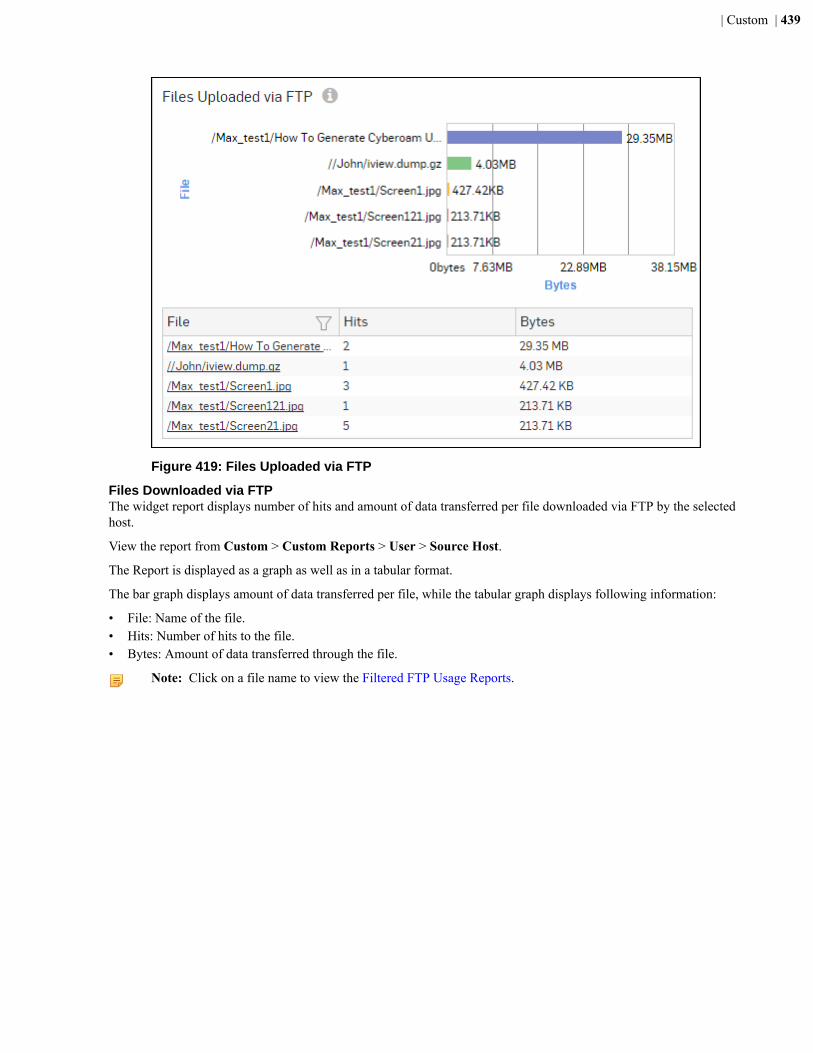
| Custom | 439
Figure 419: Files Uploaded via FTP
Files Downloaded via FTPThe widget report displays number of hits and amount of data transferred per file downloaded via FTP by the selectedhost.
View the report from Custom > Custom Reports > User > Source Host.
The Report is displayed as a graph as well as in a tabular format.
The bar graph displays amount of data transferred per file, while the tabular graph displays following information:
• File: Name of the file.• Hits: Number of hits to the file.• Bytes: Amount of data transferred through the file.
Note: Click on a file name to view the Filtered FTP Usage Reports.

| Custom | 440
Figure 420: Files Downloaded via FTP
Blocked Web CategoriesThe widget report displays the number of hits per blocked web category for the selected host.
View the report from Custom > Custom Reports > User > Source Host.
The Report is displayed as a graph as well as in a tabular format.
The bar graph displays number of hits per category while the tabular graph displays following information:
• Category: Displays name of the blocked web category as defined in the Device. If the category is not defined inthe Device, then this field will display ‘None’ instead of category name
• Hits: Number of hits to the category.
Note: Click on a category to view Filtered Blocked Web Attempts Reports.
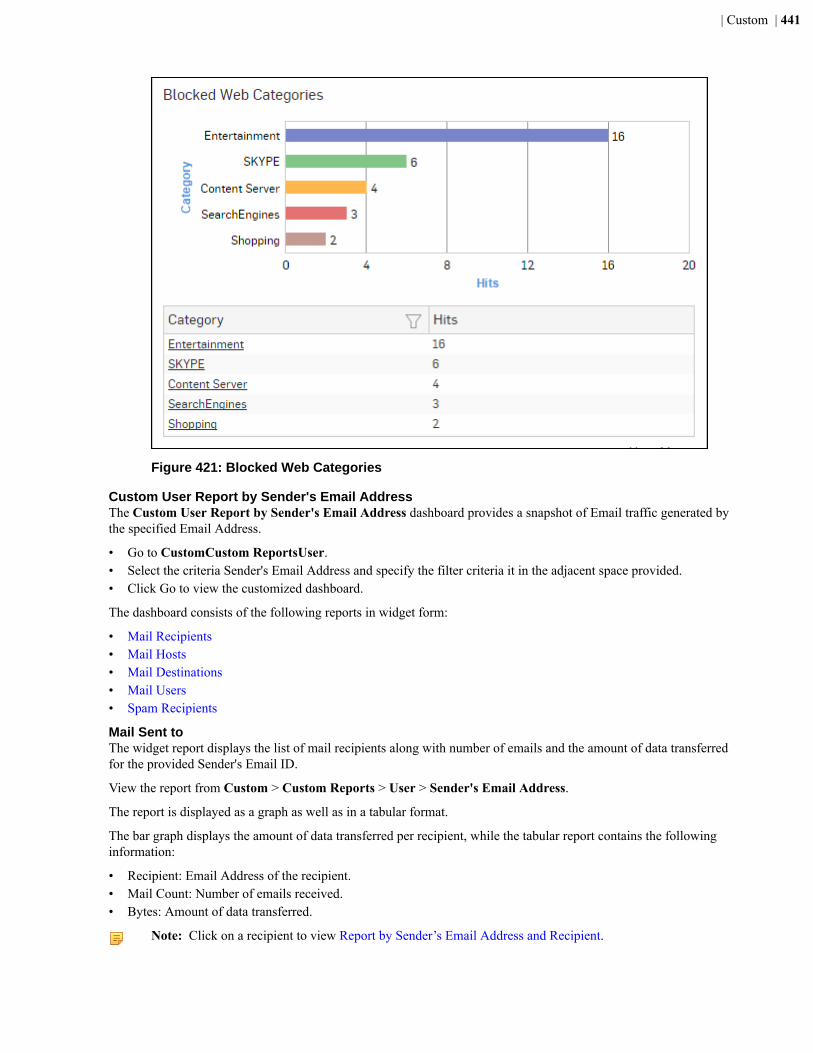
| Custom | 441
Figure 421: Blocked Web Categories
Custom User Report by Sender's Email AddressThe Custom User Report by Sender's Email Address dashboard provides a snapshot of Email traffic generated bythe specified Email Address.
• Go to CustomCustom ReportsUser.• Select the criteria Sender's Email Address and specify the filter criteria it in the adjacent space provided.• Click Go to view the customized dashboard.
The dashboard consists of the following reports in widget form:
• Mail Recipients• Mail Hosts• Mail Destinations• Mail Users• Spam Recipients
Mail Sent toThe widget report displays the list of mail recipients along with number of emails and the amount of data transferredfor the provided Sender's Email ID.
View the report from Custom > Custom Reports > User > Sender's Email Address.
The report is displayed as a graph as well as in a tabular format.
The bar graph displays the amount of data transferred per recipient, while the tabular report contains the followinginformation:
• Recipient: Email Address of the recipient.• Mail Count: Number of emails received.• Bytes: Amount of data transferred.
Note: Click on a recipient to view Report by Sender’s Email Address and Recipient.

| Custom | 442
Figure 422: Mail Sent to
Report by Sender’s Email Address and RecipientThe report displays amount of data transferred to the selected recipient(s) by the sender.
View the report from Custom > Custom Reports > User > Sender's Email Address > Recipient.
The bar graph displays amount of data transferred through each Email, while the tabular report contains the followinginformation:
• Time: Date and Time in YYYY:MM:DD HH:MM:SS format.• Subject : Subject line of the Email.• User: Username of the sender as defined in the Device. If the User is not defined then it will display ‘Unidentified’
which means the traffic is generated by an undefined user.• Host: IP Address of the host.• Destination: IP Address of the destination.• Application/Proto:Port: Displays name of the application as defined in the Device. If the application is not defined,
then this field will display the application identifier as a combination of protocol and port number.• Size: Size of the Email.
Sender HostsThe widget report displays list of mail sender hosts along with the number of emails and amount of data transferredper host,for the provided Sender's Email ID.
View the report from Custom > Custom Reports > User > Sender's Email Address.
The report is displayed as a graph as well as in a tabular format.
The bar graph displays the amount of data transferred per host, while the tabular report contains the followinginformation:
• Source Host: IP Address of the host.• Mail Count: Number of emails per host.• Bytes: Amount of data transferred.
Note: Click on a host to view Report by Sender’s Email Address and Mail Host.
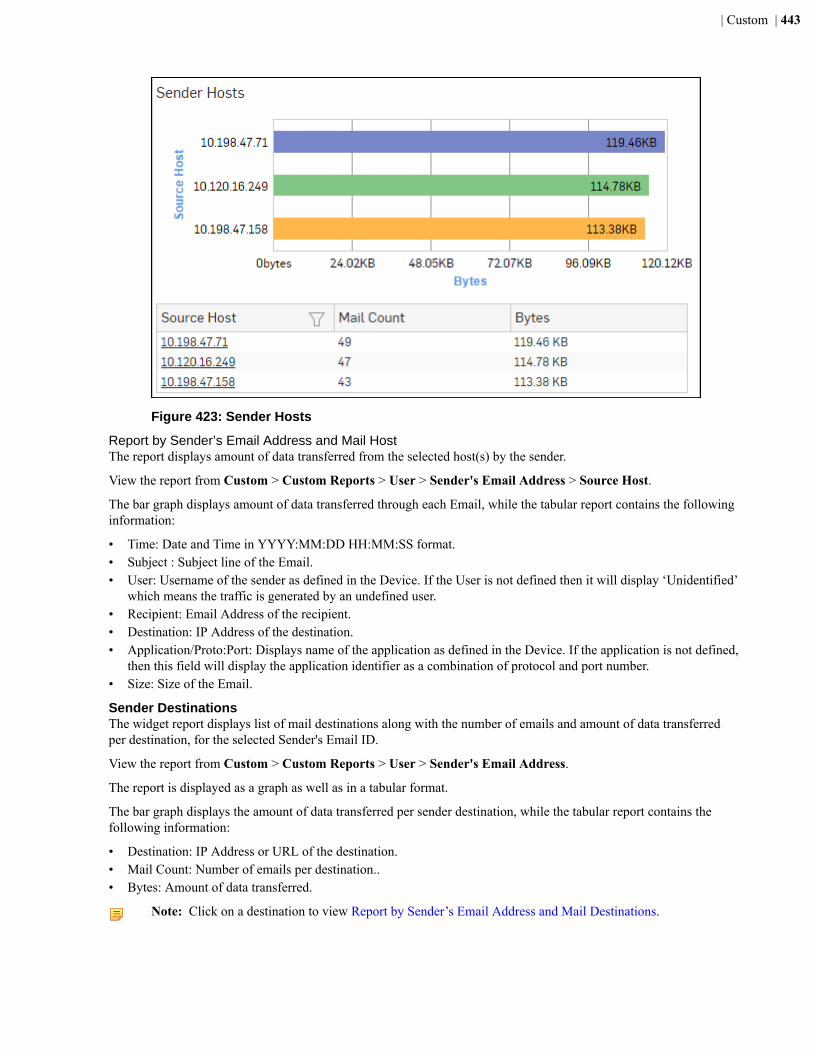
| Custom | 443
Figure 423: Sender Hosts
Report by Sender’s Email Address and Mail HostThe report displays amount of data transferred from the selected host(s) by the sender.
View the report from Custom > Custom Reports > User > Sender's Email Address > Source Host.
The bar graph displays amount of data transferred through each Email, while the tabular report contains the followinginformation:
• Time: Date and Time in YYYY:MM:DD HH:MM:SS format.• Subject : Subject line of the Email.• User: Username of the sender as defined in the Device. If the User is not defined then it will display ‘Unidentified’
which means the traffic is generated by an undefined user.• Recipient: Email Address of the recipient.• Destination: IP Address of the destination.• Application/Proto:Port: Displays name of the application as defined in the Device. If the application is not defined,
then this field will display the application identifier as a combination of protocol and port number.• Size: Size of the Email.
Sender DestinationsThe widget report displays list of mail destinations along with the number of emails and amount of data transferredper destination, for the selected Sender's Email ID.
View the report from Custom > Custom Reports > User > Sender's Email Address.
The report is displayed as a graph as well as in a tabular format.
The bar graph displays the amount of data transferred per sender destination, while the tabular report contains thefollowing information:
• Destination: IP Address or URL of the destination.• Mail Count: Number of emails per destination..• Bytes: Amount of data transferred.
Note: Click on a destination to view Report by Sender’s Email Address and Mail Destinations.
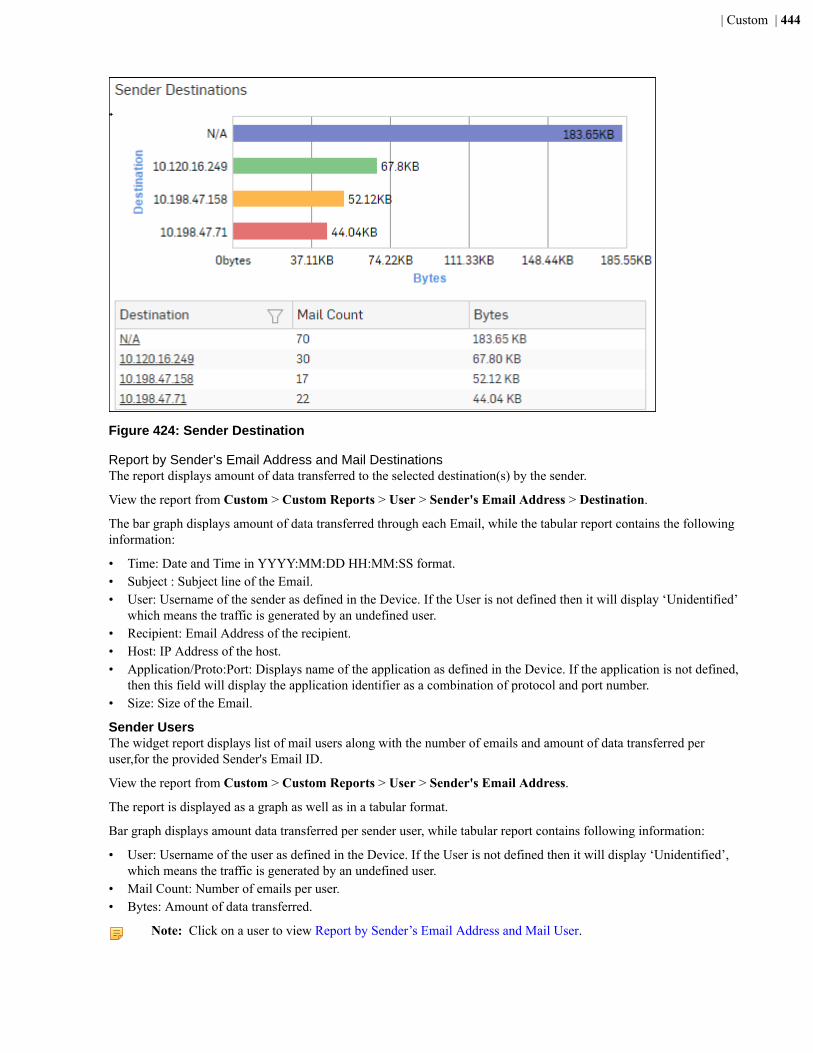
| Custom | 444
Figure 424: Sender Destination
Report by Sender’s Email Address and Mail DestinationsThe report displays amount of data transferred to the selected destination(s) by the sender.
View the report from Custom > Custom Reports > User > Sender's Email Address > Destination.
The bar graph displays amount of data transferred through each Email, while the tabular report contains the followinginformation:
• Time: Date and Time in YYYY:MM:DD HH:MM:SS format.• Subject : Subject line of the Email.• User: Username of the sender as defined in the Device. If the User is not defined then it will display ‘Unidentified’
which means the traffic is generated by an undefined user.• Recipient: Email Address of the recipient.• Host: IP Address of the host.• Application/Proto:Port: Displays name of the application as defined in the Device. If the application is not defined,
then this field will display the application identifier as a combination of protocol and port number.• Size: Size of the Email.
Sender UsersThe widget report displays list of mail users along with the number of emails and amount of data transferred peruser,for the provided Sender's Email ID.
View the report from Custom > Custom Reports > User > Sender's Email Address.
The report is displayed as a graph as well as in a tabular format.
Bar graph displays amount data transferred per sender user, while tabular report contains following information:
• User: Username of the user as defined in the Device. If the User is not defined then it will display ‘Unidentified’,which means the traffic is generated by an undefined user.
• Mail Count: Number of emails per user.• Bytes: Amount of data transferred.
Note: Click on a user to view Report by Sender’s Email Address and Mail User.
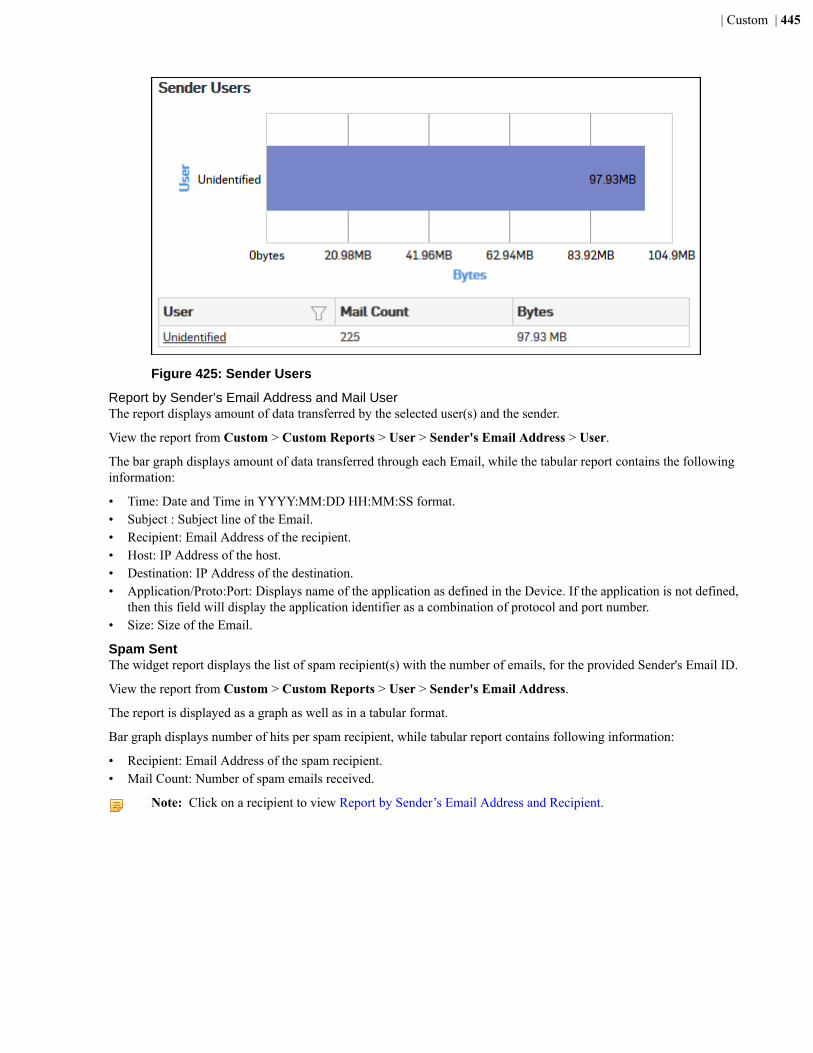
| Custom | 445
Figure 425: Sender Users
Report by Sender’s Email Address and Mail UserThe report displays amount of data transferred by the selected user(s) and the sender.
View the report from Custom > Custom Reports > User > Sender's Email Address > User.
The bar graph displays amount of data transferred through each Email, while the tabular report contains the followinginformation:
• Time: Date and Time in YYYY:MM:DD HH:MM:SS format.• Subject : Subject line of the Email.• Recipient: Email Address of the recipient.• Host: IP Address of the host.• Destination: IP Address of the destination.• Application/Proto:Port: Displays name of the application as defined in the Device. If the application is not defined,
then this field will display the application identifier as a combination of protocol and port number.• Size: Size of the Email.
Spam SentThe widget report displays the list of spam recipient(s) with the number of emails, for the provided Sender's Email ID.
View the report from Custom > Custom Reports > User > Sender's Email Address.
The report is displayed as a graph as well as in a tabular format.
Bar graph displays number of hits per spam recipient, while tabular report contains following information:
• Recipient: Email Address of the spam recipient.• Mail Count: Number of spam emails received.
Note: Click on a recipient to view Report by Sender’s Email Address and Recipient.
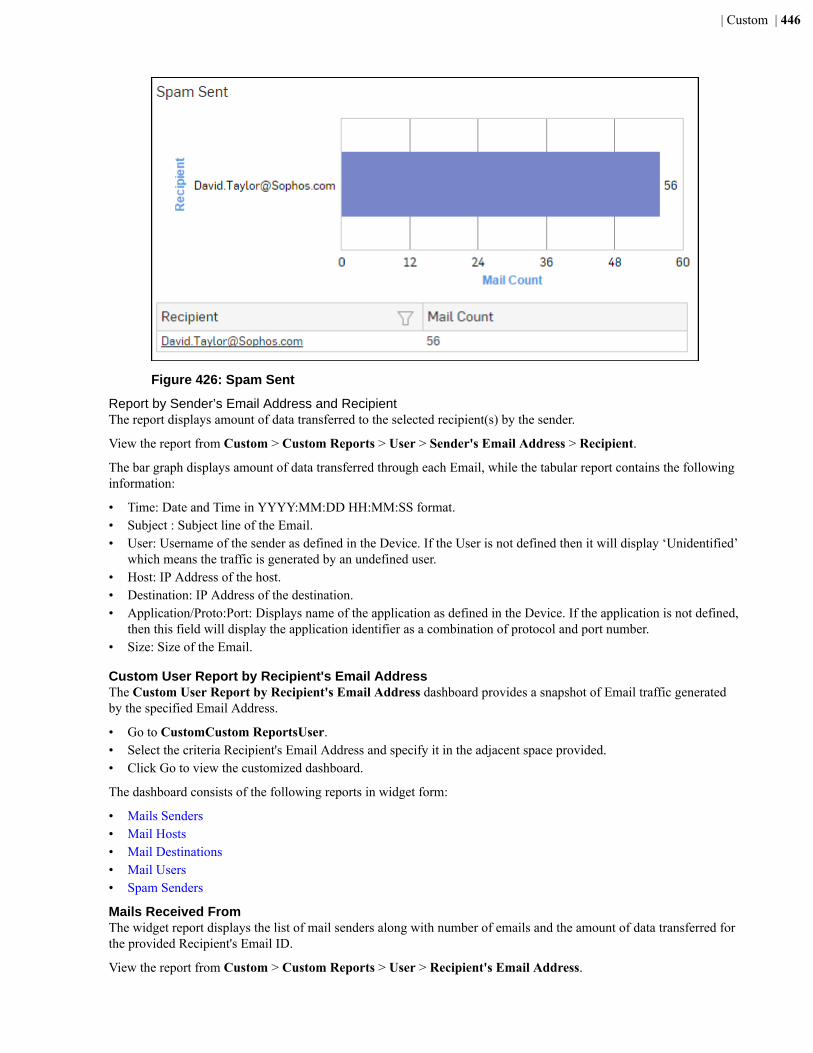
| Custom | 446
Figure 426: Spam Sent
Report by Sender’s Email Address and RecipientThe report displays amount of data transferred to the selected recipient(s) by the sender.
View the report from Custom > Custom Reports > User > Sender's Email Address > Recipient.
The bar graph displays amount of data transferred through each Email, while the tabular report contains the followinginformation:
• Time: Date and Time in YYYY:MM:DD HH:MM:SS format.• Subject : Subject line of the Email.• User: Username of the sender as defined in the Device. If the User is not defined then it will display ‘Unidentified’
which means the traffic is generated by an undefined user.• Host: IP Address of the host.• Destination: IP Address of the destination.• Application/Proto:Port: Displays name of the application as defined in the Device. If the application is not defined,
then this field will display the application identifier as a combination of protocol and port number.• Size: Size of the Email.
Custom User Report by Recipient's Email AddressThe Custom User Report by Recipient's Email Address dashboard provides a snapshot of Email traffic generatedby the specified Email Address.
• Go to CustomCustom ReportsUser.• Select the criteria Recipient's Email Address and specify it in the adjacent space provided.• Click Go to view the customized dashboard.
The dashboard consists of the following reports in widget form:
• Mails Senders• Mail Hosts• Mail Destinations• Mail Users• Spam Senders
Mails Received FromThe widget report displays the list of mail senders along with number of emails and the amount of data transferred forthe provided Recipient's Email ID.
View the report from Custom > Custom Reports > User > Recipient's Email Address.
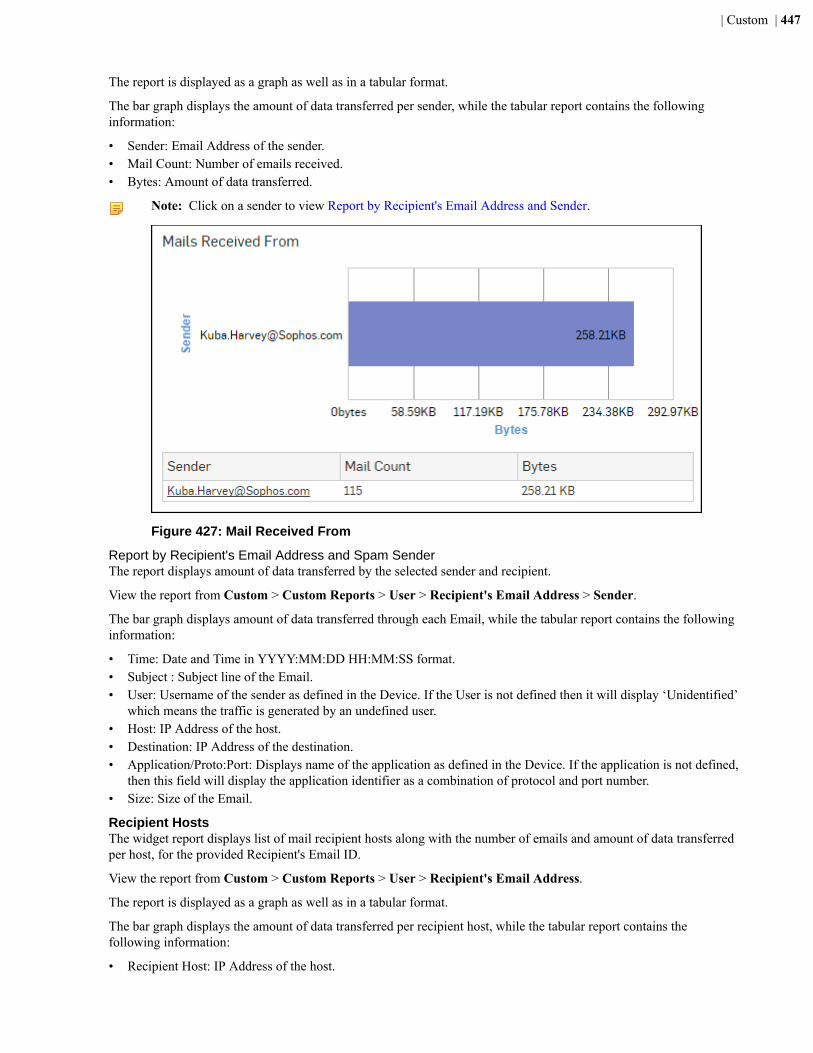
| Custom | 447
The report is displayed as a graph as well as in a tabular format.
The bar graph displays the amount of data transferred per sender, while the tabular report contains the followinginformation:
• Sender: Email Address of the sender.• Mail Count: Number of emails received.• Bytes: Amount of data transferred.
Note: Click on a sender to view Report by Recipient's Email Address and Sender.
Figure 427: Mail Received From
Report by Recipient's Email Address and Spam SenderThe report displays amount of data transferred by the selected sender and recipient.
View the report from Custom > Custom Reports > User > Recipient's Email Address > Sender.
The bar graph displays amount of data transferred through each Email, while the tabular report contains the followinginformation:
• Time: Date and Time in YYYY:MM:DD HH:MM:SS format.• Subject : Subject line of the Email.• User: Username of the sender as defined in the Device. If the User is not defined then it will display ‘Unidentified’
which means the traffic is generated by an undefined user.• Host: IP Address of the host.• Destination: IP Address of the destination.• Application/Proto:Port: Displays name of the application as defined in the Device. If the application is not defined,
then this field will display the application identifier as a combination of protocol and port number.• Size: Size of the Email.
Recipient HostsThe widget report displays list of mail recipient hosts along with the number of emails and amount of data transferredper host, for the provided Recipient's Email ID.
View the report from Custom > Custom Reports > User > Recipient's Email Address.
The report is displayed as a graph as well as in a tabular format.
The bar graph displays the amount of data transferred per recipient host, while the tabular report contains thefollowing information:
• Recipient Host: IP Address of the host.
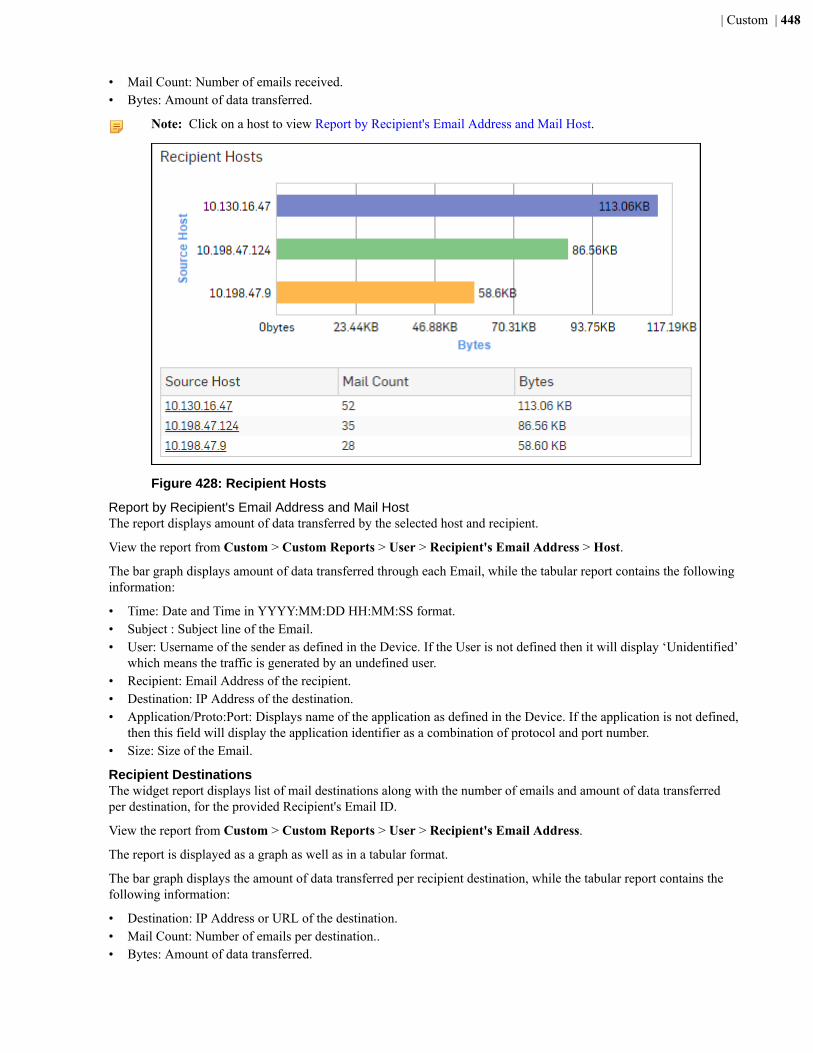
| Custom | 448
• Mail Count: Number of emails received.• Bytes: Amount of data transferred.
Note: Click on a host to view Report by Recipient's Email Address and Mail Host.
Figure 428: Recipient Hosts
Report by Recipient's Email Address and Mail HostThe report displays amount of data transferred by the selected host and recipient.
View the report from Custom > Custom Reports > User > Recipient's Email Address > Host.
The bar graph displays amount of data transferred through each Email, while the tabular report contains the followinginformation:
• Time: Date and Time in YYYY:MM:DD HH:MM:SS format.• Subject : Subject line of the Email.• User: Username of the sender as defined in the Device. If the User is not defined then it will display ‘Unidentified’
which means the traffic is generated by an undefined user.• Recipient: Email Address of the recipient.• Destination: IP Address of the destination.• Application/Proto:Port: Displays name of the application as defined in the Device. If the application is not defined,
then this field will display the application identifier as a combination of protocol and port number.• Size: Size of the Email.
Recipient DestinationsThe widget report displays list of mail destinations along with the number of emails and amount of data transferredper destination, for the provided Recipient's Email ID.
View the report from Custom > Custom Reports > User > Recipient's Email Address.
The report is displayed as a graph as well as in a tabular format.
The bar graph displays the amount of data transferred per recipient destination, while the tabular report contains thefollowing information:
• Destination: IP Address or URL of the destination.• Mail Count: Number of emails per destination..• Bytes: Amount of data transferred.
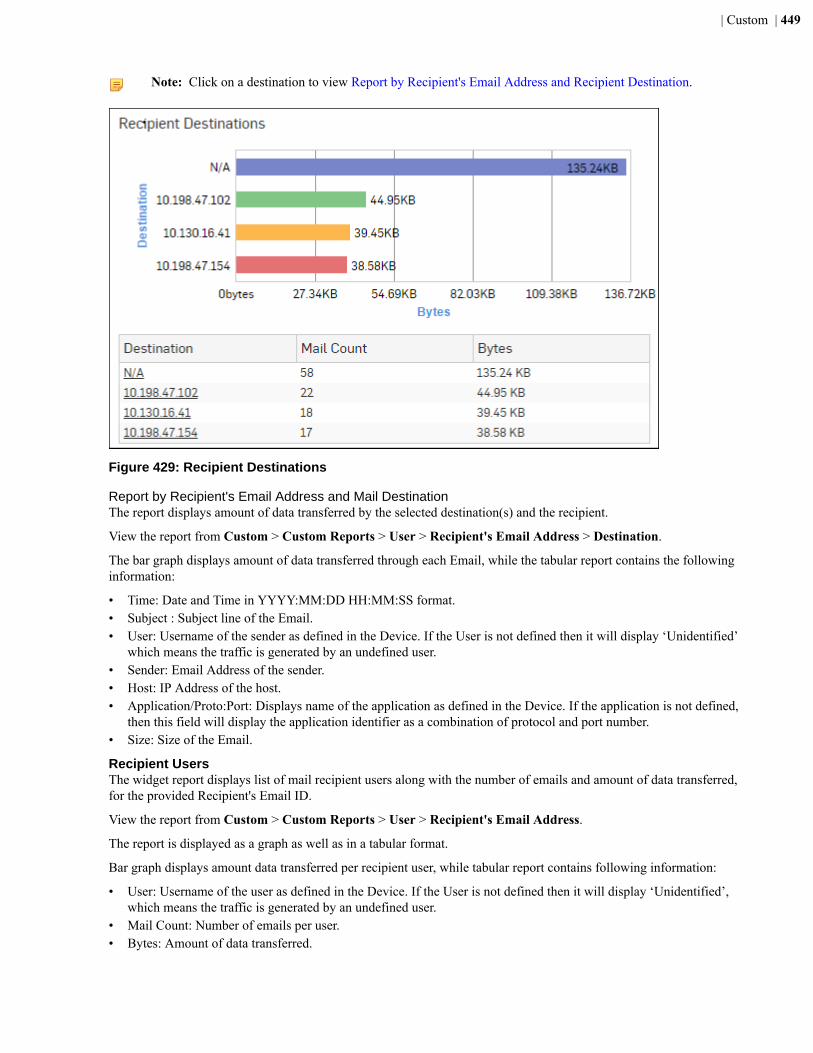
| Custom | 449
Note: Click on a destination to view Report by Recipient's Email Address and Recipient Destination.
Figure 429: Recipient Destinations
Report by Recipient's Email Address and Mail DestinationThe report displays amount of data transferred by the selected destination(s) and the recipient.
View the report from Custom > Custom Reports > User > Recipient's Email Address > Destination.
The bar graph displays amount of data transferred through each Email, while the tabular report contains the followinginformation:
• Time: Date and Time in YYYY:MM:DD HH:MM:SS format.• Subject : Subject line of the Email.• User: Username of the sender as defined in the Device. If the User is not defined then it will display ‘Unidentified’
which means the traffic is generated by an undefined user.• Sender: Email Address of the sender.• Host: IP Address of the host.• Application/Proto:Port: Displays name of the application as defined in the Device. If the application is not defined,
then this field will display the application identifier as a combination of protocol and port number.• Size: Size of the Email.
Recipient UsersThe widget report displays list of mail recipient users along with the number of emails and amount of data transferred,for the provided Recipient's Email ID.
View the report from Custom > Custom Reports > User > Recipient's Email Address.
The report is displayed as a graph as well as in a tabular format.
Bar graph displays amount data transferred per recipient user, while tabular report contains following information:
• User: Username of the user as defined in the Device. If the User is not defined then it will display ‘Unidentified’,which means the traffic is generated by an undefined user.
• Mail Count: Number of emails per user.• Bytes: Amount of data transferred.

| Custom | 450
Note: Click on a user to view Report by Recipient's Email Address and Mail User.
Figure 430: Recipient Users
Report by Recipient's Email Address and Mail UserThe report displays amount of data transferred by the selected user(s) and the recipient.
View the report from Custom > Custom Reports > User > Recipient's Email Address > User.
The bar graph displays amount of data transferred through each Email, while the tabular report contains the followinginformation:
• Time: Date and Time in YYYY:MM:DD HH:MM:SS format.• Sender: Email Address of the sender.• Subject : Subject line of the Email.• User: Username of the sender as defined in the Device. If the User is not defined, then it will display
‘Unidentified’ which means the traffic is generated by an undefined user.• Host: IP Address of the host.• Destination: IP Address of the destination.• Application/Proto:Port: Name of the application as defined in the Device. If the application is not defined, then
this field will display the application identifier as a combination of protocol and port number.• Size: Size of the Email.
Spam SenderThe widget report displays the list of spam senders along with the number of emails per sender, for the providedRecipient's Email ID.
View the report from Custom > Custom Reports > User > Recipient's Email Address.
The report is displayed as a graph as well as in a tabular format.
Bar graph displays number of hits per spam sender, while tabular report contains following information:
• Sender: Email Address of the spam sender.• Mail Count: Number of spam emails received.
Note: Click on a sender to view Report by Recipient's Email Address and Spam Sender.
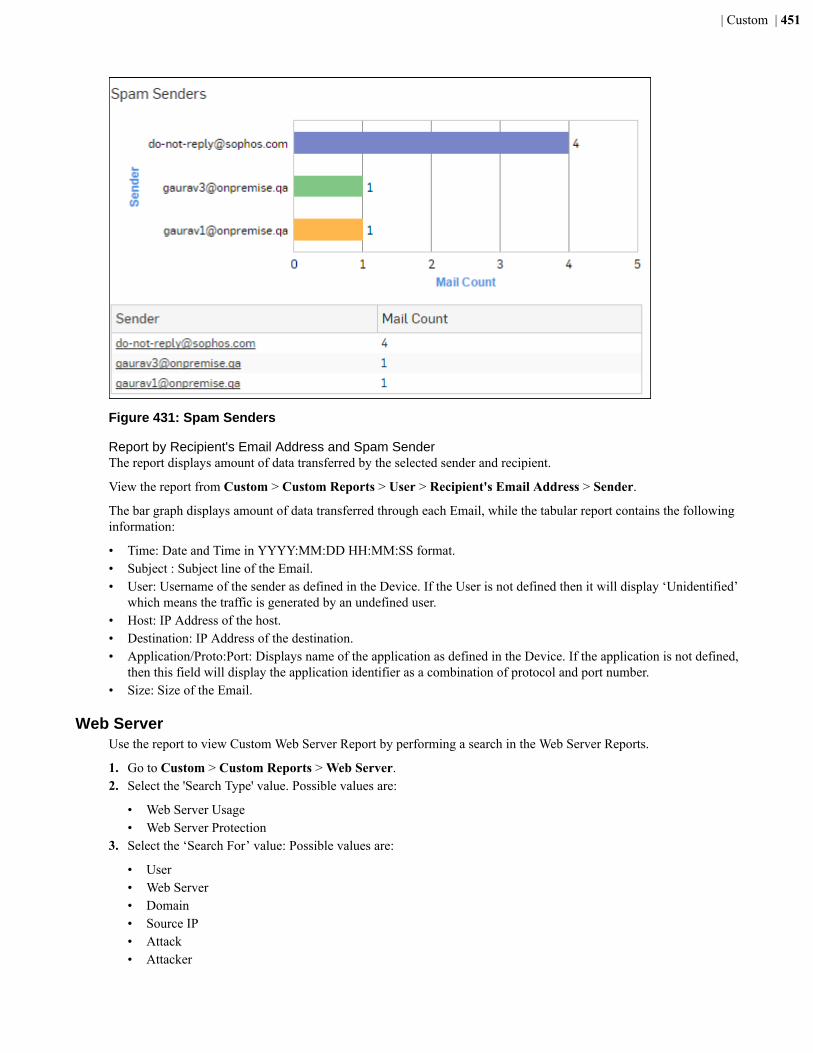
| Custom | 451
Figure 431: Spam Senders
Report by Recipient's Email Address and Spam SenderThe report displays amount of data transferred by the selected sender and recipient.
View the report from Custom > Custom Reports > User > Recipient's Email Address > Sender.
The bar graph displays amount of data transferred through each Email, while the tabular report contains the followinginformation:
• Time: Date and Time in YYYY:MM:DD HH:MM:SS format.• Subject : Subject line of the Email.• User: Username of the sender as defined in the Device. If the User is not defined then it will display ‘Unidentified’
which means the traffic is generated by an undefined user.• Host: IP Address of the host.• Destination: IP Address of the destination.• Application/Proto:Port: Displays name of the application as defined in the Device. If the application is not defined,
then this field will display the application identifier as a combination of protocol and port number.• Size: Size of the Email.
Web ServerUse the report to view Custom Web Server Report by performing a search in the Web Server Reports.
1. Go to Custom > Custom Reports > Web Server.2. Select the 'Search Type' value. Possible values are:
• Web Server Usage• Web Server Protection
3. Select the ‘Search For’ value: Possible values are:
• User• Web Server• Domain• Source IP• Attack• Attacker
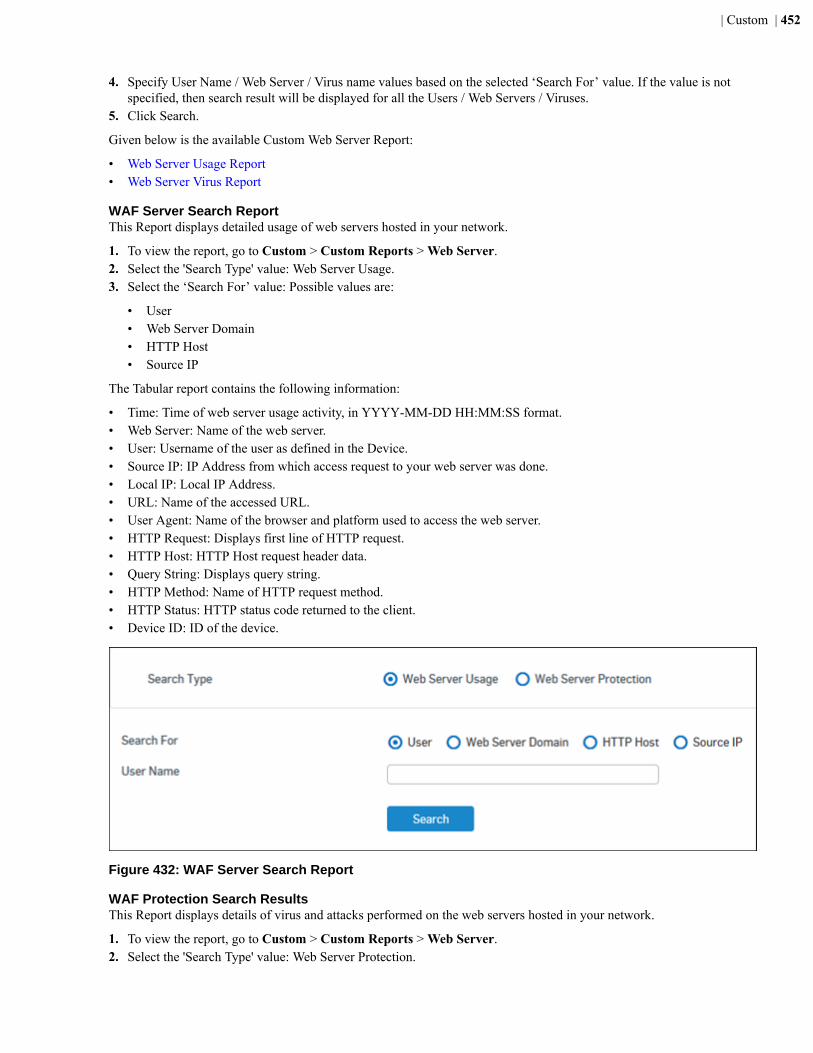
| Custom | 452
4. Specify User Name / Web Server / Virus name values based on the selected ‘Search For’ value. If the value is notspecified, then search result will be displayed for all the Users / Web Servers / Viruses.
5. Click Search.
Given below is the available Custom Web Server Report:
• Web Server Usage Report• Web Server Virus Report
WAF Server Search ReportThis Report displays detailed usage of web servers hosted in your network.
1. To view the report, go to Custom > Custom Reports > Web Server.2. Select the 'Search Type' value: Web Server Usage.3. Select the ‘Search For’ value: Possible values are:
• User• Web Server Domain• HTTP Host• Source IP
The Tabular report contains the following information:
• Time: Time of web server usage activity, in YYYY-MM-DD HH:MM:SS format.• Web Server: Name of the web server.• User: Username of the user as defined in the Device.• Source IP: IP Address from which access request to your web server was done.• Local IP: Local IP Address.• URL: Name of the accessed URL.• User Agent: Name of the browser and platform used to access the web server.• HTTP Request: Displays first line of HTTP request.• HTTP Host: HTTP Host request header data.• Query String: Displays query string.• HTTP Method: Name of HTTP request method.• HTTP Status: HTTP status code returned to the client.• Device ID: ID of the device.
Figure 432: WAF Server Search Report
WAF Protection Search ResultsThis Report displays details of virus and attacks performed on the web servers hosted in your network.
1. To view the report, go to Custom > Custom Reports > Web Server.2. Select the 'Search Type' value: Web Server Protection.
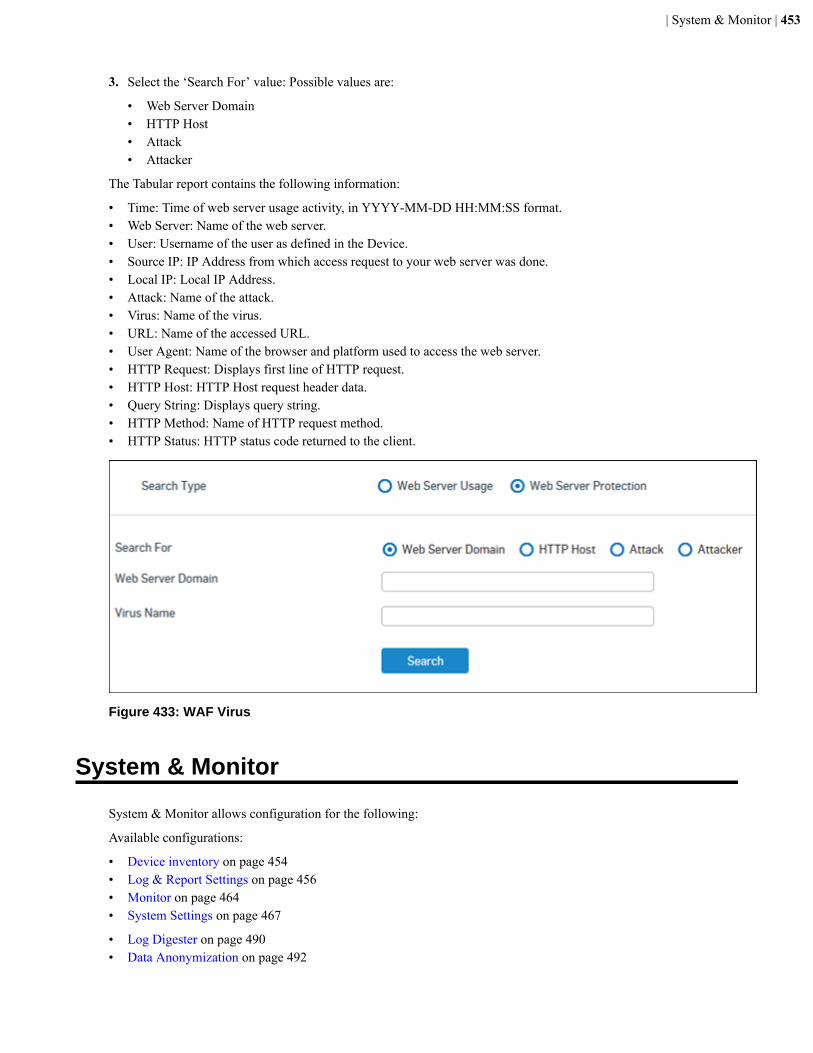
| System & Monitor | 453
3. Select the ‘Search For’ value: Possible values are:
• Web Server Domain• HTTP Host• Attack• Attacker
The Tabular report contains the following information:
• Time: Time of web server usage activity, in YYYY-MM-DD HH:MM:SS format.• Web Server: Name of the web server.• User: Username of the user as defined in the Device.• Source IP: IP Address from which access request to your web server was done.• Local IP: Local IP Address.• Attack: Name of the attack.• Virus: Name of the virus.• URL: Name of the accessed URL.• User Agent: Name of the browser and platform used to access the web server.• HTTP Request: Displays first line of HTTP request.• HTTP Host: HTTP Host request header data.• Query String: Displays query string.• HTTP Method: Name of HTTP request method.• HTTP Status: HTTP status code returned to the client.
Figure 433: WAF Virus
System & Monitor
System & Monitor allows configuration for the following:
Available configurations:
• Device inventory on page 454• Log & Report Settings on page 456• Monitor on page 464• System Settings on page 467
• Log Digester on page 490• Data Anonymization on page 492
| System & Monitor | 454
Device inventory
This section describes how to add network devices to Sophos -iView, and customize Sophos -iView as perrequirement.
This section covers the following topics:
•Devices on page 454 : Add and manage network devices.
•Device Group on page 455 : Create and manage groups of devices to generate reports.
Devices
Sophos -iView provides consolidated reports for multiple devices. It helps the Admin to view consolidated reportsand dashboards for devices at one shot. This section describes how to add and configure devices that communicatewith Sophos -iView.
Use System & Monitor > Device Inventory > Devices page to add and configure devices to communicate withSophos -iView. Use this page to:
• Add/Update Device• Activate/De-activate Device
Add/Update Device
There are two ways to add device to the Sophos -iView:
• Device-Auto Discovery• Manual Device Addition
Device Auto-Discovery
Sophos-iView uses UDP protocol to discover the network device automatically. In order to send logs to Sophos-iView, network device has to configure Sophos-iView as a Syslog server. On successful login, Super Admin isprompted with a pop-up "New Device Found" if a new device is discovered; else the Main Dashboard is displayed.This prompt will be displayed every time Super Admin logs in, until an action is taken on the newly discovereddevice.
Super Admin can:
1. ignore this prompt by clicking Cancel.2. accept and activate the device by providing Device Name and Device Type. Sophos-iView will accept the logs
only after device is activated.3. accept and keep device in deactivated state. Sophos-iView will not accept the logs if device is in inactive state.

| System & Monitor | 455
Figure 434: Add Device Pop-up
Manual Device Addition
1. Go to System & Monitor > Device Inventory > Devices and click Add.2. Specify device ID and device name. Device ID and device name can be any combination of alphanumeric
characters and special characters “_”, “@” and “.”.3. Specify IP address of the device.4. Select device type from the drop down.5. Specify device description, if required.6. Select status of the device from drop down, default status of a device is ‘Inactive’. To receive logs from the device
one needs to activate the device in Sophos-iView.
Figure 435: Add Device
Activate/Deactivate Device
Activate Device
1. Go to System & Monitor > Device Inventory > Devices and click Active/Inactive against device name.2. You can also activate or deactivate the device by clicking on the required device for updating.
Device Group
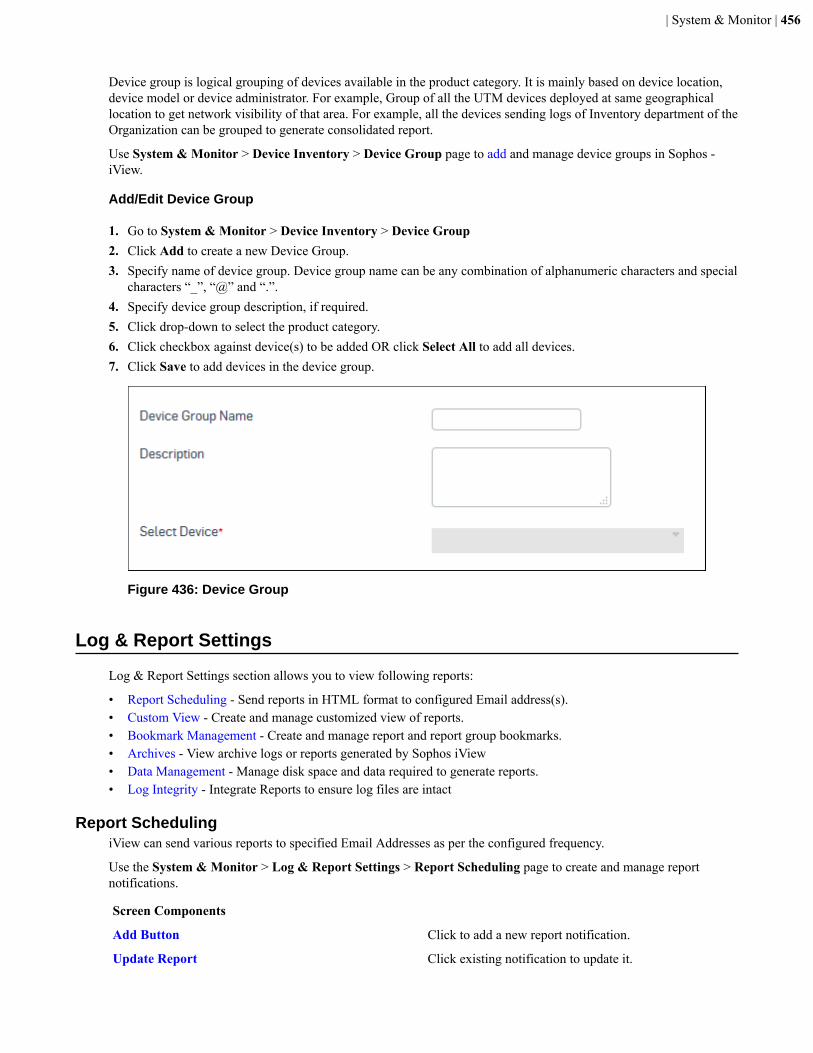
| System & Monitor | 456
Device group is logical grouping of devices available in the product category. It is mainly based on device location,device model or device administrator. For example, Group of all the UTM devices deployed at same geographicallocation to get network visibility of that area. For example, all the devices sending logs of Inventory department of theOrganization can be grouped to generate consolidated report.
Use System & Monitor > Device Inventory > Device Group page to add and manage device groups in Sophos -iView.
Add/Edit Device Group
1. Go to System & Monitor > Device Inventory > Device Group2. Click Add to create a new Device Group.3. Specify name of device group. Device group name can be any combination of alphanumeric characters and special
characters “_”, “@” and “.”.4. Specify device group description, if required.5. Click drop-down to select the product category.6. Click checkbox against device(s) to be added OR click Select All to add all devices.7. Click Save to add devices in the device group.
Figure 436: Device Group
Log & Report Settings
Log & Report Settings section allows you to view following reports:
• Report Scheduling - Send reports in HTML format to configured Email address(s).• Custom View - Create and manage customized view of reports.• Bookmark Management - Create and manage report and report group bookmarks.• Archives - View archive logs or reports generated by Sophos iView• Data Management - Manage disk space and data required to generate reports.• Log Integrity - Integrate Reports to ensure log files are intact
Report SchedulingiView can send various reports to specified Email Addresses as per the configured frequency.
Use the System & Monitor > Log & Report Settings > Report Scheduling page to create and manage reportnotifications.
Screen Components
Add Button Click to add a new report notification.
Update Report Click existing notification to update it.
| System & Monitor | 457
Screen Components
Delete Button Click to delete a report notification.
Report Notification
Name Name of the report notification.
Report Group/Bookmark Category of reports.
Device Name Name of Device(s) whose reports are included in reportnotification.
Email Frequency Report notification frequency- daily or weekly.
To Email Address Email ID of recipient(s).
Last Sent Time Last time when the report notification was sent.
Add Report Schedule
Create a new Report Notification for one or more reports.
1. Go to System & Monitor > Log & Report Settings > Report Scheduling.2. Click Add to create a new report notification.3. Select reports to be sent.
• Report Notification:
Specify report notification name. Name can be any combination of alphanumeric characters and specialcharacters “_”, “@” and “.”.
Specify description of the report notification, if required.
Specify Email address of the recipient in ‘To Email Address’ field. Use comma, with no space in between, tospecify multiple Email IDs.
Select Category.
Select notification type. Possible types of reports are Report Group and Bookmark.
Select sorting criteria from the Sorting Criteria field. Possible options are Hits and Bytes.
Select report category from the Report Group or Bookmark drop down list. Reports from selected categorywill be sent to the recipients.
Select the Devices whose reports are to be included in the notification. Select devices from the AvailableDevices list. They appear in the Selected Devices list.
Set Email frequency and time. Reports can be mailed daily or weekly. For daily notification select time of theday to send the report. For weekly notification, select day of the week and time of the day to send the report.
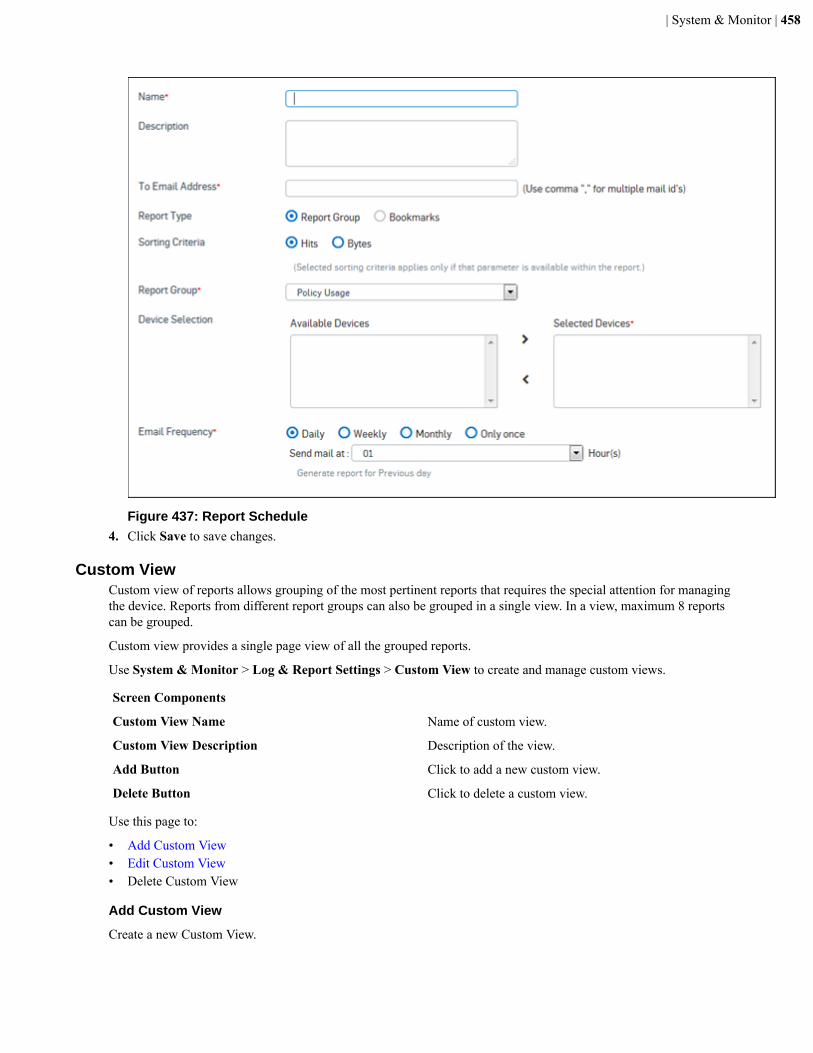
| System & Monitor | 458
Figure 437: Report Schedule4. Click Save to save changes.
Custom ViewCustom view of reports allows grouping of the most pertinent reports that requires the special attention for managingthe device. Reports from different report groups can also be grouped in a single view. In a view, maximum 8 reportscan be grouped.
Custom view provides a single page view of all the grouped reports.
Use System & Monitor > Log & Report Settings > Custom View to create and manage custom views.
Screen Components
Custom View Name Name of custom view.
Custom View Description Description of the view.
Add Button Click to add a new custom view.
Delete Button Click to delete a custom view.
Use this page to:
• Add Custom View• Edit Custom View• Delete Custom View
Add Custom View
Create a new Custom View.

| System & Monitor | 459
Note: Added Custom Views will be displayed under Custom Views sub-menu of navigation pane.
1. Go to System & Monitor > Log & Report Settings > Custom View.2. Click Add to create a new Custom View3. Specify Custom View Name. Custom view name can be any combination of alphanumeric characters and special
characters “_”, “@” and “.”.4. Specify description of the Custom View, if required.5. Expand report group and select the reports to be added in custom view. Maximum 8 reports can be added per
custom view.6. Click Save to add selected reports in the Custom View.
Figure 438: Custom View
Bookmark ManagementBookmark management allows the user to create bookmark of any report at any level of report drill-down. It providesadministrator with great level of network visibility based on any criterion.
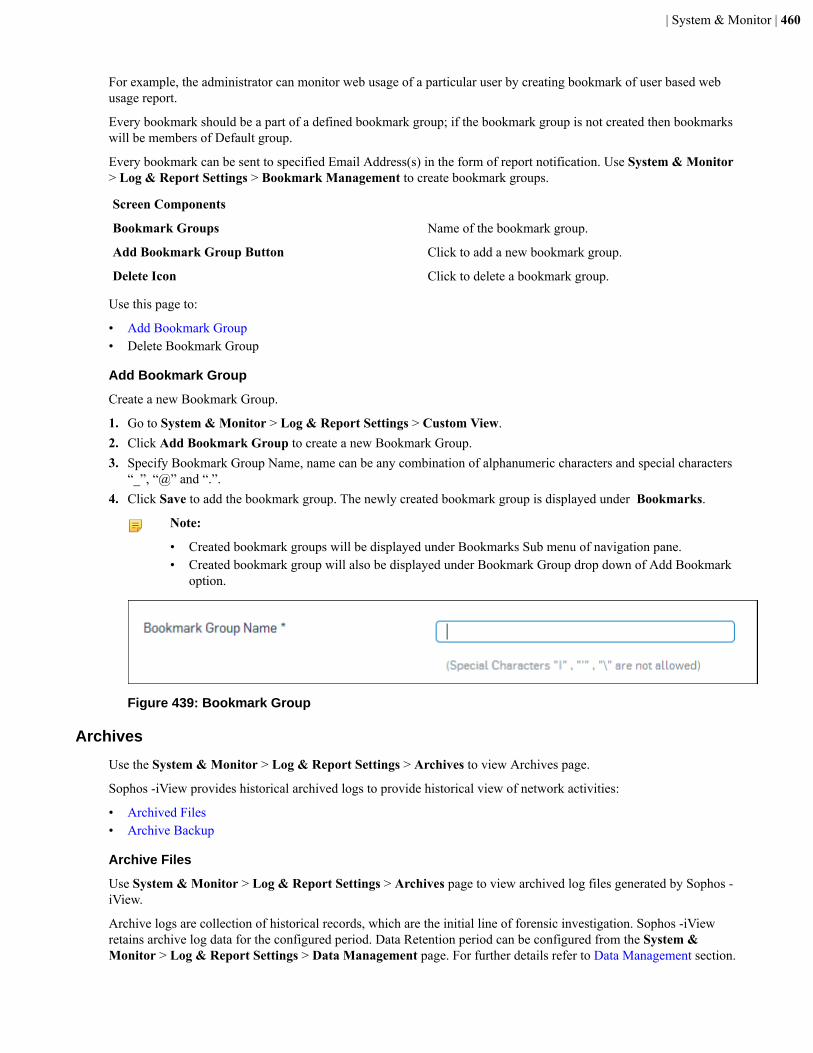
| System & Monitor | 460
For example, the administrator can monitor web usage of a particular user by creating bookmark of user based webusage report.
Every bookmark should be a part of a defined bookmark group; if the bookmark group is not created then bookmarkswill be members of Default group.
Every bookmark can be sent to specified Email Address(s) in the form of report notification. Use System & Monitor> Log & Report Settings > Bookmark Management to create bookmark groups.
Screen Components
Bookmark Groups Name of the bookmark group.
Add Bookmark Group Button Click to add a new bookmark group.
Delete Icon Click to delete a bookmark group.
Use this page to:
• Add Bookmark Group• Delete Bookmark Group
Add Bookmark Group
Create a new Bookmark Group.
1. Go to System & Monitor > Log & Report Settings > Custom View.2. Click Add Bookmark Group to create a new Bookmark Group.3. Specify Bookmark Group Name, name can be any combination of alphanumeric characters and special characters
“_”, “@” and “.”.4. Click Save to add the bookmark group. The newly created bookmark group is displayed under Bookmarks.
Note:
• Created bookmark groups will be displayed under Bookmarks Sub menu of navigation pane.• Created bookmark group will also be displayed under Bookmark Group drop down of Add Bookmark
option.
Figure 439: Bookmark Group
Archives
Use the System & Monitor > Log & Report Settings > Archives to view Archives page.
Sophos -iView provides historical archived logs to provide historical view of network activities:
• Archived Files• Archive Backup
Archive Files
Use System & Monitor > Log & Report Settings > Archives page to view archived log files generated by Sophos -iView.
Archive logs are collection of historical records, which are the initial line of forensic investigation. Sophos -iViewretains archive log data for the configured period. Data Retention period can be configured from the System &Monitor > Log & Report Settings > Data Management page. For further details refer to Data Management section.
| System & Monitor | 461
Archive Backup
iView allows the Administrator to take backup of historical archived logs to improve usage of available storage space.The Administrator can download and restore the backup files as and when required. Use System & Monitor > Log &Report Settings > Archives > Archive Backup to:
• Backup Archive Files• Download Backup Files• Restore Backup Files
Backup Archive Files
1. Select one or multiple network devices from the device drop down given at top left.2. Select date range from the given calendar.3. Click OK to save the selection.4. Click Go to view archived files for selected date.5. Select the Backup Frequency, either Never or Daily, to schedule automatic backup. If DailyProvide details of
FTP server.6. Select check box against file(s) and click Backup Now to take backup of the files in iView machine.7. Select Full Day Backup checkbox and click Backup Now to take full day back up at once.
Note:
• Super Admin or Admin privilege required to take backup of archived file.• Unloading of the archived file is required to take backup.• If the archived file is partially loaded, then backup of only unloaded data will be taken.• Once the backup file is created, Administrator can download the backup file on any machine including
Cyberoam-iView machine itself.
Download Backup Files
1. Click Download Backup Files.2. Click Download against the filename. The file will be downloaded on local machine from where iView Admin
Console is accessed.
Note:
• Super Admin or Admin privilege required to download backup of archive file.• To help identity the backup of each device, Backup file is named as <Device ID_
YYYYMMDDStartHourEndHour> Where:
• Device ID - As configured in Cyberoam-iView• YYYYMMDD - Date as displayed on Archive Files page under Date column• Start Hour End Hour – Time as displayed on Archive Files page under File Details column
Restore Backup Files
1. Browse file to be restored. Click Add to restore multiple files.2. Click Restore.
Note: Super Admin or Admin privilege required to restore backup files.
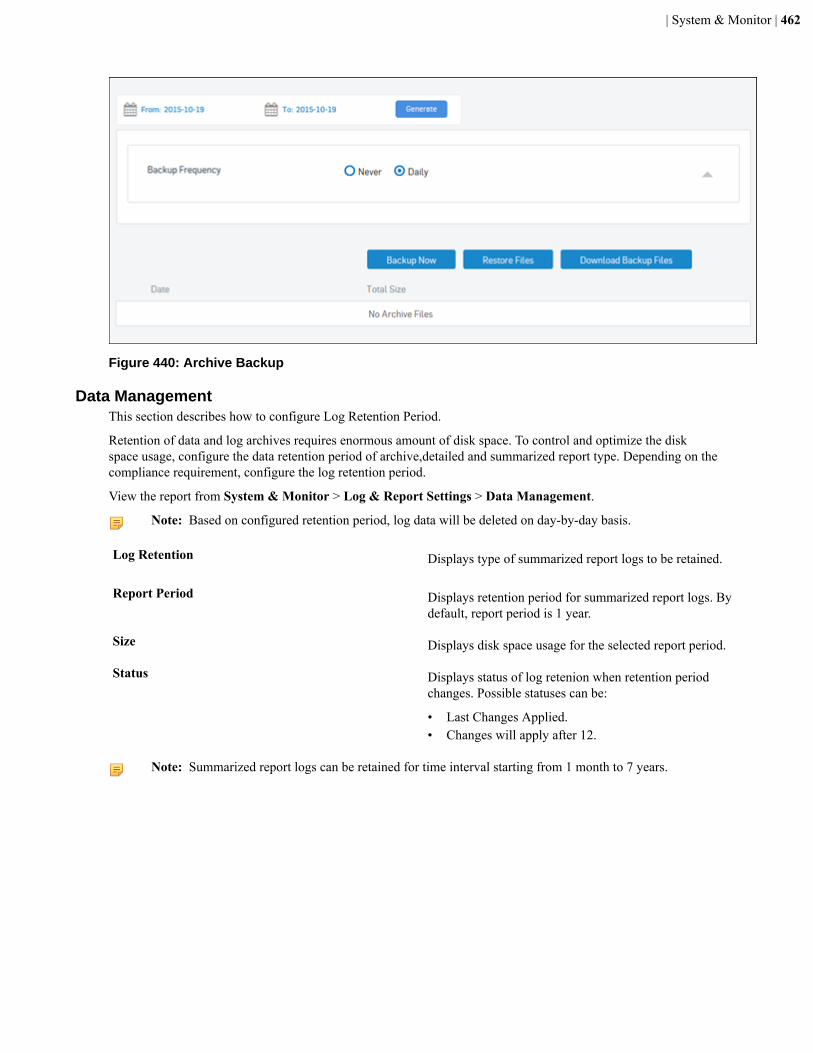
| System & Monitor | 462
Figure 440: Archive Backup
Data ManagementThis section describes how to configure Log Retention Period.
Retention of data and log archives requires enormous amount of disk space. To control and optimize the diskspace usage, configure the data retention period of archive,detailed and summarized report type. Depending on thecompliance requirement, configure the log retention period.
View the report from System & Monitor > Log & Report Settings > Data Management.
Note: Based on configured retention period, log data will be deleted on day-by-day basis.
Log Retention Displays type of summarized report logs to be retained.
Report Period Displays retention period for summarized report logs. Bydefault, report period is 1 year.
Size Displays disk space usage for the selected report period.
Status Displays status of log retenion when retention periodchanges. Possible statuses can be:
• Last Changes Applied.• Changes will apply after 12.
Note: Summarized report logs can be retained for time interval starting from 1 month to 7 years.
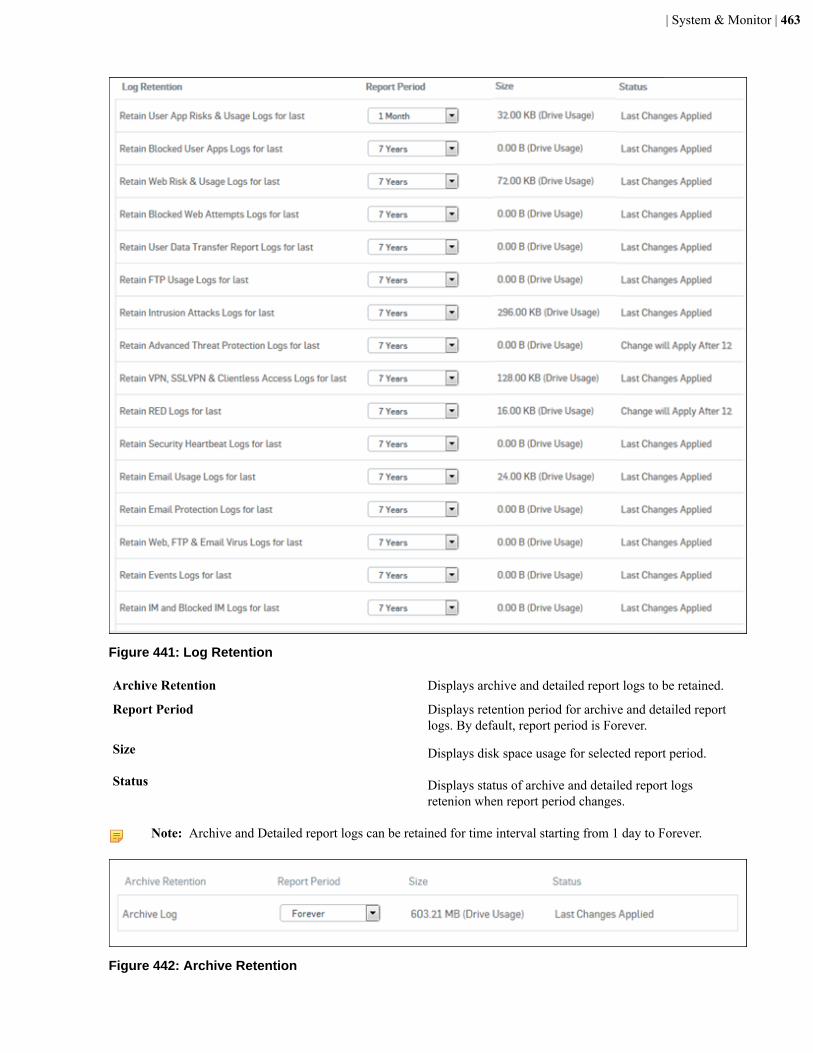
| System & Monitor | 463
Figure 441: Log Retention
Archive Retention Displays archive and detailed report logs to be retained.
Report Period Displays retention period for archive and detailed reportlogs. By default, report period is Forever.
Size Displays disk space usage for selected report period.
Status Displays status of archive and detailed report logsretenion when report period changes.
Note: Archive and Detailed report logs can be retained for time interval starting from 1 day to Forever.
Figure 442: Archive Retention
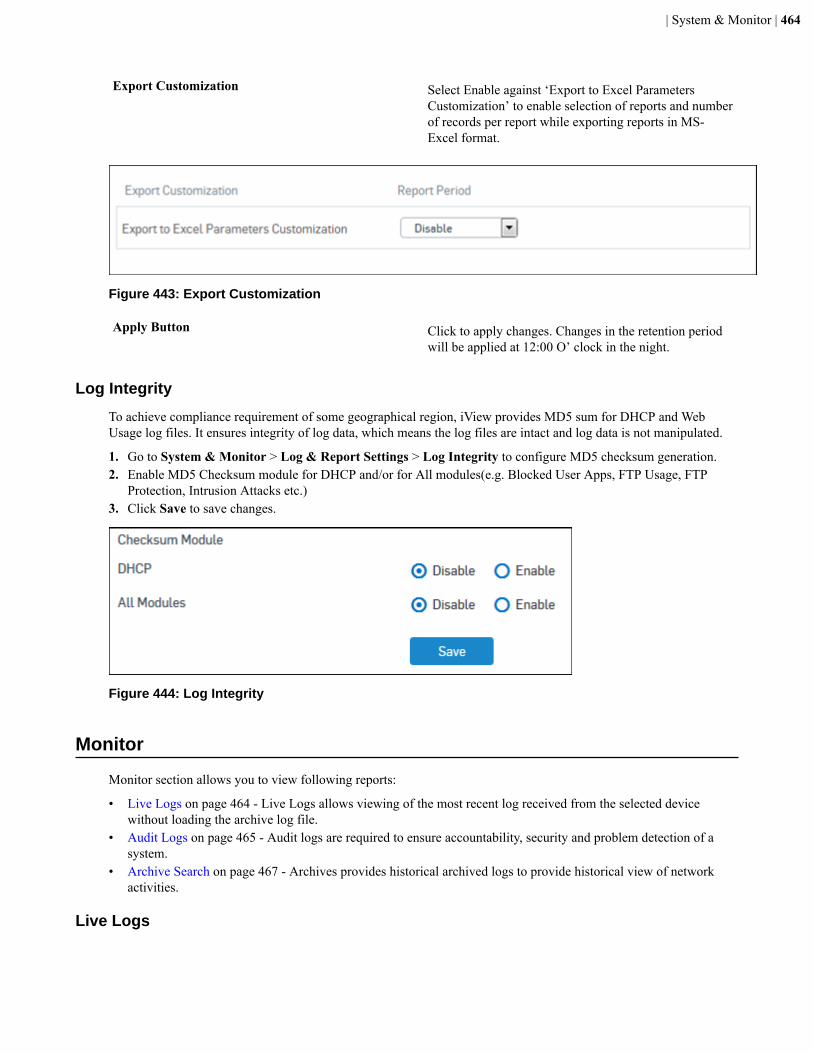
| System & Monitor | 464
Export Customization Select Enable against ‘Export to Excel ParametersCustomization’ to enable selection of reports and numberof records per report while exporting reports in MS-Excel format.
Figure 443: Export Customization
Apply Button Click to apply changes. Changes in the retention periodwill be applied at 12:00 O’ clock in the night.
Log Integrity
To achieve compliance requirement of some geographical region, iView provides MD5 sum for DHCP and WebUsage log files. It ensures integrity of log data, which means the log files are intact and log data is not manipulated.
1. Go to System & Monitor > Log & Report Settings > Log Integrity to configure MD5 checksum generation.2. Enable MD5 Checksum module for DHCP and/or for All modules(e.g. Blocked User Apps, FTP Usage, FTP
Protection, Intrusion Attacks etc.)3. Click Save to save changes.
Figure 444: Log Integrity
Monitor
Monitor section allows you to view following reports:
• Live Logs on page 464 - Live Logs allows viewing of the most recent log received from the selected devicewithout loading the archive log file.
• Audit Logs on page 465 - Audit logs are required to ensure accountability, security and problem detection of asystem.
• Archive Search on page 467 - Archives provides historical archived logs to provide historical view of networkactivities.
Live Logs
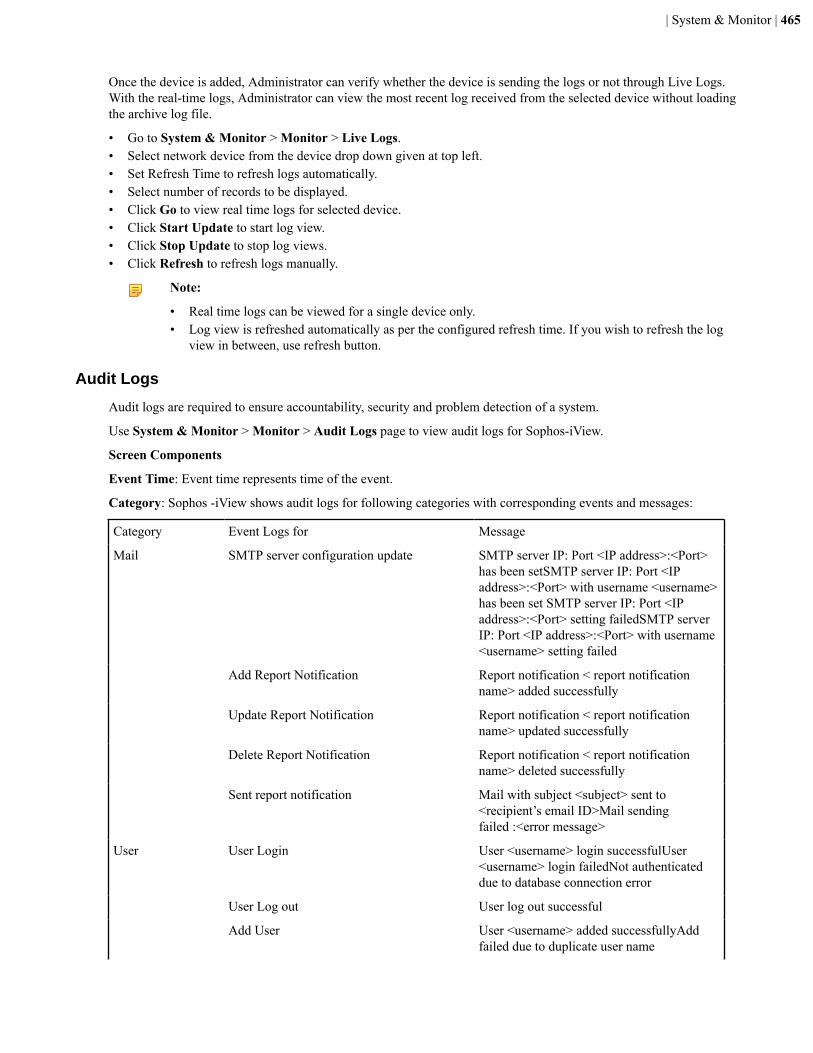
| System & Monitor | 465
Once the device is added, Administrator can verify whether the device is sending the logs or not through Live Logs.With the real-time logs, Administrator can view the most recent log received from the selected device without loadingthe archive log file.
• Go to System & Monitor > Monitor > Live Logs.• Select network device from the device drop down given at top left.• Set Refresh Time to refresh logs automatically.• Select number of records to be displayed.• Click Go to view real time logs for selected device.• Click Start Update to start log view.• Click Stop Update to stop log views.• Click Refresh to refresh logs manually.
Note:
• Real time logs can be viewed for a single device only.• Log view is refreshed automatically as per the configured refresh time. If you wish to refresh the log
view in between, use refresh button.
Audit Logs
Audit logs are required to ensure accountability, security and problem detection of a system.
Use System & Monitor > Monitor > Audit Logs page to view audit logs for Sophos-iView.
Screen Components
Event Time: Event time represents time of the event.
Category: Sophos -iView shows audit logs for following categories with corresponding events and messages:
Category Event Logs for Message
SMTP server configuration update SMTP server IP: Port <IP address>:<Port>has been setSMTP server IP: Port <IPaddress>:<Port> with username <username>has been set SMTP server IP: Port <IPaddress>:<Port> setting failedSMTP serverIP: Port <IP address>:<Port> with username<username> setting failed
Add Report Notification Report notification < report notificationname> added successfully
Update Report Notification Report notification < report notificationname> updated successfully
Delete Report Notification Report notification < report notificationname> deleted successfully
Sent report notification Mail with subject <subject> sent to<recipient’s email ID>Mail sendingfailed :<error message>
User Login User <username> login successfulUser<username> login failedNot authenticateddue to database connection error
User Log out User log out successful
User
Add User User <username> added successfullyAddfailed due to duplicate user name
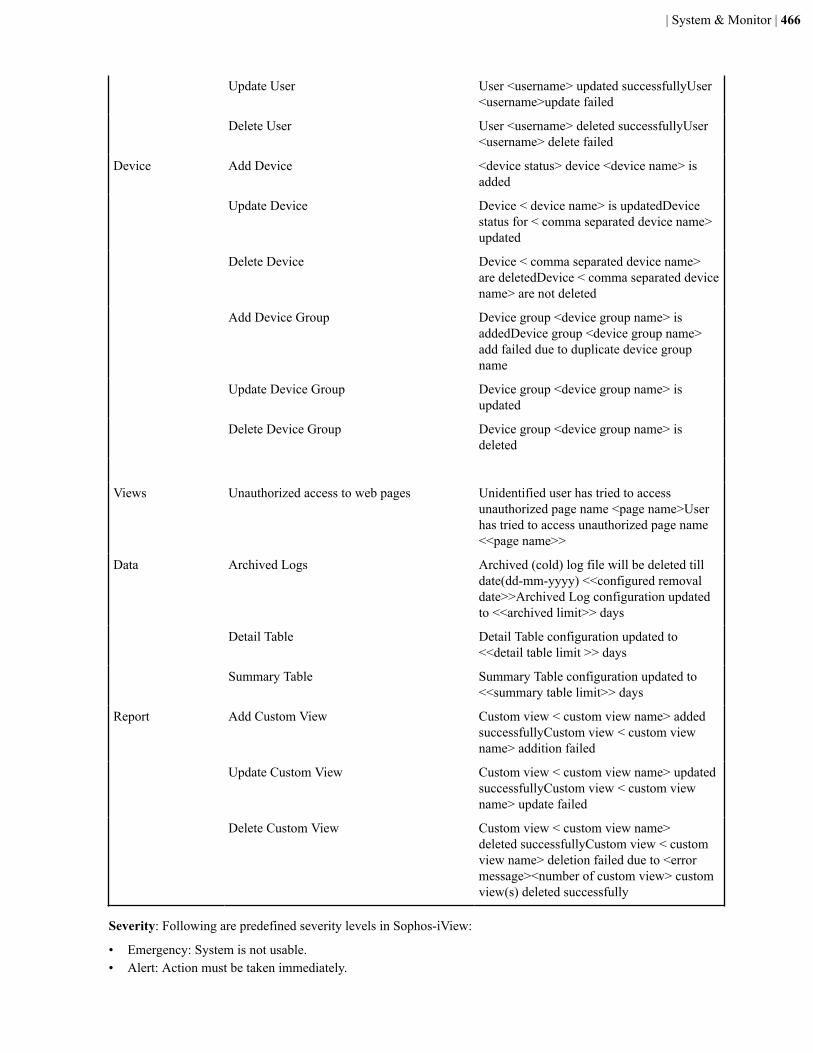
| System & Monitor | 466
Update User User <username> updated successfullyUser<username>update failed
Delete User User <username> deleted successfullyUser<username> delete failed
Add Device <device status> device <device name> isadded
Update Device Device < device name> is updatedDevicestatus for < comma separated device name>updated
Delete Device Device < comma separated device name>are deletedDevice < comma separated devicename> are not deleted
Add Device Group Device group <device group name> isaddedDevice group <device group name>add failed due to duplicate device groupname
Update Device Group Device group <device group name> isupdated
Device
Delete Device Group Device group <device group name> isdeleted
Views Unauthorized access to web pages Unidentified user has tried to accessunauthorized page name <page name>Userhas tried to access unauthorized page name<<page name>>
Archived Logs Archived (cold) log file will be deleted tilldate(dd-mm-yyyy) <<configured removaldate>>Archived Log configuration updatedto <<archived limit>> days
Detail Table Detail Table configuration updated to<<detail table limit >> days
Data
Summary Table Summary Table configuration updated to<<summary table limit>> days
Add Custom View Custom view < custom view name> addedsuccessfullyCustom view < custom viewname> addition failed
Update Custom View Custom view < custom view name> updatedsuccessfullyCustom view < custom viewname> update failed
Report
Delete Custom View Custom view < custom view name>deleted successfullyCustom view < customview name> deletion failed due to <errormessage><number of custom view> customview(s) deleted successfully
Severity: Following are predefined severity levels in Sophos-iView:
• Emergency: System is not usable.• Alert: Action must be taken immediately.
| System & Monitor | 467
• Critical: Critical condition.• Error: Error condition.• Warning: Warning condition.• Notice: Normal but significant condition.• Info: Informational.• Debug: Debug-level messages.
Message: Message is one line description of event.
Username: Username of the user associated with the event.
IP Address: IP address of the user.
Archive Search
This page allows you to load, index, unload and search archive logs for forensic investigation and compliancepurpose.
Use System & Monitor > Monitor > Archive Search page to perform search in log files generated by Sophos -iView.
Load Archive Files
1. Select one or multiple network devices from the device drop down given at top left.2. Select date range from the given calendar.3. Click OK to save the selection.4. Click Load to upload the archive file for the selected date in Sophos -iView database. This process may take some
time depending on the size of data.
Note: The check box will be disabled once the file is uploaded to the Sophos-iView database.
Unload Archive Files
Click Unload to unload all the loaded files.
Note:
• Unload operation will unload all the loaded files. User will not have option to unload individual file.• Please note that unloading file does not delete the data from the Sophos-iView.
System SettingsSettings section provides a number of configuration options to customize and use Reports
This section describes management of application groups, custom views, report notifications and database.
This section includes the following topics:
• Administration on page 468 - Administration provides options to configure general settings and administrativesettings for the device.
• System on page 472 - Configuration allows you to add network devices to Sophos iView, configure SophosiView for generating reports for added devices and customize Sophos iView as per requirement.
• Network on page 478 - Network menu establishes how your Sophos iView device connects, interacts with yournetwork, and allows configuring network specific settings.
• Maintenance on page 482 - Maintenance facilitates handling firmware versions, licensing services, updates andBackup & Restore.
• Diagnostics on page 487 - Diagnostics allows viewing of statistics to diagnose the connectivity problem,network problem and test network communication.
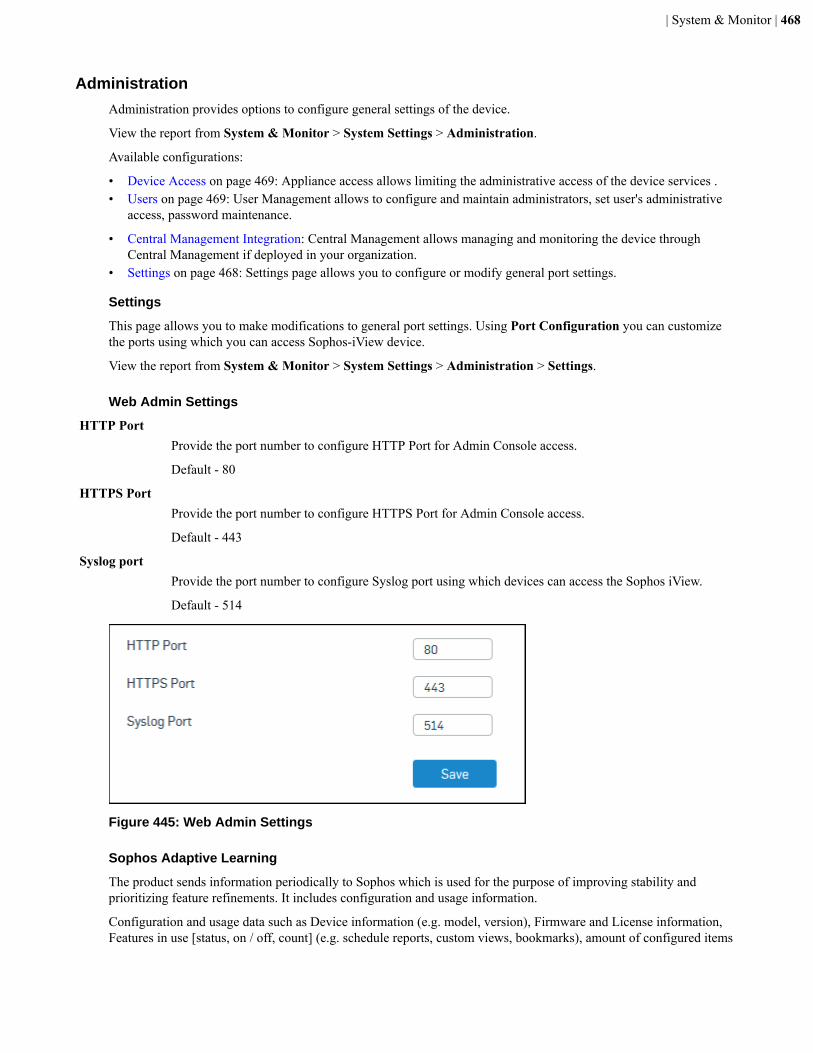
| System & Monitor | 468
Administration
Administration provides options to configure general settings of the device.
View the report from System & Monitor > System Settings > Administration.
Available configurations:
• Device Access on page 469: Appliance access allows limiting the administrative access of the device services .• Users on page 469: User Management allows to configure and maintain administrators, set user's administrative
access, password maintenance.
• Central Management Integration: Central Management allows managing and monitoring the device throughCentral Management if deployed in your organization.
• Settings on page 468: Settings page allows you to configure or modify general port settings.
Settings
This page allows you to make modifications to general port settings. Using Port Configuration you can customizethe ports using which you can access Sophos-iView device.
View the report from System & Monitor > System Settings > Administration > Settings.
Web Admin Settings
HTTP PortProvide the port number to configure HTTP Port for Admin Console access.
Default - 80
HTTPS PortProvide the port number to configure HTTPS Port for Admin Console access.
Default - 443
Syslog portProvide the port number to configure Syslog port using which devices can access the Sophos iView.
Default - 514
Figure 445: Web Admin Settings
Sophos Adaptive Learning
The product sends information periodically to Sophos which is used for the purpose of improving stability andprioritizing feature refinements. It includes configuration and usage information.
Configuration and usage data such as Device information (e.g. model, version), Firmware and License information,Features in use [status, on / off, count] (e.g. schedule reports, custom views, bookmarks), amount of configured items
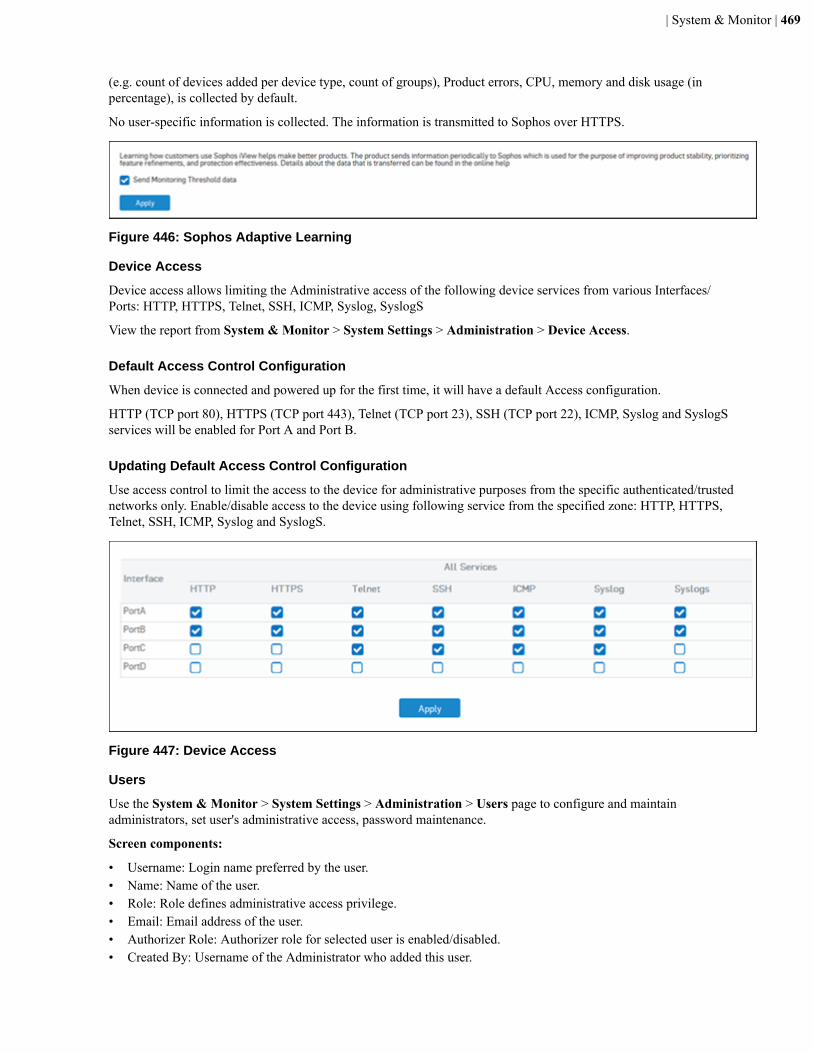
| System & Monitor | 469
(e.g. count of devices added per device type, count of groups), Product errors, CPU, memory and disk usage (inpercentage), is collected by default.
No user-specific information is collected. The information is transmitted to Sophos over HTTPS.
Figure 446: Sophos Adaptive Learning
Device Access
Device access allows limiting the Administrative access of the following device services from various Interfaces/Ports: HTTP, HTTPS, Telnet, SSH, ICMP, Syslog, SyslogS
View the report from System & Monitor > System Settings > Administration > Device Access.
Default Access Control Configuration
When device is connected and powered up for the first time, it will have a default Access configuration.
HTTP (TCP port 80), HTTPS (TCP port 443), Telnet (TCP port 23), SSH (TCP port 22), ICMP, Syslog and SyslogSservices will be enabled for Port A and Port B.
Updating Default Access Control Configuration
Use access control to limit the access to the device for administrative purposes from the specific authenticated/trustednetworks only. Enable/disable access to the device using following service from the specified zone: HTTP, HTTPS,Telnet, SSH, ICMP, Syslog and SyslogS.
Figure 447: Device Access
Users
Use the System & Monitor > System Settings > Administration > Users page to configure and maintainadministrators, set user's administrative access, password maintenance.
Screen components:
• Username: Login name preferred by the user.• Name: Name of the user.• Role: Role defines administrative access privilege.• Email: Email address of the user.• Authorizer Role: Authorizer role for selected user is enabled/disabled.• Created By: Username of the Administrator who added this user.
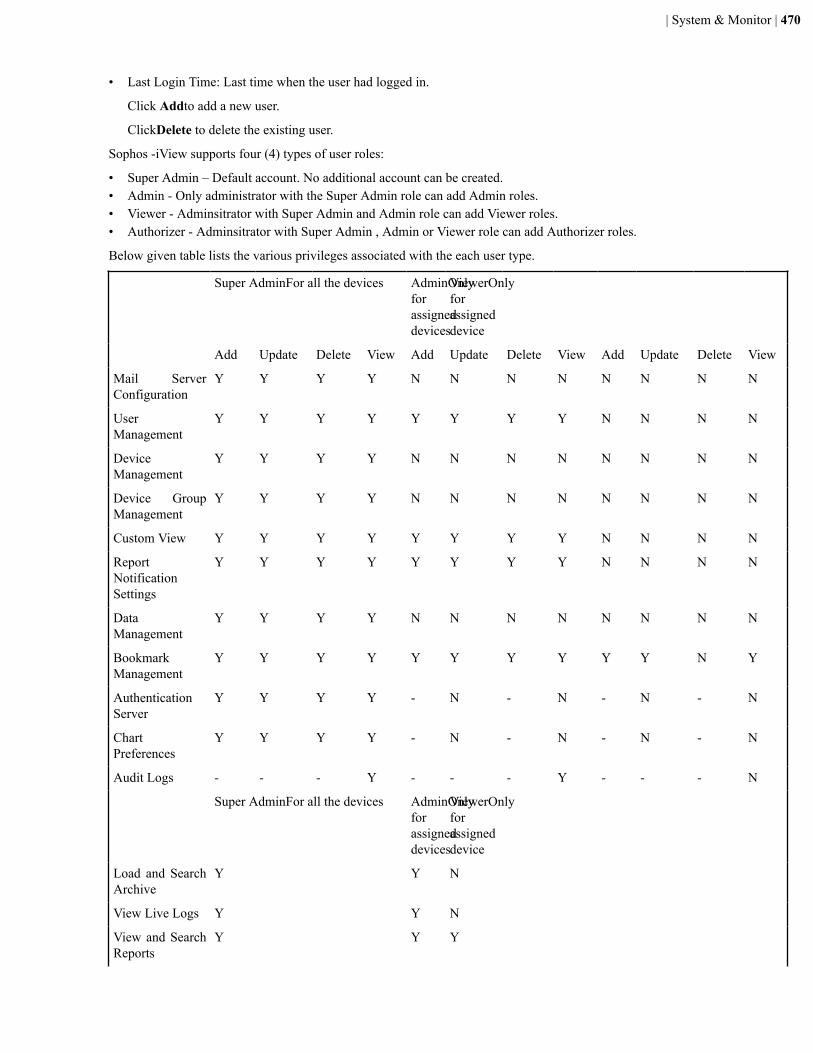
| System & Monitor | 470
• Last Login Time: Last time when the user had logged in.
Click Addto add a new user.
ClickDelete to delete the existing user.
Sophos -iView supports four (4) types of user roles:
• Super Admin – Default account. No additional account can be created.• Admin - Only administrator with the Super Admin role can add Admin roles.• Viewer - Adminsitrator with Super Admin and Admin role can add Viewer roles.• Authorizer - Adminsitrator with Super Admin , Admin or Viewer role can add Authorizer roles.
Below given table lists the various privileges associated with the each user type.
Super AdminFor all the devices AdminOnlyforassigneddevices
ViewerOnlyforassigneddevice
Add Update Delete View Add Update Delete View Add Update Delete View
Mail ServerConfiguration
Y Y Y Y N N N N N N N N
UserManagement
Y Y Y Y Y Y Y Y N N N N
DeviceManagement
Y Y Y Y N N N N N N N N
Device GroupManagement
Y Y Y Y N N N N N N N N
Custom View Y Y Y Y Y Y Y Y N N N N
ReportNotificationSettings
Y Y Y Y Y Y Y Y N N N N
DataManagement
Y Y Y Y N N N N N N N N
BookmarkManagement
Y Y Y Y Y Y Y Y Y Y N Y
AuthenticationServer
Y Y Y Y - N - N - N - N
ChartPreferences
Y Y Y Y - N - N - N - N
Audit Logs - - - Y - - - Y - - - N
Super AdminFor all the devices AdminOnlyforassigneddevices
ViewerOnlyforassigneddevice
Load and SearchArchive
Y Y N
View Live Logs Y Y N
View and SearchReports
Y Y Y
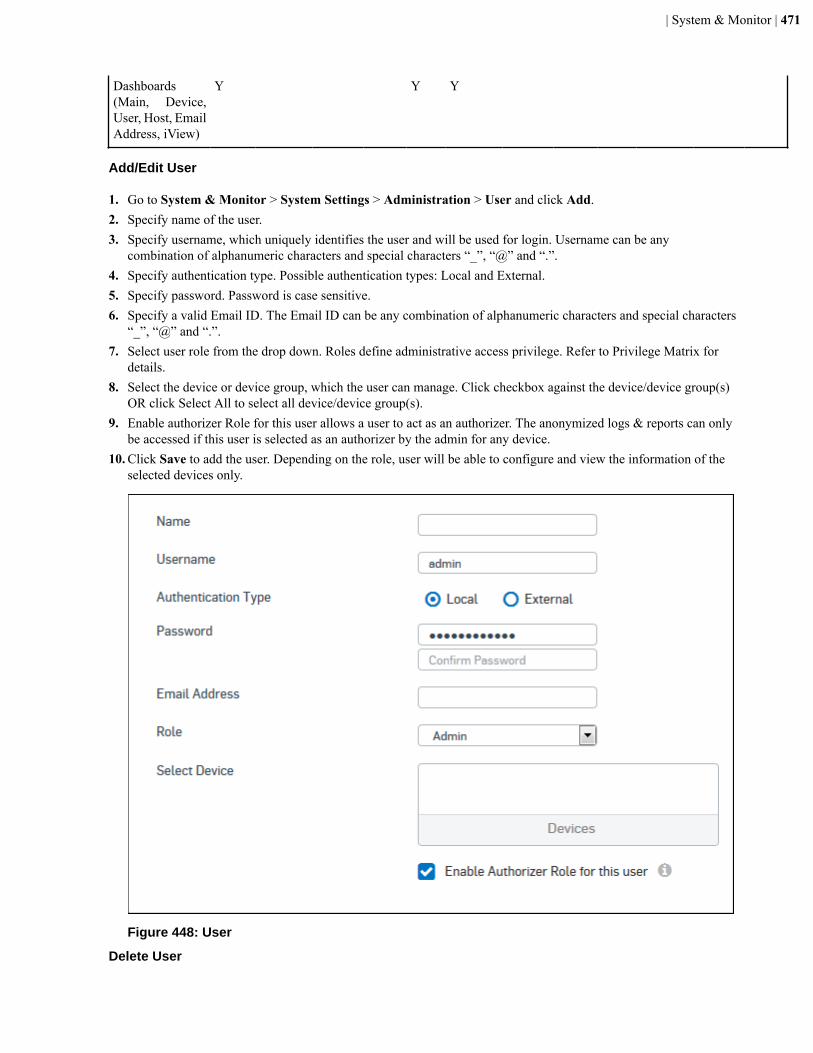
| System & Monitor | 471
Dashboards(Main, Device,User, Host, EmailAddress, iView)
Y Y Y
Add/Edit User
1. Go to System & Monitor > System Settings > Administration > User and click Add.2. Specify name of the user.3. Specify username, which uniquely identifies the user and will be used for login. Username can be any
combination of alphanumeric characters and special characters “_”, “@” and “.”.4. Specify authentication type. Possible authentication types: Local and External.5. Specify password. Password is case sensitive.6. Specify a valid Email ID. The Email ID can be any combination of alphanumeric characters and special characters
“_”, “@” and “.”.7. Select user role from the drop down. Roles define administrative access privilege. Refer to Privilege Matrix for
details.8. Select the device or device group, which the user can manage. Click checkbox against the device/device group(s)
OR click Select All to select all device/device group(s).9. Enable authorizer Role for this user allows a user to act as an authorizer. The anonymized logs & reports can only
be accessed if this user is selected as an authorizer by the admin for any device.10. Click Save to add the user. Depending on the role, user will be able to configure and view the information of the
selected devices only.
Figure 448: User
Delete User
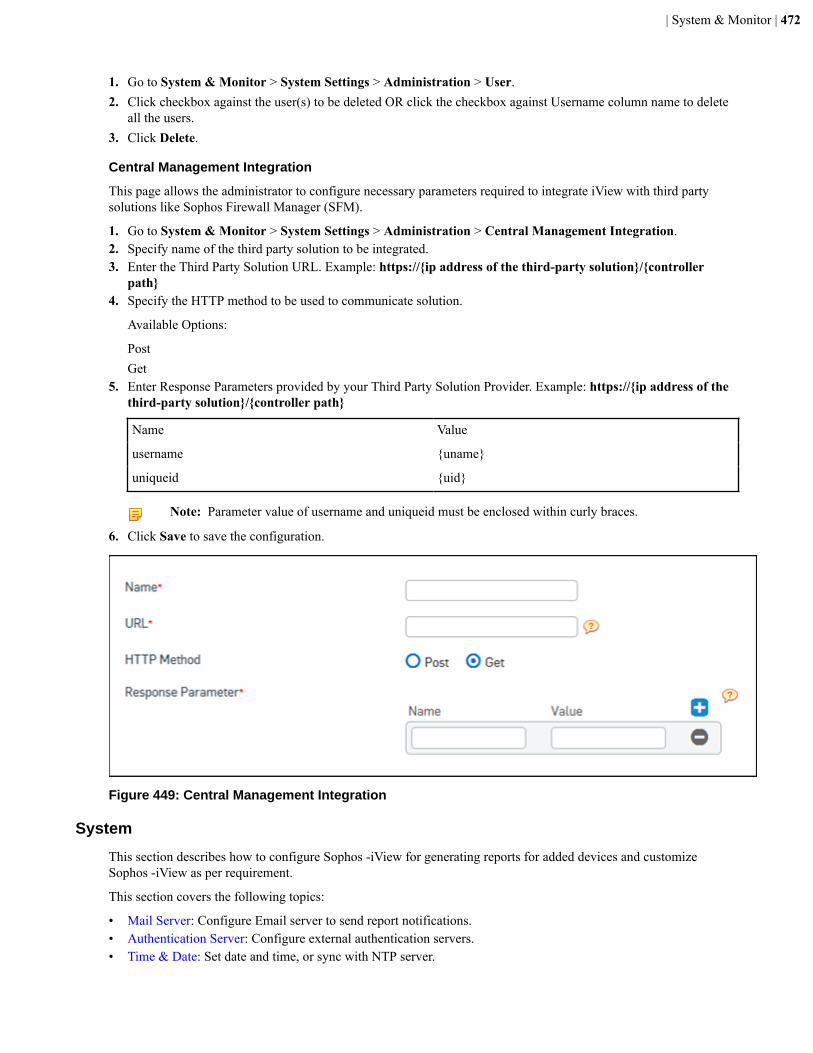
| System & Monitor | 472
1. Go to System & Monitor > System Settings > Administration > User.2. Click checkbox against the user(s) to be deleted OR click the checkbox against Username column name to delete
all the users.3. Click Delete.
Central Management Integration
This page allows the administrator to configure necessary parameters required to integrate iView with third partysolutions like Sophos Firewall Manager (SFM).
1. Go to System & Monitor > System Settings > Administration > Central Management Integration.2. Specify name of the third party solution to be integrated.3. Enter the Third Party Solution URL. Example: https://{ip address of the third-party solution}/{controller
path}4. Specify the HTTP method to be used to communicate solution.
Available Options:
PostGet
5. Enter Response Parameters provided by your Third Party Solution Provider. Example: https://{ip address of thethird-party solution}/{controller path}
Name Value
username {uname}
uniqueid {uid}
Note: Parameter value of username and uniqueid must be enclosed within curly braces.
6. Click Save to save the configuration.
Figure 449: Central Management Integration
System
This section describes how to configure Sophos -iView for generating reports for added devices and customizeSophos -iView as per requirement.
This section covers the following topics:
• Mail Server: Configure Email server to send report notifications.• Authentication Server: Configure external authentication servers.• Time & Date: Set date and time, or sync with NTP server.
| System & Monitor | 473
Authentication Server
Sophos -iView supports user authentication against:
• LDAP server• RADIUS Server• An internal database defined in Appliance
User authentication can be performed using local user database, RADIUS, LDAP or any combination of these.
Local Authentication
Sophos-iView provides a local database for storing user information. You can configure Sophos -iView to use thislocal database to authenticate users and control their access to the network. Choose local database authentication overLDAP or RADIUS when the number of users accessing the network is relatively small. Registering dozens of userstakes time, although once the entries are in place they are not difficult to maintain. For networks with larger numbersof users, user authentication using LDAP or RADIUS servers can be more efficient.
Combination of external and local authentication is useful in large networks where it is required to provide guest useraccounts for temporary access while a different authentication mechanism like RADIUS for VPN and SSL VPN usersprovides better security as password is not exchanged over the wire.
External Authentication
External Authentication Servers can be integrated with the Sophos -iView for providing secure access to the users ofthose servers.
To manage external authentication servers, go to System Settings > Configuration > Authentication Server.
Related conceptsAdd Authentication Server on page 473This page describes the authentication servers to be added. It covers the following topics:
Add Authentication ServerThis page describes the authentication servers to be added. It covers the following topics:
LDAP
LDAP, an abbreviation for Lightweight Directory Access Protocol, is a networking protocol for querying andmodifying directory services based on the X.500 standard.Sophos -iView uses the LDAP protocol to authenticateusers for several of its services, allowing or denying access based on attributes or group memberships configured onthe LDAP server.
Add LDAP Server
RADIUS
RADIUS, the acronym of Remote Authentication Dial In User Service, is a widespread protocol for allowingnetwork devices such as routers to authenticate users against a central database. In addition to user information,RADIUS can store technical information used by network devices, such as supported protocols, IP addresses,routing information, and so on. This information constitutes a user profile, which is stored in a file or database on theRADIUS server. The RADIUS protocol is very flexible, and servers are available for most operating systems. TheRADIUS implementation on Sophos -iView allows you to configure access rights on the basis of proxies and users.Before you can use RADIUS authentication, you must have a running RADIUS server on the network. Whereaspasswords are encrypted using the RADIUS secret, the username is transmitted in plain text.
Add RADIUS Server
Add LDAP ServerThis page describes how to add a LDAP server.
1. Navigate to System & Monitor > System Settings > System > Authentication Server and click Add.2. As Server Type, select LDAP Server.

| System & Monitor | 474
3. Specify the LDAP server details:Server Name
Specify a descriptive name for the LDAP server.
Authentication Server IPSpecify an IP address or domain for the LDAP server.
PortSpecify the port of the LDAP server.
Default : 389
VersionSelect the version of the LDAP server.
Default: 3
Base DNEnter the Base DN for the LDAP server. The Base DN is the starting point relative to the root of theLDAP tree where the users are included who are to be authenticated. Note that the Base DN must bespecified by the Fully Distinguished Name (FDN) in LDAP notation, using commas as delimiters(e.g., O=Example,OU=RnD).
Get Base DNClick Get Base DN if you are not aware about the Base DN. The Base DN is automaticallyretrieved from the directory.
AdministratorSpecify the username for the user with Administrative privileges for LDAP server.
PasswordSpecify Password for the user.
Authentication AttributeSpecify an authentication attribute for searching the LDAP directory. The user authenticationattribute contains the actual login name each user is prompted for, for example by remote accessservices.

| System & Monitor | 475
Figure 450: Add LDAP Server4. Click Test Connection to check the connectivity between LDAP and Sophos -iView. It also validates the LDAP
server user credentials.5. Click Save.
Add RADIUS ServerThis page describes how to add a RADIUS server.
1. Go to System & Monitor > System Settings > System > Authentication Server and click Add.2. As Server Type, select RADIUS Server.3. Specify the RADIUS server details:
Server NameSpecify a descriptive name for the RADIUS server.
Server IPSpecify an IP address for the RADIUS server.
Authentication PortSpecify the authentication port of the RADIUS server.
By default, this is port 1812.
Shared SecretSpecify the shared secret which is a text string that serves as a password between a RADIUS clientand a RADIUS server.
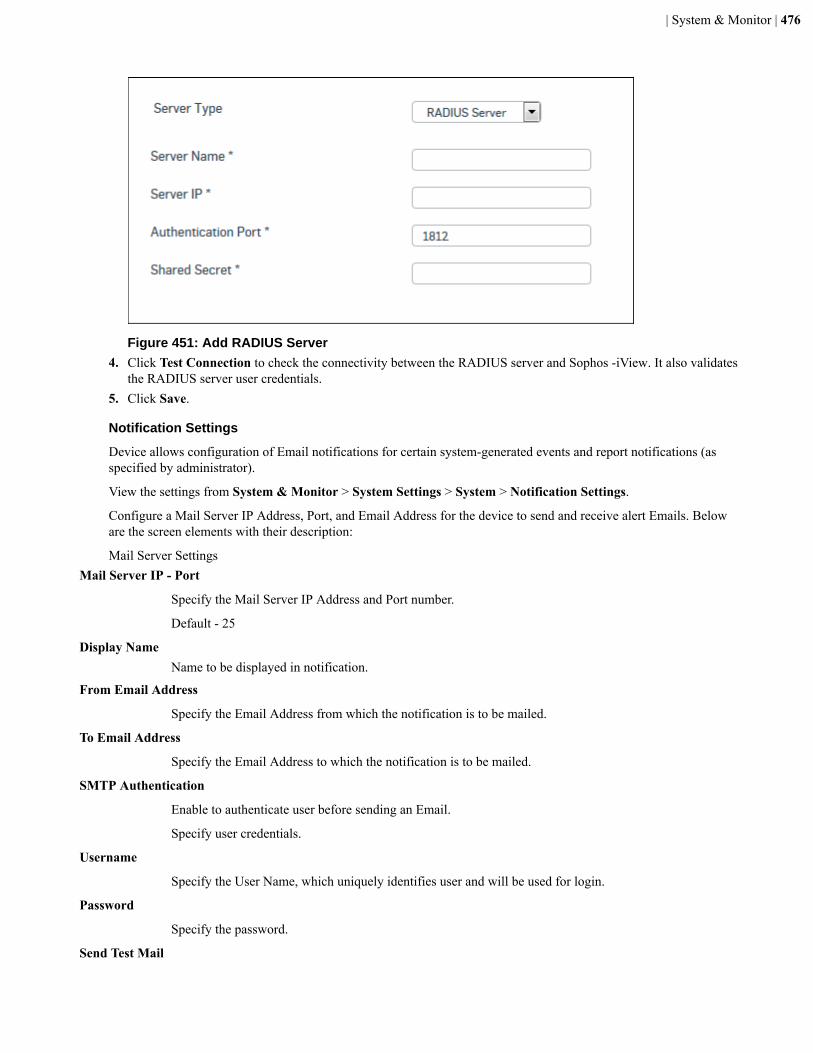
| System & Monitor | 476
Figure 451: Add RADIUS Server4. Click Test Connection to check the connectivity between the RADIUS server and Sophos -iView. It also validates
the RADIUS server user credentials.5. Click Save.
Notification Settings
Device allows configuration of Email notifications for certain system-generated events and report notifications (asspecified by administrator).
View the settings from System & Monitor > System Settings > System > Notification Settings.
Configure a Mail Server IP Address, Port, and Email Address for the device to send and receive alert Emails. Beloware the screen elements with their description:
Mail Server SettingsMail Server IP - Port
Specify the Mail Server IP Address and Port number.
Default - 25
Display NameName to be displayed in notification.
From Email Address
Specify the Email Address from which the notification is to be mailed.
To Email Address
Specify the Email Address to which the notification is to be mailed.
SMTP Authentication
Enable to authenticate user before sending an Email.
Specify user credentials.
Username
Specify the User Name, which uniquely identifies user and will be used for login.
Password
Specify the password.
Send Test Mail
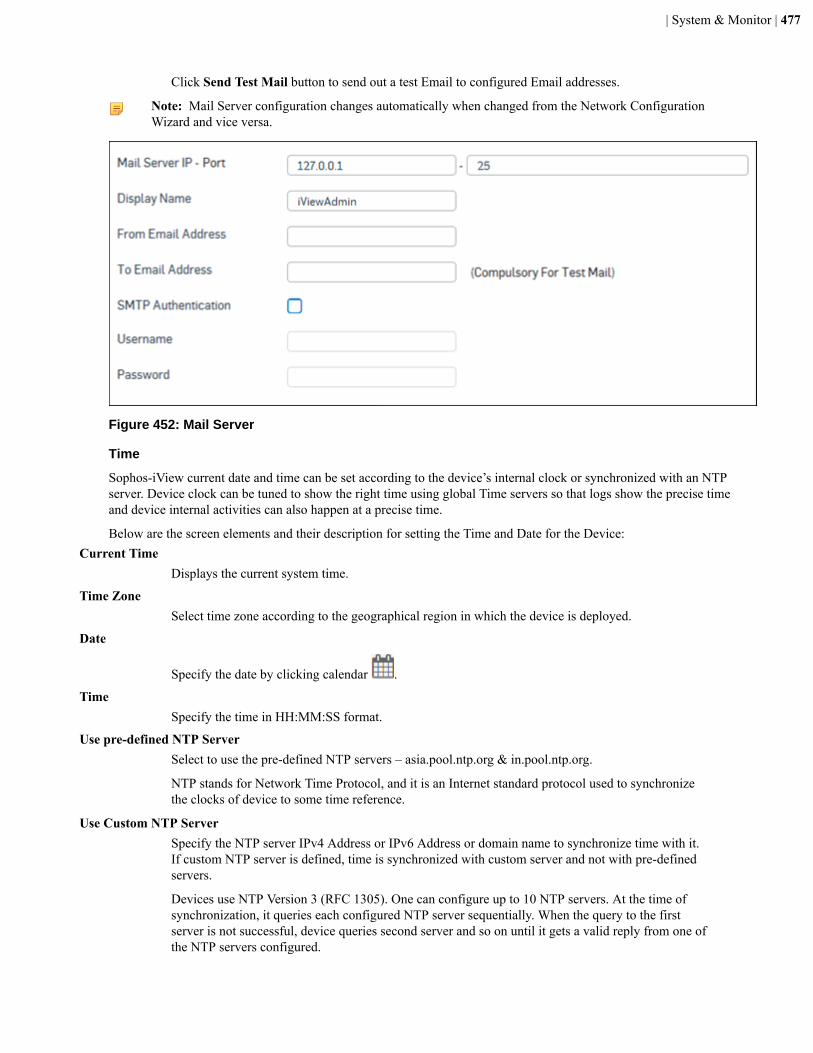
| System & Monitor | 477
Click Send Test Mail button to send out a test Email to configured Email addresses.
Note: Mail Server configuration changes automatically when changed from the Network ConfigurationWizard and vice versa.
Figure 452: Mail Server
Time
Sophos-iView current date and time can be set according to the device’s internal clock or synchronized with an NTPserver. Device clock can be tuned to show the right time using global Time servers so that logs show the precise timeand device internal activities can also happen at a precise time.
Below are the screen elements and their description for setting the Time and Date for the Device:Current Time
Displays the current system time.
Time ZoneSelect time zone according to the geographical region in which the device is deployed.
Date
Specify the date by clicking calendar .
TimeSpecify the time in HH:MM:SS format.
Use pre-defined NTP ServerSelect to use the pre-defined NTP servers – asia.pool.ntp.org & in.pool.ntp.org.
NTP stands for Network Time Protocol, and it is an Internet standard protocol used to synchronizethe clocks of device to some time reference.
Use Custom NTP ServerSpecify the NTP server IPv4 Address or IPv6 Address or domain name to synchronize time with it.If custom NTP server is defined, time is synchronized with custom server and not with pre-definedservers.
Devices use NTP Version 3 (RFC 1305). One can configure up to 10 NTP servers. At the time ofsynchronization, it queries each configured NTP server sequentially. When the query to the firstserver is not successful, device queries second server and so on until it gets a valid reply from one ofthe NTP servers configured.
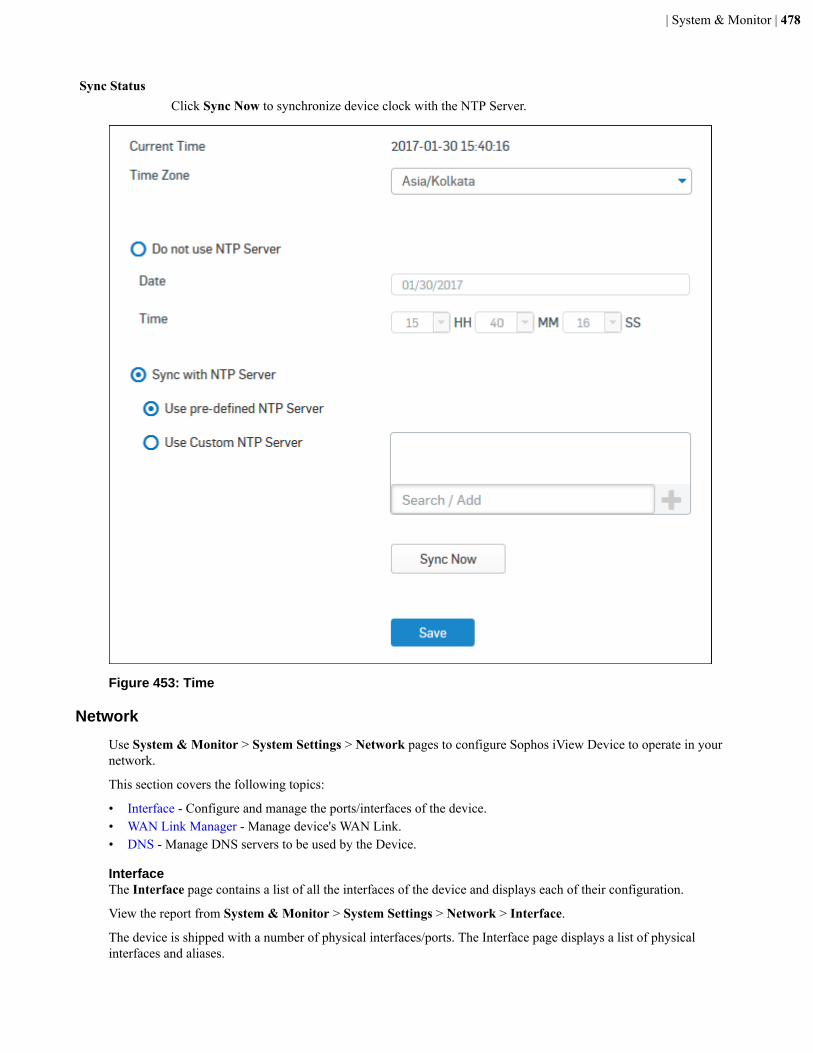
| System & Monitor | 478
Sync StatusClick Sync Now to synchronize device clock with the NTP Server.
Figure 453: Time
Network
Use System & Monitor > System Settings > Network pages to configure Sophos iView Device to operate in yournetwork.
This section covers the following topics:
• Interface - Configure and manage the ports/interfaces of the device.• WAN Link Manager - Manage device's WAN Link.• DNS - Manage DNS servers to be used by the Device.
InterfaceThe Interface page contains a list of all the interfaces of the device and displays each of their configuration.
View the report from System & Monitor > System Settings > Network > Interface.
The device is shipped with a number of physical interfaces/ports. The Interface page displays a list of physicalinterfaces and aliases.
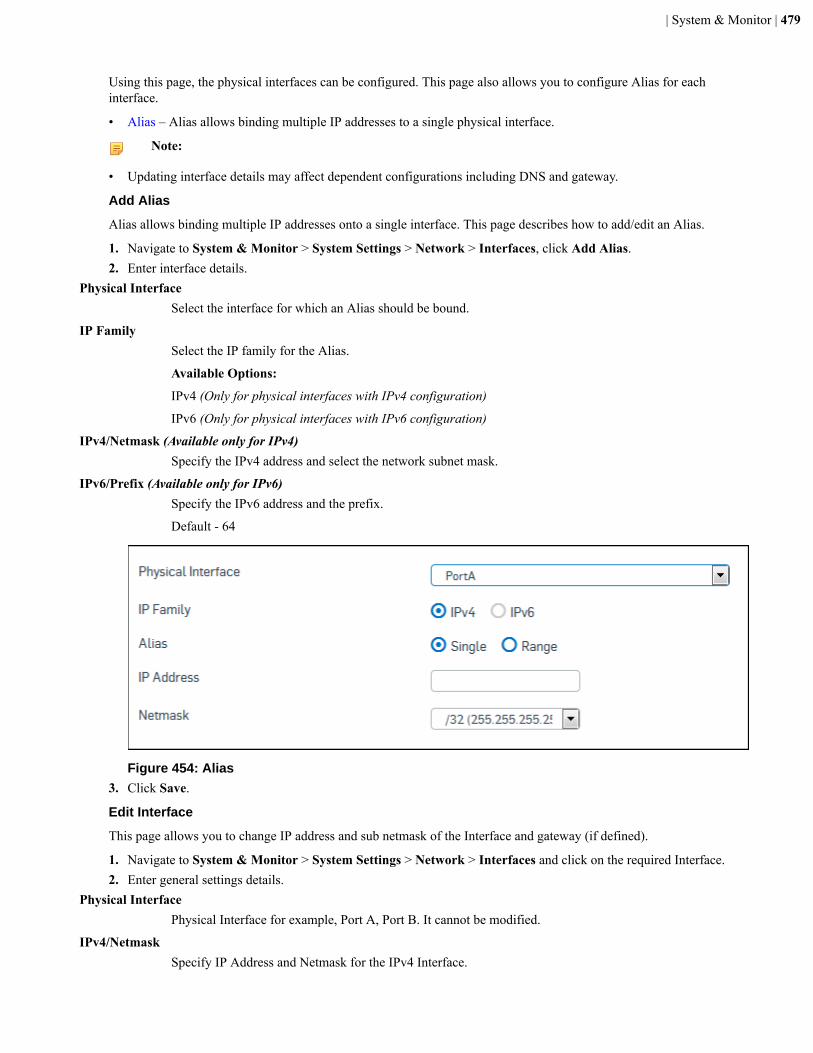
| System & Monitor | 479
Using this page, the physical interfaces can be configured. This page also allows you to configure Alias for eachinterface.
• Alias – Alias allows binding multiple IP addresses to a single physical interface.
Note:
• Updating interface details may affect dependent configurations including DNS and gateway.
Add Alias
Alias allows binding multiple IP addresses onto a single interface. This page describes how to add/edit an Alias.
1. Navigate to System & Monitor > System Settings > Network > Interfaces, click Add Alias.2. Enter interface details.
Physical InterfaceSelect the interface for which an Alias should be bound.
IP FamilySelect the IP family for the Alias.
Available Options:
IPv4 (Only for physical interfaces with IPv4 configuration)
IPv6 (Only for physical interfaces with IPv6 configuration)
IPv4/Netmask (Available only for IPv4)Specify the IPv4 address and select the network subnet mask.
IPv6/Prefix (Available only for IPv6)Specify the IPv6 address and the prefix.
Default - 64
Figure 454: Alias3. Click Save.
Edit Interface
This page allows you to change IP address and sub netmask of the Interface and gateway (if defined).
1. Navigate to System & Monitor > System Settings > Network > Interfaces and click on the required Interface.2. Enter general settings details.
Physical InterfacePhysical Interface for example, Port A, Port B. It cannot be modified.
IPv4/NetmaskSpecify IP Address and Netmask for the IPv4 Interface.

| System & Monitor | 480
IPv6/PrefixSpecify IP Address and Prefix for the IPv6 Interface.
Gateway NameSpecify name of the gateway (It is available only when the gateway is defined on the interface)
IP AddressSpecify IP Address of the gateway.
IPv6 Address (Available if IPv6 Configuration is enabled)Specify IPv6 Address of the gateway.
Figure 455: General Settings3. Enter advanced setting details.
Interface SpeedSelect Interface speed for synchronization.
Speed mismatch between Firewall Manager and 3rd party routers and switches can result into errorsor collisions on interface, no connection, traffic latency or slow performance.
Available Options:Auto Negotiate10 Mbps - Full duplex10 Mbps - Half duplex100 Mbps - Fullduplex100 Mbps - Half duplex1000 Mbps - Full duplex1000 Mbps - Half duplex
Default - Auto Negotiate
MTUSpecify MTU value (Maximum Transmission Unit)
MTU is the largest physical packet size, in bytes, that a network can transmit. This parameterbecomes an issue when networks are interconnected and the networks have different MTU sizes.Any packets larger than the MTU value are divided (fragmented) into smaller packets before beingsent.
Default - 1500
Input range - 576 to 1500
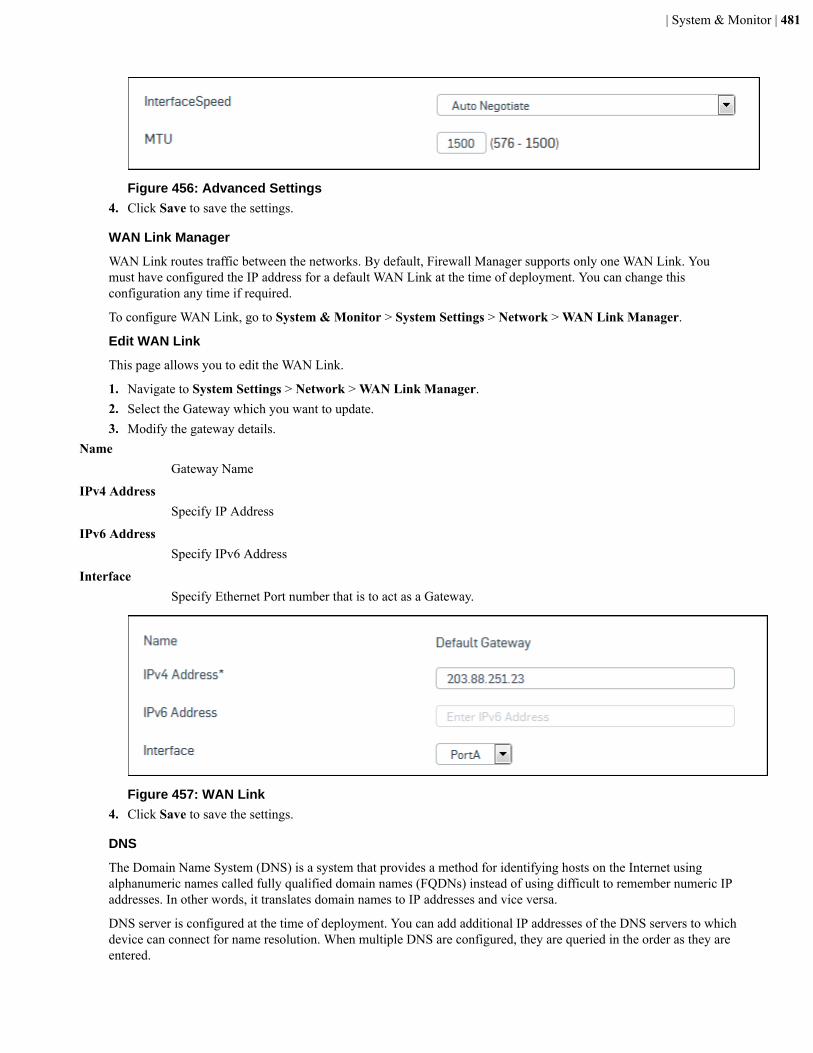
| System & Monitor | 481
Figure 456: Advanced Settings4. Click Save to save the settings.
WAN Link Manager
WAN Link routes traffic between the networks. By default, Firewall Manager supports only one WAN Link. Youmust have configured the IP address for a default WAN Link at the time of deployment. You can change thisconfiguration any time if required.
To configure WAN Link, go to System & Monitor > System Settings > Network > WAN Link Manager.
Edit WAN Link
This page allows you to edit the WAN Link.
1. Navigate to System Settings > Network > WAN Link Manager.2. Select the Gateway which you want to update.3. Modify the gateway details.
NameGateway Name
IPv4 AddressSpecify IP Address
IPv6 AddressSpecify IPv6 Address
InterfaceSpecify Ethernet Port number that is to act as a Gateway.
Figure 457: WAN Link4. Click Save to save the settings.
DNS
The Domain Name System (DNS) is a system that provides a method for identifying hosts on the Internet usingalphanumeric names called fully qualified domain names (FQDNs) instead of using difficult to remember numeric IPaddresses. In other words, it translates domain names to IP addresses and vice versa.
DNS server is configured at the time of deployment. You can add additional IP addresses of the DNS servers to whichdevice can connect for name resolution. When multiple DNS are configured, they are queried in the order as they areentered.
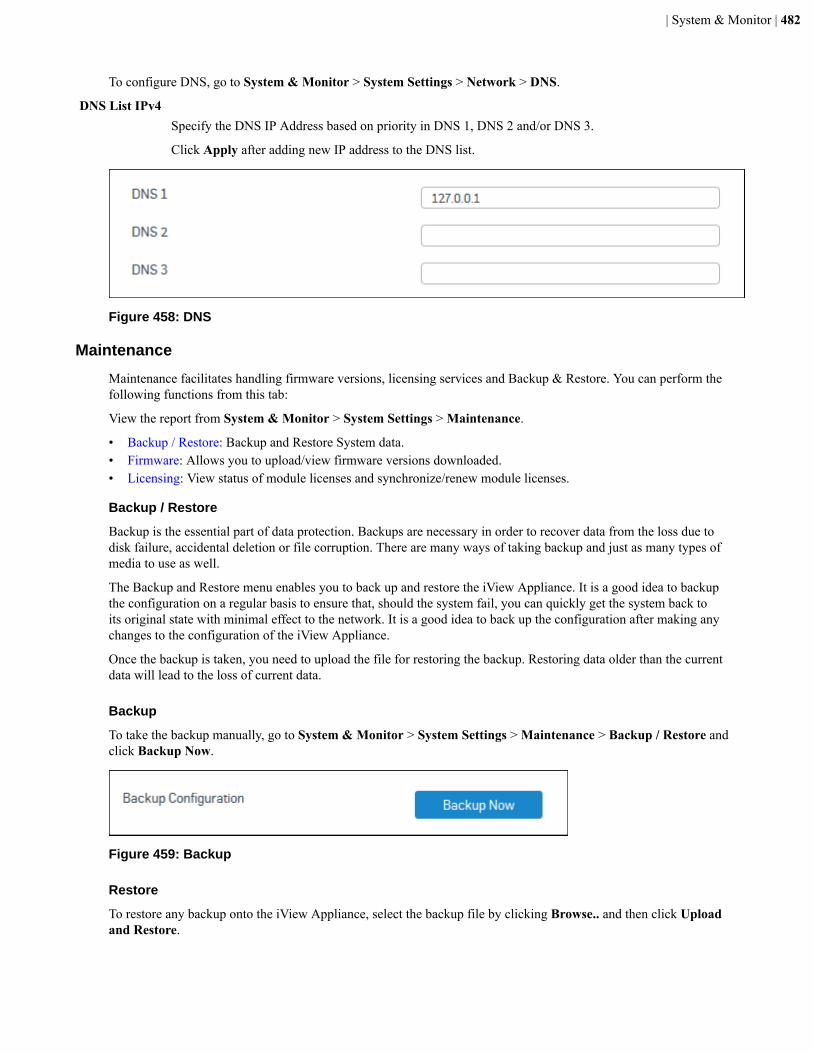
| System & Monitor | 482
To configure DNS, go to System & Monitor > System Settings > Network > DNS.
DNS List IPv4Specify the DNS IP Address based on priority in DNS 1, DNS 2 and/or DNS 3.
Click Apply after adding new IP address to the DNS list.
Figure 458: DNS
Maintenance
Maintenance facilitates handling firmware versions, licensing services and Backup & Restore. You can perform thefollowing functions from this tab:
View the report from System & Monitor > System Settings > Maintenance.
• Backup / Restore: Backup and Restore System data.• Firmware: Allows you to upload/view firmware versions downloaded.• Licensing: View status of module licenses and synchronize/renew module licenses.
Backup / Restore
Backup is the essential part of data protection. Backups are necessary in order to recover data from the loss due todisk failure, accidental deletion or file corruption. There are many ways of taking backup and just as many types ofmedia to use as well.
The Backup and Restore menu enables you to back up and restore the iView Appliance. It is a good idea to backupthe configuration on a regular basis to ensure that, should the system fail, you can quickly get the system back toits original state with minimal effect to the network. It is a good idea to back up the configuration after making anychanges to the configuration of the iView Appliance.
Once the backup is taken, you need to upload the file for restoring the backup. Restoring data older than the currentdata will lead to the loss of current data.
Backup
To take the backup manually, go to System & Monitor > System Settings > Maintenance > Backup / Restore andclick Backup Now.
Figure 459: Backup
Restore
To restore any backup onto the iView Appliance, select the backup file by clicking Browse.. and then click Uploadand Restore.
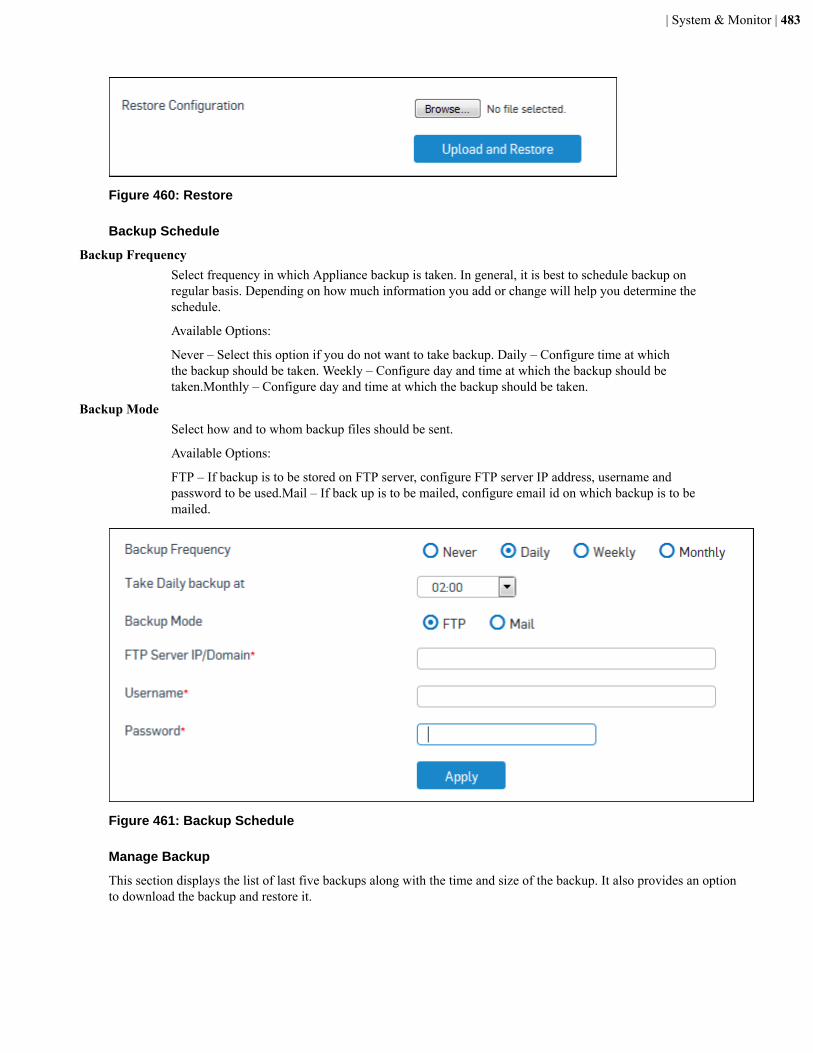
| System & Monitor | 483
Figure 460: Restore
Backup Schedule
Backup FrequencySelect frequency in which Appliance backup is taken. In general, it is best to schedule backup onregular basis. Depending on how much information you add or change will help you determine theschedule.
Available Options:
Never – Select this option if you do not want to take backup. Daily – Configure time at whichthe backup should be taken. Weekly – Configure day and time at which the backup should betaken.Monthly – Configure day and time at which the backup should be taken.
Backup ModeSelect how and to whom backup files should be sent.
Available Options:
FTP – If backup is to be stored on FTP server, configure FTP server IP address, username andpassword to be used.Mail – If back up is to be mailed, configure email id on which backup is to bemailed.
Figure 461: Backup Schedule
Manage Backup
This section displays the list of last five backups along with the time and size of the backup. It also provides an optionto download the backup and restore it.

| System & Monitor | 484
Figure 462: Manage Backup
Firmware
Firmware
Firmware page displays the list of available firmware versions downloaded. Maximum two firmware versions areavailable simultaneously and one of the two firmware versions is active.
Upload firmware - Administrator can upload a new firmware. Click to specify the location of the firmwareimage or browse to locate the file. You can simply upload the image or upload and boot from the image. The uploadedfirmware can only be active after the next reboot.
In case of Upload & Boot, firmware image is uploaded and upgraded to the new version, closes all sessions, restarts,and displays the login page. This process may take few minutes since the entire configuration is also migrated in thisprocess.
Boot from firmware - Option to boot from the downloaded image and activate the respective firmware.
Boot with factory default configuration - Device is rebooted and loads default configuration.
Note: Entire configuration will be lost if this option is selected.
Active - Active icon against a firmware suggests that the device is using that firmware.
Figure 463: Firmware
Available Latest Firmware
Check For New FirmwareDisplays if any new firmware is available.
Firmware VersionList of available firmware versions that can be downloaded.
TypeDifferent types of firmware.
Available Options:BetaGA
ActionsDownload Button to download the firmware. Once the firmware is downloaded, click the Installbutton to install the firmware.
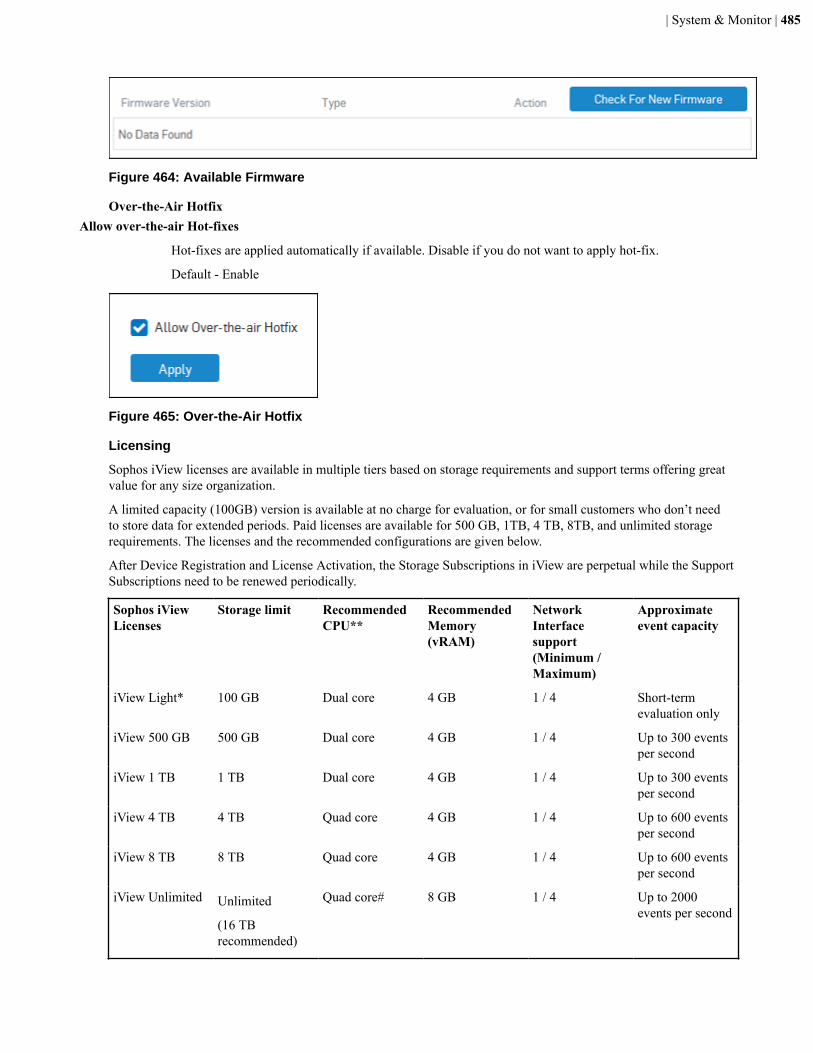
| System & Monitor | 485
Figure 464: Available Firmware
Over-the-Air HotfixAllow over-the-air Hot-fixes
Hot-fixes are applied automatically if available. Disable if you do not want to apply hot-fix.
Default - Enable
Figure 465: Over-the-Air Hotfix
Licensing
Sophos iView licenses are available in multiple tiers based on storage requirements and support terms offering greatvalue for any size organization.
A limited capacity (100GB) version is available at no charge for evaluation, or for small customers who don’t needto store data for extended periods. Paid licenses are available for 500 GB, 1TB, 4 TB, 8TB, and unlimited storagerequirements. The licenses and the recommended configurations are given below.
After Device Registration and License Activation, the Storage Subscriptions in iView are perpetual while the SupportSubscriptions need to be renewed periodically.
Sophos iViewLicenses
Storage limit RecommendedCPU**
RecommendedMemory(vRAM)
NetworkInterfacesupport(Minimum /Maximum)
Approximateevent capacity
iView Light* 100 GB Dual core 4 GB 1 / 4 Short-termevaluation only
iView 500 GB 500 GB Dual core 4 GB 1 / 4 Up to 300 eventsper second
iView 1 TB 1 TB Dual core 4 GB 1 / 4 Up to 300 eventsper second
iView 4 TB 4 TB Quad core 4 GB 1 / 4 Up to 600 eventsper second
iView 8 TB 8 TB Quad core 4 GB 1 / 4 Up to 600 eventsper second
iView Unlimited Unlimited
(16 TBrecommended)
Quad core# 8 GB 1 / 4 Up to 2000events per second
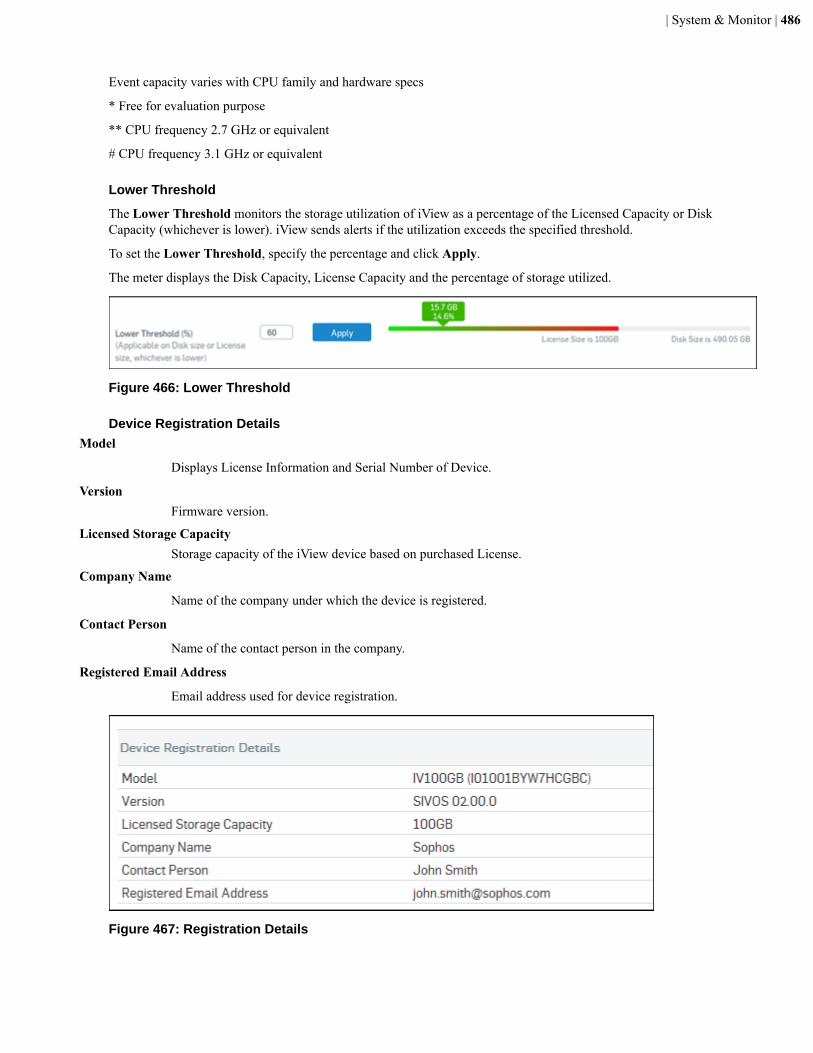
| System & Monitor | 486
Event capacity varies with CPU family and hardware specs
* Free for evaluation purpose
** CPU frequency 2.7 GHz or equivalent
# CPU frequency 3.1 GHz or equivalent
Lower Threshold
The Lower Threshold monitors the storage utilization of iView as a percentage of the Licensed Capacity or DiskCapacity (whichever is lower). iView sends alerts if the utilization exceeds the specified threshold.
To set the Lower Threshold, specify the percentage and click Apply.
The meter displays the Disk Capacity, License Capacity and the percentage of storage utilized.
Figure 466: Lower Threshold
Device Registration DetailsModel
Displays License Information and Serial Number of Device.
VersionFirmware version.
Licensed Storage CapacityStorage capacity of the iView device based on purchased License.
Company Name
Name of the company under which the device is registered.
Contact Person
Name of the contact person in the company.
Registered Email Address
Email address used for device registration.
Figure 467: Registration Details

| System & Monitor | 487
Subscription DetailsModule
Information of Storage or Support Subscription.
Status
Indicates the status of the module.
A module can have the following status:
• Active - Module is subscribed.• Inactive - Module is not subscribed.• Expired - Subscription expired.
Expiration Date
Module subscription expiry date.
Figure 468: Subscription Details
Manage Subscription
Modules can be subscribed directly from your device or from your MySophos Account. Once you subscribe, youneed to synchronize licenses with your MySophos account.
Click Synchronize to synchronize licenses with your account.
Click Activate to activate your purchased subscriptions.
Figure 469: Manage Subscription
Diagnostics
Using Diagnostics, one can view the statistics to diagnose the connectivity problem, network problem and testnetwork communication. It assists in troubleshooting issues such as hangs, packet loss, connectivity, discrepancies inthe network.
View the report from System & Monitor > System Settings > Diagnostics.
• Ping• Trace Route• Name Lookup• Route Lookup
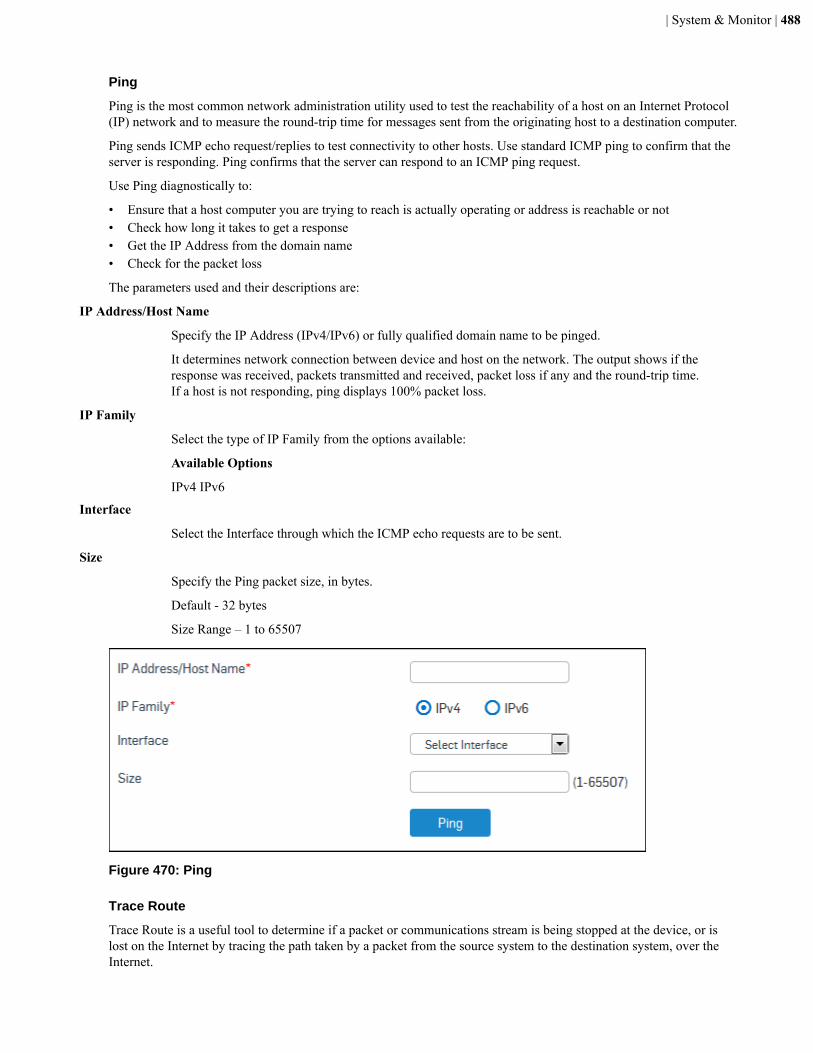
| System & Monitor | 488
Ping
Ping is the most common network administration utility used to test the reachability of a host on an Internet Protocol(IP) network and to measure the round-trip time for messages sent from the originating host to a destination computer.
Ping sends ICMP echo request/replies to test connectivity to other hosts. Use standard ICMP ping to confirm that theserver is responding. Ping confirms that the server can respond to an ICMP ping request.
Use Ping diagnostically to:
• Ensure that a host computer you are trying to reach is actually operating or address is reachable or not• Check how long it takes to get a response• Get the IP Address from the domain name• Check for the packet loss
The parameters used and their descriptions are:
IP Address/Host Name
Specify the IP Address (IPv4/IPv6) or fully qualified domain name to be pinged.
It determines network connection between device and host on the network. The output shows if theresponse was received, packets transmitted and received, packet loss if any and the round-trip time.If a host is not responding, ping displays 100% packet loss.
IP Family
Select the type of IP Family from the options available:
Available Options
IPv4 IPv6
Interface
Select the Interface through which the ICMP echo requests are to be sent.
Size
Specify the Ping packet size, in bytes.
Default - 32 bytes
Size Range – 1 to 65507
Figure 470: Ping
Trace Route
Trace Route is a useful tool to determine if a packet or communications stream is being stopped at the device, or islost on the Internet by tracing the path taken by a packet from the source system to the destination system, over theInternet.
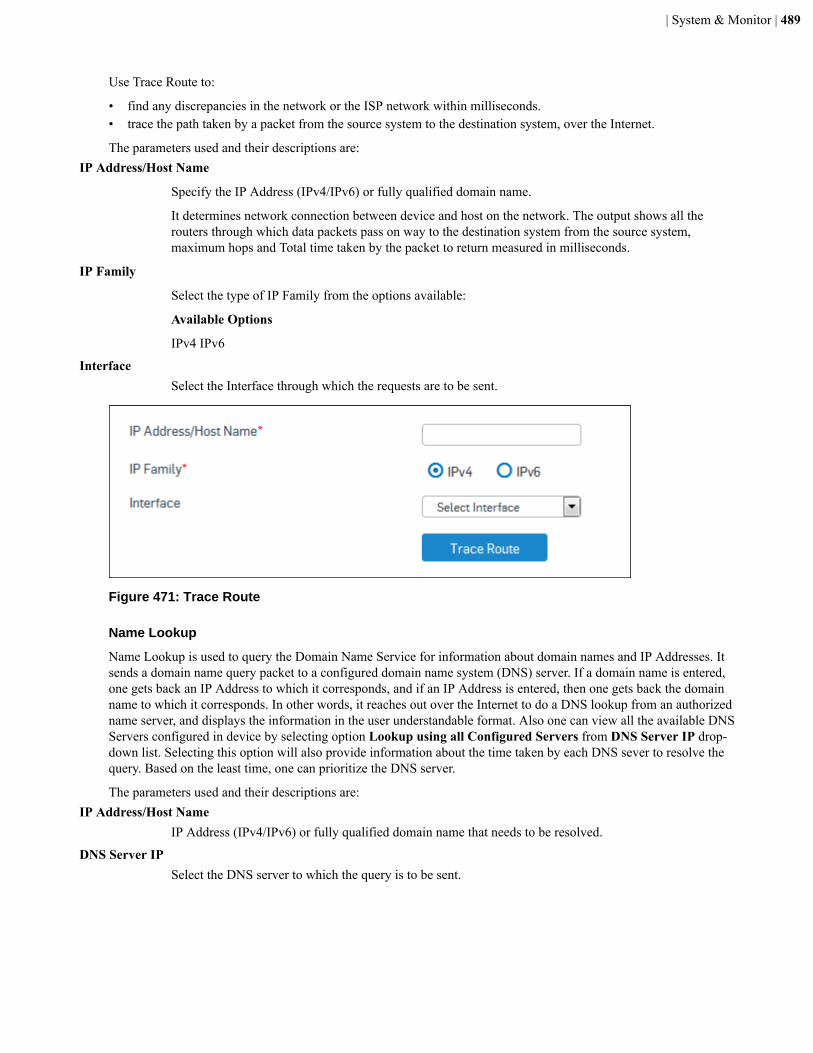
| System & Monitor | 489
Use Trace Route to:
• find any discrepancies in the network or the ISP network within milliseconds.• trace the path taken by a packet from the source system to the destination system, over the Internet.
The parameters used and their descriptions are:IP Address/Host Name
Specify the IP Address (IPv4/IPv6) or fully qualified domain name.
It determines network connection between device and host on the network. The output shows all therouters through which data packets pass on way to the destination system from the source system,maximum hops and Total time taken by the packet to return measured in milliseconds.
IP Family
Select the type of IP Family from the options available:
Available Options
IPv4 IPv6
InterfaceSelect the Interface through which the requests are to be sent.
Figure 471: Trace Route
Name Lookup
Name Lookup is used to query the Domain Name Service for information about domain names and IP Addresses. Itsends a domain name query packet to a configured domain name system (DNS) server. If a domain name is entered,one gets back an IP Address to which it corresponds, and if an IP Address is entered, then one gets back the domainname to which it corresponds. In other words, it reaches out over the Internet to do a DNS lookup from an authorizedname server, and displays the information in the user understandable format. Also one can view all the available DNSServers configured in device by selecting option Lookup using all Configured Servers from DNS Server IP drop-down list. Selecting this option will also provide information about the time taken by each DNS sever to resolve thequery. Based on the least time, one can prioritize the DNS server.
The parameters used and their descriptions are:IP Address/Host Name
IP Address (IPv4/IPv6) or fully qualified domain name that needs to be resolved.
DNS Server IPSelect the DNS server to which the query is to be sent.
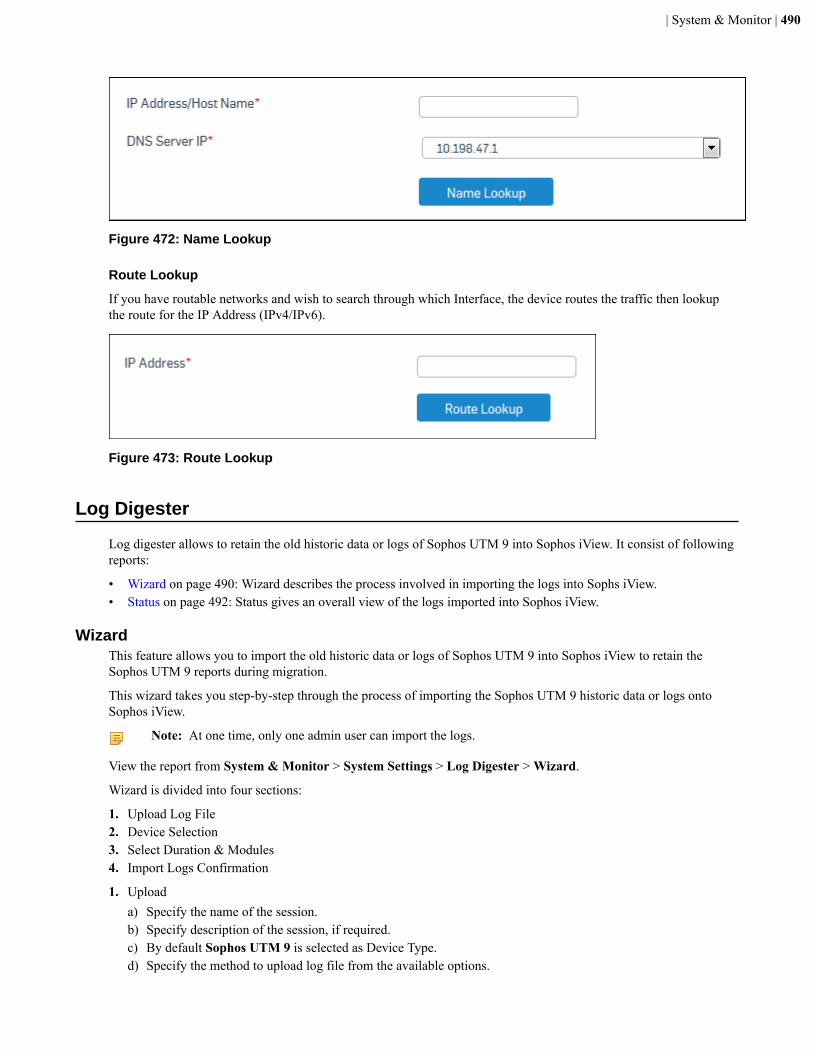
| System & Monitor | 490
Figure 472: Name Lookup
Route Lookup
If you have routable networks and wish to search through which Interface, the device routes the traffic then lookupthe route for the IP Address (IPv4/IPv6).
Figure 473: Route Lookup
Log Digester
Log digester allows to retain the old historic data or logs of Sophos UTM 9 into Sophos iView. It consist of followingreports:
• Wizard on page 490: Wizard describes the process involved in importing the logs into Sophs iView.• Status on page 492: Status gives an overall view of the logs imported into Sophos iView.
WizardThis feature allows you to import the old historic data or logs of Sophos UTM 9 into Sophos iView to retain theSophos UTM 9 reports during migration.
This wizard takes you step-by-step through the process of importing the Sophos UTM 9 historic data or logs ontoSophos iView.
Note: At one time, only one admin user can import the logs.
View the report from System & Monitor > System Settings > Log Digester > Wizard.
Wizard is divided into four sections:
1. Upload Log File2. Device Selection3. Select Duration & Modules4. Import Logs Confirmation
1. Uploada) Specify the name of the session.b) Specify description of the session, if required.c) By default Sophos UTM 9 is selected as Device Type.d) Specify the method to upload log file from the available options.
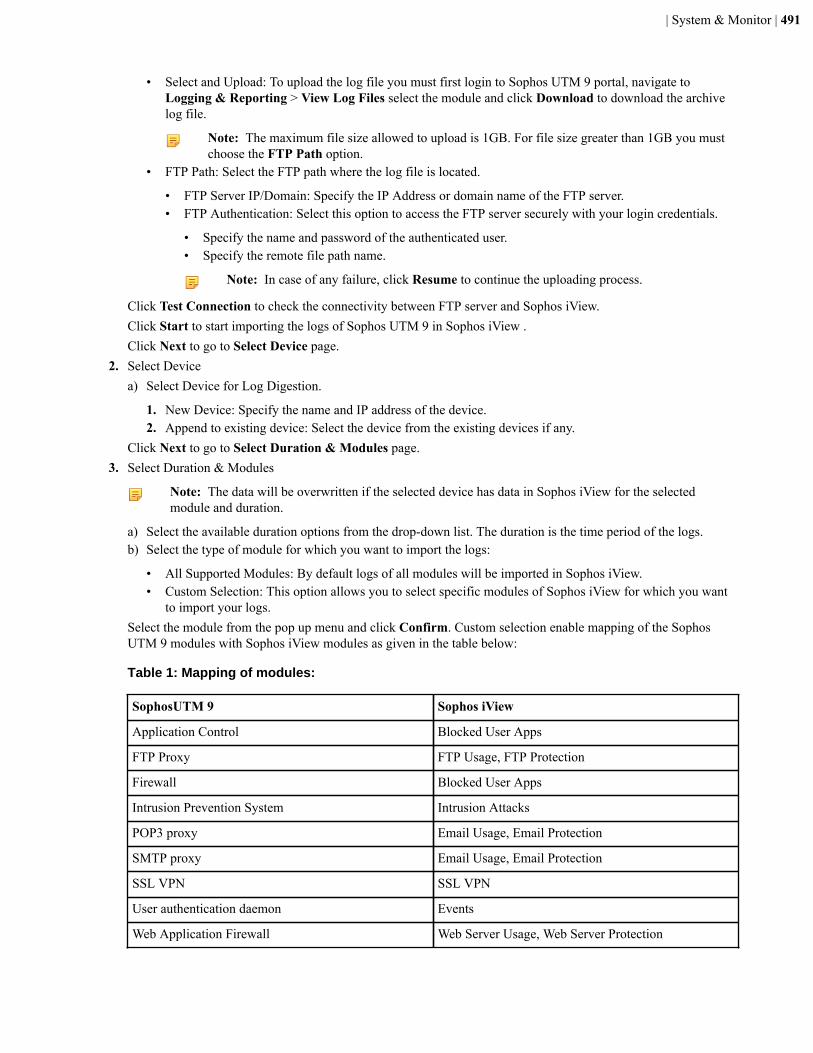
| System & Monitor | 491
• Select and Upload: To upload the log file you must first login to Sophos UTM 9 portal, navigate toLogging & Reporting > View Log Files select the module and click Download to download the archivelog file.
Note: The maximum file size allowed to upload is 1GB. For file size greater than 1GB you mustchoose the FTP Path option.
• FTP Path: Select the FTP path where the log file is located.
• FTP Server IP/Domain: Specify the IP Address or domain name of the FTP server.• FTP Authentication: Select this option to access the FTP server securely with your login credentials.
• Specify the name and password of the authenticated user.• Specify the remote file path name.
Note: In case of any failure, click Resume to continue the uploading process.
Click Test Connection to check the connectivity between FTP server and Sophos iView.Click Start to start importing the logs of Sophos UTM 9 in Sophos iView .Click Next to go to Select Device page.
2. Select Devicea) Select Device for Log Digestion.
1. New Device: Specify the name and IP address of the device.2. Append to existing device: Select the device from the existing devices if any.
Click Next to go to Select Duration & Modules page.3. Select Duration & Modules
Note: The data will be overwritten if the selected device has data in Sophos iView for the selectedmodule and duration.
a) Select the available duration options from the drop-down list. The duration is the time period of the logs.b) Select the type of module for which you want to import the logs:
• All Supported Modules: By default logs of all modules will be imported in Sophos iView.• Custom Selection: This option allows you to select specific modules of Sophos iView for which you want
to import your logs.Select the module from the pop up menu and click Confirm. Custom selection enable mapping of the SophosUTM 9 modules with Sophos iView modules as given in the table below:
Table 1: Mapping of modules:
SophosUTM 9 Sophos iView
Application Control Blocked User Apps
FTP Proxy FTP Usage, FTP Protection
Firewall Blocked User Apps
Intrusion Prevention System Intrusion Attacks
POP3 proxy Email Usage, Email Protection
SMTP proxy Email Usage, Email Protection
SSL VPN SSL VPN
User authentication daemon Events
Web Application Firewall Web Server Usage, Web Server Protection
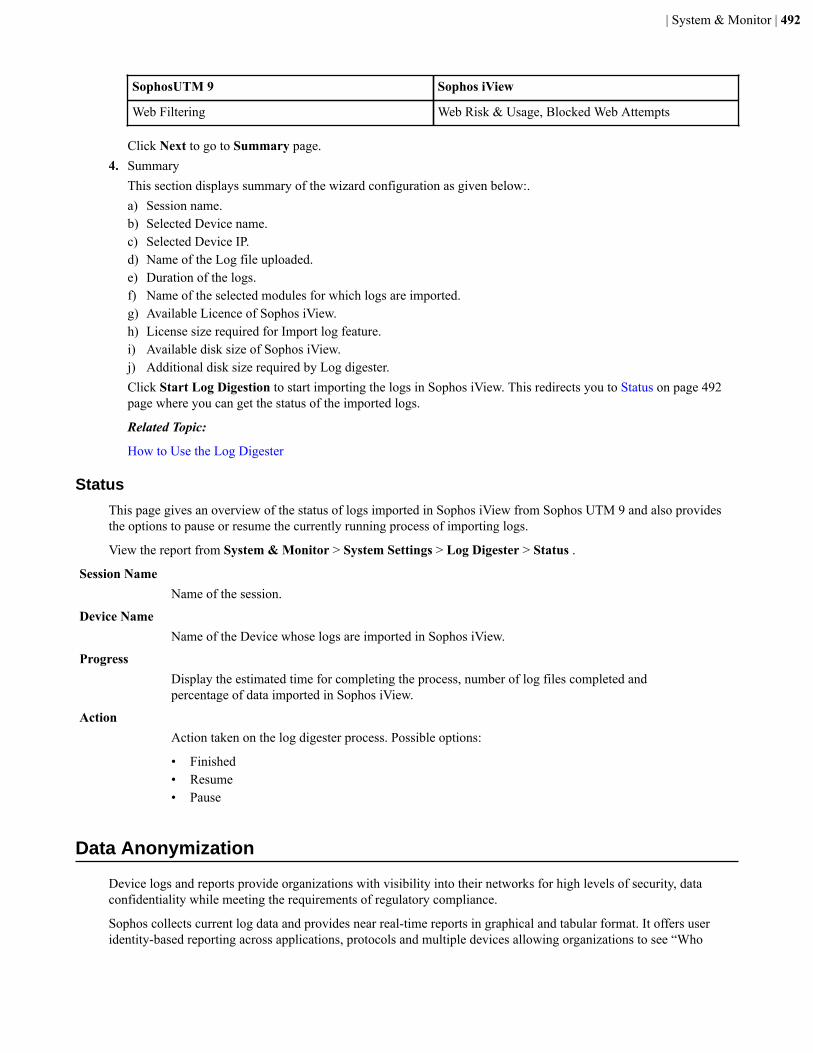
| System & Monitor | 492
SophosUTM 9 Sophos iView
Web Filtering Web Risk & Usage, Blocked Web Attempts
Click Next to go to Summary page.4. Summary
This section displays summary of the wizard configuration as given below:.a) Session name.b) Selected Device name.c) Selected Device IP.d) Name of the Log file uploaded.e) Duration of the logs.f) Name of the selected modules for which logs are imported.g) Available Licence of Sophos iView.h) License size required for Import log feature.i) Available disk size of Sophos iView.j) Additional disk size required by Log digester.Click Start Log Digestion to start importing the logs in Sophos iView. This redirects you to Status on page 492page where you can get the status of the imported logs.
Related Topic:
How to Use the Log Digester
Status
This page gives an overview of the status of logs imported in Sophos iView from Sophos UTM 9 and also providesthe options to pause or resume the currently running process of importing logs.
View the report from System & Monitor > System Settings > Log Digester > Status .
Session NameName of the session.
Device NameName of the Device whose logs are imported in Sophos iView.
ProgressDisplay the estimated time for completing the process, number of log files completed andpercentage of data imported in Sophos iView.
ActionAction taken on the log digester process. Possible options:
• Finished• Resume• Pause
Data Anonymization
Device logs and reports provide organizations with visibility into their networks for high levels of security, dataconfidentiality while meeting the requirements of regulatory compliance.
Sophos collects current log data and provides near real-time reports in graphical and tabular format. It offers useridentity-based reporting across applications, protocols and multiple devices allowing organizations to see “Who
| System & Monitor | 493
is doing What” anywhere in the network. It offers wide spectrum of 1000+ unique reports to get in-depth networkvisibility help organizations to take corrective and preventive measures.
For legally compliant logging, reporting and archiving, it is important that an organization follows all the obligationsfor keeping relevant information archived and accessible all the time. To maintain the security, it also required tomonitor the logs related to user-specific activities. On the other hand, the organization must also not invade itsemployee’s privacy.
Monitoring user-specific activities without the consent or the presence of the employee or their delegate is illegal.Internal protection is necessary when a person can access activity logs of other employees.
In an organization, usually the IT Administrator has access permissions to view the user activity logs to ensuresecurity. However, administrator can violate the organization’s privacy regulations and have insight to confidentialdocuments and can misuse to track user activities.
To prevent a single administrator from having complete control over the logs, device has implemented a Four-Eye authentication. It enhances the already existing logging and security mechanisms by adding an additionaladministrator, without whose permission access cannot be granted.
In this system, Administrator can view user (employee) specific activities / logs /reports only if an IndependentAuthorized person approves it.
Once it is enabled, Data Anonymization can be used to prevent unauthorized access to private data. To view userspecific logs, two authorized administrators must log in. Additionally, data can also be anonymized to enhanceprivacy protection.
Data Anonymization
Data AnonymizationThis report displays the list of all the devices whose data can be anonymized or de-anonymized by the admin.
View the report from System & Monitor > System Settings > Data Anonymization > Data Anonymization.
Device NameName of the device.
Device GroupName of the device group.
Anonymization StatusDisplay the current status of the device. Possible options are:
• Anonymized• De-anonymized
AuthorizerDisplays the name of the authorizer for the given device. For each device, at least one independentauthorizer with the administrative privileges is required.
Click the below options to enable/disable data anonymization and to select authorizer administrators.
• Enable anonymization• Disable anonymization
Related Topic:
Configure Data Anonymization
Anonymize DataUse this page to anonymize all the user identities - Username, IP Address, MAC Address and Email Address in alllogs or reports.
Enable data anonymization for the IT administrator to view or download user-specific logs or reports. Apart from theIT administrator, at least one independent authorizer with the administrative privileges is required.
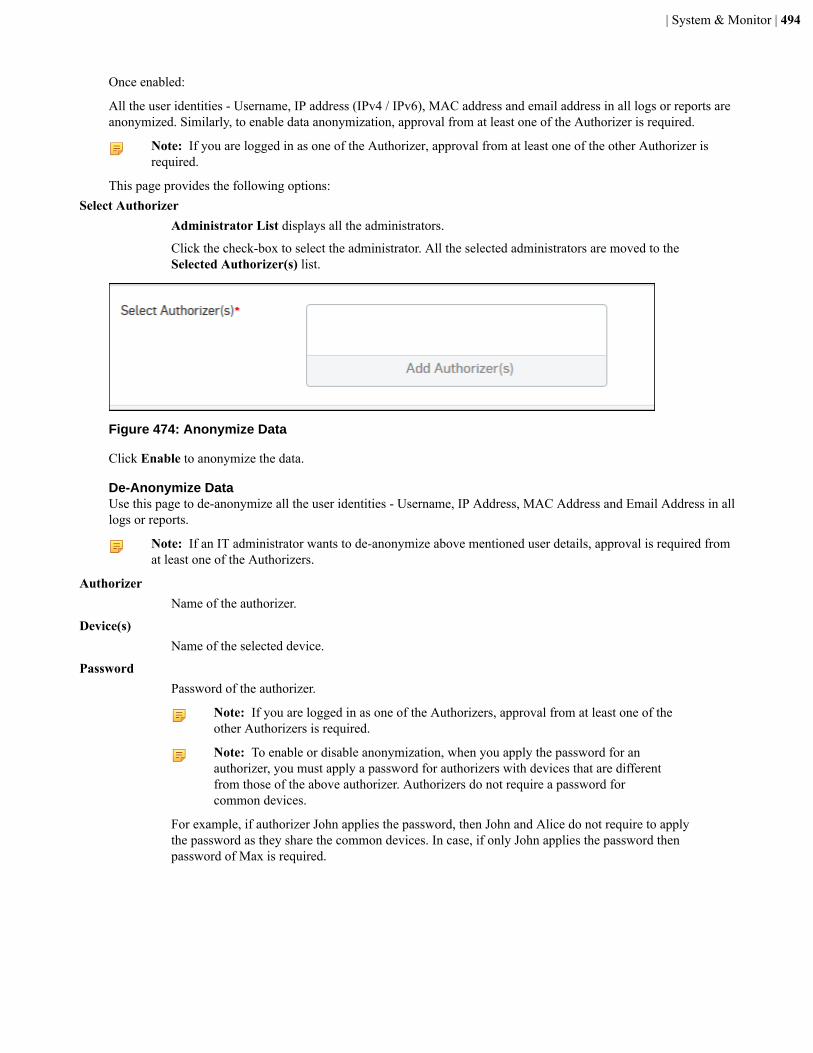
| System & Monitor | 494
Once enabled:
All the user identities - Username, IP address (IPv4 / IPv6), MAC address and email address in all logs or reports areanonymized. Similarly, to enable data anonymization, approval from at least one of the Authorizer is required.
Note: If you are logged in as one of the Authorizer, approval from at least one of the other Authorizer isrequired.
This page provides the following options:Select Authorizer
Administrator List displays all the administrators.
Click the check-box to select the administrator. All the selected administrators are moved to theSelected Authorizer(s) list.
Figure 474: Anonymize Data
Click Enable to anonymize the data.
De-Anonymize DataUse this page to de-anonymize all the user identities - Username, IP Address, MAC Address and Email Address in alllogs or reports.
Note: If an IT administrator wants to de-anonymize above mentioned user details, approval is required fromat least one of the Authorizers.
AuthorizerName of the authorizer.
Device(s)Name of the selected device.
PasswordPassword of the authorizer.
Note: If you are logged in as one of the Authorizers, approval from at least one of theother Authorizers is required.
Note: To enable or disable anonymization, when you apply the password for anauthorizer, you must apply a password for authorizers with devices that are differentfrom those of the above authorizer. Authorizers do not require a password forcommon devices.
For example, if authorizer John applies the password, then John and Alice do not require to applythe password as they share the common devices. In case, if only John applies the password thenpassword of Max is required.
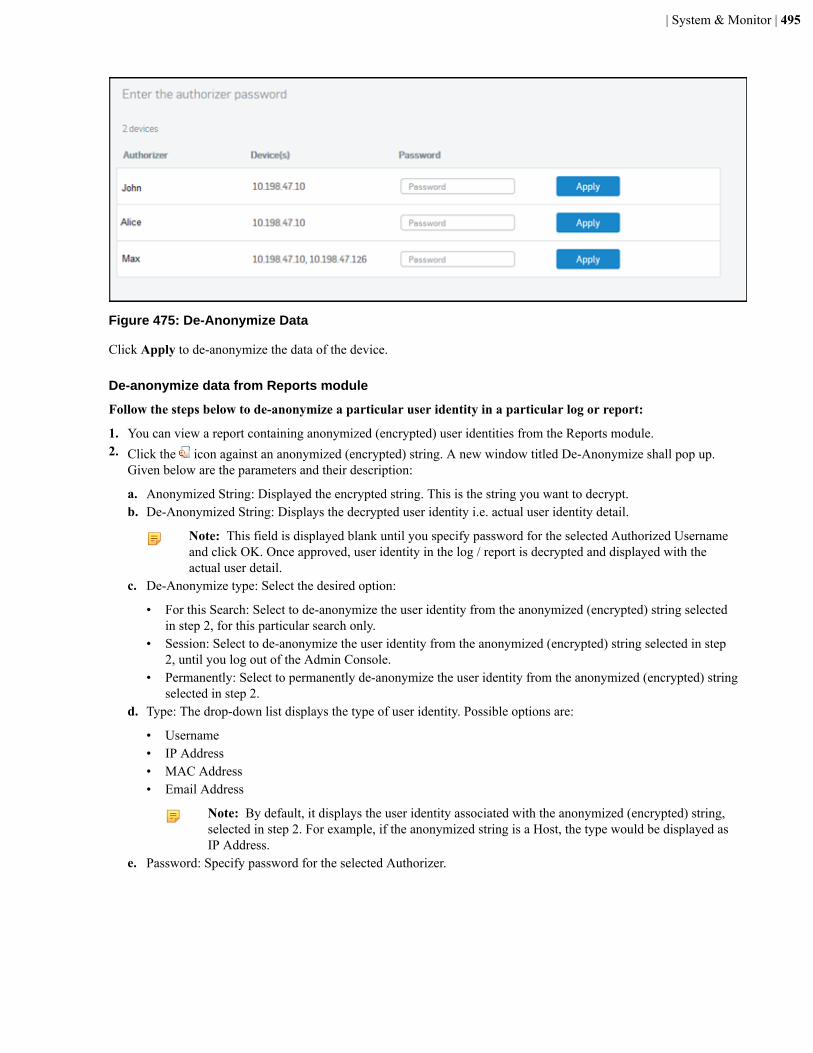
| System & Monitor | 495
Figure 475: De-Anonymize Data
Click Apply to de-anonymize the data of the device.
De-anonymize data from Reports module
Follow the steps below to de-anonymize a particular user identity in a particular log or report:
1. You can view a report containing anonymized (encrypted) user identities from the Reports module.2. Click the icon against an anonymized (encrypted) string. A new window titled De-Anonymize shall pop up.
Given below are the parameters and their description:
a. Anonymized String: Displayed the encrypted string. This is the string you want to decrypt.b. De-Anonymized String: Displays the decrypted user identity i.e. actual user identity detail.
Note: This field is displayed blank until you specify password for the selected Authorized Usernameand click OK. Once approved, user identity in the log / report is decrypted and displayed with theactual user detail.
c. De-Anonymize type: Select the desired option:
• For this Search: Select to de-anonymize the user identity from the anonymized (encrypted) string selectedin step 2, for this particular search only.
• Session: Select to de-anonymize the user identity from the anonymized (encrypted) string selected in step2, until you log out of the Admin Console.
• Permanently: Select to permanently de-anonymize the user identity from the anonymized (encrypted) stringselected in step 2.
d. Type: The drop-down list displays the type of user identity. Possible options are:
• Username• IP Address• MAC Address• Email Address
Note: By default, it displays the user identity associated with the anonymized (encrypted) string,selected in step 2. For example, if the anonymized string is a Host, the type would be displayed asIP Address.
e. Password: Specify password for the selected Authorizer.
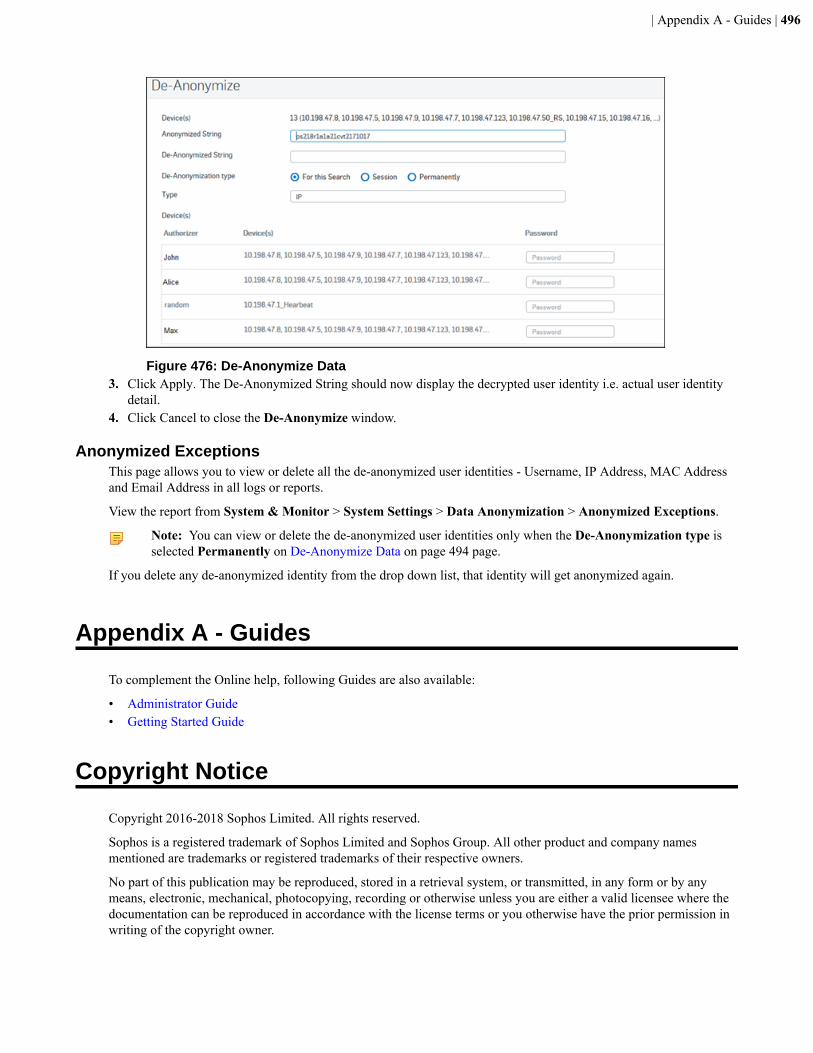
| Appendix A - Guides | 496
Figure 476: De-Anonymize Data3. Click Apply. The De-Anonymized String should now display the decrypted user identity i.e. actual user identity
detail.4. Click Cancel to close the De-Anonymize window.
Anonymized ExceptionsThis page allows you to view or delete all the de-anonymized user identities - Username, IP Address, MAC Addressand Email Address in all logs or reports.
View the report from System & Monitor > System Settings > Data Anonymization > Anonymized Exceptions.
Note: You can view or delete the de-anonymized user identities only when the De-Anonymization type isselected Permanently on De-Anonymize Data on page 494 page.
If you delete any de-anonymized identity from the drop down list, that identity will get anonymized again.
Appendix A - Guides
To complement the Online help, following Guides are also available:
• Administrator Guide• Getting Started Guide
Copyright Notice
Copyright 2016-2018 Sophos Limited. All rights reserved.
Sophos is a registered trademark of Sophos Limited and Sophos Group. All other product and company namesmentioned are trademarks or registered trademarks of their respective owners.
No part of this publication may be reproduced, stored in a retrieval system, or transmitted, in any form or by anymeans, electronic, mechanical, photocopying, recording or otherwise unless you are either a valid licensee where thedocumentation can be reproduced in accordance with the license terms or you otherwise have the prior permission inwriting of the copyright owner.