soquel crk water es10 fall12 for post - cabrillo.edu€¦ · western purisima : ... less available...
TRANSCRIPT
10/23/2012
1
October 18, 2012
OverviewOur local water resources (Vai)
Water conservation (Ron)
Integrated water plan and Desalination (Melanie)
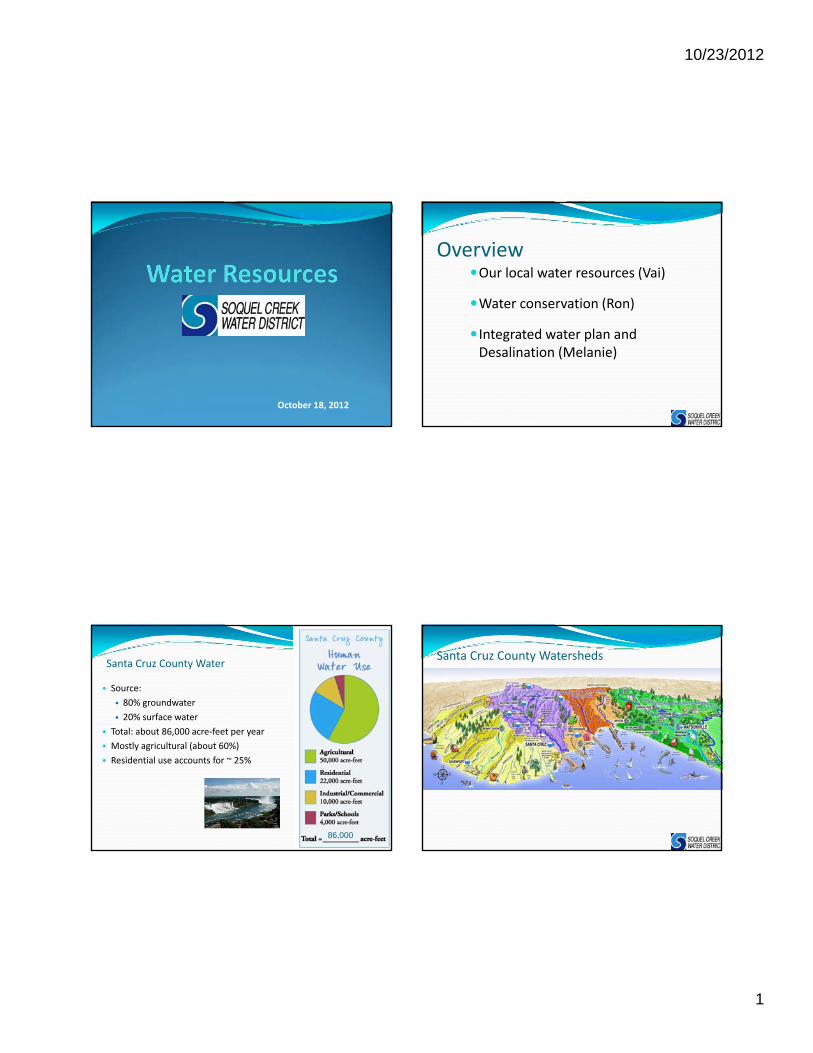
Santa Cruz County Water
• Source:
• 80% groundwater
• 20% surface water
• Total: about 86,000 acre‐feet per year
• Mostly agricultural (about 60%)
• Residential use accounts for ~ 25%
86,000
Santa Cruz County Watersheds
10/23/2012
2
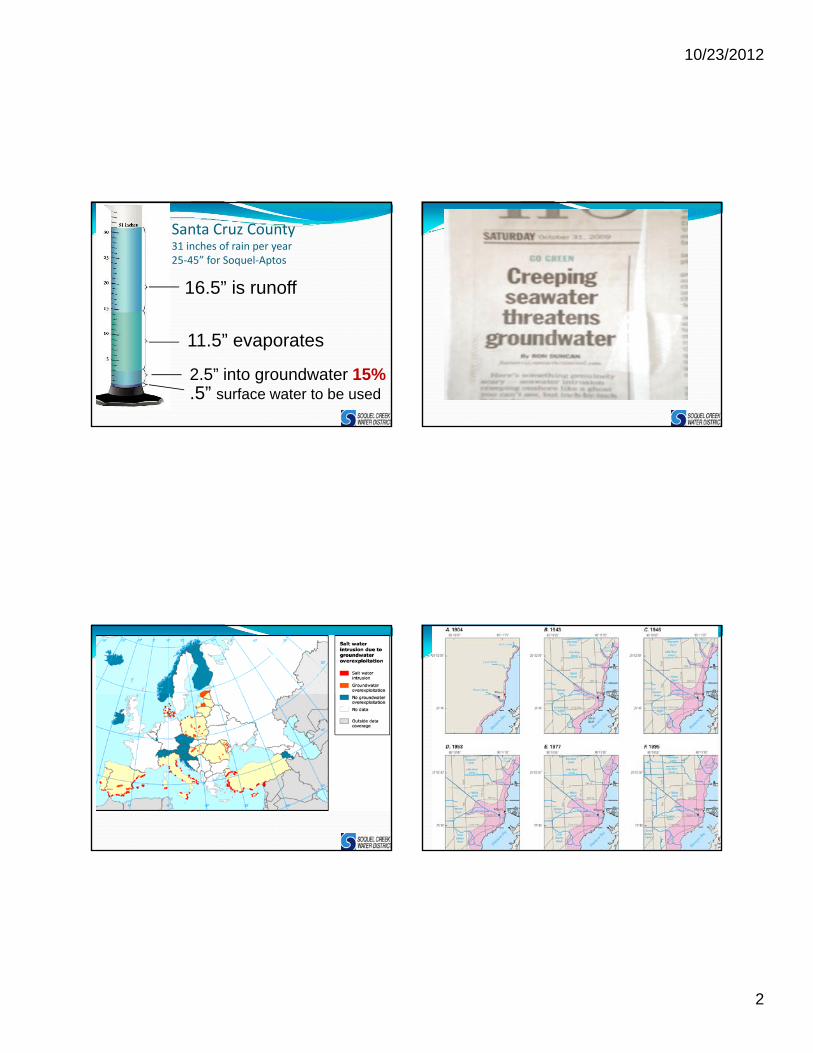
Santa Cruz County31 inches of rain per year25‐45” for Soquel‐Aptos
16.5” is runoff
11.5” evaporates
2.5” into groundwater 15%.5” surface water to be used
10/23/2012
3
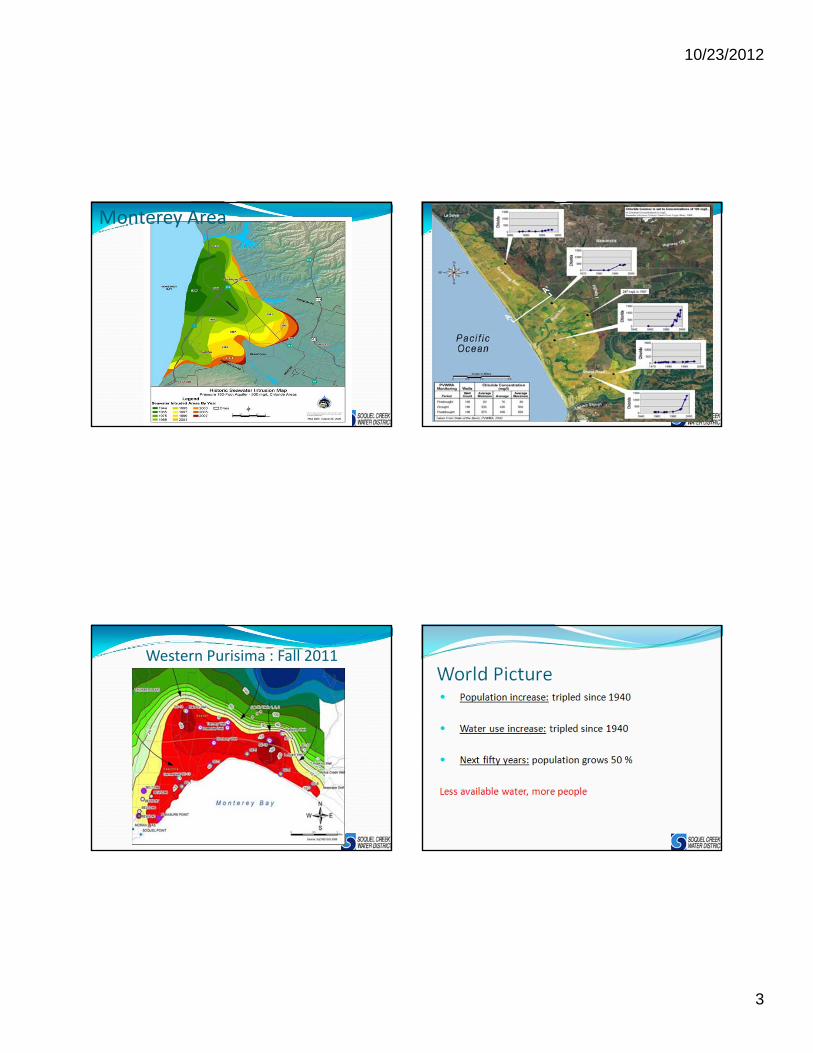
Monterey Area
Western Purisima : Fall 2011
10/23/2012
4
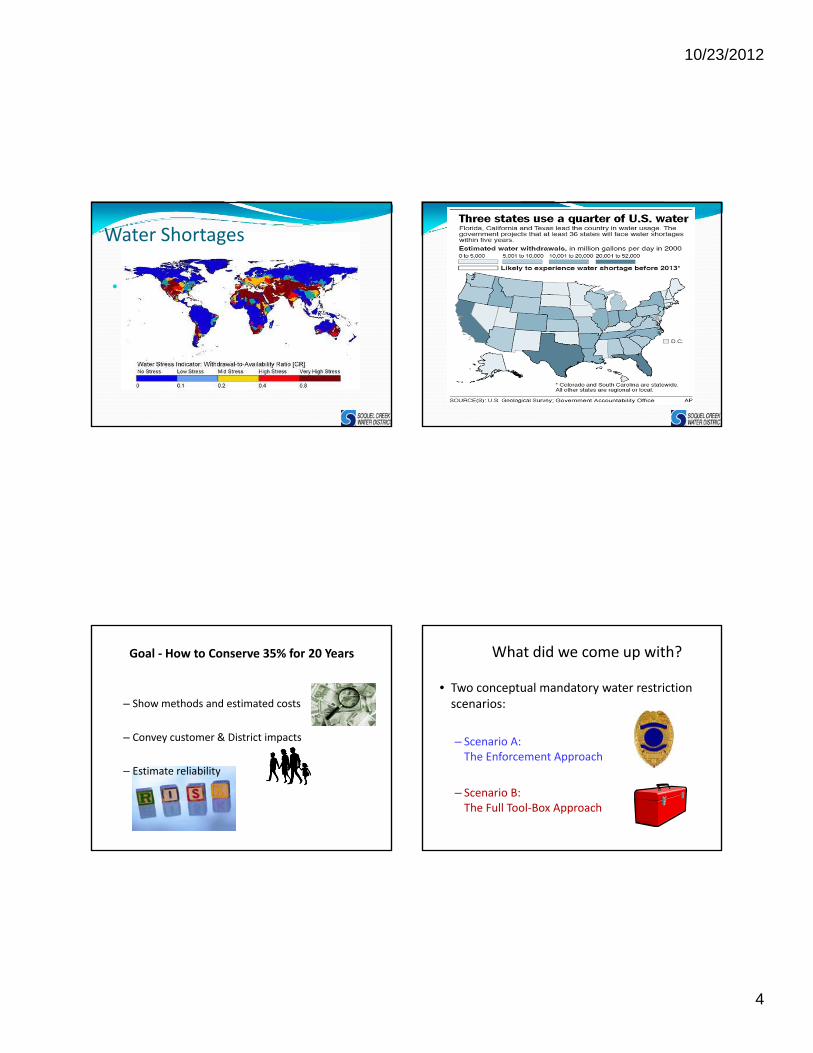
Water Shortages
Goal ‐ How to Conserve 35% for 20 Years
– Show methods and estimated costs
– Convey customer & District impacts
– Estimate reliability
What did we come up with?
• Two conceptual mandatory water restriction scenarios:
– Scenario A: The Enforcement Approach
– Scenario B: The Full Tool‐Box Approach
10/23/2012
5
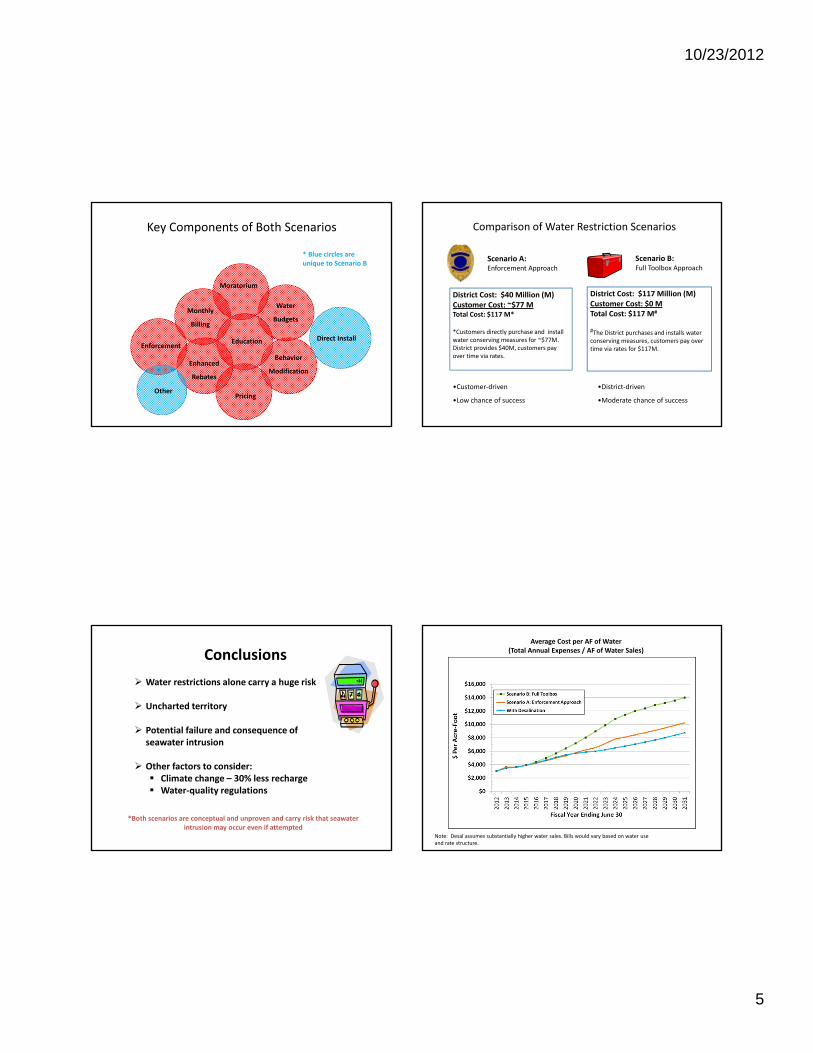
Key Components of Both Scenarios
Moratorium
Monthly
Billing
Enforcement
Water
Budgets
Pricing
Behavior
Modification
Education
Enhanced
Rebates
Direct Install
Other
* Blue circles are unique to Scenario B
Comparison of Water Restriction Scenarios
•Customer‐driven
•Low chance of success
•District‐driven
•Moderate chance of success
Scenario A:Enforcement Approach
Scenario B:Full Toolbox Approach
District Cost: $117 Million (M)Customer Cost: $0 MTotal Cost: $117 M#
#The District purchases and installs water conserving measures, customers pay over time via rates for $117M.
District Cost: $40 Million (M)Customer Cost: ~$77 MTotal Cost: $117 M*
*Customers directly purchase and install water conserving measures for ~$77M. District provides $40M, customers pay over time via rates.
*Both scenarios are conceptual and unproven and carry risk that seawater intrusion may occur even if attempted
Water restrictions alone carry a huge risk
Uncharted territory
Potential failure and consequence of seawater intrusion
Other factors to consider: Climate change – 30% less recharge Water‐quality regulations
ConclusionsAverage Cost per AF of Water
(Total Annual Expenses / AF of Water Sales)
Note: Desal assumes substantially higher water sales. Bills would vary based on water use and rate structure.
10/23/2012
6
Water Industry ‐ Help Wanted Aging Workforce – next 10 years 50% retire
Less available people – the rising Generation X (30 – 50 yrs) is 25% smaller than
current workforce
Growing industry – growing and changing as technology advances, new water
sources are developed, wastewater treatment technologies evolve, and regulations increase
Water Footprint Sister to Carbon Footprint
654,000 gals avg. US citizen Footprint
Only 5% (37,000 gals) from direct use
1 hamburger = 600 gallons
1 cotton T‐shirt = 500 gallons
1 slice of bread = 10 gallons
1 beer = 20 gallons (can’t use that as excuse anymore to save water)
Toilets – Technology Evolution Pre 1983 – 5 gallons per flush
1983 – 1992 – 3.5 gallons per flush
1992 – 2012ish – 1.6 gpf
2014 – 1.2 gpf
(2010 – invent 0.8 gpf, future no water?)
10/23/2012
7
Hot‐water Recirculation Systems
Who likes to waste water?
Who steps into a cold shower?
Nifty device – saves water (best type is the self activate type systems –save energy too)
Peanut Butter & Jelly Energy produces water, water makes “E”
In CA 20% of energy use related to water
100 watt light blub for 10 hrs takes 25 gals
3 Rounds – Who wins? Safety – a draw (EPA vs. FDA)
Environmental – tap takes it (bottle 1/4 oil)
Co$t – bottle 1000 times more costly
KNOCKOUT – tap wins
Best Life/Work Lesson
“It’s not the strongest of the species that survives, nor the most intelligent, but the one most responsive to change.” Charles Darwin
10/23/2012
8
Melanie Mow Schumacher
Education Bachelor of Science, Civil Engineering
Licensed, California Professional Engineer (P.E.)
Jobs Construction Management‐Military Base Conversions
Geotechnical Engineering‐ Soil Samples and Testing
Water Resources – Soquel Creek Water District
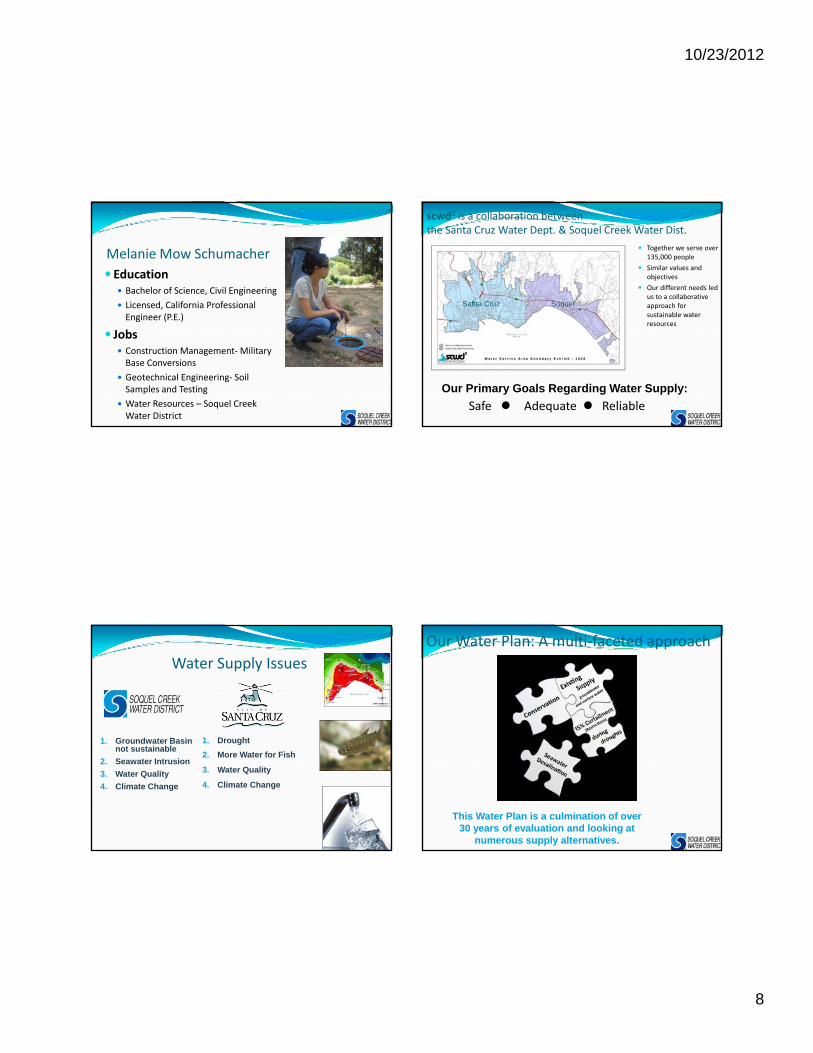
scwd2 is a collaboration betweenthe Santa Cruz Water Dept. & Soquel Creek Water Dist.
Together we serve over 135,000 people
Similar values and objectives
Our different needs led us to a collaborative approach for sustainable water resources
Santa Cruz Soquel
Safe Adequate Reliable
Our Primary Goals Regarding Water Supply:
Water Supply Issues
1. Drought
2. More Water for Fish
3. Water Quality
4. Climate Change
1. Groundwater Basin not sustainable
2. Seawater Intrusion
3. Water Quality
4. Climate Change
Our Water Plan: A multi‐faceted approach
This Water Plan is a culmination of over 30 years of evaluation and looking at
numerous supply alternatives.
10/23/2012
9
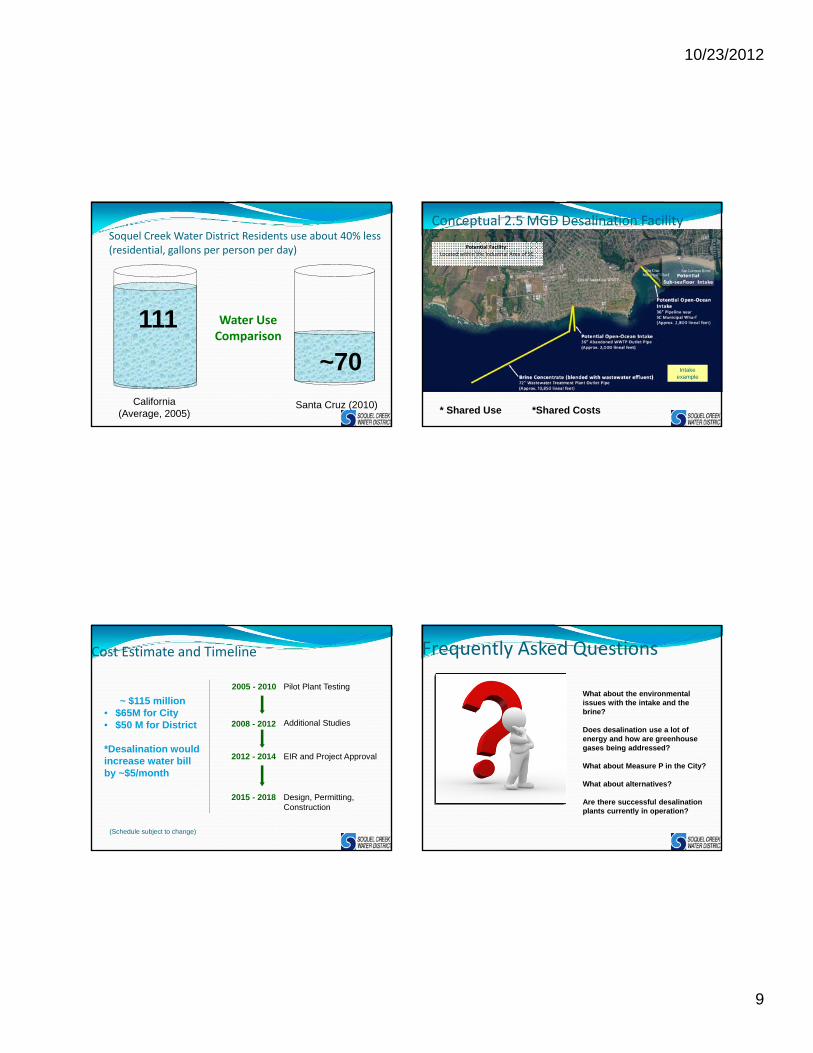
Soquel Creek Water District Residents use about 40% less(residential, gallons per person per day)
Water Use Comparison
California (Average, 2005)
Santa Cruz (2010)
~70
111
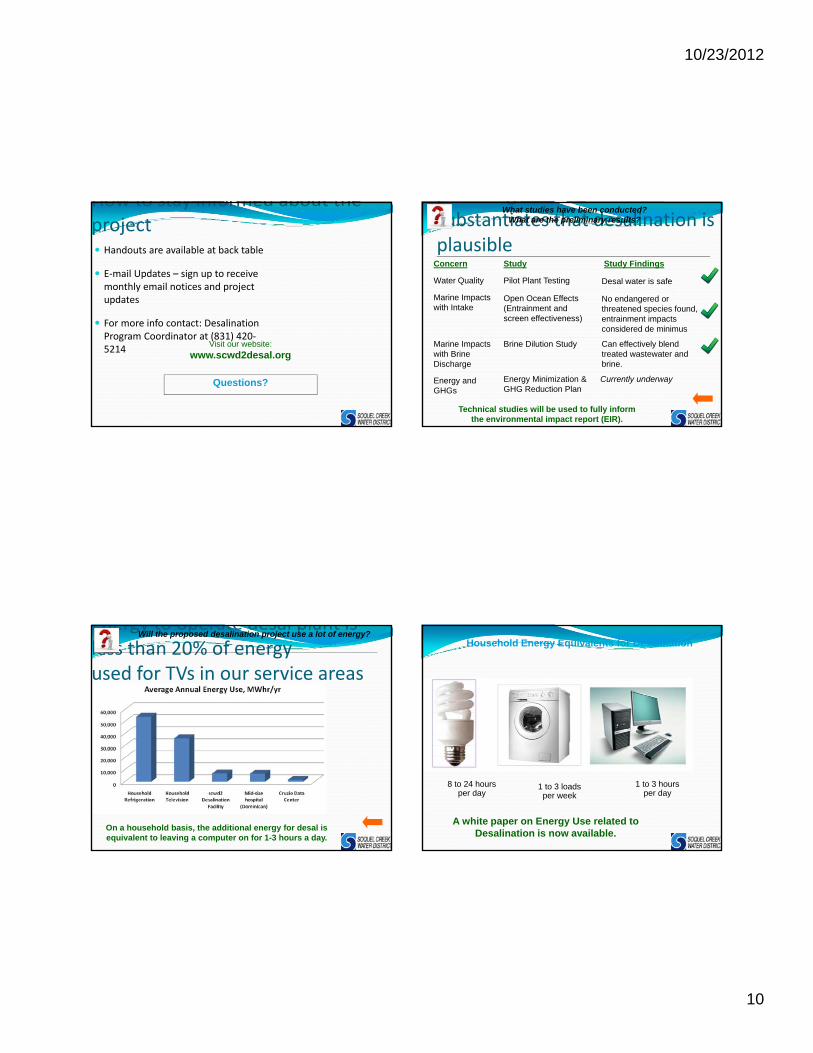
Conceptual 2.5 MGD Desalination Facility
* Shared Use *Shared Costs
Potential Facility: Located within the Industrial Area of SC
Intake example
Cost Estimate and Timeline
2005 - 2010 Pilot Plant Testing
Additional Studies
EIR and Project Approval
Design, Permitting, Construction
2008 - 2012
2012 - 2014
2015 - 2018
(Schedule subject to change)
~ $115 million• $65M for City• $50 M for District
*Desalination would increase water bill by ~$5/month
Frequently Asked Questions
What about the environmental issues with the intake and the brine?
Does desalination use a lot of energy and how are greenhouse gases being addressed?
What about Measure P in the City?
What about alternatives?
Are there successful desalination plants currently in operation?
10/23/2012
10
How to stay informed about the project Handouts are available at back table
E‐mail Updates – sign up to receive monthly email notices and project updates
For more info contact: Desalination Program Coordinator at (831) 420‐5214
Visit our website:www.scwd2desal.org
Questions?
p gsubstantiates that desalination is plausible
Concern Study
Water Quality Pilot Plant Testing
Marine Impacts with Intake
Open Ocean Effects (Entrainment and screen effectiveness)
Energy and GHGs
Energy Minimization & GHG Reduction Plan
Marine Impacts with Brine Discharge
Brine Dilution Study
Technical studies will be used to fully inform the environmental impact report (EIR).
What studies have been conducted? What are the preliminary results?
Study Findings
Desal water is safe
Currently underway
Can effectively blendtreated wastewater and brine.
No endangered or threatened species found, entrainment impacts considered de minimus
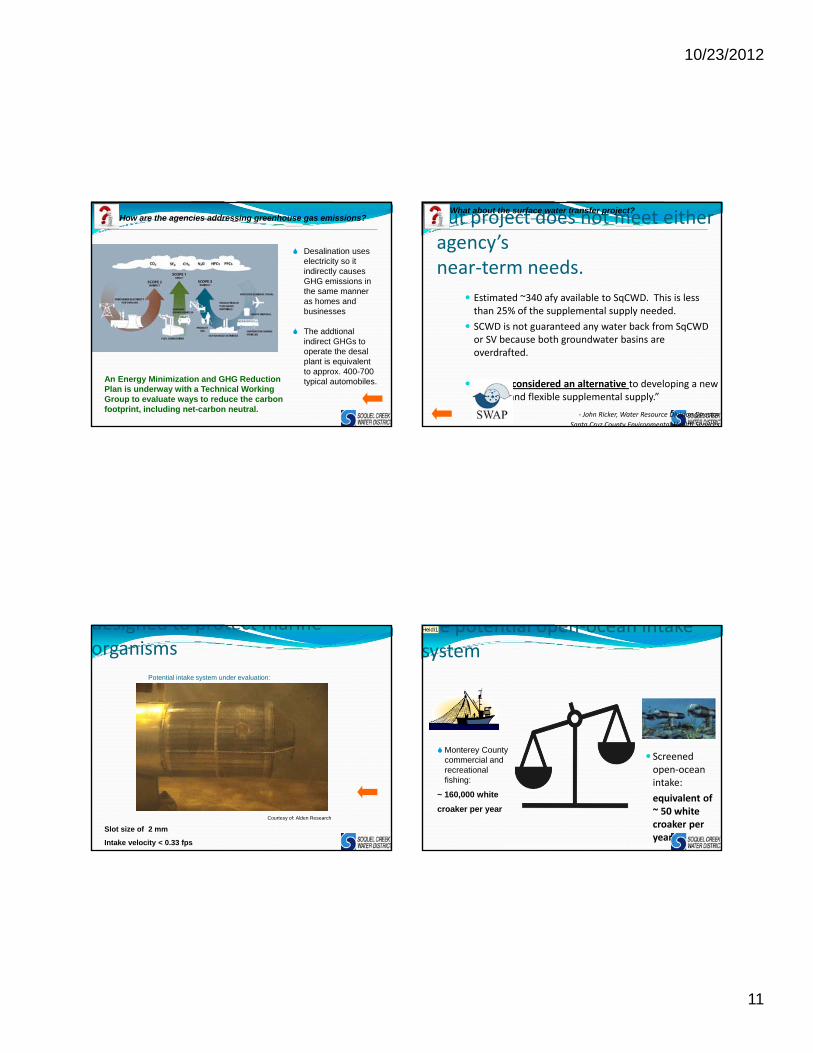
Energy to operate desal plant is less than 20% of energy used for TVs in our service areas
Will the proposed desalination project use a lot of energy?
On a household basis, the additional energy for desal is equivalent to leaving a computer on for 1-3 hours a day.
Household Energy Equivalents for Desalination
8 to 24 hours per day
1 to 3 hours per day
1 to 3 loads per week
A white paper on Energy Use related to Desalination is now available.
10/23/2012
11
How are the agencies addressing greenhouse gas emissions?
Desalination uses electricity so it indirectly causes GHG emissions in the same manner as homes and businesses
The addtional indirect GHGs to operate the desal plant is equivalent to approx. 400-700 typical automobiles.An Energy Minimization and GHG Reduction
Plan is underway with a Technical Working Group to evaluate ways to reduce the carbon footprint, including net-carbon neutral.
but project does not meet either agency’s near‐term needs.
Estimated ~340 afy available to SqCWD. This is less than 25% of the supplemental supply needed.
SCWD is not guaranteed any water back from SqCWD or SV because both groundwater basins are overdrafted.
“….. not considered an alternative to developing a new reliable and flexible supplemental supply.”
‐ John Ricker, Water Resource Division Director
Santa Cruz County Environmental Health Services
What about the surface water transfer project?
designed to protect marine organisms
Slot size of 2 mm
Intake velocity < 0.33 fps
Courtesy of: Alden Research
Potential intake system under evaluation:
the potential open‐ocean intake system
Screened open‐ocean intake:
equivalent of ~ 50 white croaker per year
Pacific Fisheries Information Network and Tenera
Monterey County commercial and recreational fishing:
~ 160,000 white
croaker per year
Heidi1

Slide 44
Heidi1 I would like to delete this slide. I've heard from several that it looks like we are comparing to commercial fisheries (peoples livelihood) and saying see, we're not as bad as that and also that 50 is still large. Can we delete it? And maybe conclude the intake study with some bullets about what its doing: assessing habitat including special status species. evaluating ways to eliminate impingement and reduce entrainment. Assess impacts and mitigate them.hluckenbach, 5/5/2011
10/23/2012
12
Conceptual Project Costs Several components continue to be evaluated
Costs will be shared equitably between the City and District
Conceptual cost estimated at ~$115 million (includes 30% contingency)
IntakeStructure
IntakeStructure
LandAcquisition
LandAcquisition
TreatmentPlant
TreatmentPlant
AlternativeEnergy
AlternativeEnergy
ConcentrateDisposal
ConcentrateDisposal
Storage& Delivery
Storage& Delivery
How much will the proposed project cost?Desalination is a proven and successful technology
1950s ‐ First major desalination plants built in the Middle East
1961 ‐ First U.S. seawater desalination plant built in Freeport, Texas
Sand City’s RO units
• Currently – over 15,000 desalination plants in operation worldwide
• 70% of U.S. desalination capacity uses reverse osmosis technology
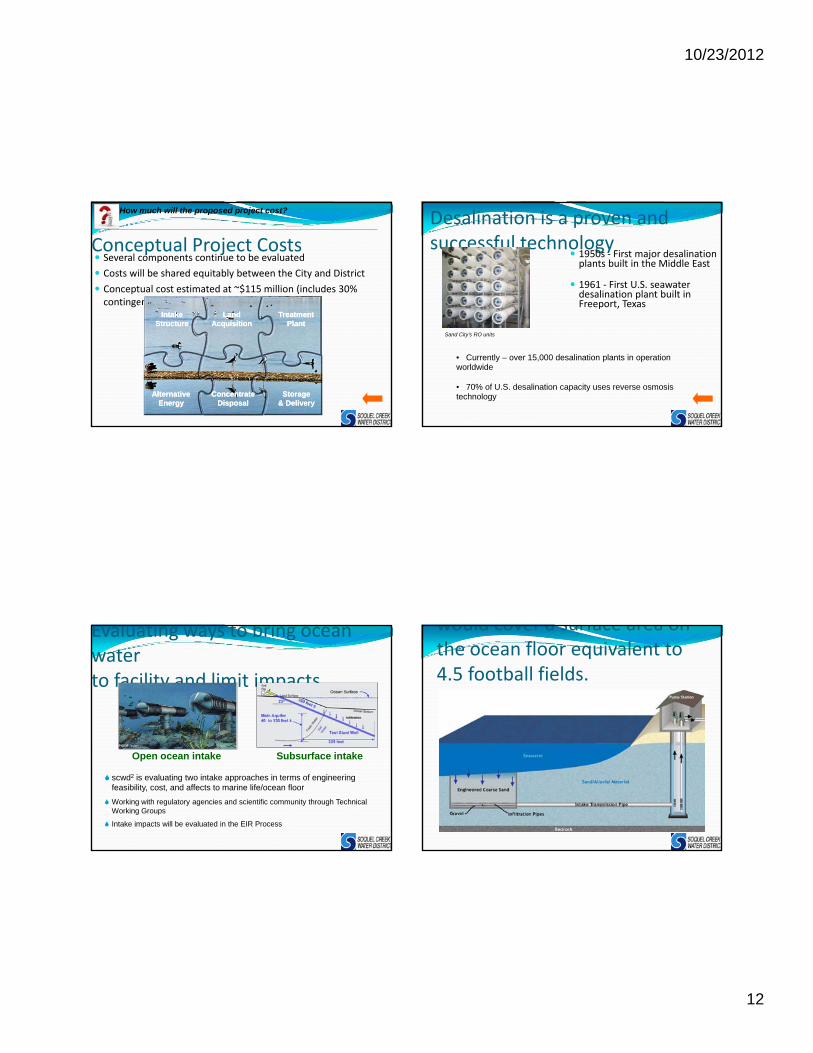
Evaluating ways to bring ocean water to facility and limit impacts
scwd2 is evaluating two intake approaches in terms of engineering feasibility, cost, and affects to marine life/ocean floor
Working with regulatory agencies and scientific community through Technical Working Groups
Intake impacts will be evaluated in the EIR Process
Open ocean intake Subsurface intake
would cover a surface area on the ocean floor equivalent to 4.5 football fields.
10/23/2012
13
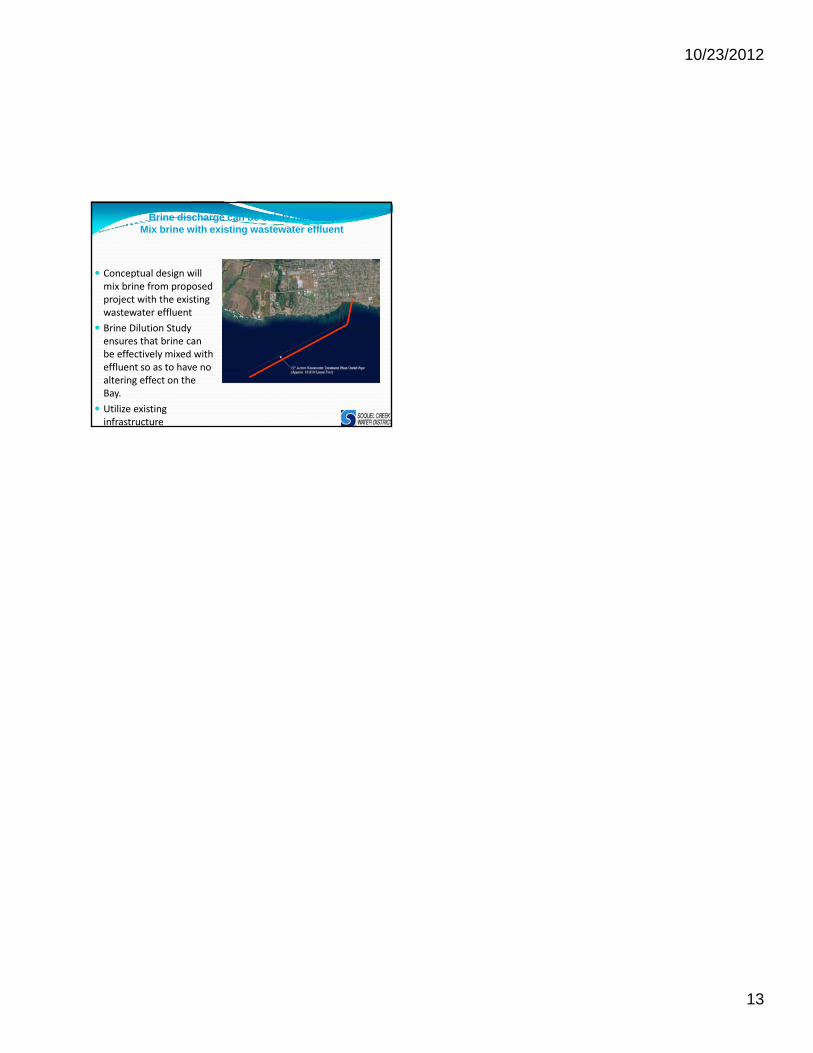
Brine discharge can be safely handled:Mix brine with existing wastewater effluent
Conceptual design will mix brine from proposed project with the existing wastewater effluent
Brine Dilution Study ensures that brine can be effectively mixed with effluent so as to have no altering effect on the Bay.
Utilize existing infrastructure