sot risk assessment specialty section webinar november 9, …
TRANSCRIPT
Beth Brewer,1 Michael Wright,2 Glenn Rice,2 Lucas Neas,3 Linda Teuschler4
1 US EPA, Oak Ridge Institute for Science and Education (ORISE) Fellow, Office of the Science Advisor2 US EPA, National Center for Environmental Assessment3 US EPA, National Health and Environmental Effects Research Laboratory4 LK Teuschler and Associates
SOT Risk Assessment Specialty Section Webinar November 9, 2016
Views presented here are of the authors, and do not necessarily reflect the opinion or position of the EPA.

Outline• Background
– CRA– Causal inference – Directed acyclic graphs (DAGs)
• Uses of graphical causal models throughout CRA– Planning, scoping, problem formulation– Analysis – Characterization
• Challenges of using graphical methods for causal inference
• Summary
2

Project Origins
3
• Argonne National Laboratory• ATSDR• Boston University• DHHS• Emory University, Clinical
Biomarkers Laboratory• Exponent• Gradient Corporation• International Life Sciences
Institute• NIH NIEHS• Stanford University • The Scientific Consulting Group• UCLA School of Medicine,
Division of Cardiology• University of Michigan School of
Public Health• University of Ottawa• University of Pittsburgh
Department of Environmental and Occupational Health
• University of Rochester School of Medicine and Dentistry
• University of Tennessee at Knoxville
• EPA NHEERL• EPA OA OCHP• EPA OAR OAQPS• EPA OAR OAQPS HEID• EPA OCSPP OPP HED• EPA OCSPP OPPT• EPA OCSPP OPPT RAD• EPA OP • EPA ORD• EPA ORD IOAA• EPA ORD NCEA• EPA ORD NCER• EPA ORD NCER HRFD• EPA ORD NERL• EPA ORD NERL HEASD• EPA ORD NHEERL• EPA ORD NHEERL
NCCT• EPA ORD NHEERL TAD• EPA ORD NRMRL
LRPCD• EPA ORD OSA• EPA ORD OSP• EPA OSWER• EPA OW• EPA Region 2• EPA Region 3• EPA Region 4• EPA Region 5• EPA Region 6• EPA Region 8• EPA Region 9
Cumulative Risk Assessment (CRA)
• CRAs examine, characterize, and quantify the combined risks to human health or the environment from exposures to multiple stressors – E.g., chemical, physical, biological, and social stressors– May focus on vulnerable populations
• CRAs may utilize many sources of information, toxicology, epidemiology, sociology, clinical studies, ecological data, spatial analysis, etc – Epi - confounding/other potential sources of bias are a
concern
4NRC (2009) Science & Decisions, Ch. 7: Implementing CRA

Causal Inference• Weight of evidence methods broadly used
– Variations of 1965 Bradford Hill criteria • Consistency, specificity, strength of association, biological plausibility,
dose response, coherence, temporality, experimentation, cessation
• Call for better inference methods in risk assessment– Cox (2013); Linder et al. (2010) suggest improved methods for
inference in risk assessment
• “Modern” methods– Potential outcomes framework/counterfactual model/Neyman-
Rubin-Holland model– Structural causal models
• Epidemiology (Greenland et al. 1999), Social research (Morgan & Winship 2007)
5Weed 2005; Pearl 2009; Holland 1986; Neyman 1923; Rubin 1974

Causal inference in CRA
• Make causal inferences using experimental studies, observational data, stakeholder concern– Epidemiological studies will be valuable, but method needs to
be adaptable to incorporate all evidence needed for a CRA
• Levels/types of causal factors important to CRA– Population, individual level– Community, state, federal– Deterministic/mechanical factors (aleatory causality), laws of
nature, fundamental physical connections– Probabilistic/social factors (statistical causality),
• Repeated significant association being “symptoms” of a causal relationship
6Russo 2009

• Wunsch (1995), God gave the easy problem to the physicists…– Isolating causal processes is much easier for objects
than it is for any process involving people
• Purpose and Application– Use graphical causal models to support causal analysis – Describe how the graphs can be utilized throughout a
CRA– Improved causal models for risk assessment
applications
7
Causal inference in CRA

Graphical Causal Models
• Structuring relationships in a CRA requires several levels of reasoning with corresponding graphical causal models:– The “big picture” or theoretical frameworks
• (e.g., Linder & Sexton 2011; Morello-Frosch and Shenassa2006; Gee and Payne-Sturges 2004; WHO 2008)
– Conceptual models – more specific, structure varies widely
– Directed acyclic graphs (DAGs)…
8Pearl 2000; Greenland et al. 1999; Textor 2011

Directed Acyclic Graphs (DAGs)
• DAG = A graphical causal model comprised of nodes connected by single-headed arrows containing no closed loops– encode assumptions, estimate causal effect
Causal pathway Confounded pathway
9Greenland et al. 1999; Glymour 2006; Pearl 2009

DAGs vs. Other graphical models• Conceptual models are usually displayed as box and
arrow diagrams but can take on many different forms
• Rules for DAGs are rigorous – Uniform structure– No bidirectional arrows
• Nothing can cause itself! Hence “Acyclic”
• Steps applied to DAG to identify if causal effect is estimable– Not possible with conceptual model, unless conceptual
model is essentially a DAG in its construction
10Shrier & Platt 2008; Pearl 2009; Greenland et al. 1999
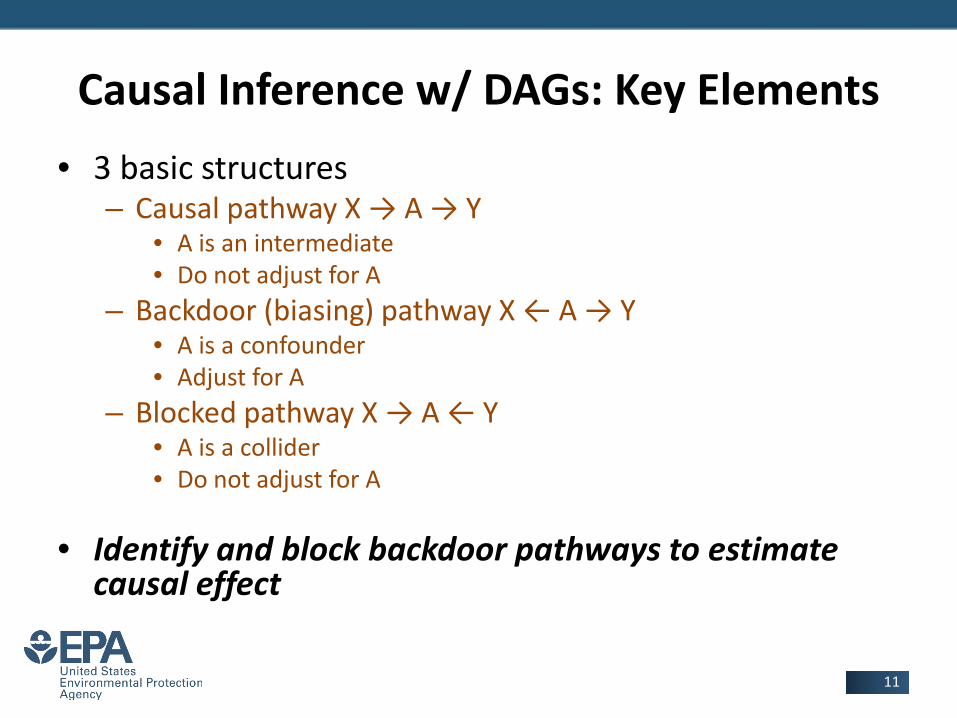
Causal Inference w/ DAGs: Key Elements• 3 basic structures
– Causal pathway X → A → Y• A is an intermediate• Do not adjust for A
– Backdoor (biasing) pathway X ← A → Y• A is a confounder• Adjust for A
– Blocked pathway X → A ← Y• A is a collider• Do not adjust for A
• Identify and block backdoor pathways to estimate causal effect
11

DAGs and Causality: Key Elements
• Identification of causal effects
• Observed association can be causal relationship + spurious association– Remove confounding, leaves causal effect
• Main points:– Increase confidence that estimation model will accurately
estimate causal effect– Increase confidence that risk management
plan/intervention will have intended effect– Be explicit about uncertainties
12

Causal DAG
• What makes a DAG a causal DAG?– All variables significant to relationship, measured and
unmeasured, along with common causes, are depicted in the graph
– Causal model will correspond to the underlying causal structure of a relationship to the extent that the relationship can be accurately observed and approximated
• Cannot convey magnitude of risks, distribution of variables, functional forms of relations (nonparametric)
• Note: graphical causal model vs causal model (mathematical equation)
13

Overview of CRA
14EPA 2003
Goal: Show potential utility of DAGs throughout process

Example: Concentrated Animal Feeding Operation
• Hypothetical population– Community near a concentrated animal feeding operation
(CAFO)– Extensive research to support links between numerous
exposures and numerous adverse health effects
• Risk hypothesis: Air emissions from the CAFO are causing an increased incidence of chronic bronchitis in the surrounding community
15Flora et al. 2002; Herriges et al. 2005; Howard et al. 2010a; Howard et al. 2010b; Merchant et al. 2002; PCIFAP 2008; U.S. EPA 2004; Wing et al. 2008; Wing et al. 2013
Phase 1: Planning, Scoping, Problem Formulation
• Initiating factors, stressor or effects based assessment, stakeholder concerns– Increased prevalence of chronic bronchitis– Effects-based– Odors, economic impacts from CAFO, etc
• Major outputs– Conceptual model– Analysis plan
16

17
Conceptual Model for CRA of a CAFO
Human Health Effects
Stressors
Ecological Effects
Economic Effects
Major Emissions
Routes
Seasonality
Other Stressors
CAFO
Other Existing Community/IndividualLevel stressors•Poor housing quality •Food desert•Low income •Minority•No affordable health care •High meat/fast food
consumption
Manure lagoon/manure spray ODOR/GAS Carcasses
VOCs
Antibiotics
NH3
NOAntibioticresistant bacteria
Community economic impacts•Decline in travel, tourism, fishing, water recreation •Consumer avoidance of downwind business •Less use of outdoor greenspaces •Decreased aggregate employment
Individual economic impacts•Decreased property value•Increased home costs: fly, rodent control, air cleaners •Increased electricity costs
PM 10, 2.5
Livestock losses from heat waves
Chronic Individual
Stress
Individual Allostatic
load
BiologicalResponse/Pathways
DOSE
•CHRONIC BRONCHITIS•Skin rash •Asthma •Eye irritiation•Headache •Gastrointestinal illness•Neurotoxic Shellfish Poisoning (subsistence fishers)•Increased risk of Methemoglobinemia (Infants)•Decreased neurocognitive function•Chronic mucous membrane irritation
Dermal InhalationIngestion
Fish/shellfish killsAlgal blooms -
algal toxins
Eutrophication
Increased fly & rodent population
Overfertilization of praries
H2S
Seepage into surface and groundwater
•State/local infrastructure•Zoning regulations•Economic Incentives•Environmental Statutes/Regulations
Nutrient loading of soil & waterways
Swine & Feed Dust
Pathogens Heavy Metals,Dioxins,
Hormones
Nutrients(N&P)
Ozone
Worsened air pollution

18Dagitty.net (Textor 2011)
DAG for CRA of a CAFO
DAG in Planning, Scoping, Problem Formulation
• Concisely diagram scope of assessment
• Opportunities for risk management input
• Facilitate planning of data collection activities
19

Facilitate planning of data collection activities
• Literature-based data analyses, collection and analysis of samples (biomarkers)
• What variables need to be observed to estimate causal effect – Choose variables to measure based on cost or
practicality
20

Minimally sufficient adjustment sets
21
• Confounding = alternative source of explanation
• Adjustment sets = variables that can be adjusted to reduce bias
• Land Use/Zoning• Education Level

Adjusting variables to control confounding in DAG
22

23
Adjusting variables to control confounding in DAG

Adjusting variables to control confounding in DAG
24

Adjusting variables to control confounding in DAG
25

Phase 2: Analysis
• Evaluate confounding in individual studies
• Determine if study data are generalizable
• Testable implications add to WOE– Iterative approach to DAG, revise based on most
robust evidence
• Identify is causal effects are estimable:– Total, direct, indirect, effect modification, interactions
26Bareinboim & Pearl 2013a; Bareinboim & Pearl 2013b

Testable Implications Add to WOE
• Testable implications– Translate causation to statistical language– X → A ← Y
• Data must show X and Y are associated when adjusting for A
– Education Level ⊥ Perception of Health Risk | Odors
• Conditional independency derived from DAG structure
• Makes sense intuitively – May not be able to check in data– Qualitatively adds to WOE
27

Analysis: are causal effects estimable from available data?
• WOE for each relationship
• Uncertainties in each study
• Comparisons facilitate choice of studies to derive the dose-response estimate
• Use DAGs in same manner to determine if direct, indirect, effect modification, and interactions are causally identified
28

Total effect
• Yes• Adjust for either
Land/Use Zoning, Education Level, or both
• Effect exposure has on the outcome through all pathways present in the graph
• Combination of direct and indirect effects
29

Direct effect
30
• Yes• Adjust Smoking and
Exhaled Nitric Oxide to block associations from all open indirect causal pathways

Indirect effect
• Mediation analysis– Indirect pathways pass through intermediate variables– Odors → Perception of Health Risk → Chronic
Individual Stress → Smoking → Chronic Bronchitis
• Relationships between intermediate and E/O need be identified– Perception of Health Risk - YES– Smoking - NO
31Imai et al., 2010; Pearl, 2012; Pearl, 2014; VanderWeele & Vansteelandt, 2014; Shpitser and Vanderweele, 2011; Breen et al., 2013

Effect Modification• Statistical concept
– Indicates presence of underlying biological mechanism
– Difference in magnitude of association within levels of 3rd variable (smoking)
• Is effect modification by smoking causally identified?– No– Estimate would be biased
because it’s a collider
32

Interaction (Joint Effects)
• Smoking– Yes – But only if Chronic
stress can be measured (or an appropriate surrogate)
33

Notes on estimation• Derivation of “causal” regression models
– Causal interaction effect Chronic Bronchitis = β0 + β1Odors + β2Smoking + β3Education Level + β4Chronic Individual Stress + β5OdorsXSmoking + ε
• SEMs and Bayesian networks (BNs) use directed graphs as their computational structure – Use SEMs when there is an interest in a range of different effects and
pathways – Causal DAG can be combined with parameter estimates in a BN (causal
BN), and can be used to estimate causal effects
• Using DAGs for causal effect identification before applying other estimation techniques can increase confidence that an estimate is a causal effect
34
VanderWeele 2012; Davis 2012; Levy et al 2015; Best et al. 2005; VanderWeele 2009; Zabinski et al. 2016

Other approaches/modifications
• Modular approach– Characteristics/vulnerabilities of population– Biological mechanisms, tox interactions
• Modify/annotate arrows to add information (+/-, color, thickness, etc)
35Joffe & Mindell 2006; Suter 1999

Phase 3: Risk Characterization
• Scoping decisions and assumptions are explicit– Boundaries of assessment– Causal ordering– Relevant mechanisms
• Insight into uncertainties and variability– Can’t control confounding = uncertainty
36

Challenges
• Dawid (2009), Beware of the DAG! – Inductive approaches using DAGs are controversial – Not recommended, but useful for (if interested in investigating)
alternate causal hypotheses• Revise based on experimental studies
– Hybrid inference approach
• Krieger & Smith (2016), The tale wagged by the DAG…– Examples where flawed logic and incomplete explanations,
represented in DAGs, led to flawed conclusions– “Triangulation” or evidence integration, “Inference to the Best
Explanation”
37

Disagreement on methods for causal inference
38http://andrewgelman.com/2009/07/05/disputes_about/
“Boy, these academic disputes are fun! Such vitriol! Such personal animosity! It's better than reality TV. Did Rubin slap Pearl's mom, or perhaps vice versa?”…

Assumptions
• Your model is correct!
• Happens with or without a DAG, assumptions about cause and effect are made, management plans are made, interventions are implemented, regulations/policies are made
• Make all assumptions (statistical and causal) explicit
39

Summary: DAGs for Causal Inference in CRA
• Use DAGs, in addition to WOE techniques, to make inferences about relationships– Unobserved confounders make causal effects unidentifiable, but may be a
way around it, graph to be sure – What variables need measurement to estimate causal effect
• Effects of intervention are important inputs for causal models– Revisions to DAG based those findings can add to validity of model
• Functions as a guide to more effective regulatory interventions– Iterative, represents state of science, assumptions
• User friendly options (DAGitty)
40Brewer et al. (In review 2016)

• J. Textor, J. Hardt, and S. Knüppel. Dagitty: A graphical tool for analyzing causal diagrams. Epidemiology, 22(5):745, 2011. (www.dagitty.net).• Brewer LE, Wright JM, Rice G, Neas L, Teuschler L. (In review). Causal Inference in Cumulative Risk Assessment: The Roles of Directed
Acyclic Graphs. Environ. Int. • McNamee R. 2003. Confounding and confounders. Occup Environ Med 60:227–34.• EPA (U.S. Environmental Protection Agency). 2003. Framework for cumulative risk assessment. Washington, DC: Risk Assessment Forum.
Available: http://www.epa.gov/raf/publications/pdfs/frmwrk_cum_risk_assmnt.pdf.• EPA (U.S. Environmental Protection Agency). 2007. Concepts, Methods and Data Sources for Cumulative Health Risk Assessment of
Multiple Chemicals, Exposures and Effects: A Resource Document. Available: http://ofmpub.epa.gov/eims/eimscomm.getfile?p_download_id=474337.
• Greenland S, Pearl J, Robins JM. 1999. Causal diagrams for epidemiologic research. Epidemiol 10:37-48. • Pearl J. 2009. Causality: Models, reasoning, inference. New York, NY: Cambridge University Press. • Pearl, J. 2010. An introduction to causal inference. Int J Biostat. 6:Article 7.• Pearl, J. 2001. Causal inference in the health sciences: A conceptual introduction. Health Services & Outcomes Research Methodology, 2,
189–220.• Glymour MM. 2006. Using causal diagrams to understand common problems in social epidemiology. In: Methods for Social Epidemiology
(Oakes JM, Kaufman JS, eds). San Francisco, CA: Jossey-Bass, 387-422. • Ian Shrier and Robert W. Platt. Reducing bias through directed acyclic graphs. BMC Medical Research Methodology, 8(70), 2008.• Best N, Jackson C, Richardson S. 2005. Modelling complexity in health and social sciences: Bayesian graphical models as a tool for
combining multiple sources of information. Paper presented at: Proceedings of the 3rd ASC International Conference on Survey Research Methods.
• VanderWeele, T. J. 2009. On the distinction between interaction and effect modification. Epidemiology, 20:863–871.• VanderWeele, T. J. 2012. Invited Commentary: Structural Equation Models and Epidemiologic Analysis. American Journal of Epidemiology,
176(7), 608–612. • Suter, G.W., II. 1999. Developing conceptual models for complex ecological risk assessments. Hum Ecol Risk Assess. 5:375-396.• WHO. 2008. Commission on Social Determinants of Health. Closing the Gap in a Generation: Health Equity Through Action on the Social
Determinants of Health. Final Report of the Commission on the Social Determinants of Health.
41
References

References• Elwert, F. 2013. Graphical causal models. in: Morgan S.L., ed. Handbook of Causal Analysis for Social Research. Springer, New York.• Joffe, M., & Mindell, J. 2006. Complex Causal Process Diagrams for Analyzing the Health Impacts of Policy Interventions. American Journal
of Public Health, 96(3), 473–479. • Zabinski, J. W., Garcia-Vargas, G., Rubio-Andrade, M., Fry, R. C., & Gibson, J. M. 2016. Advancing Dose-Response Assessment Methods for
Environmental Regulatory Impact Analysis: A Bayesian Belief Network Approach Applied to Inorganic Arsenic. Environmental Science & Technology Letters, 3(5), 200–204.
• NRC (National Research Council). 2009. Science and decisions: Advancing risk assessment. National Academy Press, Washington, DC.http://www.nap.edu/catalog/12209.html.
• Weed, D.L. 2005. Weight of evidence: a review of concept and methods. Risk Anal. 25:1545-1557.• Hill, A. B. 1965. The Environment and Disease: Association or Causation? Proceedings of the Royal Society of Medicine, 58(5), 295–300.• Cox, L.A., Jr. 2013. Improving causal inferences in risk analysis. Risk Anal. 33:1762-1771.• Linder, S.H.; Delclos, G.; Sexton, K. 2010. Making causal claims about environmentally induced adverse effects. Hum Ecol Risk Assess.
16:35-52.• Holland, P. 1986. Statistics and causal inference. Journal of the American Statistical Association, Vol. 81: 945–960.• Neyman, J. 1923. On the Application of Probability Theory to Agricultural Experiments. Essay on Principles. Section 9. Roczniki Nauk
Rolniczych Tom X [in Polish]; translated in Statistical Science, 5, 465–480.• Rubin, D. B. 1974. Estimating Causal Effects of Treatments in Randomized and Nonrandomized Studies. Journal of Educational Psychology,
66, 688–701.• Russo, F. 2009. Causality and causal modelling in the social sciences: Measuring variations. Springer, New York.• Linder, S.H.; Sexton, K. 2011. Conceptual models for cumulative risk assessment. Am J Public Health. 101 Suppl 1:S74-81.• Davis, ME. 2012. Structural equation models in occupational health: an application to exposure modelling. Occup Environ Med 69:184-
190.• Bareinboim, E and J. Pearl 2013b. Meta-Transportability of Causal Effects: A Formal Approach. UCLA Cognitive Systems Laboratory,
Technical Report (R-407) In Proceedings of the 16th International Conference on Artificial Intelligence and Statistics (AISTATS), pp. 135--143.
• Bareinboim, E and J. Pearl. 2013a. Causal Transportability with Limited Experiments. UCLA Cognitive Systems Laboratory, Technical Report (R-408). In Proceedings of the 27th AAAI Conference on Artificial Intelligence, pp. 95--101.
• Gee GC, Payne-Sturges DC. 2004. Environmental health disparities: a framework integrating psychosocial and environmental concepts. Environ Health Perspect; 112(17):1645---1650.
42
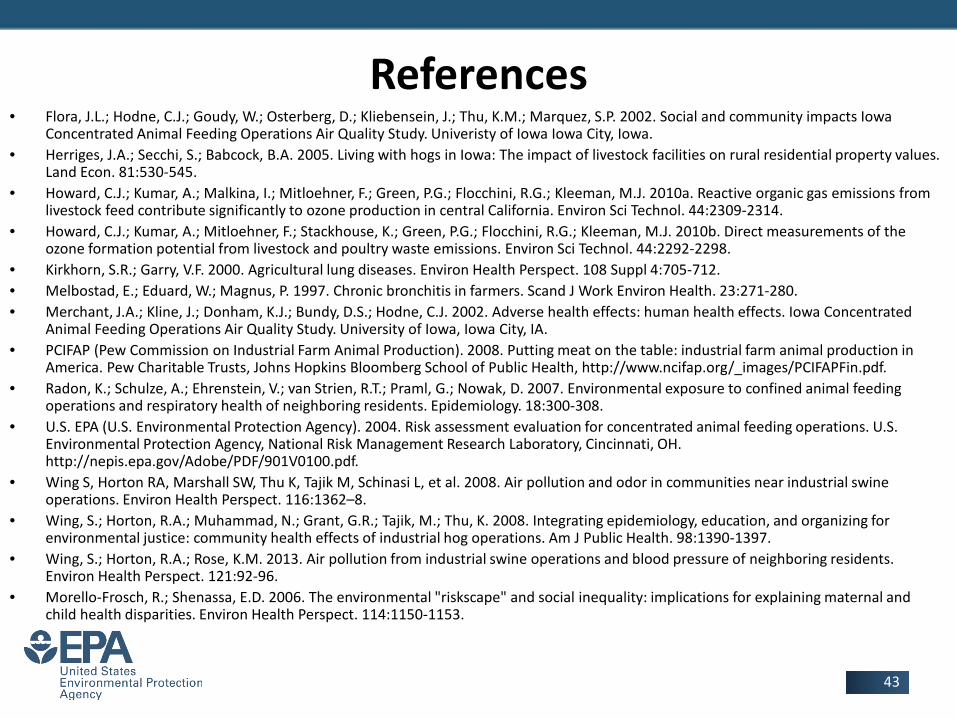
References• Flora, J.L.; Hodne, C.J.; Goudy, W.; Osterberg, D.; Kliebensein, J.; Thu, K.M.; Marquez, S.P. 2002. Social and community impacts Iowa
Concentrated Animal Feeding Operations Air Quality Study. Univeristy of Iowa Iowa City, Iowa.• Herriges, J.A.; Secchi, S.; Babcock, B.A. 2005. Living with hogs in Iowa: The impact of livestock facilities on rural residential property values.
Land Econ. 81:530-545.• Howard, C.J.; Kumar, A.; Malkina, I.; Mitloehner, F.; Green, P.G.; Flocchini, R.G.; Kleeman, M.J. 2010a. Reactive organic gas emissions from
livestock feed contribute significantly to ozone production in central California. Environ Sci Technol. 44:2309-2314.• Howard, C.J.; Kumar, A.; Mitloehner, F.; Stackhouse, K.; Green, P.G.; Flocchini, R.G.; Kleeman, M.J. 2010b. Direct measurements of the
ozone formation potential from livestock and poultry waste emissions. Environ Sci Technol. 44:2292-2298.• Kirkhorn, S.R.; Garry, V.F. 2000. Agricultural lung diseases. Environ Health Perspect. 108 Suppl 4:705-712.• Melbostad, E.; Eduard, W.; Magnus, P. 1997. Chronic bronchitis in farmers. Scand J Work Environ Health. 23:271-280.• Merchant, J.A.; Kline, J.; Donham, K.J.; Bundy, D.S.; Hodne, C.J. 2002. Adverse health effects: human health effects. Iowa Concentrated
Animal Feeding Operations Air Quality Study. University of Iowa, Iowa City, IA.• PCIFAP (Pew Commission on Industrial Farm Animal Production). 2008. Putting meat on the table: industrial farm animal production in
America. Pew Charitable Trusts, Johns Hopkins Bloomberg School of Public Health, http://www.ncifap.org/_images/PCIFAPFin.pdf.• Radon, K.; Schulze, A.; Ehrenstein, V.; van Strien, R.T.; Praml, G.; Nowak, D. 2007. Environmental exposure to confined animal feeding
operations and respiratory health of neighboring residents. Epidemiology. 18:300-308.• U.S. EPA (U.S. Environmental Protection Agency). 2004. Risk assessment evaluation for concentrated animal feeding operations. U.S.
Environmental Protection Agency, National Risk Management Research Laboratory, Cincinnati, OH. http://nepis.epa.gov/Adobe/PDF/901V0100.pdf.
• Wing S, Horton RA, Marshall SW, Thu K, Tajik M, Schinasi L, et al. 2008. Air pollution and odor in communities near industrial swine operations. Environ Health Perspect. 116:1362–8.
• Wing, S.; Horton, R.A.; Muhammad, N.; Grant, G.R.; Tajik, M.; Thu, K. 2008. Integrating epidemiology, education, and organizing for environmental justice: community health effects of industrial hog operations. Am J Public Health. 98:1390-1397.
• Wing, S.; Horton, R.A.; Rose, K.M. 2013. Air pollution from industrial swine operations and blood pressure of neighboring residents. Environ Health Perspect. 121:92-96.
• Morello-Frosch, R.; Shenassa, E.D. 2006. The environmental "riskscape" and social inequality: implications for explaining maternal and child health disparities. Environ Health Perspect. 114:1150-1153.
43
Acknowledgements
• Support was provided in part by an appointment to the Research Participation Program in the Office of the Science Advisor, US EPA, administered by ORISE through an interagency agreement between the U.S. Department of Energy and US EPA.
44

Thank You!
Questions?
Contact:[email protected]
For more information on Human Health Risk Assessment Project 6: CRA Methods and Applications:
45

Sebastiani, P., Ramoni, M. F., Nolan, V., Baldwin, C. T., & Steinberg, M. H. (2005). Genetic dissection and prognostic modeling of overt stroke in sickle cell anemia. Nature Genetics, 37(4), 435–440.
46

Shrier, I.; Platt, R.W. 2008. Reducing bias through directed acyclic graphs. BMC Med Res Methodol. 8:70.
47

Polzer, I., Schwahn, C., Völzke, H. et al. The association of tooth loss with all-cause and circulatory mortality. Is there a benefit of replaced teeth? A systematic review and meta-analysis. Clin Oral Invest (2012) 16: 333.
48