soteria platform - (safe long-term operation of light ... · toughness prediction : objective the...
TRANSCRIPT
SOTERIA platform - (Safe long-term operation oflight water reactors based on improved
understanding of radiation effects in nuclearstructural materials)
Marc BERVEILLER(1), Felix LATOURTE(1), Gilles ADJANOR(1),Julien VIDAL(1), Amel GOSSET(2)
(1) EDF, (2) Phimeca
2018 April - Prague
Marc BERVEILLER (EDF) SOTERIA platform - Workshop 2018 April - Prague 1 / 60
Outline
1 Overview
2 Case Studies
3 Charpy test
4 Toughness prediction
5 Next steps
6 SOTERIA consortium
Marc BERVEILLER (EDF) SOTERIA platform - Workshop 2018 April - Prague 2 / 60

Overview of the SOTERIA platform
The SOTERIA platform is based on the platform that was developed
during the European project Perfect (FP6) and Perform60 (FP7)
(http://perform60.lgi-consulting.eu/).
The aim of this platform is to model the effect of irradiation on RPV and
Internal materials by using a multiscale approach from nanofeatures
models up to mechanical models.
Marc BERVEILLER (EDF) SOTERIA platform - Workshop 2018 April - Prague 3 / 60

Overview of the SOTERIA platform : RPV part
For RPV material, the different scales that are taken into account in the
platform are:
Nanofeatures modelling : provide the long-term evolution of
point-defect clusters
Prediction of the hardening due to irradiation at the microscopic
level.
Evaluation of the macroscopic behaviour of RPV steel
Evaluation of the Fracture Toughness due to the increase of
hardening
Marc BERVEILLER (EDF) SOTERIA platform - Workshop 2018 April - Prague 4 / 60

Outline
1 Overview
2 Case Studies
3 Charpy test
4 Toughness prediction
5 Next steps
6 SOTERIA consortium
Marc BERVEILLER (EDF) SOTERIA platform - Workshop 2018 April - Prague 5 / 60

Definition of implemented case studies
Feedback from Users : difficult to use and to choose the models to chain.
RPV:effective dpa
prediction of hardening due to irradiation
toughness prediction
Charpy impact test
It is now possible to load experimental tensile curve as input of finite
element models.
INTERNALS:Primary pH prediction
microstructure modelling
IASCC prediction with INITEAC code
Marc BERVEILLER (EDF) SOTERIA platform - Workshop 2018 April - Prague 6 / 60
Outline
1 Overview
2 Case Studies
3 Charpy test
4 Toughness prediction
5 Next steps
6 SOTERIA consortium
Marc BERVEILLER (EDF) SOTERIA platform - Workshop 2018 April - Prague 7 / 60

Charpy test: objective
The aim of this case study is to compute the energy (Charpy energy)
absorbed by a standard notched specimen while breaking under an impact
loading
Charpy test shows whether a metal can be classified as being brittle or
ductile
For ferritic steels, it enables to demonstrate a ductile to brittle transition
(DBTT) with decreasing temperature
Marc BERVEILLER (EDF) SOTERIA platform - Workshop 2018 April - Prague 8 / 60

Charpy test: general idea of the experiment
Experimentaly one of the most commonly performed test to determine
impact toughness of engineering materials
Involves striking a standard notched specimen (KCV or KCU) supported
at its two ends on an anvil with a controlled weight pendulum swung from
a set height
The height of the swing of the pendulum is a measure of the amount of
energy absorbed in fracturing the specimen
Marc BERVEILLER (EDF) SOTERIA platform - Workshop 2018 April - Prague 9 / 60
Charpy test: general idea of the experiment
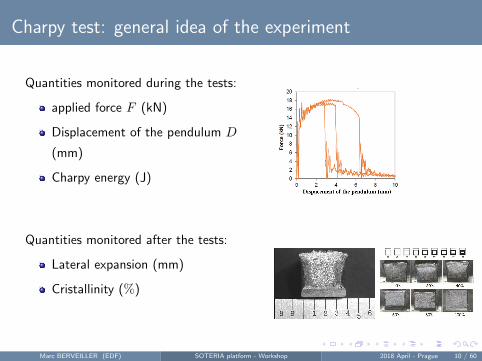
Quantities monitored during the tests:
applied force F (kN)
Displacement of the pendulum D
(mm)
Charpy energy (J)
Quantities monitored after the tests:
Lateral expansion (mm)
Cristallinity (%)
Marc BERVEILLER (EDF) SOTERIA platform - Workshop 2018 April - Prague 10 / 60

Charpy test: DBTT curve and irradiation effect
Carbon and low alloy steels
exhibit a change in fracture
behavior as the T falls with the
failure mode changing from
ductile to brittle
Temperature shift on the DBT
curve for irradiated material
(ISP)
Marc BERVEILLER (EDF) SOTERIA platform - Workshop 2018 April - Prague 11 / 60
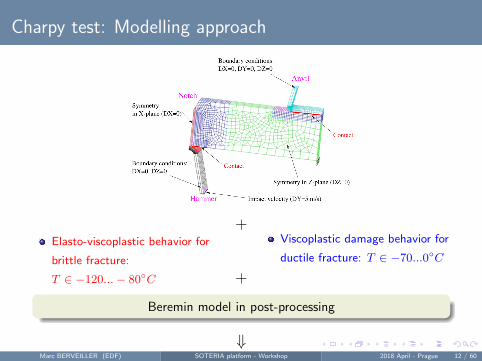
Charpy test: Modelling approach
+Elasto-viscoplastic behavior for
brittle fracture:
T ∈ −120...− 80◦C
Viscoplastic damage behavior for
ductile fracture: T ∈ −70...0◦C
+
Beremin model in post-processing
⇓Marc BERVEILLER (EDF) SOTERIA platform - Workshop 2018 April - Prague 12 / 60
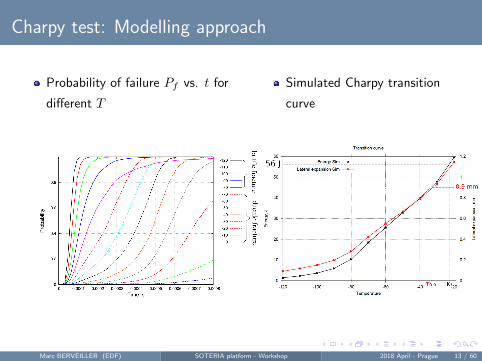
Charpy test: Modelling approach
Probability of failure Pf vs. t for
different T
Simulated Charpy transition
curve
Marc BERVEILLER (EDF) SOTERIA platform - Workshop 2018 April - Prague 13 / 60

Charpy test: chaining of modules
Marc BERVEILLER (EDF) SOTERIA platform - Workshop 2018 April - Prague 14 / 60

Charpy test: material definition
Behavior was identified for 16MND5 based on ...Marc BERVEILLER (EDF) SOTERIA platform - Workshop 2018 April - Prague 15 / 60

Charpy test: Charpy test calculation
Marc BERVEILLER (EDF) SOTERIA platform - Workshop 2018 April - Prague 16 / 60
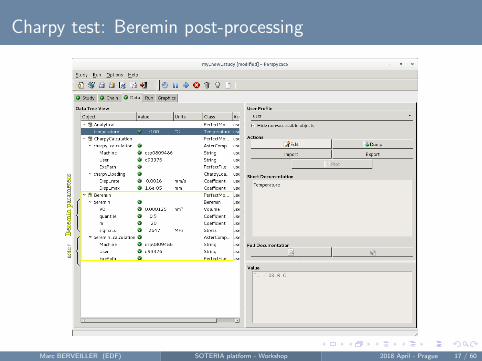
Charpy test: Beremin post-processing
Marc BERVEILLER (EDF) SOTERIA platform - Workshop 2018 April - Prague 17 / 60

Charpy test: execution procedure
Marc BERVEILLER (EDF) SOTERIA platform - Workshop 2018 April - Prague 18 / 60

Charpy test: output data
Marc BERVEILLER (EDF) SOTERIA platform - Workshop 2018 April - Prague 19 / 60
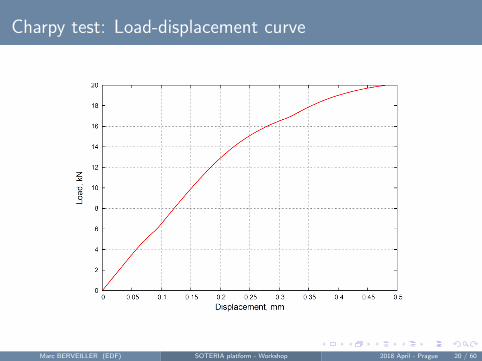
Charpy test: Load-displacement curve
Marc BERVEILLER (EDF) SOTERIA platform - Workshop 2018 April - Prague 20 / 60
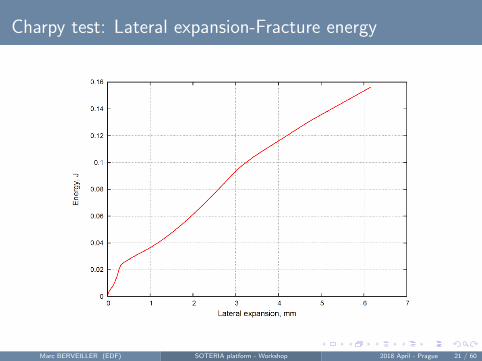
Charpy test: Lateral expansion-Fracture energy
Marc BERVEILLER (EDF) SOTERIA platform - Workshop 2018 April - Prague 21 / 60
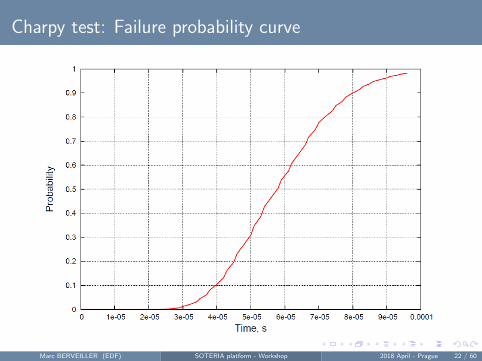
Charpy test: Failure probability curve
Marc BERVEILLER (EDF) SOTERIA platform - Workshop 2018 April - Prague 22 / 60

Charpy calculation: Run the study
To launch this study, you have to click on this button:
If it doesn’t work, launch the classical interface and load the following
study: /share/Study cases/Charpy.prf
Marc BERVEILLER (EDF) SOTERIA platform - Workshop 2018 April - Prague 23 / 60
Charpy test: perspectives for 2018
1 Calculation with viscoplastic damage behavior for ductile fracture
2 Construction of the full transition curve
3 Possibility to load own material behavior based on the tensile
experimental curve (in Flow Behavior module)
Marc BERVEILLER (EDF) SOTERIA platform - Workshop 2018 April - Prague 24 / 60

Outline
1 Overview
2 Case Studies
3 Charpy test
4 Toughness prediction
5 Next steps
6 SOTERIA consortium
Marc BERVEILLER (EDF) SOTERIA platform - Workshop 2018 April - Prague 25 / 60

Toughness prediction : objective
The aim of this case study is to compute the fracture toughness of a
material, at a given temperature.
In the context of brittle failure, the toughness, for a single specimen, is
provided as the critical stress intensity factor KJc for which a crack
initiates and propagates.
In the safety cases, one needs to demonstrate that during loadings, the
fracture toughness KJc remains greater than the applied load KI on
postulated defects.
Marc BERVEILLER (EDF) SOTERIA platform - Workshop 2018 April - Prague 26 / 60

Toughness prediction : general approach
Experimentaly, most of the fracture toughness properties are derived from
Charpy impact testing
Fracture toughness is more directly obtained from tensile tests of
Compact Tension specimens (height H, width B)
P, ULLD
CTOD
Quantities monitored during the tests are
applied load P
load-line displacement ULLD
crack-tip opening displacement CTOD
Marc BERVEILLER (EDF) SOTERIA platform - Workshop 2018 April - Prague 27 / 60
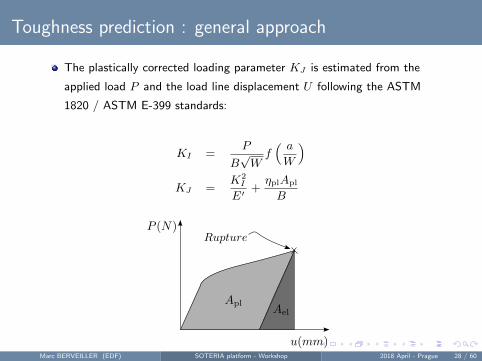
Toughness prediction : general approach
The plastically corrected loading parameter KJ is estimated from the
applied load P and the load line displacement U following the ASTM
1820 / ASTM E-399 standards:
KI =P
B√Wf( aW
)KJ =
K2I
E′+ηplApl
B
Marc BERVEILLER (EDF) SOTERIA platform - Workshop 2018 April - Prague 28 / 60
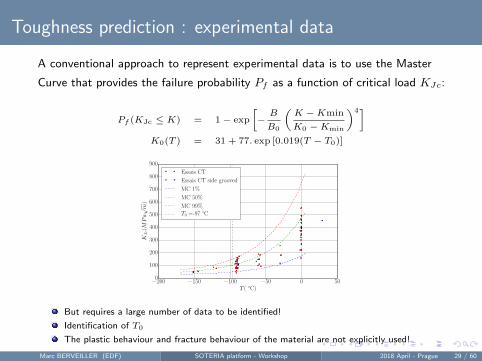
Toughness prediction : experimental data
A conventional approach to represent experimental data is to use the Master
Curve that provides the failure probability Pf as a function of critical load KJc:
Pf (KJc ≤ K) = 1 − exp
[−B
B0
(K −Kmin
K0 −Kmin
)4]K0(T ) = 31 + 77. exp [0.019(T − T0)]
−200 −150 −100 −50 0 50T ( ◦C)
0
100
200
300
400
500
600
700
800
900
KJc(MPa√m
)
Essais CT
Essais CT side grooved
MC 1%
MC 50%
MC 99%
T0 =-97 ◦C
But requires a large number of data to be identified!
Identification of T0
The plastic behaviour and fracture behaviour of the material are not explicitly used!
Marc BERVEILLER (EDF) SOTERIA platform - Workshop 2018 April - Prague 29 / 60
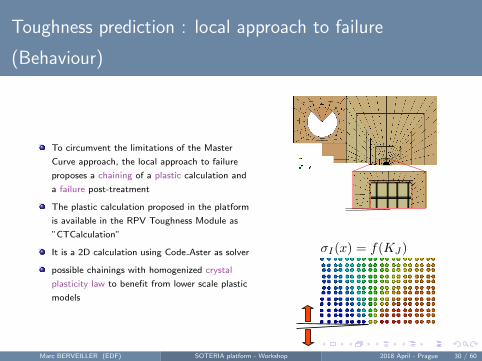
Toughness prediction : local approach to failure
(Behaviour)
To circumvent the limitations of the Master
Curve approach, the local approach to failure
proposes a chaining of a plastic calculation and
a failure post-treatment
The plastic calculation proposed in the platform
is available in the RPV Toughness Module as
”CTCalculation”
It is a 2D calculation using Code Aster as solver
possible chainings with homogenized crystal
plasticity law to benefit from lower scale plastic
models
Marc BERVEILLER (EDF) SOTERIA platform - Workshop 2018 April - Prague 30 / 60

Toughness prediction : local approach to failure (Beremin)
∀Kj(ti)fitting a Weibull stress σW on the plastic Volume Vp using the σI field
Compute the failure probability Pf
σW =
(∫Vp
σIm dV
V0
)m−1
Pf = 1− exp
[−(σW
σu
)m]
0 50 100 150 200 250 300 350 400K J(MPa
√m)
0.0
0.2
0.4
0.6
0.8
1.0
PR(K
J)
m=30,σu =2600MPam=30,σu =2450MPam=30,σu =2425MPa Beremin parameters : m, σu, V0
Marc BERVEILLER (EDF) SOTERIA platform - Workshop 2018 April - Prague 31 / 60

Toughness prediction : chaining of modules
list o
f ava
ilabl
e m
odul
esch
ain
Marc BERVEILLER (EDF) SOTERIA platform - Workshop 2018 April - Prague 32 / 60

Toughness prediction : material definition
calculation
material parameters
loading parameters
Marc BERVEILLER (EDF) SOTERIA platform - Workshop 2018 April - Prague 33 / 60

Toughness prediction : CT calculation definition
aster
geometry
loading parameters
Marc BERVEILLER (EDF) SOTERIA platform - Workshop 2018 April - Prague 34 / 60

Toughness prediction : Beremin calculation definition
Beremin parameters
for aster
Marc BERVEILLER (EDF) SOTERIA platform - Workshop 2018 April - Prague 35 / 60

Toughness prediction : following execution (BZ)
Marc BERVEILLER (EDF) SOTERIA platform - Workshop 2018 April - Prague 36 / 60

Toughness prediction : following execution (CT)
Marc BERVEILLER (EDF) SOTERIA platform - Workshop 2018 April - Prague 37 / 60
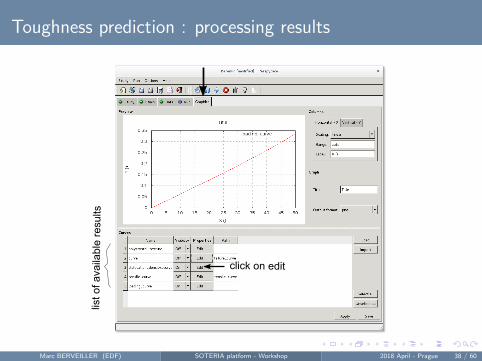
Toughness prediction : processing results
list o
f ava
ilabl
e re
sults
click on edit
Marc BERVEILLER (EDF) SOTERIA platform - Workshop 2018 April - Prague 38 / 60

Toughness prediction : tensile curve
Marc BERVEILLER (EDF) SOTERIA platform - Workshop 2018 April - Prague 39 / 60
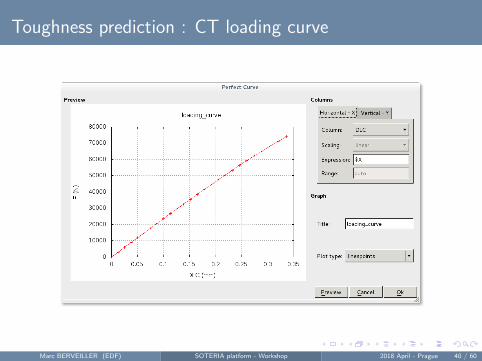
Toughness prediction : CT loading curve
Marc BERVEILLER (EDF) SOTERIA platform - Workshop 2018 April - Prague 40 / 60

Toughness prediction : failure probability curve
Marc BERVEILLER (EDF) SOTERIA platform - Workshop 2018 April - Prague 41 / 60

Toughness prediction : output data
Marc BERVEILLER (EDF) SOTERIA platform - Workshop 2018 April - Prague 42 / 60

Toughness prediction : output data - tensile curve
Marc BERVEILLER (EDF) SOTERIA platform - Workshop 2018 April - Prague 43 / 60
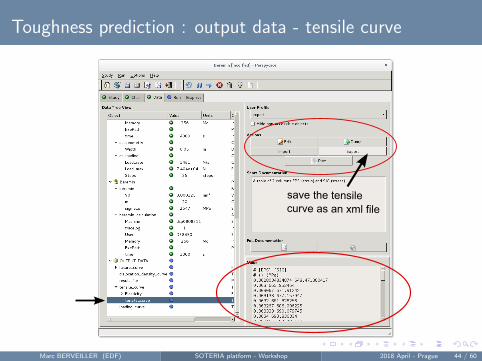
Toughness prediction : output data - tensile curve
save the tensile curve as an xml file
Marc BERVEILLER (EDF) SOTERIA platform - Workshop 2018 April - Prague 44 / 60
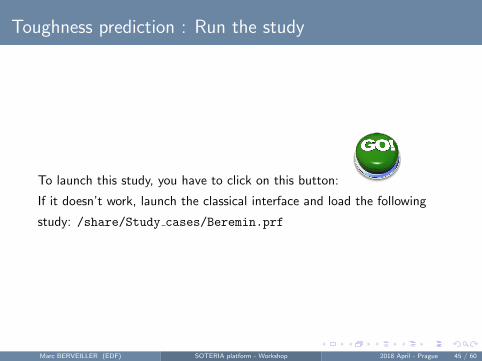
Toughness prediction : Run the study
To launch this study, you have to click on this button:
If it doesn’t work, launch the classical interface and load the following
study: /share/Study cases/Beremin.prf
Marc BERVEILLER (EDF) SOTERIA platform - Workshop 2018 April - Prague 45 / 60

Toughness prediction : end-user applications?
Computing toughness from microstructure data and hardening
prediction is sometimes not relevant for end-users
Most users have tensile data on the shelf and want to use it,
but sometimes only Rp0.2 and eventually Rm are available
proposed strategy
When limited information is available : Analytical model for tensile
curve
easy to fit from Rp0.2 and Rm
easy to plug with parametric study (variation of temperature)
When a need to use a tensile curve : Tool to process the
experimental curve
elasticity defined by a function (E = A−BT )
Marc BERVEILLER (EDF) SOTERIA platform - Workshop 2018 April - Prague 46 / 60

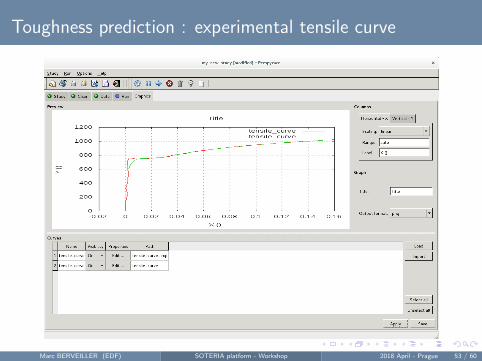
Toughness prediction : focus on experimental tensile curve
typical observations that can be done on experimental data obtained
from tensile experiments:
signal/noise ratio in LVDT or strain gages makes difficult the
determination of elastic properties
sometimes negative strain values during the elastic loading
noise can also affect stress measurement, and stress bursts will be
problematic for calculations especially when a viscoplastic model is
used
several constraints to use a tensile curve for mechanical calculations:
smooth evolution is mandatory
FE Code Aster takes the first point as the yield point, and the
Young’s modulus E is computed from this point (and not the one
provided in the elasticity material parameters
Marc BERVEILLER (EDF) SOTERIA platform - Workshop 2018 April - Prague 47 / 60

Toughness prediction : experimental tensile curve
Marc BERVEILLER (EDF) SOTERIA platform - Workshop 2018 April - Prague 48 / 60

Toughness prediction : experimental tensile curve
Marc BERVEILLER (EDF) SOTERIA platform - Workshop 2018 April - Prague 49 / 60
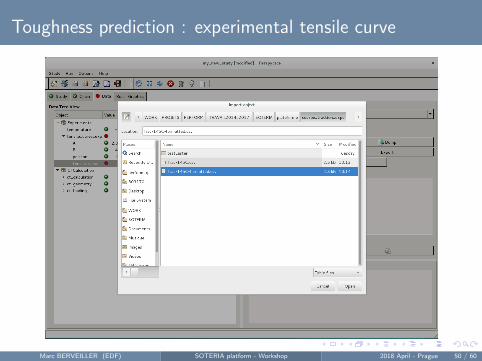
Toughness prediction : experimental tensile curve
Marc BERVEILLER (EDF) SOTERIA platform - Workshop 2018 April - Prague 50 / 60

Toughness prediction : experimental tensile curve
Marc BERVEILLER (EDF) SOTERIA platform - Workshop 2018 April - Prague 51 / 60
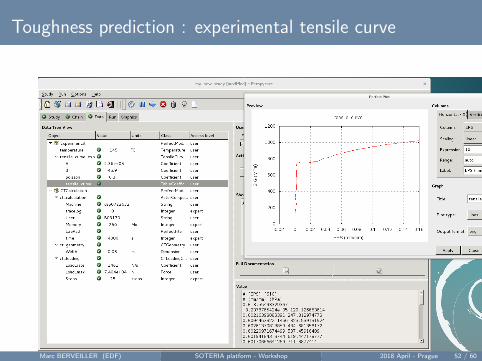
Toughness prediction : experimental tensile curve
Marc BERVEILLER (EDF) SOTERIA platform - Workshop 2018 April - Prague 52 / 60
Toughness prediction : experimental tensile curve
Marc BERVEILLER (EDF) SOTERIA platform - Workshop 2018 April - Prague 53 / 60

CT calculation with experimental tensile curve : Run the
study
To launch this study, you have to click on this button:
If it doesn’t work, launch the classical interface and load the following
study: /share/Study cases/experimental tensile curve.prf
Marc BERVEILLER (EDF) SOTERIA platform - Workshop 2018 April - Prague 54 / 60

Outline
1 Overview
2 Case Studies
3 Charpy test
4 Toughness prediction
5 Next steps
6 SOTERIA consortium
Marc BERVEILLER (EDF) SOTERIA platform - Workshop 2018 April - Prague 55 / 60

Next steps
add a tool allowing to perform parametric studies.
increase the interactions with experimental data
For RPV:
prediction of the irradiated behavior of the material
For Internals:
Prediction of the irradiated behavior of the material
Marc BERVEILLER (EDF) SOTERIA platform - Workshop 2018 April - Prague 56 / 60

Conclusions
ConclusionsR&D European project on the modelling of the ageing of RPV and
Internals due to irradiation
Development of industrial-oriented numerical tools
Disseminationearly June 2018 : new version of the platform
2018/06/22 UserGroup meeting
Contact me if you want to integrate the UserGroup
Marc BERVEILLER (EDF) SOTERIA platform - Workshop 2018 April - Prague 57 / 60

Outline
1 Overview
2 Case Studies
3 Charpy test
4 Toughness prediction
5 Next steps
6 SOTERIA consortium
Marc BERVEILLER (EDF) SOTERIA platform - Workshop 2018 April - Prague 58 / 60
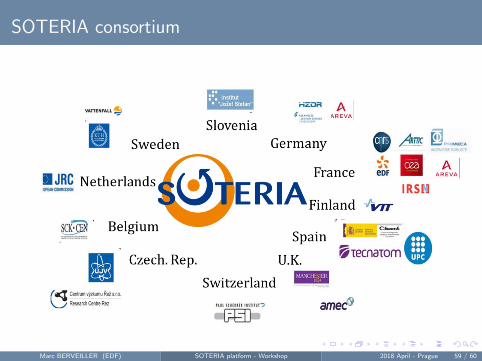
SOTERIA consortium
Marc BERVEILLER (EDF) SOTERIA platform - Workshop 2018 April - Prague 59 / 60

SOTERIA contacts
Marc BERVEILLER (EDF) SOTERIA platform - Workshop 2018 April - Prague 60 / 60