sound waves coastal science and research news from … · sound waves coastal science and research...
TRANSCRIPT
1 Sound Waves August 2006U.S. Department of the InteriorU.S. Geological Survey
Sound Waves Volume FY 2006, Issue No. 86August 2006
Sound Waves C o a s t a l S c i e n c e a n d R e s e a r c h N e w s f r o m A c r o s s t h e U S G S
Fieldwork
http://soundwaves.usgs.gov/
(Louisiana Coastline continued on page 2)
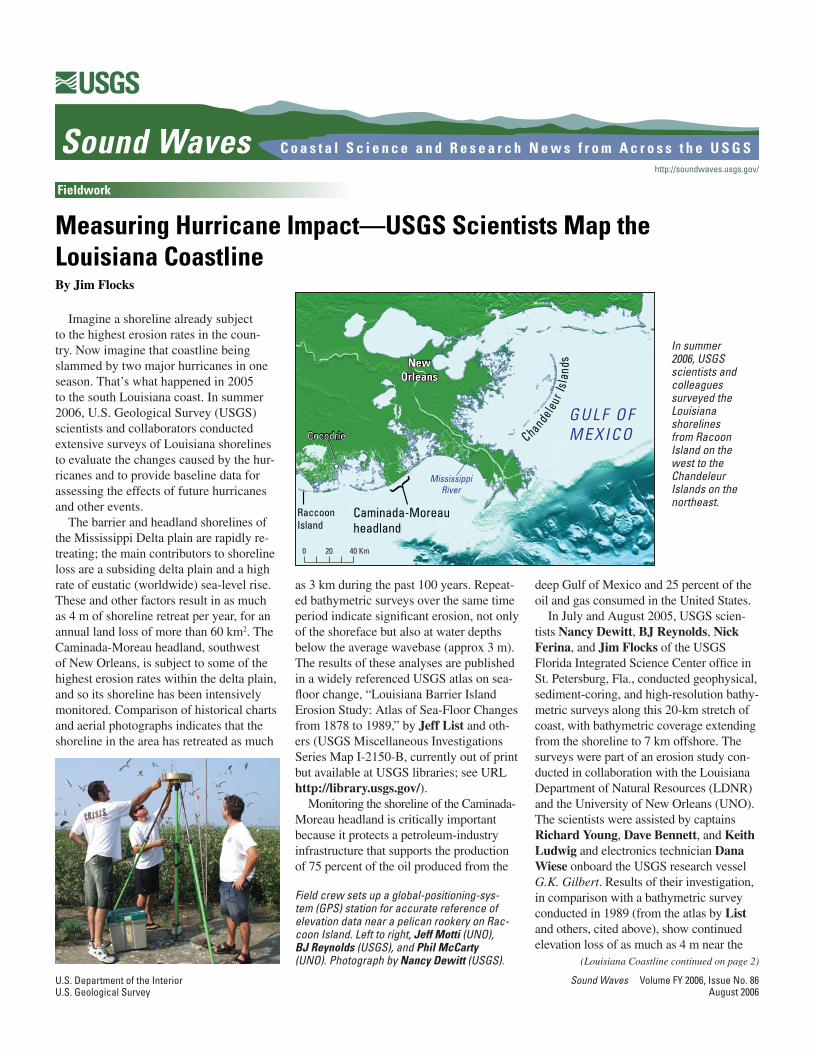
Imagine a shoreline already subject to the highest erosion rates in the coun-try. Now imagine that coastline being slammed by two major hurricanes in one season. That’s what happened in 2005 to the south Louisiana coast. In summer 2006, U.S. Geological Survey (USGS) scientists and collaborators conducted extensive surveys of Louisiana shorelines to evaluate the changes caused by the hur-ricanes and to provide baseline data for assessing the effects of future hurricanes and other events.
The barrier and headland shorelines of the Mississippi Delta plain are rapidly re-treating; the main contributors to shoreline loss are a subsiding delta plain and a high rate of eustatic (worldwide) sea-level rise. These and other factors result in as much as 4 m of shoreline retreat per year, for an annual land loss of more than 60 km2. The Caminada-Moreau headland, southwest of New Orleans, is subject to some of the highest erosion rates within the delta plain, and so its shoreline has been intensively monitored. Comparison of historical charts and aerial photographs indicates that the shoreline in the area has retreated as much
Measuring Hurricane Impact—USGS Scientists Map the Louisiana CoastlineBy Jim Flocks
as 3 km during the past 100 years. Repeat-ed bathymetric surveys over the same time period indicate signifi cant erosion, not only of the shoreface but also at water depths below the average wavebase (approx 3 m). The results of these analyses are published in a widely referenced USGS atlas on sea-fl oor change, “Louisiana Barrier Island Erosion Study: Atlas of Sea-Floor Changes from 1878 to 1989,” by Jeff List and oth-ers (USGS Miscellaneous Investigations Series Map I-2150-B, currently out of print but available at USGS libraries; see URL http://library.usgs.gov/).
Monitoring the shoreline of the Caminada-Moreau headland is critically important because it protects a petroleum-industry infrastructure that supports the production of 75 percent of the oil produced from the
Field crew sets up a global-positioning-sys-tem (GPS) station for accurate reference of elevation data near a pelican rookery on Rac-coon Island. Left to right, Jeff Motti (UNO), BJ Reynolds (USGS), and Phil McCarty (UNO). Photograph by Nancy Dewitt (USGS).
deep Gulf of Mexico and 25 percent of the oil and gas consumed in the United States.
In July and August 2005, USGS scien-tists Nancy Dewitt, BJ Reynolds, Nick Ferina, and Jim Flocks of the USGS Florida Integrated Science Center offi ce in St. Petersburg, Fla., conducted geophysical, sediment-coring, and high-resolution bathy-metric surveys along this 20-km stretch of coast, with bathymetric coverage extending from the shoreline to 7 km offshore. The surveys were part of an erosion study con-ducted in collaboration with the Louisiana Department of Natural Resources (LDNR) and the University of New Orleans (UNO). The scientists were assisted by captains Richard Young, Dave Bennett, and Keith Ludwig and electronics technician Dana Wiese onboard the USGS research vessel G.K. Gilbert. Results of their investigation, in comparison with a bathymetric survey conducted in 1989 (from the atlas by List and others, cited above), show continued elevation loss of as much as 4 m near the
0 20 40 Km
Caminada-Moreauheadland
Chandeleu
r Isl
ands
}
NewOrleans
NewOrleans
MississippiRiver
RaccoonIsland
GULF OF MEXICOGULF OF MEXICOCocodrieCocodrie
In summer 2006, USGS scientists and colleagues surveyed the Louisiana shorelines from Racoon Island on the west to the Chandeleur Islands on the northeast.

2August 2006 Sound Waves
Sound Waves
EditorHelen Gibbons
Menlo Park, CaliforniaTelephone: (650) 329-5042
E-mail: [email protected]: (650) 329-5198
Print Layout EditorsSusan Mayfi eld, Sara Boore
Menlo Park, CaliforniaTelephone: (650) 329-5066
E-mail: smayfi [email protected]; [email protected]: (650) 329-5051
Web Layout EditorJolene Shirley
St. Petersburg, FloridaTelephone: (727) 803-8747 Ext. 3038
E-mail: [email protected]: (727) 803-2032
SOUND WAVES (WITH ADDITIONAL LINKS) IS AVAILABLE ONLINE AT URLhttp://soundwaves.usgs.gov/
Contents
Fieldwork 1Research 6Outreach 9Meetings 9Staff and Center News 10Publications 11
Fieldwork
Fieldwork, continued
(Louisiana Coastline continued from page 1)
Submission Guidelines
Deadline: The dead line for news items and pub li ca tion lists for the October issue of Sound Waves is Tuesday, September 12.Publications: When new publications or prod ucts are re leased, please no ti fy the ed i tor with a full reference and a bulleted sum ma ry or description.Images: Please sub mit all images at pub li -ca tion size (col umn, 2-column, or page width). Resolution of 200 to 300 dpi (dots per inch) is best. Ado be Illustrator© fi les or EPS fi les work well with vector fi les (such as graphs or di a grams). TIFF and JPEG fi les work well with ras ter fi les (pho to graphs or rasterized vec tor fi les).
Any use of trade, fi rm, or product names is for descriptive purposes only and does not imply endorsement by the U.S. Gov ern ment.
U.S. Geological Survey Earth Science Information Sources:
Need to fi nd natural-science data orinformation? Visit the USGS Frequently Asked Ques tions (FAQ’s) at URL http://www.usgs.gov/search/faq.html
Can’t fi nd the answer to your question on the Web? Call 1-888-ASK-USGS
Want to e-mail your question to the USGS?Send it to this address: [email protected]
shoreline. In addition, shore-normal profi les indicate con-tinued removal of material from the shoreface.
Just after the 2005 fi eld-work, on August 29, 2005, Hurricane Katrina rumbled ashore 70 km east of the Caminada-Moreau headland, becoming the third-strongest hurricane ever to make U.S. landfall. While over the Gulf of Mexico, Katrina had been the most intense hurricane ever recorded, until it was surpassed 1 month later by Hurricane Rita as that storm’s eye passed within 200 km of the Caminada-Moreau headland. Hurricane Rita continued to the Texas-Louisiana State boundary, completely obliterating coastal towns along the way. Signifi cant loss to infra-
The USGS scientists who surveyed the Caminada-Moreau headland in 2005 re-turned in June 2006 to resurvey the same area, this time supported by a UNO survey team. In addition, the survey area was expanded to encompass the entire barrier-island shoreline of southern Louisiana, from Racoon Island to the modern Mississippi Delta, including the northern Chandeleur barrier-island chain, amounting to more than 500 km2 of sea fl oor surveyed in 2 months.
(Louisiana Coastline continued on page 3)
Research vessel G.K. Gilbert surveying an offshore area near the Caminada-Moreau headland, southwest of New Orleans. Photograph by Nancy Dewitt.
Kilometers
Estimated vertical sea-fl oor erosion, ranging from 1.0 to 4.5 m, along part of the Caminada-Moreau headland between 1989 and 2005 (pre-Hurricane Katrina), from USGS survey data. Warmer colors indicate greater erosion. Landsat Thematic Mapper satellite image, with 1980s shoreline overlay from the Louisiana Sedimentary and Environmental Database (LASED; see URL http://coastal.er.usgs.gov/lased/).
structure, shoreline, and wetlands occurred across the headland during both storms.
To monitor the impact of the dev-astating 2005 hurricane season on the shoreline and sea fl oor, Dawn Lavoie, USGS science coordinator for the Gulf of Mexico, and Jack Kindinger, associate center director for the USGS Florida In-tegrated Science Center, initiated a revisit of the Caminada-Moreau headland and promoted a base-level assessment of the Chandeleur Islands.

3 Sound Waves August 2006Fieldwork
(Louisiana Coastline continued from page 2)
Fieldwork, continued
The scale of this survey added to the logistic diffi culty of working in a region still recovering from last year’s damage. The scope required three survey ves-sels to operate simultaneously, in water depths ranging from 1 to 15 m. In addi-tion to collecting bathymetric data, the three survey teams also acquired subbot-tom-profi ling (compressed high-intensity radar pulse [CHIRP]) data to 40 m below the sea fl oor. The bathymetric data will be combined with high-resolution eleva-tion data from lidar (light detection and ranging) surveys fl own along the shore-line by Wayne Wright of the National Aeronautics and Space Administration (NASA), using NASA’s Experimental Airborne Advanced Research Lidar (EAARL), and by Jeff Lillycrop of the U.S. Army Corps of Engineers (USACE), using USACE’s Compact Hydrographic Airborne Rapid Total Survey (CHARTS) system. The data sets will be combined to create a comprehensive topobathymetric map for use in coastal-zone management and as a baseline for assessing future shoreline changes.
In July, the scientists moved to the remote Chandeleur Islands. Long-term
geologic models suggest that this island chain will eventually disappear and be-come an inner-shelf shoal in response to the combined effects of sand loss during storms and continuing sea-level rise. Hur-ricane Katrina accelerated this process; at present, the south half of the chain is mostly submerged shoal. The severity of damage caused by Katrina brings into question whether the islands will recover from this storm. The USGS scientists and their collaborators want to know how much infl uence the geologic setting has on the long-term evolution and ultimate fate of this island chain, and in the short term they want to determine where the sand lost from the islands went and whether sand sources exist that will allow this island chain to recover or be restored.
The Chandeleur Islands survey was an especially challenging phase of the project. Complete submergence during Hurricane Katrina had removed all land-marks from the islands, and tasks ranging from refueling the vessels to establish-ing geographic benchmarks required exceptional effort. The scientists from UNO and those from the USGS offi ce in St. Petersburg, Fla. (Dewitt, Reynolds,
Ferina, and Flocks), deployed from a houseboat moored behind what remains of the islands. They surveyed from the shoreline to 5-m water depth on the gulf side and out to 5 km from shore on the shallow bay side of the islands. A fourth survey crew from the USGS offi ce in Woods Hole, Mass., operated from the Louisiana Universities Marine Consortium (LUMCON)’s research vessel Acadiana in deeper water off the gulf side of the islands. The Woods Hole group (Dave Twichell, Chuck Worley, Wayne Bald-win, and Emile Bergeron) conducted 24-hour operations, covering the offshore ar-eas to a 15-m water depth with multibeam bathymetry, sidescan sonar, and CHIRP subbottom profi ling. All the bathymetric data will be combined with lidar data be-ing acquired along the shorelines.
Initial observation of the data shows tremendous storm impact to the islands, with large scours offshore and numerous breaches to the shoreface. Researchers hope that this survey will launch a com-prehensive monitoring effort for the be-leaguered barrier islands. Watch for more data and discussion about these scientifi c activities.]
While working along the Chandeleur Islands, sci-entists stayed onboard the houseboat Pelican, a Louisi-ana-style fi shcamp moored on the bay side. An earlier version of the houseboat survived Hurricane Georges but was destroyed by Hur-ricane Ivan; this one was moved to the mainland during Hurricanes Katrina and Rita. Photographs by Jim Flocks.
Erosion during Hurricane Katrina removed the beach from the front side of the Chandeleur Islands, exposing the delicate backbarrier marsh to wave action from the gulf. The islands are clearly in a state of transition; will they build back up or make a transition to submerged shoal? Scientists are interested in monitoring the islands during this crucial period. Photo-graph by Jim Flocks.
4August 2006 Sound Waves
Fieldwork, continued
Fieldwork
(Ground Water West continued on page 5)
What do contaminants in waters around Santa Barbara, Calif., have in common with fi sh kills in Hood Canal, Washing-ton? Both problems are likely infl uenced by submarine ground-water discharge, the movement of ground water into the ocean through underwater springs and seeps. This largely invisible process has recently been recognized as an important way that contaminants and excess nutrients, such as nitrogen, enter the ocean.
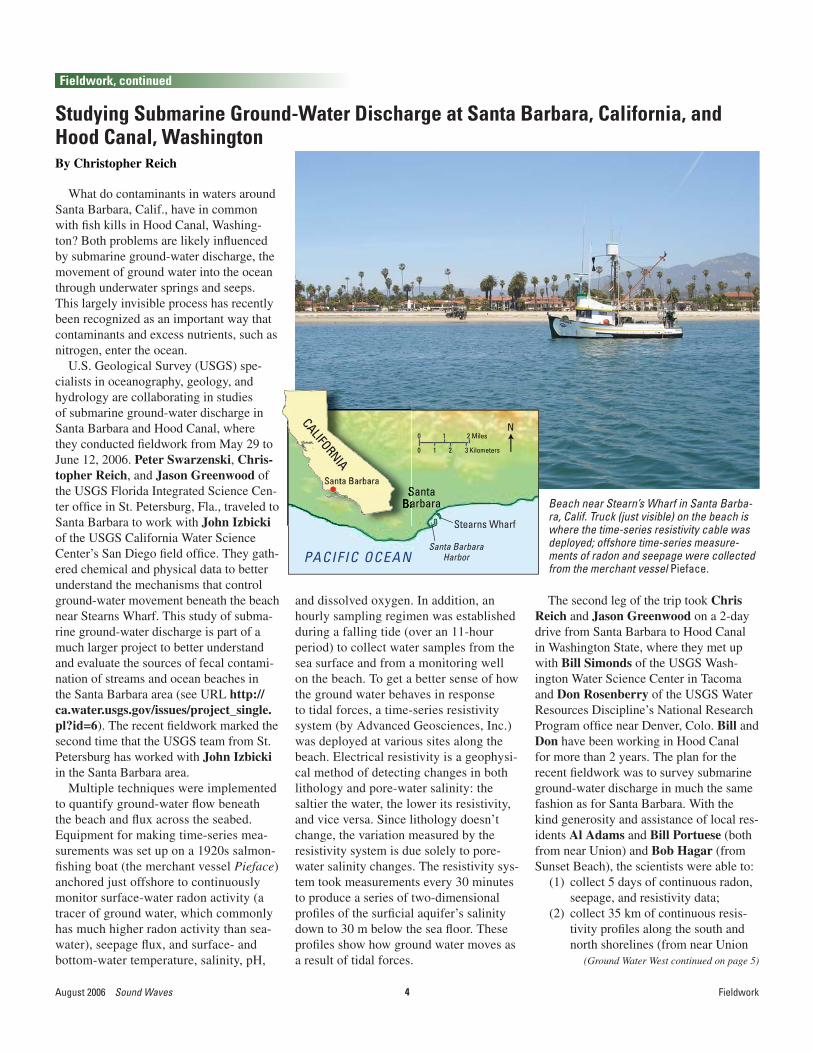
U.S. Geological Survey (USGS) spe-cialists in oceanography, geology, and hydrology are collaborating in studies of submarine ground-water discharge in Santa Barbara and Hood Canal, where they conducted fi eldwork from May 29 to June 12, 2006. Peter Swarzenski, Chris-topher Reich, and Jason Greenwood of the USGS Florida Integrated Science Cen-ter offi ce in St. Petersburg, Fla., traveled to Santa Barbara to work with John Izbickiof the USGS California Water Science Center’s San Diego fi eld offi ce. They gath-ered chemical and physical data to better understand the mechanisms that control ground-water movement beneath the beach near Stearns Wharf. This study of subma-rine ground-water discharge is part of a much larger project to better understand and evaluate the sources of fecal contami-nation of streams and ocean beaches in the Santa Barbara area (see URL http://ca.water.usgs.gov/issues/project_single.pl?id=6). The recent fi eldwork marked the second time that the USGS team from St. Petersburg has worked with John Izbickiin the Santa Barbara area.
Multiple techniques were implemented to quantify ground-water fl ow beneath the beach and fl ux across the seabed. Equipment for making time-series mea-surements was set up on a 1920s salmon-fi shing boat (the merchant vessel Pieface) anchored just offshore to continuously monitor surface-water radon activity (a tracer of ground water, which commonly has much higher radon activity than sea-water), seepage fl ux, and surface- and bottom-water temperature, salinity, pH,
Studying Submarine Ground-Water Discharge at Santa Barbara, California, and Hood Canal, WashingtonBy Christopher Reich
and dissolved oxygen. In addition, an hourly sampling regimen was established during a falling tide (over an 11-hour period) to collect water samples from the sea surface and from a monitoring well on the beach. To get a better sense of how the ground water behaves in response to tidal forces, a time-series resistivity system (by Advanced Geosciences, Inc.) was deployed at various sites along the beach. Electrical resistivity is a geophysi-cal method of detecting changes in both lithology and pore-water salinity: the saltier the water, the lower its resistivity, and vice versa. Since lithology doesn’t change, the variation measured by the resistivity system is due solely to pore-water salinity changes. The resistivity sys-tem took measurements every 30 minutes to produce a series of two-dimensional profi les of the surfi cial aquifer’s salinity down to 30 m below the sea fl oor. These profi les show how ground water moves as a result of tidal forces.
The second leg of the trip took Chris Reich and Jason Greenwood on a 2-day drive from Santa Barbara to Hood Canal in Washington State, where they met up with Bill Simonds of the USGS Wash-ington Water Science Center in Tacoma and Don Rosenberry of the USGS Water Resources Discipline’s National Research Program offi ce near Denver, Colo. Bill and Don have been working in Hood Canal for more than 2 years. The plan for the recent fi eldwork was to survey submarine ground-water discharge in much the same fashion as for Santa Barbara. With the kind generosity and assistance of local res-idents Al Adams and Bill Portuese (both from near Union) and Bob Hagar (from Sunset Beach), the scientists were able to:
(1) collect 5 days of continuous radon, seepage, and resistivity data;
(2) collect 35 km of continuous resis-tivity profi les along the south and north shorelines (from near Union
Beach near Stearn’s Wharf in Santa Barba-ra, Calif. Truck (just visible) on the beach is where the time-series resistivity cable was deployed; offshore time-series measure-ments of radon and seepage were collected from the merchant vessel Pieface.
Stearns Wharf
PACIFIC OCEANSanta Barbara
Harbor
SantaBarbara
0 1 2 Miles
0 1 2 3 Kilometers
N

5 Sound Waves August 2006Fieldwork
Fieldwork, continued
(Sea-Otter Count continued on page 6)
(Ground Water West continued from page 4)
0 20 40 Km
WASHINGTON
BRITISHCOLUMBIA
Victoria
Hood Canal
Puget Sound
Strait of Juan de Fuca
Lynch Cove
Tacoma
Seattle
PACIFIC O
CEAN Union
Sunset Beach
OlympicMountains
to the head of Hood Canal, north-east of Sunset Beach);
(3) install several piezometers (tempo-rary wells for collecting pore-water samples from discrete depths) and collect samples from them; and
(4) collect hourly surface and pore-water samples during a tidal cycle (over a 10-hour period).
Hood Canal is a fi ord off Puget Sound formed by glacial scouring and outwash from glacial meltwater some 13,500 to 15,000 years ago. The ice sheet was 0.6 to 1.3 km thick over the Puget Sound re-gion during the latest glacial maximum. Because the elevation of the surrounding terrain is moderately high (approx 170 m) and the surfi cial geology consists of gla-cial tills, which are moderately permeable, the area has a steep hydraulic gradient, resulting in springs onshore and submarine ground-water discharge at the coastline. Numerous low-salinity (less than 5 ppt) seeps were observed along the beach face at low tide, indicating discharge of ground water into the overlying marine waters of Hood Canal. Radon and seepage data cor-roborate the greatly increased discharge of ground water visually observed at low tide. Developing better constraints on the quantity, quality, and distribution of sub-marine ground-water discharge into Hood Canal will help identify problems, such as nutrient inputs, that can result in low-dis-
Hood Canal, with the Olympic Mountains in the distance. The dock was used as a site where time-series measurements of radon, seepage, and surface-water parameters were collected continu-ously over 5 days. On the opposite (left) side of the dock, the scientists positioned a resistivity cable that ran from near the road on land out into Hood Canal to a depth of approximately 20 m.
solved-oxygen (hypoxic) bottom wa-ters that have historically caused fi sh kills and other problems in Hood Ca-nal (see “Scientists Go Deep to Track Algae-Feeding Nitrogen in Washing-ton State’s Hood Canal,” in Sound Waves, July 2006, at URL http://soundwaves.usgs.gov/2006/07/).]
Observers tallied a total of 2,692 California sea otters for the 2006 spring survey, led by scientists at the U.S. Geo-logical Survey (USGS). The 2006 total showed a 1.6-percent decrease in sea ot-ters from the 2005 count of 2,735. It is the second year of small decreases since a record-high number of sea otters were observed in spring 2004.
“Although down a little, the sea-otter count this spring is well within the vari-
California Sea-Otter Numbers Dip Again in 2006, But Overall Population Trend Remains UpBy Gloria Maender
ability of our counts,” said survey orga-nizer Brian Hatfi eld, a USGS biologist in California. “Next year’s count will tell us more about whether we might actually be at the beginning of a downward trend again, which would be refl ected in the 3-year running average.”
The latest 3-year running average—the average of the totals from the spring counts of 2004, 2005, and 2006—is up 2.3 percent over the previous average, to
2,751 sea otters. To assess overall popu-lation trends, 3-year running averages of spring counts are used to reduce the infl uence of vagaries in any given year’s count, as recommended by the U.S. Fish and Wildlife Service’s Southern Sea Otter Recovery Plan.
“Like last year, we are seeing a rela-tively large seasonal presence of sea ot-ters southeast of Point Conception and

6August 2006 Sound Waves Fieldwork, Research
(Sea-Otter Count continued from page 5)
(Lake Whitefi sh continued on page 7)
Fieldwork, continued
pupping occurring in the area just to the north,” said Lilian Carswell, a fi sh and wildlife biologist for the U.S. Fish and Wildlife Service. “We’re paying close at-tention to the dynamics at the southern end of the range and their implications for sea-otter recovery.”
The spring 2006 California sea-otter survey was conducted May 5-26, cover-ing about 375 mi of California coast, from Half Moon Bay southward to Santa Barbara. Overall viewing conditions were good to very good, comparable to condi-tions of the past 2 years. The spring survey is a cooperative effort of the USGS, the California Department of Fish and Game’s Marine Wildlife Veterinary Care and Re-search Center, the Monterey Bay Aquari-um, and many experienced and dedicated volunteers. The information gathered from spring surveys is used by Federal and State wildlife agencies in making deci-sions about the management of this small sea mammal.
For additional information about the 2006 California sea-otter survey, visit URL http://www.werc.usgs.gov/otters/ca-surveyspr2006.htm.]
Number of southern sea otters counted dur-ing spring surveys, plotted as 3-year running averages. (Example: values for 2005 are the averages of the 2004, 2005, and 2006 counts.)
Number of southern sea otters counted during spring surveys.
Research
Lake whitefi sh, currently the number-one commercial fi sh in the Great Lakes and a key indicator of ecosystem health, are once again reproducing in the Detroit River, according to scientists with the U.S. Geological Survey (USGS) and the U.S. Fish and Wildlife Service (USFWS).
Scientists from the Federal agencies discovered spawning lake whitefi sh and fertilized whitefi sh eggs in the Detroit River last fall, the fi rst documented spawn-ing of the fi sh in the river since 1916. The discovery provides further evidence of progress in the ecological recovery of the
Lake Whitefi sh Returning to the Detroit River to Spawn; Federal Scientists Document First Reproducing Population of Whitefi sh in the River Since 1916 By Sandra Morrison
Detroit River, home to North America’s only International Wildlife Refuge and In-ternational Heritage River System.
The Detroit River recently received international acclaim at the White House
Lake whitefi sh. Image courtesy of Michi-gan Department of Natural Resources.

7 Sound Waves August 2006
(Lake Whitefi sh continued from page 6)
Research, continued
Research
Conference on Cooperative Conservation for its progress toward ecological recovery and for the public and private partnerships that have worked to revitalize the storied river. The river is now a major catalyst in the economic redevelopment of the Detroit River waterfront and the revival of a glori-ous “front porch” for the region.
“The return of lake whitefi sh to the De-troit River is partly the result of 40 years of pollution prevention and control activi-ties in the Detroit/Windsor metropolitan areas,” said Leon Carl, Center Direc-tor, USGS Great Lakes Science Center. “Scientists are continuing studies of this unique river ecosystem to learn more about the habitat needs of lake whitefi sh and other native fi sh that may potentially lead to the reestablishment of this heri-tage fi shery.”
“This whitefi sh recovery is helping transform the river into an internationally recognized wildlife refuge that is provid-ing an exceptional ecotourism experience to residents of southeast Michigan and southwest Ontario,” said John Hartig, Refuge Manager, Detroit International Wildlife Refuge.
The Detroit River was well known for its whitefi sh fi shery in the 1800s and early 1900s, but habitat loss and degrada-tion, pollution, and other factors contrib-uted to the loss of this important fi shery. The river has a history of environmental problems, such as oil pollution in the 1940s and 50s, phosphorus pollution in the 1960s, the “mercury crisis” of 1970, and organochlorine contamination since the 1970s. The river began its recovery in the early 1970s with the U.S. and Canada Great Lakes Water Quality Agreement and passage of the U.S. Clean Water Act in 1972. Other Federal, State and local initiatives have since helped to reduce the volume of pollutants entering the river. Relative to 1972 levels, discharges of oil have been reduced by 98 percent, and dis-charges of phosphorus by 95 percent. Sci-entists have also measured a 70-percent decline in mercury contamination in fi sh and an 83-percent decline in PCB (poly-chlorinated biphenyl) levels in herring gulls from Fighting Island. The Detroit
Lake Erie
DetroitRiver
Lake St. Clair
St. Clair River
Lake Huron
CANADA
Ind. Ohio
Mich.Wis
.
Mich.
Illin
ois CANADA
Ohio
Mich.
DetroitOntario
WindsorFighting Island
AnnArbor
0 10 20 30 40 MilesN
River now has reproducing populations of peregrine falcons, lake sturgeon, and bald eagles and is gaining a national reputa-tion as a world-class walleye fi shery.
Scientists will continue to assess sev-eral sites in the Detroit River and in the Huron-Erie corridor (which also includes the St. Clair River, Lake St. Clair, and western Lake Erie) to determine where whitefi sh are spawning, what their habitat requirements are, and other information on growth and reproduction. Whitefi sh eggs and larvae collected in 2005 and 2006 were brought back to the USGS Great Lakes Science Center in Ann Arbor, Mich., and are now being raised in the laboratory. Results from this research will help direct fi sheries managers in future ef-forts to restore native fi sh populations and habitat in the river.
The USFWS and USGS, along with the Michigan and Ohio Departments of Natu-ral Resources and other key partners in the United States and Canada, are working to address critical research issues in the Detroit River and the entire Huron-Erie corridor. Together, they contribute to the ongoing ecological recovery and revital-ization of this important ecosystem and North America’s only International Wild-life Refuge (see URL http://www.fws.gov/midwest/DetroitRiver/).
For additional information, visit the USGS Great Lakes Science Cen-ter Web site at URL http://www.glsc.usgs.gov/ and click on “Huron-Erie Corridor.” You can also download a fact sheet from URL http://www.dwfonline.com/PDF%20Files/Whitefi sh%20Fact%20Sheet.pdf. ]
The Huron-Erie corridor includes one of the busiest navigation centers in the United States and is an international trade route with Canada and overseas markets.
Scientists net spawning whitefi sh in the Detroit River in November 2005. Photograph by USFWS.

8August 2006 Sound Waves
Research, continued
Research
Food webs trace the fl ow of energy through an ecosystem. They extend the concept of food chains—those “who-eats-whom” sequences—to biological communities. Food-web studies rarely include parasites because of the diffi culty in quantifying parasites by standard eco-logical methods. Parasites seem small and invisible, hidden inside their hosts. How-ever, parasites strongly affect food-web structure, and parasite links are necessary for measuring ecosystem stability, accord-ing to a new study by scientists at the U.S. Geological Survey (USGS), Princeton University, and the University of Califor-nia, Santa Barbara (UCSB). The study was published in the online Early Edition of the Proceedings of the National Academy of Sciences, week of July 10-14, 2006 (URL http://www.pnas.org/cgi/content/abstract/0604755103v1).
“Food-web theory is the framework for modern ecology,” said Kevin Lafferty, a USGS scientist at UCSB and lead author of the study. “Parasites have been missing from this framework, and as a result, we know relatively little about the role of par-asites in ecosystems. It’s like driving with a highway map, but with no knowledge of the smaller road network. To reach most destinations, you need a map with both.”
Using data from four relatively compre-hensive food-web studies that include para-sites, Lafferty and his coauthors examined whether and how parasites affected the food webs. They found that parasites dominated the food-web links between species; on average, a food web contained more links between parasites and their hosts than be-tween predators and their prey.
“Parasites may well be the thread that holds the structure of ecological communi-ties together,” said study coauthor Andrew Dobson of Princeton University.
Additionally, the researchers’ analy-ses revealed new patterns. They found that vulnerability to predators decreased with the maximum trophic level, or top predators, but that vulnerability of hosts to parasites increased with trophic level. Animals at mid-trophic levels were the most vulnerable to natural enemies, being
Parasites, the Thread of Food Webs?By Gloria Maender
subjected to both diverse parasites and many predators.
“The work illustrates that ‘the pyramid of life’ we learn about in kindergarten is wrong!” said Dobson. “When you add par-asites to food webs, the pyramid contains a second, inverted pyramid of parasites that are as abundant as all the other species.”
When they analyzed the Carpinteria salt-marsh food web, which had the most complete set of parasites in the four food-web studies, the researchers calculated that parasites were involved in 78 percent of the links between species. Owing to the diversity of parasites in prey species, the Carpinteria web had more than twice as many predator-parasite as predator-prey links (1,021 versus 505). Parasites also increased food-web “connectance” by 93 percent and “nestedness” by 439 percent, two characteristics of food-web structure that make the food web more robust to the threat of extinction.
Parasitic trematode worms with com-plex life cycles involving sequential infection of multiple hosts were involved in numerous links in the Carpinteria salt-marsh food web. A common snail is the fi rst intermediate host to at least 19 dif-ferent types of trematode at Carpinteria,
involving many different types of bird as fi nal hosts. The authors found that without the snail and its trematodes, a corresponding 977 links would disappear from the corresponding food web. In related work, Lafferty and the third author of the study, Ar-mand Kuris of UCSB, are currently using techniques that count
trematodes in snails to assess salt-marsh health (see article in Sound Waves, July 2006, URL http://soundwaves.usgs.gov/2006/07/research2.html).
“Few food-web studies have been able to consider parasites, and it will take a lot of work to include them, but the message is that you can’t fully understand food webs without parasites,” said Lafferty. Kuris added that this, along with other re-cent studies, indicates that most ecological investigations should evaluate the role of parasites because infectious diseases can be such important players.
The Proceedings of the National Acad-emy of Sciences study opens the door, said Dobson. “Once we understand food-web structure, we will have a much better un-derstanding of how the loss of biodiversity will affect the quality of life for the surviv-ing species.”
The print edition of the paper appeared in the July 25, 2006, issue. Here is the full citation:
Lafferty, K.D., Dobson, A.P. and Kuris, A.M., 2006, Parasites dominate food web links: National Academy of Sciences, Pro-ceedings, v. 103, no. 30, p. 11,211-11,216 [URL http://www.pnas.org/cgi/content/abstract/0604755103v1].]
UCSB undergraduate Say-ward Halling investigates trematode parasites emerg-ing from an infected horn snail. The snail is in the vial, and the small white larvae are visible swimming in the water. Photograph by Kevin Lafferty, USGS.

9 Sound Waves August 2006Outreach, Meetings
Outreach
(Aerobiology Workshop continued on page 10)
During May and June 2006, the U.S. Geological Survey (USGS) Florida Inte-grated Science Center offi ce in Gaines-ville, Fla., put science on display at the main branch of the Alachua County Public Library. For 2 months, the USGS display was listed in the weekly Scene Magazine of the Gainesville Sun under local alterna-tive artspaces. Scene Magazine identifi es the cultural, entertainment, and communi-ty events happening in and around Gaines-ville and Alachua County each week.
Titled “Southeastern Rivers and Ecosys-tems,” the display showed a small sample of what researchers have found during fi eldwork on southeastern rivers over the years. Some of the fi nds were expected, such as the animals under study; others were relatively unexpected, such as Native American pottery, large (4 in. long) three-pronged “treble” hooks for catching very large fi sh, invasive species in new areas, bowling balls, and children’s toys.
The exhibit garnered a great deal of attention; library patrons were mesmer-ized by an up-close look at a cottonmouth snake, a common river frog tadpole the size of a large orange, and a diamond-backed terrapin shell that was about a foot long, next to a yellow-bellied pond slider (turtle) more than a foot long. Additional surprises for visitors were freshwater mussel shells ranging from 1 to 9 inches in length, depending on the species, and barnacle-covered radio transmitters for
Science as Art—USGS Display in Florida LibraryBy Hannah Hamilton
tracking Gulf sturgeon. Also displayed were artifacts of former Native American populations discovered during fi eldwork, such as pottery shards, skin scrapers, and hammer stones.
To illustrate how some types of fi sh sampling are done, the display included
Cabinet displaying items discovered during USGS fi eldwork in rivers and ecosystems of southeastern Florida.
rivermap books of the Suwannee River, used for marking the locations of Gulf sturgeon populations and manmade features along the river, as well as photographs of scientists doing fi eldwork. The photographs showed scientists establishing sampling grids and seining to collect fi sh and invertebrates. These were accompanied by an image of an Okaloosa darter (the fi sh being sought) and a specimen of bannerfi n shiner (an example of other species collected by using the same methods).
Other attention grabbers included a small endangered Gulf sturgeon from the Suwannee River and a realistic model of the invasive sailfi n armored catfi sh, a native of South America that is now spreading throughout Florida. According to librarian Cindy Dorfeld Bruckman, who manages the space, the librarians were kept busy restocking books on the Southeast, southeastern ecology, Florida history, and Native Americans associated with the USGS display. Another librarian stated that they were also kept busy cleaning noseprints and fi ngerprints off the case from children and adults leaning in to inspect every detail of the exhibit. USGS intern Kristin Lee, a graphic arts student at Santa Fe Community College, created and staged the exhibit. USGS scientists who contributed items included Ann Foster, Jim Williams, Margaret Gunzburger, and Howard Jelks.]
Meetings
What’s in the air we breathe—both indoors and outside? What methods and techniques, including high-throughput genomic sequencing, can we use to answer this question?
That’s the short version of the questions posed by the Alfred P. Sloan Foundation (URL http://www.sloan.org/) and the J. Craig Venter Institute (URL http://www.
USGS Scientists Participate in Genomic Aerobiology WorkshopBy Christina Kellogg
venterinstitute.org/) at their recent Ge-nomic Aerobiology workshop in La Jolla, Calif., June 19-21, 2006. The workshop was an opportunity for a small group of experts in the fi eld to discuss the current state of microbial aerobiology: sampling methods, molecular and culture-based detection techniques, the composition of background microbial communities,
pathogen surveillance, aerosol microbial ecology, and the research needed to move this fi eld forward.
Two U.S. Geological Survey (USGS) microbiologists were invited to attend this workshop and contribute as panel-ists. Christina Kellogg discussed liquid impinger technology she is applying to the

10August 2006 Sound Waves
Meetings, continued
(Aerobiology Workshop continued from page 9)
Meetings, Staff and Center News
collection of microbes associated with Af-rican desert dust. Chris also summarized the current state of research pertaining to the long-distance transport of dust-associ-ated microorganisms. Dale Griffi n com-pared the aerosol microbial communities inside Carlsbad Caverns to the communi-ties found in desert dust and described some of the potential pathogens that have been detected in African dust. Both Chris and Dale work on the USGS Global Dust Project (see URL http://coastal.er.usgs.gov/african_dust/).
The discussions and recommendations of the participants were recorded and will be collated into a manuscript for submis-sion to a peer-reviewed journal.]
Participants of the Genomic Aerobiology workshop enjoy the sunny weather outside the meeting venue at the Scripps Institution of Oceanography near San Diego, Calif.
Staff and Center News
Barry Rosen has been selected to lead U.S. Geological Survey (USGS) science in the State of Florida as the Director of the Florida Integrated Science Center (FISC). He comes to the USGS from the U.S. Fish and Wildlife Service, where he oversaw the hydrology, engineering, modeling, and over-all integration and assessment of the South Florida ecosystem-restoration projects.
As director of the USGS FISC, Rosen will lead agency natural-science programs in biology, geology, geography, and water studies conducted through fi eld centers throughout the State and in the U.S. Virgin Islands. His offi ce is at FISC headquarters in Orlando. USGS science in Florida en-compasses a wide variety of issues, includ-ing Everglades restoration, endangered species, coastal erosion, water quality and availability, hurricane-hazard mitigation, and invasive-species research.
Rosen has an expertise in aquatic biolo-gy, has published articles in numerous sci-entifi c journals, and has an indepth knowl-
Barry Rosen to Lead USGS in FloridaBy Diane Noserale
edge of water quality and aquatic biology, threatened and endangered species, critical habitat, and conservation biology. He has worked closely with State and Federal agencies on South Florida environmental issues, and his work has contributed sig-nifi cantly toward a better understanding of the overall ecosystem-restoration efforts.
Rosen earned his Ph.D. in aquatic biol-ogy from Bowling Green State Univer-sity, his M.A. in aquatic biology from St. Cloud State University in Minnesota, and his B.S. in botany from the University of Connecticut.
He was an American Association for the Advancement of Science-EPA Envi-ronmental Science Fellow, working on the impact of pollutant discharges to the marine environment from public-owned treatment works. He worked at the South Florida Water Management District as the Program Manager for Lake Okeechobee, overseeing the planning, research, moni-toring, exotic-plant control, and regulatory
activities for the greater Lake Okeechobee area. He was one of the original con-tributors to the
Barry Rosen, new director of the USGS Flor-ida Integrated Science Center.
restoration efforts for the Comprehensive Everglades Restoration Plan (CERP) in South Florida.
Rosen joined the Federal Government in 1999, working for the Natural Re-sources Conservation Service’s Watershed Science Institute on national water-quality issues, including harmful algal blooms. He joined the U.S. Fish and Wildlife Service in June 2002 as assistant fi eld supervisor and is the manager for the restoration ef-forts, including CERP, in South Florida.]

11 Sound Waves August 2006
Publications
Publications
Information about sea-fl oor charac-teristics from the beach to the deep sea improves our understanding of the interac-tions between land and sea, the effects of river discharge and sea-level changes, the distribution of benthic fl ora and fauna, the location and type of sea-fl oor resources, the potential consequences of human ac-tivities on the oceans, and other critical issues. To assist in addressing these issues, the U.S. Geological Survey (USGS) and the University of Colorado are building usSEABED, a collection of linked data sets in which existing data from the USGS and other research groups are collated, processed, and extended to maximize their usability for mapping and analysis.
The USGS Coastal and Marine Geology Program recently published one of these data sets for the contiguous U.S. Pacifi c coast: usSEABED: Pacifi c Coast (California, Oregon, Washington) Offshore Surfi cial-Sediment Data Release, USGS Data Series 182 (URL http://pubs.usgs.gov/ds/2006/182/).
DS 182 contains more than 65,000 data points in fi ve linked data sets describing sed-iment and rock characteristics that include texture, component and rock-type informa-tion, geophysical and geochemical measure-ments, and other information about the na-ture of the surface and subsurface of the sea fl oor. Although most of the data are along the continental shelf, data are also available for major estuaries, such as Puget Sound, Grays Harbor, Willapa Bay, San Francisco Bay, Monterey Bay, San Diego Bay, and other smaller inlets, as well as to the limit of the U.S. Exclusive Economic Zone (U.S. EEZ), 200 nautical mi from shore.
The usSEABED database supports USGS efforts along the Pacifi c margin in sea-fl oor mapping, benthic-habitat analysis, sediment-budget analysis, sea-fl oor resources, Holocene depositional patterns, and sea-fl oor mobility, and is a collaborative effort of the USGS, the National Oceanic and Atmospheric Administration’s National Marine Fish-
Seabed Characteristics Along the Pacifi c Margin: usSEABED in California, Oregon, and Washington Waters Published as USGS Data Series 182By Jane A. Reid and S. Jeffress Williams
eries Service (NOAA-NMFS), and the University of Colorado. This publication encourages other marine researchers to use usSEABED and to contribute to this grow-ing national database of approximately 325,000 data points within the U.S. EEZ.
Derived from existing published and unpublished data from the USGS, the U.S. Navy, NOAA, universities, local governments, and others, DS 182 provides georeferenced numerical values from laboratory analyses and verbal descrip-tions, processed and extended through the data-mining software dbSEABED created at the University of Sydney, Australia, and the University of Colorado, Boulder. Based on fuzzy-set theory, dbSEABED, in part, determines the membership of such phrases as “brown silty sand with shells and worm tubes” in various sets—such as gravel, sand, mud, color, shells, and worms—greatly extending coverages in areas of sparse data. In addition, dbSEABED uses published and empirical relations to predict unmeasured parameters from known val-ues, further extending data coverage.
DS 182 provides extensive information about the relations between the fi ve linked data sets (lab-based, word-based, and cal-culated values, compositional components, and combined components), data processing and calibration within dbSEABED, a de-scription of the application of fuzzy-set theory to geology, and a source reference page with links to Federal Geographic Data Committee (FGDC)-compliant metadata for all sources. The fi ve linked data sets are pro-vided both in ESRI shapefi les and comma-delimited text fi les, and users are strongly encouraged to read the provided information about appropriate uses of the data before ap-plying the data to their research.
More information about usSEABED is posted on the usSEABED Web site at URL http://walrus.wr.usgs.gov/usseabed/, in-cluding links to sister publications for the Atlantic margin (DS 118) and the Gulf of Mexico and Caribbean regions (DS 146). Data for Alaska and Hawaii are currently
in process. Each publication will be up-dated as new data are included and (or) the processing software dbSEABED is signifi -cantly upgraded.
To contribute data to usSEABED and (or) to obtain more information about usSEABED in the Pacifi c (California, Or-egon, Washington, Alaska, and Hawaii), or to request a copy of DS 182 on CD-ROM, please contact Jane Reid in Santa Cruz, Calif. ([email protected]). For more information and (or) to contribute data to usSEABED along the Atlantic and Gulf of Mexico coasts, the Great Lakes, and the U.S. Caribbean region, or for CD-ROMs of the Atlantic (DS 118) and Gulf/Carib-bean (DS 146) publications, please contact S. Jeffress Williams in Woods Hole, Mass. ([email protected]).
The complete citation for the new pub-lication is:
Reid, J.A., Reid, J.M., Jenkins, C.J., Zimmermann, M., Williams, S.J., and Field, M.E., 2006, usSEABED; Pacifi c Coast (California, Oregon, Washington) offshore surfi cial-sediment data release: U.S. Geological Survey Data Series 182, version 1.0 [URL http://pubs.usgs.gov/ds/2006/182/].]
Map showing data coverage for the Pacifi c off-shore data release’s lab-based (extracted; red dots) and word-based (parsed; yellow triangles) data sets.
Extracted(numeric) data
Parsed (word-based) data
Pacific Coast Data

12August 2006 Sound Waves
Publications, continued
Publications
(Publications Submitted continued on page 13)
Barnard, P.L., and Hanes, D.M., 2006, Coastal monitoring of the May 2005 dredge disposal offshore of Ocean Beach, San Francisco, Calif.: U.S. Geological Survey Open-File Report 2006-1140 [URL http://pubs.usgs.gov/of/2006/1140/].
Carr, R.S., Nipper, Marion, Field, Michael, and Biedenbach, J.M., 2006, Coastal circulation and sediment dynamics in Hanalei Bay, Kaua‘i, part III, studies of sediment toxicity: U.S. Geological Survey Open-File Report 2006-1147 [URL http://pubs.usgs.gov/of/2006/1147/].
Draut, A.E., and Rubin, D.M., 2006, Measurements of wind, aeolian sand transport, and precipitation in the Colorado River corridor, Grand Canyon, Arizona; January 2005 to January 2006: U.S. Geological Survey Open-File Report 2006-1188 [URL http://pubs.usgs.gov/of/2006/1188/].
Draut, A.E., Clift, P.D., and Blodgett, R.B., 2006, Field-trip guide to volcanic and volcaniclastic deposits of the Lower Jurassic Talkeetna Formation, Sheep Mountain, south-central Alaska: U.S. Geological Survey Open-File Report 2006-1124 [URL http://pubs.usgs.gov/of/2006/1124/].
Garrison, V.H., 2006, From Aspergillus to Timbuktu; African dust, coral reefs, and human health [abs.]: World Congress of Soil Science, 18th, Philadelphia, Pa., July 9-15, 2006, abstract 88-2, p. 77 [URL http://crops.confex.com/crops/wc2006/techprogram/P14057.HTM].
Garrison, V.H., Carr, R.S., Foreman, W.T., Griffi n, D., Holmes, C., Kellogg, C., Majewski, M.S., Nipper, M., Shinn, E.A., Simonich, S.L., and Smith, G.W., 2005, Saharan dust and the degradation
of coral reefs—evidence of a link [abs.]: Association of Marine Laboratories of the Caribbean Scientifi c Meeting, 32nd, Curacao, Netherlands Antilles, June 13-17, 2005, Abstracts, p. 29.
Garrison, V.H., Carr, R.S., Foreman, W.T., Holmes, C., Majewski, M.S., Nipper, M., Shinn, E.A., Simonich, S.L., and Smith, G.W., 2005, African dust and degradation of coral reefs—a tale of persistent organic pollutants, metals and microbes [abs.]: International Association of Meteorology and Atmospheric Sciences General Assembly, 9th, Beijing, China, August 2-11, 2005, Abstracts, p. A-121 [URL http://web.lasg.ac.cn/IAMAS2005/download.html].
Hall, D.K., Williams, R.S., Jr., Casey, K.A., DiGirolamo, N.E., and Wan, Z., 2006, Satellite-derived, melt-season surface temperature of the Greenland Ice Sheet (2000-2005) and its relationship to mass balance: Geophysical Research Letters, v. 33, no. 11, L11501, doi:10.1029/2006GL026444 [URL http://www.agu.org/pubs/crossref/2006/2006GL026444.shtml].
Meckel, T.A., ten Brink, U.S., and Williams, S.J., 2006, Estimating present compaction rates in coastal deltaic environments—numerical methods and stratigraphic infl uences: Geophysical Research Letters, v. 33, no. 11, L11403, doi:10.1029/2006GL26300 [URL http://www.agu.org/pubs/crossref/2006/2006GL026300.shtml].
Poppe, L.J., Paskevich, V.F., Butman, B., Ackerman, S.D., Danforth, W.W., Foster, D.S., and Blackwood, D.S., 2006, Geological interpretation of bathymetric and backscatter imagery of the sea fl oor off eastern Cape Cod: U.S. Geological
Survey Open-File Report 2005-1048 (DVD-ROM) [URL http://woodshole.er.usgs.gov/pubs/of2005-1048/].
Smith-Vaniz, W.F., Jelks, H.L., and Rocha, L.A., 2006, Relevance of cryptic fi shes in biodiversity assessments; a case study at Buck Island Reef National Monument, St. Croix: Bulletin of Marine Science, v. 79, p. 17-48 [URL http://www.rsmas.miami.edu/bms/].
ten Brink, U.S., Geist, E.L., and Andrews, B.D., 2006, Size distribution of submarine landslides and its implication to tsunami hazard in Puerto Rico: Geophysical Research Letters, v. 33, no. 11, L11307, doi:10.1029/2006GL026125 [URL http://www.agu.org/pubs/crossref/2006/2006GL026125.shtml].
ten Brink, U.S., Song, J., and Bucknam, R.C., 2006, Rupture models for the A.D. 900-930 Seattle fault earthquake from uplifted shorelines: Geology, v. 34, no. 7, p. 585-588 [URL http://www.gsajournals.org/gsaonline/?request=get-archive&issn=0091-7613].
Verdi, R.J., Tomlinson, S.A., and Marella, R.L., 2006, The drought of 1998-2002; impacts on Florida’s hydrology and landscape: U.S. Geological Survey Circular 1295 [URL http://pubs.usgs.gov/circ/2006/1295/].
Ward, G.A., Smith, T.J., III, and Whelan, K.R.T., 2006, Regional processes in mangrove ecosystems; spatial scaling relationships, biomass and turnover rate trends following catastrophic disturbance: Hydrobiologia, v. 569, no. 1, p. 517-527, doi:10.1007/s10750-006-0153-9.
Zawada, D.G., Brock, J.C., Along-Track Reef Imaging System (ATRIS): U.S. Geological Survey Fact Sheet 2006-3051 [URL http://pubs.usgs.gov/fs/2006/3051/].]
Recently Published Articles
Barnard, P.L., Hanes, D.M., Kvitek, R.G., and Iampietro, P.J., Bedforms at the mouth of San Francisco Bay: U.S. Geological Survey Scientifi c Investigations Map.
Barnard, P.L., Harney, Jodi, and Rubin, D.M., Field test comparison of an autocorrelation technique for determining
Publications Submitted for Director’s Approvalgrain size using a digital “eyeball” camera versus traditional methods: Sedimentary Geology.
Brock, J.C., Wright, C.W., Patterson, M., Nayegandhi, A., and Patterson, Judd, USGS-NPS-NASA-EEARL, submarine topography, Dry Tortugas National Park:
U.S. Geological Survey Open-File Report, DVD.
Calderon, Karynna, Dadisman, S.V., Kindinger, J.L., Flocks, J.G., Harris, M.S., and Thompson, P.R., Archive of digital

13 Sound Waves August 2006
Publications, continued
Publications
(Publications Submitted continued from page 12)
boomer seismic refl ection data collected during USGS cruise 97CCT01 offshore of central South Carolina, June 1997: U.S. Geological Survey Data Series.
Carniel, S., Sclavo, M., and Warner, J.C., Applying a coupled oceanic-wave-sediment transport model on coastal environments; a case study in the North Adriatic Sea [abs.]: Estuarine and Coastal Sciences Association (ECSA) International Conference, 41st, “Measuring and Managing Changes in Estuaries and Lagoons,” Venice, Italy, October 15-20, 2006.
Crusius, J., and Kenna, T., Ensuring confi dence in radionuclide-based sediment chronologies and mixing rates: Estuarine Coastal and Shelf Science.
Fisher, M.A., and Sliter, R.W., Does a boundary of the Wrangell block extend through lower Cook Inlet, Alaska?: Geophysical Research Letters.
Fisher, M.A., Langenheim, V.E., Nicholson, Craig, Ryan, Holly, and Sliter, R.W., Recent developments in understanding the tectonic evolution of the southern California offshore area; implications for earthquake-hazard analysis: Geological Society of America Special Paper.
Garrison, V.H., Foreman, W.T., Majewski, M.S., Mohammed, A., Genualdi, S.A., Simonich, S.L., and Lisle, J.T., Long-distance transport of persistent organic pollutants and trace metals in Saharan dust air masses [abs.]: Earth Science and Public Health—National Conference on USGS Health-Related Research, 2nd, Reston, Va., February 27-March 1, 2007.
Gibbs, A.E., Cochran, S.A., Logan, J.B., and Grossman, E.G., Benthic habitats and offshore geological resources of Kaloko-Honokohau National Historical Park: U.S. Geological Survey Scientifi c Investigations Report.
Hansen, M.E., Estimation of debris quantities after Hurricane Katrina—
Harrison County, MS: U.S. Geological Survey Open-File Report, 14 p.
Mallinson, D.J., Culver, S J., Riggs, S.R., Farrell, K., Wehmiller, J., Thieler, E.R., Foster, D.S., and Pierson, J., Early Pleistocene antecedent control on the location of Cape Hatteras; Mid-Atlantic coastal system, USA: Geology.
Meunier, T.K., U.S. Geological Survey activities in the exploration of Antarctica; 1946-2006 record of U.S. Geological Survey (USGS) and non-USGS collaborating personnel in Antarctica and their postal cachets; U.S. Navy (1946-48, 1954-60), International Geophysical Year (1957-58), and U.S. Geological Survey (1960-2005), in Williams, R.S., Jr., and Ferrigno, J.G., eds.: U.S. Geological Survey Open-File Report 2006-1116.
Meunier, T.K., U.S. Geological Survey scientifi c activities in the exploration of Antarctica, 1995-96 fi eld season, in Williams, R.S., Jr., and Ferrigno, J.G., eds.: U.S. Geological Survey Open-File Report 2006-1114.
Noble, M.A., Rosenberger, Kurt, Signell, Richard, White, Carmen, and Meistrell, Joe, Rapid variations in the temporal and spatial structures of barotropic and baroclinic currents associated with tidal processes on the Los Angeles shelves [abs.]: East Pacifi c Ocean Conference (EPOC), 53d annual, Timberline, Oreg., September 27-30, 2006.
Poag, C.W., Solving a Chesapeake Bay conundrum; new clues to the source beds for North American tektites [abs.]: Geological Society of America Annual Meeting, Philadelphia, Pa., October 22-25, 2006.
Poppe, L.J., Ackerman, S.D., Doran, E.F., Beaver, A.J., Crocker, J.M., and Schattgen, P.T., Mapping the sea fl oor in north-central Long Island Sound with interpolated reconnaissance multibeam bathymetry [abs.]: Long Island Sound Biennial Research Conference, New London, Conn., October 26-28, 2006.
Poppe, L.J., Williams, S.J., Doran, E.F., Moser, M.S., Forfi nski, N.A., and Stewart, H.F., Seafl oor character and sedimentary processes of Six Mile Reef interpreted from verifi ed multibeam bathymetry and high-resolution seismic profi les [abs.]: Long Island Sound Biennial Research Conference, New London, Conn., October 26-28, 2006.
Ryan, H.F., compiler, Structure number 292, San Diego Trough fault zone, in Quaternary fault and fold database of the United States: URL http://earthquakes.usgs.gov/regional/qfaults/.
Shuman, C.A., Hall, D.K., and Williams, R.S., Jr., Detection of surface-elevation change on Drangajokull, Iceland: Annals of Glaciology.
ten Brink, U.S., Smith, S., Stepka, T., Worley, C.R,. and Williams, G.F., Project PROBE Leg I—Report and archive of multibeam bathymetry and acoustic backscatter, CTD/XBT and GPS navigation data collected during USGS cruise 02051 (NOAA cruise RB0208), Puerto Rico Trench, September 24, 2002, to September 30, 2002: U.S. Geological Survey Open-File Report 2005-1066.
Tsunami Pilot Study Working Group, Seaside, Oregon, Tsunami Pilot Study—modernization of FEMA fl ood hazard maps: U.S. Geological Survey Open-File Report.
Twichell, D.C., Cross, V.A., Paskevich, V.F., Hutchinson, D.R., Winters, W.J., and Hart, P.E., GIS of selected geophysical and core data in the northern Gulf of Mexico continental slope collected by the U.S. Geological Survey: U.S. Geological Survey Open-File Report 2005-1071 [DVD-ROM].
Warrick, J.A., and Farnsworth, K.L., Hyperpycnal river plume processes—insights from the small, semi-arid rivers of southern California [abs.]: Geological Society of America Annual Meeting, Philadelphia, Pa., October 22-25, 2006.]