source rock evaluation of the cenomanian middle sarvak
TRANSCRIPT

100
http://jpst.ripi.irJournal of Petroleum Science and Technology 2017, 7(3), 100-116© 2017 Research Institute of Petroleum Industry (RIPI)
ABSTRACTThe middle Sarvak formation (Cenomanian) is one of the stratigraphic units of the Bangestan group in
the south of Iran. This formation is stratigraphically equivalent to the Ahmadi member of Kuwait and
Iraq. There is geochemical evidence that indicates this unit has a high level of organic richness and can
be a possible source rock in various locations. This study focuses on the organic geochemistry of the
middle Sarvak formation in the Persian Gulf region. Rock Eval pyrolysis, organic petrography, and kerogen
elemental analyses were used in order to evaluate the thermal maturity and determine the kerogen type
of the middle Sarvak formation. The results of this study show that middle Sarvak formation has entered
the oil window in eastern and western parts of the Persian Gulf, but it is immature in the central parts. This
regional pattern of organic maturation is probably a consequence of the regional uplift in the Qatar-Fars
arch area. The higher maturities in the eastern and western parts are, on the other hand, attributed to its
greater depth of burial. The results of the screening analyses by the Rock-Eval pyrolysis in parallel with the
results of maceral and elemental analyses show that the kerogen type in the middle Sarvak formation is
mainly a mixture of Types II and III.
Keywords: Middle Sarvak Formation, Rock Eval Pyrolysis, Organic Petrography, the Persian Gulf
Maryam Mirshahani*, Mohammad Kassaie, and Arsalan Zeinalzadeh
Geochemistry Group, Faculty of Upstream Petroleum Industry, Research Institute of Petroleum Industry (RIPI), Tehran, Iran
Source Rock Evaluation of the Cenomanian Middle Sarvak (Ahmadi) Formation in the Iranian Sector of the Persian Gulf
*Corresponding author
Maryam Mirshahani Email: [email protected] Tel: +98 21 4825 3027 Fax: +98 21 4473 9723
Article history Received: October 31, 2015 Received in revised form: May 10, 2016 Accepted: June 19, 2016 Available online: July 22, 2017
Journal of Petroleum Science and Technology
INTRODUCTIONThe Persian Gulf region is known for its prolific
petroleum systems owing to the large number of
active source rocks. The middle Sarvak formation is
considered as a candidate source rock in the studied
area based on geochemical observations. This
formation is a part of the Bangestan group and is
stratigraphically equivalent to the Mauddud, Ahmadi,
Rumaila, and Mishrif formations of the southern
Persian Gulf region [1]. The middle Sarvak formation
is present throughout the Persian Gulf area. A number
of geological and geochemical studies on the Sarvak
formation in the south of Iran, particularly in the
Zagros area, have been carried out [2-5].The goal of
this study is to evaluate the source rock potential of
the middle Sarvak formation in the Persian Gulf area.
Geological SettingThe Persian Gulf basin encompasses a thick
sedimentary succession with alternating clastic,
Source Rock Evaluation of the Cenomanian Middle Sarvak (Ahmadi)... Journal of Petroleum Science and Technology
http://jpst.ripi.ir
101
Journal of Petroleum Science and Technology 2017, 7(3),100-116© 2017 Research Institute of Petroleum Industry (RIPI)
carbonate, and evaporite sediments, which makes the
area particularly prolific for hosting large hydrocarbon
deposits. The oldest sediments in the area are
believed to be the evaporites, shales, and dolomites
of the Late-Precambrian Hormuz series [6]. Generally,
there is little data about the sedimentary history of
the Lower Paleozoic in the Persian Gulf region, and the
sedimentary record comprises mostly of shales and
sandstone with rare carbonates in the Devonian and
Early Carboniferous [7]. During the Permian, carbonate
shelf deposits of the Dalan formation were deposited
under warm and shallow-water conditions. More
arid conditions during Mid-Late Triassic formed the
evaporite deposits of the Dashtak formation, which
mark the end of the carbonate cycles. The middle
Jurassic sediments mainly consist of normal marine
organic-rich carbonates (the Surmeh formation) [8]
which are capped by extensive evaporite deposits
(Hith formation) of Tithonian age [9, 10]. During
Cretaceous, three main stratigraphic sequences [11]
were recorded in the Persian Gulf area: the Lower
Cretaceous deposits of the Fahliyan, Gadvan, and
Dariyan formations; the middle Cretaceous sediments
comprising of the Kazhdumi and Sarvak formations;
and the Upper Cretaceous deposits of the Ilam,
Laffan, and Gurpi formations [12, 13]. A regional
unconformity marks the end of the Cretaceous and
the boundary between the Late Cretaceous and
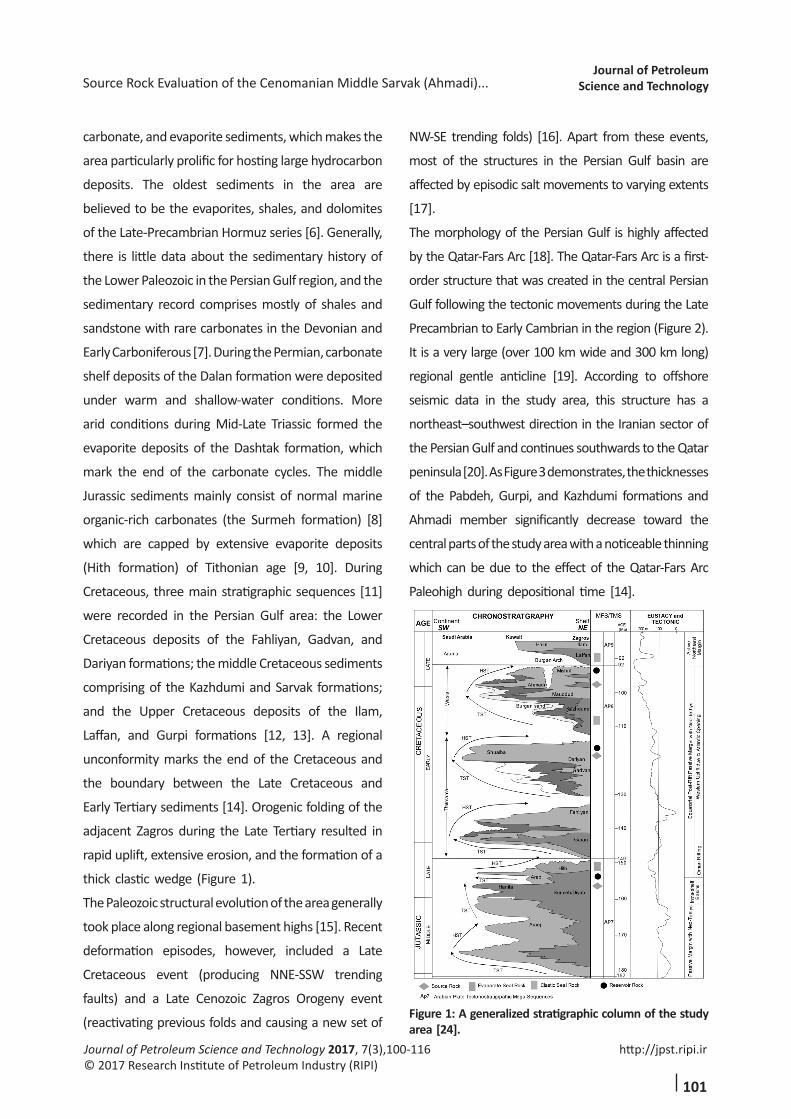
Early Tertiary sediments [14]. Orogenic folding of the
adjacent Zagros during the Late Tertiary resulted in
rapid uplift, extensive erosion, and the formation of a
thick clastic wedge (Figure 1).
The Paleozoic structural evolution of the area generally
took place along regional basement highs [15]. Recent
deformation episodes, however, included a Late
Cretaceous event (producing NNE-SSW trending
faults) and a Late Cenozoic Zagros Orogeny event
(reactivating previous folds and causing a new set of
NW-SE trending folds) [16]. Apart from these events,
most of the structures in the Persian Gulf basin are
affected by episodic salt movements to varying extents
[17].
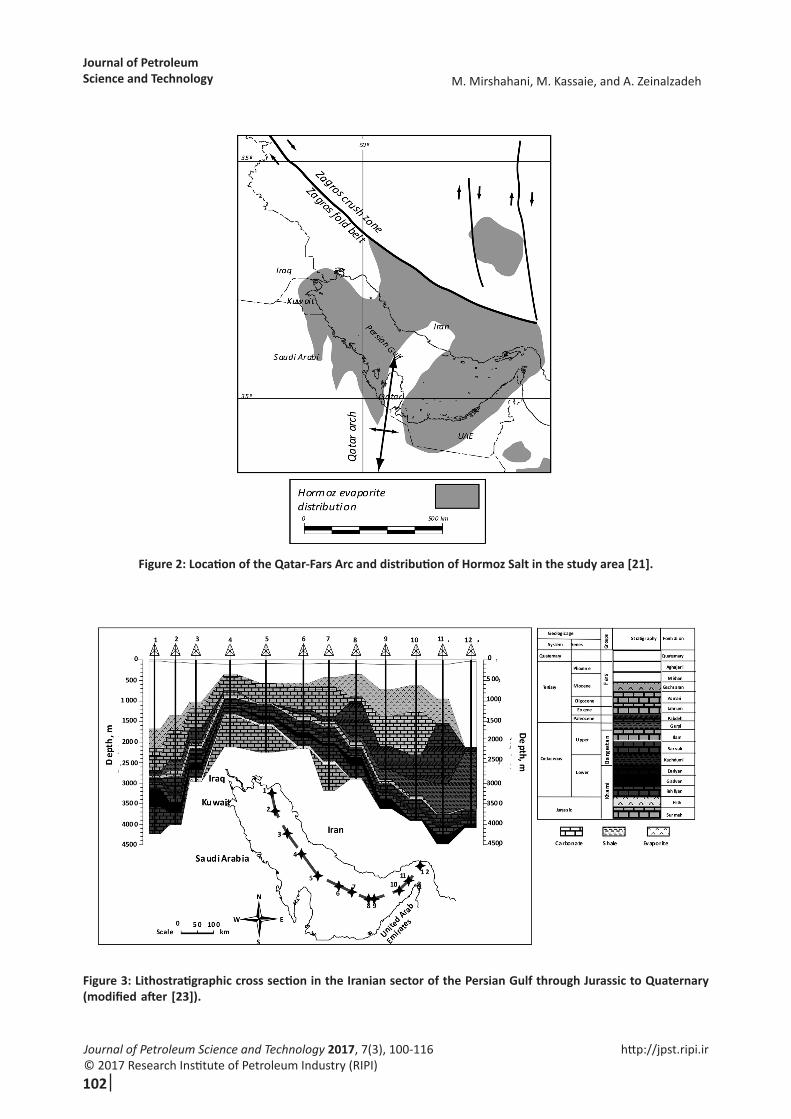
The morphology of the Persian Gulf is highly affected
by the Qatar-Fars Arc [18]. The Qatar-Fars Arc is a first-
order structure that was created in the central Persian
Gulf following the tectonic movements during the Late
Precambrian to Early Cambrian in the region (Figure 2).
It is a very large (over 100 km wide and 300 km long)
regional gentle anticline [19]. According to offshore
seismic data in the study area, this structure has a
northeast–southwest direction in the Iranian sector of
the Persian Gulf and continues southwards to the Qatar
peninsula [20]. As Figure 3 demonstrates, the thicknesses
of the Pabdeh, Gurpi, and Kazhdumi formations and
Ahmadi member significantly decrease toward the
central parts of the study area with a noticeable thinning
which can be due to the effect of the Qatar-Fars Arc
Paleohigh during depositional time [14].
Figure 1: A generalized stratigraphic column of the study area [24].
M. Mirshahani, M. Kassaie, and A. ZeinalzadehJournal of PetroleumScience and Technology
Journal of Petroleum Science and Technology 2017, 7(3), 100-116© 2017 Research Institute of Petroleum Industry (RIPI)102
http://jpst.ripi.ir
Figure 2: Location of the Qatar-Fars Arc and distribution of Hormoz Salt in the study area [21].
Figure 3: Lithostratigraphic cross section in the Iranian sector of the Persian Gulf through Jurassic to Quaternary (modified after [23]).

Source Rock Evaluation of the Cenomanian Middle Sarvak (Ahmadi)... Journal of Petroleum Science and Technology
http://jpst.ripi.ir
103
Journal of Petroleum Science and Technology 2017, 7(3),100-116© 2017 Research Institute of Petroleum Industry (RIPI)
Figure 4: Location map and selected fields of the study area.
The sediments of the middle Sarvak formation
were deposited on a passive margin of the Neo-
Tethys Ocean. This formation is divided into four
depositional members: the Mauddud, bituminous
shaley limestone, Khatiyah in the central and western
parts of the Persian Gulf, Ahmadi with shaley facies
in the northern Persian Gulf, and the Mishrif reefal
limestone [1].
The middle Sarvak is present in all wells drilled in the
Persian Gulf. The thickness of the formation varies
from a minimum 41 meters up to a maximum of 223
meters in the northwestern Persian Gulf [1].
The Ahmadi member is a continuation of the middle
Sarvak in the northwestern Persian Gulf (towards
Kuwait). Lithologically, it consists of 30 to 60 meters
of highly eroded shale with intercalation of thin
limestone beds. Most of the present Persian Gulf
area was beyond the deltaic influence, and until
the deposition of the Ahmadi shales, continued to
receive sub-littoral to shallow marine carbonates [25].
The Ahmadi member also consists of fossiliferous
limestones. The shale and limestone of the Ahmadi
member were deposited during Early to middle
Cenomanian in open-marine conditions on the outer
Persian Gulf

M. Mirshahani, M. Kassaie, and A. ZeinalzadehJournal of PetroleumScience and Technology
Journal of Petroleum Science and Technology 2017, 7(3), 100-116© 2017 Research Institute of Petroleum Industry (RIPI)104
http://jpst.ripi.ir
shelf at depths between 100 to 200 meters [1].
For the purpose of this study, in order to evaluate source
rock potentiality of middle Sarvak formation, cutting
samples from a total of 18 wells through the Persian
Gulf area have been analyzed with organic geochemical
methods. Figure 4 shows the location map of these wells
in the Persian Gulf. Four study blocks were delineated
to present the northwest (Block A), west-central (Block
BC), east central (Block D), and east parts of the Iranian
sector of the Persian Gulf.
EXPERIMENTAL PROCEDURES
Materials and Methods In order to evaluate middle Sarvak formation for
hydrocarbon source rock potentiality, Rock-Eval
pyrolysis results were used in combination with
organic-petrography methods. The latter included
vitrinite reflectance measurements, visual kerogen
inspection, thermal alteration determination, and
kerogen elemental analysis following generally
published procedures.
A total of 77 cutting samples were selected for analysis.
Cutting cheeps were cleaned and pulverized prior to
analysis. Vinci Technologies’ Rock-Eval 6 instrument
(AGH University of Poland) and Rock-Eval 2 unit
(Research Institute of Petroleum Industry of Iran)
equipped with a total organic carbon module (TOC)
were used for this study.
Based on the Rock-Eval screening analyses, nine
samples were selected for kerogen extraction and
subsequently used for visual kerogen analyses. In
order to obtain kerogen extracts, selected rock
samples were crushed to an average particle size
of approximately 1 mm. Concentrated HCl and
HF were successively added to the pulverized
cutting samples to remove carbonate and silicate
materials respectively. The samples were washed
in distilled water repeatedly until neutrality (pH=7)
was attained, followed by the flotation of the isolated
organic matter (kerogen) within zinc-bromide solution
(specific gravity=2) to remove residual inorganic
matter.
According to the results obtained from the screening
analyses, a total of 36 samples were selected for
vitrinite reflectance measurements. Vitrinite reflectance
measurements were carried out on both polished whole
rock block and kerogen concentrate samples by using
a Leitz-MPV-SP photometer microscope at RIPI. The
measurements were carried out in a random mode
according to the ASTM standard method [26].
Nine polished blocks and equal number of thin
sections were prepared from the extracts for the
identification of kerogen type and the determination
of thermal alteration index (TAI).
The kerogen extract samples were used for the
elemental analyses to determine the elemental
composition of C, H, N, O, and S. The elemental
composition of the isolated kerogens (C, H, N, and S)
was determined with a Carlo ErBa EA 1108 elemental
analyzer at AGH University of Poland.
RESULTS AND DISCUSSIONSource rock characteristics of the middle Sarvak
formation were performed based on a geochemical
combination. Special emphasizing was on determining
the type, amount, maturity, and generative potential
of the contained organic matter.
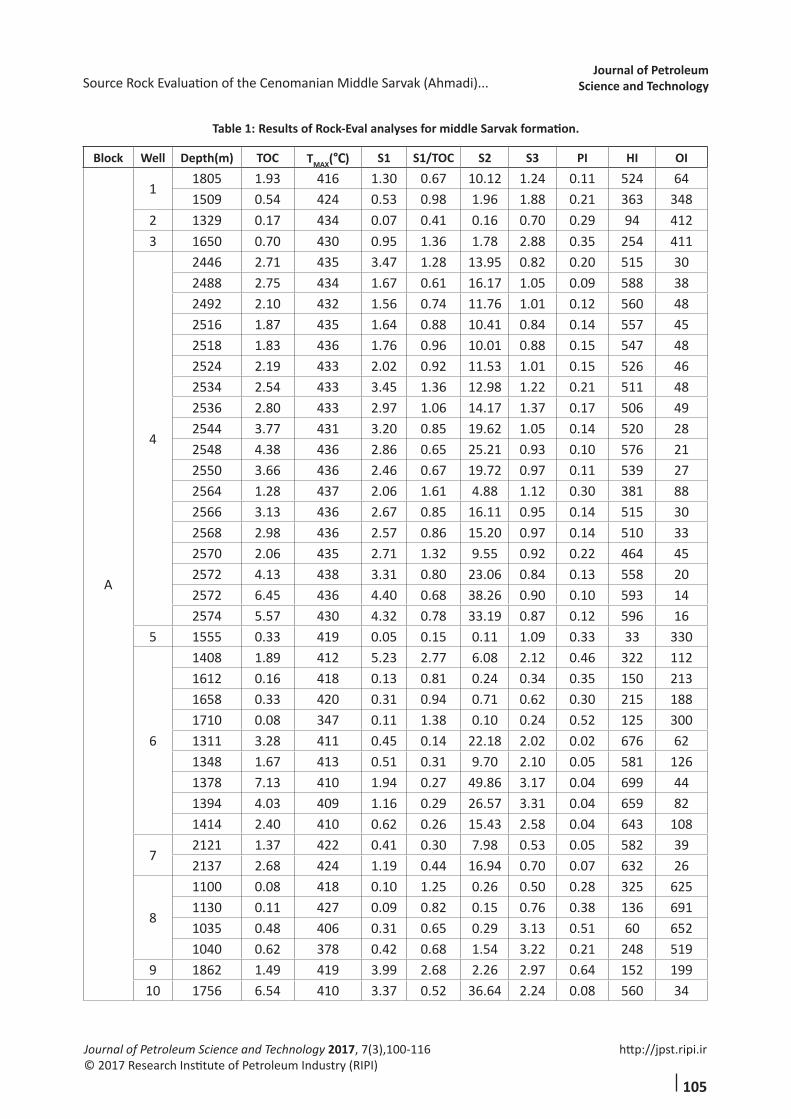
Source Rock PotentialityThe results of Rock-Eval screening analyses are
presented in Table 1.
Source Rock Evaluation of the Cenomanian Middle Sarvak (Ahmadi)... Journal of Petroleum Science and Technology
http://jpst.ripi.ir
105
Journal of Petroleum Science and Technology 2017, 7(3),100-116© 2017 Research Institute of Petroleum Industry (RIPI)
Table 1: Results of Rock-Eval analyses for middle Sarvak formation.
Block Well Depth(m) TOC TMAX(°C) S1 S1/TOC S2 S3 PI HI OI
A
11805 1.93 416 1.30 0.67 10.12 1.24 0.11 524 641509 0.54 424 0.53 0.98 1.96 1.88 0.21 363 348
2 1329 0.17 434 0.07 0.41 0.16 0.70 0.29 94 4123 1650 0.70 430 0.95 1.36 1.78 2.88 0.35 254 411
4
2446 2.71 435 3.47 1.28 13.95 0.82 0.20 515 302488 2.75 434 1.67 0.61 16.17 1.05 0.09 588 382492 2.10 432 1.56 0.74 11.76 1.01 0.12 560 482516 1.87 435 1.64 0.88 10.41 0.84 0.14 557 452518 1.83 436 1.76 0.96 10.01 0.88 0.15 547 482524 2.19 433 2.02 0.92 11.53 1.01 0.15 526 462534 2.54 433 3.45 1.36 12.98 1.22 0.21 511 482536 2.80 433 2.97 1.06 14.17 1.37 0.17 506 492544 3.77 431 3.20 0.85 19.62 1.05 0.14 520 282548 4.38 436 2.86 0.65 25.21 0.93 0.10 576 212550 3.66 436 2.46 0.67 19.72 0.97 0.11 539 272564 1.28 437 2.06 1.61 4.88 1.12 0.30 381 882566 3.13 436 2.67 0.85 16.11 0.95 0.14 515 302568 2.98 436 2.57 0.86 15.20 0.97 0.14 510 332570 2.06 435 2.71 1.32 9.55 0.92 0.22 464 452572 4.13 438 3.31 0.80 23.06 0.84 0.13 558 202572 6.45 436 4.40 0.68 38.26 0.90 0.10 593 142574 5.57 430 4.32 0.78 33.19 0.87 0.12 596 16
5 1555 0.33 419 0.05 0.15 0.11 1.09 0.33 33 330
6
1408 1.89 412 5.23 2.77 6.08 2.12 0.46 322 1121612 0.16 418 0.13 0.81 0.24 0.34 0.35 150 2131658 0.33 420 0.31 0.94 0.71 0.62 0.30 215 1881710 0.08 347 0.11 1.38 0.10 0.24 0.52 125 3001311 3.28 411 0.45 0.14 22.18 2.02 0.02 676 621348 1.67 413 0.51 0.31 9.70 2.10 0.05 581 1261378 7.13 410 1.94 0.27 49.86 3.17 0.04 699 441394 4.03 409 1.16 0.29 26.57 3.31 0.04 659 821414 2.40 410 0.62 0.26 15.43 2.58 0.04 643 108
72121 1.37 422 0.41 0.30 7.98 0.53 0.05 582 392137 2.68 424 1.19 0.44 16.94 0.70 0.07 632 26
8
1100 0.08 418 0.10 1.25 0.26 0.50 0.28 325 6251130 0.11 427 0.09 0.82 0.15 0.76 0.38 136 6911035 0.48 406 0.31 0.65 0.29 3.13 0.51 60 6521040 0.62 378 0.42 0.68 1.54 3.22 0.21 248 519
9 1862 1.49 419 3.99 2.68 2.26 2.97 0.64 152 19910 1756 6.54 410 3.37 0.52 36.64 2.24 0.08 560 34

M. Mirshahani, M. Kassaie, and A. ZeinalzadehJournal of PetroleumScience and Technology
Journal of Petroleum Science and Technology 2017, 7(3), 100-116© 2017 Research Institute of Petroleum Industry (RIPI)106
http://jpst.ripi.ir
Block Well Depth(m) TOC TMAX(°C) S1 S1/TOC S2 S3 PI HI OI
B and
C
11
2131 1.08 415 2.85 2.64 1.23 1.08 0.70 114 1002137 0.75 394 1.56 2.08 0.85 1.65 0.65 113 2202173 0.37 422 0.65 1.76 0.87 1.16 0.43 235 3142182 1.28 414 0.93 0.73 5.06 1.34 0.16 395 1052188 1.35 421 1.12 0.83 4.49 1.59 0.20 333 1182201 1.16 424 1.05 0.91 4.23 1.79 0.20 365 154
12
930 0.83 421 2.61 3.14 0.38 1.79 0.87 46 2161056 0.25 ** 0.12 0.48 0.04 1.35 0.75 16 5401058 0.30 406 0.10 0.33 0.13 1.69 0.44 43 5631060 0.54 427 0.17 0.31 0.40 1.70 0.30 74 3151062 0.48 419 0.22 0.46 0.22 1.85 0.50 46 3851064 0.32 409 0.12 0.38 0.02 1.52 0.86 6 4751072 0.40 416 0.11 0.28 0.05 1.51 0.69 13 3781094 0.51 404 0.11 0.22 0.12 1.60 0.47 24 3141106 0.51 431 0.18 0.35 0.92 0.63 0.16 180 1241108 0.43 428 0.20 0.47 0.69 0.72 0.23 160 1671110 0.39 433 0.21 0.54 0.57 0.66 0.27 146 169
131846 0.30 ** 0.11 0.37 0.21 1.58 0.34 70 5271890 0.29 411 0.14 0.48 0.33 1.28 0.29 114 441
D
14
3539 0.17 441 0.26 1.53 0.20 0.63 0.57 118 3713619 0.31 440 0.29 0.94 0.66 0.19 0.31 213 603695 0.10 451 0.19 1.90 0.09 0.32 0.68 90 3203790 0.24 440 0.91 3.79 0.40 0.27 0.69 167 112
152551 0.87 436 2.58 2.97 3.96 1.33 0.39 455 1532615 1.11 430 3.89 3.50 3.20 1.18 0.55 288 106
16
3578 0.38 430 0.41 1.08 1.03 0.70 0.28 271 1843674 0.15 425 0.26 1.73 0.07 0.67 0.79 47 4473778 0.13 426 0.27 2.08 0.00 0.72 1.00 0 5543852 0.22 428 0.55 2.50 0.22 0.75 0.71 100 341
17
2260 0.44 432 0.14 0.32 0.32 1.11 0.30 73 2522380 0.38 435 0.16 0.42 0.52 0.73 0.24 138 1932420 3.86 421 0.96 0.25 14.16 2.73 0.06 367 712450 1.34 425 0.35 0.26 5.42 1.16 0.06 404 872480 0.43 432 0.12 0.28 0.47 0.66 0.20 110 1542490 0.98 435 0.16 0.16 1.11 1.21 0.13 113 124
E 18 3550 1.13 429 0.58 0.51 5.16 0.66 0.10 457 58

Source Rock Evaluation of the Cenomanian Middle Sarvak (Ahmadi)... Journal of Petroleum Science and Technology
http://jpst.ripi.ir
107
Journal of Petroleum Science and Technology 2017, 7(3),100-116© 2017 Research Institute of Petroleum Industry (RIPI)
Peters and Cassa [26] presented standard guidelines for
evaluating organic richness, quality, and maturity of source
rock based on pyrolysis parameters in which a TOC value
of 0.5 wt.% is considered as the base limit for an effective
source rock. Based on this standard, the TOC range
of middle Sarvak formation exhibits variable changes
with a lateral alteration in the depositional environment
conditions.
The middle Sarvak formation in block A from the eastern
Persian Gulf area has a TOC content of 0.08-7.13 wt.%.
These values are consistent with source rocks that may
have poor to excellent source rock potential with S2
ranging from 0.1 to 49 (mg HC)/(g. rock) at an average
S2 value of 12 (mg HC)/(g. rock) [27]. B and C block in
the central part of the study area has a TOC content
of 0.25-1.35 wt.%. The middle Sarvak formation in
this area represents a poor to fair hydrocarbon potential
with respect to organic concentration. Moving to the
western part (block D), it becomes evident that the middle
Sarvak formation in this area is fair to good in terms of oil
generation potential (TOC content of 0.1-3.86 wt.% with an
average value of 0.69 and an S2 of 0.07-14.16 (mg HC)/(g.
rock) at an average S2 value of 2.11 (mg HC)/(g. rock)) (Table
1). Source rock potentiality of middle Sarvak formation
was also estimated from the HI versus TOC and S1+S2
versus TOC plots from the Rock-Eval pyrolysis output.
These plots indicate variable source rock quality for
the middle Sarvak formation in the sampled areas.
According to this figure, the data points representing
samples from block B and C indicate poor to fair
source quality. Poor to excellent oil source quality is
represented for Blocks A and D located in the northwest
(Figure 5 and Figure 6). As a result, in the regional context,
TOC and source rock potentiality variation of the middle
Sarvak formation are in satisfactory agreement with the
Persian Gulf basin morphology. As represented in the
map of Figure 2, Qatar-Fars Arc played an important role
in deposition and preservation of organic matter. Qatar-
Fars Arc Paleo-high divided the Persian Gulf basin
into two distinct basins, namely one in the west and
another in the east of Qatar-Fars Arc. The amounts
of TOC increase from central Persian Gulf towards
northwestern direction in the western basin and
northeast direction in the eastern basin.
Figure 5: S1+S2 versus TOC in the middle Sarvak formation [27].
Figure 6: HI versus TOC in the middle Sarvak formation [27].
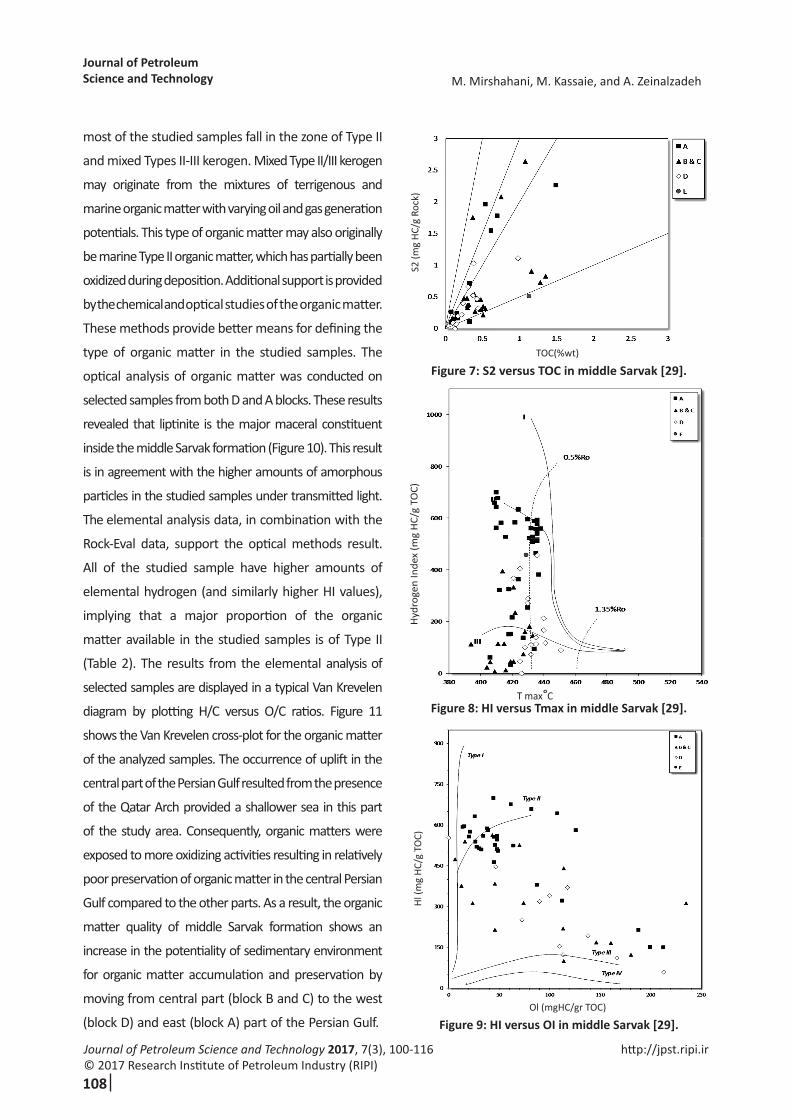
Kerogen TypeThe type of organic matter present in the source rocks
can be evaluated based on the plot of S2 (remaining
hydrocarbon potentiality) verses TOC and modified
Van Krevelen diagrams of HI versus temperature of
maximum generation (Tmax) and OI versus HI. In the
modified Van Krevelen diagram of HI-OI and HI-Tmax
and S2 versus TOC (Figure 7, Figure 8, and Figure 9),
TOC(%wt)
Hl (m
gHC/
grTO
C)
TOC(%wt)
S1+S
2(m
gHC/
g R
ock)
M. Mirshahani, M. Kassaie, and A. ZeinalzadehJournal of PetroleumScience and Technology
Journal of Petroleum Science and Technology 2017, 7(3), 100-116© 2017 Research Institute of Petroleum Industry (RIPI)108
http://jpst.ripi.ir
Figure 7: S2 versus TOC in middle Sarvak [29].
Figure 8: HI versus Tmax in middle Sarvak [29].
most of the studied samples fall in the zone of Type II
and mixed Types II-III kerogen. Mixed Type II/III kerogen
may originate from the mixtures of terrigenous and
marine organic matter with varying oil and gas generation
potentials. This type of organic matter may also originally
be marine Type II organic matter, which has partially been
oxidized during deposition. Additional support is provided
by the chemical and optical studies of the organic matter.
These methods provide better means for defining the
type of organic matter in the studied samples. The
optical analysis of organic matter was conducted on
selected samples from both D and A blocks. These results
revealed that liptinite is the major maceral constituent
inside the middle Sarvak formation (Figure 10). This result
is in agreement with the higher amounts of amorphous
particles in the studied samples under transmitted light.
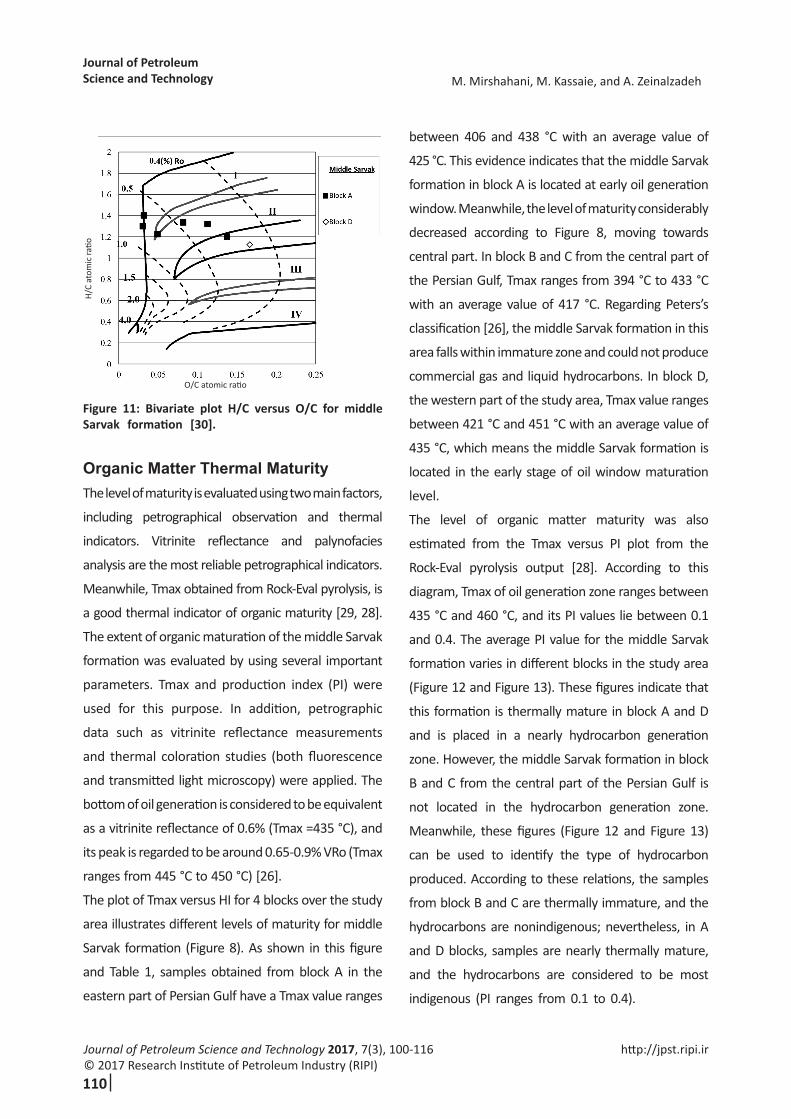
The elemental analysis data, in combination with the
Rock-Eval data, support the optical methods result.
All of the studied sample have higher amounts of
elemental hydrogen (and similarly higher HI values),
implying that a major proportion of the organic
matter available in the studied samples is of Type II
(Table 2). The results from the elemental analysis of
selected samples are displayed in a typical Van Krevelen
diagram by plotting H/C versus O/C ratios. Figure 11
shows the Van Krevelen cross-plot for the organic matter
of the analyzed samples. The occurrence of uplift in the
central part of the Persian Gulf resulted from the presence
of the Qatar Arch provided a shallower sea in this part
of the study area. Consequently, organic matters were
exposed to more oxidizing activities resulting in relatively
poor preservation of organic matter in the central Persian
Gulf compared to the other parts. As a result, the organic
matter quality of middle Sarvak formation shows an
increase in the potentiality of sedimentary environment
for organic matter accumulation and preservation by
moving from central part (block B and C) to the west
(block D) and east (block A) part of the Persian Gulf. Figure 9: HI versus OI in middle Sarvak [29].
S2 (m
g HC
/g R
ock)
TOC(%wt)
Hyd
roge
n In
dex
(mg
HC/
g TO
C)
T max°C
Hl (m
g HC
/g T
OC)
Ol (mgHC/gr TOC)

Source Rock Evaluation of the Cenomanian Middle Sarvak (Ahmadi)... Journal of Petroleum Science and Technology
http://jpst.ripi.ir
109
Journal of Petroleum Science and Technology 2017, 7(3),100-116© 2017 Research Institute of Petroleum Industry (RIPI)
Table 2: Determination of kerogen type based on chemical and optical properties of middle Sarvak formation.
General Information
Elemental Analyze
Chemical methods Optical Methods
Kerogen
Type
Rock-Eval Reflected Light Transmitted Light
Block Well
Sample
No.
Interval
H/C O/C HI OI Vit. Lip. Iner. Amor. Herb. Woody Coaly
D 7S-1034-
10351.13 0.17 386 79 30 50 20 65 0 15 20 II
A 4S-637-
6381.3 0.03 595 15 30 60 10 75 5 10 10 II
A 4 S-645 1.4 0.03 576 21 30 50 20 80 0 15 5 II
A 4S-653-
6541.23 0.05 551 34 35 60 5 70 0 20 10 II
A 6 S-75-79 1.32 0.11 655 84 30 60 20 85 0 5 10 II
A 6 S-81-86 1.2 0.14 672 71 20 65 15 80 0 10 10 II
Average 1.3 0.1 572.4 50.7 29 58 15 76 1 13 11
Figure 10: Photomicrographs of macerals in the middle Sarvak formation; A and C are reflected light, and B and D are UV; (V: Vitrinite, L: Liptinite).
M. Mirshahani, M. Kassaie, and A. ZeinalzadehJournal of PetroleumScience and Technology
Journal of Petroleum Science and Technology 2017, 7(3), 100-116© 2017 Research Institute of Petroleum Industry (RIPI)110
http://jpst.ripi.ir
Figure 11: Bivariate plot H/C versus O/C for middle Sarvak formation [30].
Organic Matter Thermal Maturity The level of maturity is evaluated using two main factors,
including petrographical observation and thermal
indicators. Vitrinite reflectance and palynofacies
analysis are the most reliable petrographical indicators.
Meanwhile, Tmax obtained from Rock-Eval pyrolysis, is
a good thermal indicator of organic maturity [29, 28].
The extent of organic maturation of the middle Sarvak
formation was evaluated by using several important
parameters. Tmax and production index (PI) were
used for this purpose. In addition, petrographic
data such as vitrinite reflectance measurements
and thermal coloration studies (both fluorescence
and transmitted light microscopy) were applied. The
bottom of oil generation is considered to be equivalent
as a vitrinite reflectance of 0.6% (Tmax =435 °C), and
its peak is regarded to be around 0.65-0.9% VRo (Tmax
ranges from 445 °C to 450 °C) [26].
The plot of Tmax versus HI for 4 blocks over the study
area illustrates different levels of maturity for middle
Sarvak formation (Figure 8). As shown in this figure
and Table 1, samples obtained from block A in the
eastern part of Persian Gulf have a Tmax value ranges
between 406 and 438 °C with an average value of
425 °C. This evidence indicates that the middle Sarvak
formation in block A is located at early oil generation
window. Meanwhile, the level of maturity considerably
decreased according to Figure 8, moving towards
central part. In block B and C from the central part of
the Persian Gulf, Tmax ranges from 394 °C to 433 °C
with an average value of 417 °C. Regarding Peters’s
classification [26], the middle Sarvak formation in this
area falls within immature zone and could not produce
commercial gas and liquid hydrocarbons. In block D,
the western part of the study area, Tmax value ranges
between 421 °C and 451 °C with an average value of
435 °C, which means the middle Sarvak formation is
located in the early stage of oil window maturation
level.
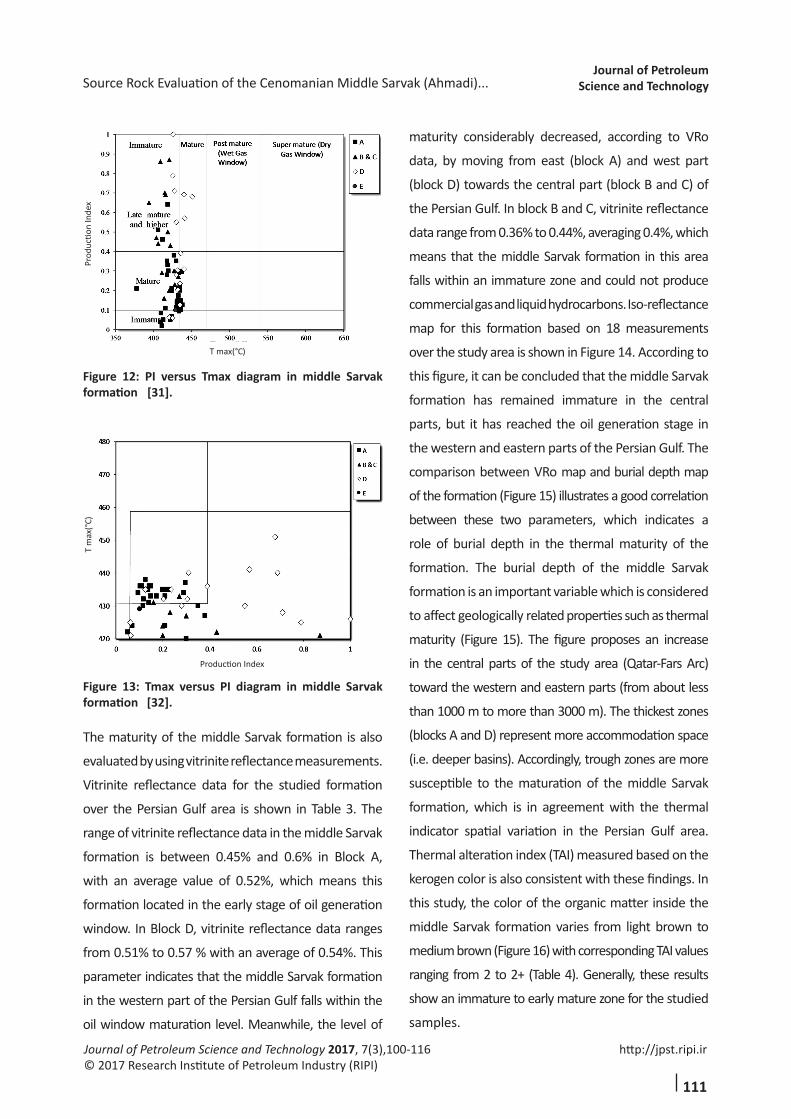
The level of organic matter maturity was also
estimated from the Tmax versus PI plot from the
Rock-Eval pyrolysis output [28]. According to this
diagram, Tmax of oil generation zone ranges between
435 °C and 460 °C, and its PI values lie between 0.1
and 0.4. The average PI value for the middle Sarvak
formation varies in different blocks in the study area
(Figure 12 and Figure 13). These figures indicate that
this formation is thermally mature in block A and D
and is placed in a nearly hydrocarbon generation
zone. However, the middle Sarvak formation in block
B and C from the central part of the Persian Gulf is
not located in the hydrocarbon generation zone.
Meanwhile, these figures (Figure 12 and Figure 13)
can be used to identify the type of hydrocarbon
produced. According to these relations, the samples
from block B and C are thermally immature, and the
hydrocarbons are nonindigenous; nevertheless, in A
and D blocks, samples are nearly thermally mature,
and the hydrocarbons are considered to be most
indigenous (PI ranges from 0.1 to 0.4).
H/C
atom
ic ra
tio
O/C atomic ratio
Source Rock Evaluation of the Cenomanian Middle Sarvak (Ahmadi)... Journal of Petroleum Science and Technology
http://jpst.ripi.ir
111
Journal of Petroleum Science and Technology 2017, 7(3),100-116© 2017 Research Institute of Petroleum Industry (RIPI)
Figure 12: PI versus Tmax diagram in middle Sarvak formation [31].
Figure 13: Tmax versus PI diagram in middle Sarvak formation [32].
The maturity of the middle Sarvak formation is also
evaluated by using vitrinite reflectance measurements.
Vitrinite reflectance data for the studied formation
over the Persian Gulf area is shown in Table 3. The
range of vitrinite reflectance data in the middle Sarvak
formation is between 0.45% and 0.6% in Block A,
with an average value of 0.52%, which means this
formation located in the early stage of oil generation
window. In Block D, vitrinite reflectance data ranges
from 0.51% to 0.57 % with an average of 0.54%. This
parameter indicates that the middle Sarvak formation
in the western part of the Persian Gulf falls within the
oil window maturation level. Meanwhile, the level of
maturity considerably decreased, according to VRo
data, by moving from east (block A) and west part
(block D) towards the central part (block B and C) of
the Persian Gulf. In block B and C, vitrinite reflectance
data range from 0.36% to 0.44%, averaging 0.4%, which
means that the middle Sarvak formation in this area
falls within an immature zone and could not produce
commercial gas and liquid hydrocarbons. Iso-reflectance
map for this formation based on 18 measurements
over the study area is shown in Figure 14. According to
this figure, it can be concluded that the middle Sarvak
formation has remained immature in the central
parts, but it has reached the oil generation stage in
the western and eastern parts of the Persian Gulf. The
comparison between VRo map and burial depth map
of the formation (Figure 15) illustrates a good correlation
between these two parameters, which indicates a
role of burial depth in the thermal maturity of the
formation. The burial depth of the middle Sarvak
formation is an important variable which is considered
to affect geologically related properties such as thermal
maturity (Figure 15). The figure proposes an increase
in the central parts of the study area (Qatar-Fars Arc)
toward the western and eastern parts (from about less
than 1000 m to more than 3000 m). The thickest zones
(blocks A and D) represent more accommodation space
(i.e. deeper basins). Accordingly, trough zones are more
susceptible to the maturation of the middle Sarvak
formation, which is in agreement with the thermal
indicator spatial variation in the Persian Gulf area.
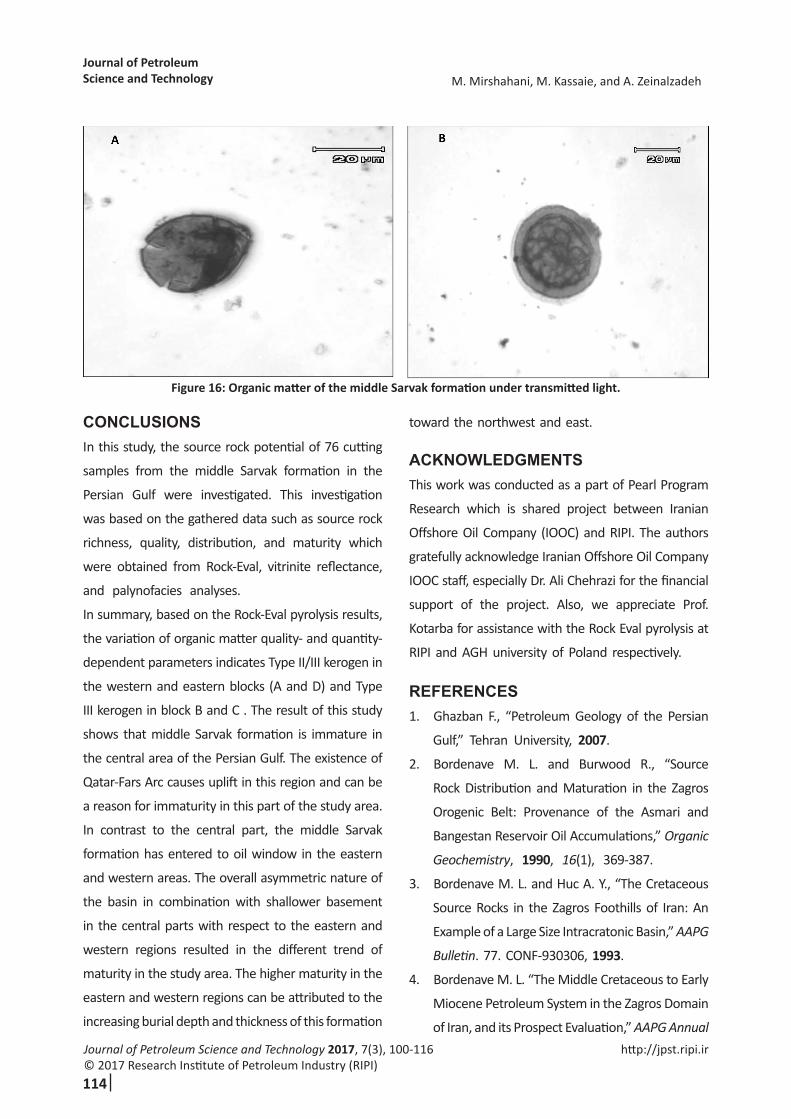
Thermal alteration index (TAI) measured based on the
kerogen color is also consistent with these findings. In
this study, the color of the organic matter inside the
middle Sarvak formation varies from light brown to
medium brown (Figure 16) with corresponding TAI values
ranging from 2 to 2+ (Table 4). Generally, these results
show an immature to early mature zone for the studied
samples.
Prod
uctio
n In
dex
T max(°C)
T m
ax(°C
)
Production Index

M. Mirshahani, M. Kassaie, and A. ZeinalzadehJournal of PetroleumScience and Technology
Journal of Petroleum Science and Technology 2017, 7(3), 100-116© 2017 Research Institute of Petroleum Industry (RIPI)112
http://jpst.ripi.ir
Table 3: Vitrinite reflectance data (Ro%) of the Sarvak formation in the Persian Gulf.
Block Well FormationSample
No.Depth
Number of Reading
Vitrinite Reflectance (%)
Min Max MeanB and C 11 Middle Sarvak FC-1-17 2130.55 5 0.3 0.66 0.44
B and C 11 Middle Sarvak FC-1-19 2173.22 5 0.33 0.57 0.40
B and C 11 Middle Sarvak FC-1-22 2200.66 3 0.27 0.53 0.38
A 2 Middle Sarvak S-587 1329 11 0.36 0.54 0.46
A 4 Middle Sarvak S-654 2446 16 0.46 0.69 0.54
A 4 Middle Sarvak S-653 2488 8 0.42 0.62 0.53
A 4 Middle Sarvak S-652 2492 8 0.43 0.63 0.52
A 4 Middle Sarvak S-649 2524 11 0.44 0.62 0.54
A 4 Middle Sarvak S-647 2536 10 0.45 0.62 0.52
A 4 Middle Sarvak S-645 2548 10 0.48 0.67 0.55
A 4 Middle Sarvak S-644 2550 9 0.48 0.65 0.55
A 4 Middle Sarvak S-641 2568 11 0.47 0.71 0.57
A 4 Middle Sarvak S-639 2572 10 0.47 0.71 0.6
A 4 Middle Sarvak S-637 2574 11 0.46 0.72 0.6
B and C 13 Middle Sarvak S-911 1846 9 0.31 0.43 0.36
D 17 Middle Sarvak S-1037 2260 14 0.43 0.6 0.51
D 17 Middle Sarvak S-1035 2420 8 0.47 0.68 0.55
D 17 Middle Sarvak S-1034 2450 11 0.48 0.7 0.56
D 17 Middle Sarvak S-1032 2490 13 0.48 0.7 0.57
Table 4: Range and mean of Ro% and TAI data for the middle Sarvak formation in different blocks.
Block Number of Samples Range of Ro Average Ro (%) TAI Maturity
A 11 0.46-0.6 0.54 +2 to 2 Early Mature
B and C 4 0.36-0.44 0.39 - Immature
D 4 0.51-0.57 0.54 +2 Early Mature
E No sample - - - -

Source Rock Evaluation of the Cenomanian Middle Sarvak (Ahmadi)... Journal of Petroleum Science and Technology
http://jpst.ripi.ir
113
Journal of Petroleum Science and Technology 2017, 7(3),100-116© 2017 Research Institute of Petroleum Industry (RIPI)
Figure 14: Regional variation of Ro data for the middle Sarvak formation in the Persian Gulf.
Figure 15: Depth map of the middle Sarvak formation; Qatar-Fars Arc Paleo-high represents the minimum depth for the middle Sarvak formation.
Mea
n Ro
(%)
Well NamePersian Gulf
(m)
Persian Gulf
M. Mirshahani, M. Kassaie, and A. ZeinalzadehJournal of PetroleumScience and Technology
Journal of Petroleum Science and Technology 2017, 7(3), 100-116© 2017 Research Institute of Petroleum Industry (RIPI)114
http://jpst.ripi.ir
Figure 16: Organic matter of the middle Sarvak formation under transmitted light.
CONCLUSIONSIn this study, the source rock potential of 76 cutting
samples from the middle Sarvak formation in the
Persian Gulf were investigated. This investigation
was based on the gathered data such as source rock
richness, quality, distribution, and maturity which
were obtained from Rock-Eval, vitrinite reflectance,
and palynofacies analyses.
In summary, based on the Rock-Eval pyrolysis results,
the variation of organic matter quality- and quantity-
dependent parameters indicates Type II/III kerogen in
the western and eastern blocks (A and D) and Type
III kerogen in block B and C . The result of this study
shows that middle Sarvak formation is immature in
the central area of the Persian Gulf. The existence of
Qatar-Fars Arc causes uplift in this region and can be
a reason for immaturity in this part of the study area.
In contrast to the central part, the middle Sarvak
formation has entered to oil window in the eastern
and western areas. The overall asymmetric nature of
the basin in combination with shallower basement
in the central parts with respect to the eastern and
western regions resulted in the different trend of
maturity in the study area. The higher maturity in the
eastern and western regions can be attributed to the
increasing burial depth and thickness of this formation
toward the northwest and east.
ACKNOWLEDGMENTSThis work was conducted as a part of Pearl Program
Research which is shared project between Iranian
Offshore Oil Company (IOOC) and RIPI. The authors
gratefully acknowledge Iranian Offshore Oil Company
IOOC staff, especially Dr. Ali Chehrazi for the financial
support of the project. Also, we appreciate Prof.
Kotarba for assistance with the Rock Eval pyrolysis at
RIPI and AGH university of Poland respectively.
REFERENCES1. Ghazban F., “Petroleum Geology of the Persian
Gulf,” Tehran University, 2007.
2. Bordenave M. L. and Burwood R., “Source
Rock Distribution and Maturation in the Zagros
Orogenic Belt: Provenance of the Asmari and
Bangestan Reservoir Oil Accumulations,” Organic
Geochemistry, 1990, 16(1), 369-387.
3. Bordenave M. L. and Huc A. Y., “The Cretaceous
Source Rocks in the Zagros Foothills of Iran: An
Example of a Large Size Intracratonic Basin,” AAPG
Bulletin. 77. CONF-930306, 1993.
4. Bordenave M. L. “The Middle Cretaceous to Early
Miocene Petroleum System in the Zagros Domain
of Iran, and its Prospect Evaluation,” AAPG Annual

Source Rock Evaluation of the Cenomanian Middle Sarvak (Ahmadi)... Journal of Petroleum Science and Technology
http://jpst.ripi.ir
115
Journal of Petroleum Science and Technology 2017, 7(3),100-116© 2017 Research Institute of Petroleum Industry (RIPI)
Meeting, Houston, Texas, 2002.
5. Beiranvand B., Ahmad. A., and Sharafodin M.,
“Mapping and Classifying Flow Units in the Upper
Part of the Mid-cretaceous Sarvak Formation
(Western Dezful Embayment, SW Iran) Based on
a Determination of Reservoir Rock Types,” Journal
of Petroleum Geology, 2007, 30(4), 357-373.
6. Kent P., “The Emergent Hormuz Salt Plugs of
Southern Iran,” Journal of Petroleum Geology,
1979, 2, 117-144.
7. Murris R. J., “Middle East-Stratigraphic Evolution
and Oil Habitat,” ABSTRACT. AAPG Bulletin, 1981,
65, 1358-1358.
8. Alsharhan A., “Oxfordian-Kimmeridgian Diyab
Formation as a Major Source Rock Unit in
Southern Arabian Gulf,” The Society for Organic
Petrology (TSOP), 18th Annual Meeting, 2001
9. Alsharhan A. and Magara, K., “The Jurassic of the
Arabian Gulf Basin: Facies, Depositional Setting
and Hydrocarbon Habitat,” Global Environments
and Resources, 1994, 17, 397-412.
10. Lasemi Y. and Jalilian A., “The Middle Jurassic
Basinal Deposits of the Surmeh Formation in the
Central Zagros Mountains, Southwest Iran: Facies,
Sequence Stratigraphy, and Controls,” Carbonates
and Evaporites, 2010, 25(4), 283-295.
11. Alsharhan A. and Kendall C. S. C., “Cretaceous
Chronostratigraphy, Unconformities and Eustatic
Sea Level Changes in the Sediments of Abu Dhabi,
United Arab Emirates,” Cretaceous Research,
1991, 12, 379-401.
12. Van Buchem F. S., Razin P., Homewood P. W.,
Oterdoom W. H., and Philip J., “Stratigraphic
Organization of Carbonate Ramps and Organic-
rich Intrashelf Basins: Natih Formation (Middle
Cretaceous) of Northern Oman,” AAPG Bulletin,
2002, 86, 21-53.
13. Vincent B., van Buchem F. S., Bulot L. G., Jalali
M., et al., “Depositional Sequences, Diagenesis
and Structural Control of the Albian to Turonian
Carbonate Platform Systems in Coastal Fars (SW
Iran),” Marine and Petroleum Geology, 2015, 63,
46-67.
14. Alsharhan A. and Nairn A., “Carbonate Platform
Models of Arabian Cretaceous Reservoirs,” AAPG
Special Publications, 1993, 56, 173-184.
15. Faqira M., Rademakers M., and Afifi A., “New
Insights into the Hercynian Orogeny, and their
Implications for the Paleozoic Hydrocarbon
System in the Arabian Plate,” GeoArabia, 2009,
14, 199-228.
16. Soleimany B., Nalpas T. i., and Montserrat F. S.,
“Multidetachment Analogue Models of Fold
Reactivation in Transpression: the NW Persian
Gulf,” Geologica Acta: an International Earth
Science Journal, 2013, 11, 265-276.
17. Jordan J. r., Connolly J. r., and Vest H. A., “Middle
Cretaceous Carbonates of the Mishrif Formation,
Fateh Field, Offshore Dubai, UAE,” Carbonate
Petroleum Reservoirs, Springer, 1985, 425-442.
18. Aali J., Rahimpour-Bonab H. and Kamali M. R.,
“Geochemistry and Origin of the Worlds Largest
Gas Field from Persian Gulf, Iran,” Journal of
Petroleum Science and Engineering, 2006, 50,
161-175.
19. Ziegler M. A., “Late Permian to Holocene
Palynofacies Evolution of the Arabian Plate and its
Hydrocarbon Occurrences,” Journal of Geoarabia,
2001, 6, 445-504.
20. Perotti C. R., Bertozzi G., Feltre L., Rahimi M., et al.,
“The Qatar-South Fars Arch Development (Arabian
Platform, Persian Gulf): Insights from Seismic
Interpretation and Analogue Modelling,” INTECH
Open Access Publisher, 2011.
21. Ghazban F. and Al-Aasm I. S., “Hydrocarbon-
induced Diagenetic Dolomite and Pyrite

M. Mirshahani, M. Kassaie, and A. ZeinalzadehJournal of PetroleumScience and Technology
Journal of Petroleum Science and Technology 2017, 7(3), 100-116© 2017 Research Institute of Petroleum Industry (RIPI)116
http://jpst.ripi.ir
Formation Associated with the Hormoz Island
Salt Dome, Offshore Iran,” Journal of Petroleum
Geology, 2010, 33, 183-196.
22. Mashhadi Z. S., Rabbani A. R., Kamali M. R.,
Mirshahani M., et al., “Burial and Thermal Maturity
Modeling of the Middle Cretaceous–Early Miocene
Petroleum System, Iranian Sector of the Persian
Gulf,” Petroleum Science, 2015, 12, 367-390.
23. Sharland P. R., Archer R., Casey D., Davies,R., et al.,
“Arabian Plate Sequence Stratigraphy,” GeoArabia,
Journal of the Middle East Petroleum Geosciences,
2013, 18, 56-74.
24. Mina P., Razaghnia M. T. , and ParanY., “Geological
and geophysical studies and exploratory drilling
of the Iranian continental shelf–Persian Gulf,” 7th
World Petroleum Congress, World Petroleum
Congress, 1967.
25. Taylor G. H., “Organic Petrology: Berlin,” Gebrüder
Borntraeger, 1998.
26. Peters K. E. and Cassa M. R., “Applied Source
Rock Geochemistry,” Chapter 5: Part II, Essential
Elements, 1994, 93-120.
27. Kenneth E. P., Walters C. C., and Moldowan J. M.,
“The Biomarker Guide: Biomarkers and Isotopes in
the Environment and Human History,” Cambridge
University Press, 2005.
28. Hunt J. M., “Petroleum Geology and Geochemistry,”
Freeman and Company, New York, 1996.
29. Krevelen D. W., “Coal-typology, Chemistry, Physics,
Constitution,” Elsevier Science and Technology, 3,
1961.
30. Magoon L. B. and Wallace G. D., “The Petroleum
System-from Source to Trap,” AAPG Memoir, 1994,
60, 3-24.
31. Langford F. F. and Blanc-Valleron M. M.,
“Interpreting Rock-Eval Pyrolysis Data Using Graphs
of Pyrolizable Hydrocarbons vs. Total Organic
Carbon,” AAPG Bulletin, 1990, 74(6), 799-804.