sources and fate of chromium in drinking water...
TRANSCRIPT

Phil Brandhuber PhDHDR
Rengao Song PhDLWC
Sources and Fate of Chromium in Drinking Water Systems
CA – NV Section Fall Conference October 2, 2013
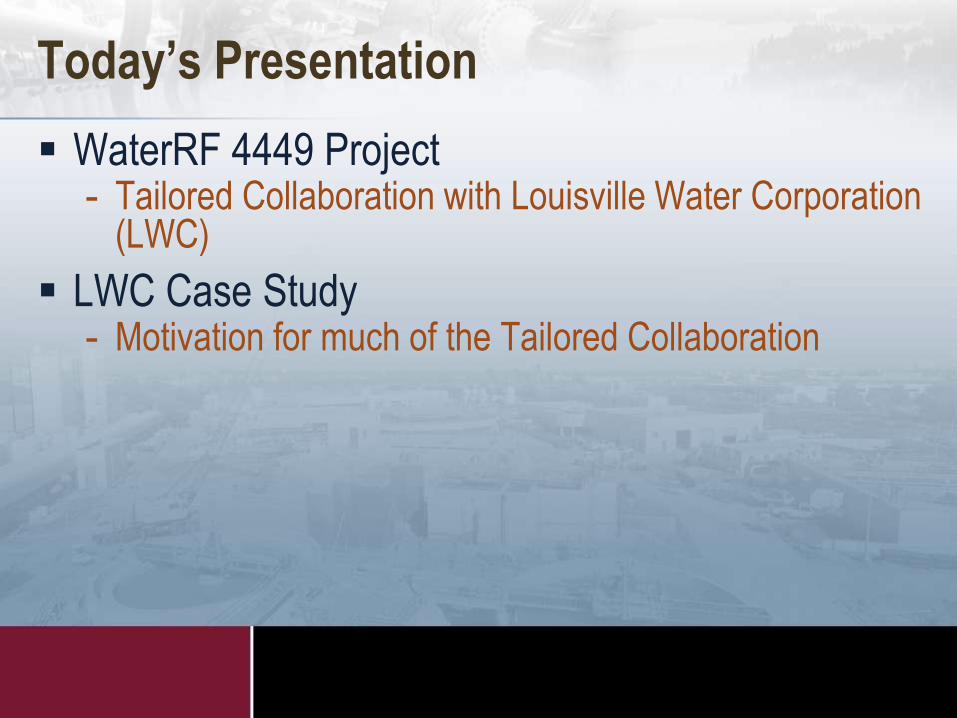
Today’s Presentation
WaterRF 4449 Project- Tailored Collaboration with Louisville Water Corporation
(LWC)
LWC Case Study- Motivation for much of the Tailored Collaboration

WRF 4449 Project Objectives
Measure chromium sources and sinks - Treatment plants - Distribution systems
Bench level evaluation of reduction coagulation filtration (RCF) process- Multiple source waters- Ferrous/ferric blends
Develop chromium control approaches - Develop specific chromium control strategies for
participating utilities

Project Team
Sponsoring Utility
- Louisville Water Company
Participating Utilities
- Madison Water Utility
- Tulsa Municipal Utility Authority
- City of Norman, OK
- San Jose Water Company
Investigators
- PI => Phil Brandhuber PhD (HDR)
- Co-PI => Rengao Song PhD (LWC)
Research Manager
- Mary Smith

Chromium isn’t Unique to California(!)
Location of participating utilities
Reference USEPA

Characteristics of Participating Utilities
Utility Water source Infrastructure Treatment Type Anticipated
CrVI LevelsLouisville
Water
Company, KY
Ohio River 2 WTPs Conventional softening, river
bank filtration, chloramine
residual
Low
City of
Norman, OK
Lake
Thunderbird,
Garber-Wellington
Aquifer
1 WTP
36 wells
SW: Conventional softening
GW: Arsenic treatment for 3
wells, no treatment for the rest.
Chlorine residual.
Elevated
City of Tulsa,
OK
Lake Oologah,
Lake Eucha,
Lake Spavinaw
2 WTPs Conventional with GAC
Chlorine residual.
Low
San Jose Water
Company , CA
Groundwater
Surface water,
Purchased water
2 WTPs
100 wells
Chloramine or chlorine residual. Elevated
City of
Madison, WI
Groundwater 23 wells Chlorine residual; fluoride
addition
Elevated
Low : < 1 ppb
Elevated: ≥ 1 ppb

Chromium Mass Balance in Water System

Factors Influencing Speciation in System

Differences Between Plant and Distribution System
Raw
Water
Treatment
ChemicalDistributed
Water
Waste
Short time periods
Many chemicals
Large changes to equilibrium
Plant sampling
Distributed
WaterRaw Water
Long time periods
Large surface areas
Moving to equilibrium
Distribution system sampling

What Factors May Impact Cr Fate or Speciation?
Treatment Plant Distribution System
Oxidants
Treatment
Chemicals
Treatment
Processes
Treatment
Residuals
Disinfectant
Residual
Water Age System
Materials
Ozone
Chlorine
Chloramine
Permanganate
Chlorine
dioxide
Ferric Chloride
Ferric sulfate
Lime
Alum
Conventional
Softening
NF/RO
membrane
Ozone
generation
Chlorine
dioxide
generation
Filter
Backwash
Membrane
Concentrate
Sludges
Recycle water
Chlorine
Chloramine
With and
without
boosting
EPDS
ART
MRT
Ductile iron
Cast iron
AC
PVC

Plan for Source and Sinks Sampling
Similar approach as
McNeill and McLean
Repeat quarterly
over 1 year period
Plant sampling
- LWC
- Tulsa
DS sampling
- Norman
- Madison
- San Jose

RCF Bench Testing
Take advantage of range of water qualities available
from participating utilities
Perform jar tests
- Ferric/ferrous mixes
- Aeration requirements
- Presence of oxidants
- Performance predictions

Chromium Control Plan
“Top level” assessment of
Cr(VI) treatment impact
Assess (desk top)
- Technology
- Approach
- Cost
Insights into treatment
approach for distributed
source systems

Two water treatment plants:- 180 MGD Crescent Hill WTP: Conventional treatment using
Ohio River as source water
- 60 MGD B. E. Payne WTP: River Bank Filtration (RBF) of Ohio River water with conventional treatment and lime softening
- Both plants use chloramines as secondary disinfectant
Not concerned about Cr(VI) until release of EWGReport in 2010
Case Study - Louisville Water Company

B. E. Payne Plant Treatment Process

Sample Date Jan, 2011 April, 2011 July, 2011
Source RBF/River Blended 100% RBF 100% RBF
Location of lime
addition
Prior to softening
basin
Prior to softening
basinHead of plant
Raw (RBF) <0.02 <0.02 <0.02
After lime
addition0.14 0.27 0.03
After chlorine
addition0.19 0.35 0.09
Finished 0.22 0.35 0.04
Distribution
system0.27 0.35 0.04
BEP Cr(VI) Sampling
Cr(VI) in ug/L
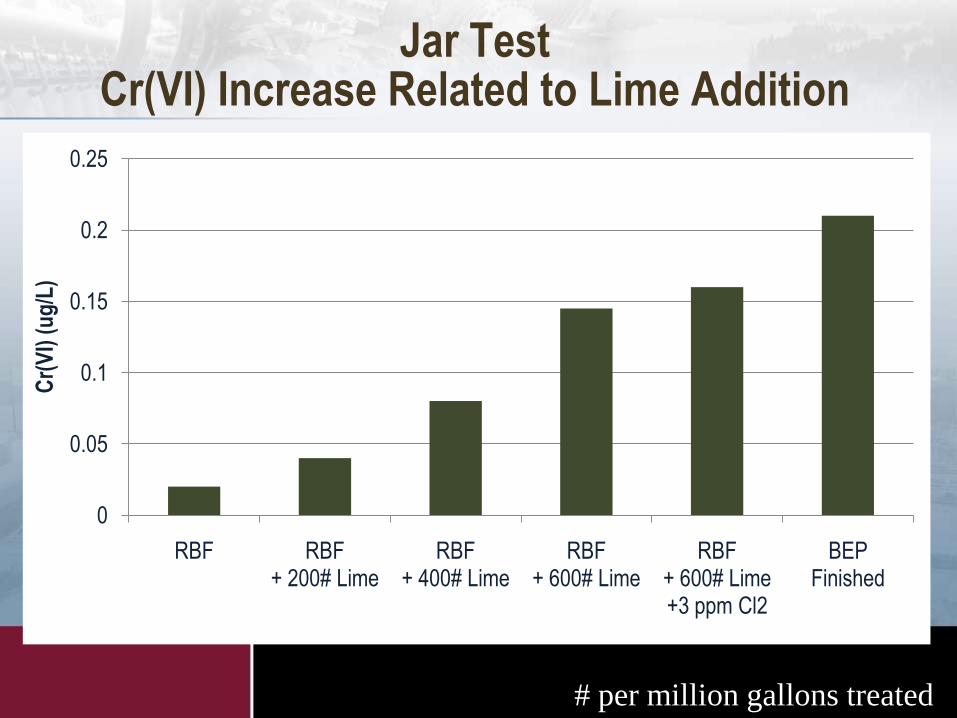
Jar Test Cr(VI) Increase Related to Lime Addition
0
0.05
0.1
0.15
0.2
0.25
RBF RBF + 200# Lime
RBF + 400# Lime
RBF + 600# Lime
RBF + 600# Lime +3 ppm Cl2
BEP Finished
Cr(
VI)
(u
g/L
)
# per million gallons treated
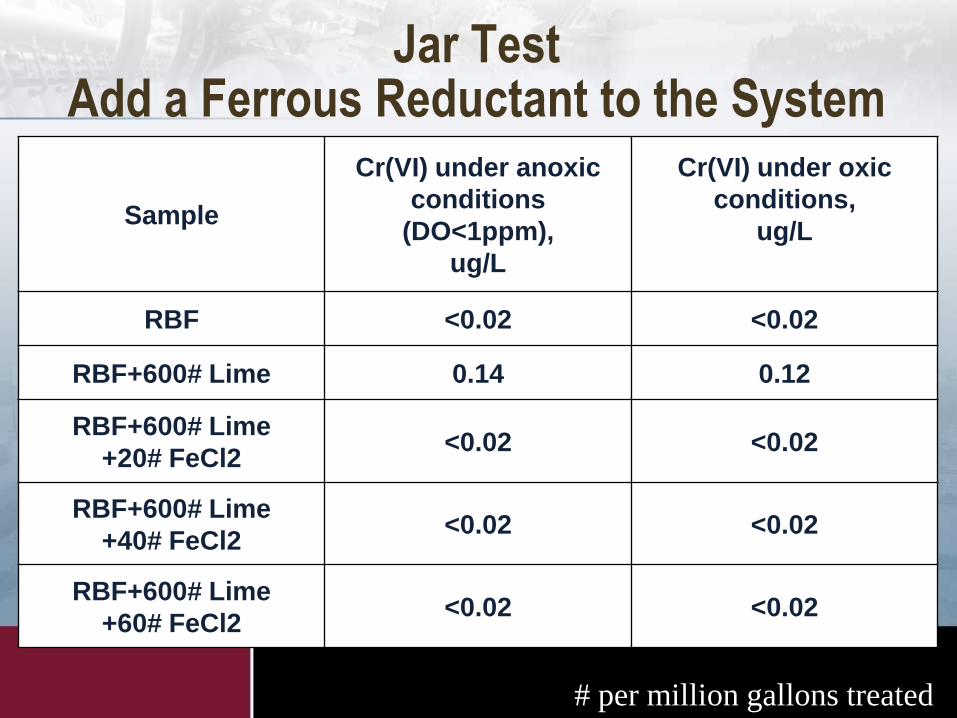
Jar TestAdd a Ferrous Reductant to the System
Sample
Cr(VI) under anoxic
conditions
(DO<1ppm),
ug/L
Cr(VI) under oxic
conditions,
ug/L
RBF <0.02 <0.02
RBF+600# Lime 0.14 0.12
RBF+600# Lime
+20# FeCl2<0.02 <0.02
RBF+600# Lime
+40# FeCl2<0.02 <0.02
RBF+600# Lime
+60# FeCl2<0.02 <0.02
# per million gallons treated

SampleCr(VI) (ug/L)
0.1 ug/L Cr(VI) Spike 10 ug/L Cr(VI) Spike
Ohio River 0.07 0.07
Ohio River + spike 0.18 10
Ferric/Ferrous (0#/100#) <0.02 0.03
Ferric/Ferrous (30#/70#) <0.02 0.03
Ferric/Ferrous (50#/50#) <0.02 <0.02
Ferric/Ferrous (70#/30#) <0.02 0.02
Ferric/Ferrous (100#/0#) 0.14 9
# per million gallons treated
Jar TestFeasibility of a Ferric/Ferrous Blend

Full Scale TestImpact of Ferrous Addition on Cr(VI) Concentration
0
0.02
0.04
0.06
0.08
0.1
0.12
0.14
0.16
RBF After Lime Addition (550#)
Basin 1 - With Ferrous Addition
(1 ppm)
Basin 2 - Without Ferrous Addition
Cr(
VI)
(u
g/L
)
ND
# per million gallons treated

Full ScaleImpact of ‘Background’ and ‘Added’ Ferrous
0
0.05
0.1
0.15
0.2
0.25
0.3
0.35
0.4
0.45
0.5
Lime applied at softening basin
Lime applied at head of plant Lime + 0.5 ppm FeCl2 applied at head of plant
Cr(
VI)
(u
g/L
)

Conclusions
WaterRF 4449 Project- Get better handle on sources and fate of Cr
LWC Case Study- Potential for Cr(VI) from contamination
• Relevance to 10 ppb MCL
- May be simple was to implement ferrous reduction

Yes, it did rain a lot in Colorado