sources and methods to compile quarterly non-financial ... · quarterly non-financial accounts by...
TRANSCRIPT

Quarterly Non-financial Accounts by Institutional Sector (QSA) in Belgium
ESA 2010
Sources and Methods
Third edition
February 2016

2.
Quarterly Non-financial Accounts by Institutional Sector
Sources and Methods ESA 2010 Third edition (March 2016)
BELGIUM
Table of contents
1. General description ...................................................................................................................... 4 1.1. Organisational aspects ........................................................................................................ 4 1.2. Sources................................................................................................................................ 5 1.3. Methods ............................................................................................................................... 7
1.3.1. General description ...................................................................................................... 7 1.3.2. Exhaustiveness and balancing ..................................................................................... 8 1.3.3. Use of econometric modelling ...................................................................................... 9 1.3.4. Plausibility checks ...................................................................................................... 10 1.3.5. Technical framework .................................................................................................. 10
1.4. Consistency with related datasets ..................................................................................... 10 1.4.1. Consistency with annual data .................................................................................... 10 1.4.2. Consistency with main aggregates of sector S1 (QNA) ............................................. 10 1.4.3. Consistency with government data (QNFAGG) ......................................................... 11 1.4.4. Consistency with Bop data (BPM6 version) ............................................................... 11 1.4.5. Consistency with financial accounts ........................................................................... 11
1.5. Short description of the methods used to estimate back data .......................................... 11 1.6. Seasonal adjustment policy ............................................................................................... 12 1.7. Release and revision policy ............................................................................................... 12
1.7.1. Release policy ............................................................................................................ 12 1.7.2. Revision policy ........................................................................................................... 13
1.8. Remarks or problems ........................................................................................................ 13 1.9. Future plans ....................................................................................................................... 13
2. Description by transaction ........................................................................................................ 14 2.1. General remarks ................................................................................................................ 14 2.2. Overall picture ................................................................................................................... 14 2.3. Detailed review of transactions ......................................................................................... 14
2.3.1. Output (P.1) and intermediate consumption (P.2)...................................................... 14 2.3.2. Value added, gross (B1.g) .......................................................................................... 14 2.3.3. Final consumption expenditure (P.3) ......................................................................... 16 2.3.4. Gross capital formation (P.5)...................................................................................... 17
2.3.5. Exports (P.6) and imports (P.7) of goods and services ............................................. 19 2.3.6. Compensation of employees (D.1) ............................................................................. 19 2.3.7. Taxes on production and imports (D.2) ...................................................................... 21
2.3.8. Subsidies (D.3) ........................................................................................................... 23
1.7.2.1. Major revisions (consistency with updated annual data) ...................................... 13 1.7.2.2. Revisions of data for the latest quarters ............................................................... 13 1.7.2.3. Methodological revisions ....................................................................................... 13
2.3.4.1. Gross fixed capital formation (P.51) ...................................................................... 17 2.3.4.2. Changes in inventories and acquisitions less disposals of valuables (P.5N) ....... 18
2.3.7.1. Taxes on products (D.21) ...................................................................................... 21 2.3.7.2. Other taxes on production (D.29) .......................................................................... 21

3.
2.3.9. Interest (D.41) ............................................................................................................ 25 2.3.10. Property income other than interest (D.4N) ............................................................... 27
2.3.11. Current taxes on income, wealth, etc. (D.5) ............................................................... 36 2.3.12. Social contributions (D.61) ......................................................................................... 37
2.3.13. Social benefits other than social transfers in kind (D.62) ........................................... 39 2.3.14. Social transfers in kind (D.63) .................................................................................... 41 2.3.15. Other current transfers (D.7) ...................................................................................... 42
2.3.16. Adjustment for the change in net equity of households in pension funds
reserves (D.8) ............................................................................................................. 46 2.3.17. Capital transfers (D.9) ................................................................................................ 47
2.3.18. Consumption of fixed capital (P51C) .......................................................................... 49 2.3.19. Acquisitions less disposals of non-financial non-produced assets (NP) .................... 49
Boxes
Relative importance of pre-existing data and appropriate estimates of missing data for non-
financial corporations, financial corporations and households............................................ 5
Additional explanation for the estimation of quarterly profile of dividends paid by resident
enterprises......................................................................................................................... 28
Tables
Table 1 - Residual sector selected to balance QSA..................................................................... 8
Table 2 - Breakdown of value added by industry between institutional...................................... 14
Table 3 - Breakdown of the quarterly compensation of employees paid between institutional
sectors.......................................................................................................................... 19
Table 4 - Quarterly profile of dividends paid by Belgian corporations........................................ 27
Table 5 - Quarterly profile of dividends paid by the rest of the world according to national
accounts..................................................................................................................... 28
Table 6 - Quarterly profile of dividends received by the rest of the world according to national
accounts................................................................................................................ 29
Table 7 - Method used to estimate annual dividends................................................................ 30
Annexes
Methodology by transaction - Overall picture............................................................................. 51
2.3.8.1. Subsidies on products (D.31) ................................................................................ 23 2.3.8.2. Other subsidies on production (D.39) ................................................................... 23
2.3.10.1. Dividends (D.421) ............................................................................................ 27 2.3.10.2. Withdrawals from the income of quasi-corporations (D.422) .......................... 30 2.3.10.3. Reinvested earnings on direct foreign investment (D.43) ............................... 30 2.3.10.4. Property income attributable to insurance policy holders (D.441)
+Investment income payable on pension entitlements (D.442) ............................ 33 2.3.10.5. Investment income attributable to collective investment fund (CIF)
shareholders (D.443) ............................................................................................ 34 2.3.10.6. Rents (D.45) .................................................................................................... 35
2.3.12.1. Actual social contributions (D61x = D.611 + D.613 + D.614 + D.61SC) ......... 37 2.3.12.2. Imputed social contributions (D.612) ............................................................... 38
2.3.15.1. Net non-life insurance premiums (D.71) .......................................................... 42 2.3.15.2. Non-life insurance claims (D.72) ..................................................................... 42 2.3.15.3. Other current transfers (D.7N) ......................................................................... 43
2.3.17.1. Capital taxes (D.91) ......................................................................................... 47 2.3.17.2. Investments grants and other capital transfers (D.9N) .................................... 48

4.
1. GENERAL DESCRIPTION
1.1. ORGANISATIONAL ASPECTS
Quarterly non-financial sector accounts (QSA) are established within the "National / regional
accounts and business surveys" division of the National Bank of Belgium's General Statistics
Department, on behalf of the National Accounts Institute (NAI).
Annual and quarterly sector accounts are compiled within the same division of the NBB, as well as
the most important inputs such as main aggregates and government accounts.
Financial accounts are established within the "Financial statistics" division of the General Statistics
Department.
Balance of payments (Bop) data are established within the “External statistics” division.
An organization chart of the General Statistics Department is provided below.
Contact persons are:
Béatrice Thiry ([email protected]) and Catherine Rigo ([email protected])

5.
1.2. SOURCES
Two main pre-existing quarterly data sets serve as input when establishing QSA:
The quarterly main aggregates for the whole economy (S.1) which are published each quarter
by the NAI, with a delay of 60 days after the closing date of the quarter.
The quarterly accounts for general government (S.13) which are compiled independently of the
accounts for other sectors, with a delay of 85 days after the closing date of the quarter.
The quarterly main aggregates (QNA) are based on the following short-term information:
o industrial production indices (first version available at t+40 days); o VAT data (first confidential version available at t+50 days); o social security data (first version available at t+4 months); o Bop data (first version available at t+45 days);
The quarterly non-financial accounts of general government (QNFAGG) is based on indicators related to general government taxes and expenditure :
o tax revenue (available at t+80 days) o non-fiscal and non-parafiscal revenue: specific information is available for certain headings
(inter-municipal body dividends, non-recurrent exceptional payments, etc); o interest payments on the federal authority’s public debt (available at t+60 days); o other expenditure by the federal authority, communities and regions: trend for total
expenditure is available at t+45 days, together with certain non-recurrent exceptional expenditure;
o social contributions paid to the National Social Security Office (NSSO) (available at t+80 days)
Pre-existing data are not sufficient to compile complete QSA. To estimate quarterly missing direct
information, different methods have been adopted depending on the availability of additional
sources of information or indicators (cf. 1.3 below). In some cases, specific methods have been
developed which take into account additional information stemming from:
o balance sheets of non-financial companies (exhaustive administrative annual source);
o financial accounts (quarterly source);
o MIR data on interest rate (monthly source)
o reporting schemes of financial corporations (exhaustive, partly annual, partly quarterly
source);
o Belgian Bop (quarterly source);
o Bop of European institutions (quarterly source);
o National Social Security Office data (quarterly administrative exhaustive source).
In some other cases (when no indicator is available), a simple linear trend is defined.
To guarantee the overall consistency of sector accounts, some transactions are also calculated as
residual items to balance the system throughout the institutional sectors and on the basis of the
identity that, for the total of institutional sectors, the resources must equal the uses.
As most of the pre-existing quarterly data are already available for the total economy (S.1), the
general government (S.13) and the rest of the world (S.2), the estimate of the remaining
transactions based on additional information and specific methods mainly concerns the accounts
for non-financial corporations (S.11), financial corporations (S.12) and households 1 (S.1M).
Defining linear trends or calculating items as balancing transactions occur for a set of transactions
1 As stated in the European Parliament and Council Regulation 1161/2005, quarterly sector accounts are built up for
households (S.14) together with NPISH's (S.15). In the present document, the grouping of both institutional sectors is mentioned with the codification S.1M.

6.
which are not amongst the most critical one, as illustrated in Box 1.
Thanks to the approach used, an efficient production of robust QSA in a short time can be ensured.
This also allows meeting the requirements set out in Article 5/2 of the European Parliament and
Council Regulation 1161/2005 which imposes QSA to be consistent with the quarterly non-financial
accounts for the general government and the quarterly main aggregates of the total economy. As
stated in the same regulation (Article 5/3), QSA are also always completely aligned with the
corresponding annual data transmitted under the data transmission programme of the ESA2010
Regulation.
Box - Relative importance of pre-existing data and appropriate estimates of missing data for
non-financial corporations, financial corporations and households
QSA are build up by incorporating pre-existing data which have to be filled in with appropriate
estimates when items (transactions) are missing.
The relative importance of pre-existing data is illustrated below for non-financial and financial
corporations separately and for households. The tables show, for the account of each of these
institutional sectors, the number of transactions 2 and the total and average amount of these
transactions which come directly from pre-existing data i.e. mainly quarterly main aggregates for
the whole economy or counterpart of quarterly accounts for general government or Bop series. If
the transactions for which a specific estimate method using ad hoc information has been developed
are consolidated with the pre-existing data sets, it appears that these data represent the substance
of the accounts as they count for some 73 to 94% of the total amount of transactions, depending on
the institutional sector3. These transactions generally concern the main items as their average
amount is quite large. On the other side, the average amount of transactions which are estimated
with a trend or as residual item is more limited. These transactions count for some 6% to 13% of
the total amount of all the relevant transactions for households and non-financial corporations.
They represent some 27% of the relevant flows in the case of financial corporations.
Components of the quarterly non-financial corporations account (S.11)
Pre-existing data and
specific estimates Other (trends and
residual items)
Number of relevant variables 15 20
Cumulative amount (millions euro) 123,365 17,671
% of total 87.5% 12.5%
Average amount per relevant variable (millions euro)
8,218 884
Components of the quarterly financial corporations account (S.12)
Pre-existing data and
specific estimates Other (trends and
residual items)
Number of relevant variables 15 22
Cumulative amount (millions euro) 32,063 13,201
% of total 70.8% 29.2%
Average amount per relevant variable (millions euro)
2,138 600
2 When methods have been defined for sub-transactions, higher-level transactions have not been considered as relevant
transactions in the present assessment exercise. The relevant transactions appear on the resources or on the uses side of the account.
3 Calculations have been drawn for the four quarters of 2012 (as established for the January 2016 transmission) and averaged.

7.
Components of the quarterly households account (S.1M)
Pre-existing data and
specific estimates Other (trends and
residual items)
Number of relevant variables 19 20
Cumulative amount (millions euro) 175,005 1,038
% of total 89.4% 10,6%
Average amount per relevant variable (millions euro)
9,211 1,038
1.3. METHODS
1.3.1. General description
Three sets of transactions can be drawn according to their quarterly availability.
(A) For the following transactions, quarterly data are available by institutional sector:
(B) The following transactions are available on a quarterly basis for the total economy (S.1) but
have to be broken down amongst the institutional sectors:
For the two first items of this second group, a specific method to break down quarterly data
by institutional sector has been developed: the breakdown by institutional sectors of
quarterly value added and quarterly gross fixed capital formation is estimated with reference
to a corresponding annual key that is applied to quarterly data. For added value, such a
breakdown by sector is calculated for each industry.
For the other transactions, a simple smoothing method of annual figures (Chow and Lin or
Fernandez method with a linear temporal series as indicator) is used together with balancing
procedures that preserve consistency with the whole economy constraints.
(C) For the following transactions, no pre-existing quarterly information is known:
- final consumption expenditure (P.31 and P.32) - exports and imports of goods and services (P.6 and P.7) - taxes and subsidies on products (D.21 and D.31) - current taxes on income, wealth (D.5) - social contributions relating to the State social security system (part of D.61) - social benefits other than transfers in kind and relating to the State social security system
(part of D.62) - social transfers in kind (D.63) - current international cooperation (D.74) - VAT and GNI based EU own resources (D.76) - capital taxes (D.91) - complete sequence of government account.
- value added (B.1.g) (availability by 38 industries) - compensation of employees (D.1)
- gross capital formation (P.5) - other taxes on production (D.29) - other subsidies on production (D.39) - consumption of fixed capital (P.51c) - acquisitions less disposals of non-financial non-produced assets (NP).

8.
A specific method to build up quarterly data has been developed for the following
transactions: D.41, D.42, D.43, D.443, by collecting information coming from the balance
sheets of non-financial companies, the reporting schemes of financial corporations, financial
accounts and the Bop data.
In the other cases, a simple smoothing method of annual figures is used (Chow and Lin or
Fernandez method with a linear temporal series as indicator) with due regard for accounting
constraints.
1.3.2. Exhaustiveness and balancing
The methodology ensures exhaustiveness of the whole dataset.
Procedures are systematically applied to guarantee that:
The sum of the data for the four quarters of a year is equal to the annual data :
YQi
This is de facto the case when using pre-existing quarterly data which are consistent with
annual data.
(In September, where new released annual data have not been converted yet in new official quarterly data that must
be incorporated within the QSA as an external input, a procedure for the specific purpose of QSA is proceed to
generate new quarterly series that are aligned with the new annual data. This procedure generates a new quarterly
time series aligned on the new annual one by using the “old” quarterly time series as an indicator.)
The smoothing method mentioned above also guarantees that the sum of quarters equals the
annual data.
Accounting constraints are met (horizontal consistency).
(a) for each transaction, quarterly data for the whole economy are equal to the sum of
quarterly data for the different domestic institutional sectors:
M1.S13.S12.S11.S1.S and
(b) for each distributive transaction, total resources equal total uses:
)2.S1.S_(TOT)2.S1.S_(TOTuseres
Whether the total is calculated on the resources side or on the uses side of an account depends
for each transaction on the information available on each side. The total is calculated on one
side, as the sum of the data for the domestic sectors and the rest of the world. It is then used as
a constraint on the other side of the account and an institutional sector is chosen to be the
o interest income (D.41) o distributed income from corporations (D.42) o reinvested earnings on direct foreign investment (D.43) o other investment income (D.44) o rent (D.45) o items related to insurance transaction (part of D.61 and D.62, D.71, D.72, D.8) o miscellaneous current transfers other than related to S.13 (D.75) o capital transfers other than related to S.13 (D.92+D.99)

9.
residual sector which balances the system. The "residual sector" is either S.11 or S.1M,
depending on the transaction4.
No residual sector is defined for transactions whose quarterly pattern is built up using a specific
method (D.41, D.42, D.43, D.44, D.75, D.92+D.99).
Table 1 - Residual sector selected to balance QSA
Transaction Total constraint (S1+S2)
calculated on :
Residual sector
P.52+P.53 (=P.5N) ---- S.11
D.1 uses side S.1M_res
D.29 resources side S.11_use
D.39 uses side S.11_res
D.45 uses side S.1M_res
D.61 resources side S.1M_use
D.62 uses side S.1M_res
D.63 uses side S.1M_res
D.71 resources side S.1M_use
D.72 uses side S.1M_res
D.8 uses side S.1M_res
P51C ---- S.11
NP ---- S.11
ESA2010 balancing items in the sequence of accounts are calculated on the basis of the upstream
transactions except value added (B.2, B.5, B.6, B.8 and B.9). Value added (B.1) for the total
economy is calculated as the sum of the value added of the domestic sectors.
1.3.3. Use of econometric modelling
Given the large availability of quarterly information and the chosen approach, there is no need for
an econometric modelling in the Belgian QSA. In the cases of missing quarterly data i.e. when
there is no pre-existing quarterly data, when no specific methodology has been developed, when a
transaction cannot be estimated as a residual item to balance the system and when there is no
appropriate indicator, quarterly data are estimated by smoothing out the corresponding annual
figure over the four quarters of the year, by applying a linear trend5. The smoothing out of annual
data is obtained by using the Chow and Lin (or Fernandez) method with a linear temporal series as
indicator. The choice of a smooth distribution is not only justified by the unavailability of adequate
quarterly indicators but also by the limited annual amounts involved or by the fact that the
transaction concerned by the smoothing method can reasonably be considered as quite stable
from quarter to quarter.
If the smoothing method generates quarterly negative values, manual adjustments are introduced,
generally by dragging, within a same year, the negative value to the previous or next quarter that
displays a positive value. This procedure applies to a very few series of limited value. When annual
accounts are not yet available, quarterly data for the transactions concerned by the smoothing
method are built up by extending the linear trend.
In order to smooth data, as for seasonal adjustment (see 1.6), software JDemetra+ is used.
4 This depends on the "expert judgment". The greater the relative size of one sector for a specific transaction is, the better
it is to be chosen as a residual item. It can then absorb the changes in the data imputed to the others sectors without being too much affected (in relative terms) and with a limited risk to become negative.
5 The annual amounts are not divided by 4 in order to avoid an artificial break between the fourth quarter and the first quarter of the subsequent year.

10.
1.3.4. Plausibility checks
Data is monitored as regards internal consistency and consistency with other datasets (ASA, QNA,
QNFAGG). There is also a regular revision analysis. Outliers are monitored, especially in the
government account. Metadata is provided each quarter to Eurostat, according to the agreed
template among TF-QSA members.
1.3.5. Technical framework
QSA are mainly established on the basis of Excel sheets.
Quarterly disaggregation of annual data (on the basis of indicators or linear) are computed with the
help of JDemetra+. Seasonal and working days adjustments are computed with JDemetra+.
1.4. CONSISTENCY WITH RELATED DATASETS
1.4.1. Consistency with annual data
By construction, QSA data are always consistent with corresponding annual data. The same
consolidation rules apply to all involved data sets (ASA, QSA, QNFAGG).
1.4.2. Consistency with main aggregates of sector S1 (QNA)
Some main aggregates transmitted to Eurostat in Table 1 (60 days after the end of the quarter) are
integrated into QSA for the whole period of transmission. This concerns the following transactions:
For other items, discrepancies between data transmitted in Table 1 and QSA might occur. This
relates with the establishment of priorities in the available sources of data when QSA are compiled:
general government data transmitted 85 days after the end of the quarter, always have priority over
the data transmitted in Table 1. This applies, for instance, to the following items:
In these cases, as QSA incorporate more recent general government information (which is
transmitted some 25 days after Table 1 and incorporates updates for government transactions),
discrepancies between Table 1 and QSA occur generally for the latest quarters6.
As QSA refer to the most recent information for consumption and investments of the general
government, the differences with figures transmitted in Table 1 are offset by adjusting the amount
of changes in inventories for the total economy (P.52_S1) which therefore differ from the one
6 Government data for former quarters are indeed generally stable and have not been revised, when compiling QSA,
since the latest transmission of Table 1. More extended discrepancies (for the whole period of transmission) could however occur in the case of revised annual (hence quarterly) general government data that are not yet incorporated in the main aggregates (in March and September). In this specific case, priority is also given to the newly released government data.
o final consumption expenditure of households and NPISH's (P.3_S.1M); o exports of goods and services (P.6_S.1); o imports of goods and services (P.7_S.1); o consumption of fixed capital (P51C_S.1); o compensation of employees (D.1_S.1) o added value for all sectors except S.13.
o final consumption expenditure by the general government (P.3_S.13); o gross fixed capital formation by the general government (P.51_S.13); o taxes less subsidies on products (D.21-D.31).

11.
transmitted in Table 1. This adjustment helps to keep consistency with quarterly estimates on the
production side of the economy and to preserve quarterly GDP transmitted in Table 1. However,
quarterly GDP can finally differ from the one transmitted in Table 1 because of possible
discrepancies in taxes less subsidies (using general government data when compiling QSA7).
1.4.3. Consistency with government data (QNFAGG)
As mentioned above, QSA include the quarterly non-financial accounts for general government.
These are integrated as such without any correction. This implies that QSA can only be built up
when government data are finalized. Those data always have priority over data transmitted in
Table 1 and hence can interfere with them (cf. 1.4.2 above).
1.4.4. Consistency with Bop data (BPM6 version) 8
Recently, at annual level, some progress has been made in the field of consistency between NA
and Bop data, especially for time span 2012-2015. For transactions D.1, D.5, D.6, D8, D.9, NP, as
well as for D.2, D.3 and D.7 vis-à-vis general government, consistency is fully met. Some
discrepancies remain for D.4 and D.7, but should disappear at medium notice.
As regards exports (P.6) and imports (P.7) of goods and services, some discrepancies will remain,
as consequence of balancing procedure of the NA main aggregates. However, the size of these
discrepancies is limited compared to the huge gross amounts of P.6 and P.7.
At quarterly level, the same situation prevails. However, for the more recent quarters some infra-
annual discrepancies may appear for all transactions, due to vintage.
1.4.5. Consistency with financial accounts
The general rule is that statistical discrepancies between net lending/borrowing according to
financial accounts on the one hand (B.9F) and according to non-financial accounts (B.9) on the
other hand are not hidden. The inconsistencies are the most important for households (S.1M) and
non-financial corporations (S.11).
Specific rules are defined in financial accounts for S.2: the net lending/borrowing in the financial
accounts is by construction set equal to the one that is determined in the non-financial accounts
and the adjustment is imputed in other accounts receivable/payable. By construction, there is no
statistical discrepancy for the rest of the world.
1.5. SHORT DESCRIPTION OF THE METHODS USED TO ESTIMATE BACK DATA
In general, the whole data set, from 1999 on, is estimated according to the same methodology.
However, some exceptions occur:
For interest (D.41), for the quarters of the years before 2003 quarterly matrices were not
built up because this work proved to be very time-consuming. A simplified ad hoc
procedure, which relies on smoothing trends, is applied to get quarterly estimates of total
interest received and paid by each institutional sector without information on the
counterpart sector (see point 2.3.9).
7 Differences in the value added of the general government are counterbalanced with an equivalent adjustment (with the
opposite sign) in the value added of non-financial companies. This helps to limit the divergence between the GDP released in the main aggregates and the one which is considered in the QSA.
8 Consistency is not ensured for Bop data established on the basis of BPM5 (1999-2008).

12.
For investment income attributable to collective investment fund (CIF) shareholders
(D.443) for the quarters of the years before 2009, it was not possible to implement the
detailed quarterly calculation method, as Bop-BPM6 data is not available before 2009 and
as the national accounts estimation is established on annual basis. Consequently, a
simplified methodology is used, i.e. the annual figure for each sector (resource or use) is
spread over quarters using a key. This key is equal to 2/3 of the corresponding key for
interest and 1/3 of the corresponding key for dividends. A final adjustment is applied to
ensure that total resources are equal to total uses (see point 2.3.10.5).
For dividends (D.421), the quarterly disaggregation of annual data is based on fixed
allocation keys for years before 2004.
1.6. SEASONAL ADJUSTMENT POLICY
Seasonal adjustment is calculated using JDemetra+ software. Series are also adjusted for calendar
days when relevant.
Seasonally adjusted series coming from QNA or QNFAGG are taken on board as such in QSA. All
other QSA series (except those calculated by smoothing) are tested. Series showing seasonality
are seasonally and calendar days adjusted using JDemetra+.
All series are tested for seasonality once a year and seasonality models are also revised once a
year, in September.
In order to ensure horizontal consistency of the data set by transaction, the same accounting
constraints as explained at point 1.3.2 are applied to seasonally adjusted data set.
1.7. RELEASE AND REVISION POLICY
1.7.1. Release policy
Since April 2007, the quarterly accounts for general government (S.13) are officially released9. The
accounts for general government are published at t+85 days on the online database of the Central
Bank of Belgium for the December and June releases. For the second and fourth quarters, due to
EDP procedure, the data are published around mid-April and mid-October (between t+110 and
t+120 days).
Some days later on, a quarterly publication of the whole QSA is released. This release includes an
online publication of the whole dataset, except sub-categories of D.4 and D.7, and key indicators.
The key indicators selected are the same as the one selected by Eurostat when releasing the
European sector accounts. At the same time, a paper-publication "Comptes nationaux-Comptes
trimestriels" "Nationale rekeningen-Kwartale rekeningen" is released, together with a press release,
giving some comments on the key indicators.
The publication of QSA data and press release follows the schedule below:
o yyyyQ1 t +100 days
o yyyyQ2 t +120 days (benchmarking on annual data + EDP)
o yyyyQ3 t +100 days
o yyyyQ4 t +120 days (EDP)
Link: https://www.nbb.be/doc/dq/f/dq3/nfsc.pdf
9 The accounts for general government are published according to 'Short-Term Public Finance Statistics' (STPFS)
synoptic tables (receipts, expenses and balance with some details), not according to the full QSA sequence of accounts.

13.
1.7.2. Revision policy
1.7.2.1. Major revisions (consistency with updated annual data)
When new annual national accounts are released, QSA are updated to be consistent with them. In
this case, QSA can be revised for several years backwards. This occurs when producing QSA at
the end of September: QSA are then updated to be aligned on the new set of ASA also released in
September (including new government accounts).
QSA are always consistent with revised quarterly data for the general government. Any updating of
these data for general government is incorporated into QSA, even if this updating involves not
being consistent any longer with other transmission programs (notably Table 1).
1.7.2.2. Revisions of data for the latest quarters
When annual national accounts are not yet available, quarterly data can be revised when a new
quarter is estimated. The revision of QSA mainly depends on the revisions brought to pre-existing
data for the latest quarters.
1.7.2.3. Methodological revisions
Methodological improvements can be brought to QSA, up to now on the occasion of any
transmission during the year. Such revisions are implemented for the whole period of transmission
(backwards to 1999Q1). Methodological revisions to QSA never contradict other data transmission
programs.
1.8. REMARKS OR PROBLEMS
Rents (D.41) are available including and excluding Fisim adjustment.
Since the implementation of ESA2010, the same consolidation rules apply to all involved data sets
(ASA, QSA, QNFAGG).
Financial and non-financial accounts are established on the basis of the same classification among
sectors (use of the same business register).
1.9. FUTURE PLANS
The efficient production of robust QSA in a very short time is ensured thanks to the approach
chosen which is easy to work out. This general principle should not be departed from at the risk of
compromising timeliness.
Smoothing procedures should be, as far as possible, avoided even if these only apply in Belgium
for transactions which are limited in size and hence do not have a substantial effect on quarterly
accounts. Explanatory works, suggested that it would be difficult to find relevant quarterly indicators
for other transfers (except those related to the rest of the world), rents and private social security
schemes. Some more attention could be paid in a near future to transfers related to insurance, as
some quarterly information has been recently made available.
For all series estimated with smoothing out the annual data, the Belgian NAI will continue to pay
due attention to the developments that could occur in these fields to find out appropriate quarterly
indicators.
Quarterly Supply and Use tables should be established at medium notice. This will enable the
estimation of P.1 and P.2 by institutional sector and improve the accuracy of the Belgian QSA.

14.
2. DESCRIPTION BY TRANSACTION
2.1. GENERAL REMARKS
The establishment of quarterly accounts for the general government (S.13) is described in a document “Précisions méthodologiques relatives aux comptes non financiers trimestriels des administrations publiques”. The document is available on the NBB website (https://www.nbb.be/doc/dq/f_method/m_nfa06iv.pdf).
The building up of the quarterly main aggregates is described in the specific Manual "Quarterly
national accounts of Belgium - Methodological inventory: Description of sources and methods used
- December 2007". The document is available on the NBB website
(https://www.nbb.be/doc/dq/e_method/m_invcn_e.pdf).
These two documents are still based on ESA1995 concepts, but the described principles and
methodology remain valid.
The present description does not dwell on methodologies which are detailed in one of those two
manuals. Cross-references to this document are mentioned in the following text.
2.2. OVERALL PICTURE
An overall picture for each transaction is provided in Annex 1 and Annex 2.
2.3. DETAILED REVIEW OF TRANSACTIONS
2.3.1. Output (P.1) and intermediate consumption (P.2)
These two optional items are not compiled by institutional sector so far on a quarterly basis and are
not transmitted to Eurostat. This is due to the lack of quarterly Supply-Use tables that could enable
P.2 to be calculated using technical coefficients. At the time being, short-term indicators (VAT data,
industrial production indices etc.) are used to directly estimate value added. However, some
improvement in this field should be brought in the future (see 1.9).
2.3.2. Value added, gross (B1.g)
Sources
On the basis of short term information such as VAT data and industrial production indices, quarterly
gross value added is estimated by industry for more than 30 branches (the detailed methodology to
estimate quarterly value added by industry is described in the specific Manual mentioned under 2.1
above). This data set is translated into a sector breakdown using appropriate keys.
Methods
Total economy (S.1) and domestic sub sectors (S.11, S.12, S.13, S.1M)
The keys that allow distributing the quarterly value added amongst the institutional sectors are
established using, for each industry, the annual breakdown of the value added between the
institutional sectors. This means that quarterly value added is allocated among the sectors S.11,
S.12, S.13 and S.1M according to the allocation of the corresponding amount registered on an
annual basis.
b
Si,b
Si VAVA

15.
with i,bb
SbS
i,b VAxVA
VAVA
where S : institutional sector
b : activity branch
i : quarter
The following keys were used, for each quarter of 2012, to distribute the quarterly value added by
industry amongst the institutional sectors:
Table 2 - Breakdown of value added by industry between institutional sectors (annual keys for 2012)
S.11 S.12 S.13 S.14(*) S.15(*)
Agriculture, forestry and fishing 33.1% 66.9%
Mining and quarrying 99.7% 0.3%
Food products, beverages and tobacco 95.9% 4.1%
Textile and leather 98.2% 1.8%
Wood, paper product and printing 97.7% 2.3%
Coke, refined petroleum products 100%
Chemicals 100%
Pharmaceutical products 100%
Rubber, plastic products and other non-
metallic products
99.6% 0.4%
Basic metals and fabricated metal
products 98.6% 1.4%
Computer electronic and optical products 99.8% 0.2%
Electrical equipment 99.8% 0.2%
Other machinery and equipment 99.8% 0.2%
Transport equipment 99.9% 0.1%
Furniture 94.3% 5.7%
Repair 99.0% 1,0%
Electricity and gas 100%
Water supply, sewage and waste
management
82.2% 17.3% 0.4%
Construction 88.5% 11.5%
Wholesale and retail trade 93.8% 6.2%
Transportation and storage 72.6% 27.0% 1.0%
Accommodation and food activities 76.8% 23.2%
Publishing audio-visual and broadcasting
activities
81.5% 17.7% 0.9%
Telecommunication 98.8% 0.2%
Computer and information service
activities
98.2% 1.8%
Financial intermediation 100%
Insurance 100%
Financial auxiliaries 96.4% 3.6%
Real estate activities 97.7% 2.3%
Dwelling services 100%
Legal, accounting, consultancy,
architecture and engineering activities
53.3% 0.1% 46.6%
Scientific research and development 88.7% 0.2% 11.1%
Advertising, other professional scientific
and technical activities, veterinary
83.9% 16.1%
Administrative and support services 95.9% 4.2%
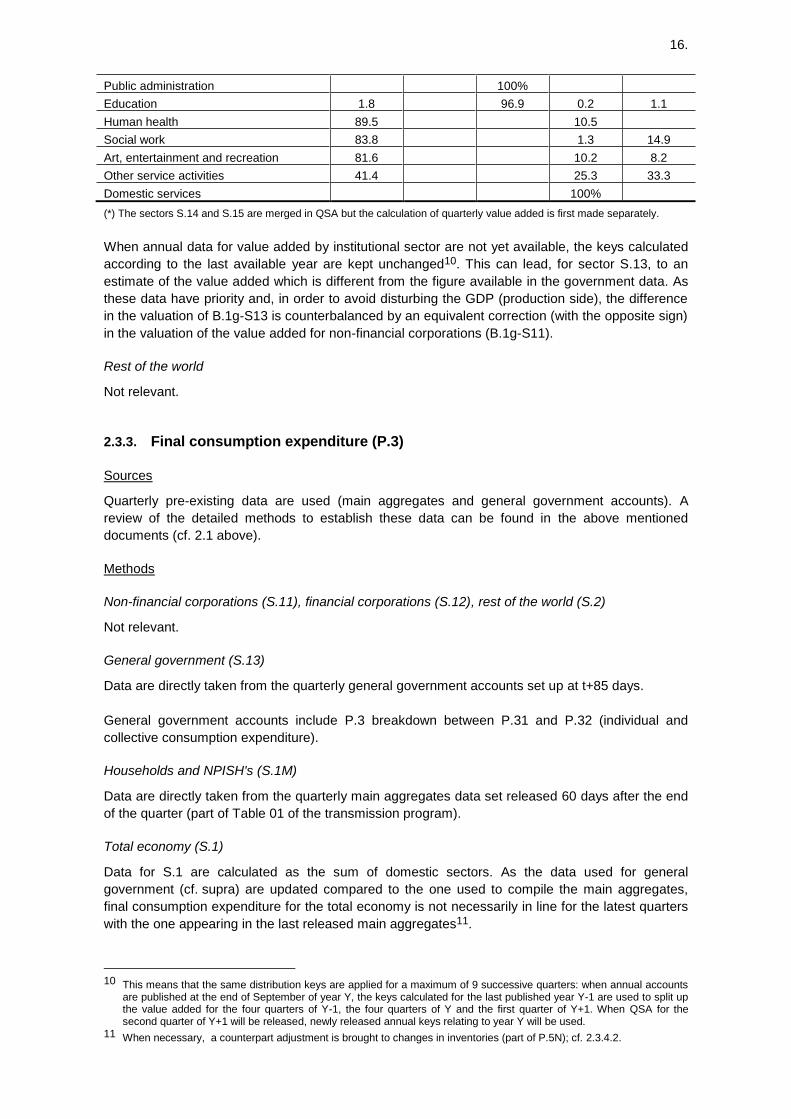
16.
Public administration 100%
Education 1.8 96.9 0.2 1.1
Human health 89.5 10.5
Social work 83.8 1.3 14.9
Art, entertainment and recreation 81.6 10.2 8.2
Other service activities 41.4 25.3 33.3
Domestic services 100%
(*) The sectors S.14 and S.15 are merged in QSA but the calculation of quarterly value added is first made separately.
When annual data for value added by institutional sector are not yet available, the keys calculated
according to the last available year are kept unchanged10. This can lead, for sector S.13, to an
estimate of the value added which is different from the figure available in the government data. As
these data have priority and, in order to avoid disturbing the GDP (production side), the difference
in the valuation of B.1g-S13 is counterbalanced by an equivalent correction (with the opposite sign)
in the valuation of the value added for non-financial corporations (B.1g-S11).
Rest of the world
Not relevant.
2.3.3. Final consumption expenditure (P.3)
Sources
Quarterly pre-existing data are used (main aggregates and general government accounts). A
review of the detailed methods to establish these data can be found in the above mentioned
documents (cf. 2.1 above).
Methods
Non-financial corporations (S.11), financial corporations (S.12), rest of the world (S.2)
Not relevant.
General government (S.13)
Data are directly taken from the quarterly general government accounts set up at t+85 days.
General government accounts include P.3 breakdown between P.31 and P.32 (individual and
collective consumption expenditure).
Households and NPISH's (S.1M)
Data are directly taken from the quarterly main aggregates data set released 60 days after the end
of the quarter (part of Table 01 of the transmission program).
Total economy (S.1)
Data for S.1 are calculated as the sum of domestic sectors. As the data used for general
government (cf. supra) are updated compared to the one used to compile the main aggregates,
final consumption expenditure for the total economy is not necessarily in line for the latest quarters
with the one appearing in the last released main aggregates11.
10 This means that the same distribution keys are applied for a maximum of 9 successive quarters: when annual accounts
are published at the end of September of year Y, the keys calculated for the last published year Y-1 are used to split up the value added for the four quarters of Y-1, the four quarters of Y and the first quarter of Y+1. When QSA for the second quarter of Y+1 will be released, newly released annual keys relating to year Y will be used.
11 When necessary, a counterpart adjustment is brought to changes in inventories (part of P.5N); cf. 2.3.4.2.
17.
2.3.4. Gross capital formation (P.5)
Gross capital formation is defined as the sum of gross fixed capital formation (P.5) and the
changes in inventories together with acquisitions less disposals of valuables (P.5N)
2.3.4.1. Gross fixed capital formation (P.51)
Sources
Quarterly pre-existing data are used (main aggregates and general government accounts). A
review of the detailed methods to establish these data can be found in the above mentioned
documents (cf. 2.1 above).
The available quarterly data in the main aggregates are:
housing investments;
government investments ;
'private' investments (excl. housing).
Housing investments have to be totally imputed to households. QSA require breaking down
'private' investments (excl. housing) between non-financial corporations (S.11), financial
corporations (S.12) and households’ incl. NPISH's (S.1M). Public investments are taken from
general government accounts.
Methods
Non-financial corporations (S.11), financial corporations (S.12), households and NPISH's (S.1M),
rest of the world (S.2)
Quarterly 'private' investments (excl. housing) are broken down between non-financial corporations
(S.11), financial corporations (S.12), households (S.14) and NPISH's (S.15) by considering the
annual share of each of these sectors in the corresponding annual aggregate. Those data for the
sector S14 refer to investments attributed to self-employed workers. They are added to housing
investments - available in the main aggregates and which are totally attributed to households - to
estimate the total investments for the sector S.14.
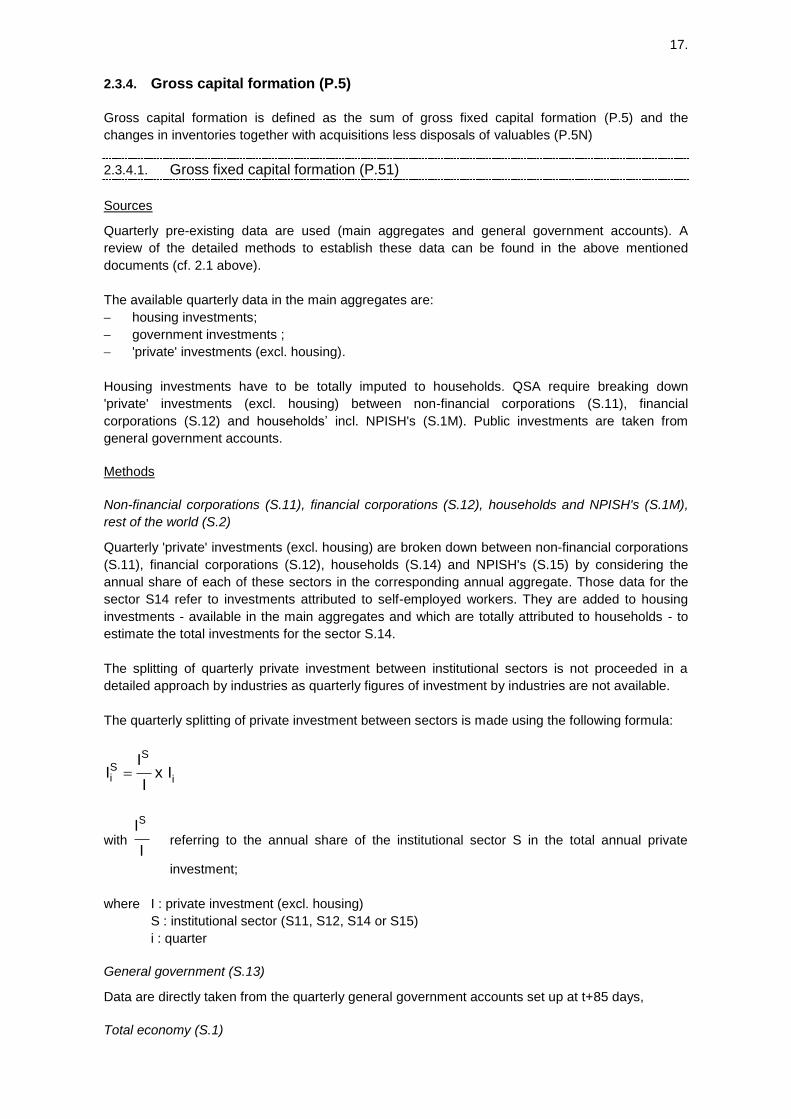
The splitting of quarterly private investment between institutional sectors is not proceeded in a
detailed approach by industries as quarterly figures of investment by industries are not available.
The quarterly splitting of private investment between sectors is made using the following formula:
i
SSi Ix
I
II
with I
IS
referring to the annual share of the institutional sector S in the total annual private
investment;
where I : private investment (excl. housing)
S : institutional sector (S11, S12, S14 or S15)
i : quarter
General government (S.13)
Data are directly taken from the quarterly general government accounts set up at t+85 days,
Total economy (S.1)

18.
Data for S.1 are calculated as the sum of domestic sectors. As the data used for general
government (cf. supra) are updated compared to the one used to compile the main aggregates,
gross fixed capital formation for the total economy is not necessary in line for the latest quarters
with the one appearing in the last released main aggregates12.
2.3.4.2. Changes in inventories and acquisitions less disposals of valuables (P.5N)
Sources
Quarterly pre-existing data, coming from the main aggregates, are used as starting point for the
whole economy. For the latest quarters, discrepancies appear between the figures coming from the
quarterly main aggregates (Table 1) and those coming from the general government accounts.
Discrepancies concern government final consumption (P.3_S13), government investments
(P.51_S.13) and taxes less subsidies on products (D.21-D31_S.1).
Government data is always considered as a priority. Hence, an adjustment is brought in the total
changes in inventories, in order to offset the discrepancy on the expenditure side (for P.3_S13 and
P.51_S.13), so that the GDP in QSA is consistent with the figures published in the main aggregates,
except for updated taxes less subsidies on products. As a consequence, quarterly GDP data in
QSA are closed to the one transmitted in Table 1 of the transmission program but its
decomposition into the different categories of expenditure can be different for the latest quarters13.
This adjustment and remaining discrepancy have a limited size.
Quarterly data for the whole economy have to be broken down amongst the institutional sectors
S.11, S.12, S.13 and S.1M.
Methods
Non-financial corporations (S.11)
This is the residual item for transaction P.5N.
For each quarter i :
iiiii M1.S_N5.P13S_N5.P12.S_N5P1.S_N5.P11.S_N5.P
Financial corporations (S.12)
The small corresponding annual figure is smoothed out over the four quarters of the year, by
applying a linear trend.
As specified in 1.3.3., when annual accounts are not yet available, quarterly data for transactions
estimated by a smoothing method are built up by extending the linear trend.
General government (S.13)
Data are directly taken from the quarterly general government accounts set up at t+85 days.
Households and NPISH's (S.1M)
The small corresponding annual figure is smoothed out over the four quarters of the year, by
applying a linear trend.
12 When necessary, a counterpart adjustment is brought to changes in inventories (part of P.5N); cf. 2.3.4.2. 13 In the case of revised annual (hence quarterly) general government data that are not incorporated yet in the main
aggregates, more extended discrepancies (for the whole period of transmission) can occur. In this case, adjustments to changes in inventories should be brought for each quarter of the period of transmission.

19.
As specified in 1.3.3., when annual accounts are not yet available, quarterly data for transactions
estimated by a smoothing method are built up by extending the linear trend.
Total economy (S.1)
For each quarter i :
1iTable25iTable
25iTable1iTable
25iTable1iTable1iTableiQSA
1.S_31.D21.D1.S_31.D21.D
13.S_51.P13.S_51.P
13.S_3.P13.S_3.P1.S_N5.P1.S_N5.P
Rest of the world
Not relevant.
2.3.5. Exports (P.6) and imports (P.7) of goods and services
Data for P.6 and P.7, but also for P.61 (exports of goods), P.62 (export of services), P.71 (imports
of goods) and P.72 (imports of services), are directly taken from the quarterly main aggregates
(part of Table 01 of the transmission program). A review of the detailed methods to establish these
data can be found in the above mentioned document (cf. 2.1 above).
2.3.6. Compensation of employees (D.1)
(A) Uses side
Total economy (S.1) and domestic sub sectors (S.11, S.12, S.13, S.1M)
Sources
Quarterly pre-existing data, coming from the main aggregates published 60 days after the end of
the quarter, are used as starting point for the whole economy. Compensation of employees paid by
the government is taken from the general government accounts. The difference between those two
aggregates represents the wage bill of the private sector (S.1-S.13) that has to be split up amongst
the institutional sectors S.11, S.12 and S.1M.
Methods
Compensation of employees paid by the general government is estimated within the general
government accounts. The difference between the total wage bill and this compensation has to be
split up amongst the non-government institutional sectors. This breakdown is made by using an
indicator built up on quarterly information coming from the NSSO. This information is available, in a
first version, with a time lag of 4 months and, in a second version, with a time lag of 7 months14.
Depending on the quality and the exhaustiveness of the NSSO indicator, the annual total for each
institutional sector arising from this method diverges more or less from the annual data that prevails
in the annual ESA2010 accounts. The quarterly results have to be adjusted in a second step to fit
the annual released data.
For each 'private' institutional sector, the difference between the sum of the four quarters calculated
according to the NSSO indicator and the annual released data is distributed according to the
weight of the quarter within the year.
14 Quarterly data for the whole economy (S.1) published in the main aggregates are based on the same information
coming from the NSSO.
20.
The very limited residual difference that could remain between the sum of the three sectors (S.11,
S.12 and S.1M) and the total constraint for S.1-S.13 is attributed to wages paid by non-financial
corporations (S.11).
When annual data by institutional sector are not yet available, quarterly estimates are built up by
considering the evolution of the NSSO indicator compared to the corresponding quarter of the
previous year and adjusting the result to fit the quarterly released data for the whole domestic
economy (main aggregates).
For the most recent quarter, for which no information coming from the NSSO is available, the
indicator is prolonged on the basis of the development of the wage bill estimated for the whole
economy and the respective developments by institutional sector observed in the recent past.
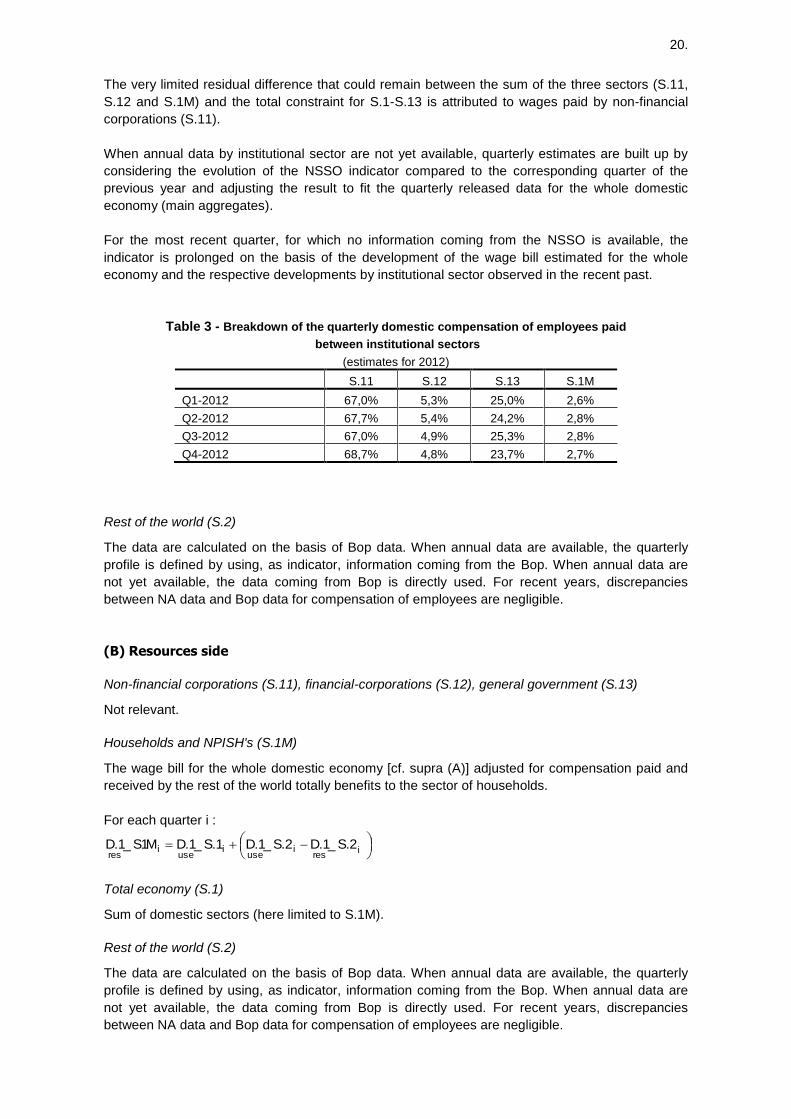
Table 3 - Breakdown of the quarterly domestic compensation of employees paid
between institutional sectors
(estimates for 2012)
S.11 S.12 S.13 S.1M
Q1-2012 67,0% 5,3% 25,0% 2,6%
Q2-2012 67,7% 5,4% 24,2% 2,8%
Q3-2012 67,0% 4,9% 25,3% 2,8%
Q4-2012 68,7% 4,8% 23,7% 2,7%
Rest of the world (S.2)
The data are calculated on the basis of Bop data. When annual data are available, the quarterly
profile is defined by using, as indicator, information coming from the Bop. When annual data are
not yet available, the data coming from Bop is directly used. For recent years, discrepancies
between NA data and Bop data for compensation of employees are negligible.
(B) Resources side
Non-financial corporations (S.11), financial-corporations (S.12), general government (S.13)
Not relevant.
Households and NPISH's (S.1M)
The wage bill for the whole domestic economy [cf. supra (A)] adjusted for compensation paid and
received by the rest of the world totally benefits to the sector of households.
For each quarter i :
ires
iuse
iuse
ires
2.S_1.D2.S_1.D1.S_1.DM1S_1.D
Total economy (S.1)
Sum of domestic sectors (here limited to S.1M).
Rest of the world (S.2)
The data are calculated on the basis of Bop data. When annual data are available, the quarterly
profile is defined by using, as indicator, information coming from the Bop. When annual data are
not yet available, the data coming from Bop is directly used. For recent years, discrepancies
between NA data and Bop data for compensation of employees are negligible.

21.
2.3.7. Taxes on production and imports (D.2)
Taxes on production and imports are defined as the sum of taxes on products (D.21) and other
taxes on production (D.29)
2.3.7.1. Taxes on products (D.21)
(A) Uses side
Quarterly taxes on products that are estimated on the resources side for the total economy (S.1)
and the rest of the world (S.2) [cf. infra (B)] are entirely paid by the total economy (S.1) without
distinction of institutional sectors, in accordance with ESA2010.
For each quarter i :
ires
ires
iuse
2.S_21.D1.S_21.D1S_21.D
(B) Resources side
Sources
Quarterly pre-existing data taken from the general government accounts are used. A review of the
detailed methods to establish these data can be found in the above-mentioned document (cf. 2.1
above).
Methods
Non-financial corporations (S.11), financial corporations (S.12), households and NPISH's (S.1M)
Not relevant.
General government (S.13)
Data are directly taken from the quarterly general government accounts set up at t+85 days.
Total economy (S.1)
Sum of domestic sectors (here limited to S.13). As the data used for general government (cf.
supra) are updated compared to the one used to compile the main aggregates, taxes on products
for the total economy are not necessary in line for the latest quarters with the one appearing in the
last released main aggregates15.
Rest of the world (S.2)
Data are directly taken from the quarterly general government accounts set up at t+85 days. This
data set reports taxes that are paid to EU institutions (mainly part of taxes from the common
agricultural policy and customs duties).
2.3.7.2. Other taxes on production (D.29)
(A) Uses side
15 If required, a counterpart adjustment is brought to changes in inventories (part of P.5N); cf. 2.3.4.2.

22.
Source
No information on the decomposition of other taxes on production paid by the different institutional
sectors is available on a quarterly basis. Estimates must be made.
Methods
Non-financial corporations (S.11)
This is the residual item for transaction D.29.
For each quarter i :
iuse
iuse
iuse
iuse
iuse
M1.S_29.D13S_29.D12.S_29.D1.S_29.D11.S_29.D
Financial corporations (S.12)
The corresponding annual figure is smoothed out over the four quarters of the year, by applying a
linear trend.
General government (S.13)
Actually, the transaction is nil in Belgian accounts.
Households and NPISH's (S.1M)
The corresponding annual figure is smoothed out over the four quarters of the year, by applying a
linear trend. The annual amounts for other taxes on production paid by households are quite large
and mainly concern taxes on the ownership or use of buildings. The smoothing treatment to
estimate quarterly data can be considered as appropriate according to the accrual recording
concept, as those taxes refer to a production of housing services that are evenly spread over time.
Total economy (S.1)
Other taxes on production paid by the total economy are equal to the amount received by the
general government.
Rest of the world (S.2)
Not relevant.
(B) Resources side
Sources
Quarterly pre-existing data taken from the general government accounts are used. A review of the
detailed methods to establish these data can be found in the above-mentioned document (cf. 2.1
above).
Methods
Non-financial corporations (S.11), financial corporations (S.12), households and NPISH's (S.1M),
rest of the world (S.2)
Not relevant.
General government (S.13)
Data are directly taken from the quarterly general government accounts set up at t+85 days.
Total economy (S.1)

23.
Sum of domestic sectors (here limited to S.13).
2.3.8. Subsidies (D.3)
Subsidies are defined as the sum of subsidies on products (D.31) and other subsidies on
production (D.39).
2.3.8.1. Subsidies on products (D.31)
(A) Uses side
Sources
Quarterly pre-existing data taken from the general government accounts are used. A review of the
detailed methods to establish these data can be found in the above-mentioned document (cf. 2.1
above).
Methods
Non-financial corporations (S.11), financial corporations (S.12), households and NPISH's (S.1M)
Not relevant.
General government (S.13)
Data are directly taken from the quarterly general government accounts set up at t+85 days.
Total economy (S.1)
Sum of domestic sectors (here limited to S.13). As the data used for general government (cf.
supra) are updated compared to the one used to compile the main aggregates, subsidies on
products for the total economy are not necessarily in line for the latest quarters with the one
appearing in the last released main aggregates16.
Rest of the world (S.2)
Data are directly taken from the quarterly general government accounts set up at t+85 days. These
report subsidies that are received from EU institutions.
(B) Resources side
Quarterly subsidies on products that are estimated on the uses side for the total economy (S.1) and
the rest of the world (S.2) [cf. supra (A)] are entirely received by the total economy (S.1) without
distinction of institutional sectors, in accordance with ESA2010.
For each quarter i :
iuse
iuse
ires
2.S_31.D1.S_31.D1S_31.D
2.3.8.2. Other subsidies on production (D.39)
(A) Uses side
16 If required, a counterpart adjustment is brought to changes in inventories (part of P.5N); cf. 2.3.4.2.

24.
Sources
Quarterly pre-existing data taken from the general government accounts are used. A review of the
detailed methods to establish these data can be found in the above-mentioned document (cf. 2.1
above).
Methods
Non-financial corporations (S.11), financial corporations (S.12), households and NPISH's (S.1M)
Not relevant.
General government (S.13)
Data are directly taken from the quarterly general government accounts set up at t+85days.
Total economy (S.1)
Sum of domestic sectors (here limited to S.13).
Rest of the world (S.2)
Data are directly taken from the quarterly general government accounts set up at t+85 days.
(B) Resources side
Source
No information on the decomposition of other subsidies on production received by the different
institutional sectors is available on a quarterly basis. Estimates must be made.
Methods
Non-financial corporations (S.11)
This is the residual item for transaction D.39.
For each quarter i :
ires
ires
ires
ires
ires
M1.S_39.D13S_39.D12.S_39.D1.S_39.D11.S_39.D
Financial corporations (S.12)
The limited corresponding annual figure is smoothed out over the four quarters of the year, by
applying a linear trend.
General government (S.13)
Data are directly taken from the quarterly general government accounts set up at t+85 days.
Households and NPISH's (S.1M)
The limited corresponding annual figure is smoothed out over the four quarters of the year, by
applying a linear trend.
Total economy (S.1)
Other subsidies on production received by the total economy are equal to the amount paid by the
general government and the rest on the world.
For each quarter i :

25.
iuse
iuse
ires
2.S_39.D13.S_39.D1.S_39.D
2.3.9. Interest (D.41)
Unless otherwise stated, quarterly interest flows are defined after FISIM allocation.
Sources
The only pre-existing quarterly information comes from the quarterly general government accounts:
interest paid and received by the sector S.13 must be considered as constraints in QSA. For the
other institutional sectors, as well as for the whole economy, quarterly estimates of interest flows
have to be produced in respect of the identity according to which the sum of the quarters must
equal the annual data.
For the years from 2003 onwards, this identity is met as the released annual data are based on the
summation of quarterly estimates for interest received and paid by each institutional sector (interest
matrix on quarterly basis). For the quarters of the years before 2003, quarterly matrices have not
been built up because this work proved to be very time-consuming. A simplified ad hoc procedure,
which relies on smoothing trends, is applied to get quarterly estimates of total interest received and
paid by each institutional sector without information on the counterpart sector.
Methods
Quarterly estimates before 2003
(A) Uses side
Non-financial corporations (S.11), financial corporations (S.12), rest of the world (S.2)
The corresponding annual figure is smoothed out over the four quarters of the year, by applying a
linear trend.
General government (S.13)
Data are directly taken from the quarterly general government accounts (these data are
"consolidated" i.e. they exclude interest flows within entities of the government).
Households and NPISH's (S.1M)
This is the residual item for transaction D.41, on the uses side.
For each quarter i :
iuse
iuse
iuse
iuse
iuse
13.S_41.D12S_41.D11.S_41.D1.S_41.DM1.S_41.D
Total economy (S.1)
The corresponding annual figure (excluding interest payments within entities of the general
government sector) is smoothed out over the four quarters of the year, by applying a linear trend.
(B) Resources side
Non-financial corporations (S.11), financial corporations (S.12), rest of the world (S.2)
The corresponding annual figure is smoothed out over the four quarters of the year, by applying a
linear trend.
General government (S.13)

26.
Data are directly taken from the quarterly general government accounts (these data are
"consolidated" i.e. they exclude interest flows within entities of the government).
Households and NPISH's (S.1M)
This is the residual item for transaction D.41 on the resources side.
For each quarter i :
ires
ires
ires
ires
ires
13.S_41.D12S_41.D11.S_41.D1.S_41.DM1.S_41.D
Total economy (S.1)
Quarterly interests received by the total economy are defined accordingly to quarterly interests paid
by the domestic sectors adjusted for net interest with the rest of the world.
For each quarter i :
i
resi
usei
usei
res2.S_41.D2.S_41.D1.S_41.D1.S_41.D
Quarterly estimates for 2003-2012
Availability of annual accounts
As annual data relating to interest flows are built up on the basis of quarterly matrices combining
the uses side and the resources side, these quarterly matrices are used for the purpose of QSA
and are fully consistent with the corresponding annual figures.
Quarterly matrices are defined before FISIM allocation and take into account the following
constraints:
quarterly interest paid and received by the central bank, other monetary financial institutions
and mutual funds. The quarterly available information, coming from accounting data and
reporting schemes, does not include information about counterpart sectors (except for the
interbank payments that are taken on board);
quarterly interest paid and received by the general government without information about
counterpart sectors;
annual interest flows for insurance corporations and pension funds that are assessed mainly
on the basis of information coming from the Financial supervisory and market authority
(FSMA) without information about counterpart sectors.
The breakdown of quarterly interest flows by counterpart sector is estimated on the basis of the
outstanding amounts of assets and liabilities (instruments F.2, F.3 and F.4) and associated interest
rates. The most detailed level of financial accounts classification is used so that the most
appropriate return by instrument can be applied. Adjustments to fit the above mentioned
constraints are made to the estimated matrix by combining a manual balancing procedure and, for
small residual amounts, a RAS procedure17.
As the quarterly matrices relate to interest flows before FISIM allocation, corrections have to be
made in order to reclassify part of the interest payments as payments for financial services. They
are estimated on the basis of quarterly detailed data about assets and liabilities coming from the
financial accounts and associated interest rate margins (FISIM calculation at quarterly level).
For time-span 2003-2012, the interest matrices and the FISIM calculations are established on the
basis of ESA1995 sectorization and concepts. It was not possible to re-build all matrices back to
2003 on the basis of ESA2010. It was decided to keep ESA1995 matrices, and to adjust for new
sector classification and revisions in sectors S.13 and S.2, knowing that there were no major
methodological change between ESA1995 and ESA2010 in the field of interest or FISIM.
17 In contrast to procedures applied for many transactions, no specific residual sector is defined to balance the system.

27.
Quarterly estimates from 2013 on
From 2013 on, quarterly interest matrices on the basis of ESA2010 sector classification have been
set up. The building principles are the same as previously: for each sector, interest flows by
counterpart sector is estimated on the basis of the outstanding amounts of assets and liabilities
(instruments F.2, F.3, F.4 and F.8 recorded in financial accounts) multiplied by an ad hoc
associated interest rates. For sectors S.13, S.121, S.122, S.123, S.124, S.128 and S.129, total
interests are known from other sources and taken into account. FISIM calculation is estimated
according to the same principles and data sources.
Annual interest flows are calculated as the sum of quarterly interest flows, ensuring perfect
consistency between ASA and QSA for interest.
2.3.10. Property income other than interest (D.4N)
Property income other than interest is the summing up of the components: D.42, D.43, D.441/2,
D.443 and D.45.
2.3.10.1. Dividends (D.421)
Sources
When annual data are available, quarterly profiles of dividends are defined using information
coming from the balance sheets of Belgian companies and from the Bop. For the latest quarters
(when annual accounts are not yet available), an ad hoc methodology has been developed.
Methods
Availability of annual accounts
A quarterly allocation key is calculated for dividends paid and dividends received.
(A) Uses
Non-financial corporations (S.11), financial corporations (S.12)
The quarterly profile is determined on the basis of information coming from the balance sheets of
companies and Bop. According to the collected information, the major part of dividends is paid by
Belgian companies during the second quarter of the year.
Table 4 - Quarterly profile of dividends paid by Belgian corporations
2011 2012 2013
Non-financial corporations (S.11)
Q1 8% 8% 8%
Q2 63% 63% 63%
Q3 16% 16% 16%
Q4 14% 14% 14%
Financial corporations (S.12)
Q1 12% 13% 14%
Q2 61% 60% 60%
Q3 14% 14% 13%
Q4 13% 13% 13%

28.
Box - Additional explanation for the estimation of quarterly profile of dividends paid by
resident enterprises
Non-financial corporations (S11)
The individual annual accounts of corporations contain information on the date of the annual
general meeting of shareholders (AGM). As a rule, dividends are not paid out until several weeks
after the AGM, but precise information on this is not available. On the basis of the date of the AGM,
the quarterly pattern of paid dividends is calculated separately for the full-format and short-format
accounts. The bulk of the dividends is paid out in the second quarter.
The dividend pattern for the short format accounts is more or less the same as that for the full
format. Dividends paid out in year t relate to activities in t-1. The allocation key is therefore lagged
by 1 year.
Central Bank (S.121)
Information is available on the annual account of the National Bank.
Deposit taking corporations (S.122)
The quarterly allocation key for S.122 is based on the date of filling the annual accounts. Since no
annual accounts are filled in June, there is no need for any shift from the second to the third quarter,
in contrast to S.11. The allocation key appears to be quite constant over time.
Other financial sub-sectors (S123, S124, S125, S126, S127)
The calculations are performed in the same way as for S.11.
General government (S.13), households and NPISH's (S.1M)
Not relevant.
Total economy (S.1)
Sum of domestic sectors
Rest of the world (S.2)
An agreement was reached between national accounts experts and Bop experts to use identical
quarterly allocation keys for dividends paid by the rest of the world. The general profile that has
been set, according to a combination of companies' balance sheets and Bop information, ensures a
global consistency of dividend flows amongst all the institutional sectors (including plausible results
for the residual sector S.1M on the resources side). These common keys apply from 2004 onwards.
The agreed general pattern for quarterly profiles has also been adopted in QSA for the years
before 2004, so that constant allocation keys are used for 1999-2004.
Table 5 - Quarterly profile of dividends paid by the rest of the world
according to national accounts
2011 2012 2013
Q1 10% 10% 10%
Q2 64% 64% 64%
Q3 13% 13% 13%
Q4 13% 13% 13%
(B) Resources

29.
Total economy (S.1) and domestic sub sectors (S.11, S.12, S.13, S.1M)
Quarterly dividends received by the total economy are defined accordingly to quarterly dividends
paid by the domestic sectors adjusted for net dividend flows with the rest of the world.
For each quarter i :
i
resi
usei
usei
res2.S_421.D2.S_421.D1.S_421.D1.S_421.D
Quarterly dividends received by the total economy are allocated to the domestic sectors as follows:
dividends received by the government (S13) are directly taken from the quarterly general
government accounts set up at t+85 days;
the residual amount ires
ires
SDSD 13._421.1._421. is allocated pro rata among the sectors
S.11, S.12 and S.1M according to the amounts received on an annual basis.
Rest of the world (S.2)
As for dividends paid by the rest of the world [cf. supra (A)], quarterly allocation keys are common
to QSA and Bop from 2004 onwards. For the former period, quarterly dividends received by the
rest of the world are calculated in QSA with the ultimate objective to keep net dividend flows with
the rest of the world (arising from quarterly Bop data) unchanged. The quarterly profile of dividend
received by the rest of the world in QSA is the following:
Table 6 - Quarterly profile of dividends received by the rest of the world
according to national accounts
2011 2012 2013
Q1 12% 10% 10%
Q2 57% 58% 58%
Q3 17% 17% 17%
Q4 15% 15% 15%
Unavailability of annual accounts
If the dividends calculated for the purpose of the annual national accounts are not yet available, an
estimate is produced.
(A) Uses
Non-financial corporations (S.11)
The method relies on the fact that dividends paid in year Y by resident corporations depend on the
profit generated in Y-1. The link that can be established between those two aggregates has been
analysed on the basis of the following regression18 : Y1Y g2.Bba421.D . This regression has
been examined on an annual basis (published data from 1995 onwards) for six industry groups.
When it proved not to be significant, a moving average of the ratio D.421/B.2g is applied. The
annual projection of dividends is, in a second step, allocated amongst the quarters on the basis of
the quarterly pattern of the latest available annual data.
18 This regression is a simplified view of the items underlying payment of dividends.

30.
Table 7 - Method used to estimate annual dividends
(when annual national accounts are not yet available)
NACE
01_05 agriculture/fisheries D.421 (Y) = D.421 (Y-1)
14_37 manufacturing regression on B.2g (Y-1)
40_41 electricity, gas, water moving average of D.421/B.2g over 3 years
45 construction moving average of D.421/B.2g over 3 years
50_52 trade regression on B.2g (Y-1)
55_90 services regression on B.2g (Y-1)
Financial institutions (S.12)
Since financial institutions have to meet strict and timely reporting obligations, sufficient information
is generally available to estimate dividends paid during the latest quarters. Dividends relating to
quarters of year Y+1 after the final year of available national accounts are estimated on the basis of
accounting reports for year Y that are already available around April Y+1.
General government (S.13), households and NPISH's (S.1M)
Not relevant.
Total economy (S.1)
Sum of domestic sectors.
Rest of the world (S.2)
Dividends paid by the rest of the world (portfolio and direct investment) to domestic sectors are
estimated on the basis of data coming from the Bop.
(A) Resources
Total economy (S.1) and domestic sub sectors (S.11, S.12, S.13, S.1M)
Dividends received by Belgian residents are calculated as a residual figure per quarter, in the same
way as for the years for which annual data are already available (cf. supra). They are allocated to
sectors via the outstanding amounts of shares and other equity (information available in the
financial accounts).
Rest of the world (S.2)
Both dividends resulting from portfolio and direct investment are estimated on the basis of data
coming from the Bop.
2.3.10.2. Withdrawals from the income of quasi-corporations (D.422)
Quarterly amounts of withdrawals from the income of quasi-corporations are directly taken from the
quarterly general government accounts set up at t85 days (S13/resources side) with, as full and
single counterpart, expenditure for resident non-financial corporations (S.11/uses side).
2.3.10.3. Reinvested earnings on direct foreign investment (D.43)
Sources
When annual data are available, quarterly profiles of reinvested earnings on direct foreign
investment are defined using information coming from the balance sheets of Belgian companies
and from the Bop. For the latest quarters (when annual accounts are not yet available), an ad hoc
methodology is applied.

31.
Methods
Availability of annual accounts
A quarterly allocation key is calculated for reinvested earnings paid and reinvested earnings
received.
(A) Uses
Non-financial corporations (S.11)
The calculations include the following steps:
(a) For each year since 1999 the percentage allocation per quarter of the value added per industry
(industry breakdown of the quarterly accounts) is calculated.
(b) The following data from the direct investment enterprises included in the database used to
calculate the annual figures for D.43 are aggregated at NACE 2-digit level:
the net current result (current operating profit) x control percentage
dividends x control percentage
(c) The corresponding quarterly allocation key (cf. (a)) is applied to the annual figure of the "net
result x control%" under (b), which gives the quarterly net result of the direct investment enterprises
per NACE 2-digit heading.
(d) The quarterly pattern of dividends paid per NACE 2-digit heading is available from the
information in the annual accounts.
(e) The corresponding quarterly allocation key is applied to the annual figure of the "dividends x
control %" under (b), giving the dividends per quarter.
(f) Per NACE 2-digit heading, this gives per quarter: D.43 = net result – dividends. Summing across
all sectors gives 4 quarterly amounts which, except for minor rounding errors and any adjustment
effects, correspond to the figure calculated annually for D.43, and can therefore be applied as
allocation key to that annual figure.
The assumptions underlying these calculations are:
the allocation of the gross operating surplus (for which the value added B.1g is used as
a proxy) for all enterprises (cf. (a)) is representative for direct investment enterprises.
The gross operating surplus is itself a proxy for the net current result.
the information on the quarterly pattern of dividends paid, based on information for all
annual accounts available at the Central Balance Sheet Office, is representative for
direct investment enterprises.
Financial corporations (S.12)
In the case of financial corporations (S.12), the quarterly patterns of dividends paid, calculated for
the purpose of the quarterly accounts, are taken as a proxy for the quarterly patterns of the direct
investment enterprises.
The quarterly patterns of the net result for S.122, S.125, S126 and S.127 are calculated in a similar
way as for S.11, i.e. on the basis of the quarterly pattern of the value added of NACE 64+66
(financial institutions + financial auxiliaries). For the quarterly pattern of the net result for S.128, the
quarterly pattern of NACE 65 (insurance sector) is used.

32.
For each sub sector of S.12, the quarterly figures for D.43 thus obtained (= net result - dividends)
are used as the allocation key for the purpose of the quarterly allocation of the D.43 calculated in
the annual national accounts.
General government (S.13), households and NPISH's (S.1M)
Not relevant.
Total economy (S.1)
Sum of domestic sectors.
Rest of the world (S.2)
Rest of the world is the counterpart sector of corresponding quarterly transactions recorded as
resources for Belgian corporations.
For each quarter i :
ires
ires
iuse
12.S_43.D11.S_43.D2S_43.D
(B) Resources side
Non-financial corporations (S.11), financial corporations (S.12)
The quarterly Bop data on the foreign direct investment survey for non-financial corporations and
financial institutions are taken on board.
General government (S.13), households and NPISH's (S.1M)
Not relevant.
Total economy (S.1)
Sum of domestic sectors.
Rest of the world (S.2)
Rest of the world is the counterpart sector of corresponding quarterly transactions recorded as
uses for Belgian corporations.
For each quarter i :
iuse
iuse
ires
12.S_43.D11.S_43.D2S_43.D
Unavailability of annual accounts
(A) Uses
Non-financial corporations (S.11), financial corporations (S.12)
Currently, quarterly estimates relating to the latest year for which annual accounts are available are
kept unchanged for the corresponding quarters relating to the following years.
General government (S.13), households and NPISH's (S.1M)
Not relevant.
Total economy (S.1)
Sum of domestic sectors.
Rest of the world (S.2)
33.
Rest of the world is the counterpart sector of corresponding quarterly transactions recorded as
resources for Belgian corporations.
For each quarter i :
ires
ires
iuse
12.S_43.D11.S_43.D2S_43.D
(B) Resources side
Non-financial corporations (S.11), financial corporations (S.12)
Currently, quarterly estimates relating to the latest year for which annual accounts are available are
kept unchanged for the corresponding quarters relating to the following years.
General government (S.13), households and NPISH's (S.1M)
Not relevant.
Total economy (S.1)
Sum of domestic sectors.
Rest of the world (S.2)
Rest of the world is the counterpart sector of corresponding quarterly transactions recorded as
uses for Belgian corporations.
For each quarter i :
iuse
iuse
ires
12.S_43.D11.S_43.D2S_43.D
2.3.10.4. Property income attributable to insurance policy holders (D.441) +Investment
income payable on pension entitlements (D.442)
Sources
No quarterly information is available and a simple smoothing method is used.
Methods
(A) Uses side
Non-financial corporations (S.11), financial corporations (S.12), rest of the world (S.2)
The corresponding annual figure is smoothed out over the four quarters of the year, by applying a
linear trend.
General government (S.13)
Data are directly taken from the quarterly general government accounts set up at t+85 days.
Households and NPISH's (S.1M)
Not relevant.
Total economy (S.1)
Sum of domestic sectors.
(B) Resources side
34.
Non-financial corporations (S.11), financial corporations (S.12), rest of the world (S.2)
The corresponding annual figure is smoothed out over the four quarters of the year, by applying a
linear trend.
General government (S.13)
Quarterly general government accounts set up a t+85 days, give data on property income attributed
to insurance policy holders (D.441) together with rents (D.45). For the purposes of QSA, this
information is allocated pro rata amongst both transactions according to the amounts registered on
an annual basis. When annual accounts are not yet available, the most recent annual distribution
key is kept unchanged.
Households and NPISH's (S.1M)
This is the residual item for transaction D.441+D442.
For each quarter i :
ires
ires
ires
ires
ires
SDSDSDSDMSD 13._2/144.12_2/144.11._2/144.1._2/144.1._2/441.
Total economy (S.1)
Quarterly property income attributed to insurance policy holders received by the total economy are
defined according to quarterly property income attributed to insurance policy holders paid by the
domestic sectors adjusted for net corresponding flows with the rest of the world.
For each quarter i :
ires
iuse
iuse
ires
SDSDSDSD 2._2/144.2._2/441.1._2/441.1._2/441.
2.3.10.5. Investment income attributable to collective investment fund (CIF) shareholders
(D.443)
Sources
From 2009Q1 onwards, the estimation of investment income attributable to CIF shareholders is
calculated on quarterly basis. The annual data are calculated as the sum of quarterly estimates.
As regards resident CIF, the investment income is collected by the supervisory authorities on
quarterly basis. The income is allocated among counterpart sectors proportionally to the holding of
resident CIF shares of each sector as recorded in the quarterly financial accounts.
As regards non-resident CIF, the quarterly investment income comes from the Bop data. This total
income is allocated among counterpart sectors proportionally to the holding of non-resident CIF
shares of each sector as recorded in the quarterly financial accounts.
The estimation is very detailed, as it distinguishes monetary/non-monetary CIF, D4431/D4432 and
each sub-sector of S.12.
Before 2009, it was not possible to implement this detailed calculation method, as Bop-BPM6 data
are not available and as the estimation is established on annual basis. Consequently, a simplified
methodology is used, i.e. the annual figure for each sector (resource or use) is spread over
quarters using a key. This key is equal to 2/3 of the corresponding key for interest and 1/3 of the
corresponding key for dividends. This calculation is made for each series (D.443 paid by S12,
D.443 paid by S.2 and D.443 received by each sector) . A final adjustment is applied to ensure that
total resources are equal to total uses.

35.
Methods
(A) Uses side
Financial corporations (S.12), rest of the world (S.2)
The data comes directly from sources as explained above.
Non-financial corporations (S.11), general government (S.13), households and NPISH's (S.1M)
Not relevant.
Total economy (S.1)
Equal to S.12.
(B) Resources side
Non-financial corporations (S.11), financial corporations (S.12), households and NPISH's (S.1M),
rest of the world (S.2)
The data comes directly from sources as explained above.
General government (S.13)
The transaction is nil in Belgian accounts.
Total economy (S.1)
Quarterly property income attributable to CIF shareholders received by the total economy are
defined according to quarterly property income attributed to CIF shareholders paid by the domestic
sectors adjusted for net corresponding flows with the rest of the world.
For each quarter i :
ires
iuse
iuse
ires
SDSDSDSD 2._344.2._344.1._344.1._344.
2.3.10.6. Rents (D.45)
Sources
No quarterly information is available and a simple smoothing method is used.
Methods
(A) Uses side
Non-financial corporations (S.11), financial corporations (S.12), households and NPISH's (S.1M)
The corresponding annual figure is smoothed out over the four quarters of the year, by applying a
linear trend.
General government (S.13)
Nil in Belgian accounts.
Total economy (S.1)

36.
Sum of domestic sectors.
Rest of the world (S.2)
Not relevant.
(B) Resources side
Non-financial corporations (S.11), financial corporations (S.12)
The corresponding annual figure is smoothed out over the four quarters of the year, by applying a
linear trend.
General government (S.13)
Quarterly general government accounts set up at t+85 days, give data on property income
attributed to insurance policy holders (D.44) together with rents (D.45). For the purposes of QSA,
this information is allocated pro rata amongst both transactions according to the amounts
registered on an annual basis. When annual accounts are not yet available, the most recent annual
distribution key is kept unchanged.
Households and NPISH's (S.1M)
This is the residual item for transaction D.45.
For each quarter i :
ires
ires
ires
ires
ires
13S_45.D12.S_45.D11.S_45.D1.S_45.DM1.S_45.D
Total economy (S.1)
Quarterly rents received by the total economy are defined according to quarterly rents paid by the
domestic sectors, as transactions with the rest of the world are non-existent.
For each quarter i :
iuse
ires
1.S_45.D1.S_45.D
Rest of the world (S.2)
Not relevant.
2.3.11. Current taxes on income, wealth, etc. (D.5)
Sources
Quarterly pre-existing data taken from the general government accounts are used. A review of the
detailed methods to establish these data can be found in the above-mentioned document (cf. 2.1
above).
Methods
(A) Uses side
Non-financial corporations (S.11), financial corporations (S.12)
Quarterly general government accounts give information about current taxes paid by corporations,
whether these are non-financial or financial enterprises. For the purposes of QSA, this information
is allocated pro rata amongst both sub sectors according to the amounts paid on an annual basis.
When annual accounts are not yet available, the most recent annual distribution key is kept
unchanged.

37.
General government (S.13)
Quarterly general government accounts give information about current taxes within the government.
Households and NPISH's (S.1M)
Quarterly general government accounts give information about current taxes paid by households
and NPISH's.
Total economy (S.1)
Sum of domestic sectors.
Rest of the world (S.2)
Quarterly general government accounts give information about current taxes paid by non-residents.
(B) Resources side
Non-financial corporations (S.11), financial corporations (S.12), households and NPISH's (S.1M)
Not relevant.
General government (S.13)
Data are directly taken from the quarterly general government accounts.
Total economy (S.1)
Sum of domestic sectors (here limited to S.13).
Rest of the world (S.2)
Current taxes paid by residents to the rest of the world are taken from the quarterly Bop of the
European Institutions, published on Eurostat website.
2.3.12. Social contributions (D.61)
2.3.12.1. Actual social contributions (D61x = D.611 + D.613 + D.614 + D.61SC)
Sources
The actual social contributions relating to public schemes come from quarterly general government
accounts. For private schemes, no information is at present available on a quarterly basis and a
simple smoothing method of annual data is used.
Methods
(A) Uses side
Non-financial corporations (S.11), financial corporations (S.12), general government (S.13)
Not relevant.
Households and NPISH's (S.1M)
Total actual social contributions on the resources side of the whole domestic economy [cf. infra (B)]
adjusted for net corresponding flows with the rest of the world are totally supported by households
and NPISH's.
For each quarter i :

38.
iuse
ires
ires
iuse
SDSDSDMSD 2._61.2._61.1._61.1_61.
Total economy (S.1)
Sum of domestic sectors (here limited to S.1M).
Rest of the world (S.2)
The data are calculated on the basis of Bop data. When annual data are available, the quarterly
profile is defined by using, as indicator, information coming from the Bop. When annual data are
not yet available, the data coming from Bop is directly used. Due to harmonization procedure
between national accounts and Bop, the discrepancies between both statistics for this transaction
are negligible for the more recent years.
(B) Resources side
Non-financial corporations (S.11), financial corporations (S.12), rest of the world (S.2)
The corresponding annual figure is smoothed out over the four quarters of the year, by applying a
linear trend.
General government (S.13)
Data are directly taken from the quarterly general government accounts.
Households and NPISH's (S.1M)
Not relevant.
Total economy (S.1)
Sum of domestic sectors.
Rest of the world (S.2)
The data are calculated on the basis of Bop data. When annual data are available, the quarterly
profile is defined by using, as indicator, information coming from the Bop. When annual data are
not yet available, the data coming from Bop is directly used. Due to harmonization procedure
between national accounts and Bop, the discrepancies between both statistics for this transaction
are negligible for the more recent years.
2.3.12.2. Imputed social contributions (D.612)
Sources
The quarterly information comes from quarterly general government accounts.
Methods
(A) Uses side
Non-financial corporations (S.11), financial corporations (S.12), general government (S.13), rest of
the world (S.2)
Not relevant.
Households and NPISH's (S.1M)
39.
Imputed social contributions on the resources side of the whole domestic economy [cf. infra (B)]
adjusted for imputed social contributions paid to non-residents are totally supported by households
and NPISH's.
For each quarter i :
ires
ires
iuse
2.S_612.D1.S_612.DM1S_612.D
Total economy (S.1)
Sum of domestic sectors (here limited to S.1M).
(B) Resources side
Non-financial corporations (S.11)
The following accounting identity is used:
For each quarter i :
)(11_611.11_62.11_612. partimSDScDSD ires
iuse
ires
(D62C = social benefit directly paid by the employer)
Financial corporations (S.12), households and NPISH's (S.1M), rest of the world (S.2)
The corresponding annual figure is smoothed out over the four quarters of the year, by applying a
linear trend.
General government (S.13)
Data are directly taken from the quarterly general government accounts.
Total economy (S.1)
Sum of domestic sectors.
2.3.13. Social benefits other than social transfers in kind (D.62)
Sources
Information coming from quarterly general government accounts and from the Bop are used. No
quarterly information relating to Belgian private social schemes is available and smoothing
procedures are used with due regards to ESA2010 accounting constraints.
On the uses side, quarterly estimates are built up for the three following items:
D.62a : all social benefits and social assistance benefits supported by the general
government
(D.62a_S.1 = D.621_S.13 + D.622_S.13 + D.623_S.13 )
D.62b : private funded social benefits , excl. S.13
(D.62b_S.1 = D.622_S.12) )
D.62c : direct social insurance benefits from employers, excl. S.13
(D.62c_S.1 = D.623_S.1 - D.623_S.13)
On the resources side, a quarterly estimate for total social benefits (D.62) is established.
Methods
(A) Uses side

40.
Non-financial corporations (S.11)
D.62a: not relevant.
D.62b and D.62c: the corresponding annual figure is smoothed out over the four quarters of the
year, by applying a linear trend.
Financial corporations (S.12)
Total of D.62 is smoothed out over the four quarters of the year, by applying a linear trend.
The decomposition between the three mentioned categories is the following:
D.62a: not relevant.
D.62b: residual category: iuse
iuse
iuse
12.S_c62.D12.S_62.D12.S_b62.D
D.62c: the following accounting identity is used, for each quarter i:
ires
iuse
12S_612.D12S_c62.D (cf. 2.3.12.2 above)
General government (S.13)
D.62a: quarterly estimates are directly taken from the quarterly general government accounts.
D.62b and D.62c: not relevant.
Households and NPISH's (S.1M)
D.62a and D.62b: not relevant.
For D.62c, the following accounting identity is used, for each quarter i:
ires
iuse
M1S_612.DM1S_c62.D (cf. 2.3.12.2 above)
Total economy (S.1)
Sum of domestic sectors.
Rest of the world (S.2)
The data are calculated on the basis of Bop data. When annual data are available, the quarterly
profile is defined by using, as indicator, information coming from the Bop. When annual data are
not yet available, the data coming from Bop is directly used. Due to harmonization procedure
between national accounts and Bop, the discrepancies between both statistics for this transaction
are negligible for the more recent years.
(B) Resources side
Non-financial corporations (S.11), financial corporations (S.12), general government (S.13)
Not relevant.
Households and NPISH's (S.1M)
Social benefits on the uses side of the whole domestic economy [cf. supra (A)] adjusted for net
social benefits paid by the rest of the world are entirely recorded as resources for households and
NPISH's.
For each quarter i :
ires
iuse
iuse
ires
2.S_62.D2.S_62.D1.S_62.DM1S_62.D
Total economy (S.1)
Sum of domestic sectors (here limited to S.1M).
41.
Rest of the world (S.2)
The data are calculated on the basis of Bop data. When annual data are available, the quarterly
profile is defined by using, as indicator, information coming from the Bop. When annual data are
not yet available, the data coming from Bop is directly used. Due to harmonization procedure
between national accounts and Bop, the discrepancies between both statistics for this transaction
are negligible for the more recent years.
2.3.14. Social transfers in kind (D.63)
Sources
Quarterly pre-existing data taken from the general government accounts are used. A review of the
detailed methods to establish these data can be found in the above-mentioned document (cf. 2.1
above).
Methods
(A) Uses side
Non-financial corporations (S.11), financial corporations (S.12), rest of the world (S.2)
Not relevant.
General government (S.13)
Data are directly taken from the quarterly general government accounts set up at t+85 days.
Quarterly social transfers in kind are equal to quarterly individual consumption expenditure by the
general government (P.31_S.13).
Households and NPISH's (S.1M)
The corresponding annual figure is smoothed out over the four quarters of the year, by applying a
linear trend.
Total economy (S.1)
Sum of domestic sectors.
(B) Resources side
Non-financial corporations (S.11), financial corporations (S.12), general government (S.13), rest of
the world (S.2)
Not relevant.
Households and NPISH's (S.1M)
Quarterly social transfers in kind paid by the government and households and NPISH's entirely
benefit the latter.
For each quarter i :
iuse
iuse
ires
M1.S_63.D13.S_63.DM1S_63.D
Total economy (S.1)
Sum of domestic sectors (here limited to S.1M).

42.
2.3.15. Other current transfers (D.7)
2.3.15.1. Net non-life insurance premiums (D.71)
Sources
No specific quarterly information is available relating to net non-life insurance premiums.
Smoothing methods are used.
Methods
(A) Uses side
Non-financial corporations (S.11), financial corporations (S.12), rest of the world (S.2)
The corresponding annual figure is smoothed out over the four quarters of the year, by applying a
linear trend.
General government (S.13)
Data are directly taken from the quarterly general government accounts.
Households and NPISH's (S.1M)
This is the residual item for transaction D.71.
For each quarter i :
iuse
iuse
iuse
iuse
iuse
13S_71.D12.S_71.D11.S_71.D1.S_71.DM1.S_71.D
Total economy (S.1)
Quarterly non-life insurance premiums paid by the total economy are defined accordingly to
quarterly non-life insurance received by the domestic sectors adjusted for net corresponding flows
with the rest of the world.
For each quarter i :
i
usei
resi
resi
use2.S_71.D2.S_71.D1.S_71.D1.S_71.D
(B) Resources side
Non-financial corporations (S.11), general government (S.13), households and NPISH's (S.1M)
Not relevant.
Financial corporations (S.12), rest of the world (S.2)
The corresponding annual figure is smoothed out over the four quarters of the year, by applying a
linear trend.
Total economy (S.1)
Sum of the domestic sectors (here limited to S.12)
2.3.15.2. Non-life insurance claims (D.72)
Sources
No specific quarterly information is available relating to non-life insurance claims. Smoothing
methods are used.

43.
Methods
(A) Uses side
Non-financial corporations (S.11), general government (S.13), households and NPISH's (S.1M)
Not relevant.
Financial corporations (S.12), rest of the world (S.2)
The corresponding annual figure is smoothed out over the four quarters of the year, by applying a
linear trend.
Total economy (S.1)
Sum of the domestic sectors (here limited to S.12).
(B) Resources side
Non-financial corporations (S.11), financial corporations (S.12), rest of the world (S.2)
The corresponding annual figure is smoothed out over the four quarters of the year, by applying a
linear trend.
General government (S.13)
Data are directly taken from the quarterly general government accounts.
Households and NPISH's (S.1M)
This is the residual sector for transaction D.72.
For each quarter i :
ires
ires
ires
ires
ires
13S_72.D12.S_72.D11.S_72.D1.S_72.DM1.S_72.D
Total economy (S.1)
Quarterly non-life insurance claims received by the total economy are defined accordingly to
quarterly non-life insurance claims paid by the domestic sectors adjusted for net corresponding
flows with the rest of the world.
For each quarter i :
i
resi
usei
usei
res2.S_72.D2.S_72.D1.S_72.D1.S_72.D
2.3.15.3. Other current transfers (D.7N)
These transfers are estimated on a quarterly basis by distinguishing current international
cooperation (D.74), miscellaneous current transfers (D.75) and VAT and GNI based EU own
resources (D.76).
Current international cooperation (D.74)
Sources
Quarterly pre-existing data taken from the general government accounts are used. A review of the
detailed methods to establish these data can be found in the above-mentioned document (cf. 2.1
above).

44.
Methods
(A) Uses side
Non-financial corporations (S.11), financial corporations (S.12), households and NPISH's (S.1M)
Not relevant.
General government (S.13)
Data are directly taken from the quarterly general government accounts.
Total economy (S.1)
Sum of the domestic sectors (here limited to S.13).
Rest of the world (S.2)
Quarterly flows are the direct counterpart of current international cooperation receipts for the
general government. This information comes directly from quarterly general government accounts.
(B) Resources side
Non-financial corporations (S.11), financial corporations (S.12), households and NPISH's (S.1M)
Not relevant.
General government (S.13)
Data are directly taken from the quarterly general government accounts.
Total economy (S.1)
Sum of the domestic sectors (here limited to S.13).
Rest of the world (S.2)
Quarterly flows are the direct counterpart of current international cooperation expenditure by the
general government. This information comes directly from quarterly general government accounts.
Miscellaneous current transfers (D.75)
Sources
Except quarterly pre-existing data coming from the general government accounts and from the Bop
(flows between the domestic economy and the rest of the world), no quarterly specific information
is known. Estimates must be made. To ensure a consistency of these redistributive flows, a
complete whom-to-whom quarterly matrix is build up. For transactions other than related to S.13 or
S.2, it relies mainly on smoothing procedures.
A review of the detailed methods to establish pre-existing data (quarterly general government
transactions) that are used to build up the QSA matrix can be found in the above-mentioned
document (cf. 2.1 above).
Methods
The general procedures underlying the establishment of whom-to-whom quarterly matrices for D.75
are the following:
to avoid the appearance of negative flows, smoothing out methods of annual data are
applied on internal components of the matrices. Total on the lines and columns are the
sum of the components;

45.
quarterly data for general government represent constraints to draw up the matrix;
flows between S.1 and S.2 have to be consistent with information contained in the Bop.
A summary of the methods used to establish the matrix, which combines the uses side and the
resources side, is provided below.
received
by:
from :
S.11 S.12 S.13 S.1M Total S.1 S.2 S.1+S.2
S.11 0 0
vertical residual
item
annual data smoothed with linear
trend
(horizontal) sum of
domestic sectors
Belgian Bop data
horizontal sum
S.12 0
annual data smoothed with linear
trend
S13 data (*)
annual data smoothed with linear
trend
(horizontal) sum of
domestic sectors
S13 data (*) horizontal
sum
S.13 S.13 data S.13 data 0 S.13 data
(horizontal) sum of
domestic sectors
S.13 data horizontal
sum
S.1M 0 0
annual data smoothed with linear
trend
annual data smoothed with linear trend (**)
(horizontal) sum of
domestic sectors
Belgian Bop data +
annual data smoothed with linear trend (***)
horizontal sum
Total S.1
(vertical) sum of
domestic sectors
(vertical) sum of
domestic sectors
S.13 data
(vertical) sum of
domestic sectors
(vertical) sum of
domestic sectors
horizontal or vertical
sum
S.2 Belgian and
EUI Bop data
0 S13 data (*)
Belgian Bop data+
annual data smoothed with linear
trend
(horizontal) sum of
domestic sectors
S.1+S.2
vertical
sum
vertical sum
vertical sum
vertical sum
horizontal or vertical
sum
(*) Guarantee fees in the context of financial turmoil. (**) Transfers between households (S.14) and NPISHs (S.15) are not consolidated. Internal transfers within the sector
S.1M are registered, for an equivalent amount, on the uses side and on the resources side. (***) Transfers from ISBLSM to S2 (not included in Bop data) are smoothed with a linear trend.
Quarterly miscellaneous current transfers related to the rest of the world are partially calculated on
the basis of the quarterly Belgian and EUI Bop data. Other components of S.2 current transfers, in
particular cross-border transfers related to NPISH’s, are not included in Bop data. They are
estimated by smoothing annual data with a linear trend.
For quarterly miscellaneous current transfers related to S.13, the information comes directly from
quarterly general government accounts.
Other quarterly miscellaneous current transfers are estimated by smoothing annual data with a
linear trend.
VAT and GNI based EU own resources (D.76)
Sources
Quarterly pre-existing data taken from the general government accounts are used.

46.
Methods
(A) Uses side
Non-financial corporations (S.11), financial corporations (S.12), households and NPISH's (S.1M)
Not relevant.
General government (S.13)
Data are directly taken from the quarterly general government accounts.
Total economy (S.1)
Sum of the domestic sectors (here limited to S.13).
Rest of the world (S.2)
Not relevant
(B) Resources side
Non-financial corporations (S.11), financial corporations (S.12), general government (S.13),
households and NPISH's (S.1M)
Not relevant.
Rest of the world (S.2)
Quarterly flows are the direct counterpart of VAT and GNI based EU own resources paid by the
general government. This information comes directly from quarterly general government accounts.
2.3.16. Adjustment for the change in net equity of households in pension funds
reserves (D.8)
Sources
As for social contributions and benefits related to private pension schemes, no information is for the
time being available on a quarterly basis to estimate changes in the net equity of households in
pension funds reserve and a simple smoothing method of annual data is used.
Methods
(A) Uses side
Non-financial corporations (S.11)
The very limited corresponding annual figure is divided into four equivalent quarters.
Financial corporations (S.12)
Quarterly estimates are based on the following accounting identity:
The corresponding annual figure is smoothed out over the four quarters of the year, by applying a
linear trend.
General government (S.13)
Data are directly taken from the quarterly general government accounts.
Households and NPISH's (S.1M), rest of the world (S.2)

47.
Nil in Belgian accounts.
Total economy (S.1)
Sum of domestic sectors.
(B) Resources side
Non-financial corporations (S.11), financial corporations (S.12), general government (S.13)
Not relevant.
Households and NPISH's (S.1M)
Households are the only counterpart for this transaction registered on the uses side for the total
economy.
iuse
ires
1.S_8.DM1.S_8.D
Total economy (S.1)
Sum of domestic sectors (here limited to S.1M).
Rest of the world (S.2)
Nil in Belgian accounts.
2.3.17. Capital transfers (D.9)
2.3.17.1. Capital taxes (D.91)
Sources
Quarterly pre-existing data taken from the general government accounts are used. A review of the
detailed methods to establish these data can be found in the above-mentioned document (cf. 2.1
above).
Methods
(A) Uses side
Non-financial corporations (S.11), financial corporations (S.12), rest of the world (S.2)
Nil in Belgian accounts.
General government (S.13)
Non relevant.
Households and NPISH's (S.1M)
Households are the only counterpart for this transaction registered on the resources side for the
general government.
ires
iuse
13.S_9.DM1.S_9.D
Total economy (S.1)
Sum of domestic sectors (here limited to S.1M).
(B) Resources side
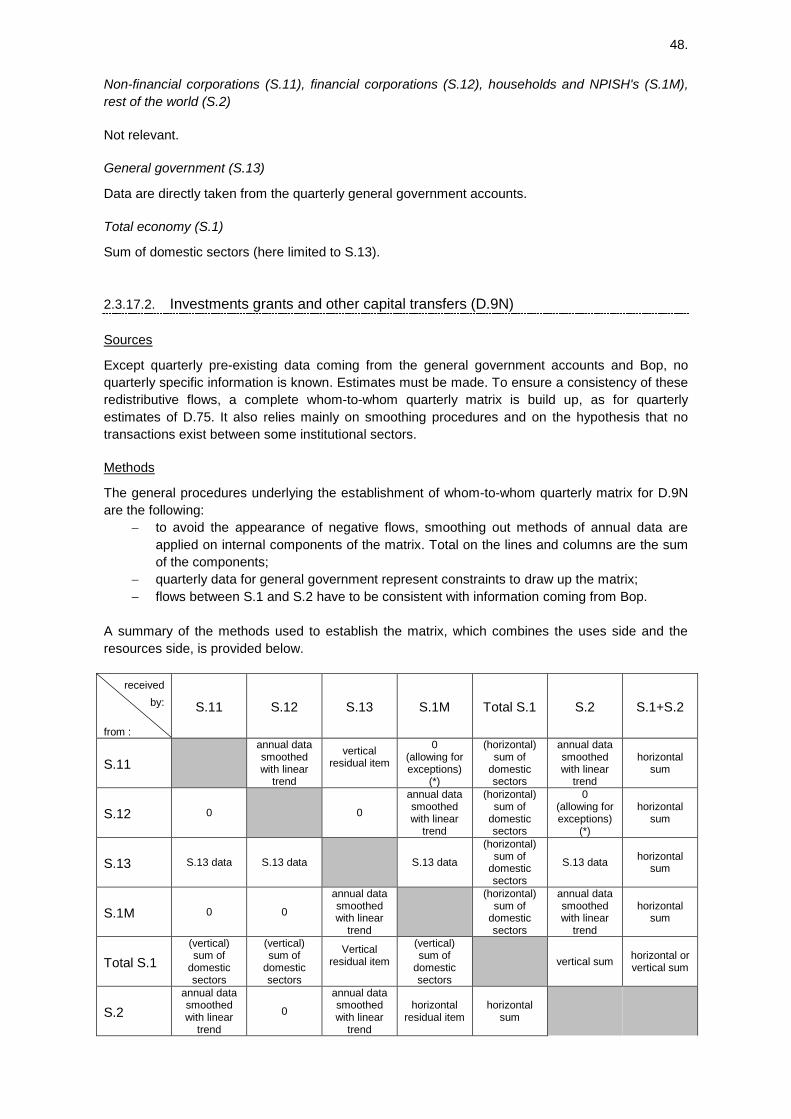
48.
Non-financial corporations (S.11), financial corporations (S.12), households and NPISH's (S.1M),
rest of the world (S.2)
Not relevant.
General government (S.13)
Data are directly taken from the quarterly general government accounts.
Total economy (S.1)
Sum of domestic sectors (here limited to S.13).
2.3.17.2. Investments grants and other capital transfers (D.9N)
Sources
Except quarterly pre-existing data coming from the general government accounts and Bop, no
quarterly specific information is known. Estimates must be made. To ensure a consistency of these
redistributive flows, a complete whom-to-whom quarterly matrix is build up, as for quarterly
estimates of D.75. It also relies mainly on smoothing procedures and on the hypothesis that no
transactions exist between some institutional sectors.
Methods
The general procedures underlying the establishment of whom-to-whom quarterly matrix for D.9N
are the following:
to avoid the appearance of negative flows, smoothing out methods of annual data are
applied on internal components of the matrix. Total on the lines and columns are the sum
of the components;
quarterly data for general government represent constraints to draw up the matrix;
flows between S.1 and S.2 have to be consistent with information coming from Bop.
A summary of the methods used to establish the matrix, which combines the uses side and the
resources side, is provided below.
received
by:
from :
S.11 S.12 S.13 S.1M Total S.1 S.2 S.1+S.2
S.11
annual data smoothed with linear
trend
vertical residual item
0 (allowing for exceptions)
(*)
(horizontal) sum of
domestic sectors
annual data smoothed with linear
trend
horizontal sum
S.12 0 0
annual data smoothed with linear
trend
(horizontal) sum of
domestic sectors
0 (allowing for exceptions)
(*)
horizontal sum
S.13 S.13 data S.13 data S.13 data
(horizontal) sum of
domestic sectors
S.13 data horizontal
sum
S.1M 0 0
annual data smoothed with linear
trend
(horizontal) sum of
domestic sectors
annual data smoothed with linear
trend
horizontal sum
Total S.1
(vertical) sum of
domestic sectors
(vertical) sum of
domestic sectors
Vertical residual item
(vertical) sum of
domestic sectors
vertical sum horizontal or vertical sum
S.2
annual data smoothed with linear
trend
0
annual data smoothed with linear
trend
horizontal residual item
horizontal sum

49.
S.1+S.2 vertical sum vertical sum S.13 data vertical sum horizontal or vertical sum
(*) Exceptional transactions can be registered on the basis of ad-hoc collected information.
Quarterly general government accounts give information about investments grants and other
capital transfers paid to corporations, whether these are non-financial or financial enterprises. For
the purposes of QSA, this information is allocated pro rata amongst both sub sectors according to
the amounts paid on an annual basis. When annual accounts are not yet available, the most recent
annual distribution key is kept unchanged.
Capital transfers other than capital taxes can be the result of exceptional transactions. This is
notably the case for exceptional receipts collected by the government. By construction, the
counterpart sector is non-financial corporations (S.11) which is defined as a residual item. Specific
attention has to be devoted to such exceptional transactions if it appears that the counterpart
sector is not S.11. Manual corrections can be brought to the usual drawing of the matrix.
2.3.18. Consumption of fixed capital (P51C)
Sources
Given the lack of information, quarterly data are estimated on the basis of a linear trend. Since
these series are calculated with a model using the lifespan of past investments, they have a regular
profile.
Methods
Non-financial corporations (S.11)
This is the residual item for transaction P51C.
For each quarter i :
iiiii MSCPSCPSCPSCPSCP 1_5113._5112._511._5111._51
Financial corporations (S.12), households and NPISH's (S.1M)
The corresponding annual figure is smoothed out over the four quarters of the year, by applying a
linear trend.
General government (S.13)
Data are directly taken from the quarterly general government accounts.
Total economy (S.1)
The data come directly from the quarterly main aggregates.
Rest of the world (S.2)
Not relevant.
2.3.19. Acquisitions less disposals of non-financial non-produced assets (NP)
Sources
From 2007Q1 on, data for the rest of the world are directly taken from the Bop established
according to BPM6. For time span 1999-2006, the corresponding annual figure is smoothed out
over the four quarters of the year, by applying a linear trend.

50.
Methods
Non-financial corporations (S.11)
This is the residual item for transaction NP. If required, due attention is given to be sure that the
counterpart for exceptional transactions registered at the level of general government is correctly
recorded.
For each quarter i :
iiiii MSNPSNPSNPSNPSNP 1_13._12._1._11._
Financial corporations (S.12)
The corresponding annual figure (very small amount) is smoothed out over the four quarters of the
year, by applying a linear trend.
General government (S.13)
Data are directly taken from the quarterly general government accounts set up at t+85 days. These
data take into account specific transactions such as sales of land and sales of mobile telecom
licences (after 2005 for the latter).
Households and NPISH's (S.1M)
The corresponding annual figure is smoothed out over the four quarters of the year, by applying a
linear trend.
Total economy (S.1)
Sum of domestic sectors.
Rest of the world (S.2)
The data come directly from the Bop. From 2006 onwards, this transaction is mainly influenced by
the development of purchases or sales of CO2 emission rights. The counterpart sector for these
transactions is non-financial corporations. The development observed in NP_S.2 is mainly imputed
to the sector S.11 as this latter is considered as the residual item.

51.
QSA methodology_SEC2010.doc
Annex 1 : Methodology by transaction - Overall picture
Transaction Already available To be calculated Comment
P.1
P.2
- - Lack of quarterly Supply-Use tables that would enable P2 to be calculated using technical
coefficients.
B.1g B.1g_S.13
B.1g_S.11
B.1g_S.12
B.1g_S.1M
Availability of quarterly estimates of value added for more than 30 branches. To split up value
added amongst the institutional sectors, the annual breakdown of value added per sector, for
each branch, is defined as allocation key for quarterly data.
P.31 et P.32 P.31_S.13
P.32_S.13
P.31_S.1M
-
P.4 P.4_S.13
P.4_S.1M
-
P.51 P.51_S.13
P.51_S.1M (housing)
P.51_S.11
P.51_S.12
P.51_S.1M (excl. housing)
The breakdown of quarterly 'private' gross fixed capital formation (excl. housing) amongst
S.11, S.12 and S.1M is estimated by considering the share of each sector in the annual
corresponding aggregate.
P.5N P.5N_S.13 P.5N_S.1 (adjusted)
P.5N_S.11
P.5N_S.12
P.5N_S.1M
If required, quarterly data for the whole economy are adjusted for the latest quarters to fit
quarterly released GDP. The breakdown per institutional sector is estimated by using
smoothing methods and defining a residual sector (S.11).
P.6 P.6 -
P.7 P.7 -
D.1 D.1_S.1 res & use
D.1_S.13 use
D.1_S.2 res
D.1_S.2 use
D.1_S.11 use
D.1_S.12 use
D.1_S.1M use
D.1_S.1M res
A specific methodology has been developed using NSSO data. Since information coming
from NSSO is only available with a 4-month delay, the last quarter is subject to an ad-hoc
estimate.
D.21 D.21_S.1 res & use
D.21_S.13 res
D.21_S.2 res
-
D.29 D.29_S.1 res & use
D.29_S.13 res
D.29_S.2 res
D.29_S.11 use
D.29_S.12 use
D.29_S.1M use
Given the lack of information, the small sums involved and/or the relatively regular profile of
the series, quarterly data are estimated by using smoothing methods and defining a residual
sector (S.11).
D.31 D.31_S.1 res & use
D.31_S.13 use
D.31_S.2 use
-
D.39 D.39_S.1 res & use
D.39_S.13 use
D.39_S.2 use
D.39_S.11 res
D.39_S.12 res
D.39_S.1M res
Given the lack of information, the small sums involved and/or the relatively regular profile of
the series, quarterly data are estimated by using smoothing methods and defining a residual
sector (S.11).
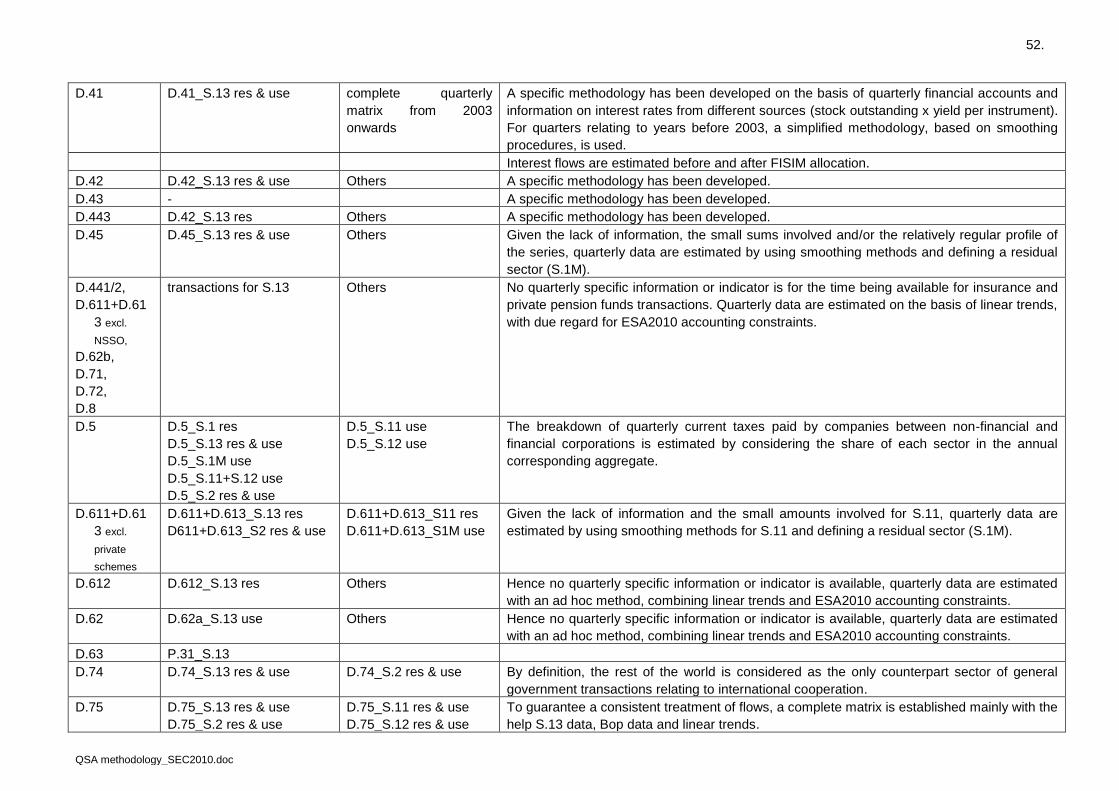
52.
QSA methodology_SEC2010.doc
D.41 D.41_S.13 res & use complete quarterly
matrix from 2003
onwards
A specific methodology has been developed on the basis of quarterly financial accounts and
information on interest rates from different sources (stock outstanding x yield per instrument).
For quarters relating to years before 2003, a simplified methodology, based on smoothing
procedures, is used.
Interest flows are estimated before and after FISIM allocation.
D.42 D.42_S.13 res & use Others A specific methodology has been developed.
D.43 - A specific methodology has been developed.
D.443 D.42_S.13 res Others A specific methodology has been developed.
D.45 D.45_S.13 res & use Others Given the lack of information, the small sums involved and/or the relatively regular profile of
the series, quarterly data are estimated by using smoothing methods and defining a residual
sector (S.1M).
D.441/2,
D.611+D.61
3 excl.
NSSO,
D.62b,
D.71,
D.72,
D.8
transactions for S.13 Others No quarterly specific information or indicator is for the time being available for insurance and
private pension funds transactions. Quarterly data are estimated on the basis of linear trends,
with due regard for ESA2010 accounting constraints.
D.5 D.5_S.1 res
D.5_S.13 res & use
D.5_S.1M use
D.5_S.11+S.12 use
D.5_S.2 res & use
D.5_S.11 use
D.5_S.12 use
The breakdown of quarterly current taxes paid by companies between non-financial and
financial corporations is estimated by considering the share of each sector in the annual
corresponding aggregate.
D.611+D.61
3 excl.
private
schemes
D.611+D.613_S.13 res
D611+D.613_S2 res & use
D.611+D.613_S11 res
D.611+D.613_S1M use
Given the lack of information and the small amounts involved for S.11, quarterly data are
estimated by using smoothing methods for S.11 and defining a residual sector (S.1M).
D.612 D.612_S.13 res
Others Hence no quarterly specific information or indicator is available, quarterly data are estimated
with an ad hoc method, combining linear trends and ESA2010 accounting constraints.
D.62 D.62a_S.13 use
Others Hence no quarterly specific information or indicator is available, quarterly data are estimated
with an ad hoc method, combining linear trends and ESA2010 accounting constraints.
D.63 P.31_S.13
D.74 D.74_S.13 res & use D.74_S.2 res & use By definition, the rest of the world is considered as the only counterpart sector of general
government transactions relating to international cooperation.
D.75 D.75_S.13 res & use
D.75_S.2 res & use
D.75_S.11 res & use
D.75_S.12 res & use
To guarantee a consistent treatment of flows, a complete matrix is established mainly with the
help S.13 data, Bop data and linear trends.

53.
QSA methodology_SEC2010.doc
D.75_S.1M res & use
D.91 D.91_S.13 res
D.91_S.1M use
-
D.9N D.9N_S.13 res & use
D.9N_S.2 res & use
D.9N_S.11 res & use
D.9N_S.12 res & use
D.9N_S.1M res & use
To guarantee a consistent treatment of flows, a complete matrix is established mainly with the
help of linear trends, with the exception of specific transactions generally implying the general
government.
P51C P51C_S.1
P51C_S.13
P51C_S.11
P51C_S.12
P51C_S.1M
In view of the lack of information, quarterly data are estimated on the basis of a linear trend.
Since these series are calculated with a model using the lifespan of past investments, they
have a regular profile. S.11 is defined as residual sector.
NP NP_S.13
NP_S.2
NP_S.11
NP_S.12
NP_S.1M
In view of the lack of information and the small sums involved, quarterly data are estimated
on the basis of a linear trend, except for specific operations for which information is known
(payment date, sectors involved). S.11 is defined as residual sector.
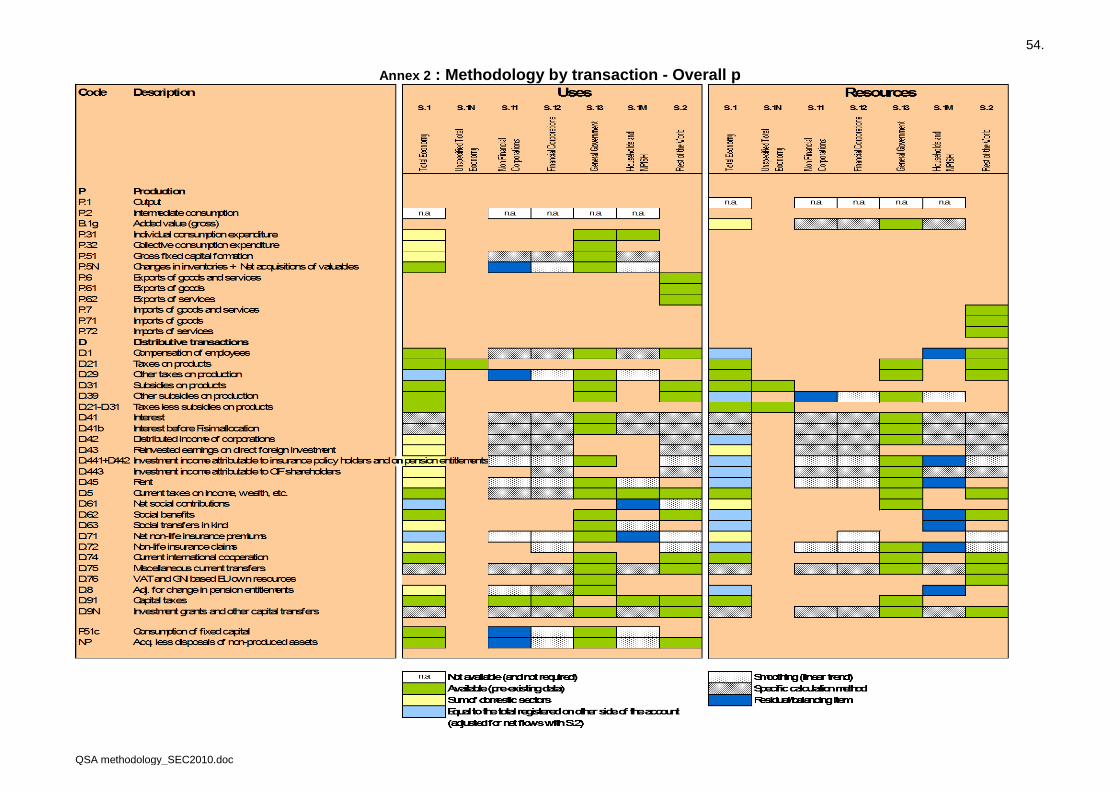
54.
QSA methodology_SEC2010.doc
Annex 2 : Methodology by transaction - Overall p