sourcesofstructure:genetic, environmental, andartifactual...
TRANSCRIPT

Sources of Structure: Genetic,
Environmental, and Artifactual Influences
on the Covariation of Personality Traits
Robert R. McCraeNational Institute on Aging
Kerry L. Jang and W. John LivesleyUniversity of British Columbia
Rainer Riemann and Alois AngleitnerUniversität Bielefeld
ABSTRACT The phenotypic structure of personality traits has been welldescribed, but it has not yet been explained causally. Behavior genetic covari-ance analyses can identify the underlying causes of phenotypic structure;previous behavior genetic research has suggested that the effects from bothgenetic and nonshared environmental influences mirror the phenotype.However, nonshared environmental effects are usually estimated as a residual
Robert R. McCrae, Personality, Stress and Coping Section, Gerontology ResearchCenter, National Institute on Aging, National Institutes of Health; Kerry L. Jang andW. John Livesley, Department of Psychiatry, University of British Columbia, Vancouver,British Columbia, Canada; Rainer Riemann and Alois Angleitner, Department of Psy-chology, Universität Bielefeld, Bielefeld, Germany.
We thank Erik Mutén for providing self/spouse data from Sample B, and John C.Loehlin and Jerry S. Wiggins for helpful comments on the manuscript.
Correspondence concerning this article should be addressed to Robert R. McCrae,Box 03, Personality, Stress and Coping Section, NIA Gerontology Research Center, 5600Nathan Shock Drive, Baltimore, MD 21224-6825. Electronic mail may be sent [email protected].
Journal of Personality 69:4, August 2001.Copyright © 2001 by Blackwell Publishers, 350 Main Street, Malden, MA 02148,USA, and 108 Cowley Road, Oxford, OX4 1JF, UK.
term that may also include systematic bias, such as that introduced by implicitpersonality theory. To reduce that bias, we supplemented data from Canadianand German twin studies with cross-observer correlations on the Revised NEOPersonality Inventory. The hypothesized five-factor structure was found in boththe phenotypic and genetic/familial covariances. When the residual covariancewas decomposed into true nonshared environmental influences and method bias,only the latter showed the five-factor structure. True nonshared environmentalinfluences are not structured as genetic influences are, although there was somesuggestion that they do affect two personality dimensions, Conscientiousnessand Love. These data reaffirm the value of behavior genetic analyses for researchon the underlying causes of personality traits.
For decades, personality psychologists worked to define the phenotypicstructure of personality—the pattern of covariation of observed person-ality traits (Goldberg, 1993). The present near-consensus on the Five-Factor Model (FFM; McCrae & John, 1992) has allowed researchers toproceed to a new question: What accounts for the observed structure?Personality traits are known to be substantially inherited (Loehlin, 1992),but can genetics alone explain the covariation of traits, or is the pheno-typic FFM the net result of combined genetic and environmentalinfluences?
The answer to that question has always been relevant to developmen-talists and clinicians who seek to understand the origins of personality,but it has taken on particular importance in the era of molecular genetics(Plomin & Caspi, 1998). Identifying the particular genes associated withany single trait has been likened to finding “many tiny needles in thehaystacks” (Plomin, 1990, p. 187), and this daunting search must beguided by an understanding of the origins of personality structure.Cloninger, Adolfsson, and Svrakic (1996) have argued that “traits derivedby factor analysis at the phenotypic level, such as extraversion . . . arelikely to be composites of aetiologically heterogeneous facets” that maynot be optimal guides for “unraveling the genetics and neurobiologyunderlying human personality” (p. 3). Indeed, it would make little senseto look for the genes responsible for extraversion if extraversion weremerely a cluster of genetically unrelated traits inculcated by certainpatterns of child rearing.
But are the facets of extraversion (and other phenotypic factors) in factgenetically unrelated? It might seem that molecular genetics itself wouldoffer the most direct answers to such questions, but, to date, progress inthat field has been halting. Early reports of specific genes linked to
512 McCrae et al.
personality traits (Benjamin et al., 1996; Lesch et al., 1996) have not beenconsistently replicated (Flory et al., 1999; Vandenbergh et al., 1997). Atpresent, it appears more realistic to rely on the well-established methodsof behavior genetics.
Genetic Covariance Analyses
Conventional behavior genetics analyses attempt to determine the pro-portion of variance in a trait attributable to genetic and environmentalinfluences. More recently, attention has been focused on the genetic andenvironmental sources of covariance among different traits (e.g., Carey& DiLalla, 1994; Jang & Livesley, 1999). For example, Eley (1997)investigated the possibility that the well-known correlation betweenanxiety and depression might be due to shared genes that influence boththese dispositions. Such analyses can be extended to examine the inter-correlations among many traits, and factor analysis (e.g., Livesley, Jang,& Vernon, 1998) can summarize the structure of genetic and environ-mental influences on personality just as it summarizes the structure oftraits themselves. Genetic covariance analyses might be used to askwhether and to what degree the FFM is the result of genetic and environ-mental influences.
Personality psychologists have frequently assumed that different traitsand trait factors had different sources (Strelau, 1987). In particular, theclassic distinction between temperament and character assumed thatsome traits (such as Neuroticism and Extraversion) were primarily theresult of nature, whereas others (such as Agreeableness and Conscien-tiousness) reflected socialization and personal experience (cf. Cloninger,Przybeck, Svrakic, & Wetzel, 1994). This appealing dichotomy has beencalled into question by recent evidence that traits from all five majorpersonality factors are moderately to strongly heritable (Jang, Livesley,& Vernon, 1996), but the heritability of individual traits does not speakdirectly to the heritability of their patterns of covariance. Traits such asdutifulness, order, and achievement striving might each individually bepartly heritable, but their covariation in defining the Conscientiousnessfactor might be due entirely to environmental influences such as religioustraining or parental encouragement.
Depending on the research design, behavior genetics analyses can esti-mate contributions from additive and non-additive (dominant-recessive)genetic influences, shared environmental influences (e.g., perinatal,
Sources of Structure 513

common family and community influences on both twins), and non-shared environmental influences (experiences unique to each twin).Nonshared environmental influences have become a focus of interest inbehavior genetics because they appear to have as much influence onpersonality as do genes, and a far greater influence than shared environ-mental influences (Bouchard, 1994; Plomin, Chipuer, & Neiderhiser,1994). This is a puzzling finding, because most personality theories havestressed environmental influences (such as parental role models andeducational opportunities) that are generally shared, and because it is farfrom clear why the causal impact of an experience should depend onwhether or not it is shared by family members.
A number of researchers have attempted to identify specific circum-stances or experiences that uniquely shape the personality of one of a pairof twins (e.g., Baker & Daniels, 1990; Hetherington, Reiss, & Plomin,1994; Vernon, Jang, Harris, & McCarthy, 1997), and arguments havebeen made concerning the importance of birth order (Sulloway, 1996)and peer influences (Harris, 1998). But although some of these findingsare suggestive and the arguments provocative, it is fair to say thatresearchers have not yet documented major nonshared environmentalinfluences on personality. One possible reason for this is that much ofthe reported effect may be spurious.
Nonshared environmental influences are normally calculated as aresidual—that is, they are what remains when genetic and shared envi-ronmental influences are removed. One crucial consequence of thisprocedure is that the nonshared environment term includes both randomerror and systematic bias along with any true nonshared environmentalinfluence. Random error contributes to unreliability, and behavior geneti-cists sometimes refine their estimates by expressing heritabilities in termsof the proportion of reliable variance (e.g., Jang, McCrae, Angleitner,Riemann, & Livesley, 1998). Systematic bias is a form of methodvariance and can only be controlled in studies that include multimethodpersonality assessments (e.g., Riemann, Angleitner, & Strelau, 1997)—adesign still rare in behavior genetics research. In the present study weattempt to separate true nonshared environmental effects from artifactsof method bias in analyses of trait covariance.
514 McCrae et al.

The Puzzle of Parallel Structures
An example of genetic covariance analysis was published by Loehlin(1987), who analyzed the structure of item clusters from the CaliforniaPsychological Inventory (CPI; Gough, 1987) in samples of monozygotic(MZ) and dizygotic (DZ) twins. Using formulas that parallel the well-known formulas for estimating the heritability of single traits, Loehlinderived three matrices that represented the covariance among differenttraits, due to genes, shared environment, and nonshared environment.When these matrices were factored, four factors emerged from analysesof genetic covariance that could be interpreted as variants of the FFMfactors of Neuroticism, Extraversion, Openness, and Conscientiousness(items measuring the fifth factor, Agreeableness, are rare in the CPI; seeMcCrae, Costa, & Piedmont, 1993). Two quite different factors emergedin the analysis of shared environmental effects: family problems andmasculinity/ femininity; the former is not an aspect of personality per se,and the latter is probably an artifact of the exclusive use of same-sex twinsin this study (Loehlin, 1987).1
Three interpretable factors were found in the analysis of the nonsharedenvironmental covariance matrix, which, as in the genetic analysis,resembled Neuroticism, Extraversion, and Conscientiousness. Thus, thenonshared environmental influences appeared to mirror most of thegenetic influences. This is not an isolated finding: Livesley, Jang, andVernon (1998) found similar structures in genetic and nonshared envi-ronmental components of traits related to personality disorders, andPlomin, DeFries, and McClearn (1990, p. 236) noted that, across a rangeof studies, “the structure of genetic influences seems to be similar to thestructure of [nonshared] environmental influences.”
Plomin et al. (1990) also pointed out that this phenomenon is surpris-ing: “Most of us would probably predict different patterns of genetic andenvironmental influences” (p. 236). The fact that the pattern of nonshared
1. This interpretation may not be obvious. As Loehlin (1987) explained, “Since the studyexcluded unlike-sex fraternal twin pairs, all of the biological variation associated withsex lies between pairs for both kinds of twin, and thus necessarily is confounded withshared environmental effects” (p. 143). Said another way, same-sex twins will tend toresemble each other in any sex-related variable whether they are DZ or MZ; becauseshared environmental effects are calculated as twice the DZ correlation minus the MZcorrelation, effects that apply equally to both types of twins will appear to contribute toshared environmental effects.
Sources of Structure 515
environmental influences seems to duplicate the pattern of genetic influ-ences might perhaps be explained by hypothesizing that each personalityfactor represents the effects of a neuropsychic structure that is initiallydefined by genes and subsequently modified by experience. But thathypothesis returns us to a question raised earlier: If these presumedneuropsychic structures are so malleable that all five can be modified bynonshared experiences, why are none of them affected by sharedexperiences?
An alternative explanation would call attention to the error-of-measurement components of the nonshared environment term. Ran-dom error would not, of course, create any replicable structure, butsystematic bias could. It has been known for decades that there are infact systematic biases in personality judgments, and the structure of thosebiases is known as implicit personality theory (IPT; Borkenau, 1992).
In an early demonstration of IPT, Passini and Norman (1966) askedstudents to rate the personalities of complete strangers. Although eachindividual rating was presumably an arbitrary guess, Passini and Normanfound that guessing followed a clear pattern: Students who supposed thatthe strangers were talkative also imagined that they were sociable andcheerful; across a range of targets, these associations defined an Extra-version factor. Factor analysis of all the ratings showed a structure veryclose to the FFM.
Some researchers concluded from such studies that personality traitstructure was nothing but a projection of semantic biases onto personperceptions (Shweder, 1975). But a variety of studies have since con-firmed that personality traits are veridical (e.g., Woodruffe, 1985), andthe parallel between the FFM and IPT is easily understandable: IPTclosely resembles the real structure of personality because individualshave learned, with reasonable accuracy, the true associations betweentraits (c.f., Sneed, McCrae, & Funder, 1998). Students guess that astranger who is talkative is also sociable, because, in fact, talkative peopleare usually sociable.
In ratings of strangers the observed structure must represent IPTbecause it cannot be influenced by the (unknown) true personalities ofthe targets. But the structure of self-reports and ratings of well-knowntargets is also likely to include some degree of IPT bias. Cross-observercorrelations on personality traits typically range from .4 to .6 (McCrae &Costa, 1989), well below scale reliability. The method variance thataccounts for the discrepancy between reliability and validity is probably
516 McCrae et al.

structured in terms of IPT. For example, two observers may agree that atarget is sociable but disagree on just how sociable the target is. Theobserver who gives a higher rating for sociability is also likely to give ahigher rating for cheerfulness and talkativeness. Thus, part of the covari-ance of these traits may be attributable to systematic biases in personperception, which result in correlated errors in individual judgments.
If these biases do indeed take the form of IPT, then similarities instructure between genetic covariance and nonshared environmental co-variance could be due entirely to the presence of IPT bias in the latter.That hypothesis is testable but only by designing a new way of estimatingnonshared environmental influences that is free of IPT.
Estimating the Componentsof Trait Covariances
The classic design for genetic covariance analysis (e.g., Loehlin, 1987)in reared-together twin samples requires three correlation matrices: Thephenotypic correlation matrix, R, which is based on the self-reports of asample of twins; the mean cross-correlation matrix of a subsample ofMZ twins, Rmz, and the mean cross-correlation matrix of a subsampleof DZ twins, Rdz. (Cross-correlation matrices consist of correlations ofTrait X in Twin A with Trait Y in Twin B and of Trait Y in Twin A withTrait X in Twin B; the average of these two is the mean cross-correlation.)
As Loehlin (1987) noted, the classic assumption that MZ twins shareall their genes, whereas DZ twins share, on average, only half, makes itpossible to estimate covariance matrices from these three. Specifically,the genetic covariance matrix (Cg), shared environmental covariancematrix (Cs), and nonshared environmental covariance matrix (Cns) canbe estimated as follows:
1) Cg = 2*(Rmz – Rdz);
2) Cs = 2*Rdz – Rmz;
and
3) Cns = R – Rmz.
Note that all these are estimated covariance matrices; we discuss theirdiagonal values and strategies for factoring them in the Analyses section.
Sources of Structure 517
As Rowe (1982) pointed out, the cross-correlation matrices in thisdesign (Rmz and Rdz) ought to be relatively free of IPT bias, “since thecorrelations represent the association between traits independently re-ported by two individuals [Twin A and Twin B]” (p. 1072); the biases inone twin would likely not be shared by the other.2 It follows that Cg andCs should also be relatively free of IPT bias. Cns, however, involves thematrix R, which is a monomethod correlation matrix potentiallycontami-nated by IPT bias.
To produce an IPT-free Cns matrix, we need an estimate of theintercorrelation of phenotypic traits which is itself IPT-free, and this canonly be obtained from a heteromethod matrix in which traits are inde-pendently assessed by two different methods. The most convenientsource of such a matrix comes from mean cross-correlations betweentwo raters of the same target individuals. In the present article we willemploy a matrix of self/spouse correlations, Rss. In principle, Rssreflects genetic, shared environmental, and true nonshared environ-mental influences along with random error, but it excludes systematicbiases, which are unlikely to be shared by self and spouse. Table 1presents a model of the sources of variance in the observed correlationmatrices.
Together, R and Rss can be used to estimate covariance among traitsdue to IPT bias,
4) Cipt = R – Rss;
and Rss can replace R in the computation of an IPT-free nonsharedenvironmental covariance matrix Cns′, estimated as
5) Cns′ = Rss – Rmz.
Note that in these formulas the conventional Cns has been decomposedinto bias and true nonshared influence:
6) Cns = (Cipt + Cns′) = (R – Rss + Rss – Rmz) = (R – Rmz).
Factor analyses generally require large samples, and that is especiallyso when the matrices factored are based on difference scores. In this study
2. If IPT bias is itself heritable or due to shared environmental effects, than MZ and DZcross-correlations would also be contaminated with IPT bias, as would matrices derivedfrom them. There is at present no evidence for such effects, and the present articleassumes that, if they exist, they are small.
518 McCrae et al.

we conduct the primary analyses in a sample that combines German andCanadian twin samples. Previous analyses (Jang et al., 1998) suggestthat, despite differences of language and culture, the two samples aresufficiently similar in genetic and environmental influences to justifycombining them; averaging the two correlation matrices eliminates anyeffects due to mean level differences. The combined sample is used in aseries of analyses that compare the structure of covariance matrices withthe FFM. Previous research suggests that we should replicate the FFMin the phenotypic covariance of traits (R and Rss), the genetic covariance(Cg), the nonshared environmental covariance including IPT bias (Cns),and (as Passini & Norman, 1966, found) in pure measures of IPT bias(Cipt). We hypothesize that we will replicate the FFM neither in theshared environmental covariance, Cs, because shared environment usu-ally plays little or no role in shaping personality, nor in the IPT-freenonshared covariances, Cns′, because that would lead to the puzzlingparallelism noted above.
However, a failure to find the FFM does not mean that there is nostructure at all. Subsequent analyses will therefore examine alternativefactor solutions. Analyses will be conducted in parallel on two randomsubsamples; factor congruence will be used to identify a replicable factorsolution (cf. Everett, 1983).
Ideally, the Rss matrix would be obtained from self- and spouse ratingsof the twins. Those data are not, however, available. Instead, we employself/spouse data from two American samples, on the assumption thatself/spouse correlations are likely to be very similar across samples,whether or not the targets happen to be twins. Future research shouldinclude multiple observer ratings on the twins in the study.
Table 1A Model of Sources of Variance in Four Correlation Matrices
R = G + Es + Ens + IPT + εRmz = G + Es + εRdz = ½G + Es + εRss = G + Es + Ens + ε,
where G = genetic influences, Es = shared environmental influences, Ens= nonshared environmental influences, IPT = influence of implicitpersonality theory, and ε = random error.
Sources of Structure 519

Statistical Approach
Most contemporary behavior geneticists employ versions of structuralequation modeling, such as confirmatory factor analysis (CFA), to con-duct multivariate behavior genetic analyses (Neale & Cardon, 1992).These techniques were designed to provide both parameter estimates andstatistical tests of significance. Unfortunately, the tests appear to behighly sensitive to both sample size and violations of assumptions (Hu,Bentler, & Kano, 1992). Furthermore, when dealing with complex struc-tures, CFA—with its usual reliance on chi-square as the primary fitindex—may reject highly replicable structures (McCrae, Zonderman,Costa, Bond, & Paunonen, 1996). Technical problems are frequentlyencountered when large matrices are factored, and CFA is not appropriatefor situations in which data exploration is required.
In the present study we adopt an alternative approach. We beginwith simple cross-twin correlations, which are appropriate because non-additive genetic effects have not been found in analyses of NEO-PI-Rscales in these samples (Jang et al., 1998). Exploratory factor analysesare supplemented with targeted rotations, and both Varimax and orthogo-nal Procrustes solutions are evaluated by congruence coefficients (Haven& ten Berge, 1977). Although oblique Procrustes rotation can severelydistort interpretation of data through capitalization on chance (Horn,1967), orthogonal Procrustes rotation is much less susceptible to theseproblems. Monte Carlo simulations (McCrae et al., 1996) demonstratethat high congruence coefficients are extremely rare when random dataare rotated by orthogonal Procrustes rotation.
Procrustes rotation is a form of confirmatory factor analysis, in whichobserved matrices are rotated toward a target matrix—in this case, thephenotypic FFM as seen in American normative data (Costa & McCrae,1992). It is possible that the underlying sources of covariance form someother structures. To differentiate these from chance, we must look forreplicable structures, and, for that purpose, systematic comparisons offactor structures from random halves of the sample will be examined (cf.Everett, 1983). Replicable structures might be used as targets for confir-matory analyses in future studies.
520 McCrae et al.

METHOD
Participants
Participants were 709 monozygotic (MZ) and 444 dizygotic (DZ) volunteergeneral population twin pairs from Canada and Germany. The Canadian dataand portions of the German data have been published previously and aredescribed in Jang et al. (1998).
Canadian twins. The Canadian sample consisted of 183 MZ twins (75 brotherand 108 sister pairs) and 175 DZ twins (48 brother, 84 sister, and 43 brother-sisterpairs). The mean age of the MZ pairs is 31.92 years, SD = 12.75 years, range16–71 years. The mean age of the DZ pairs is 31.51 years, SD = 11.19 years,range 16–68 years. Twin pairs were recruited from Vancouver, Canada, by theUniversity of British Columbia Twin Project, an ongoing study of psychiatricdisorder and personality (see also Jang, Livesley, Vernon, & Jackson 1996). Toreduce sampling bias, twins were paid to participate (Lykken, Tellegen, &DeRubis, 1978), yielding approximately equal numbers of MZ and DZ twins.
German twins. The German sample consisted of 526 MZ (103 brother and423 sister pairs) and 269 DZ (38 brother, 163 sister, and 68 brother-sister) twinpairs recruited from across Germany by the University of Bielefeld Twin Study(see Riemann, Angleitner, & Strelau, 1997). Twins were recruited throughnewspaper advertisements and media stories. Although MZ twins were over-represented relative to DZ twins, the fact that German and Canadian samplesshowed similar genetic structures (Jang et al., 1998) suggests that bias in theGerman study is minimal. The mean age of the MZ pairs is 32.34 years,SD = 13.44 years, range 15–80 years. The mean age of the DZ pairs is 31.23years, SD = 11.93 years, range 14–66 years.
Zygosity was diagnosed in the Canadian sample by a questionnaire designedby Nichols and Bilbro (1966) and in the German sample by a questionnairedesigned by Oniszczenko, Angleitner, Strelau, and Angert (1993). Both ques-tionnaires have been shown to predict zygosity as determined by red blood cellpolymorphism analysis with at least 94% accuracy (e.g., Kasriel & Eaves, 1976).
Self/Spouse samples. Self/spouse correlations were obtained from two samplesthat were pooled to provide a stable estimate of Rss. Sample A consisted of47 couples who each rated themselves and their spouses. Participants weremembers of the Baltimore Longitudinal Study of Aging (BLSA; Shock et al.,1984), ranging in age from 26 to 85. BLSA participants in general are healthy,well-educated, community-dwelling volunteers. For details on this sample, seeMcCrae, Stone, Fagan, and Costa (1998). Sample B included 59 women and46 men, aged 23 to 68, who were private practice psychotherapy patients andwho volunteered to provide self-reports and spouse ratings of personality. As a
Sources of Structure 521

group they scored in the high range on Neuroticism but in the average range onthe other factors.
Recent research (Livesley, Jang, & Vernon, 1998; Yang et al., 1999) has shownthat the structure of personality is essentially the same in normal and clinicalsamples, and preliminary factor analysis of Rss matrices from Samples A andB separately showed similar structures. There are, however, mean level differ-ences between volunteer and clinical samples. To control for these differences,correlations were calculated within sample and averaged across the two samples.
Measure and Procedures
Personality was assessed by the Revised NEO Personality Inventory (NEO-PI-R;Costa & McCrae, 1992), a questionnaire measure of the FFM. The NEO-PI-Rconsists of 30 eight-item facet scales, six for each of the five factors. Evidenceon the reliability, stability, and validity of the instrument is summarized in themanual.
The NEO-PI-R was originally developed in English but has subsequentlybeen translated into several other languages; the American factor structure hasbeen consistently replicated in these translations (McCrae & Costa, 1997). TheGerman version of the NEO-PI-R (Ostendorf & Angleitner, 1994) was used inthe German twin study.
In addition to the usual first-person, self-report version, the NEO-PI-R has athird-person version designed for observer ratings of personality; evidence ofreliability and validity are presented in the manual. In the present study,self-reports and spouse ratings were gathered independently, although respon-dents were aware that the two would be compared. Self/spouse agreement onthe five factors ranged from .46 to .74 in Sample A and from .55 to .73 inSample B, all p < .001.
Analyses
The matrices of chief interest in this study are estimated rather than observed,and, as Loehlin (1987) pointed out, are “not necessarily proper correlationor covariance matrices” (p. 140). In particular, the diagonal values of theresidual matrices are problematic; although all of them ought in principle to benon-negative, in fact, a small number of negative values were found, complicat-ing the process of factoring.
Two strategies were considered. Because it has been used in most studies ofthe FFM, principal components (PC) analysis (with 1s substituted for thediagonal values) appeared to be a straightforward way to describe structure,giving unit weight to each variable. A theoretically quite different approach isoffered by minimum residual (MINRES) factor extraction. MINRES is an
522 McCrae et al.

iterative process that seeks to minimize the off-diagonal residuals, withoutregard to the diagonal. MINRES factors best account for the observed orestimated cross-correlations that are the focus of the present paper and thusmight be regarded as the factor method of choice.
Preliminary analyses were conducted for three matrices: Rmz, Rdz, andCns′. For each, five PC factors and five MINRES factors were extracted, andboth sets were subjected to Varimax rotation. Factor congruence coefficientswere calculated between corresponding factors. Although factor loadings weresomewhat lower in the MINRES analyses, congruences for the five factorsacross the three analyses ranged from .96 to 1.00 (median = .99), demonstratingidentical patterns. This analysis suggests that the method of factor analysis islargely irrelevant, probably because the sheer number of off-diagonal elements(870) outweighs the diagonal elements (cf. Velicer & Jackson, 1990).
Because it is both more familiar and computationally simpler, PC wasadopted for subsequent analyses. In the first phase, five varimax-rotated factorswere examined, and congruence coefficients were calculated to compare themto the phenotypic FFM structure in published norms (Costa & McCrae, 1992).Coefficients above .90 are conventionally required as evidence of factor repli-cation, although Haven & ten Berge (1977) have shown that values as low as.85 correspond to expert human judgments of a match.
When hypothesized factor structures fail to show high congruence, it may insome cases be attributable to arbitrary differences in rotation. In such cases, atargeted rotation serves as a more appropriate test of factor matching because itevaluates the best possible alignment between two factor matrices (McCraeet al., 1996). Targeted rotations were examined in those cases in which varimaxfactors did not replicate the FFM.
Whenever targeted rotations failed to reproduce the FFM, exploratory analy-ses were conducted to ascertain whether there was some other replicablestructure in the data. For these analyses, Canadian and German twin sampleswere randomly divided into halves, and two sets of covariance matrices werecomputed, each combining data from half the Canadian and half the Germansamples. The first unrotated factor and Varimax rotations of two through eightfactors were compared across the two subsamples; the solution in which allfactors could be matched determined the correct number of factors to extract.This method is particularly useful in the analysis of covariance matrices, inwhich the usual rules for number of factors in a correlation matrix may not apply.
RESULTS
Table 2 reports congruence coefficients, comparing factors from covari-ance matrices in the present study with the published factor structure ofthe NEO-PI-R (Costa & McCrae, 1992). (The basic correlation and factor
Sources of Structure 523

loading matrices are available from the first author.) The phenotypicstructure of personality as assessed by Canadian and German twins’self-reports (R) is a near-perfect replication of the original Americanfactor structure. A replication almost as good is provided by factoring thecross-observer correlations from the self/spouse sample (Rss), despitethe fact that this second, heteromethod matrix is presumably free ofIPT bias.
Conventional behavior genetics analyses have typically shown mini-mal contribution of shared environment to the variance of individual traits(Loehlin, 1992). Previous analyses of the present data (Jang et al., 1998)showed that the best fitting models for most NEO-PI-R facets excludedany shared environmental effect. The third row of Table 2 suggests thatshared environmental effects (Cs) appear to contribute little to thephenotypic FFM structure. Congruences were poor even after Procrustesrotation, with congruence coefficients ranging from .39 for Agreeable-ness to .74 for Extraversion.
Analyses of the genetic covariance matrix, Cg, yield at best a fairmatch, with only two factors—Openness and Agreeableness—showingconventionally acceptable levels of factor replication. In this case, Pro-crustes rotation improves congruences, yielding values of .87, .81, .94,.91, and .75 for N, E, O, A, and C factors, respectively. In evaluating these
Table 2Congruence Coefficients Between Varimax-rotated Factors
in the Present Study and the Normative NEO-PI-R Factors
FactorMatrix N E O A C
PhenotypeTwins’ Self-reports (R) .99 .97 .97 .99 .99Self/Spouse Ratings (Rss) .96 .93 .91 .98 .98
Shared Environment (Cs) .68 .68 .12 .30 .68Genetic/Familial
Genetic (Cg) .83 .72 .92 .88 .70Familial (Rmz) .98 .95 .97 .98 .97Familial (Rdz) .93 .92 .85 .86 .88
Nonshared EnvironmentWith IPT Bias (Cns) .96 .93 .90 .93 .97IPT Bias (Cipt) .81 .45 .81 .89 .85Without IPT Bias (Cns′) .53 .68 .27 .61 .80
524 McCrae et al.

values, it must be recalled that the Cg matrix is composed of differencesbetween two other matrices and that difference scores are notoriouslyunreliable. Alternative estimates of genetic covariance that avoid differ-ence scores are given by Rmz and Rdz. In theory, those matrices includeboth shared environmental and genetic covariances, but if one assumesshared environmental effects are trivial in size (Jang et al., 1998), Rmzand Rdz can be used directly as more reliable bases for assessing thestructure of genetic covariance. Because genetic influences are twice aslarge in Rmz as in Rdz, the former may show a clearer FFM structure.
As Table 2 shows, the FFM structure is clearly replicated in theseanalyses, especially the MZ data. As Rowe (1982) argued, these resultseffectively refute the hypothesis that the factor structure of traits isattributable solely to IPT.
The last three rows of Table 2 examine the structure of the nonsharedenvironmental covariance. As in previous research (e.g., Loehlin, 1987),when calculated as the residual from the monomethod matrix R, Cnsfaithfully reproduces the phenotypic structure. These data are consistentwith a large literature (Plomin et al., 1990) showing parallels betweengenetic and nonshared environmental structures. But this covariancematrix can itself be decomposed into two others, one representing IPTbias, the other, true nonshared environmental effects uncontaminated byIPT bias.
Both R and Rss estimate the covariance of phenotypic traits in indi-vidual targets, but the monomethod R matrix includes method bias thatthe heteromethod Rss matrix lacks. When the difference, Cipt, is fac-tored, the results show considerable resemblance to the FFM, except forthe E factor. After Procrustes rotation, the observed congruences are .85,.73, .79, .91, and .91. N, A, and C factors are replicated in IPT, and theremaining factors show some resemblance to E and O.
Factors from the final matrix, representing IPT-free nonshared envi-ronmental covariance, show low congruences with the FFM. Even afterProcrustes rotation (see Table 3), congruence coefficients for N, E, O, A,and C are only .71, .75, .57, .75, and .79, respectively. Although thesevalues are technically higher than chance, as shown in Monte Carlosimulations (McCrae et al., 1996), they would be judged terrible to poormatches by Tucker’s criteria (MacCallum, Widaman, Zhang, & Hong,1999). Variable congruence coefficients show that only 9 of the 30 facetsshow a better-than-chance similarity to the target structure.
Sources of Structure 525

Table 3Factor Loadings From the IPT-Free Nonshared Environmental
Covariance Matrix After Procrustes Rotation
NEO-PI-R Factor VariableFacet N E O A C Congruence
NeuroticismAnxiety .48 –.10 –.15 .11 .04 .89*Angry Hostility .32 .06 .05 –.43 .20 .85Depression .48 –.13 –.11 .12 –.04 .90*Self-Consciousness .19 .05 –.31 .22 .05 .47Impulsiveness .09 –.08 .22 .03 –.39 .41Vulnerability .35 .15 .06 –.14 .15 .43
ExtraversionWarmth .25 .36 .17 .38 .00 .79Gregariousness .23 .49 .23 .33 .08 .68Assertiveness .07 .03 .39 –.17 .32 .59Activity .03 .31 –.42 –.13 .17 .48Excitement Seeking –.37 .27 .22 –.15 .26 .53Positive Emotions –.17 .52 .01 –.05 –.20 .81
Openness to ExperienceFantasy –.05 .23 .24 –.23 –.32 .81Aesthetics –.08 .35 .30 –.13 –.20 .42Feelings .36 .29 .25 .09 .01 .93*Actions –.37 .47 –.10 –.05 .08 .29Ideas –.15 –.42 .37 –.09 –.04 .66Values –.04 –.11 .53 .33 .03 .67
AgreeablenessTrust –.20 .21 –.09 .33 .08 .89*Straightforwardness –.04 –.06 –.05 .11 .25 .70Altruism .01 .29 .06 .34 .10 .97**Compliance –.23 .06 –.02 .47 .07 .93*Modesty –.03 –.19 –.22 .22 –.06 .77Tender-Mindedness –.13 .19 .34 .30 –.03 .78
ConscientiousnessCompetence –.11 –.16 .05 .17 .38 .75Order .08 .11 –.08 –.07 .47 .95**Dutifulness .06 .02 .05 –.02 .49 .83Achievement Striving –.21 .08 –.23 –.16 .40 .74Self-Discipline –.16 .11 –.04 .06 .51 .99**Deliberation –.31 –.18 –.06 .33 .29 .89*
Factor Congruence .71** .75** .57* .75** .79**
Note. Loadings greater than .30 in absolute magnitude are given in boldface. *Congru-ence higher than that of 95% of rotations from random data. **Congruence higher thanthat of 99% of rotations from random data.
526 McCrae et al.

A comparison of corresponding factor congruence coefficients follow-ing Procrustes rotation shows that each of these values is substantiallylower in the analysis of Cns′ than in the analysis of Cipt. Thus, when theconventional estimates of nonshared environmental covariances are de-composed into IPT bias and true nonshared effects, most of the resem-blance to the FFM appears to be attributable to the IPT bias.
Two matrices of interest—Cs and Cns′—do not conform to the FFM,but it is possible they have some other replicable structure. Table 4 reportsthe results of parallel factor analyses conducted on two random subsam-ples of twins. We calculated congruence coefficients for the unrotatedfirst factor, and for Varimax-rotated two-, three-, four-, five-, six-, seven-,and eight-factor solutions. Factors were matched by identifying thehighest congruence coefficient, then the highest coefficient among theremaining factors, and so on. In such analyses, congruence coefficients
Table 4Factor Congruences for Varimax-Rotated Principal Components
in Two Random Subsamples
Factor Congruence CoefficientFactors Rotated 1st 2nd 3rd 4th 5th 6th 7th 8th
Shared Environment (Cs)8 .49 .39 .39 .36 .30 .23 .19 .087 .56 .56 .37 .36 .26 .21 .086 .51 .49 .42 .26 .25 .125 .62 .50 .25 .25 .064 .64 .34 .23 .003 .64 .29 .222 .72 .311 .54
Nonshared Environment Without IPT Bias (Cns′)8 .87 .81 .78 .75 .63 .49 .44 .237 .79 .74 .71 .66 .57 .37 .116 .82 .78 .75 .68 .62 .605 .88 .80 .67 .56 .464 .80 .80 .69 .683 .78 .68 .012 .82 .801 .29
Sources of Structure 527

are evaluated as a set (Everett, 1983)—that is, one seeks the solution inwhich all congruences exceed .90 (or perhaps, .85). It is clear that noneof the solutions meets this criterion; no solution is replicable over randomhalves of the present sample.
It is, however, perhaps worthwhile to relax the usual criteria. Noneof the solutions for Cs even approaches replication, as would beexpected given the negligible influence shared environmental factorshave repeatedly been shown to have on personality variables. However,the two-factor solution for Cns′ merits some attention. As shown in Table5, Factor I has loadings over .30 in both samples for Activity, Order,Dutifulness, Achievement Striving, Self-Discipline, and (low) Impul-siveness, and thus resembles a broad form of Conscientiousness. Fac-tor II includes Warmth, Gregariousness, Positive Emotions, Openness toFeelings, Altruism, and Tender-Mindedness. That combination of traitsfrom Extraversion and Agreeableness domains produces a factor thatresembles the Love axis of the Interpersonal Circumplex (Wiggins,1979). The other interpersonal axis—Dominance—does not appear to beinfluenced by the nonshared environment: Note that Assertiveness loadson neither factor.
DISCUSSION
Behavior genetic covariance analyses are designed to reveal the under-lying causal sources of structure in trait associations. In addition to theusual separation of genetic, shared environmental, and nonshared envi-ronmental effects, the present study decomposed the nonshared environ-mental influences into method covariance and true environmental effects.
Results showed that the familiar five-factor structure of personalitycan be found not only in the phenotype but also in the genotype,particularly as estimated by cross-correlations from MZ twins. Thesedata provide no basis for a distinction between the hypothesized geneti-cally determined temperament factors (Neuroticism and Extraversion)and the putatively environmentally determined character factors (Open-ness, Agreeableness, and Conscientiousness); the structure of all fivefactors is genetically based. Ironically, as the congruence coefficients inTable 2 attest, the clearest factor replication in these analyses of geneticcovariance is for Openness to Experience, a dimension sometimes heldto be “unnecessarily ambiguous and complex” (Carroll, in press, p. 35;cf. Glisky, Tartaryn, Tobias, Kihlstrom, & McConkey, 1991). The present
528 McCrae et al.
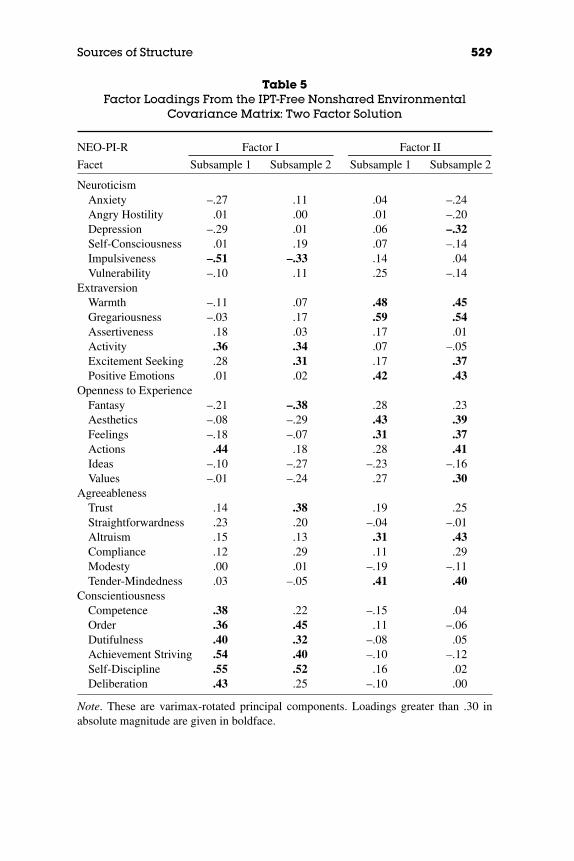
Table 5Factor Loadings From the IPT-Free Nonshared Environmental
Covariance Matrix: Two Factor Solution
NEO-PI-R Factor I Factor II
Facet Subsample 1 Subsample 2 Subsample 1 Subsample 2
NeuroticismAnxiety –.27 .11 .04 –.24Angry Hostility .01 .00 .01 –.20Depression –.29 .01 .06 –.32Self-Consciousness .01 .19 .07 –.14Impulsiveness –.51 –.33 .14 .04Vulnerability –.10 .11 .25 –.14
ExtraversionWarmth –.11 .07 .48 .45Gregariousness –.03 .17 .59 .54Assertiveness .18 .03 .17 .01Activity .36 .34 .07 –.05Excitement Seeking .28 .31 .17 .37Positive Emotions .01 .02 .42 .43
Openness to ExperienceFantasy –.21 –.38 .28 .23Aesthetics –.08 –.29 .43 .39Feelings –.18 –.07 .31 .37Actions .44 .18 .28 .41Ideas –.10 –.27 –.23 –.16Values –.01 –.24 .27 .30
AgreeablenessTrust .14 .38 .19 .25Straightforwardness .23 .20 –.04 –.01Altruism .15 .13 .31 .43Compliance .12 .29 .11 .29Modesty .00 .01 –.19 –.11Tender-Mindedness .03 –.05 .41 .40
ConscientiousnessCompetence .38 .22 –.15 .04Order .36 .45 .11 –.06Dutifulness .40 .32 –.08 .05Achievement Striving .54 .40 –.10 –.12Self-Discipline .55 .52 .16 .02Deliberation .43 .25 –.10 .00
Note. These are varimax-rotated principal components. Loadings greater than .30 inabsolute magnitude are given in boldface.
Sources of Structure 529
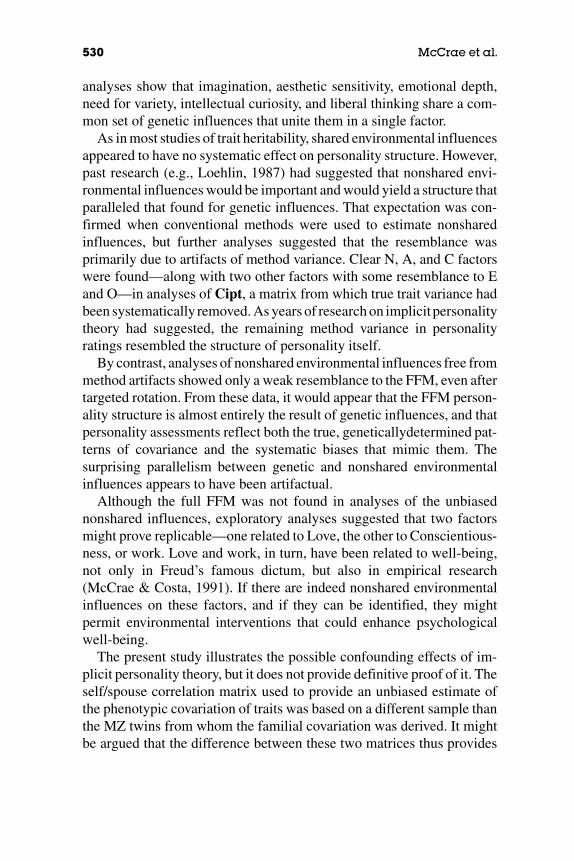
analyses show that imagination, aesthetic sensitivity, emotional depth,need for variety, intellectual curiosity, and liberal thinking share a com-mon set of genetic influences that unite them in a single factor.
As in most studies of trait heritability, shared environmental influencesappeared to have no systematic effect on personality structure. However,past research (e.g., Loehlin, 1987) had suggested that nonshared envi-ronmental influences would be important and would yield a structure thatparalleled that found for genetic influences. That expectation was con-firmed when conventional methods were used to estimate nonsharedinfluences, but further analyses suggested that the resemblance wasprimarily due to artifacts of method variance. Clear N, A, and C factorswere found—along with two other factors with some resemblance to Eand O—in analyses of Cipt, a matrix from which true trait variance hadbeen systematically removed. As years of research on implicitpersonalitytheory had suggested, the remaining method variance in personalityratings resembled the structure of personality itself.
By contrast, analyses of nonshared environmental influences free frommethod artifacts showed only a weak resemblance to the FFM, even aftertargeted rotation. From these data, it would appear that the FFM person-ality structure is almost entirely the result of genetic influences, and thatpersonality assessments reflect both the true, geneticallydetermined pat-terns of covariance and the systematic biases that mimic them. Thesurprising parallelism between genetic and nonshared environmentalinfluences appears to have been artifactual.
Although the full FFM was not found in analyses of the unbiasednonshared influences, exploratory analyses suggested that two factorsmight prove replicable—one related to Love, the other to Conscientious-ness, or work. Love and work, in turn, have been related to well-being,not only in Freud’s famous dictum, but also in empirical research(McCrae & Costa, 1991). If there are indeed nonshared environmentalinfluences on these factors, and if they can be identified, they mightpermit environmental interventions that could enhance psychologicalwell-being.
The present study illustrates the possible confounding effects of im-plicit personality theory, but it does not provide definitive proof of it. Theself/spouse correlation matrix used to provide an unbiased estimate ofthe phenotypic covariation of traits was based on a different sample thanthe MZ twins from whom the familial covariation was derived. It mightbe argued that the difference between these two matrices thus provides
530 McCrae et al.

only a rough estimate of the unbiased, nonshared environmental effects,potentially distorted by sample differences. However, both twin andself/spouse samples showed the same five-factor structure in the pheno-type, so any sample differences must have been relatively subtle.
A somewhat different problem is raised by the possibility that spouseratings are not fully independent of self-reports. Spouses may, to someextent, have adopted the biased perceptions of the target; Rss would thenbe at least somewhat contaminated by IPT bias. The effect of such ashared bias would be to reduce the artifactual variance in Cipt andincrease it in Cns′. Thus, Table 4 appears to give conservative estimatesof how well method variance mimics the FFM and how poorly truenonshared environmental effects do.
It might also be objected that the present design was less than optimalbecause the data came not only from different observers but also fromdifferent kinds of observers. Self-reports and spouse ratings representinternal and external perspectives on personality, respectively, and it ispossible that IPT takes a somewhat different form when applied to self-and other assessments. A cleaner design would rely on two (or more)peer raters for each member of a sample of MZ twins. R would then bederived from single peer ratings, Rss (here, Rpp) from peer/peer cross-correlations, and Rmz from cross-twin correlations based on single peerratings. A comparison of the structures in Cns, Cipt, and Cns′ derivedfrom these matrices would provide a clear test of the relative importanceof bias and true nonshared environmental influences. Such data arecurrently being collected.
Finally, it should be recalled that the present design involved factoranalysis of estimated covariation matrices that may not have preservedsome of the mathematical properties of true covariance matrices. The factthat generally sensible results were obtained, however, suggests that anydistortions introduced were probably minor.
The problem of unreliability in conventional behavior geneticanalyses has frequently been addressed; failures to take it into accountcan lead to an underestimation of the effects of genetic and sharedenvironmental effects. But less attention has been paid to systematicbias, which can be particularly misleading in genetic covarianceanalyses. The present analyses suggest that the role of nonsharedenvironmental effects has been misunderstood, with important conse-quences. The search for mechanisms by which such influences affectpersonality should take a different direction if their effects are limited
Sources of Structure 531

to Love and Conscientiousness than if, as previously believed (Plominet al., 1990), they duplicate the full range of genetic effects.
CONCLUSION
Turkheimer (1998) has argued that almost all human behavior can beshown to be heritable and, thus, that evidence on heritability is notinformative: “the very ubiquity of these findings makes them a poor basisfor reformulating scientists’ conceptions of human behavior” (p. 782). Itis certainly the case that the mere identification of a genetic influencedoes not automatically point to specific genes or to neuropsychologicalstructures or processes that explain the trait or behavior. But the analysespresented here have important implications for research on the determi-nants of personality. Shared environmental influences (which have pre-occupied personality theorists and researchers until recently; Scarr,1987) are apparently unimportant; the role of nonshared environmentalinfluences also appears to have been misunderstood. However difficultthe search for specific genes may prove to be, there is at least reason tothink that it is on the right track.
REFERENCES
Baker, L. A., & Daniels, D. (1990). Nonshared environmental influences and personalitydifferences in adult twins. Journal of Personality and Social Psychology, 58, 103–110.
Benjamin, J., Li, L., Patterson, C., Greenberg, B. D., Murphy, D. L., & Hamer, D. H.(1996). Population and familial association between the D4 dopamine receptor geneand measures of novelty seeking. Nature Genetics, 12, 81–84.
Borkenau, P. (1992). Implicit personality theory and the five-factor model. Journal ofPersonality, 60, 295–327.
Bouchard, T. J., Jr. (1994). Genes, environment, and personality. Science, 264,1700–1701.
Carey, G., & DiLalla, D. L. (1994). Personality and psychopathology: Genetic perspec-tives. Journal of Abnormal Psychology, 103, 32–43.
Carroll, J. B. (in press). The Five-Factor Personality Model: How complete and satisfac-tory is it? In H. Braun, D. Wiley, D. N. Jackson, & D. E. Wiley (Eds.), The role ofconstructs in psychological and educational measurement. Mahwah, NJ: LawrenceErlbaum Associates.
Cloninger, C. R., Adolfsson, R., & Svrakic, N. M. (1996). Mapping genes for humanpersonality. Nature Genetics, 12, 3–4.
Cloninger, C. R., Przybeck, T. R., Svrakic, D. M., & Wetzel, R. D. (1994). TheTemperament and Character Inventory (TCI): A guide to its development and use.St. Louis, MO: Center for Psychobiology of Personality, Washington University.
532 McCrae et al.
Costa, P. T., Jr., & McCrae, R. R. (1992). Revised NEO Personality Inventory (NEO-PI-R)and NEO Five-Factor Inventory (NEO-FFI) professional manual. Odessa, FL: Psy-chological Assessment Resources, Inc.
Eley, T. C. (1997). General genes: A new theme in developmental psychopathology.Current Directions in Psychological Science, 6, 90–95.
Everett, J. E. (1983). Factor comparability as a means of determining the number offactors and their rotation. Multivariate Behavioral Research, 18, 197–218.
Flory, J. D., Manuck, S. B., Ferrell, R. E., Dent, K. M., Peters, D. G., & Muldoon, M. F.(1999). Neuroticism is not associated with the serotonin transporter (5-HTTLPR)polymorphism. Molecular Psychiatry, 4, 93–96.
Glisky, M. L., Tartaryn, D. J., Tobias, B. A., Kihlstrom, J. F., & McConkey, K. M. (1991).Absorption, Openness to Experience, and hypnotizability. Journal of Personality andSocial Psychology, 60, 263–272.
Goldberg, L. R. (1993). The structure of phenotypic personality traits. American Psy-chologist, 48, 26–34.
Gough, H. G. (1987). California Psychological Inventory administrator’s guide. PaloAlto, CA: Consulting Psychologists Press.
Harris, J. R. (1998). The nurture assumption: Why children turn out the way they do. NewYork: The Free Press.
Haven, S., & ten Berge, J. M. F. (1977). Tucker’s coefficient of congruence as a measureof factorial invariance: An empirical study. Heymans Bulletin, 290EX. The Nether-lands: University of Groningen.
Hetherington, E.M., Reiss, D., & Plomin, R. (1994). Separate social worlds of siblings:The impact of nonshared environment on development. Hillsdale, NJ: Erlbaum.
Horn, J. L. (1967). On subjectivity in factor analysis. Educational and PsychologicalMeasurement, 27, 811–820.
Hu, L., Bentler, P. M., & Kano, Y. (1992). Can test statistics in covariance structureanalysis be trusted? Psychological Bulletin, 112, 351–362.
Jang, K. L., & Livesley, W. J. (1999). Why do measures of normal and disorderedpersonality correlate? A study of genetic comorbidity. Journal of Personality Disor-ders, 13, 10–17.
Jang, K. L., Livesley, W. J., & Vernon, P. A. (1996). Heritability of the big five personalitydimensions and their facets: A twin study. Journal of Personality, 64, 577–591.
Jang, K. L., Livesley, Vernon, P. A., & Jackson, D. N. (1996). Heritability of personalitydisorder traits: A twin study. Acta Psychiatrica Scandinavica, 94, 438–444.
Jang, K. L., McCrae, R. R., Angleitner, A., Riemann, R., & Livesley, W. J. (1998).Heritability of facet-level traits in a cross-cultural twin study: Support for a hierarchi-cal model of personality. Journal of Personality and Social Psychology, 74,1556–1565.
Kasriel, J., & Eaves, L. J. (1976). The zygosity of twins: Further evidence on theagreement between diagnosis by blood groups and written questionnaires. Journal ofBiosocial Science, 8, 263–266.
Lesch, K. P., Bengel, D., Sabol, S. Z., Greenberg, B. D., Petri, S., Benjamin, J., Müller,C. R., Hamer, D. H., & Murphy, D. L. (1996). Association of anxiety-related traitswith a polymorphism in the serotonin transporter gene regulatory region. Science,274, 1527–1531.
Sources of Structure 533

Livesley, W. J., Jang, K. L., & Vernon, P. A. (1998). Phenotypic and genetic structure oftraits delineating personality disorder. Archives of General Psychiatry, 55, 941–948.
Loehlin, J. C. (1987). Heredity, environment, and the structure of the California Psycho-logical Inventory. Multivariate Behavioral Research, 22, 137–148.
Loehlin, J. C. (1992). Genes and environment in personality development. Newbury Park,CA: Sage.
Lykken, D. T., Tellegen, A., DeRubeis, R. (1978). Volunteer bias in twin research: Therule of two-thirds. Social Biology, 25, 1–9.
MacCallum, R. C., Widaman, K. F., Zhang, S., & Hong, S. (1999). Sample size in factoranalysis. Psychological Methods, 4, 84–99.
McCrae, R. R., & Costa, P. T., Jr. (1989). Different points of view: Self-reports and ratingsin the assessment of personality. In J. P. Forgas & M. J. Innes (Eds.), Recent advancesin social psychology: An international perspective (pp. 429–439). Amsterdam: El-sevier Science Publishers.
McCrae, R. R., & Costa, P. T., Jr. (1991). Adding Liebe und Arbeit: The full five-factormodel and well-being. Personality and Social Psychology Bulletin, 17, 227–232.
McCrae, R. R., & Costa, P. T., Jr. (1997). Personality trait structure as a human universal.American Psychologist, 52, 509–516.
McCrae, R. R., Costa, P. T., Jr., & Piedmont, R. L. (1993). Folk concepts, naturallanguage, and psychological constructs: The California Psychological Inventory andthe five-factor model. Journal of Personality, 61, 1–26.
McCrae, R. R., & John, O. P. (1992). An introduction to the five-factor model and itsapplications. Journal of Personality, 60, 175–215.
McCrae, R. R., Stone, S. V., Fagan, P. J., & Costa, P. T., Jr. (1998). Identifying causes ofdisagreement between self-reports and spouse ratings of personality. Journal ofPersonality, 66, 285–313.
McCrae, R. R., Zonderman, A. B., Costa, P. T., Jr., Bond, M. H., & Paunonen, S. V. (1996).Evaluating replicability of factors in the Revised NEO Personality Inventory: Confir-matory factor analysis versus Procrustes rotation. Journal of Personality and SocialPsychology, 70, 552–566.
Neale, M. C., & Cardon, L. R. (1992). Methodology for genetic studies of twins andfamilies. Dordrecht, The Netherlands: Kluwer.
Nichols, R., C., & Bilbro, W. C., Jr. (1966). The diagnosis of twin zygosity. ActaGeneteticae Medicae et Gemellollogiae, 16, 265–275.
Oniszczenko, W., Angleitner, A., Strelau, J., & Angert T. (1993). The questionnaire oftwins’physical resemblance. Unpublished questionnaire, University of Warsaw, War-saw, Poland, and University of Bielefeld, Bielefeld, Germany.
Ostendorf, F., & Angleitner, A. (1994, July). Psychometric properties of the Germantranslation of the NEO Personality Inventory (NEO-PI-R). Poster presented at theSeventh Conference of the European Association for Personality Psychology, Madrid,Spain.
Passini, F. T., & Norman, W. T. (1966). A universal conception of personality structure?Journal of Personality and Social Psychology, 4, 44–49.
Plomin, R. (1990). The role of inheritance in behavior. Science, 248, 183–188.Plomin, R., & Caspi, A. (1998). DNA and personality. European Journal of Personality,
12, 387–407.
534 McCrae et al.

Plomin, R., Chipuer, H.M., & Neiderhiser, J.M. (1994). Behavioral genetic evidence forthe importance of nonshared environment. In E. M. Hetherington, D. Reiss, & R.Plomin (Eds.), Separate social worlds of siblings: The impact of nonshared environ-ment on development (pp. 1–32). Hillsdale, NJ: Erlbaum.
Plomin, R., DeFries, J. C., & McClearn, G. E. (1990). Behavioral genetics: A primer(2nd ed.). New York, NY: Freeman.
Riemann, R., Angleitner, A., & Strelau, J. (1997). Genetic and environmental influenceson personality: A study of twins reared together using the self and peer reportNEO-FFI scales. Journal of Personality, 65, 449–475.
Rowe, D. C. (1982). Monozygotic twin cross-correlations as validation of personalitystructure: A test of the semantic bias hypothesis. Journal of Personality and SocialPsycholgy, 43, 1072–1079.
Scarr, S. (1987). Distinctive environments depend on genotypes. Behavioral and BrainSciences, 10, 38–39.
Shock, N. W., Greulich, R. C., Andres, R., Arenberg, D., Costa, P. T., Jr., Lakatta, E. G.,& Tobin, J. D. (1984 ). Normal human aging: The Baltimore Longitudinal Study ofAging (NIH Publication No. 84-2450). Bethesda, MD: National Institutes of Health.
Shweder, R. A. (1975). How relevant is an individual difference theory of personality?Journal of Personality, 43, 455–484.
Sneed, C. D., McCrae, R. R., & Funder, D. C. (1998). Lay conceptions of the Five-FactorModel and its indicators. Personality and Social Psychology Bulletin, 24, 115–126.
Strelau, J. (1987). The concept of temperament in personality research. European Journalof Personality, 1, 107–117.
Sulloway, F. J. (1996). Born to rebel: Birth order, family dynamics, and creative lives.New York: Pantheon.
Turkheimer, E. (1998). Heritability and biological explanation. Psychological Review,105, 782–791.
Vandenbergh, D. J., Zonderman, A. B., Wang, J., Uhl, G. R., & Costa, P. T., Jr. (1997).No association between Novelty Seeking and dopamine D4 receptor (D4DR) exonIII seven repeat alleles in Baltimore Longitudinal Study of Aging participants.Molecular Psychiatry, 2, 417–419.
Velicer, W. F., & Jackson, D. N. (1990). Component analysis versus common factoranalysis: Some issues in selecting an appropriate procedure. Multivariate BehavioralResearch, 25, 1–28.
Vernon, P. A., Jang, K. L., Harris, J. A., McCarthy, J. M. (1997). Environmental predictorsof personality differences. A twins and sibling study. Journal of Personality and SocialPsychology, 72, 177–183.
Wiggins, J. S. (1979). A psychological taxonomy of trait-descriptive terms: The inter-personal domain. Journal of Personality and Social Psychology, 37, 395–412.
Woodruffe, C. (1985). Consensual validation of personality traits: Additional evidenceand individual differences. Journal of Personality and Social Psychology, 48,1240–1252.
Yang, J., McCrae, R. R., Costa, P. T., Jr., Dai, X., Yao, S., Cai, T., & Gao, B. (1999).Cross-cultural personality assessment in psychiatric populations: The NEO-PI-R inthe People’s Republic of China. Psychological Assessment, 11, 359–368.
Sources of Structure 535