south africa, november 2013 - glencoresource: wood mackenzie, ame, company websites, glencore...
TRANSCRIPT
South Africa, November 2013
This presentation has been prepared by Glencore Xstrata plc ("Glencore").
Forward looking statements
This document contains statements that are, or may be deemed to be, “forward looking statements” which are prospective in nature. Such statements are qualified in their entirety by the inherent risks and uncertainties surrounding future expectations. Forward-looking statements are not based on historical facts, but rather on current predictions, expectations, beliefs, opinions, plans, objectives, goals, intentions and projections about future events, results of operations, prospects, financial condition and discussions of strategy.
By their nature, forward looking statements involve known and unknown risks and uncertainties, many of which are beyond Glencore’s control. Forward looking statements are not guarantees of future performance and may and often do differ materially from actual results. Important factors that could cause these uncertainties include, but are not limited to, those discussed in Part III: “Risk Factors” of the pre-listing statement issued by Glencore on 31 October 2013, and under “Principal risks and uncertainties” in section 1.7 of Glencore’s Annual Report 2012 and “Risks and uncertainties” in Glencore’s Half-Yearly Results 2013.
Neither Glencore nor any of its associates or directors, officers or advisers, provides any representation, assurance or guarantee that the occurrence of the events expressed or implied in any forward looking statements in this document will actually occur. You are cautioned not to place undue reliance on these forward looking statements which only speak as of the date of this document. Other than in accordance with its legal or regulatory obligations (including under the UK Listing Rules and the Disclosure and Transparency Rules of the Financial Conduct Authority and the Rules Governing the Listing of Securities on the Stock Exchange of Hong Kong Limited), Glencore is not under any obligation and Glencore and its affiliates expressly disclaim any intention, obligation or undertaking to update or revise any forward looking statements, whether as a result of new information, future events or otherwise. This document shall not, under any circumstances, create any implication that there has been no change in the business or affairs of Glencore since the date of this document or that the information contained herein is correct as at any time subsequent to its date.
No statement in this document is intended as a profit forecast or a profit estimate and no statement in this document should be interpreted to mean that earnings per Glencore share for the current or future financial years would necessarily match or exceed the historical published earnings per Glencore share.
This document does not constitute or form part of any offer or invitation to sell or issue, or any solicitation of any offer to purchase or subscribe for any securities. The making of this document does not constitute a recommendation regarding any securities.
2
A JSE listing for Glencore
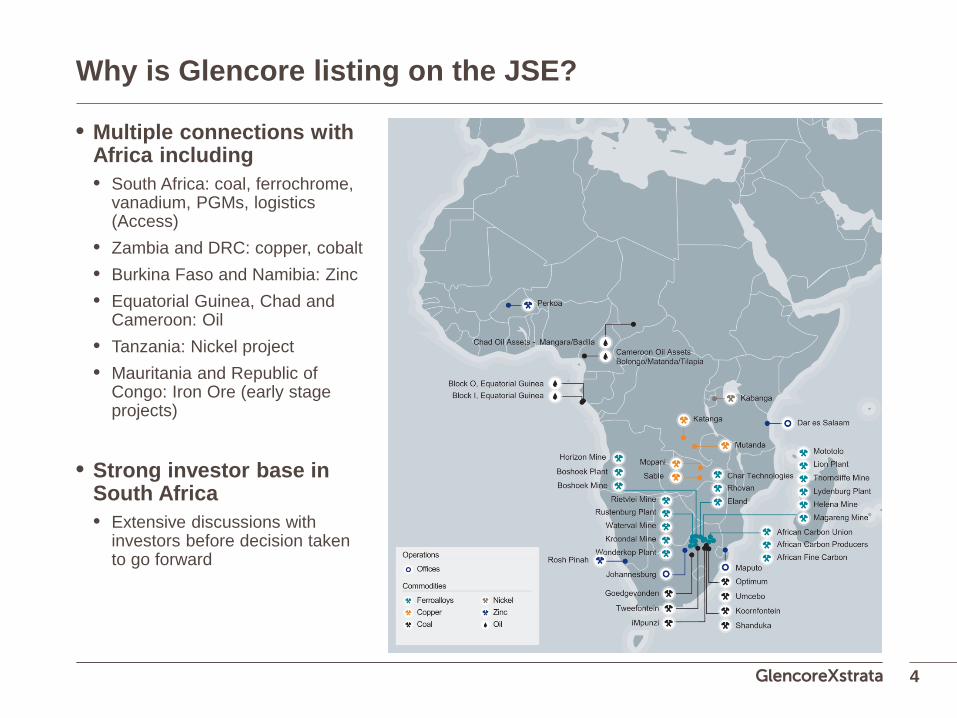
Why is Glencore listing on the JSE?
• Multiple connections with Africa including • South Africa: coal, ferrochrome,
vanadium, PGMs, logistics (Access)
• Zambia and DRC: copper, cobalt • Burkina Faso and Namibia: Zinc • Equatorial Guinea, Chad and
Cameroon: Oil • Tanzania: Nickel project • Mauritania and Republic of
Congo: Iron Ore (early stage projects)
• Strong investor base in
South Africa • Extensive discussions with
investors before decision taken to go forward
4
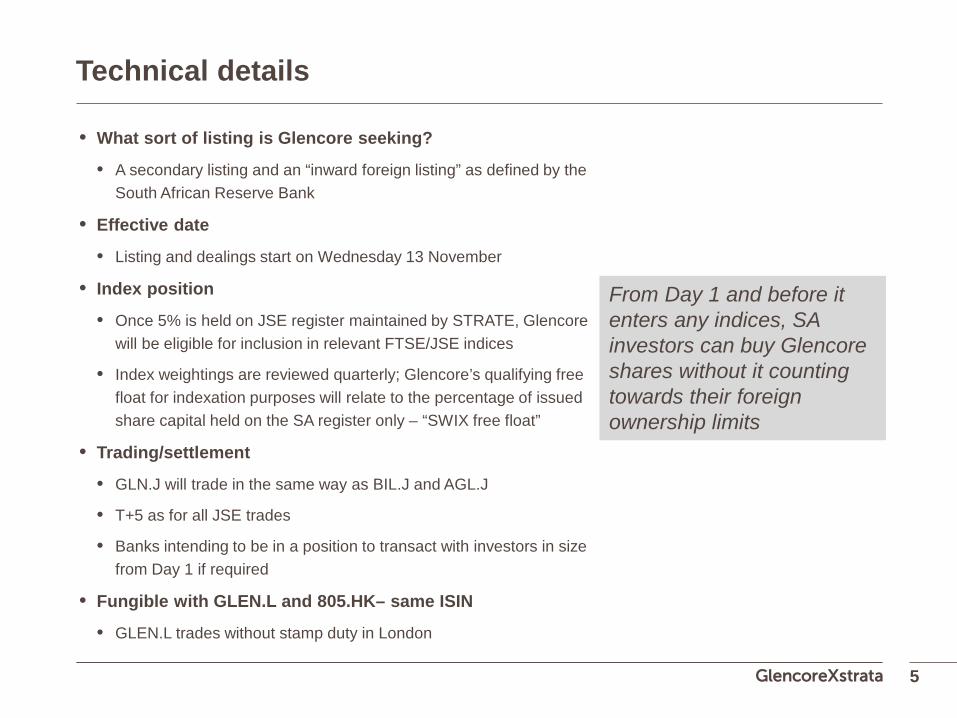
Technical details
• What sort of listing is Glencore seeking?
• A secondary listing and an “inward foreign listing” as defined by the South African Reserve Bank
• Effective date
• Listing and dealings start on Wednesday 13 November
• Index position
• Once 5% is held on JSE register maintained by STRATE, Glencore will be eligible for inclusion in relevant FTSE/JSE indices
• Index weightings are reviewed quarterly; Glencore’s qualifying free float for indexation purposes will relate to the percentage of issued share capital held on the SA register only – “SWIX free float”
• Trading/settlement
• GLN.J will trade in the same way as BIL.J and AGL.J
• T+5 as for all JSE trades
• Banks intending to be in a position to transact with investors in size from Day 1 if required
• Fungible with GLEN.L and 805.HK– same ISIN
• GLEN.L trades without stamp duty in London
5
From Day 1 and before it enters any indices, SA investors can buy Glencore shares without it counting towards their foreign ownership limits
Sector overview
Where is the mining sector today?
7
1.7 2.6
3.2
5.9
4.6
7.9
4.4 4.9
5.7 6.6
7.1
11.0
0
2
4
6
8
10
12
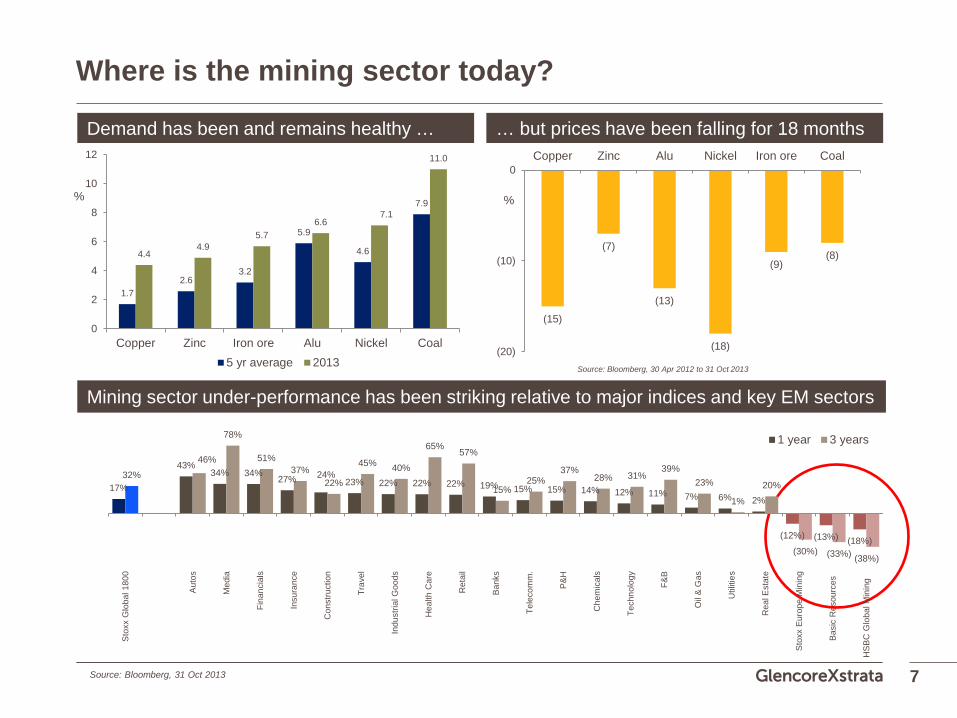
Copper Zinc Iron ore Alu Nickel Coal5 yr average 2013
(15)
(7)
(13)
(18)
(9) (8)
(20)
(10)
0Copper Zinc Alu Nickel Iron ore Coal
Source: Bloomberg, 30 Apr 2012 to 31 Oct 2013
% %
Source: Bloomberg, 31 Oct 2013
Demand has been and remains healthy … … but prices have been falling for 18 months
Mining sector under-performance has been striking relative to major indices and key EM sectors
17%
43% 34% 34%
27% 24% 23% 22% 22% 22% 19% 15% 15% 14% 12% 11% 7% 6% 2%
(12%) (13%) (18%)
32%
46%
78%
51% 37%
22%
45% 40%
65% 57%
15% 25%
37% 28% 31%
39% 23%
1%
20%
(30%) (33%) (38%) -60.00%
-40.00%
-20.00%
0.00%
20.00%
40.00%
60.00%
80.00%
100.00%
Sto
xx G
loba
l 180
0
Aut
os
Med
ia
Fina
ncia
ls
Insu
ranc
e
Con
stru
ctio
n
Trav
el
Indu
stria
l Goo
ds
Hea
lth C
are
Ret
ail
Ban
ks
Tele
com
m.
P&
H
Che
mic
als
Tech
nolo
gy
F&B
Oil
& G
as
Util
ities
Rea
l Est
ate
Sto
xx E
urop
e M
inin
g
Bas
ic R
esou
rces
HS
BC
Glo
bal M
inin
g
1 year 3 years
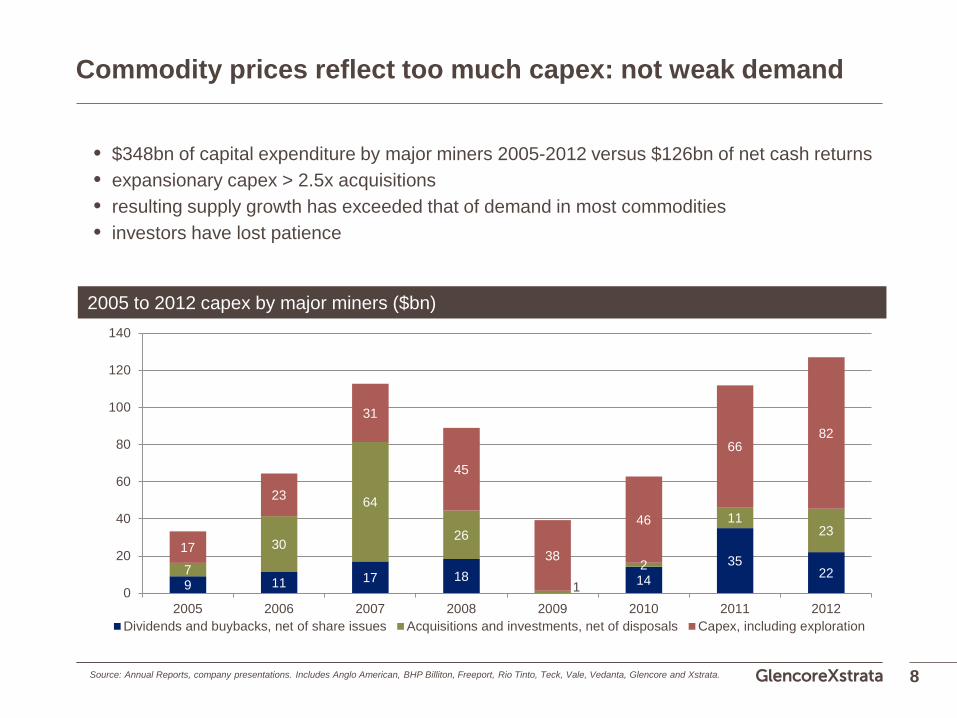
Commodity prices reflect too much capex: not weak demand
• $348bn of capital expenditure by major miners 2005-2012 versus $126bn of net cash returns • expansionary capex > 2.5x acquisitions • resulting supply growth has exceeded that of demand in most commodities • investors have lost patience
8
2005 to 2012 capex by major miners ($bn)
9 11 17 18 14 35
22 7
30
64
26
1 2
11 23
17
23
31
45
38
46
66 82
0
20
40
60
80
100
120
140
2005 2006 2007 2008 2009 2010 2011 2012Dividends and buybacks, net of share issues Acquisitions and investments, net of disposals Capex, including exploration
Source: Annual Reports, company presentations. Includes Anglo American, BHP Billiton, Freeport, Rio Tinto, Teck, Vale, Vedanta, Glencore and Xstrata.
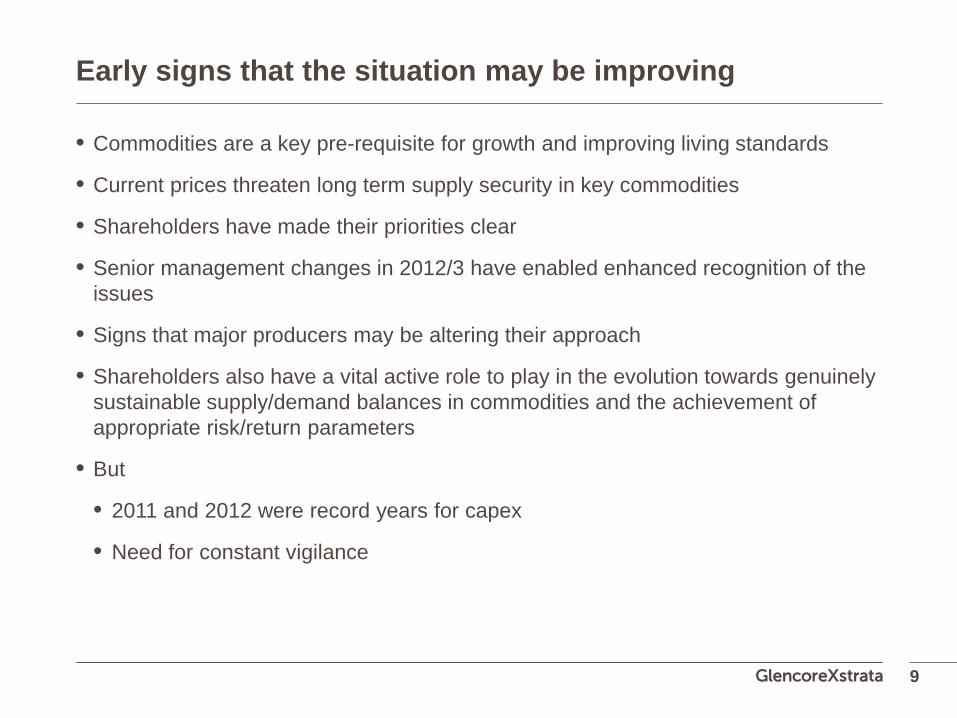
Early signs that the situation may be improving
• Commodities are a key pre-requisite for growth and improving living standards
• Current prices threaten long term supply security in key commodities
• Shareholders have made their priorities clear
• Senior management changes in 2012/3 have enabled enhanced recognition of the issues
• Signs that major producers may be altering their approach
• Shareholders also have a vital active role to play in the evolution towards genuinely sustainable supply/demand balances in commodities and the achievement of appropriate risk/return parameters
• But
• 2011 and 2012 were record years for capex
• Need for constant vigilance
9
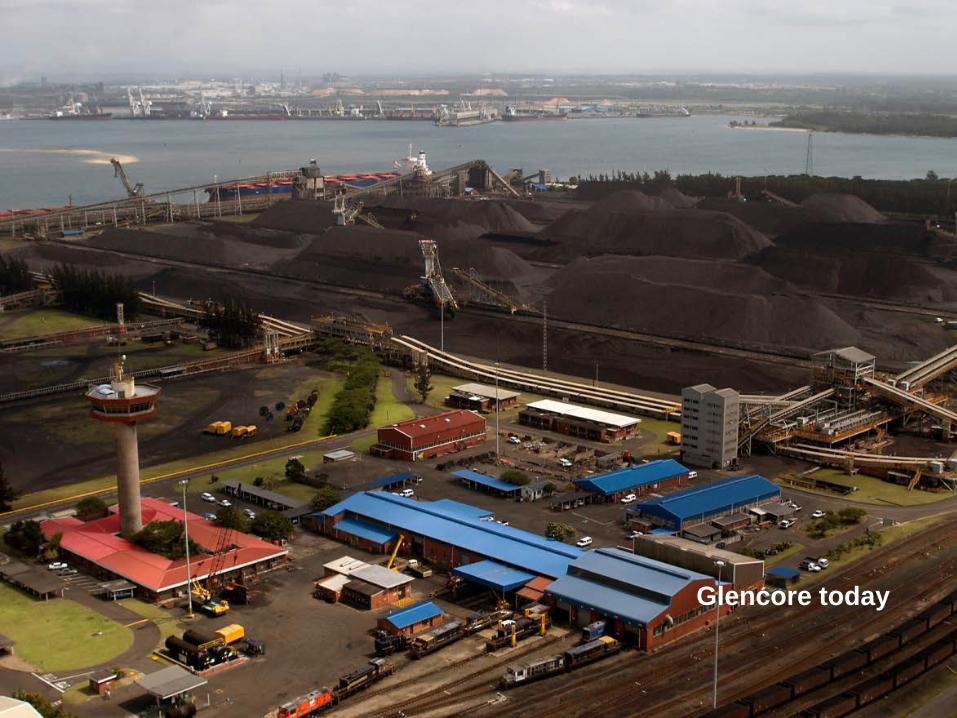
Glencore today

Glencore – a unique business model ..
Exploration
Mining / producing
Processing / refining
Logistics
Marketing & trading
Traditional miners Traders
Exploration
Mining / producing
Processing / refining
Logistics
Marketing & trading
Major presence across the entire value chain
11
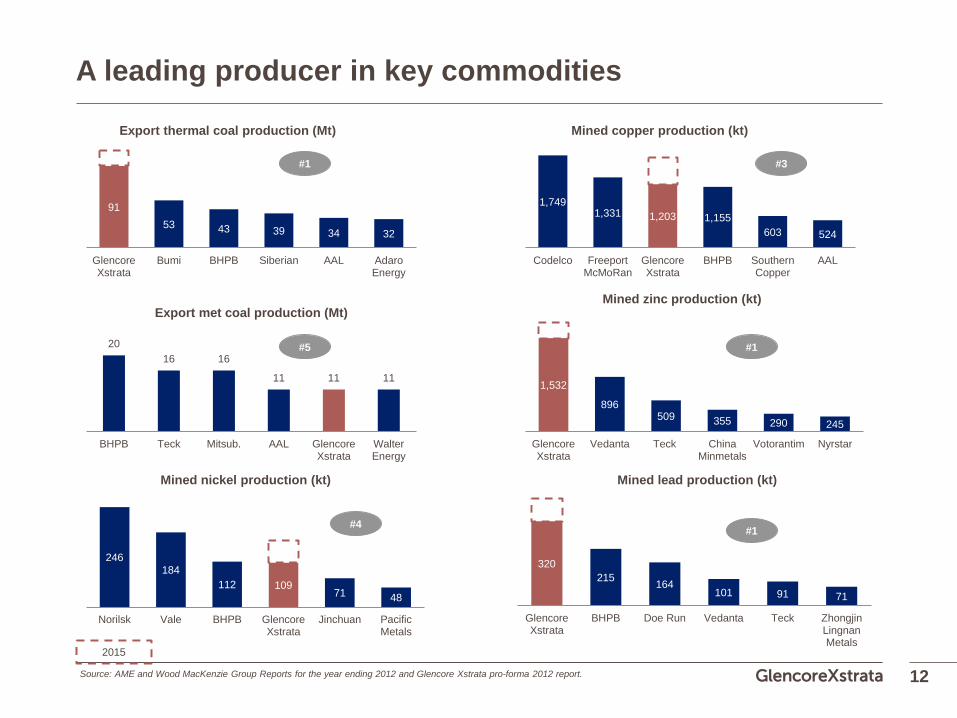
91 53 43 39 34 32
GlencoreXstrata
Bumi BHPB Siberian AAL AdaroEnergy
A leading producer in key commodities
12
20 16 16
11 11 11
BHPB Teck Mitsub. AAL GlencoreXstrata
WalterEnergy
Export met coal production (Mt)
1,749 1,331 1,203 1,155
603 524
Codelco FreeportMcMoRan
GlencoreXstrata
BHPB SouthernCopper
AAL
1,532
896 509 355 290 245
GlencoreXstrata
Vedanta Teck ChinaMinmetals
Votorantim Nyrstar
246 184
112 109 71 48
Norilsk Vale BHPB GlencoreXstrata
Jinchuan PacificMetals
320 215 164
101 91 71
GlencoreXstrata
BHPB Doe Run Vedanta Teck ZhongjinLingnanMetals
Source: AME and Wood MacKenzie Group Reports for the year ending 2012 and Glencore Xstrata pro-forma 2012 report.
#1
#5
#4
#3
#1
#1
Export thermal coal production (Mt) Mined copper production (kt)
Mined zinc production (kt)
Mined nickel production (kt) Mined lead production (kt)
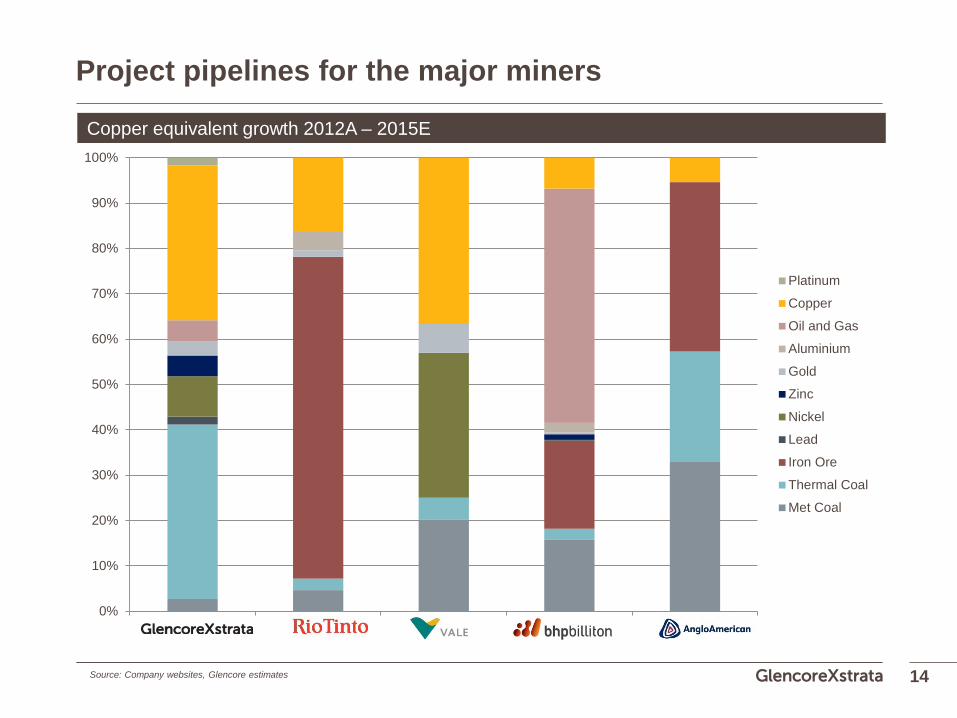
2015
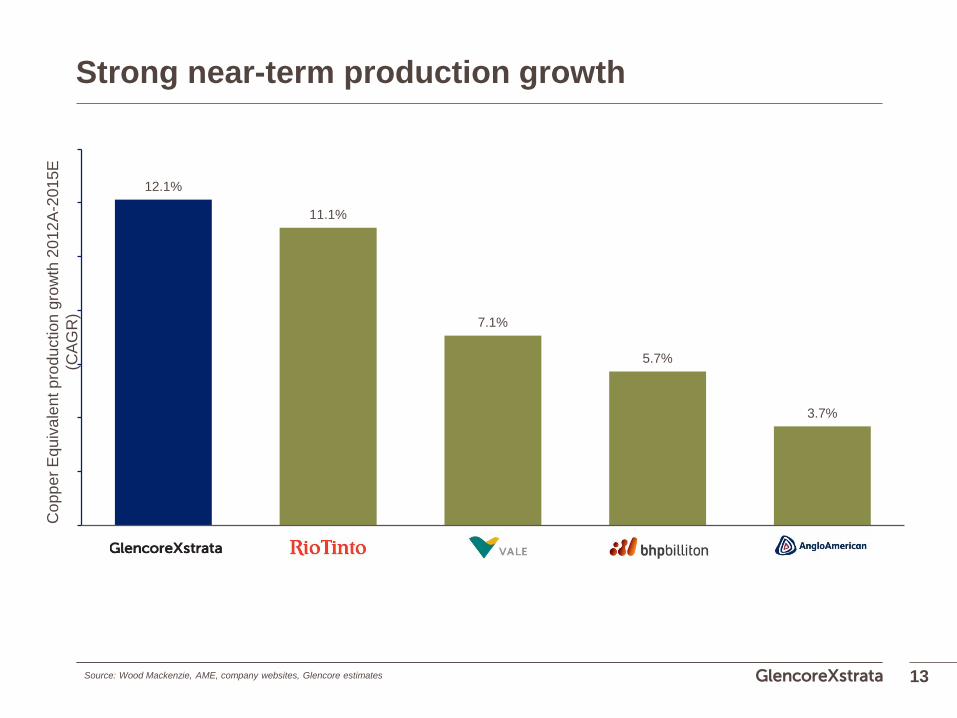
Strong near-term production growth
13 Source: Wood Mackenzie, AME, company websites, Glencore estimates
Cop
per E
quiv
alen
t pro
duct
ion
grow
th 2
012A
-201
5E
(CA
GR
)
12.1%
11.1%
7.1%
5.7%
3.7%
0%
10%
20%
30%
40%
50%
60%
70%
80%
90%
100%
GlencoreXstrata Rio Tinto Vale BHP Billiton Anglo American
Platinum
Copper
Oil and Gas
Aluminium
Gold
Zinc
Nickel
Lead
Iron Ore
Thermal Coal
Met Coal
Project pipelines for the major miners
14
Copper equivalent growth 2012A – 2015E
Source: Company websites, Glencore estimates
Q1 Q2 Q3 Q4
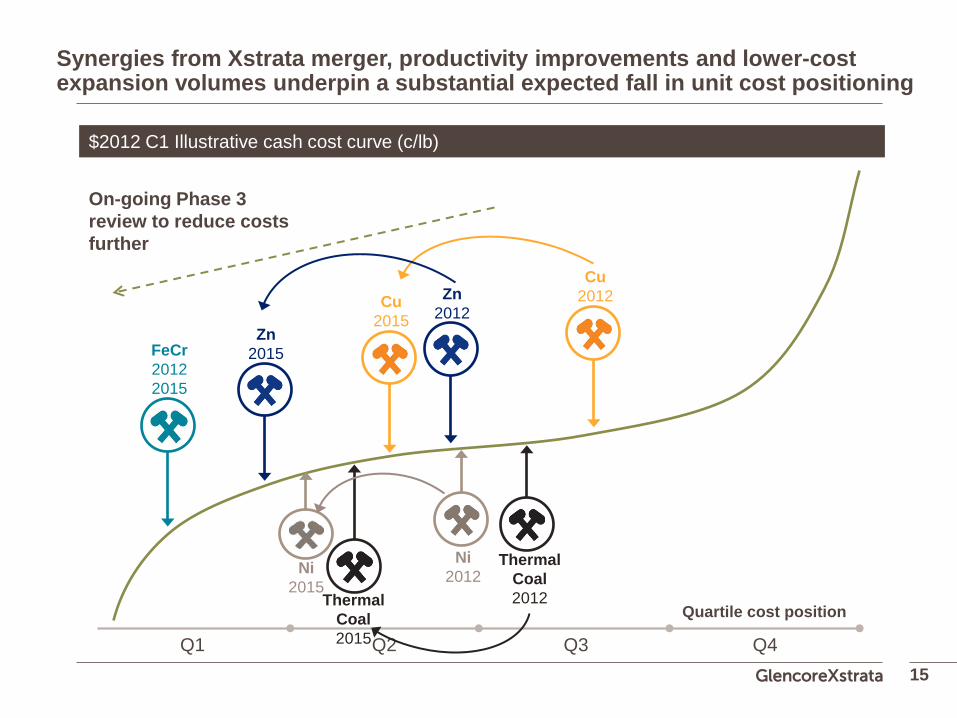
Synergies from Xstrata merger, productivity improvements and lower-cost expansion volumes underpin a substantial expected fall in unit cost positioning
15
$2012 C1 Illustrative cash cost curve (c/lb)
Quartile cost position
FeCr 2012 2015
Zn 2015
Zn 2012
Cu 2012 Cu
2015
Ni 2012 Ni
2015
Thermal Coal 2012 Thermal
Coal 2015
On-going Phase 3 review to reduce costs further
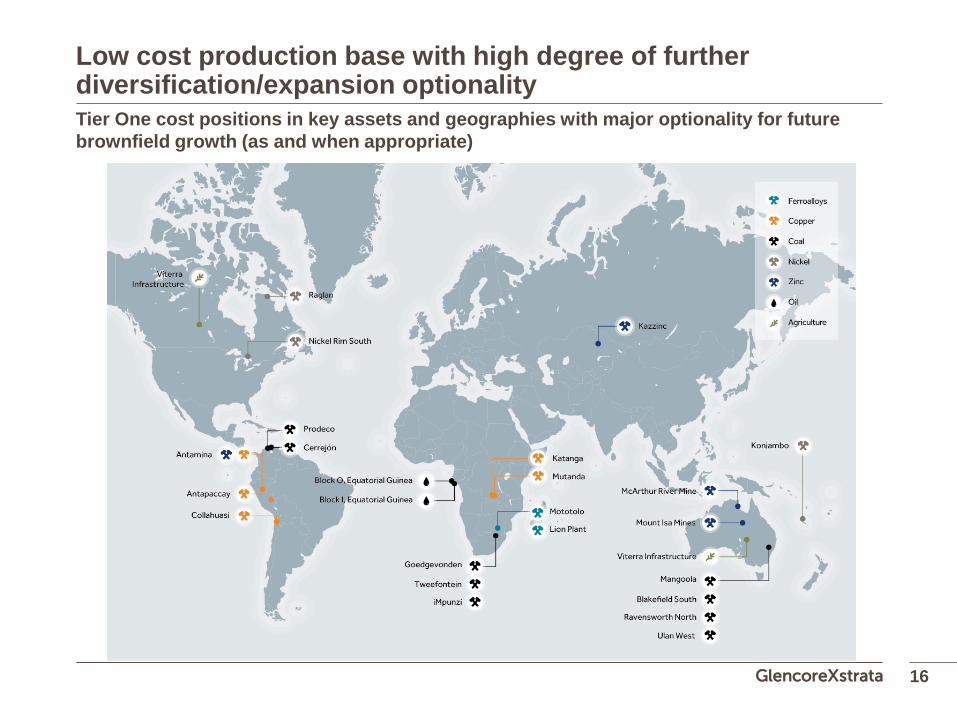
Low cost production base with high degree of further diversification/expansion optionality
16
Tier One cost positions in key assets and geographies with major optionality for future brownfield growth (as and when appropriate)
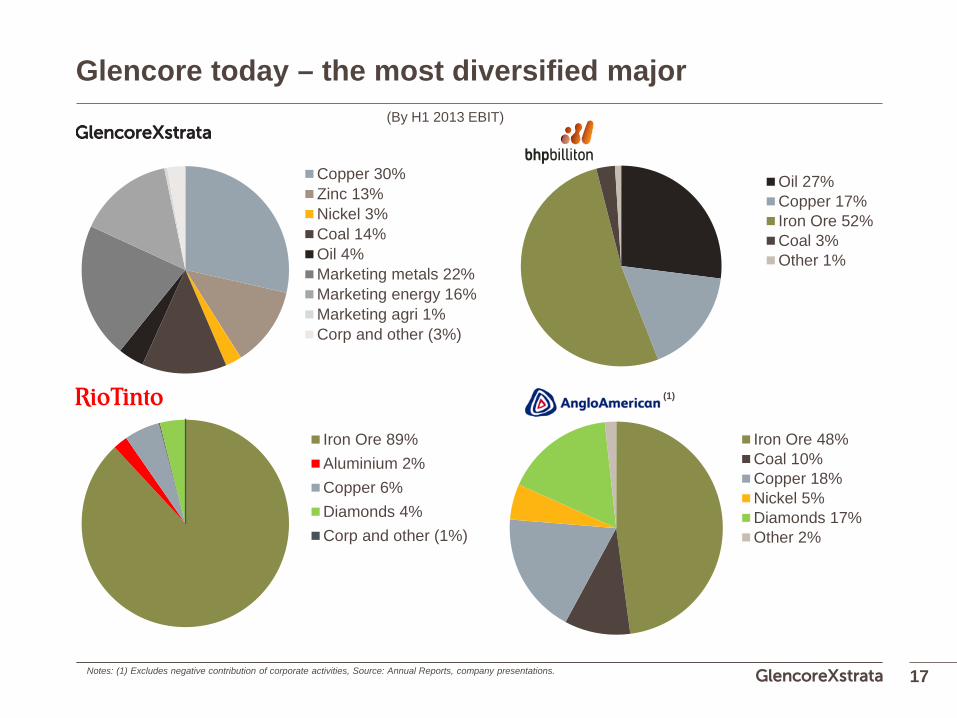
Glencore today – the most diversified major
17
Oil 27%Copper 17%Iron Ore 52%Coal 3%Other 1%
Iron Ore 89%Aluminium 2%Copper 6%Diamonds 4%Corp and other (1%)
(By H1 2013 EBIT)
Iron Ore 48%Coal 10%Copper 18%Nickel 5%Diamonds 17%Other 2%
Rio Tinto:
BHP:
Anglo American (1)
Copper 30%Zinc 13%Nickel 3%Coal 14%Oil 4%Marketing metals 22%Marketing energy 16%Marketing agri 1%Corp and other (3%)
Notes: (1) Excludes negative contribution of corporate activities, Source: Annual Reports, company presentations.
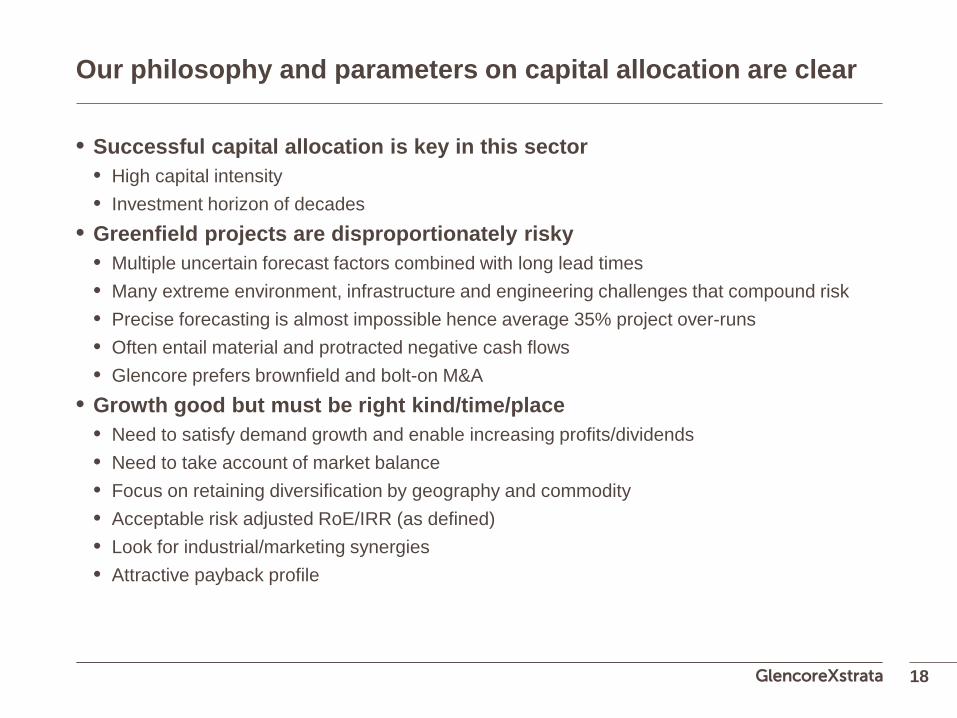
Our philosophy and parameters on capital allocation are clear
• Successful capital allocation is key in this sector • High capital intensity • Investment horizon of decades
• Greenfield projects are disproportionately risky • Multiple uncertain forecast factors combined with long lead times • Many extreme environment, infrastructure and engineering challenges that compound risk • Precise forecasting is almost impossible hence average 35% project over-runs • Often entail material and protracted negative cash flows • Glencore prefers brownfield and bolt-on M&A
• Growth good but must be right kind/time/place • Need to satisfy demand growth and enable increasing profits/dividends • Need to take account of market balance • Focus on retaining diversification by geography and commodity • Acceptable risk adjusted RoE/IRR (as defined) • Look for industrial/marketing synergies • Attractive payback profile
18
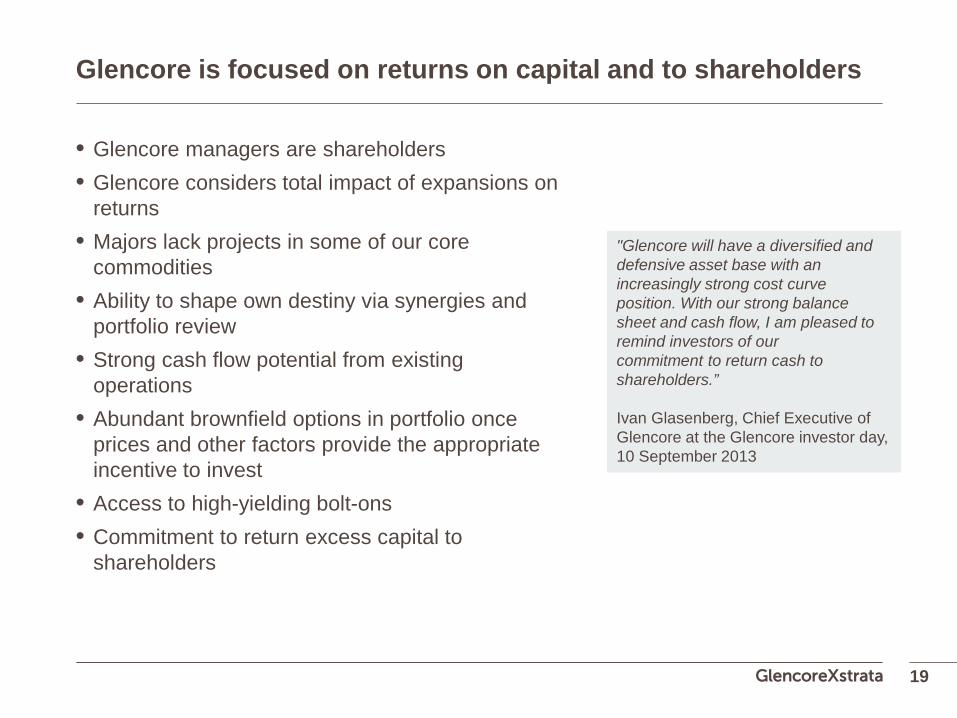
Glencore is focused on returns on capital and to shareholders
• Glencore managers are shareholders • Glencore considers total impact of expansions on
returns • Majors lack projects in some of our core
commodities • Ability to shape own destiny via synergies and
portfolio review • Strong cash flow potential from existing
operations • Abundant brownfield options in portfolio once
prices and other factors provide the appropriate incentive to invest
• Access to high-yielding bolt-ons • Commitment to return excess capital to
shareholders
19
"Glencore will have a diversified and defensive asset base with an increasingly strong cost curve position. With our strong balance sheet and cash flow, I am pleased to remind investors of our commitment to return cash to shareholders.” Ivan Glasenberg, Chief Executive of Glencore at the Glencore investor day, 10 September 2013
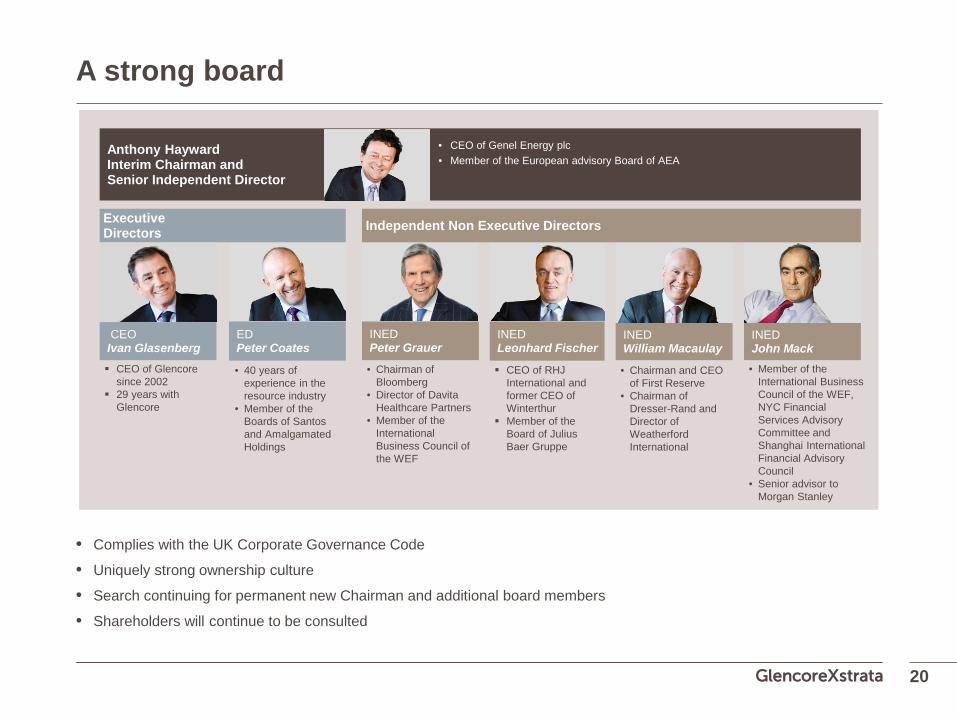
A strong board
20
• Complies with the UK Corporate Governance Code
• Uniquely strong ownership culture
• Search continuing for permanent new Chairman and additional board members
• Shareholders will continue to be consulted
Anthony Hayward Interim Chairman and Senior Independent Director
Independent Non Executive Directors Executive Directors
CEO Ivan Glasenberg
ED Peter Coates
• 40 years of experience in the resource industry
• Member of the Boards of Santos and Amalgamated Holdings
INED William Macaulay
• Chairman and CEO of First Reserve
• Chairman of Dresser-Rand and Director of Weatherford International
INED Peter Grauer
• Chairman of Bloomberg
• Director of Davita Healthcare Partners
• Member of the International Business Council of the WEF
INED Leonhard Fischer
INED John Mack
• Member of the International Business Council of the WEF, NYC Financial Services Advisory Committee and Shanghai International Financial Advisory Council
• Senior advisor to Morgan Stanley
CEO of Glencore since 2002
29 years with Glencore
• CEO of Genel Energy plc • Member of the European advisory Board of AEA
CEO of RHJ International and former CEO of Winterthur
Member of the Board of Julius Baer Gruppe
Finance update
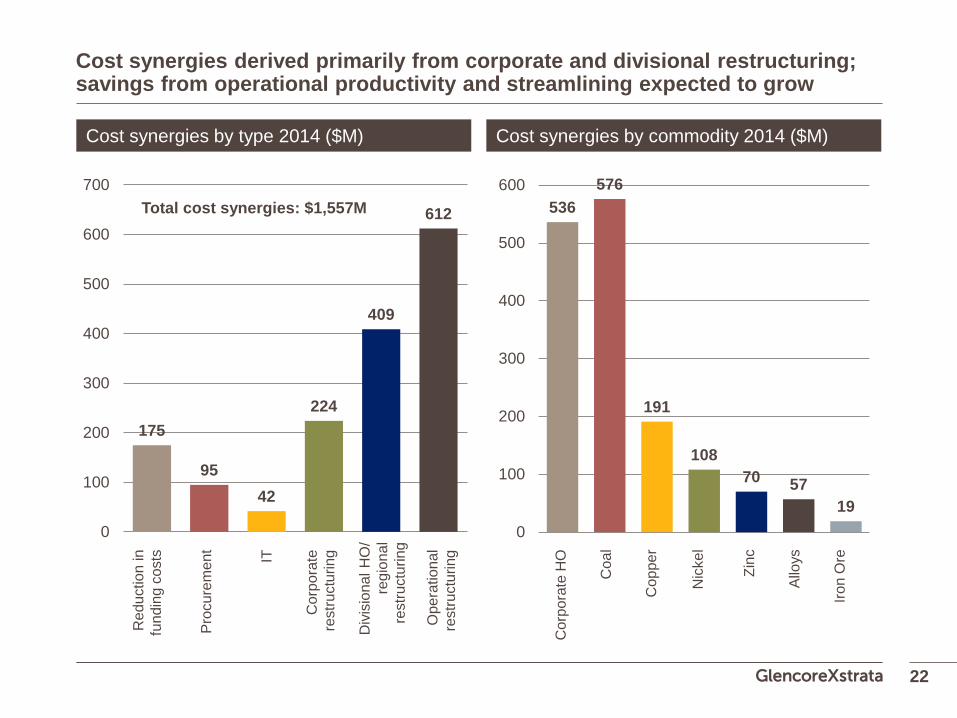
Cost synergies derived primarily from corporate and divisional restructuring; savings from operational productivity and streamlining expected to grow
175
95 42
224
409
612
0
100
200
300
400
500
600
700
Red
uctio
n in
fu
ndin
g co
sts
Proc
urem
ent IT
Cor
pora
te
rest
ruct
urin
g
Div
isio
nal H
O/
regi
onal
re
stru
ctur
ing
Ope
ratio
nal
rest
ruct
urin
g
22
536 576
191
108 70 57
19 0
100
200
300
400
500
600
Cor
pora
te H
O
Coa
l
Cop
per
Nic
kel
Zinc
Allo
ys
Iron
Ore
Cost synergies by type 2014 ($M) Cost synergies by commodity 2014 ($M)
Total cost synergies: $1,557M
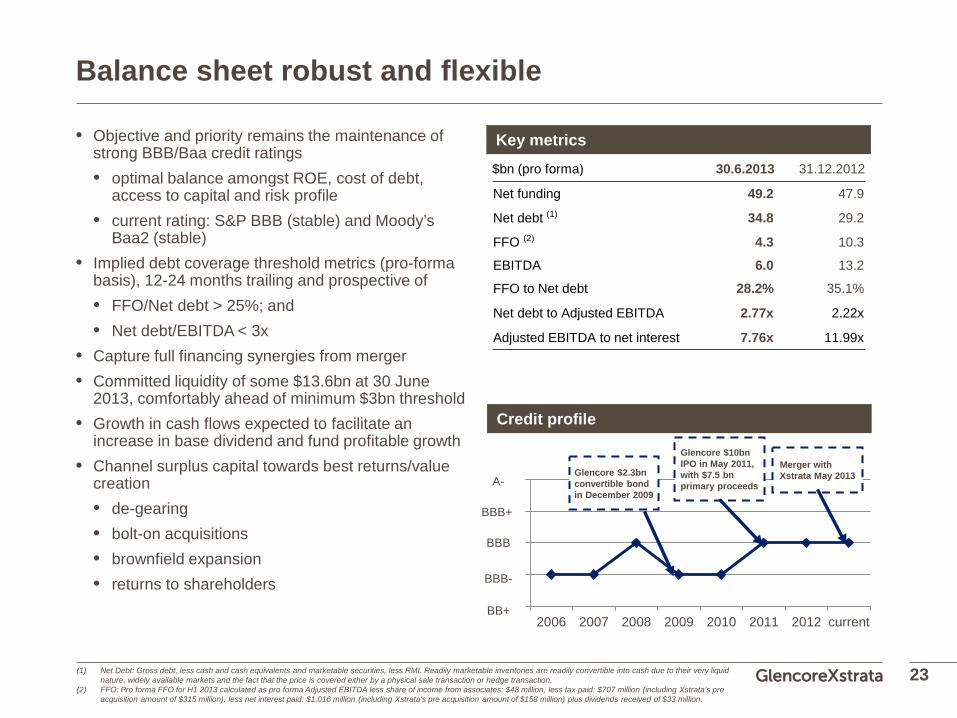
Balance sheet robust and flexible
• Objective and priority remains the maintenance of strong BBB/Baa credit ratings • optimal balance amongst ROE, cost of debt,
access to capital and risk profile • current rating: S&P BBB (stable) and Moody’s
Baa2 (stable) • Implied debt coverage threshold metrics (pro-forma
basis), 12-24 months trailing and prospective of • FFO/Net debt > 25%; and • Net debt/EBITDA < 3x
• Capture full financing synergies from merger • Committed liquidity of some $13.6bn at 30 June
2013, comfortably ahead of minimum $3bn threshold • Growth in cash flows expected to facilitate an
increase in base dividend and fund profitable growth • Channel surplus capital towards best returns/value
creation • de-gearing • bolt-on acquisitions • brownfield expansion • returns to shareholders
23
2
3
4
5
6
2006 2007 2008 2009 2010 2011 2012 current
BBB
BB+
BBB+
BBB-
A-
Glencore $10bn IPO in May 2011, with $7.5 bn primary proceeds
Glencore $2.3bn convertible bond in December 2009
Merger with Xstrata May 2013
$bn (pro forma) 30.6.2013 31.12.2012
Net funding 49.2 47.9
Net debt (1) 34.8 29.2
FFO (2) 4.3 10.3
EBITDA 6.0 13.2
FFO to Net debt 28.2% 35.1%
Net debt to Adjusted EBITDA 2.77x 2.22x
Adjusted EBITDA to net interest 7.76x 11.99x
Key metrics
(1) Net Debt: Gross debt, less cash and cash equivalents and marketable securities, less RMI. Readily marketable inventories are readily convertible into cash due to their very liquid nature, widely available markets and the fact that the price is covered either by a physical sale transaction or hedge transaction.
(2) FFO: Pro forma FFO for H1 2013 calculated as pro forma Adjusted EBITDA less share of income from associates: $48 million, less tax paid: $707 million (including Xstrata’s pre acquisition amount of $315 million), less net interest paid: $1,016 million (including Xstrata’s pre acquisition amount of $158 million) plus dividends received of $33 million.
Credit profile
Capital efficient business model
• Application of Glencore’s capital-efficient business model • Glencore run by owners for the benefit of all shareholders • maintain flexible but efficient balance sheet – strong BBB/Baa
• Marketing remains highly capital efficient • low capex and equity requirements
• Strong track record of capital efficiency in industrial assets • value-based, often contrarian and opportunistic approach to investments • lower risk brownfield and bolt-on M&A • divisions responsible for sourcing investments
• Centralised capital allocation process to ensure discipline • Comprehensive assessment of value, based on returns and risks
• focus continues to be on RoE and cash flow • trading and industrial assets access separate pools of capital • focus on high returns, forecastability and appropriate risk-return trade-off
• On-going optimisation of the asset portfolio
24
Glencore’s flexible capital model
• Two distinct pools of capital centrally funded and allocated • Marketing • Industrial
• Marketing: ~$20bn of capital employed • working capital average turnover cycle of ~35 days • target for 80% debt-funded • Marketing debt is frequently refreshed; average duration of debt facilities versus use is a highly
conservative 20x • 2013 earnings benefit from Viterra and Xstrata • target RoE is 40%-65%
• Industrial: ~$100bn of capital employed • target of 30-40% debt-funded; or < 3x Net Debt/EBITDA • target RoE is 20-25% for new capital/projects • earnings to fully benefit from ramp-up of Koniambo, Antapaccay, E&P, African copper belt, Prodeco,
etc • portfolio optimisation will also boost returns on equity
25
Strong cash flow potential confirmed
• Material cash flow growth remains on track for 2013-2015 • commissioning of existing organic growth projects • full earnings from recent bolt-on acquisitions • at least $2bn of merger synergies from 2014 • Phase 3 to come
• Capex confirmed to decline materially from 2013 • large Xstrata capex commitments for 2013 and 2014 come to an end • total capex now expected to fall to $12bn/$8bn/$6bn in 2013/2014/2015 • sustaining capex confirmed at $4bn range • anticipated divestment of Las Bambas at minimum of capital costs incurred at the time of sale
• Base dividend to remain competitive with sector while growth phase completes • …. and to be reviewed after that, adjusted to reflect expected future cash flows, leverage and asset
disposal processes underway • in addition, excess capital will be returned to shareholders in most efficient manner
26
Appendices
How does Glencore find the best investment opportunities?
• Trusted relationships with over 7,000 suppliers and customers • existing supply and credit relationships • Glencore often first call for any investment opportunities
• Marketing activities and relationships provides unique insight • market view enables decisive decision making • product, asset quality and operational matters evident to Glencore • proven ability to spot and deliver on optionality around assets • examples include: Colombian, Australian and South African coal, African copper belt, Kazzinc
• Decades of experience at sourcing and integrating deals • unlike some peers, there is, deliberately, little or no rotation of senior personnel
between divisions • No pressure to grow for strategic reasons
• managers are owners • assets built upon opportunistic deals • divisions have multiple existing options to grow efficiently without M&A
28
Our values
29
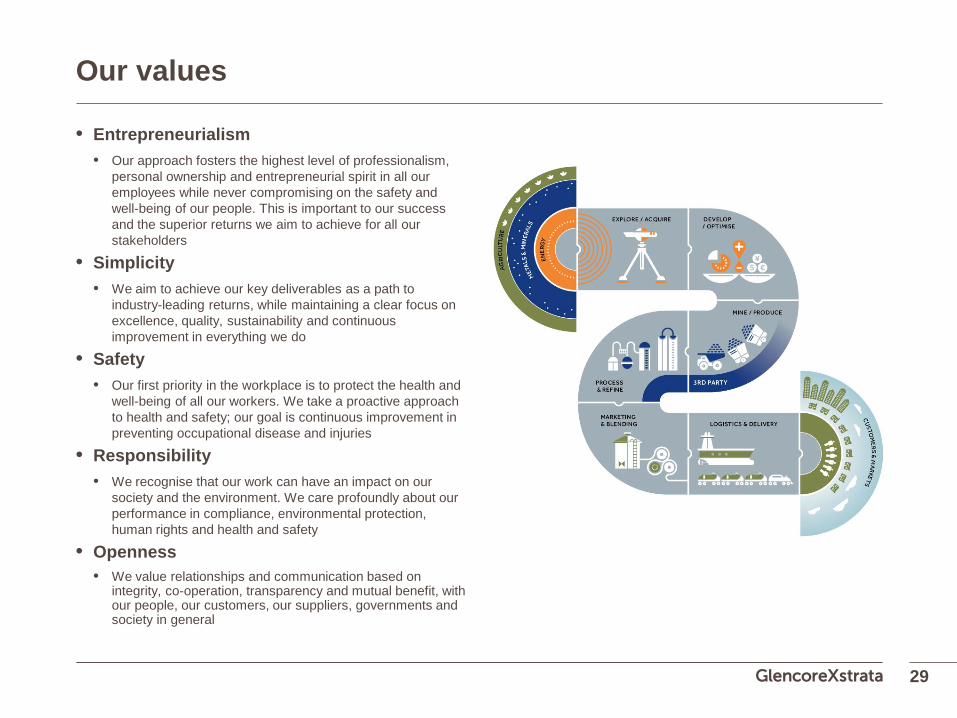
• Entrepreneurialism • Our approach fosters the highest level of professionalism,
personal ownership and entrepreneurial spirit in all our employees while never compromising on the safety and well-being of our people. This is important to our success and the superior returns we aim to achieve for all our stakeholders
• Simplicity • We aim to achieve our key deliverables as a path to
industry-leading returns, while maintaining a clear focus on excellence, quality, sustainability and continuous improvement in everything we do
• Safety • Our first priority in the workplace is to protect the health and
well-being of all our workers. We take a proactive approach to health and safety; our goal is continuous improvement in preventing occupational disease and injuries
• Responsibility • We recognise that our work can have an impact on our
society and the environment. We care profoundly about our performance in compliance, environmental protection, human rights and health and safety
• Openness • We value relationships and communication based on
integrity, co-operation, transparency and mutual benefit, with our people, our customers, our suppliers, governments and society in general
30
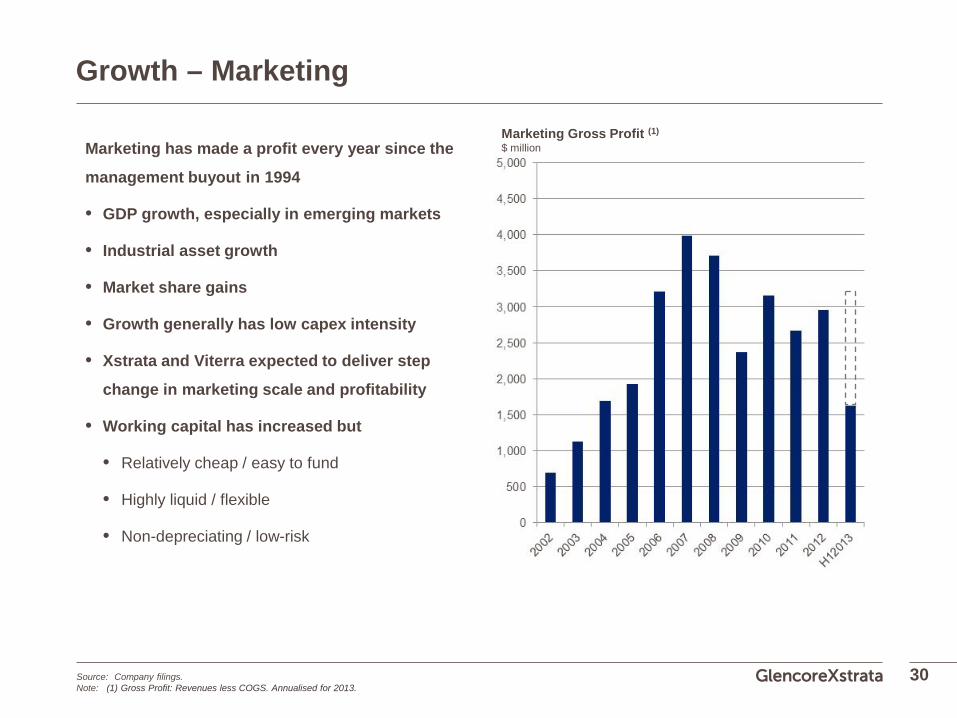
Growth – Marketing
Marketing has made a profit every year since the
management buyout in 1994
• GDP growth, especially in emerging markets
• Industrial asset growth
• Market share gains
• Growth generally has low capex intensity
• Xstrata and Viterra expected to deliver step
change in marketing scale and profitability
• Working capital has increased but
• Relatively cheap / easy to fund
• Highly liquid / flexible
• Non-depreciating / low-risk
Marketing Gross Profit (1) $ million
Source: Company filings. Note: (1) Gross Profit: Revenues less COGS. Annualised for 2013.
0
50
100
150
200
250
300
0
5
10
15
20
25
30
Q105
Q205
Q305
Q405
Q106
Q206
Q306
Q406
Q107
Q207
Q307
Q407
Q108
Q208
Q308
Q408
Q109
Q209
Q309
Q409
Q110
Q210
Q310
Q410
Q111
Q211
Q311
Q411
Q112
Q212
Q312
Q412
Q113
Q213
Current capital employed CCI Index (rebased to 100)
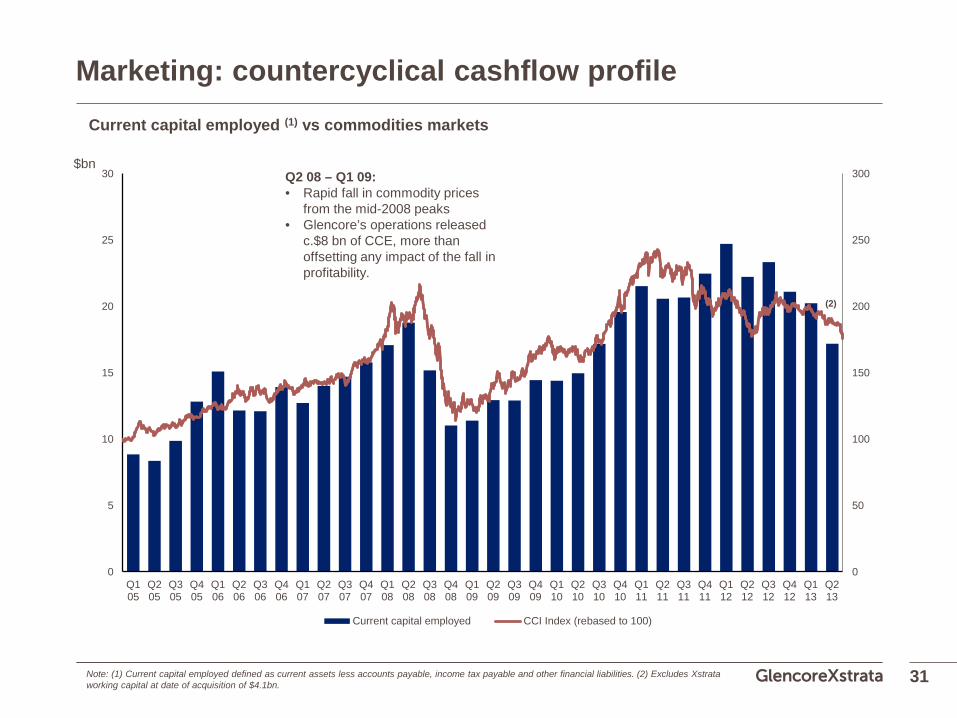
Marketing: countercyclical cashflow profile
31
$bn Q2 08 – Q1 09: • Rapid fall in commodity prices
from the mid-2008 peaks • Glencore’s operations released
c.$8 bn of CCE, more than offsetting any impact of the fall in profitability.
Current capital employed (1) vs commodities markets
Note: (1) Current capital employed defined as current assets less accounts payable, income tax payable and other financial liabilities. (2) Excludes Xstrata working capital at date of acquisition of $4.1bn.
(2)
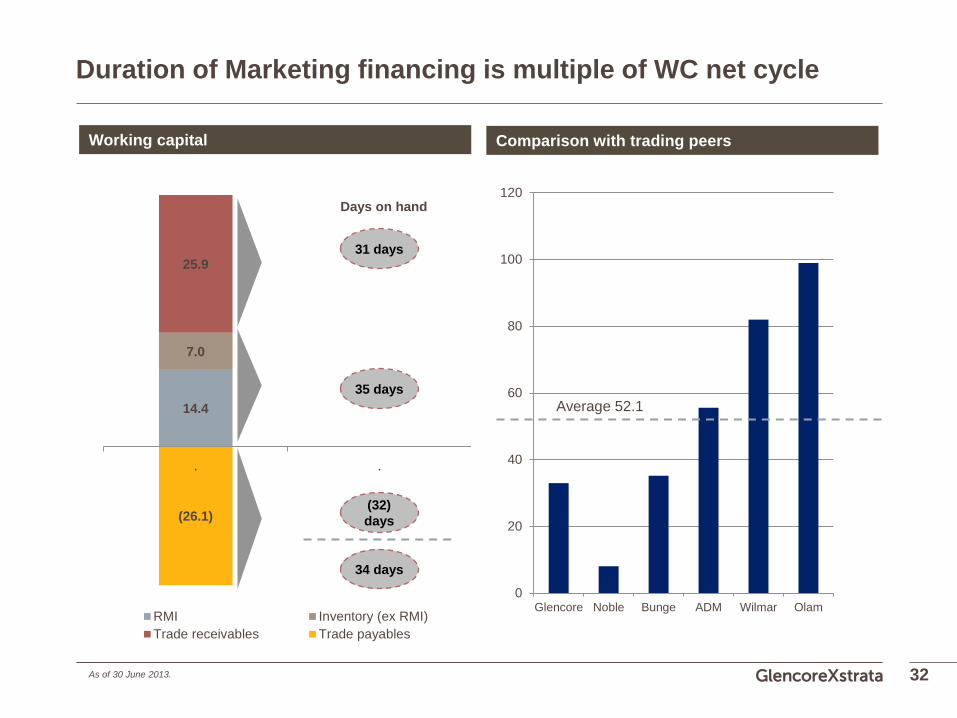
14.4
7.0
25.9
(26.1)
-30
-20
-10
0
10
20
30
40
50
. .
RMI Inventory (ex RMI)Trade receivables Trade payables
Duration of Marketing financing is multiple of WC net cycle
32
Working capital Comparison with trading peers
Days on hand
31 days
35 days
(32) days
34 days
0
20
40
60
80
100
120
Glencore Noble Bunge ADM Wilmar Olam
Average 52.1
As of 30 June 2013.
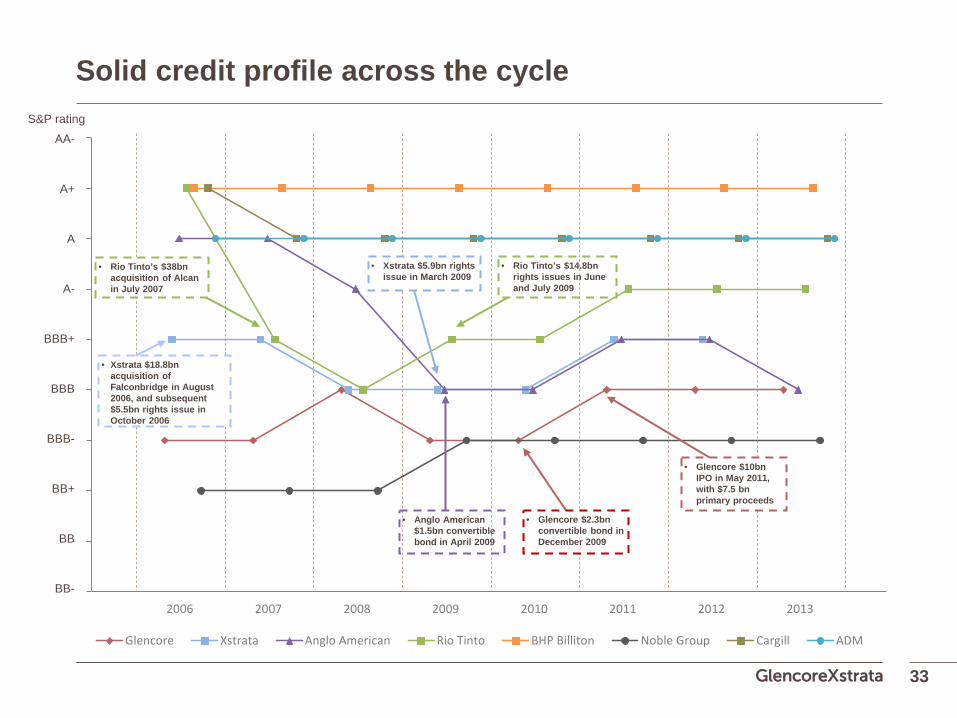
Solid credit profile across the cycle
33
0
1
2
3
4
5
6
7
8
9
2005 2006 2007 2008 2009 2010 2011 2012 2013
Glencore Xstrata Anglo American Rio Tinto BHP Billiton Noble Group Cargill ADM
S&P rating
• Anglo American $1.5bn convertible bond in April 2009
• Rio Tinto’s $14.8bn rights issues in June and July 2009
• Xstrata $18.8bn acquisition of Falconbridge in August 2006, and subsequent $5.5bn rights issue in October 2006
• Rio Tinto’s $38bn acquisition of Alcan in July 2007
• Xstrata $5.9bn rights issue in March 2009
• Glencore $2.3bn convertible bond in December 2009
• Glencore $10bn IPO in May 2011, with $7.5 bn primary proceeds
BB-
BB
BB+
BBB-
BBB
BBB+
A-
A
A+
AA-
Q&A