south africa power protection results · 2017. 12. 12. · • trial background: » comparison...
TRANSCRIPT

©2016 Innovolt. All rights reserved
South Africa Power Protection Results
February 2017
Innovolt Confidential

©2016 Innovolt. All rights reserved
Agenda
Trial Background
2 Innovolt Confidential
Results
Business Planning
Appendix- Comparative Studies
Competitive Review

©2016 Innovolt. All rights reserved
3
Trial Background

©2016 Innovolt. All rights reserved
Types of Electrical Overstress Examples of Impact
4
Electrical Overstresses (EOS) Cause Copy Quality Issues
• Inconsistent Light/Laser Source
• Motor Timing Errors
• Insufficient Fuser Temperatures
• Premature Component Failures
• Color Variations and Dropouts
• Image Distortion
• Paper Jams
• Inaccurate Color
• Unfinished Prints
Effects on MFP Subsystems

©2016 Innovolt. All rights reserved
Test Sites- Significant Power Issues
• Disturbance date available for 20 sites.
• All experienced
significant Electrical Over Stress (EOS) disturbances.
• As expected, there
was a wide distribution of EOSs across the machines
5
1
10
100
1000
10000Voltage Surge
Voltage Sag
Over Voltage
Brownout
Power Outage
20 Different sites spread across South Africa

©2016 Innovolt. All rights reserved
Electrical Over Stress (EOS) Disturbance Data
6
Voltage Sags
Power Outages
Brown Outs
Over Voltages
Voltage Surges
Totals
4455 2170 318 30 1 6974
Note: Shown on log scale due to large number of Sags and Outages
Source Voltage Sags
Power Outages
Brown Outs
Over Voltages
Voltage Surges
i-grid 74.5% 10.0% 10.0% 5.0% 0.5%
Innovolt 93.7% 5.1% 0.3% 0.2% 0.2%
Test Sites 63.88% 31.12% 4.56% 0.43% 0.01%
1
10
100
1000
10000
0.0%
20.0%
40.0%
60.0%
80.0%
100.0%
VoltageSag
PowerOutage Brownout Over
Voltage VoltageSurge
i-grid
Innovolt
NashuaTest Sites
©2016 Innovolt. All rights reserved
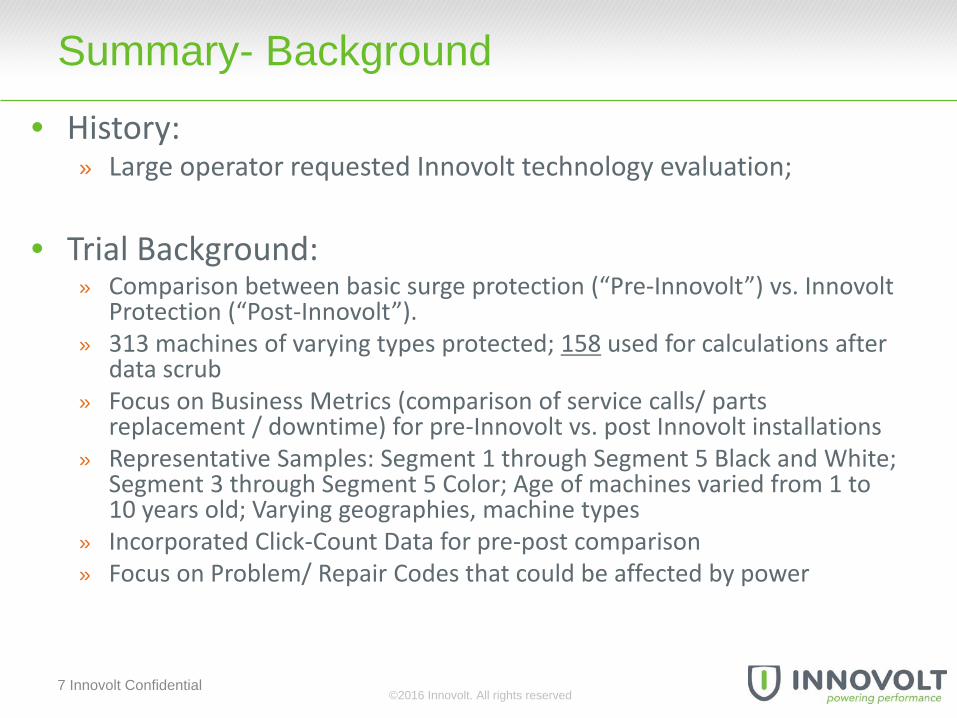
Summary- Background
7 Innovolt Confidential
• History: » Large operator requested Innovolt technology evaluation;
• Trial Background:
» Comparison between basic surge protection (“Pre-Innovolt”) vs. Innovolt Protection (“Post-Innovolt”).
» 313 machines of varying types protected; 158 used for calculations after data scrub
» Focus on Business Metrics (comparison of service calls/ parts replacement / downtime) for pre-Innovolt vs. post Innovolt installations
» Representative Samples: Segment 1 through Segment 5 Black and White; Segment 3 through Segment 5 Color; Age of machines varied from 1 to 10 years old; Varying geographies, machine types
» Incorporated Click-Count Data for pre-post comparison » Focus on Problem/ Repair Codes that could be affected by power
8
• Innovolt used an objective, third-party data analytics firm for assistance • Innovolt provided the raw data to Aspirent who formatted, grouped, compiled and analyzed the data
• Aspirent spreadsheet is provided with this presentation

Proprietary & Confidential 9
Aspirent’s U.S. Based Clients
©2016 Innovolt. All rights reserved
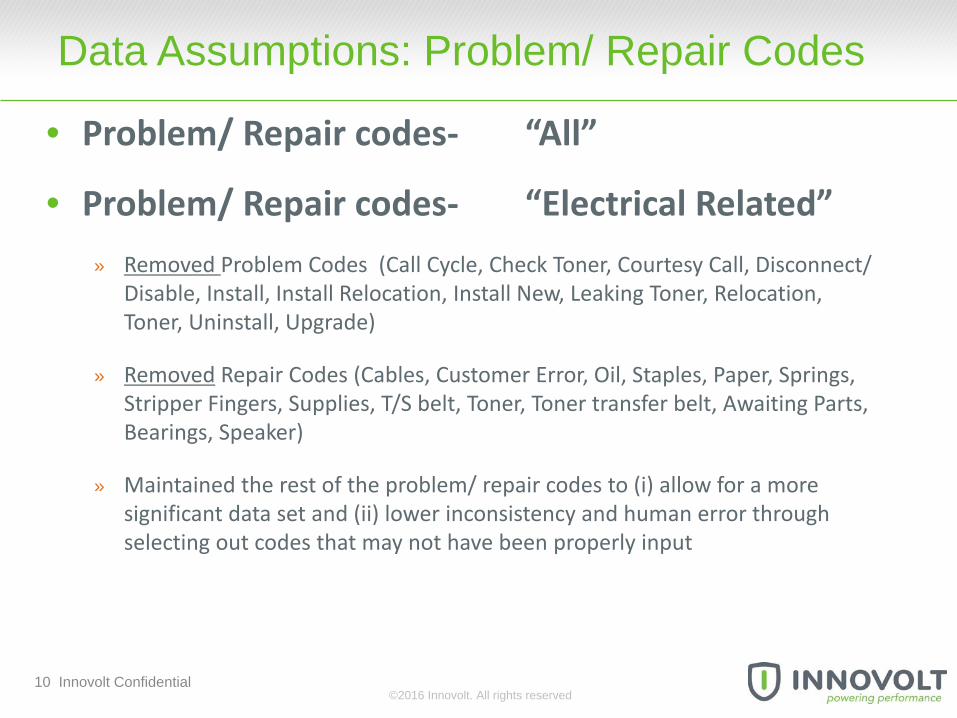
Data Assumptions: Problem/ Repair Codes
• Problem/ Repair codes- “All”
• Problem/ Repair codes- “Electrical Related” » Removed Problem Codes (Call Cycle, Check Toner, Courtesy Call, Disconnect/
Disable, Install, Install Relocation, Install New, Leaking Toner, Relocation, Toner, Uninstall, Upgrade)
» Removed Repair Codes (Cables, Customer Error, Oil, Staples, Paper, Springs, Stripper Fingers, Supplies, T/S belt, Toner, Toner transfer belt, Awaiting Parts, Bearings, Speaker)
» Maintained the rest of the problem/ repair codes to (i) allow for a more significant data set and (ii) lower inconsistency and human error through selecting out codes that may not have been properly input
10 Innovolt Confidential

©2016 Innovolt. All rights reserved
Data Assumptions- Click Results
11 Innovolt Confidential
• Review of click-counts on a pre vs. post Innovolt as a factor in relation to the business metrics (service, part, downtime reduction)
» Click-counts were down by approximately 32M clicks for an 18% decrease from the pre- post Innovolt time period
• Results were adjusted for usage (click-counts): For every metric calculated, we
divided the metric result in both the pre/ post periods by the actual clicks (thousands) to adjust for usage
• Discussion regarding factors that could contribute to the decrease in clicks:
» Seasonality / vacations / holidays » Decrease in printer/ copier usage » Business/ Market decline

©2016 Innovolt. All rights reserved
12
Results

©2016 Innovolt. All rights reserved
Results- Summary
13 Innovolt Confidential
General*Adjusted Per 1k
clicks** GeneralAdjusted Per 1k
clicks GeneralAdjusted Per 1k
clicks
21% 3%
R 5,290 per machine/ year
R802per machine/ year
21% 2%
R 4,163 per machine/ year
R524 per machine/ year
158
41% 28%
Problem, Repair Codes - Electrical Related
(Included most codes, but removed install, courtesy call, toner codes, etc.)
BUSINESS METRICS
Service Call Reduction Parts Cost Reduction Downtime Reduction
All Problem, Repair Codes
57% 48%
# of Machines
50% 39%
* General: pre/ post comparison reduction without factoring in click-count reduction
**Click-Adjusted (1k clicks): adjustied by taking pre/post reduction amounts for service, parts, downtime and dividing by the number of clicks in each period (pre/ post) to eliminate the click-count decrease variable
37% 24%
155 of 158

©2016 Innovolt. All rights reserved
Results: Service Call Reductions
14 Innovolt Confidential
0
1000
2000
3000
4000
5000
All Repair Codes NarrowedElectrical Codes
General
Surge Protector Innovolt
37%
41%
Serv
ice
Calls
0.0000
0.0050
0.0100
0.0150
0.0200
0.0250
0.0300
All Repair Codes Narrowed ElectricalCodes
Click-Adjusted
Surge Protector InnovoltSe
rvic
e Ca
lls
(per
1k
clic
ks)
28%
24%
*1858 service calls saved on 158 machines normalized for one year. Average of over 11 service calls saved per machine per year, (Over 9 service calls saved per machine per year if you remove the top 5 worst machines with the most calls.)

©2016 Innovolt. All rights reserved
Results: Down Time Reductions
15 Innovolt Confidential
0
10000
20000
30000
40000
50000
All Repair Codes NarrowedElectrical Codes
General
Surge Protector Innovolt
50%
57%
Dow
ntim
e –H
rs.
0.00
2.00
4.00
6.00
8.00
10.00
12.00
14.00
16.00
All Repair Codes Narrowed ElectricalCodes
Click-Adjusted
Surge Protector Innovolt
Dow
ntim
e- H
rs
(per
1k
clic
ks)
48%
39%
©2016 Innovolt. All rights reserved
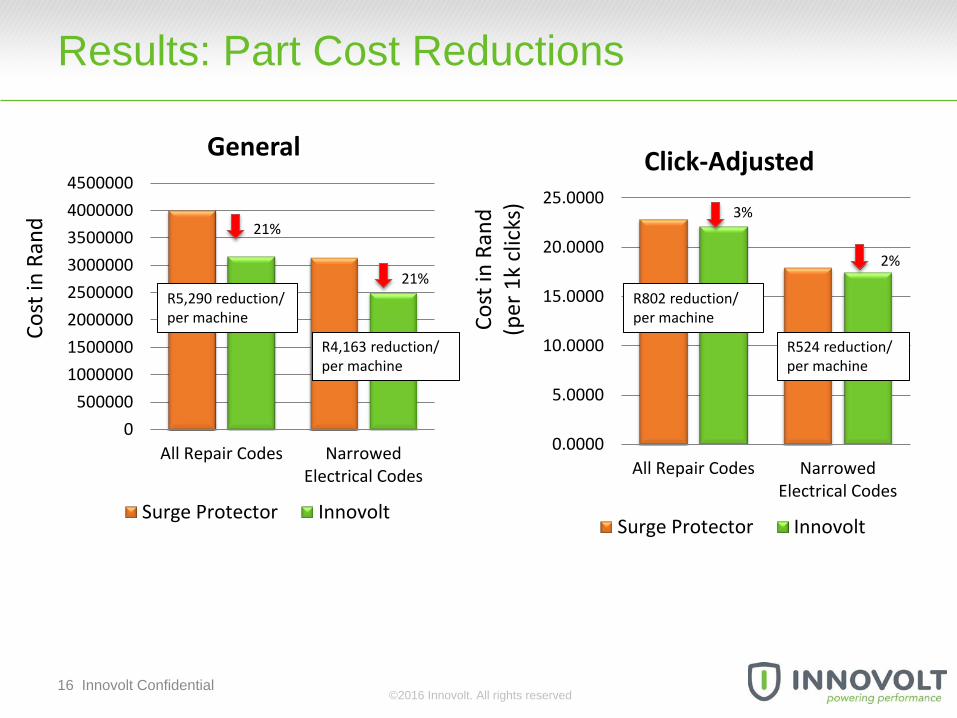
Results: Part Cost Reductions
16 Innovolt Confidential
Cost
in R
and
0500000
10000001500000200000025000003000000350000040000004500000
All Repair Codes NarrowedElectrical Codes
General
Surge Protector InnovoltCo
st in
Ran
d (p
er 1
k cl
icks
)
0.0000
5.0000
10.0000
15.0000
20.0000
25.0000
All Repair Codes NarrowedElectrical Codes
Click-Adjusted
Surge Protector Innovolt
21%
2%
R5,290 reduction/ per machine
3%
R802 reduction/ per machine
R524 reduction/ per machine
21%
R4,163 reduction/ per machine

©2016 Innovolt. All rights reserved
17
Competitive Review
©2016 Innovolt. All rights reserved
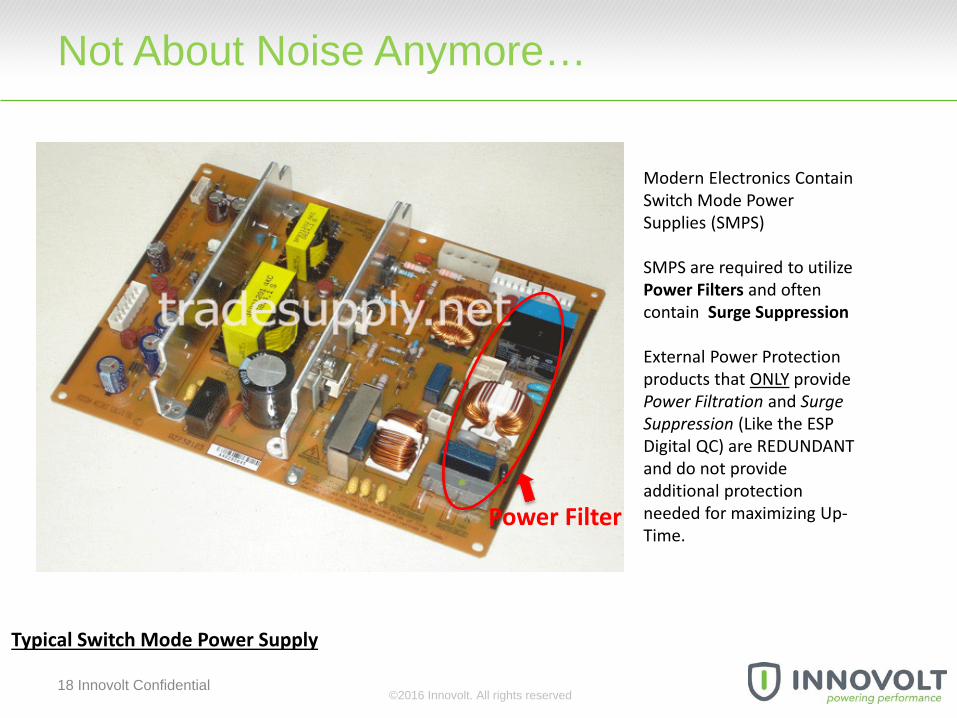
Not About Noise Anymore…
Modern Electronics Contain Switch Mode Power Supplies (SMPS) SMPS are required to utilize Power Filters and often contain Surge Suppression External Power Protection products that ONLY provide Power Filtration and Surge Suppression (Like the ESP Digital QC) are REDUNDANT and do not provide additional protection needed for maximizing Up-Time.
Typical Switch Mode Power Supply
18 Innovolt Confidential
Power Filter

©2016 Innovolt. All rights reserved
Innovolt is the ONLY power protection product that protects your electronic assets from ALL 5 Electrical Overstresses (EOS)
19 Innovolt Confidential

©2016 Innovolt. All rights reserved
Innovolt SmartProtect- PM16
ESP NextGen
ESP Digital QC
Voltage Sag • Patented circuit prevents component damage from Current Inrush at the recovery of a Voltage Sag and whenever voltage is reconnected.
• Lets Current Inrushes due to Voltage Sags pass through to the asset. “ICE” current inrush limiting circuit does not respond to Voltage Sags.
• No Protection
Over Voltage/ Brownout
• Fastest disconnection speed in the industry for Catastrophic OV
• Uses Voltage Level and Time to determine appropriate disconnection speed for voltages outside the standard range. – AVOIDS NUISANCE SHUTDOWNS
• Rudimentary system uses the same cut-off speed for all voltages outside the standard operating range, resulting in unnecessary NUISANCE SHUTDOWNS and pointless downtime.
• No Protection
Reclose Sequence • Monitors voltage closely when power is turned ON to confirm stable power before engaging the connected equipment, ensuring a “soft” start with a clean power up sequence.
• Immediately connects equipment to main power upon recovery from a power outage. Standard power company procedure after an outage is to perform a “reclose sequence” – several short burst of power to clear the power lines of debris – which can inflict multiple severe voltage transients and current inrushes which is detrimental to the life of the connected equipment.
Innovolt Differentiation – Advanced Power Protection
20 Innovolt Confidential

©2016 Innovolt. All rights reserved
Voltage Sag Premature Failure and Phantom Errors
Standard MFP presented with a Voltage Sag
protected by ESP NextGen
Lets 98A through to the MFP
Standard MFP presented with a Voltage Sag
protected by Innovolt
Allows only 22A through to the MFP
Voltage
Current
Current Inrush
Voltage
Current
Current Inrush
21 Innovolt Confidential
©2016 Innovolt. All rights reserved
Competitive Summary
(1) SURGE PROTECTORS- ALL SIMILAR • Surge Protectors w/ filters = all use very similar components • Generally provide the same protection (i.e. that which is already contained
in the vast majority of power supplies, for noise and lightning)
(2) TRIAL RESULTS – INNOVOLT VS. SURGE PROTECTOR • Innovolt went head to head with basic surge protector in the study
reference herein • the results are based on that comparison with Innovolt saving over 11
service calls/ machine/ year vs. basic surge protection
(3) INNOVOLT PROVIDES SUPERIOR PROTECTION • No power protection in the marketplace (sans expensive double conversion
UPS systems) protect against all of the power anomalies like Innovolt
22 Innovolt Confidential

©2016 Innovolt. All rights reserved
Business Planning
23

©2016 Innovolt. All rights reserved
Discussion/ Decision Process
1. Compelling Results Comparative results where basic surge protector was bundled on all machines vs. Innovolt
protection on the evaluation group. Innovolt significantly lower service calls, increase in uptime and significant part costs
reduction vs. basic surge protection even with decrease in click-counts Innovolt provides the ability to differentiate from competition and create stickiness and
growth with its customers.
3. Next Steps: Roll-Out Planning, Pro-Active Corporate Decision Understand current fleet make-up (volume by segment of deployed machines and new
machines)
Understand Ricoh SA economics o Cost of service call (by segment) o Average number of service calls per machine o Average annual parts costs per machine (by segment) o Average revenue per machine (click-counts)
Decision process for bundling (i.e. swapping basic surge protection with Innovolt) and retro-
fits on current deployed machines
24 Innovolt Confidential

©2016 Innovolt. All rights reserved
Hypothetical Business Case- Bundling
25 Innovolt Confidential
Customer Satisfaction- technology provides for better working, lower service machines (vs. competitive basic surge protector)
Economics- part savings alone result in ROI of approximately 1 year, without factoring in other savings
Compounding Profits- the part savings are per year, so such savings should be cumulative
*Information provided solely for illustrative purposes. Confirm Assumptions
Yr. 1 Yr. 2 Yr. 3
Total Available Machines for Retro-Fit (Seg 2-6)(1)
10,000 7,000 4,000
New Machines Bundled with Innovolt(2) 3,000 3,000 3,000Retro-fit on Machines Deployed(3) 3,000 3,000 4,000
Revenue Per Innovolt Appliance Sold to Customers (4)
1795 1795 1795
Part Savings Per Machine/ year (5)
Uptime Profit Increase / year (6) ____ ____ _____Service Savings/ year (7) ____
Total Profit/ Savings for Bundling (excluding uptime profit increase)
ZAR 10,770,000 ZAR 10,770,000 ZAR 12,565,000
Cost of Innovolt Appliance per machine (8) 1795 1795 1795Total Cost ZAR 10,770,000 ZAR 10,770,000 ZAR 12,565,000
Profit Per Yearly Rollout: Cumulative Rolling Profit(8)
5 To Populate for ful l bus iness case- s tudy shows savings ranging from 800 - 5600 rand per machine per year 6 To Populate for ful l bus iness case
9 Assumes same parts savings profi ts in years 2 and 3 for the uni ts deployed the previous years , with 3 year warranty/ protection plan
8 Based on current pricing, discounted volume pricing ava i lable 7 To Populate for ful l bus iness case; assumed 40% savings of service ca l l s (determine volume and cost of each ca l l )
RICOH SA- ROLLOUT OF INNOVOLT- EXAMPLE(New Machines & Retro-fit on Machines Deployed)
Assumptions:
1 ______ segment 2-6 machines deployed each year; (SLA question on segment 1 machine), decl ining each year with ful l bundl ing of Innovolt and attacking retro-fi t machines from year 1
4 Based on current pricing with an individual sa le to the franchisees at Cost to Ricoh.
2 Based on bundl ing with Innovolt of a l l new Segment 2-6 machines
3 Assumes 3 year lease period on a l l new deployed machines with a s table base of 10k machines per year for three years and ful l penetration on a l l deployed machines after three years , so year 3 new machines would finish the remaining 4k

©2016 Innovolt. All rights reserved
26 Innovolt Confidential
Proposed Timeline for Decision
Next Steps Proposed Timeline
(1) Meeting with Ricoh • Review Innovolt technology and results in South
Africa and USA • Determine Ricoh metrics, purchase considerations
(bundling, value in saved calls/ part reduction, etc.)
February 8
(2) Follow-up review • Analyze relevant Ricoh information for comparative
purposes • ROI determination
Week of February 20
(3) Decision on Purchase Program First week in March

©2016 Innovolt. All rights reserved
27
Appendix- Comparative Results

©2016 Innovolt. All rights reserved
28 Innovolt Confidential
INNOVOLT’S SOLUTIONS WORK- RESULTS ACROSS SEGMENTS
• Over 20
evaluations
• Ranging from 60 days to multi-year
• Protecting various distributed electronics
• Significant savings and increased uptime across the board

©2016 Innovolt. All rights reserved
Comparative Results South Africa Savings – Consistent with Innovolt N.A. Office Equipment Customer
29 Innovolt Confidential
2.59
1.36
0.0
0.5
1.0
1.5
2.0
2.5
3.0
Control Group Innovolt
Total Emergency Service Calls
47%
• Aspirent studied 10,000 MFPs over an 8 year period from a major imaging OEM in North America
» 4 years with a competitive power protection solution and then 4 years with Innovolt
» Study covered over 71,000 service calls
• Innovolt provided a 52% reduction in emergency service calls (non-scheduled service calls) in the three most common problem segments
» 47% reduction across all emergency service calls
• The impact of Innovolt was
immediate, with significant reductions showing up in the first year and continuing through the study
• This includes critical customer satisfaction areas like copy quality, where Innovolt demonstrated a 51% reduction in service calls

©2016 Innovolt. All rights reserved
Comparative Results South Africa Savings- Consistent to other U.S. segments
30 Innovolt Confidential
$333.33
$223.74
0.0
100.0
200.0
300.0
400.0
Pre Innovolt Post Innovolt
Parts Replacement Costs / Lane / Year
33%
In the PARC segment, the Innovolt protected machines experienced a
42% reduction in overall service calls and a 33% reduction in parts
replacement costs.
In the ATM segment, The Innovolt protected machines
experienced a 55% reduction in down time, along with a 46%
reduction in overall service calls.
PARC (Parking Access & revenue Control)
ATM Vending/ Point of Sale
8.9
4.0
0.0
5.0
10.0
Pre Innovolt Post Innovolt
Hours Down / machine/ month
48%
In the Vending segment, The Innovolt protected machines
experienced a 48% reduction in overall service calls.
11.2
5.8
0.0
5.0
10.0
15.0
Pre Innovolt Post Innovolt
Service Calls / Machine / Year