south african film industry economic baseline study …nfvf.co.za/home/22/files/baseline...
TRANSCRIPT

1
© Copyright NFVF 2013
South African Film Industry Economic Baseline Study Report
April 2013

2
© Copyright NFVF 2013
Table of Contents 1. Executive Summary ............................................................................................................................ 6
2. Objectives ............................................................................................................................................ 7
3. Scope .................................................................................................................................................... 7
4. Methodology .............................................................................................................................................. 7
4.1. Background ........................................................................................................................................... 7 4.2. Value Chain Definition ........................................................................................................................... 8 4.3. Methods Employed ................................................................................................................................ 9 4.3.1. High Level Overview ........................................................................................................................... 9 4.3.2. Online Survey Methodology .............................................................................................................. 11 4.3.2.1. Background and Scope .................................................................................................................. 11 4.3.2.2. Process ........................................................................................................................................ 11 4.3.3. DTI Film Incentive Information ......................................................................................................... 11 4.3.3.1. Background and Scope .................................................................................................................. 11 4.3.3.2. Process ........................................................................................................................................ 12 4.3.4. Research and Meetings Methodology ................................................................................................ 13 4.3.4.1. Background ................................................................................................................................... 13 4.4.4.2. Process ........................................................................................................................................ 13
5. Film Industry Online Survey Results .............................................................................................. 14
5.1. Economic Indicators ............................................................................................................................ 14 5.1.1. Size of the Industry and Value Chain Breakdown .............................................................................. 14 5.1.2. Job Creation .................................................................................................................................... 14 5.1.3. Taxation ........................................................................................................................................... 15
6. DTI Information Results .................................................................................................................. 15
6.1. Economic Indicators ............................................................................................................................ 15 6.1.1. Size of the Industry and Value Chain Breakdown .............................................................................. 15

3
© Copyright NFVF 2013
6.1.2. Job Creation .................................................................................................................................... 15
7. Economic Indicators ......................................................................................................................... 16
7.1. Introduction ....................................................................................................................................... 16 7.2. What is a SAM? ................................................................................................................................... 17 7.3. SAM Methodology ................................................................................................................................ 18 7.3.1. Market Size of the SAFI .................................................................................................................... 19 7.3.2. Evaluating the Cost Breakdowns for the SAFI’s Value Chain .............................................................. 20 Pre-production Costs .................................................................................................................................. 20 7.3.2.2. Production Costs ............................................................................................................................ 21 7.3.2.3. Post-production Costs .................................................................................................................... 22 7.3.2.4. Distribution Costs .......................................................................................................................... 23 7.4. SAM Results ...................................................................................................................................... 23 7.4.1. Direct GDP Impacts ......................................................................................................................... 23 7.4.2. Indirect GDP Impacts ....................................................................................................................... 24 7.4.3. Induced GDP impacts ....................................................................................................................... 24 7.4.4. Multiplier .......................................................................................................................................... 24 7.4.4.1. Comparison of the SAFI Multiplier to Other Industry Multipliers ...................................................... 25 7.4.5. Employment ..................................................................................................................................... 26 7.4.5.1. Direct Employment Estimates ........................................................................................................ 26 7.4.5.2. Indirect Employment Estimates...................................................................................................... 29 7.4.6. Taxes ............................................................................................................................................... 30 7.4.6.1. Direct Taxes .................................................................................................................................. 30 7.4.6.2. Indirect Taxes ............................................................................................................................... 31
8.Value Chain Analysis ................................................................................................................................ 32
8.1. General Value Chain Trends .............................................................................................................. 32 8.2. Pre-production Stage .......................................................................................................................... 33 8.2.1. Development Cost Funding .............................................................................................................. 34 8.2.2. Production Cost Funding .................................................................................................................. 34 8.2.2.1.Reasons for the Lack of Funding ..................................................................................................... 36 8.3. Production Stage .............................................................................................................................. 37
4
© Copyright NFVF 2013
8.3.2. Low Budget Films ............................................................................................................................. 38 8.3.3. Transformation ................................................................................................................................. 39 8.3.4. Training and development ................................................................................................................ 40 8.3.5. Production Incentives ...................................................................................................................... 40 8.4. Post-production ................................................................................................................................ 41 8.4.1. Technology ...................................................................................................................................... 41 8.4.2. Post-production Incentive ............................................................................................................... 42 8.5. Distribution .......................................................................................................................................... 42 8.5.1. Local Film Revenues ......................................................................................................................... 42 8.5.1.1. Local Cinemas ............................................................................................................................... 43 8.5.2. Local DVD......................................................................................................................................... 45 8.5.3. Local Pay TV and Free TV ................................................................................................................. 46 8.6. International Distribution ..................................................................................................................... 47
9. Conclusion .......................................................................................................................................... 49

5
© Copyright NFVF 2013
Definitions The following definitions apply throughout this report: Term
Definition
DTI Department of Trade and Industry DTI’s Film Incentive DTI’s South African Film and Television Production and Co-
production Incentives, and, the Foreign Film and Television Production and Post-production Incentive
Film / s Refers only to feature films, documentaries, TV series, TV films, animation series and animation films. This definition closely follows the DTI’s classification of qualifying projects in the DTI’s Film Incentive. Thus, commercials, projects commissioned by broadcasters and shortform film / animation projects are excluded
FPB Film and Publication Board FTE Full Time Equivalent GDP Gross Domestic Product GFC Gauteng Film Commission IDC Industrial Development Corporation IPO Independent Producers Organisation. ISPA Internet Service Providers Association NFVF National Film and Video Foundation SASFED South African Screen Federation SARS South African Revenue Services South African Film Industry
Includes those activities which arise in South Africa from companies and / or individuals employed in the: • different stages of film production in the South Africa
(including pre- and post-production); • distribution of films in South Africa; and • exhibition of films in South Africa; associated with South African-made films only. Economic activity associated with the distribution and exhibition of films made outside of South Africa is excluded
TV Television
WASPA Web Application Service Providers Association

6
© Copyright NFVF 2013
1. Executive Summary The NFVF commissioned Deloitte to research and determine the economic benefits and the value chain profile of the South African Film Industry (“SAFI”). Key findings from this research show that in 2012 the SAFI: • Contributed R3.5 billion to South Africa’s GDP (both direct and indirect spend); • Created over 25 175 FTE jobs; • Earned over R670 million towards the South African GDP; • Encompassed over 2 500 direct service providers; and • Delivered an economic multiplier of 2.89, i.e. for every R1 spent in the industry, another R1.89
was generated within the South African economy. Although the SAFI is not the biggest GDP contributor or job creator when compared to some of the other South African industries, e.g. manufacturing or retail, its multiplier of 2.89 puts it at mid-range when compared to 99 other industries. Also, it more than pays for itself with a delivery back to SARS of more than R670 million (R420 million more than the estimated Film Incentive of R250 million paid out in 2012). A full value chain analysis of the SAFI for 2012 revealed the following focal areas to ensure the sustainability and commercial viability of the SAFI in the long-term: • Development of high quality film concepts and screenplays; • Increased training initiatives across the value chain; • Increasing competitiveness of South Africa versus other countries when attracting foreign films; • Supporting the growth and distribution of low budget films; • Supporting the distribution of local films into foreign territories; • Controlling the negative impacts of piracy; and • Supporting the development of local films’ audiences and associated distribution methods.
The remainder of this report will outline the objectives, scope, methodologies and results of the research on the SAFI.

7
© Copyright NFVF 2013
2. Objectives
The NFVF commissioned Deloitte to conduct a baseline study on the economic impact of the SAFI. The purpose of this study is to provide the NFVF with data that will help it to develop appropriate strategies for facilitating development of the SAFI.
3. Scope
In order to fulfil the objective, the scope of the study included: • A full value chain analysis of the SAFI covering development (i.e. pre-production, production,
post-production and distribution); and • The annual economic output of the SAFI in terms of the following economic indicators:
• Size (i.e. GDP contribution) of the SAFI; • Number of companies that are doing business in the SAFI; • Number of individuals employed in the SAFI (permanent employees and freelancers); • Direct and indirect taxes that the SAFI pays; and • The economic multiplier effect of the SAFI.
The scope of the study was limited to the following: • Films as defined in section 1 of this report; • Films that were produced during the period 1 January 2012 to the 31 December 2012; • Legitimate film project distribution (i.e. no pirated content distribution); and • Only films that were produced in their entirety or partially within South Africa.
4. Methodology
4.1. Background The analysis of the SAFI’s value chain and the calculation of the economic indicators require the following:
• Defining the value chain of the SAFI prior to conducting any research; • Understanding the total Rand value of the SAFI value chain; and • Understanding the breakdown of costs within the SAFI value chain.

8
© Copyright NFVF 2013
4.2. Value Chain Definition
For the purposes of conducting this research, the SAFI value chain is defined as covering all costs from film concept development through to release of the completed film. These costs are referred to as Direct Costs. These costs can be categorised as per Table 1. Table 1: Value Chain Cost Definitions Value Chain Stage
Definition
Pre-production The cost of development, funding and shoot preparations for the film.
Production The costs incurred to shoot the film, including stock footage. In the case of animation, the actual animation and programing costs incurred to complete the film.
Post-production The costs incurred to transform the footage (digital or film stock) into the finished film.
Distribution The costs incurred to release and promote the finished film across cinema, DVD, CD, video-on-demand (“VOD”), mobile, online and TV platforms.
These cost categories can be broadly broken down as per Figure 1.

9
© Copyright NFVF 2013
Figure 1: Value Chain Cost Details
As there is no central repository / database of information for the SAFI, a multi-pronged approach was necessary to collect enough data to build an accurate picture of the SAFI. The methods that were employed are detailed in paragraph 5.3.
4.3. Methods Employed
4.3.1. High Level Overview
The methods employed to compile the total Direct Cost Rand value and costs breakdown of the SAFI and its value chain are illustrated in Figure 2. Figure 2: Direct Costs Total and Breakdown Calculation

10
© Copyright NFVF 2013
The outputs (i.e. SAFI Direct Costs Rand value and cost breakdown) were used to inform the detailed value chain analysis, and, were used as inputs for the economic modelling to calculate the economic indicators.
Sections 5.3.2 to 5.3.3 provide more detail on each of the research methods employed.

11
© Copyright NFVF 2013
4.3.2. Online Survey Methodology
4.3.2.1. Background and Scope The online survey was emailed out to an electronic database of 2 523 SAFI stakeholders.
4.3.2.2. Process The following process was followed to compile, distribute and assimilate the online survey of the SAFI:
• Deloitte, in conjunction with the NFVF and the Deloitte Economic Advisory Unit, compiled a
questionnaire that addressed the economic indicators requested by the NFVF; • In order to allow for comparison to the DTI information, the categories and definitions as per the
DTI’s Film Incentive documents were closely followed and included in the questionnaire; • In order to allow for a detailed value chain analysis, the value chain categories and costs as per
section 5.2 were used in the development of the questionnaire; • A database of SAFI stakeholders was compiled from the NFVF’s database, Deloitte’s database and
various provincial film commissions’ databases; • The online survey was emailed to the SAFI stakeholder database; • Separate emails were sent to SAFI “umbrella” organisations to request their assistance in
encouraging and mobilising their members to complete the survey; • Survey responses were automatically collated electronically; and • The raw survey database of responses was given to Deloitte which then analysed the data by
filtering, calculating totals, averages and trends.
The online survey allowed us to collect detailed information on the SAFI value chain and individual films for the calculation of the economic indicators.
Film industry stakeholders who did not have online access or connectivity would not have been included in this survey. This necessitated the use of other methods, i.e. DTI Incentive information collation, research, and, meetings with SAFI stakeholders.
4.3.3. DTI Film Incentive Information
4.3.3.1. Background and Scope The DTI offers and administrates the DTI Film Incentive.
Qualifying films may access the DTI Film Incentive which is then either paid retrospectively (i.e. after a film is completed and ready for distribution) or during the course of the production of the film (i.e. at pre-defined milestones and is thus appropriately referred to as the “Milestone Option”).
Qualifying productions include feature films, television movies, television drama series or mini-series, documentaries and longform animation projects. There are no projects that can qualify for the DTI incentive that fall outside the definition of films for the purposes of this study.

12
© Copyright NFVF 2013
The DTI Film Incentive pays out between 25%-35% on Qualifying South African Expenditure (“QSAPE”) for films that meet the definition of a local production / co-production, and, 20% of QSAPE for films that meet the “foreign” film definition. A post-production incentive was introduced in June 2012 and this provides an additional 2.5% and upwards on QSAPE.
QSAPE is, in basic terms, production budget spent by the applicant on services, intellectual property and goods provided by South African companies / individuals on films. In other words, QSAPE is a very good measure of the economic benefit to South Africa resulting from the production of films by the SAFI.
The DTI Film Incentive payments are governed by a series of processes and documents, with the Form D being the document that summarises the audited QSAPE. Thus, Form Ds are the best source of information as the reflected QSAPE has been incurred, paid and audited.
4.3.3.2. Process
The following process was followed to compile the DTI Film Incentive information:
• A meeting was held between Deloitte and the DTI unit that manages the Film Incentive, where
the scope and purpose of the project was explained. At this meeting, the DTI agreed to provide us with all Form Ds submitted between 1 January 2012 and 31 December 2012;
• Deloitte compiled the relevant information from the Form Ds into an Excel database; • Any projects that were completed before 1 January 2012 were removed from the database (as
they fell outside the period of our study): • Projects that were not completed before the end of 31 December 2012 were pro-rated according
to their stage of completion (as one cannot place reliance on costs not yet incurred); • Projects that were started before the 1 January 2012, and, were finished between the 1 January
and 31 December 2012, were not pro-rated to adjust for costs incurred prior to 1 January 2012. The reasons for this are as follows:
• The database was compiled using the DTI’s Form Ds only. As approximately 70% of the DTI incentives are paid out retrospectively (i.e. once a project is completed), any project that was in production during the period 1 January 2012 to 31 December 2012, but which was not completed before 31 December 2012, will not have submitted its Form D . This would result in these projects being excluded from this database. This would have resulted in an significant undervaluation of the SAFI if there was no compensating data;
• If, however one assumes the following: • Films are produced constantly over a 12 month period; and • The average distribution of costs remains the same (both the survey and the DTI
database reflect production costs as the dominant cost with pre- and post-production costs being minimal in comparison);
then it is logical to deduce that all production costs of projects that were started before the 1 January 2012 and finished between 1 January 2012 and 31 December 2012 can be included.
• This resulted in the compilation of a database that follows the same timing as the online survey (i.e. between 1 January and 31 December 2012), thus allowing the comparison of trends, percentages and totals.

13
© Copyright NFVF 2013
The database compiled from the Form Ds would exclude any project which does not qualify for the DTI Film and Television Incentive. The most notable exclusions for purposes of this research are films with total production budgets of less than R2.5 million, and films with less than 75% qualifying South African spend. Further to this, both the online survey and the DTI Information study do not include any qualitative information. To address this, we held stakeholder interviews to cover both low budget films and qualitative aspects of the SAFI. Results from these interviews are included in Section 9 Value Chain Analysis.
4.3.4. Research and Meetings Methodology
4.3.4.1. Background
Research was conducted via stakeholder interviews and desktop research. The objectives of this research were to:
• Qualitatively landscape the SAFI and value chain; and • Determine the number of small budget films and filmmakers operating in the legitimate informal
sector of the SAFI.
4.4.4.2. Process
Stakeholder interviews were held with the following individuals / organisations:
• NFVF; • FPB; • DTI; • IPO; • SASFED; • Straight2DVD; • MNet; • Magic Factory; • Indigenous Films; • Nu Metro; • SAFACT; • GFC; • ISPA; • Moonlighting; • Chicco Twala; and • Individual producers of low cost films for broadcasters.
The list of websites that were accessed can be seen in Annexure A: Source of Information. The remainder of this report will deal with the results of these methods employed.

14
© Copyright NFVF 2013
5. Film Industry Online Survey Results
5.1. Economic Indicators
5.1.1. Size of the Industry and Value Chain Breakdown
The value and relative percentage of the total SAFI attributable to each stage of the value chain is illustrated in Table 2. Table 2: Distribution of Value Across the Value Chain
Value Chain Stage Estimated size % of Total
(QSAPE)
ZAR Pre-production 18 429 441 11%
Production 128 094 091 73% Post-production 23 910 676 14% Distribution 4 127 035 2% Total SAFI 174 561 243 100%
Thus, the online survey indicated that the Production Stage of the SAFI value chain is significantly dominant over the other stages.
5.1.2. Job Creation
The number of people employed, skills breakdown and FTE jobs are illustrated in Table 3.
Table 3: Breakdown of SAFI Employment Figures Description Permanent Temporary Total number employed 263 5 769 Skill Level: Highly skilled 120 1 807 Skilled 90 1 806 Un-skilled 53 2 156 Full time equivalent conversion Average months employed 12 4 Full time equivalent (FTE) 263 1 923

15
© Copyright NFVF 2013
Thus, highly skilled individuals constitute the largest portion of the permanent jobs in the SAFI, whereas unskilled individuals dominate the temporarily jobs sector of the SAFI.
5.1.3. Taxation
Total average direct taxation paid per the online survey was 19% of total production cost.
Please see Section 9 for a detailed value chain analysis, and, Annexure B for a detailed report on the Online Survey Results.
6. DTI Information Results
6.1. Economic Indicators
6.1.1. Size of the Industry and Value Chain Breakdown
The total QSAPE reported in the DTI’s Form Ds for the period under review was R1.2 billion as documented in Table 4. Production costs accounted for 93% of QSAPE. Table 4: Value Chain Stage Value and Breakdown Value Chain Stage Estimated size % of Total (QSAPE) ZAR Pre-production 32 490 088 3% Production 1 111 459 780 93% Post-production 48 420 962 4% Distribution - 0% Total 1 192 370 830 100%
The Production stage dominates the SAFI value chain. This concurs with the results of the Online Survey as per Section 6.
6.1.2. Job Creation
A total of 39 961 individuals were employed according to the DTI Form Ds. 66% of individuals working on productions were black. Please see Table 5 for further details.

16
© Copyright NFVF 2013
Table 5: Breakdown of SAFI Employment Figures
Please see Section 9 for a detailed value chain analysis. Please see Annexure C for a detailed report on the collation of the DTI Information Results.
7. Economic Indicators
7.1. Introduction
To reiterate, the NFVF required the following economic indicators to be calculated with regard to the SAFI: • Size of the SAFI; • Number of companies that are doing business in the SAFI; • Number of individuals employed in the SAFI (permanent employees and freelancers; • Direct and indirect taxes that the SAFI generates and pays to SARS; and • The economic multiplier effect of the SAFI. In order to quantify the economic indicators one needs to measure the following: • Direct impacts; • Indirect impacts; and • Induced impacts of the SAFI. The reason for this is that there are many channels through which the SAFI contributes to the South African economy including:
Description Total People Total number employed 39
961 Race: Black 26
424 White 13
537 Disabled:
9

17
© Copyright NFVF 2013
• Direct impacts – this is the employment, investment, wages and salaries that the SAFI spends in the South African economy each year from the pre-production, production, post-production and distribution phases of a longform film production;
• Indirect impacts – this includes secondary spending and employment which occurs throughout the entire value chain to produce a film. Expenditure incurred by the suppliers to the SAFI required to produce their own output not directly related to the SAFI, will also provide benefits to the economy. Even though these benefits are not directly related to the SAFI, they occur as an indirect result of spending from the SAFI, e.g. the expenditures by hotels to house film crews, or, a special effects studio purchasing computing and graphics equipment from an IT supplier not necessarily associated with the SAFI; and
• Induced impacts – this includes the employment and activity that is supported by those directly or indirectly employed in the SAFI spending their wage income on goods and services in the wider South African economy.
Taking all of these impacts into account, one will find that the total GDP or value added economic contribution from the production of a film will be larger than the initial direct investment expenditure due to the additional indirect and induced impact. This is illustrated in Figure 3 below: Figure 3: Channels of Economic Impact
In order to correctly estimate the indirect and induced impacts, one needs to make use of a social accounting matrix (“SAM”).
7.2. What is a SAM?
A SAM is simply the quantification (in matrix form) or modelling of the ‘circular flow ‘of an economy in a given period of time (typically a year). The data used in the model is built from data taken from the national accounts and various other statistical surveys.
Induced employment and income is generated when people employed in the direct and indirect activities (businesses who profit from them) spend their income or revenues on a wide range of goods and services.E.g. Entertainment, Groceries, Rental, Banking, Fuel, Electricity, Transport, etc.
Induced Impact
Indirect employment and income is generated in businesses that supply inputs to the various film industry stakeholders (upstream industries) e.g. the impacts due to spending by equipment suppliers to the film industry.
Employment and income generated by the activities related to film production. These impacts are due to the activities that take place during each stage of the film production value chain. These include:
Direct Impact
Indirect Impact
Film industry
spending
Measurable Economic Impacts
Total Economic Impact of Project
Spending
Pre-production• Script development• Writing
Production• Studios• Casting• Equipment
Post production• Editing• Music
Distribution• Cinema film• DVD sales

18
© Copyright NFVF 2013
SAMs differ widely in their complexity ranging from simple representations of the national accounts to detailed decompositions of economic activity and the associated financial flows. The SAM employed in this economic impact study is particularly detailed and contains 171 activities of the South African economy, 104 commodities, 14 household income categories and various components of the government, the external accounts and saving and investment. When SAMs are sufficiently detailed, they capture the economic linkages between different sectors and industries within an economy. These linkages can be either upstream or downstream. For example, the transport industry requires vehicles, fuel and tyres as inputs to the services provided. These inputs in turn require steel, chemicals and rubber respectively. The production of these commodities would require their own inputs and so on and so forth. If the transport industry were to experience growth in demand, the upstream industries would too experience an increase in demand and would have to increase its supply to take advantage of the improved economic/trading environment. In a similar way, an industry downstream may benefit from an increase in supply from one of the upstream industries either through costs being lowered or it being able to expand output more seamlessly. Crucially, the linkages contained in a SAM allow for the calculation of economic multipliers associated with spending in the different industries. The term multiplier stems from the well-known economic effect of an amount of spending, for argument’s sake R10, having a greater than R10 impact on economic activity. The size of an industry’s multiplier depends on the proportion of the inputs sourced domestically versus the rest of the world, the amount of tax paid in the production process and the marginal propensity to consume of the households receiving income from their factors of production. These multipliers (and the amounts spent in a given project) result in the total economic impacts generally measured in terms of GDP, employment, government revenue, imports and exports. In modelling the contribution of an industry to the economy, it would be ideal to “shock” the actual activity in the SAM model. This would imply that a separate line item representing the film sector and its industry linkages to all other sectors in the economy would be available in the SAM. Unfortunately economy wide SAM’s are unlikely to report all sub-sectors in such great detail unless modified for that particular purpose. A way around this issue is to understand the various linkages associated with an industry or firm by gathering annual expenditure data and “mapping” these cost categories to the various sectors which are reported in the SAM model. For example, the impact of expenditure on video cameras or sound equipment by the firms in the film SAFI can be replicated by shocking demand for the products produced by the television and equipment sector. Inputting these and other expenditure breakdowns into the SAM model allows us to estimate the overall GDP impact on the economy.
7.3. SAM Methodology

19
© Copyright NFVF 2013
In order to conduct a study of this nature, information detailing the market size and costs associated with each stage of film production is necessary. This information allows one to estimate the effects on the economy as a result of spending by industries associated with the SAFI. 7.3.1. Market Size of the SAFI
Obtaining an accurate measure of the total SAFI’s size and its direct investment is challenging given that not all entities are open to providing detailed financial information, especially on profits, incentives or salaries. Deloitte was, however, able to gather sufficient data from the DTI, the NFVF and SAFI stakeholders that responded to our online survey and that met with us. According to information collated from the DTI Film Incentive, Deloitte estimates that the SAFI spent over R1.26 billion on goods and services within the South African economy in 2012. It is estimated that 30% of this value comprises expenses on wages and salaries, with the remaining budget being spent on the costs incurred to produce a long form film. This is in line with research conducted by the Joint Long Form Production Task Team report in August 2012 titled “Report to the Department of Trade and Industry on the success of the Foreign Film & Television Production Incentive and the South African Film &Television Production and Co-production Incentive”.
The size of the SAFI is based on revenues and expenditures directly related to activities within the SAFI across the four stages of the value chain, i.e. pre-production, production, post-production and distribution. Table 6 records the estimated direct investment for each of the four stages.

20
© Copyright NFVF 2013
Table 6: SAFI Value Chain and Size
Value Chain Stage Estimated Size – Incl. Tax % of total
Pre-production R 32 490 088 3%
Production R 1 111 459 780 89%
Post-production R 48 420 962 3%
Distribution R 63 190 000 5%
Total Market Size R 1 255 560 830 100% The Production stage of the SAFI’s value chain has the highest expenditure, accounting for roughly 89% of the entire industry. Various goods and services are purchased at each stage of a production’s lifetime, with each having an effect on the economy. This study only took into consideration purchases of South African products. Purchases made of imported goods or services were not included, as they do not have any lasting impact on the economy and are thus considered leakages
7.3.2. Evaluating the Cost Breakdowns for the SAFI’s Value Chain
In order to develop a comprehensive expenditure breakdown for the SAM model, data is required for every stage of the value chain as shown in Table 1.
This section details the cost breakdown per stage of a South African film and the various data sources incorporated.
Pre-production Costs
Total pre-production costs were estimated from the DTI database compiled, and include screenplay and development costs. The total costs incurred for pre-production in 2012 were estimated at R32.5 million. Table 7 provides a breakdown of pre-production costs which were utilised during the SAM modelling process: Table 7: Pre-Production Cost Breakdown SIC Code % of total
costs

21
© Copyright NFVF 2013
SIC Code % of total costs
Recreation, cultural, sport activities1 100% Total 100%
7.3.2.2. Production Costs
Total production costs were estimated using the DTI database compiled, and include costs for producers, direction, cast & casting, bit players, extras, production staff, associate directors and continuity, camera crew, camera equipment, grip equipment, lighting equipment, sound crew and equipment, etc. The total costs incurred for production in 2012 were estimated at R1 057 billion2. An additional R2.5 million was added based on information gathered through interviews regarding production costs within the informal SAFI. Table 8 provides a breakdown for these costs as per the impact on various commodities (as represented by the relevant Standard Industrial Classification (“SIC”) codes): Table 8: Production Cost Breakdown SIC Code % of total
costs Recreation, cultural, sport activities 34% Air transport 12% Building of complete constructions 9% Paints, varnishes, printing ink, mastics 9% Accommodation 8% Real estate activities 8% Financial, insurance, pension funding 4% Legal, accounting, bookkeeping, audited activities 4% Television, radio transmitters, apparatus 4% Wearing apparel 4% Electric lamps, lighting equipment 2% Jewellery and related articles 2% Central Government 1% Television, radio receivers, recording 1% Total 100%
1Sectors that did not have their own activities defined within the SAM were grouped into the activity that best represented the activities that were mentioned in the survey as costs incurred by the SAFI. The recreation, cultural and sports activity (SIC Code 93) was the most appropriate SIC code to shock due to its inclusion of film and television sector. These include amongst others costs associated with storyboarding, audio-visual and related services, sound recording services, live recording services, motion picture, videotape, television, and radio programme production services, visual effects services, sound editing and design services to name but a few. 2 Contingencies and direct taxes were removed from our sample as these represent a financial flow and not an actual expenditure and therefore have no effect on the economy until actually spent.

22
© Copyright NFVF 2013
7.3.2.3. Post-production Costs
Post-production costs were also estimated from the DTI database compiled. This includes costs incurred for editing, sound editing, post-production (digital, labs and sound), music and publicity. The estimated costs for post-production in the SAFI for 2012 were R48.4 million. The majority of expenses incurred for post-production were spent on the digital and musical post-production editing which is represented by the recreation, cultural and sport activities3. The remaining expense was publicity which contributed a small percentage of the overall post-production costs and was represented by advertising. Table 9 represents the corresponding activity breakdown which was used for modelling purposes:
3 See footnote 2

23
© Copyright NFVF 2013
Table 9: Post production Cost Breakdown SIC Code % of total
costs Recreation, cultural, sport activities 99% Advertising 1% Total 100%
7.3.2.4. Distribution Costs
Finally, distribution costs were estimated from the information provided by the NFVF4. These included costs for the distribution of films by the major South African distributors, namely Indigenous Film Distributions (“IFD”), Nu-Metro and Ster-Kinekor. Not all the South African distributors responded and as such the data was extrapolated for the entire value chain. The total distributor commissions for 2012 came to R63.2 million – this is what the distributors would lose if South Africa stopped producing feature films. Table 10 represents the breakdown of distributor costs as provided by the results from the Deloitte survey. Table 10: Distribution Cost Breakdown
SIC Code % of total
costs Recreation, cultural, sport activities 64% Advertising 18% Reproduction of recorded media 9% Other publishing 3% Restaurants 2% Tax 2% Financial, insurance, pension funding 1% Office, accounting, computing machinery 1% Other <1% Total 100%
7.4. SAM Results 7.4.1. Direct GDP Impacts 4 From the Box Office statistics released by the NFVF (2012)
24
© Copyright NFVF 2013
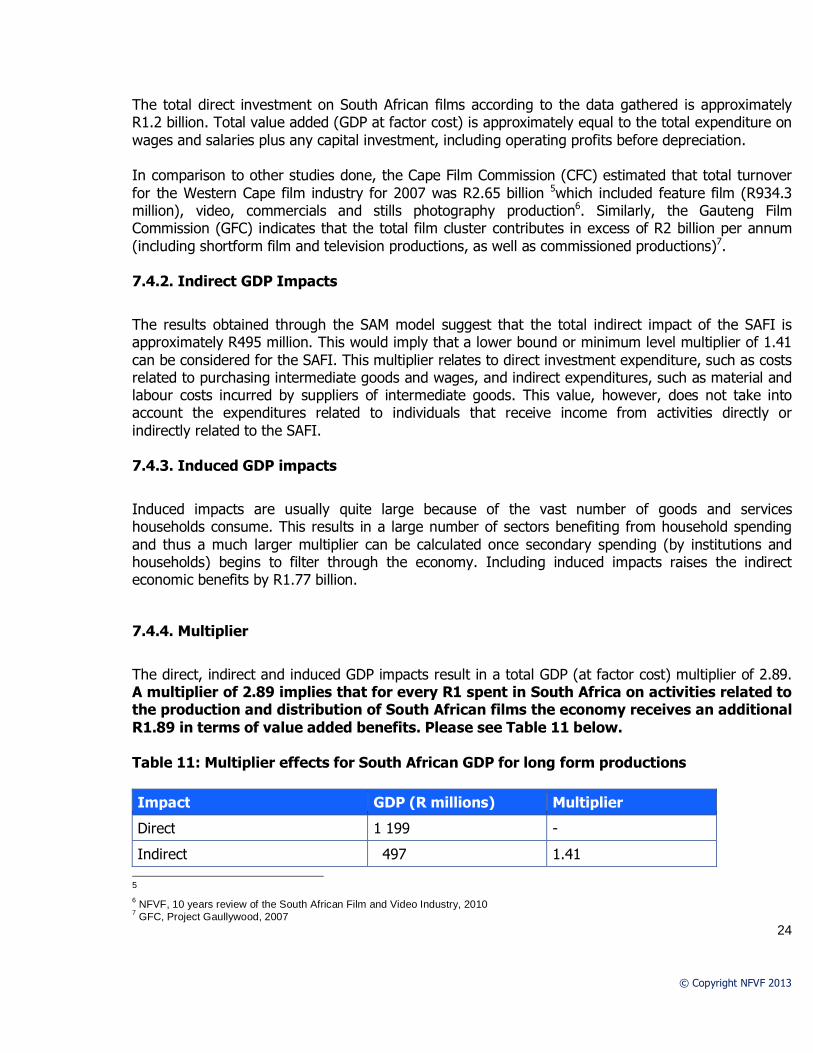
The total direct investment on South African films according to the data gathered is approximately R1.2 billion. Total value added (GDP at factor cost) is approximately equal to the total expenditure on wages and salaries plus any capital investment, including operating profits before depreciation.
In comparison to other studies done, the Cape Film Commission (CFC) estimated that total turnover for the Western Cape film industry for 2007 was R2.65 billion 5which included feature film (R934.3 million), video, commercials and stills photography production6. Similarly, the Gauteng Film Commission (GFC) indicates that the total film cluster contributes in excess of R2 billion per annum (including shortform film and television productions, as well as commissioned productions)7. 7.4.2. Indirect GDP Impacts
The results obtained through the SAM model suggest that the total indirect impact of the SAFI is approximately R495 million. This would imply that a lower bound or minimum level multiplier of 1.41 can be considered for the SAFI. This multiplier relates to direct investment expenditure, such as costs related to purchasing intermediate goods and wages, and indirect expenditures, such as material and labour costs incurred by suppliers of intermediate goods. This value, however, does not take into account the expenditures related to individuals that receive income from activities directly or indirectly related to the SAFI. 7.4.3. Induced GDP impacts
Induced impacts are usually quite large because of the vast number of goods and services households consume. This results in a large number of sectors benefiting from household spending and thus a much larger multiplier can be calculated once secondary spending (by institutions and households) begins to filter through the economy. Including induced impacts raises the indirect economic benefits by R1.77 billion.
7.4.4. Multiplier
The direct, indirect and induced GDP impacts result in a total GDP (at factor cost) multiplier of 2.89. A multiplier of 2.89 implies that for every R1 spent in South Africa on activities related to the production and distribution of South African films the economy receives an additional R1.89 in terms of value added benefits. Please see Table 11 below. Table 11: Multiplier effects for South African GDP for long form productions
Impact GDP (R millions) Multiplier
Direct 1 199 -
Indirect 497 1.41 5 6 NFVF, 10 years review of the South African Film and Video Industry, 2010 7 GFC, Project Gaullywood, 2007
25
© Copyright NFVF 2013
Impact GDP (R millions) Multiplier
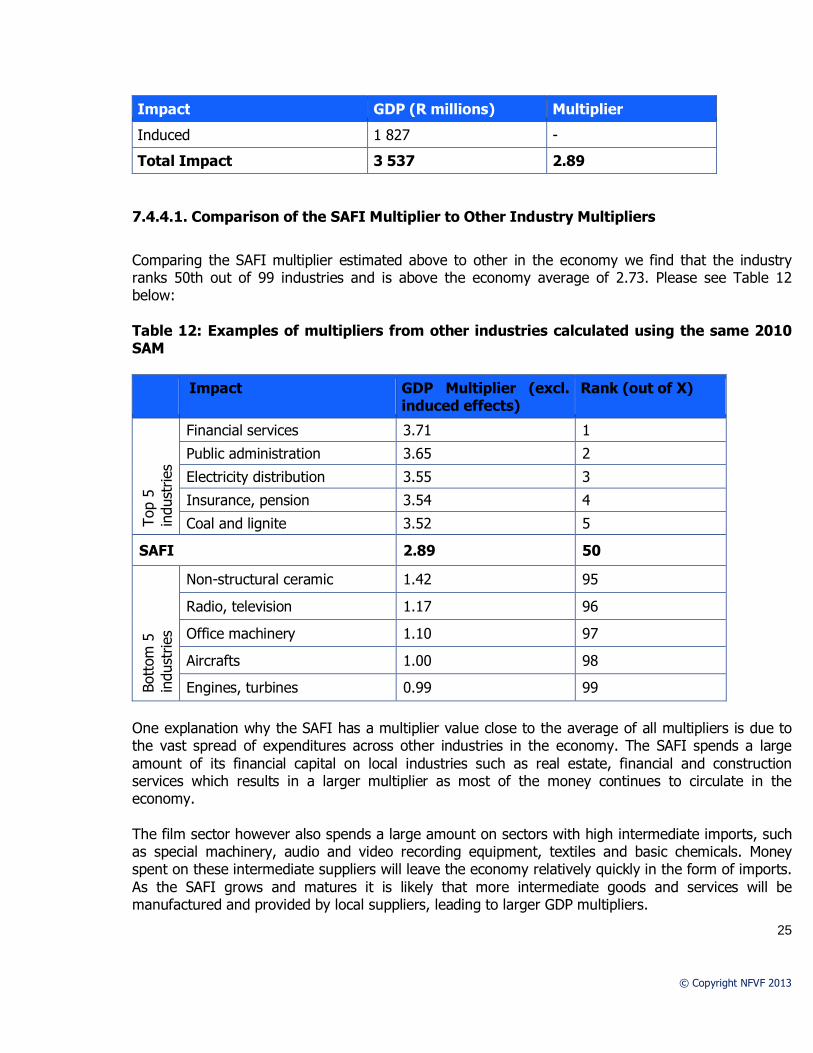
Induced 1 827 -
Total Impact 3 537 2.89
7.4.4.1. Comparison of the SAFI Multiplier to Other Industry Multipliers
Comparing the SAFI multiplier estimated above to other in the economy we find that the industry ranks 50th out of 99 industries and is above the economy average of 2.73. Please see Table 12 below: Table 12: Examples of multipliers from other industries calculated using the same 2010 SAM
Impact GDP Multiplier (excl.
induced effects) Rank (out of X)
Top
5 in
dust
ries
Financial services 3.71 1
Public administration 3.65 2
Electricity distribution 3.55 3
Insurance, pension 3.54 4
Coal and lignite 3.52 5
SAFI 2.89 50
Bott
om 5
in
dust
ries
Non-structural ceramic 1.42 95
Radio, television 1.17 96
Office machinery 1.10 97
Aircrafts 1.00 98
Engines, turbines 0.99 99
One explanation why the SAFI has a multiplier value close to the average of all multipliers is due to the vast spread of expenditures across other industries in the economy. The SAFI spends a large amount of its financial capital on local industries such as real estate, financial and construction services which results in a larger multiplier as most of the money continues to circulate in the economy. The film sector however also spends a large amount on sectors with high intermediate imports, such as special machinery, audio and video recording equipment, textiles and basic chemicals. Money spent on these intermediate suppliers will leave the economy relatively quickly in the form of imports. As the SAFI grows and matures it is likely that more intermediate goods and services will be manufactured and provided by local suppliers, leading to larger GDP multipliers.

26
© Copyright NFVF 2013
The multiplier metric though does not reveal all the economic benefits of the SAFI to economy, such as employment impacts, thus more factors should be investigated in order to adequately estimate the sector’s relative economic contribution.
7.4.5. Employment
7.4.5.1. Direct Employment Estimates
In addition to GDP contributions, employment impacts must also be considered when evaluating the importance of an industry to the economy.
Estimating the number of employment opportunities that were generated by the activities and investments in the SAFI throughout 2012 is challenging because of the employment dynamics that are characteristic of the SAFI, especially those related to temporary staff and crew.
To estimate the employment contributions of the film sector, Deloitte made use of the online survey results, the collated DTI database and the underlying SAM data. Employment data is initially represented in different forms or metrics for each source. In order to compare findings between these various sources of information the data has to be converted into a uniform metric. The following section illustrates the initial data from each of the three sources of information and the method that was used to calculate a comparable ratio of full time equivalent (“FTE”) jobs per one million rand of investment.
The Deloitte surveys included questions regarding the number of permanent and temporary individuals that were employed throughout the 2012 year as well as the skill levels of these individuals. Table 13 summarises the survey results and illustrates the process that was utilised to derive the final FTE employment metric. Table 13: Employment Data Received from the Deloitte surveys
Deloitte Survey Results Permanent Temporary
Distribution of labour 4.36% 95.64%
Total number employed 263 5 769
Skill level:
Highly Skilled 120 1 807
Skilled 90 1 806
Un-skilled 53 2 156

27
© Copyright NFVF 2013
Full time equivalent conversion:
Average months employed 12 4
Full Time Equivalent (FTE) 263 1 923
Total value of productions = R 175 million
Employment created per R1 million spent:
FTE jobs 1.5 10.9 To convert temporary jobs into a FTE value the total number of temporary jobs reported were annualised based on the average period that firms reported hiring temporary staff for, i.e. 4 months per production. This method results in the 5 769 temporary jobs representing, or being equivalent to, 1 923 FTE jobs. Using the cost of production (QSAPE) values reported in the survey a permanent job creation value of 1.5 jobs per R1 million and a temporary jobs value 10.9 jobs per R1 million were calculated.
The second source of data that includes employment statistics is the DTI database – please see Table 9 below which summarises this data and illustrates the process that was utilised to derive the final FTE employment metric.

28
© Copyright NFVF 2013
Table 14: Employment Data Received From the DTI
DTI Data Results White Non-white Disabled
Jobs 13 537 26 424 9
Applying the ratio calculated using the Deloitte survey (FTE jobs):
Permanent 590 1 152 0
Temporary 4 316 8 424 3
Total value of productions = R1 192 million
Employment created per R1 million spent:
FTE jobs 4.1 8.0 0.0 Once the data is converted into the appropriate metric the results indicate that the number of jobs created per R1 million investment may be higher than that of the Deloitte survey estimates. The DTI data does not separate employment by skill level, as in the Deloitte survey, but rather by ethnicity. The estimates suggest that for every R1 million rand of expenditure on a production 4.1 FTE jobs are created for whites and 8 FTE jobs for non-whites. For disabled people the number was insignificant. The third source of information that can be used to gather insights regarding employment dynamics of the SAFI is the underlying data within the SAM model. Table 15 reports the data within the SAM corresponding to the recreation, cultural and sport industry. The SAFI falls within this category as do a number of other industries. Table 15: Underlying SAM Employment Data
SAM model results Highly Skilled Skilled Un-skilled
Employment numbers in the “Recreation, cultural & sport activities” sector:
Permanent Jobs 37 639 40 364 16 834
Total sector size (GDP at factor cost) = R 4 733 million
Employment created per R1 million spent:
FTE jobs 7.95 8.53 3.56 The values regarding the total number of jobs created per Rand of investment are larger than both the previous estimates from the Deloitte surveys or the DTI film database. There is however some similarity between the SAM data and the Deloitte survey feedback. In both estimates it seems that the SAFI is a relatively large employer of skilled labour compared to un-skilled labour. The values reported in the tables above only represent the employment numbers associated with direct investment within the industry. Comparing the final results we find that the Deloitte survey

29
© Copyright NFVF 2013
indicates that approximately 12.4 jobs are created per R1 million rand expenditure which gives a total of 15 428 direct FTE employment opportunities. Similarly, the DTI data suggests that a total of 15 210 direct FTE jobs were created, with two thirds accruing to non-white individuals. The underlying SAM data suggests a total of 24 308 direct jobs, though this figure represents other industries in addition to the SAFI and thus is probably overestimated. As the DTI information is audited, it is fair to assume that this lower total of 15 210 FTE jobs for 2012 is the more accurate number.
Through an interview with a prominent low-budget film producer it was estimated that an additional 318 FTE jobs were created during 2012 by this single producer. This brings the total average number of direct jobs per year to 15 528.
7.4.5.2. Indirect Employment Estimates
In a similar way to GDP contributions the SAM model also allows us to estimate the indirect jobs created due to indirect and induced GDP impacts. These estimates are based on the underlying employment and output data in the SAM model. A baseline ratio of jobs per R1 of output is calculated and applied to the outcomes from the impact analysis. The SAM results align closely to the Deloitte survey analysis with an estimated 5 284 direct jobs created in 2012. These jobs are more likely to represent the permanent jobs portion of 15 210 jobs estimated using the DTI information as the SAM model will not likely estimate temporary jobs. Thus the DTI information still remains the most accurate measure of direct employment creation. The benefit of using the SAM model is that we can estimate the indirect and induced impact on labour. The number of jobs created due to the SAFI’s linkages to other industries (indirect) and due to the spending by affected households (induced) comes to a total of 9 965 (Table 16). Table 16: Indirect Employment Created
Job impacts Highly-skilled Skilled Semi & un-skilled Total
Direct 9 75 2 394 1 916 5 284
Indirect & Induced 1 838 4 514 3 513 9 965
Total 2 813 6 908 5 528 15 249
To avoid double counting and the issue of temporary jobs we can add the estimated direct employment number of 15 210 FTE’s (based on the DTI information) and the indirect employment impacts of 9 965 (based on the SAM model) to arrive at a total employment impact value. Using the DTI information and the SAM model results we can conclude that the South African long-form SAFI generates an estimated 25 175 (15 210 + 9 965 = 25 175) FTE jobs per year.

30
© Copyright NFVF 2013
7.4.6. Taxes
In order to determine direct taxes paid by producers, feedback from the Deloitte survey and estimates derived from an independent study8 were utilised. Indirect taxes were calculated based on the underlying SAM data and the indirect and induced GDP impacts.
7.4.6.1. Direct Taxes
In order to determine direct tax paid by a producer, the Deloitte survey provided data on the total tax paid by those surveyed. These taxes were calculated as a percentage of the production cost reported which was estimated at 19%. Utilising this ratio and applying it to the total 2012 expenditure estimate ofR1 199 billion it was assumed that direct taxes contribute 19% of a producers costs and as such direct taxes were estimated to be R213 million. In order to verify the above direct tax costs, this estimate was cross checked to an independently published report by the IPO, DFA and SASFED. In the report a breakdown of tax expenditures by film producers is provided (please see below) from which various tax-to-QSAPE ratios can be calculated. These ratios are represented by % of total QSAPE in Table 17. Tax expenditures by film producers in 2012 can thus be estimated using these same ratios.
Table 17: Total Expenditures by Film Producers (2012)
Description 2008-2011 R’Mill
% of total QSAPE
2012 R’Mill
Total QSAPE R 4 987 R 1 192 PAYE R 316 6.3% R 76 VAT R 76 1.5% R 18 Company tax R 227 4.6% R 54 PAYE on Procurement Labour R 341 6.8% R 82 Total Direct Tax R 961 19.3% R 230
Comparing the two results, we find that that the Deloitte survey was lower than the estimates from the independent report, which is likely due to survey bias. However, the results do not differ drastically from the independent report and are considered robust.
Overall, direct taxes based on QSAPE values for 2012 could be approximated at R230 million, where the majority of these taxes are PAYE related (R158 million). Including the direct taxes paid by distributors, which is roughly R1 million based on the expenditure breakdowns as previously discussed, the total tax received by SARS from activities related to the SAFI is R231 million. 8 Independent Producers Organization (IPO), Documentary Filmmakers association (DFA) and the South African Screen Federation (SASFED), 2012

31
© Copyright NFVF 2013
7.4.6.2. Indirect Taxes
In a similar method to the GDP contribution and employment calculations above, tax revenues based on indirect activities and induced dynamics related to the SAFI can be estimated. The results obtained from the SAM model are reported in Table 18 below. Table 18: Indirect Tax Results
Description Indirect R’Mill
Induced R’Mill
Total R’Mill
Taxes on production R 28 R 41 R 70 Subsidies on production -R 7 -R 8 -R 15 Taxes on products - Vat R 79 R 177 R 256 Taxes on products - Customs R 15 R 20 R 35 Taxes on products - Excise R 6 R 29 R 34 Taxes on products - Fuel levy R 25 R 28 R 53 Taxes on products - Other R 12 R 14 R 26 Subsidies on goods and services -R 8 -R 11 -R 18 Net taxes received from direct and induced impacts R 150 R 290 R 439
The indirect and induced interactions that take place throughout the production of longform films will generate tax revenues for the government. The largest increase in tax revenue is related to VAT, mostly because of the spending by households on goods and services which are not excluded from VAT charges. The government also provides subsidies on a number of commodities and the production activities of these commodities. Taking into account these subsidies and the direct tax calculated above the government (SARS) received an estimated total (direct, indirect and induced) of R 670 million in tax revenue generated by the SAFI in 2012. 7.4.7. Unquantifiable or out-of-scope Impacts The relationship between the SAFI and the economy does not end at the benefits that a single film provides to the economy. The SAFI has a very strong relationship to that of the creative services sector in South Africa, with most of South Africa’s core SAFI also dependent on revenue generated from other forms of creative outlet. This multi-dimensional relationship means that the fixed costs of infrastructure and studios are shared, enabling economies of scale to be better utilised within the wider creative services industry.

32
© Copyright NFVF 2013
Films which encourage viewers to visit the country or site where films were shot, which is often labelled “film-induced tourism” or “movie-induced tourism” is widely discussed in literature and can become the catalyst for investment tourism and can bolster additional movies setting their location within that area. South Africa has a well established reputation for having a good climate, stunning locations and a generous rebate structure. This has led to a strategy of encouraging films and producers to locate themselves in South Africa. On a separate note, the extensive technology and research and development needed for the post production phase of a production can also lead to positive spin-offs for the economy with a wide range of alternative uses. For example, post-production technologies and animation can enable TV and gaming industries to benefit from the subsequent investment that is made in a film. Movies such as Avatar, in the UK, is a good example as the company used for the post-production process, built the technology for the 3-D production of this movie was allowed to use its technology for the development of the BBC series Walking with Dinosaurs which greatly enhanced the UK’s reputation for producing high quality 3-D animation. South Africa has the potential to do the same.
8.Value Chain Analysis
The following SAFI value chain analysis has been compiled from our research , interviews, survey results, DTI information results and our industry experience .
8.1. General Value Chain Trends
The online survey and DTI data identified the Production stage of the value chain as the section of the value chain where the majority of costs are incurred. Please see Figure 4. Figure 4: Value Chain Breakdown – Comparison of Online Survey, DTI Data and
Research Figures

33
© Copyright NFVF 2013
As per Table 19, the DTI information revealed that local films make up nearly 60% of all QSAPE: Table 19: Breakdown of QSAPE (DTI Data)
Description Local Local International International
Total
Budget / project (ZAR) >10 million <10 million >10 million <10 million
Number of projects 16 20 7 1 44
Total QSAPE (ZAR) 608 445 715 100 913 372 481 000 719 2 021 024 1 192 370 830
% of Total QSAPE 51% 8.5% 40.3% 0.2% 100%
8.2. Pre-production Stage
Pre-production costs are the second lowest in the SAFI value chain (Table 20). Table 20: Pre-production Stage Value and % of Total QSAPE (Rands) (DTI Data)
Value Chain Stage Online Survey DTI Information QSAPE R18 429 441 R32 490 088 % of total QSAPE 11% 3%
Key trends and issues identified in this stage include:

34
© Copyright NFVF 2013
8.2.1. Development Cost Funding
There appears to be a lack of development funding for concept development, including screenplays within the industry. Funding generally comes from the National Film and Video Foundation and some international film funds / organisations.
This may hamper the development of quality films as a screenplay is the framework for a film – it allows it allows for accurate budgeting, attraction of good cast and crew, and ultimately dictates the quality of the film.
Good quality films, aimed at the right audience and in the most optimal genre will assist in a commercially viable SAFI in the long term.
8.2.2. Production Cost Funding
Production cost funding is raised during the development / pre-production stage and is thus addressed here. There appears to be a shortage of funding for film production costs. Please see Table 21 for the current sources of production cost funding.

35
© Copyright NFVF 2013
Table 21: Sources of Production Cost Funding for Films Source Amount Type of
Funding Restrictions
NFVF <R2 million Equity, debt • Focused on local film • Small amounts of
funding IDC Up to 49% of
production budget Minimum investment of R1 million
Equity, debt • 50% of production budget funding must be in place before application
DTI Film Incentive
Between 20% and 35% of QSAPE
Retrospective / milestone payment rebate
• Numerous qualifying criteria
• Must have 25% of production budget funding in place before application
Exhibitors
<R1 million Advances • Require film distribution rights / all rights in return
• Often require all rights to be ceded
• Needs to be recouped out of revenue earned
GFC <R1 million Grants • Film must be shot in Gauteng
Small private funds
Up to value of DTI film incentive
Debt • Only bridging finance for DTI film incentive. Rarely invest debt or equity
• Expensive Co-productions Depends on
participating country – maximum of 40% of production budget
Tax credits, film incentives
• Increases the cost of production.
• High legal costs. • Often complicated
and subject to delays.
Foreign film funds >US$10 million Equity, debt • Minimum investment is $10 million
• Often will not look at South African films

36
© Copyright NFVF 2013
Broadcasters Varies Equity, debt, advances on licensing deals
• Require cession of TV rights
High net worth individuals / venture capitalists
Varies Equity, debt • Expensive finance, underdeveloped market
• Negative sentiment towards film industry – difficult to secure
Product placement
Varies Cash and products
• Only received once the production is shot
Sponsorship Varies Cash • Limited as this is an underdeveloped market
In summary, what this means is that a film producer can only source the following upfront funding, (without compromising their ability to earn long-term income from the film): • Small NFVF debt / equity investments; • Small GFC grants; • Small venture capital investments; and • Advances from television broadcasters or exhibitors. Once 25% of the funding is secured, a provisional application to the DTI for the film incentive can be made. Once 50% of the funding is secured, the film producer can make an application to the IDC. There is very little upfront funding available for feature films in South Africa. Often, a film producer cannot even get to the 25% mark to allow them to apply for the DTI Film Incentive, with the result that many projects are not progressing into production
To understand the dynamics driving the lack of funding, one needs to examine the history of film funding in South Africa.
8.2.2.1.Reasons for the Lack of Funding
The reasons for the lack of funding are:
• Past abuses of the Section 24F Film Allowance; and • Poor investor track record. Past abuses of the Section 24F Film Allowance

37
© Copyright NFVF 2013
In the 1980’s, many individuals and entities invested in film with the sole objective of using the Section 24F Film Allowance as a tax deduction. Many of these films were not commercially viable and were never released. The South African Revenue Services (“SARS”) realised that the allowance was being abused, and clamped down, resulting in many investors losing large sums of money. Poor Investor Track Record Many investors have lost significant amounts of capital from investing in films with no real commercial prospect. The result was poor investor returns and an unwillingness to reinvest in any future film projects.
Some of the reasons for poor commercial returns were:
• Poorly developed projects and screenplays (please see commentary under 9.3.1.); • Projects catering for a genre and audience that was so narrow that it would never allow
recoupment of costs; • Overinflated production budgets; • Lack of local distribution market; and • Poor international distribution.
More detailed commentary on distribution is given in paragraph 9.5.
8.3. Production Stage Production costs are the highest cost category in the SAFI value chain: Value Chain Stage Online Survey DTI Information QSAPE R128 094 091 R1 111 459 780 % of total QSAPE 73% 93%
Trends and issues identified in this stage include: 8.3.1. Provincial Preference Gauteng and the Western Cape still dominate as the provinces of preference for the film industry, with KwaZulu-Natal starting to show growth. Please see Figure 5.

38
© Copyright NFVF 2013
Figure 5: Breakdown of Number of Projects by Province
8.3.2. Low Budget Films
Low budget films targeting the broader demographic are on the increase. Broadcasters and producers have seen a market that is currently underserviced in terms of relevant content and are now producing bespoke content on small budgets that are being well received. Some examples of success stores in this area are: • MNet’s Bubblegum Films; • Etv’s Ekasi Films; • Ekasi Movie Nights; and • Chicco Twala’s self-produced films. From interviews held, the legitimate (i.e. not pirated) market for these low budget films is estimated at a maximum of R200 million (including distribution). Many of these productions are funded by broadcasters in return for TV rights, with the producers earning income from the DVD rights.
Job creation is estimated at a minimum of 500 FTE jobs per annum (including distribution).

39
© Copyright NFVF 2013
This is a sector that is set to grow provided it continues to get funding and the sector can survive the impacts of piracy.
8.3.3. Transformation
The DTI information used in this study shows the following: • 26 424 black individuals were employed in the SAFI in the period under review; and • 13 537 white individuals were employed. The online survey revealed the following:
• 210 out of 263 permanent staff were semi-skilled or above; • 3 613 out of 5 769 temporary staff were semi-skilled or above; • Thus, 3 823 individuals were semi-skilled or above out of 6 032 individuals, i.e. 63% of all
individuals.
Applying the ratio of skilled or semi-skilled labour calculated above to the employment figures gathered from the DTI exercise shows that 25 175 people employed in the South African Industry were semi-skilled or above (63% of 39 961). Thus, at the very least, the number of semi-skilled or above black individuals is estimated at:
Total individuals semi-skilled or above 25 175 Less: White individuals (in total) 13 537 Equals: Total black individuals (semi-skilled or above) 11 639

40
© Copyright NFVF 2013
8.3.4. Training and development
Historically, training and development of new film graduates relied heavily on the individual securing a junior position on set and learning on-the-job. More often than not, the person started as a “runner” and worked their way up through the ranks. To a large degree, this is still the case.
There are, however, some exciting initiatives taking place where individuals are teaching themselves or are being afforded the opportunity to train as interns in more defined roles (e.g. camera assistant) from the beginning of their training period: • MNet’s Bubblegum Films; and • Chico Twala’s films and documentaries.
8.3.5. Production Incentives
From examining the number of films made in South Africa in Figure 6, it appears that the introduction of the DTI’s Film Incentive in 2004 has been a catalyst for film production in South Africa. Figure 6: Number of South African Films Produced per Annum
The DTI Film unit is considered a point of pride for the film industry – it is well run, reliable and effective.
However, a study done by Borden Ladner Gervais in 2010 on International Film Incentives showed that South Africa was the one of the least competitive film incentives for foreign films. The results of

41
© Copyright NFVF 2013
this study are shown in Figure 7. A loss of foreign film work to South Africa to other more competitive countries could result. Figure 7: Comparison of International Film Incentives (2010).
The DTI data showed that 40% of QSAPE earned in the period of review comes from foreign versus local films (see Table 19), which means that foreign productions constitute a significant part of the SAFI. From discussions with SAFI stakeholders who service foreign films, it would appear that the lack of competition could result in the loss of foreign work to other countries. There would appear to be a case for investigating a possible increase in the foreign DTI Film Incentive.
8.4. Post-production
In comparison to production costs, post-production costs form a small portion of the SAFI value chain: Value Chain Stage Online Survey DTI Information QSAPE (ZAR) 23 910 676 48 420 962 % of total QSAPE 14% 4%
Trends and issues identified in the post-production stage include:
8.4.1. Technology

42
© Copyright NFVF 2013
Technological advances and price decreases have effectively dropped the barriers of entry to small film producers wanting good quality post-production on lower budget films.
With the ongoing switch-over of cinemas to digital projectors, the significant cost of releasing films in cinemas will reduce as transfer to films and prints will no longer be a necessity for films desiring a wide release on local screens.
8.4.2. Post-production Incentive
The DTI introduced a post-production incentive in June 2012 for foreign films that completed their post-production in South Africa. From discussions with the DTI, it appears that only three foreign films to date have applied for this incentive, and, that it would appear that this incentive’s benefits are not high enough to attract foreign films away from countries with more competitive film incentives.
8.5. Distribution
The online survey and DTI Information recorded minimal distribution costs. The only costs reported here were publicity costs incurred during the completion of the film projects. In order to get a more accurate idea of what these costs are, we approached distributors directly for information. The costs included here are based on an extrapolation of data received from one distributor, and, given its market share, we were able to estimate the total distribution costs for local films distributed in South African (foreign films are excluded from the scope of this study).
The distributor’s margins and prints and advertising costs are approximately R63.1 million for local films in South Africa. Key issues and trends in the distribution market are as follows:
8.5.1. Local Film Revenues
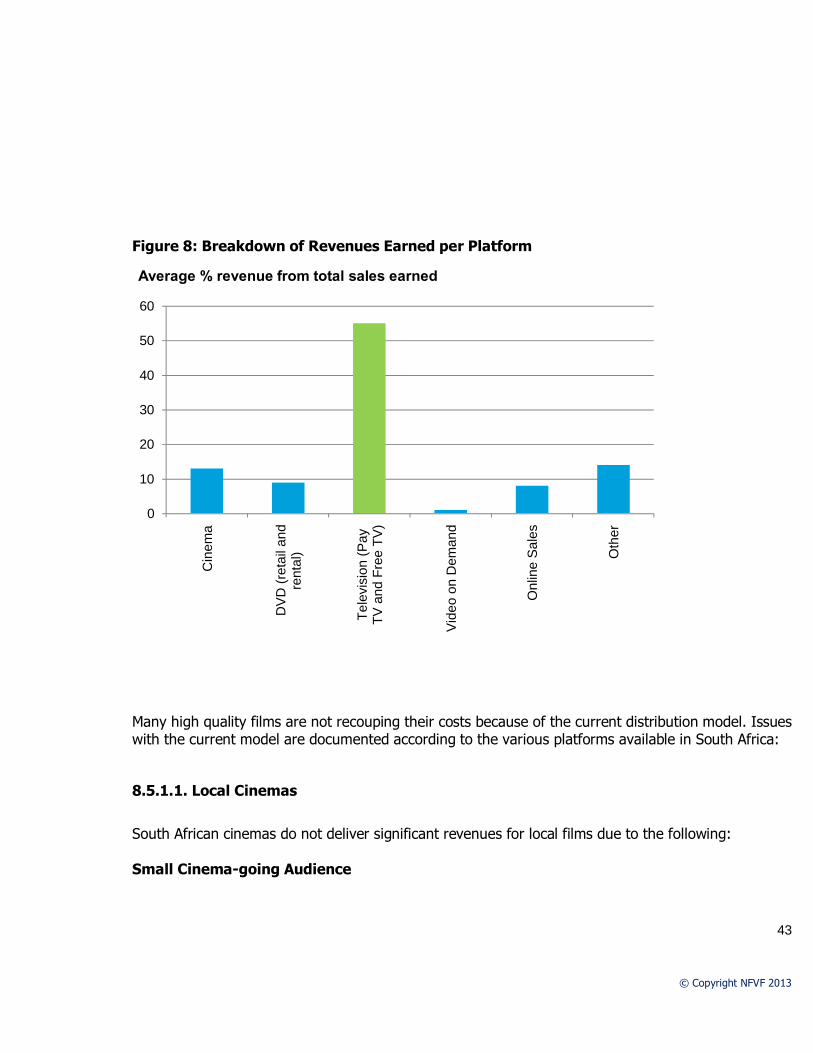
The online survey reports that TV sales are the biggest sources of revenue for films. Please see Figure 8.
43
© Copyright NFVF 2013
Figure 8: Breakdown of Revenues Earned per Platform
Many high quality films are not recouping their costs because of the current distribution model. Issues with the current model are documented according to the various platforms available in South Africa:
8.5.1.1. Local Cinemas
South African cinemas do not deliver significant revenues for local films due to the following: Small Cinema-going Audience
0
10
20
30
40
50
60
Cin
ema
DV
D (r
etai
l and
re
ntal
)
Tele
visi
on (P
ay
TV a
nd F
ree
TV)
Vid
eo o
n D
eman
d
Onl
ine
Sal
es
Oth
er
Average % revenue from total sales earned

44
© Copyright NFVF 2013
According to Indigenous Films, South Africa has a cinema-going audience of approximately 5.5 million individuals who attend the cinema 4.5 times per year on average. Revenue earned from this platform is limited by the small number of cinema attendees in South Africa.
From discussions with Indigenous Films, the NFVF and various SAFI stakeholders, it would appear that the reasons for the underdeveloped cinema audience are as follows:
• Lack of cinema-going culture amongst black population - during apartheid, cinemas were built in the white-only areas. This resulted in a lack of cinema culture developing in the black population. Given that black individuals make up 79% of the entire South African population of 51.8 million (2011 Census results), this has a significant impact on cinema revenues;
• Lack of access to cinemas: Cinemas are still predominantly in white areas. Low disposable income and high transport costs from townships to cinemas place these cinemas out of reach for the majority of the population;
• Price of cinema tickets: Ticket prices are considered high and unaffordable by the majority of the population with low disposable income;
• Lack of relevant content: All major exhibitors have agreements with international film studios. The current demographic that goes to cinemas is still more interested in Western content than local content, and this consequently makes up the bulk of box-office sales. From discussions with black film producers, audiences and broadcasters, black audiences do not generally find this content culturally relevant and thus prefer to watch TV and purchase DVD’s where content is colloquial.
High Exhibitor Costs
South African film producers feel that exhibitor costs are too high to allow for recoupment of production costs. According to discussions with exhibitors, cinemas tend to break-even on film ticket sales, and often make their margins in other areas of the business, e.g. refreshments sales.
Short Flighting Windows
Cinemas operate a system whereby films are booked in cinemas for a limited period of time and are only kept on the circuit if the films make minimum attendance numbers. The demographic that attends cinema is still largely an audience that watches Western content. Local films are competing against these films which are made with far higher budgets and A-List stars. There are thus very few films that can successful stay on circuit for any meaningful period of time to allow for decent box office revenues. Low Local Print and Advertising Costs
As the main box office revenue earners for local cinemas are foreign films, much of their resources are directed at optimising the awareness and subsequent attendances of such films. This can result in limited release cost funding, low marketing levels, low awareness of local films amongst audiences, and consequently low local box office sales.
There are, however, initiatives been driven by cinema owners, the NFVF, and entrepreneurs to address these issues including:

45
© Copyright NFVF 2013
• Cinemas with lower ticket prices e.g. Ster Kinekor Junctions where the price of a movie ticket has
been dropped to as low as R8 on certain days; • Mobile broadcasting units that take the cinema to townships, with admission fees at the R10 mark
e.g. Ekasi Movie Nights; • Informal cinemas that have been developed in community halls and other township buildings
where movies are broadcast for a small admission fee; and • Developing digital cinemas within townships (NFVF initiative).
8.5.2. Local DVD
DVD as a revenue stream and a means to recoup film costs is declining world-wide because of: • Replacement of DVD by online streaming, downloading and VOD; and • Piracy.
Online Streaming, Downloading and VOD
The erosion of the DVD market in South Africa by online purchasing and rentals has to a large extent been protected by the slow roll-out of broadband, the expense of broadband, lack of access to computers and computer illiteracy amongst the broader demographic. The erosion of the DVD revenue streams is still there, but not to the extent that it has occurred in areas with better developed online communities. Satellite based VOD has largely been the driver of local VOD sales (e.g. DSTV’s Box Office). This has to an eroded the DVD rental and purchases market amongst the audiences that have access to this platform.
Piracy
Piracy of films appear to be significant, whether distributed on DVD’s or USB sticks. It thrives because of the following issues:
• Instant gratification – long cinema and DVD release windows motivate consumers who do not
want to wait into purchasing pirated copies of films which are often the latest content and readily available;
• Price - the broader demographic has little disposable income and cannot afford the high costs of legitimate DVD’s or cinema tickets. Pirated DVD’s are sold for between R5 and R60, depending on the content. Pirated films are sold on USB sticks – with up to 6 films being sold on one stick for as little as R60;
• Convenience and accessibility – pirates sell where the people are. Pirates sell at bus-stations, taxi-stations, train stations, in townships and even go as far as knocking on resident’s doors.

46
© Copyright NFVF 2013
Pirates alleviate the transport cost of getting to retailers, and, often take advantage of impulse purchases; and
• Lacks of awareness – some people do not understand why pirated goods are unethical. There is no awareness that the profits are not reaching the films creators, thus allowing for long-term sustainability of the SAFI. There is also a lack of awareness concerning the links between piracy and other illegal activities.
Piracy will continue until:
• Legitimate DVD’s / films on USB sticks are sold at prices that compete with pirates, or, for free
using sponsorship / advertisement subsidised (adspend) models (similar to the TV content funding model);
• Legitimate DVD’s are sold in the same diverse locations as pirates; and • The broader demographic is made aware of the consequences of piracy using campaigns that are
engaging and relevant.
Respondents to the online survey estimated that their revenues were eroded by up to 44% by DVD piracy and 15% by online piracy. Please see Figure 9. Figure 9: Estimated Percentage of Revenue Lost to Piracy
As online connectivity and access grows in South Africa, online piracy will become more predominant.
Both DVD and online piracy are focal areas that need to be addressed to ensure the long-term commercial viability of the SAFI.
8.5.3. Local Pay TV and Free TV
South African pay-TV and free-TV broadcasters play a very important role in distribution as:

47
© Copyright NFVF 2013
• The online survey shows that license sales from broadcasters are often a South African film’s biggest revenue stream;
• If a broadcaster is prepared to provide advances on TV rights license deals, these funds can be used to close the funding on production costs thus allowing a film to go into production;
• Distributor commissions on these revenue streams are typically low – between 10% and 20%. Many film producers negotiate directly with broadcasters thereby avoiding any distribution commission costs and allowing them to maximise the revenue earned by the film; and
• Broadcasters have initiated the production of low budget films and training programmes which are assisting the development of skills and transformation within the SAFI.
The only issue with TV distribution is that often this funding is received after the cinema and DVD windows (i.e. in instances where no upfront advance is given), and this period can be as long as two years from a film’s release date.
8.6. International Distribution
Successful international distribution relies on a number of factors: • Relationships with reputable international sales agents and or distributors; and • Funds to cover deliverables, travel and marketing costs to attend film festivals and meet with
distributors / sales agents abroad. It is difficult for South African film producers to cultivate relationships without physically attending the festivals and meeting face-to-face with distributors.
There is funding available to cover some of the marketing and travel costs (Table 22): Table 22: Funding Sources for Marketing and Travel Costs Source Type of funding GFC • Distribution costs (e.g. prints) DTI – Export Marketing and Investment Assistance Scheme (EMIA)
• Marketing assistance and attendance at film festivals
NFVF • Test screenings • Film launches • Entry costs and freight costs for the submission of
films to local and international festivals and markets • Travel to local and international markets • Theatrical exhibition costs (print and advertising) • Video promotion costs (launches, video sleeves,
catalogues, posters) • International film and video marketing costs

48
© Copyright NFVF 2013
However, many producers felt that more funding and initiatives could make a big difference in this area. A permanent operation with the sole objective of marketing and selling South African film abroad could make a difference.

49
© Copyright NFVF 2013
9. Conclusion
The SAFI contributes R3.5 billion to South Africa’s GDP and over 25 000 jobs per annum. It is not a significant industry when compared to many of the primary, secondary or tertiary industries in South Africa. However, given that: • SAFI’s multiplier of 2.89 puts it at mid-range when compared to 99 other industries; and • In terms of government support, it more than pays for itself with a delivery back to the SARS of
more than R670 million (R420 million more than an estimated Film Incentive of R250 million paid out in 2012);
It appears that it is a worthwhile industry to invest in and grow. To ensure sustainable growth for the SAFI over the long-term, the focus on commercial viability is essential. Proposed key issues to focus on to address this are: • Development of high quality concepts and screenplays; • Increased training initiatives across the value chain; • Increasing the competitiveness of South Africa versus other countries when attracting foreign
films; • Supporting the growth and distribution of low budget films; • Supporting the distribution of local films into foreign territories; • Controlling the negative impacts of piracy; and • Supporting the development of local film audiences and associated distribution methods.
Given these key issues, some proposed initiatives include:
• Provision of development funding for high quality concept and screenplay development; • Support for training and transformation initiatives – ideally in the form of a well-controlled training
incentive; • Increasing the Film Incentive for foreign films; • Development of a separate Film Incentive for low budget films targeting the broader
demographic; • Development of a separate Film Incentive for low budget films such as documentaries (that do
not qualify for the minimum threshold under the current Film Incentive); • Introduction of more funding and support for the distribution of local films into foreign territories; • Investigating the extent of DVD and online piracy and the introduction of measures to combat it;
and • Introduction of funding for alternative distribution mechanisms into the broader demographic.

50
© Copyright NFVF 2013