south african pulp and paper industry · south african pulp and paper industry...
TRANSCRIPT
Page 1 of 6
SOUTH AFRICAN PULP AND PAPER INDUSTRY Summary findings on 2015 production, import and export statistics
JULY 2016
PAMSA collates data from industry players and Statistics SA to draw up an annual production report that tells the economic story and role that the pulp and paper industry fulfils in the South African economy.
Overview Packaging, tissue and chemical cellulose are growth sectors for South Africa. They are showing the work, energy and refocus of an industry that was under pressure but which is emerging with increased global competitiveness in its chosen grades.
The local industry continues to drive cost control, but a renewed focus for exports is also expected. Forestry is the sustaining force in the sector -‐ with much potential yet to be realised, especially in the case of smaller, emerging tree growers. This is recognised by government in that a carbon offset paper was published in June 2016 which included small afforestation in as an offset.
The end-‐consumer and the economy in general are struggling. Local demand, policy uncertainty, rising utility and tax costs and constrained energy supplies have all negatively impacted on the South African economy as well as strong global competition. While less recycled fibre was collected from lower production tonnages, recycling rates are higher, supporting the view that more is being done in recycling to keep paper production costs under control. In short, the industry would appear to be pushing hard to make the best of a very difficult situation.
Sector contribution to GDP 2015 2014 2013 • Forestry-‐paper contribution to total South African GDP 0.5% 0.5% 0.6% • Forestry-‐paper contribution to manufacturing GDP 4.2% 3.7% 3.8% • Forestry-‐paper contribution to agricultural GDP 23.3% 24.2% 26.1%
Employment According to Stats SA in 2015, the industry has shown a 10% rise in jobs., with pulp and paper adding more jobs than this, while recycling a little less. The recycling industry however has shown more promise as it has increased jobs and with the rising recycling rates, one can expect this rise to be sustained. It does appear that more independent mills (mostly tissue) are creating more jobs; similarly the larger mills are showing sustained growth in technical skilled staff (2% pa). For the first half of 2015, forestry related jobs (distinct from paper/pulp) came in with a 20% increase (source: StatsSA and PAMSA Education Research Report).
Page 2 of 6
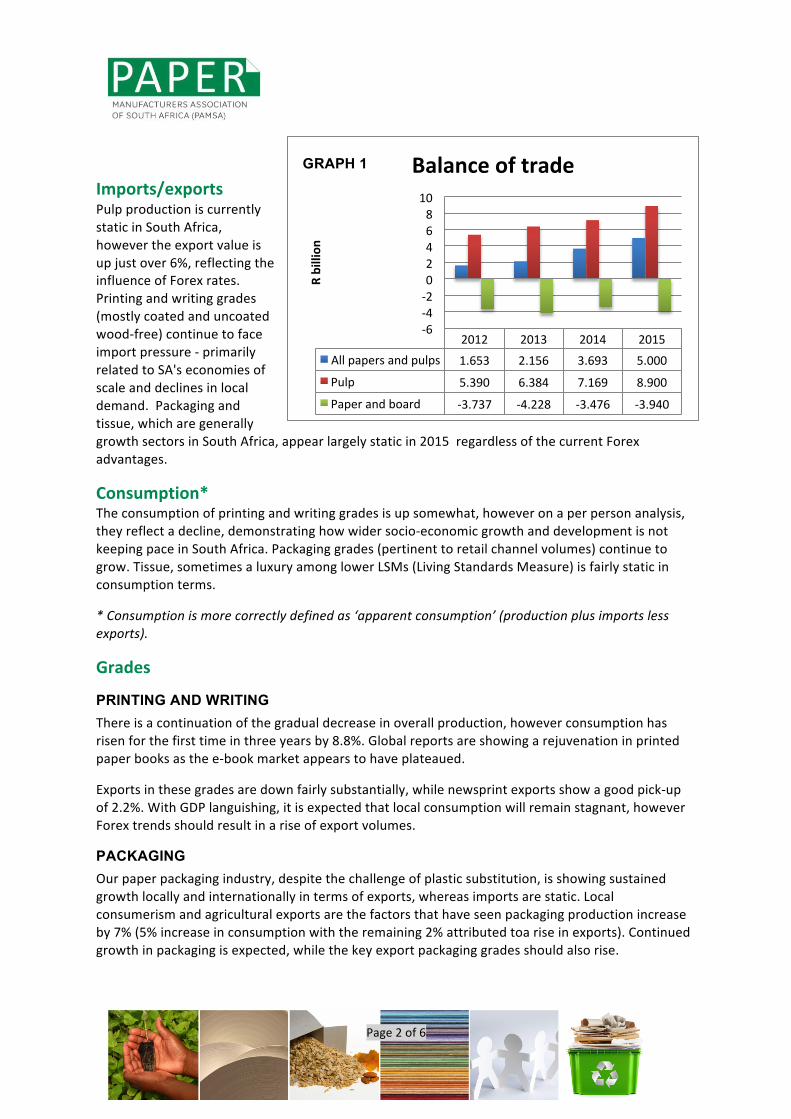
Imports/exports Pulp production is currently static in South Africa, however the export value is up just over 6%, reflecting the influence of Forex rates. Printing and writing grades (mostly coated and uncoated wood-‐free) continue to face import pressure -‐ primarily related to SA's economies of scale and declines in local demand. Packaging and tissue, which are generally growth sectors in South Africa, appear largely static in 2015 regardless of the current Forex advantages.
Consumption* The consumption of printing and writing grades is up somewhat, however on a per person analysis, they reflect a decline, demonstrating how wider socio-‐economic growth and development is not keeping pace in South Africa. Packaging grades (pertinent to retail channel volumes) continue to grow. Tissue, sometimes a luxury among lower LSMs (Living Standards Measure) is fairly static in consumption terms.
* Consumption is more correctly defined as ‘apparent consumption’ (production plus imports less exports).
Grades
PRINTING AND WRITING There is a continuation of the gradual decrease in overall production, however consumption has risen for the first time in three years by 8.8%. Global reports are showing a rejuvenation in printed paper books as the e-‐book market appears to have plateaued.
Exports in these grades are down fairly substantially, while newsprint exports show a good pick-‐up of 2.2%. With GDP languishing, it is expected that local consumption will remain stagnant, however Forex trends should result in a rise of export volumes.
PACKAGING Our paper packaging industry, despite the challenge of plastic substitution, is showing sustained growth locally and internationally in terms of exports, whereas imports are static. Local consumerism and agricultural exports are the factors that have seen packaging production increase by 7% (5% increase in consumption with the remaining 2% attributed toa rise in exports). Continued growth in packaging is expected, while the key export packaging grades should also rise.
2012 2013 2014 2015 All papers and pulps 1.653 2.156 3.693 5.000
Pulp 5.390 6.384 7.169 8.900
Paper and board -‐3.737 -‐4.228 -‐3.476 -‐3.940
-‐6 -‐4 -‐2 0 2 4 6 8 10
R billion
Balance of trade GRAPH 1
Page 3 of 6
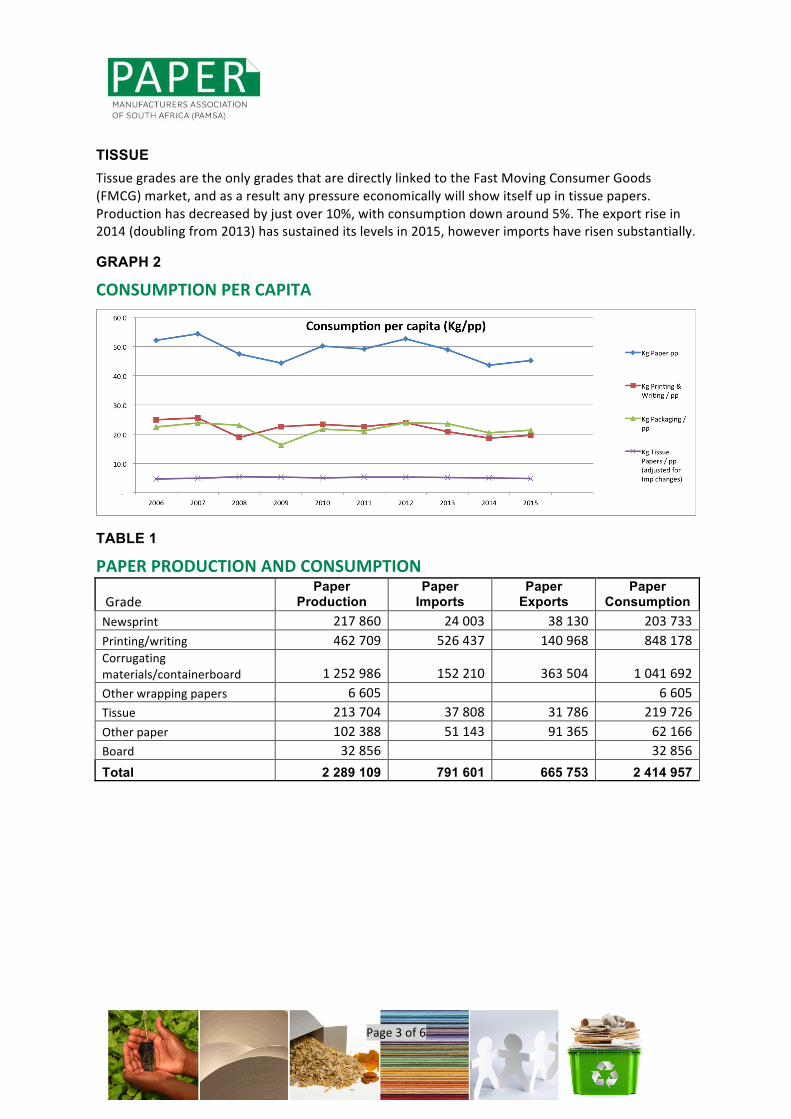
TISSUE Tissue grades are the only grades that are directly linked to the Fast Moving Consumer Goods (FMCG) market, and as a result any pressure economically will show itself up in tissue papers. Production has decreased by just over 10%, with consumption down around 5%. The export rise in 2014 (doubling from 2013) has sustained its levels in 2015, however imports have risen substantially.
GRAPH 2
CONSUMPTION PER CAPITA
TABLE 1
PAPER PRODUCTION AND CONSUMPTION
Grade Paper
Production Paper
Imports Paper
Exports Paper
Consumption Newsprint 217 860 24 003 38 130 203 733 Printing/writing 462 709 526 437 140 968 848 178 Corrugating materials/containerboard 1 252 986 152 210 363 504 1 041 692 Other wrapping papers 6 605
6 605
Tissue 213 704 37 808 31 786 219 726 Other paper 102 388 51 143 91 365 62 166 Board 32 856
32 856
Total 2 289 109 791 601 665 753 2 414 957
Page 4 of 6
SUMMARY TABLES AND GRAPHS
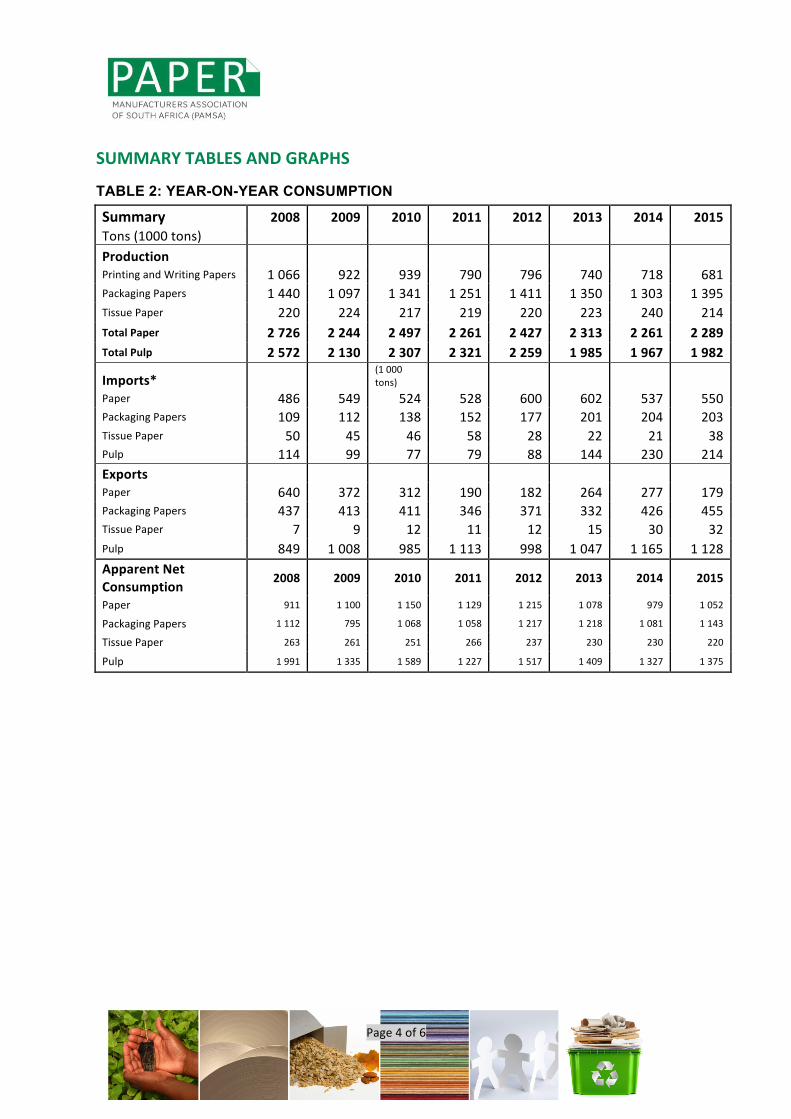
TABLE 2: YEAR-ON-YEAR CONSUMPTION
Summary 2008 2009 2010 2011 2012 2013 2014 2015 Tons (1000 tons) Production
Printing and Writing Papers 1 066 922 939 790 796 740 718 681 Packaging Papers 1 440 1 097 1 341 1 251 1 411 1 350 1 303 1 395 Tissue Paper 220 224 217 219 220 223 240 214 Total Paper 2 726 2 244 2 497 2 261 2 427 2 313 2 261 2 289 Total Pulp 2 572 2 130 2 307 2 321 2 259 1 985 1 967 1 982
Imports* (1 000 tons)
Paper 486 549 524 528 600 602 537 550 Packaging Papers 109 112 138 152 177 201 204 203 Tissue Paper 50 45 46 58 28 22 21 38 Pulp 114 99 77 79 88 144 230 214 Exports
Paper 640 372 312 190 182 264 277 179 Packaging Papers 437 413 411 346 371 332 426 455 Tissue Paper 7 9 12 11 12 15 30 32 Pulp 849 1 008 985 1 113 998 1 047 1 165 1 128 Apparent Net Consumption
2008 2009 2010 2011 2012 2013 2014 2015
Paper 911 1 100 1 150 1 129 1 215 1 078 979 1 052
Packaging Papers 1 112 795 1 068 1 058 1 217 1 218 1 081 1 143
Tissue Paper 263 261 251 266 237 230 230 220
Pulp 1 991 1 335 1 589 1 227 1 517 1 409 1 327 1 375
Page 5 of 6
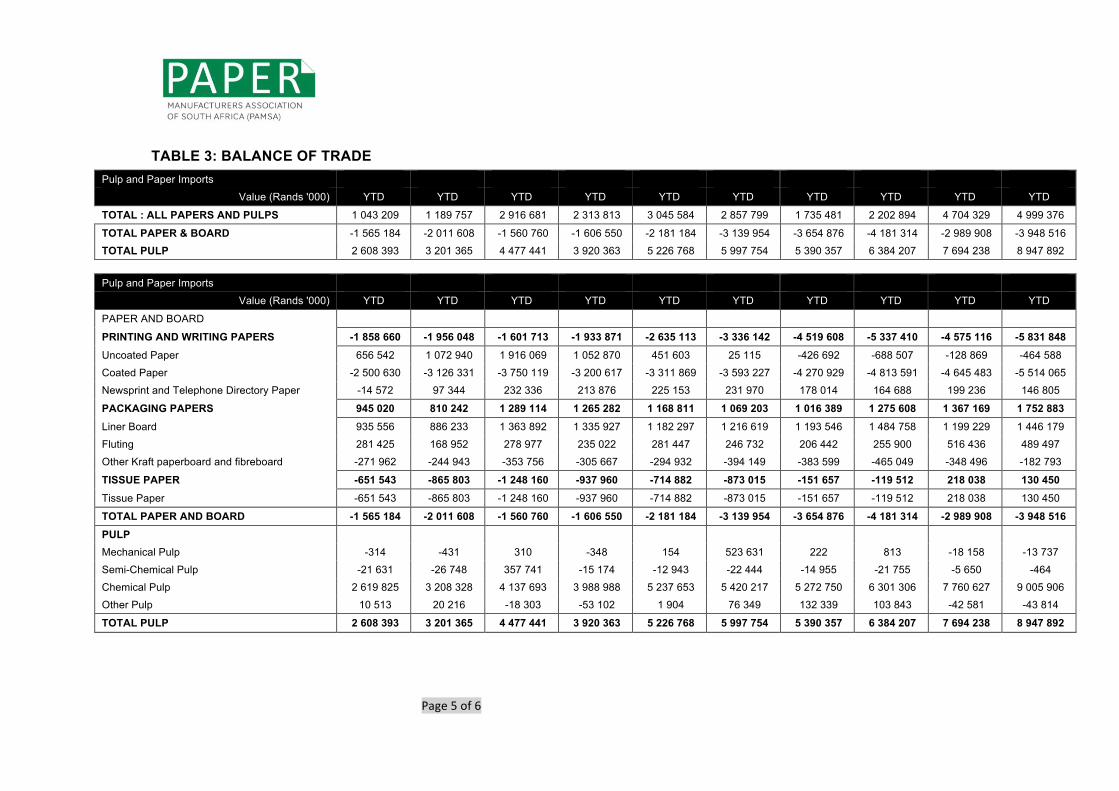
TABLE 3: BALANCE OF TRADE Pulp and Paper Imports 2006 2007 2008 2009 2010 2011 2012 2013 2014 2015
Value (Rands '000) YTD YTD YTD YTD YTD YTD YTD YTD YTD YTD
TOTAL : ALL PAPERS AND PULPS 1 043 209 1 189 757 2 916 681 2 313 813 3 045 584 2 857 799 1 735 481 2 202 894 4 704 329 4 999 376
TOTAL PAPER & BOARD -1 565 184 -2 011 608 -1 560 760 -1 606 550 -2 181 184 -3 139 954 -3 654 876 -4 181 314 -2 989 908 -3 948 516
TOTAL PULP 2 608 393 3 201 365 4 477 441 3 920 363 5 226 768 5 997 754 5 390 357 6 384 207 7 694 238 8 947 892
Pulp and Paper Imports Value (Rands '000) YTD YTD YTD YTD YTD YTD YTD YTD YTD YTD
PAPER AND BOARD
PRINTING AND WRITING PAPERS -1 858 660 -1 956 048 -1 601 713 -1 933 871 -2 635 113 -3 336 142 -4 519 608 -5 337 410 -4 575 116 -5 831 848 Uncoated Paper 656 542 1 072 940 1 916 069 1 052 870 451 603 25 115 -426 692 -688 507 -128 869 -464 588
Coated Paper -2 500 630 -3 126 331 -3 750 119 -3 200 617 -3 311 869 -3 593 227 -4 270 929 -4 813 591 -4 645 483 -5 514 065
Newsprint and Telephone Directory Paper -14 572 97 344 232 336 213 876 225 153 231 970 178 014 164 688 199 236 146 805
PACKAGING PAPERS 945 020 810 242 1 289 114 1 265 282 1 168 811 1 069 203 1 016 389 1 275 608 1 367 169 1 752 883 Liner Board 935 556 886 233 1 363 892 1 335 927 1 182 297 1 216 619 1 193 546 1 484 758 1 199 229 1 446 179
Fluting 281 425 168 952 278 977 235 022 281 447 246 732 206 442 255 900 516 436 489 497
Other Kraft paperboard and fibreboard -271 962 -244 943 -353 756 -305 667 -294 932 -394 149 -383 599 -465 049 -348 496 -182 793
TISSUE PAPER -651 543 -865 803 -1 248 160 -937 960 -714 882 -873 015 -151 657 -119 512 218 038 130 450 Tissue Paper -651 543 -865 803 -1 248 160 -937 960 -714 882 -873 015 -151 657 -119 512 218 038 130 450
TOTAL PAPER AND BOARD -1 565 184 -2 011 608 -1 560 760 -1 606 550 -2 181 184 -3 139 954 -3 654 876 -4 181 314 -2 989 908 -3 948 516 PULP
Mechanical Pulp -314 -431 310 -348 154 523 631 222 813 -18 158 -13 737
Semi-Chemical Pulp -21 631 -26 748 357 741 -15 174 -12 943 -22 444 -14 955 -21 755 -5 650 -464
Chemical Pulp 2 619 825 3 208 328 4 137 693 3 988 988 5 237 653 5 420 217 5 272 750 6 301 306 7 760 627 9 005 906
Other Pulp 10 513 20 216 -18 303 -53 102 1 904 76 349 132 339 103 843 -42 581 -43 814
TOTAL PULP 2 608 393 3 201 365 4 477 441 3 920 363 5 226 768 5 997 754 5 390 357 6 384 207 7 694 238 8 947 892
Page 6 of 6
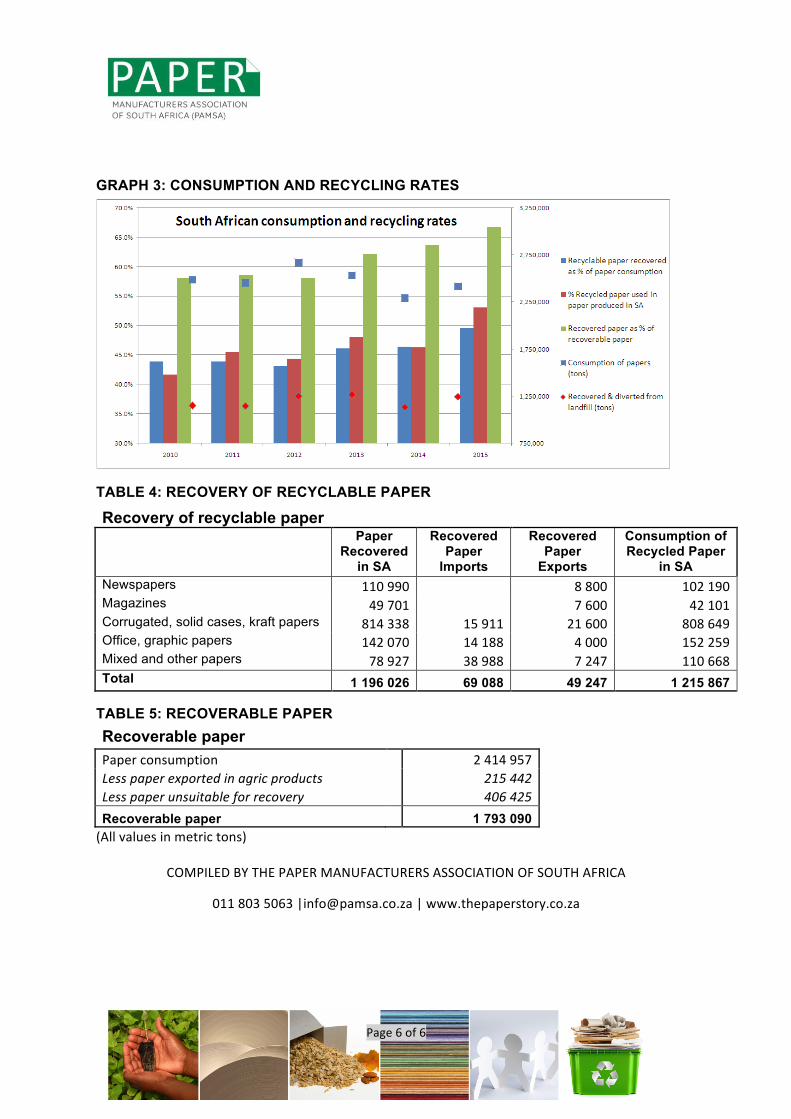
GRAPH 3: CONSUMPTION AND RECYCLING RATES
TABLE 4: RECOVERY OF RECYCLABLE PAPER
Recovery of recyclable paper
Paper Recovered
in SA
Recovered Paper
Imports
Recovered Paper
Exports
Consumption of Recycled Paper
in SA Newspapers 110 990
8 800 102 190
Magazines 49 701
7 600 42 101 Corrugated, solid cases, kraft papers 814 338 15 911 21 600 808 649 Office, graphic papers 142 070 14 188 4 000 152 259 Mixed and other papers 78 927 38 988 7 247 110 668 Total 1 196 026 69 088 49 247 1 215 867
TABLE 5: RECOVERABLE PAPER Recoverable paper
Paper consumption 2 414 957 Less paper exported in agric products 215 442 Less paper unsuitable for recovery 406 425 Recoverable paper
1 793 090
(All values in metric tons)
COMPILED BY THE PAPER MANUFACTURERS ASSOCIATION OF SOUTH AFRICA
011 803 5063 |[email protected] | www.thepaperstory.co.za