south african renewables initiative - development … south african renewables initiative (sari)...
TRANSCRIPT
South African Renewables initiative
Page 1
Update briefing | June 2010
South African
Renewables Initiative
October 2011
South African Renewables initiative
Page 2
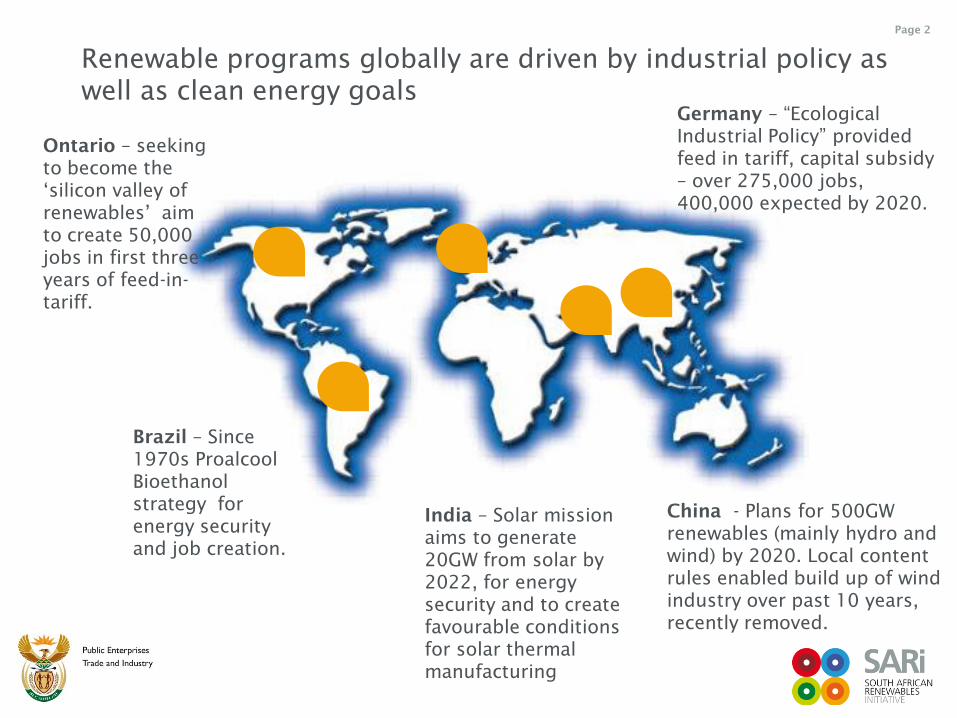
Ontario – seeking
to become the
„silicon valley of
renewables‟ aim
to create 50,000
jobs in first three
years of feed-in-
tariff.
Brazil – Since
1970s Proalcool
Bioethanol
strategy for
energy security
and job creation.
India – Solar mission
aims to generate
20GW from solar by
2022, for energy
security and to create
favourable conditions
for solar thermal
manufacturing
Germany – “Ecological
Industrial Policy” provided
feed in tariff, capital subsidy
– over 275,000 jobs,
400,000 expected by 2020.
China - Plans for 500GW
renewables (mainly hydro and
wind) by 2020. Local content
rules enabled build up of wind
industry over past 10 years,
recently removed.
Renewable programs globally are driven by industrial policy as
well as clean energy goals
South African Renewables initiative
Page 3
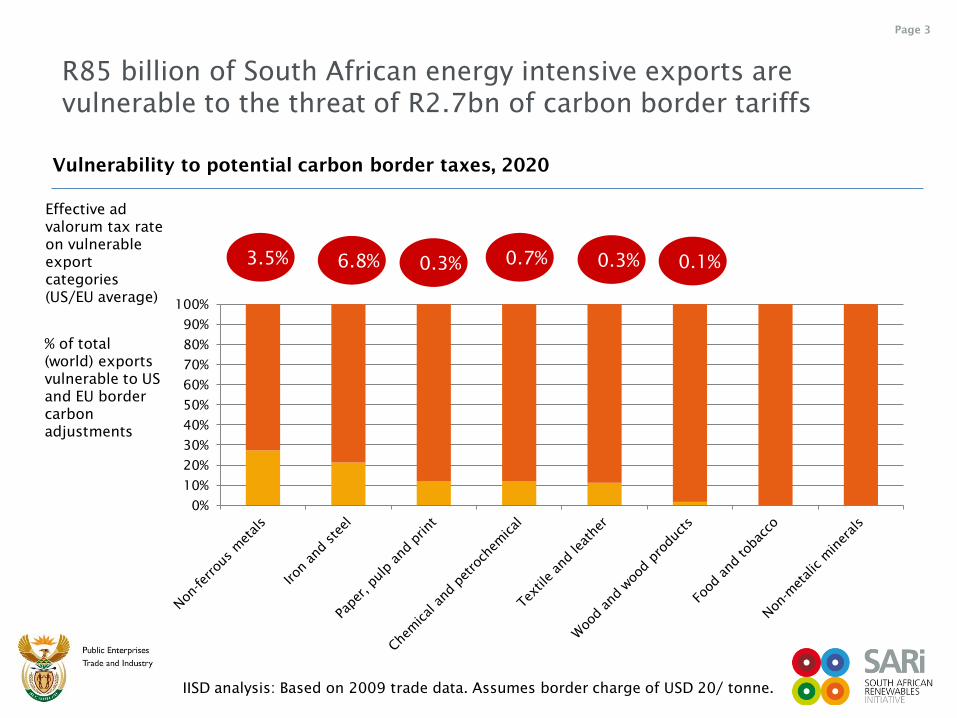
R85 billion of South African energy intensive exports are
vulnerable to the threat of R2.7bn of carbon border tariffs
0.3% 3.5% 6.8% 0.7% 0.3% 0.1%
% of total
(world) exports
vulnerable to US
and EU border
carbon
adjustments
Effective ad
valorum tax rate
on vulnerable
export
categories
(US/EU average)
IISD analysis: Based on 2009 trade data. Assumes border charge of USD 20/ tonne.s
0%
10%
20%
30%
40%
50%
60%
70%
80%
90%
100%
Vulnerability to potential carbon border taxes, 2020
South African Renewables initiative
Page 4
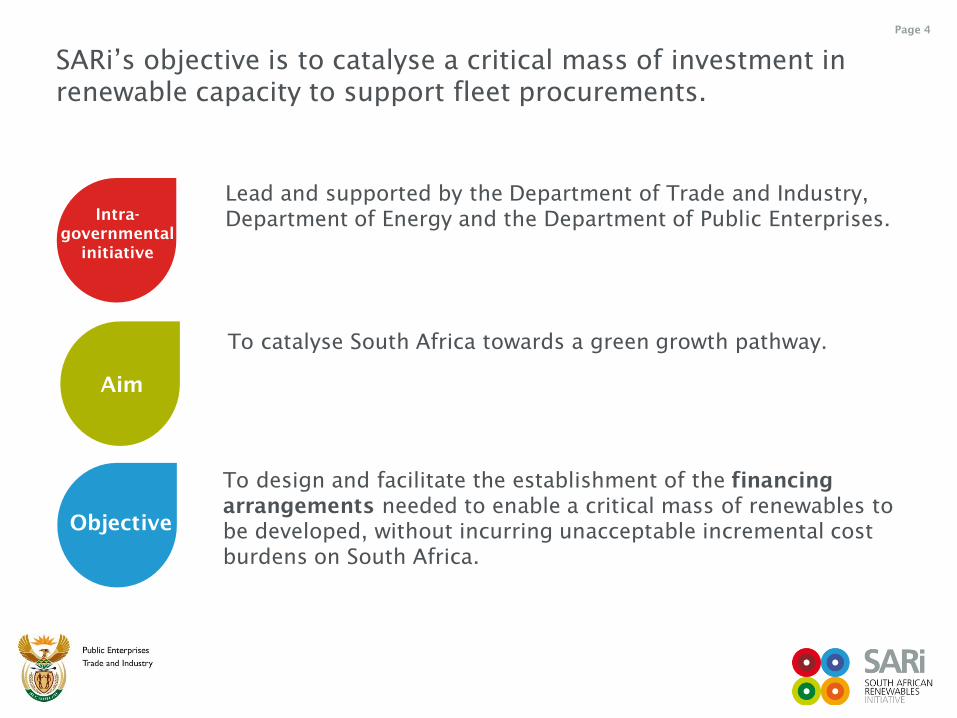
Lead and supported by the Department of Trade and Industry,
Department of Energy and the Department of Public Enterprises.
Intra-
governmental
initiative
Aim
Objective
To catalyse South Africa towards a green growth pathway.
To design and facilitate the establishment of the financing
arrangements needed to enable a critical mass of renewables to
be developed, without incurring unacceptable incremental cost
burdens on South Africa.
SARi‟s objective is to catalyse a critical mass of investment in
renewable capacity to support fleet procurements.
South African Renewables initiative
Page 5
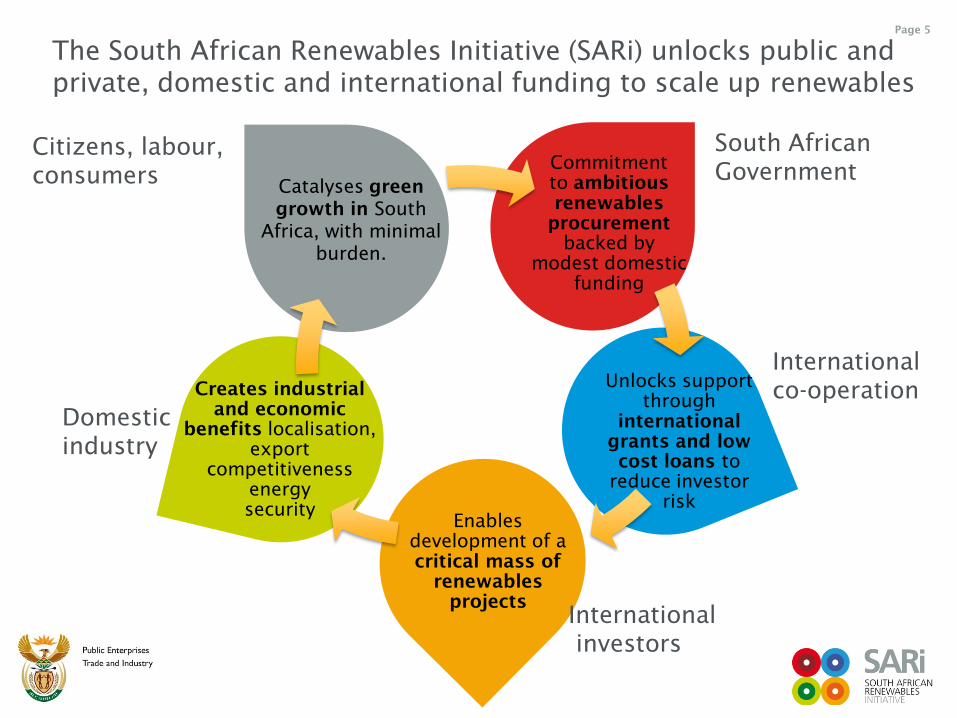
South African
Government
International
co-operation
International
investors
Domestic
industry
Citizens, labour,
consumers Commitment
to ambitious
renewables
procurement
backed by
modest domestic
funding
Unlocks support
through
international
grants and low
cost loans to
reduce investor
risk
Enables
development of a
critical mass of
renewables
projects
Creates industrial
and economic
benefits localisation,
export
competitiveness
energy
security
Catalyses green
growth in South
Africa, with minimal
burden.
The South African Renewables Initiative (SARi) unlocks public and
private, domestic and international funding to scale up renewables
South African Renewables initiative
Page 6
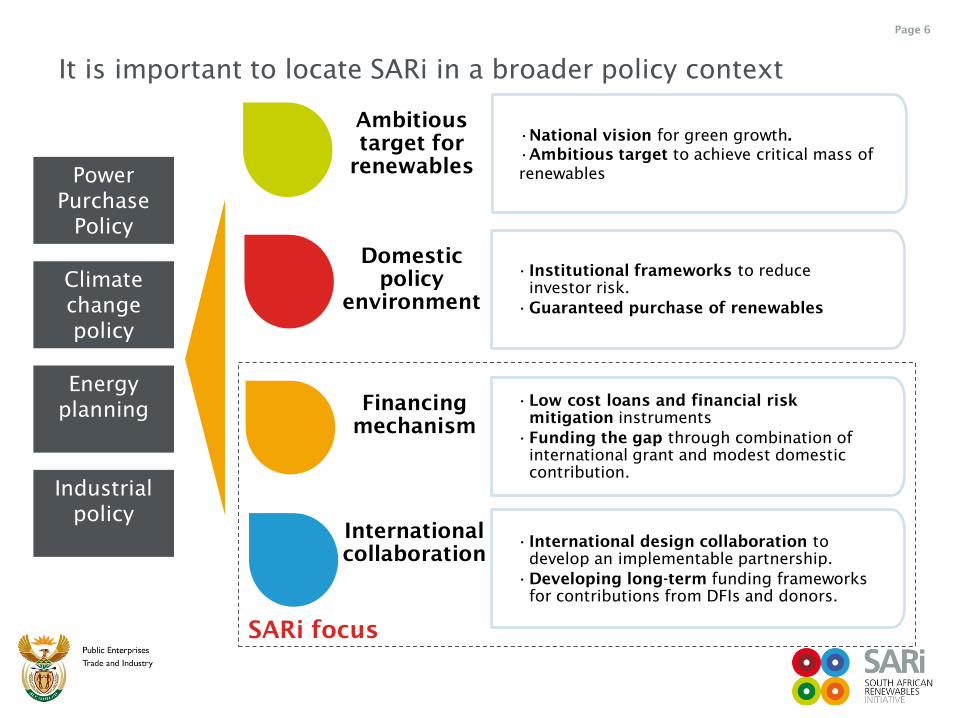
Ambitious
target for
renewables
Domestic
policy
environment
Financing
mechanism
International
collaboration
SARi focus
Power
Purchase
Policy
Energy
planning
Climate
change
policy
Industrial
policy
It is important to locate SARi in a broader policy context
•National vision for green growth.
•Ambitious target to achieve critical mass of
renewables
• Institutional frameworks to reduce
investor risk.
•Guaranteed purchase of renewables
•Low cost loans and financial risk
mitigation instruments
•Funding the gap through combination of
international grant and modest domestic
contribution.
• International design collaboration to
develop an implementable partnership.
•Developing long-term funding frameworks
for contributions from DFIs and donors.
South African Renewables initiative
Page 7
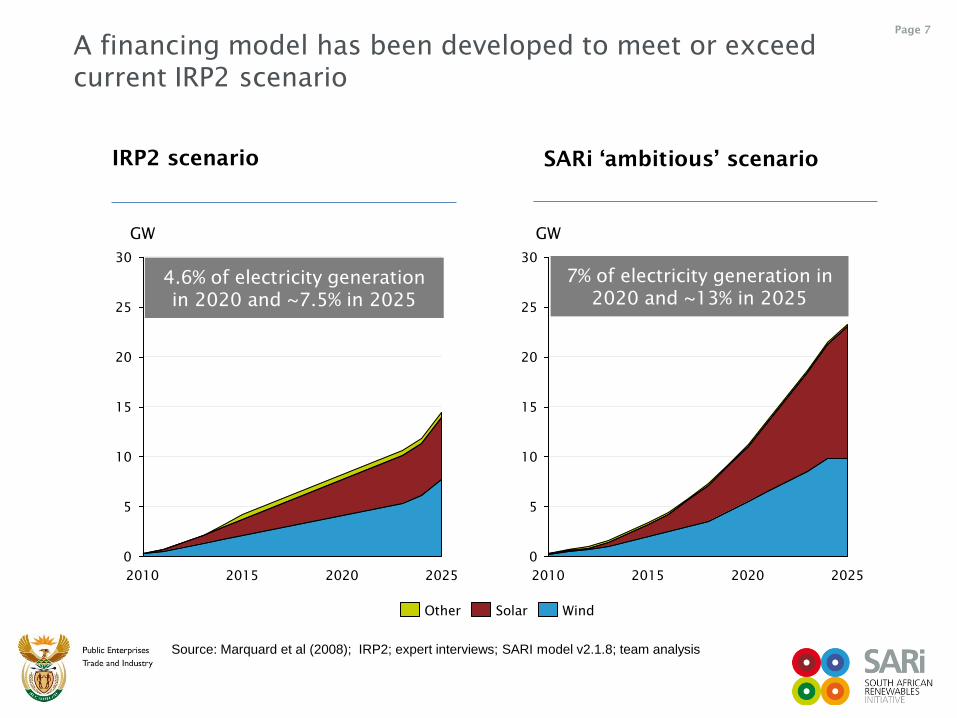
A financing model has been developed to meet or exceed
current IRP2 scenario
GW
30
25
20
15
10
5
0
2025 2020 2015 2010
5
0
2025 2020 2015 2010
GW
30
25
20
15
10
SARi ‘ambitious’ scenario IRP2 scenario
Source: Marquard et al (2008); IRP2; expert interviews; SARI model v2.1.8; team analysis
7% of electricity generation in
2020 and ~13% in 2025
4.6% of electricity generation
in 2020 and ~7.5% in 2025
Wind Solar Other
South African Renewables initiative
Page 8
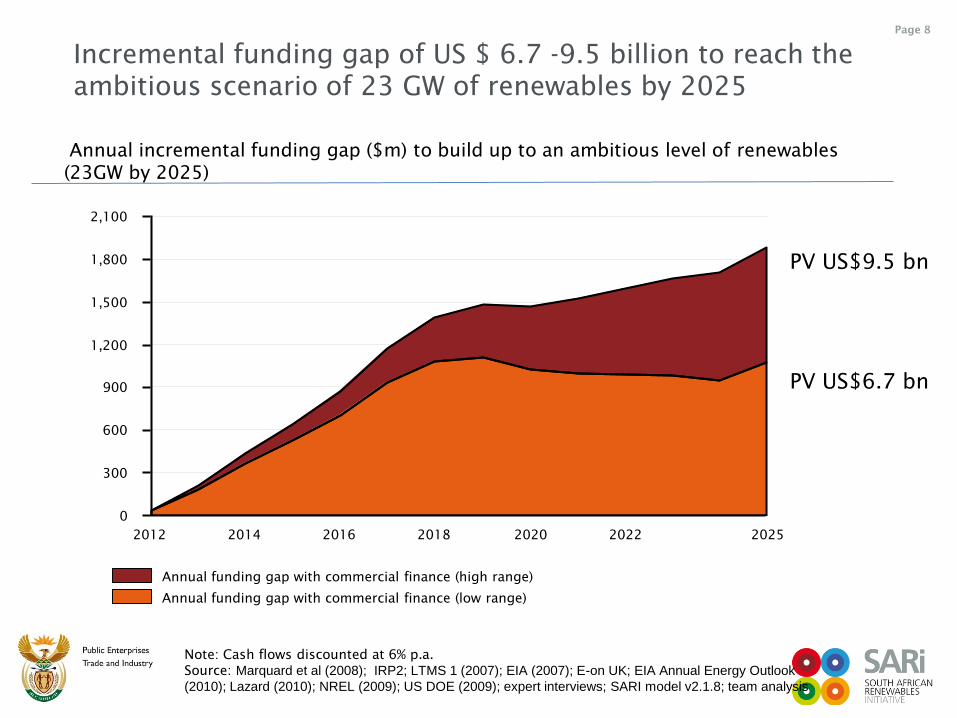
Annual incremental funding gap ($m) to build up to an ambitious level of renewables
(23GW by 2025)
Incremental funding gap of US $ 6.7 -9.5 billion to reach the
ambitious scenario of 23 GW of renewables by 2025
2012 2014
900
600
2025
300
2022
0
2016 2018 2020
2,100
1,200
1,800
1,500
Annual funding gap with commercial finance (low range)
Annual funding gap with commercial finance (high range)
Note: Cash flows discounted at 6% p.a.
Source: Marquard et al (2008); IRP2; LTMS 1 (2007); EIA (2007); E-on UK; EIA Annual Energy Outlook
(2010); Lazard (2010); NREL (2009); US DOE (2009); expert interviews; SARI model v2.1.8; team analysis
PV US$6.7 bn
PV US$9.5 bn
South African Renewables initiative
Page 9
Source: SARI model v10.1 team analysis
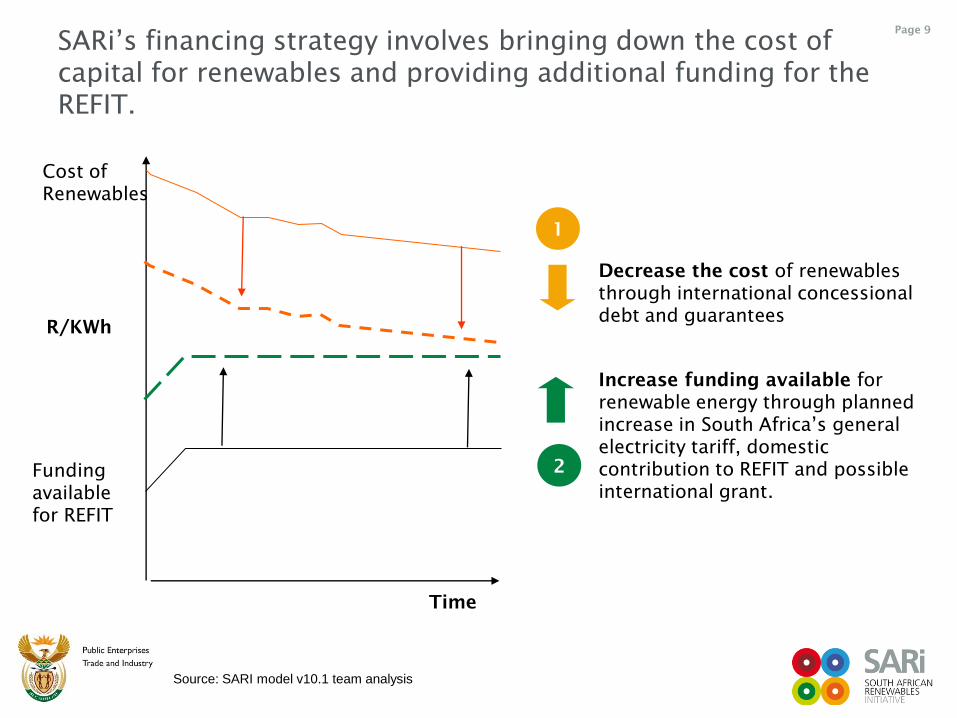
SARi‟s financing strategy involves bringing down the cost of
capital for renewables and providing additional funding for the
REFIT.
R/KWh
Increase funding available for
renewable energy through planned
increase in South Africa‟s general
electricity tariff, domestic
contribution to REFIT and possible
international grant.
Time
Funding
available
for REFIT
Cost of
Renewables
Decrease the cost of renewables
through international concessional
debt and guarantees
1
2
South African Renewables initiative
Page 10
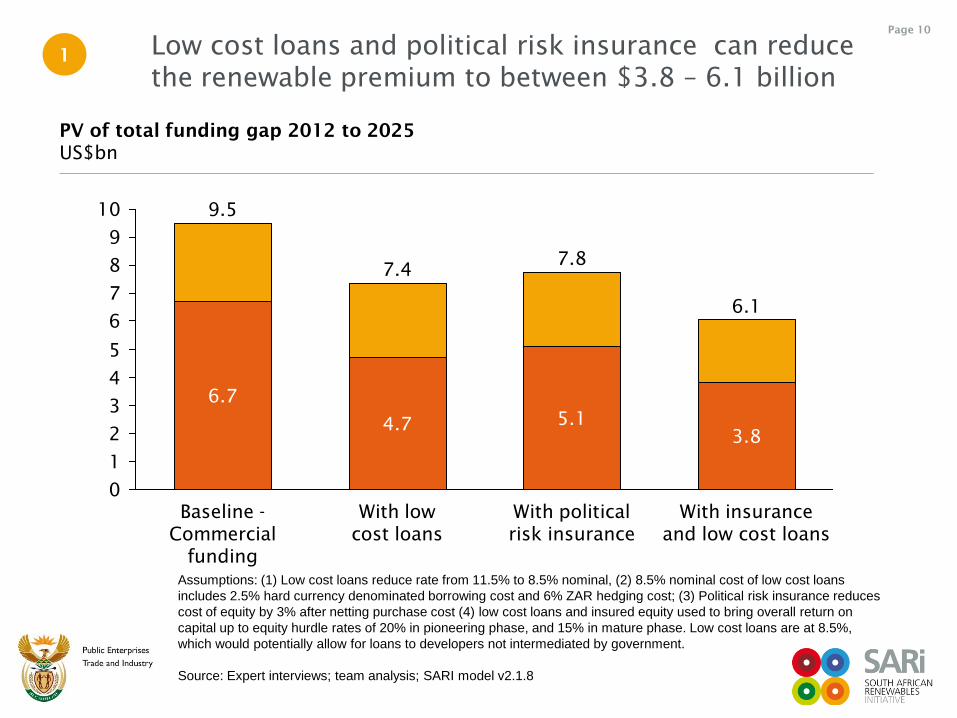
Assumptions: (1) Low cost loans reduce rate from 11.5% to 8.5% nominal, (2) 8.5% nominal cost of low cost loans
includes 2.5% hard currency denominated borrowing cost and 6% ZAR hedging cost; (3) Political risk insurance reduces
cost of equity by 3% after netting purchase cost (4) low cost loans and insured equity used to bring overall return on
capital up to equity hurdle rates of 20% in pioneering phase, and 15% in mature phase. Low cost loans are at 8.5%,
which would potentially allow for loans to developers not intermediated by government.
Source: Expert interviews; team analysis; SARI model v2.1.8
Low cost loans and political risk insurance can reduce
the renewable premium to between $3.8 – 6.1 billion
PV of total funding gap 2012 to 2025
US$bn
9
8
5
4
3
2
1
7.8
With political
risk insurance
7
6
6.1
0
With insurance
and low cost loans
4.7
10
5.1
3.8
Baseline -
Commercial
funding
6.7
7.4
With low
cost loans
9.5
1
South African Renewables initiative
Page 11
Source: Team analysis
5
Source: Team analysis, expert interviews
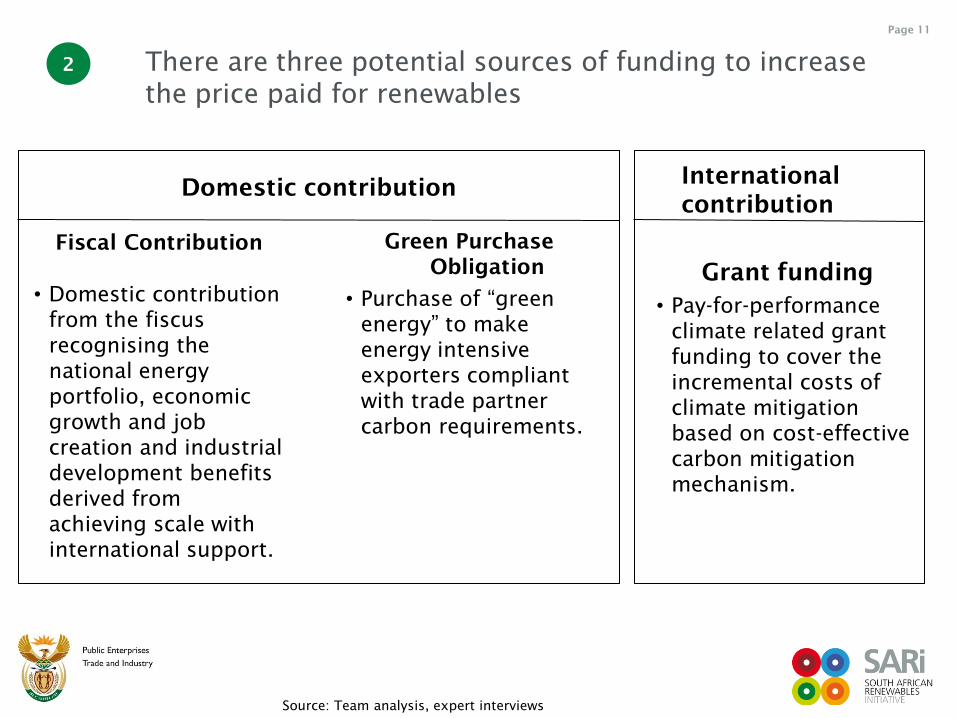
There are three potential sources of funding to increase
the price paid for renewables
Fiscal Contribution
• Domestic contribution
from the fiscus
recognising the
national energy
portfolio, economic
growth and job
creation and industrial
development benefits
derived from
achieving scale with
international support.
Green Purchase
Obligation
• Purchase of “green
energy” to make
energy intensive
exporters compliant
with trade partner
carbon requirements.
2
Grant funding
• Pay-for-performance
climate related grant
funding to cover the
incremental costs of
climate mitigation
based on cost-effective
carbon mitigation
mechanism.
Domestic contribution International
contribution
South African Renewables initiative
Page 12
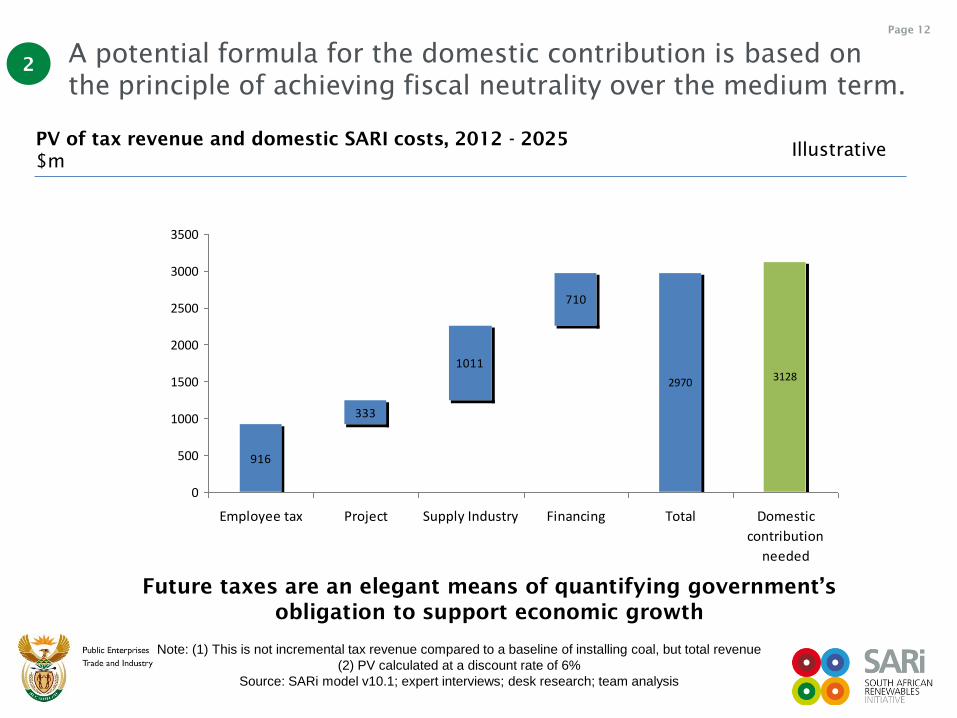
Note: (1) This is not incremental tax revenue compared to a baseline of installing coal, but total revenue
(2) PV calculated at a discount rate of 6%
Source: SARi model v10.1; expert interviews; desk research; team analysis
PV of tax revenue and domestic SARI costs, 2012 - 2025
$m
A potential formula for the domestic contribution is based on
the principle of achieving fiscal neutrality over the medium term.
2970 3128
916
333
1011
710
0
500
1000
1500
2000
2500
3000
3500
Employee tax Project Supply Industry Financing Total Domestic
contribution
needed
Future taxes are an elegant means of quantifying government’s
obligation to support economic growth
Illustrative
2
South African Renewables initiative
Page 13
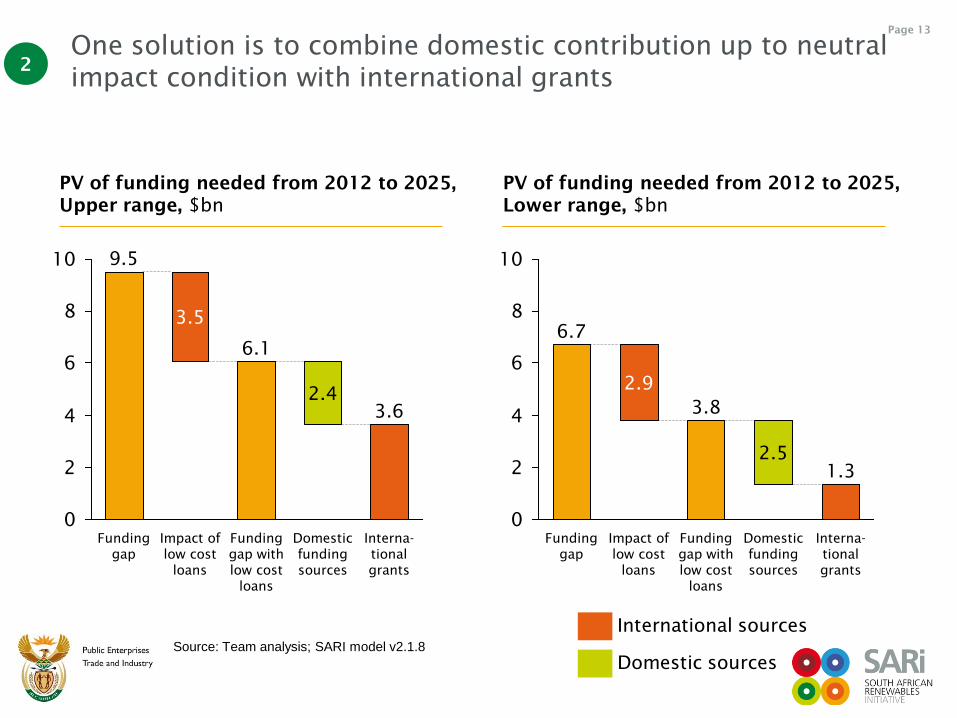
Source: Team analysis; SARI model v2.1.8
One solution is to combine domestic contribution up to neutral
impact condition with international grants
PV of funding needed from 2012 to 2025,
Upper range, $bn
0
2
4
6
8
10
Interna-
tional
grants
3.6
Domestic
funding
sources
Funding
gap
2.4
Funding
gap with
low cost
loans
3.5
Impact of
low cost
loans
9.5
6.1
International sources
Domestic sources
0
2
4
6
8
10
2.5
Domestic
funding
sources
1.3
Funding
gap with
low cost
loans
2.9
3.8
Impact of
low cost
loans
Interna-
tional
grants
Funding
gap
6.7
PV of funding needed from 2012 to 2025,
Lower range, $bn
2
South African Renewables initiative
Page 14
Source: Team analysis
Source: Team analysis, expert interviews
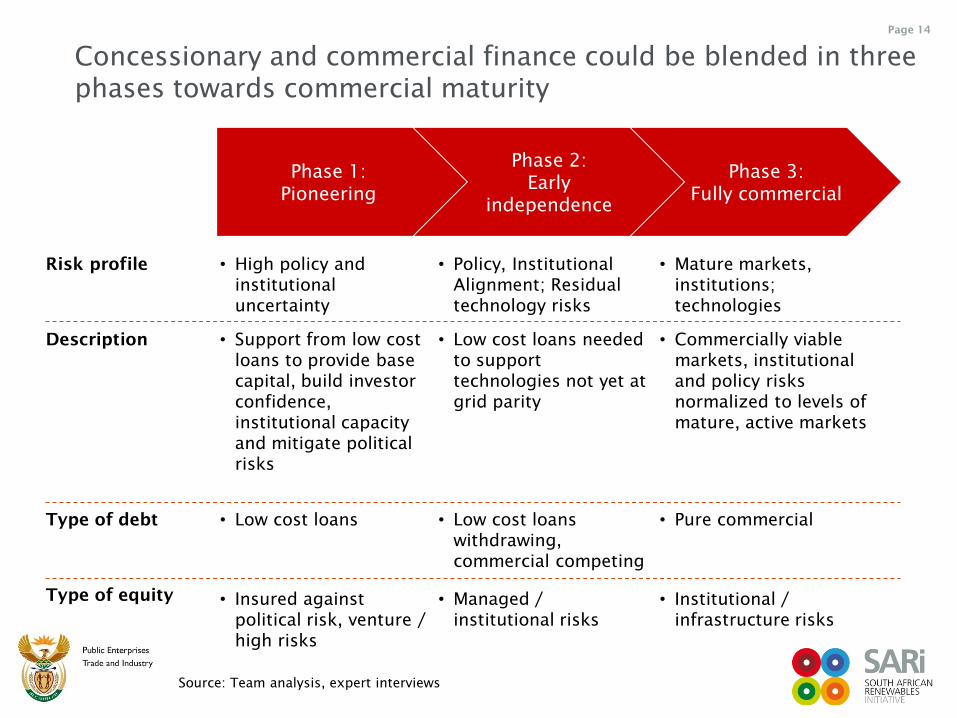
Phase 1:
Pioneering
Phase 2:
Early
independence
Phase 3:
Fully commercial
Description • Support from low cost
loans to provide base
capital, build investor
confidence,
institutional capacity
and mitigate political
risks
• Low cost loans needed
to support
technologies not yet at
grid parity
• Commercially viable
markets, institutional
and policy risks
normalized to levels of
mature, active markets
Type of debt • Low cost loans • Low cost loans
withdrawing,
commercial competing
• Pure commercial
Type of equity • Insured against
political risk, venture /
high risks
• Managed /
institutional risks
• Institutional /
infrastructure risks
Risk profile • High policy and
institutional
uncertainty
• Policy, Institutional
Alignment; Residual
technology risks
• Mature markets,
institutions;
technologies
Concessionary and commercial finance could be blended in three
phases towards commercial maturity
South African Renewables initiative
Page 15
Source: Team analysis
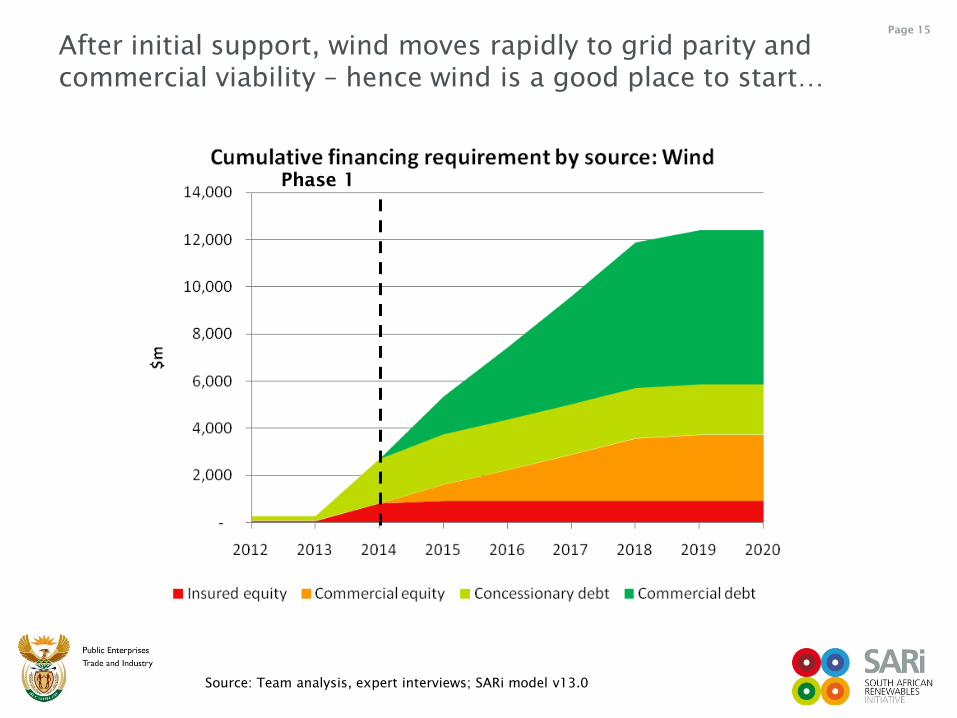
Source: Team analysis, expert interviews; SARi model v13.0
Phase 1
After initial support, wind moves rapidly to grid parity and
commercial viability – hence wind is a good place to start…
South African Renewables initiative
Page 16
12
8
4
16
24
0
20
2022 2025 2020 2018 2016 2014 2012
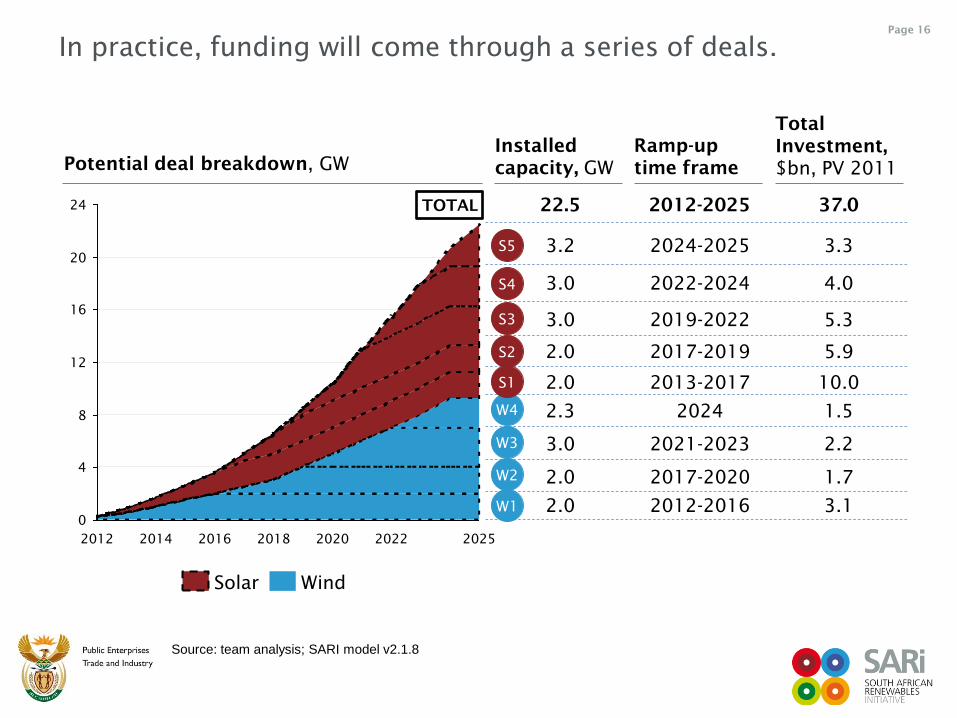
Potential deal breakdown, GW
Source: team analysis; SARI model v2.1.8
Wind Solar
Installed
capacity, GW
Ramp-up
time frame
Total
Investment,
$bn, PV 2011
3.2
3.0
3.0
2.0
2.0
2.3
3.0
2.0
2.0 W1
W2
W3
W4
S1
S2
S3
S4
S5 2024-2025
2022-2024
2019-2022
2017-2019
2013-2017
2024
2021-2023
2017-2020
2012-2016
3.3
4.0
5.3
5.9
10.0
1.5
2.2
1.7
3.1
22.5 2012-2025 37.0 TOTAL
In practice, funding will come through a series of deals.
South African Renewables initiative
Page 17
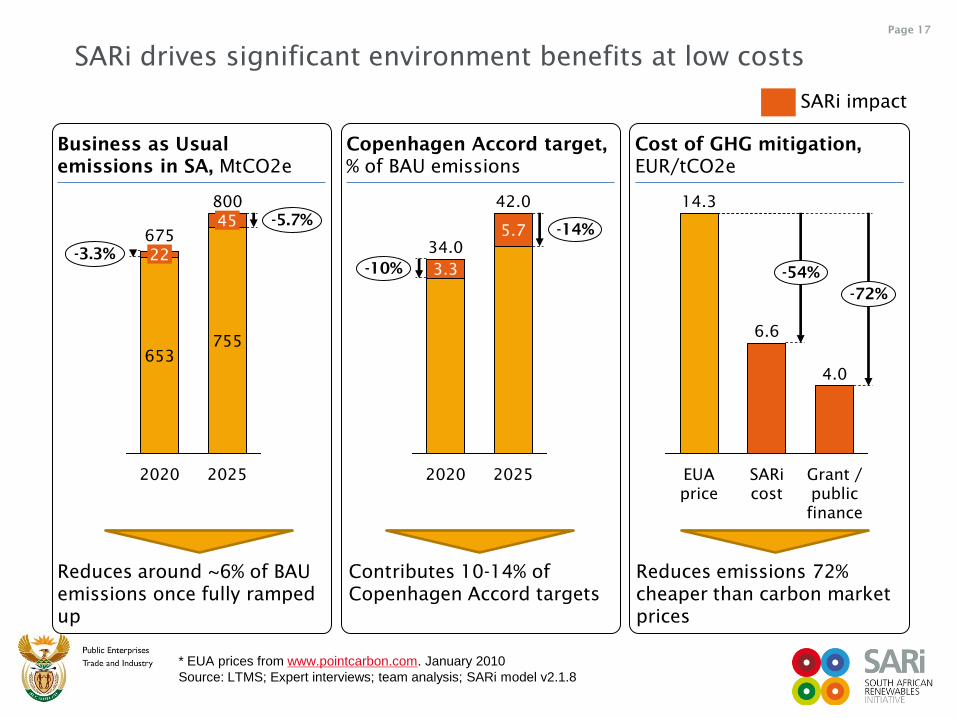
SARi drives significant environment benefits at low costs
Business as Usual
emissions in SA, MtCO2e
Copenhagen Accord target,
% of BAU emissions
Cost of GHG mitigation,
EUR/tCO2e
* EUA prices from www.pointcarbon.com. January 2010
Source: LTMS; Expert interviews; team analysis; SARi model v2.1.8
675
-3.3%
2020
653
22
800
-5.7%
2025
755
45
34.0
-10%
2020
3.3
42.0
-14%
2025
5.7
4.0
-72%
-54%
Grant /
public
finance
SARi
cost
6.6
EUA
price
14.3
Reduces around ~6% of BAU
emissions once fully ramped
up
Contributes 10-14% of
Copenhagen Accord targets
Reduces emissions 72%
cheaper than carbon market
prices
SARi impact
South African Renewables initiative
Page 18
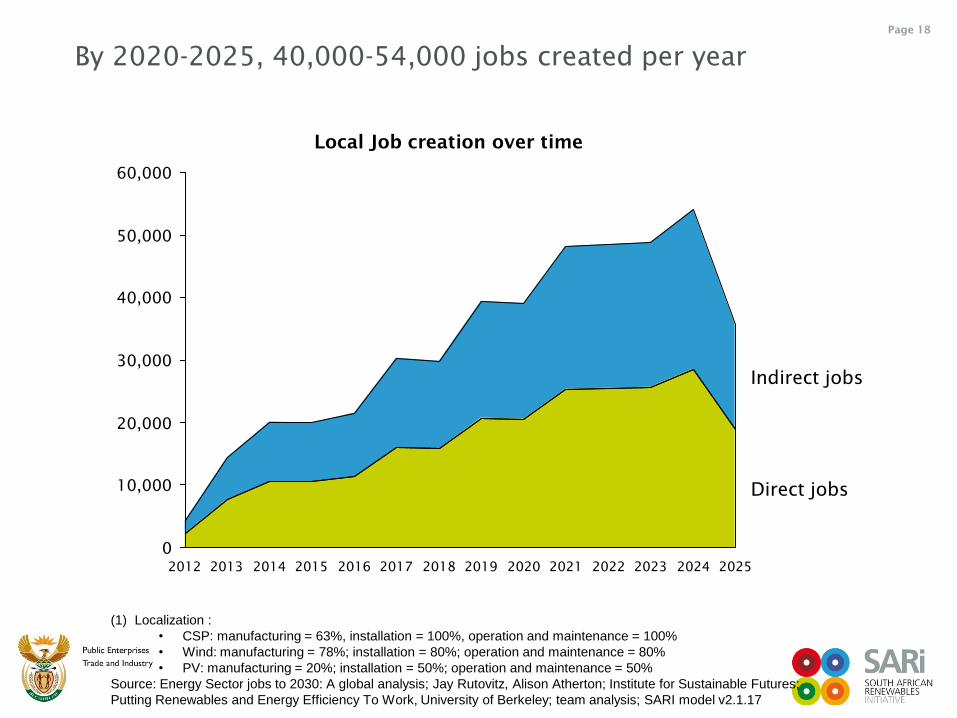
By 2020-2025, 40,000-54,000 jobs created per year
(1) Localization :
• CSP: manufacturing = 63%, installation = 100%, operation and maintenance = 100%
• Wind: manufacturing = 78%; installation = 80%; operation and maintenance = 80%
• PV: manufacturing = 20%; installation = 50%; operation and maintenance = 50%
Source: Energy Sector jobs to 2030: A global analysis; Jay Rutovitz, Alison Atherton; Institute for Sustainable Futures;
Putting Renewables and Energy Efficiency To Work, University of Berkeley; team analysis; SARI model v2.1.17
50,000
40,000
30,000
20,000
10,000
0
Direct jobs
Indirect jobs
2025 2024 2023 2022 2021 2020 2019 2018 2017 2016 2015 2014 2013 2012
60,000
Local Job creation over time
South African Renewables initiative
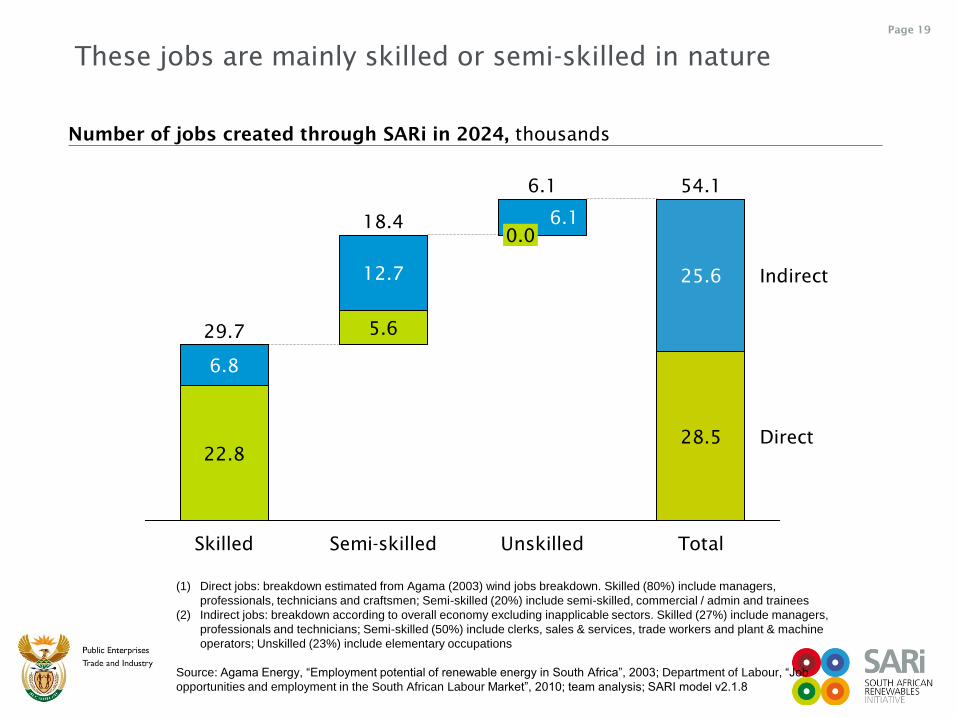
Page 19
(1) Direct jobs: breakdown estimated from Agama (2003) wind jobs breakdown. Skilled (80%) include managers,
professionals, technicians and craftsmen; Semi-skilled (20%) include semi-skilled, commercial / admin and trainees
(2) Indirect jobs: breakdown according to overall economy excluding inapplicable sectors. Skilled (27%) include managers,
professionals and technicians; Semi-skilled (50%) include clerks, sales & services, trade workers and plant & machine
operators; Unskilled (23%) include elementary occupations
Source: Agama Energy, “Employment potential of renewable energy in South Africa”, 2003; Department of Labour, “Job
opportunities and employment in the South African Labour Market”, 2010; team analysis; SARI model v2.1.8
Indirect
Direct
Total
54.1
28.5
25.6
Unskilled
6.1
0.0
6.1
Semi-skilled
18.4
5.6
12.7
Skilled
29.7
22.8
6.8
Number of jobs created through SARi in 2024, thousands
These jobs are mainly skilled or semi-skilled in nature
South African Renewables initiative
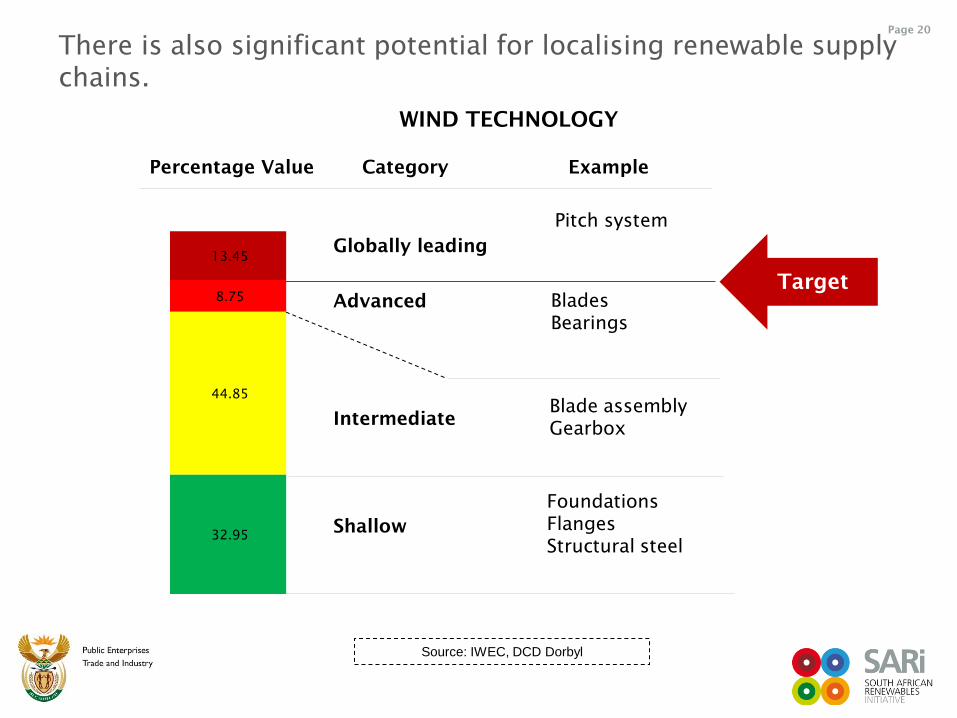
Page 20
32.95
44.85
8.75
13.45 Globally leading
Advanced
Intermediate
Shallow
Pitch system
Blades
Bearings
Foundations
Flanges
Structural steel
Percentage Value Category Example
Source: IWEC, DCD Dorbyl
Blade assembly
Gearbox
There is also significant potential for localising renewable supply
chains.
Target
WIND TECHNOLOGY
South African Renewables initiative
Page 21
Industrial development opportunity. Sustained installation demand can drive high
levels of localisation. This is an economic opportunity to create 40,000 jobs arising
and attract investments of US$50bn.
Enhanced energy security. Embarking on an ambitious renewables development
pathway would improve South Africa‟s reserve margin.
Competitiveness of exports – would ensure that energy intensive exporters get
real value for money that would otherwise be lost through carbon border taxes.
Achievement of Copenhagen commitments. Significant contribution to reducing
carbon GHG emissions growth.
Minimal domestic cost. The net domestic burdens would be relatively small, with
tax revenues from investments and associated labour income approaching fiscal
neutrality over time.
.
Summary: There are a range of benefits associated with SARi