south african soybean crop - sagl
TRANSCRIPT

Sout
h A
fric
an S
oybe
an C
rop
Quality Report
2019/2020 Season

Compiled and issued by:
The Southern African Grain Laboratory NPC
Grain Building - Agri-Hub Office477 Witherite Street
The WillowsPretoria
SOUTH AFRICA
PostNet Suite # 391Private Bag X 1
The Willows
0041
Tel: +27 (12) 807 4019Fax: +27(12) 807 4160E-mail: [email protected]: www.sagl.co.za

Page
Introduction 1 - 2
Provincial contribution to the production of the 2019/20 crop (Graph 1) 1
Production 2 - 4
Soybean Production overview, dryland vs irrigation over two seasons (Table 1) 2
Total RSA area utilised for soybean production from the 2009/10 to 2019/20 seasons (Graph 2) 3
Soybean production in RSA from the 2009/10 to 2019/20 seasons (Graph 3) 3
RSA soybean yield from the 2009/10 to 2019/20 seasons (Graph 4) 3
Area utilised for soybean production in the Free State, Mpumalanga and KwaZulu-Natal since 2009/10 (Graphs 5, 7 and 9) 4
Soybean production in the Free State, Mpumalanga and KwaZulu-Natal since 2009/10(Graphs 6, 8 and 10) 4
Supply and Demand 5
Soybean supply and demand overview for the current marketing season (Mar 2020 – Jan 2021) (Graph 11) 5
SAGIS Soybean Supply and Demand Table 6
Soybean: Supply and demand graphs over 10 marketing seasons (Graphs 12 - 15) 7
SAGIS Import and Export figures 8
SAGIS Oil Seeds Products per month Manufactured 9
SAGIS Oil Seeds Products per month Imported 10
SAGIS Oil Seeds Products per month Exported 11
RSA Production regions 12
RSA Provinces (Figure 1) 12
RSA Crop Production Regions (Figure 2) 13
Soybean Crop Quality 2019/20 - Summary of results 14 - 19
Average % sclerotia per province over five seasons (Graph 16) 14
Average % foreign matter per province over five seasons (Graph 17) 15
Average % soybeans and parts of soybeans above the 1.8 mm slotted sieve which pass through the 4.75 mm round hole sieve per province over five seasons (Graph 18) 15
Average % defective soybeans on the 4.75 mm round hole sieve per province over five seasons (Graph 19) 16
Index

Average % soiled soybeans per province over five seasons (Graph 20) 16
Approximation of test weight per province over three seasons (Table 2) 16
Comparison of the test weight per province over five seasons (Graph 21) 17
Comparison of weighted average nutritional component values on a dry and ‘as is’ basis over five seasons (Table 3) 17
Average crude protein content per province over five seasons (Graph 22) 18
Average crude fat content per province over five seasons (Graph 23) 18
Average crude fibre content per province over four seasons (Graph 24) 18
Average ash content per province over five seasons (Graph 25) 18
Comparison between crop quality and ARC cultivar trial samples of the 2019/20 season (Table 4) 19
Genetic Modification (GM) 20
Genetic Modification (GM) results for the 2019/20 season (Table 5) 20
South African Soybean Crop Quality Averages 2019/20 vs 2018/19 (Table 6) 21
List of grain production region with silo/intake stands and type of storage structure 22 - 25
Regional soybean quality for the 2019/20 season 26 – 33
Fatty Acid Profile 34
Fatty Acid Profile results of a selection of crop quality samples from the 2019/20 season (Table 7) 35
Fatty Acid Profile results of a selection of cultivar samples per region from the 2019/20 season (Table 8) 36
Fatty Acid Profile results per cultivar from the 2019/20 season (Table 9) 37 - 38
Methods 39 - 40
SANAS Certificate and Schedule of Accreditation 41 - 44
2019/20 Report of the ARC Grain Crops National Soybean Cultivar Trials 45 - 84
Grading Regulations for Soybeans, Government Notice NO. R.370 of 21 April 2017 85 - 94

South African Soybean Crop Quality Report 2019/2020 Season1
Acknowledgements
With gratitude to:
• The Oilseeds Advisory Committee (OAC) as well as the Oil & Protein Seed Development Trust (OPDT)
foritsfinancialsupportinconductingthissurvey.• Agbiz Grain and its members for their cooperation in providing the samples to make the survey possible.
• The Crop Estimates Committee (CEC) of the Department of Agriculture, Land Reform and Rural Development
(DALRRD)forprovidingproductionrelatedfigures.• South African Grain Information Service (SAGIS) for providing supply and demand figures relating to
soybeans.
• The Bureau for Food and Agricultural Policy (BFAP) for providing research based market analysis.
• PrecisionOilLaboratoriesforprovidingFattyAcidProfileanalyses.
IntroductionThe final commercial soybean crop figure of the 2019/20 season, as overseen by the National Crop Estimates Liaison Committee (CELC), is 1 245 500 tons and represents a 6% increase (75 155 tons) year on year. The major soybean producing provinces, namely the Free State and Mpumalanga, contributed 75% of the total crop.
Free State42%
KwaZulu-Natal8%
Western, Eastern and Northern Cape
1%
Mpumalanga33%
Limpopo4%
Gauteng6%
North West6%
Graph 1: Provincial contribution to the
production of the 2019/20 soybean crop
Figures provided by the CEC.
South AfricanCOMMERCIAL SOYBEAN QUALITY FOR THE
2019/2020 SEASON
During the harvesting season, a representative sample of each delivery of soybeans at the various silos was taken according to the prescribed grading regulations. The sampling procedure for the samples used in this survey is described on page 39. One hundred and fifty composite soybean samples, representing the different production regions, were analysed for quality. The samples were graded, milled and analysed for moisture, crude protein, crude fat, crude fibre and ash content. Fifteen randomly selected samples were analysed to quantitatively determine the presence of genetically modified soybeans. Twenty samples, randomly selected to represent the different production regions, were submitted to Precision Oil Laboratories for fatty acid profile analyses.
This is the nineth annual soybean crop quality survey performed by The Southern African Grain Laboratory NPC (SAGL). SAGL was established in 1997 on request of the Grain Industry. SAGL is an ISO 17025 accredited testing laboratory and participates in various proficiency testing schemes, both nationally and internationally, as part of our ongoing quality assurance procedures to demonstrate technical competency and international comparability.
The goal of this crop quality survey is the compilation of a detailed database, accumulating quality data collected over several seasons on the national commercial soybean crop, which is essential in assisting with decision making processes. The data reveal general tendencies, highlight quality differences in the commercial soybeans produced in different local production regions and provide important information on the quality of commercial soybeans intended for export when applicable.
The results of this survey are available on the SAGL website (www.sagl.co.za). Hard copy reports are distributed to all Directly Affected Groups and interested parties. The report is also available to read or download (in a PDF format) from the website.

South African Soybean Crop Quality Report 2019/2020 Season2
In addition to the quality information, production figures (obtained from the Crop Estimates Committee (CEC)) relating to hectares planted, tons produced and yields obtained on a national as well as provincial basis, over an eleven season period, are provided in this report. SAGIS (South African Grain Information Service) supply and demand information is provided in table and graph format. Import and export figures over several seasons as well as information on the manufacture, import and export of oil seeds products, are also included.
The 2019/20 Report of the National Soybean Cultivar Trials conducted by the ARC-Grain Crops in Potchefstroom, is included in totality and as received, in this report. The national grading regulations as published in Government Notice NO. R.370 of 21 April 2017 are also provided.
Production Soybeans are the most important oilseed crop produced in South Africa, driven mainly by the demand for protein feed in the animal feed industry. Soybeans have benefits to producers in crop rotation programs, especially as part of conservation agriculture, but also due to lower input requirements compared to other commodities for example wheat and maize.
Table 1: Soybean production overview over two seasons
Province Type of production
2019/20 2018/19
Hectares
planted, ha
Production,
tons
Yield,
t/ha
Hectares
planted, ha
Production,
tons
Yield,
t/ha
Western Cape
Dryland - - - - - -
Irrigation - - - 100 10 0.10
Total - - - 100 10 0.10
Northern Cape
Dryland - - - - - -
Irrigation 2 000 7 000 3.50 1 550 5 425 3.50
Total 2 000 7 000 3.50 1 550 5 425 3.50
Free State
Dryland 304 000 486 750 1.60 292 800 368 350 1.26
Irrigation 11 000 33 000 3.00 8 200 22 950 2.80
Total 315 000 519 750 1.65 301 000 391 300 1.30
Eastern Cape
Dryland 1 300 2 300 1.77 1 150 1 380 1.20
Irrigation 200 700 3.50 - - -
Total 1 500 3 000 2.00 1 150 1 380 1.20
KwaZulu-Natal
Dryland 22 000 56 000 2.55 20 000 47 000 2.35
Irrigation 13 000 45 500 3.50 13 000 52 000 4.00
Total 35 000 101 500 2.90 33 000 99 000 3.00
Mpumalanga
Dryland 252 000 390 000 1.55 297 000 470 000 1.58
Irrigation 8 000 26 000 3.25 13 000 41 500 3.19
Total 260 000 416 000 1.60 310 000 511 500 1.65
Limpopo
Dryland 2 700 4 350 1.61 2 800 4 980 1.78
Irrigation 12 800 43 700 3.41 13 400 42 000 3.13
Total 15 500 48 050 3.10 16 200 46 980 2.90
Gauteng
Dryland 34 000 63 200 1.86 28 500 56 550 1.98
Irrigation 2 000 7 000 3.50 3 000 9 600 3.20
Total 36 000 10 200 1.95 31 500 66 150 2.10
North West
Dryland 30 000 51 000 1.70 29 200 27 500 0.94
Irrigation 10 000 29 000 2.90 6 800 21 100 3.10
Total 40 000 80 000 2.00 36 000 48 600 1.35
RSA
Dryland 646 000 1 053 600 1.63 671 450 975 760 1.45
Irrigation 59 000 191 900 3.25 59 050 194 585 3.30
Total 705 000 1 245 000 1.77 730 500 1 170 345 1.60
Figures provided by the CEC.

South African Soybean Crop Quality Report 2019/2020 Season3
100 000
200 000
300 000
400 000
500 000
600 000
700 000
800 000
900 000
Ha
Graph 2: Total RSA area utilised for soybean production from 2009/10 to 2019/20
Previous 3 yr ave = 697 217
Previous 5 yr ave = 656 350
Previous 10 yr ave = 550 260
200 000
400 000
600 000
800 000
1 000 000
1 200 000
1 400 000
1 600 000
1 800 000
Ton
Graph 3: Soybean production in RSA from 2009/10 to 2019/20
1.00
1.20
1.40
1.60
1.80
2.00
2.20
2.40
t/ha
Graph 4: RSA soybean yield from 2009/10 to 2019/20
Figures provided by the CEC.
Previous 3 yr ave = 1 342 115
Previous 5 yr ave = 1 167 669
Previous 10 yr ave = 949 685
Previous 3 yr ave = 1.95
Previous 5 yr ave = 1.78
Previous 10 yr ave = 1.72
Compared to the 2018/19 production season, the area utilised for commercial soybean crop production decreased by just more than 3% (25 500 hectares). Both the area planted as well as the production figure, are the third highest figures on record. The average national yield increased by almost 11% to 1.77 t/ha.
According to the BFAP Baseline, Agricultural Outlook 2020 – 2029, the area cultivated to soybeans is projected to continue increasing, expanding by 47% over the ten-year period to 2029. A substantial share of further area expansion is expected in the western regions, traditionally considered to be more marginal with regards to soybean production. The national average yield is nevertheless still projected to increase by 13% relative to the base period, as the introduction of the breeding technology levy, is expected to incentivise seed companies to make the latest technology available to South African producers.
Soybeans account for more than half of the world oilseed production. According to the World Agricultural
Supply and Demand Estimates Report (WASDE – 610) an estimated 339.00 million metric tons of soybeans were produced during the 2019/20 season. Brazil, the United States and Argentina are the biggest contributors to this total. The world soybean production during the 2020/21 season is projected to be 361.82 million metric tons.

South African Soybean Crop Quality Report 2019/2020 Season4
10 000
15 000
20 000
25 000
30 000
35 000
40 000
45 000
Ha
20 000
40 000
60 000
80 000
100 000
120 000
140 000
To
n
50 000
100 000
150 000
200 000
250 000
300 000
350 000
Ha
100 000
200 000
300 000
400 000
500 000
600 000
700 000
To
n
50 000
100 000
150 000
200 000
250 000
300 000
350 000
400 000
Ha
100 000
200 000
300 000
400 000
500 000
600 000
To
n
Graph 5: Area utilised for soybean production in the
Free State since 2009/10
Graph 6: Soybean production in the Free State
since 2009/10
Graph 7: Area utilised for soybean production in
Mpumalanga since 2009/10
Graph 8: Soybean production in Mpumalanga
since 2009/10
Graph 9: Area utilised for soybean production in
KwaZulu-Natal since 2009/10
Graph 10: Soybean production in KwaZulu-Natal
since 2009/10
Figures provided by the CEC.
227 364328 818
231 727
401 777
33 955 91 828
Eleven season average

South African Soybean Crop Quality Report 2019/2020 Season5
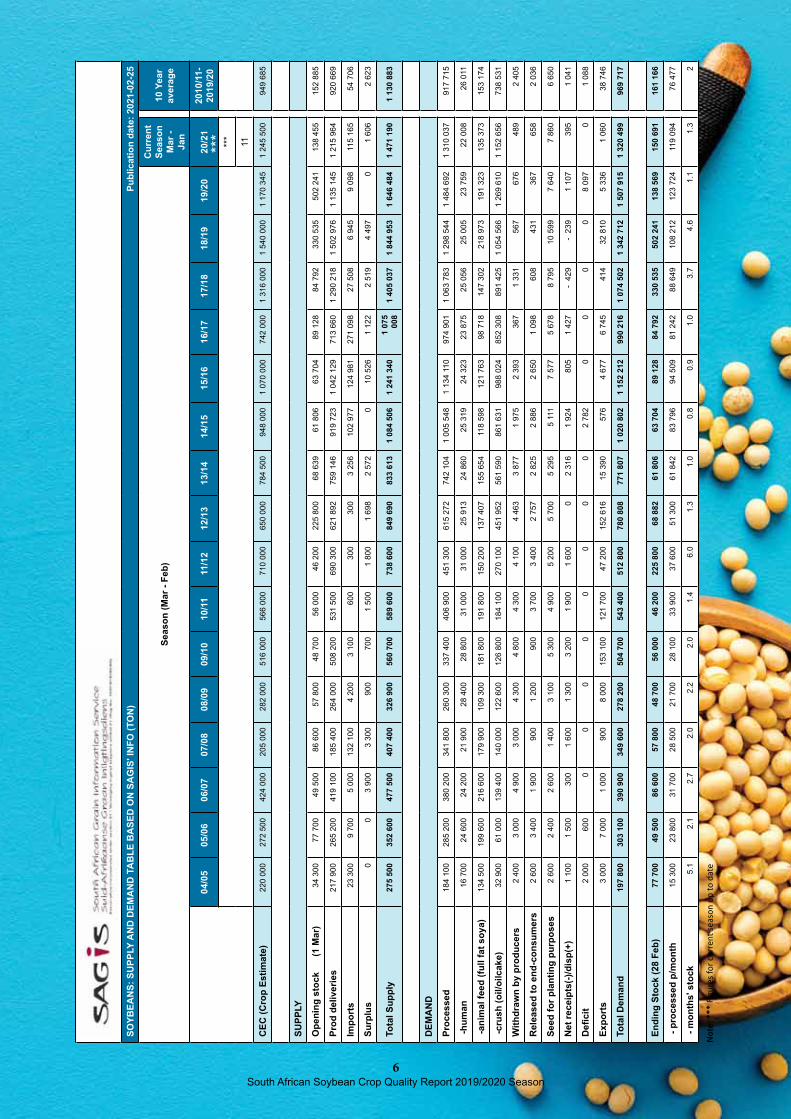
Supply and DemandThe soybean marketing season dates from March to end of February. According to SAGIS’ supply and demand figures for the current marketing season to date (March 2020 to January 2021), the amount of soybeans imported (115 165 tons) increased significantly compared to the 9 098 and 6 945 tons of the previous two seasons. China remains the largest importer of soybeans worldwide, with 98.53 million metric tons during the 2019/20 season, followed by the European Union and the UK.
Of the 1.31 million tons of soybeans processed locally to date, 1.7% was used for human consumption, 10.3% for animal feed as full fat soya and the bulk crushed to produce oil and oilcake. Soybean oilcake demand is primarily driven by the feed industry. The quantity of soybeans crushed so far, is 9% less than the total quantity crushed during the previous season and 56% more than the 10-year average. According to BFAP Baseline, soybean processing volumes are projected to increase by 63% over the next 10 years.
Over the past decade, the soybean industry has been one of the most dynamic sectors in local agriculture, now maturing, further expansion is expected to occur at a much slower rate. Total soybean processing capacity (crush and full fat) in South Africa is derived from a combination of dedicated soybean processing facilities, as well as plants with the ability to switch between soybeans and sunflowers, resulting in a total combined capacity of more than 2 million tons. South Africa should therefore have ample capacity to process the projected volumes until 2026, provided that crush margins are sufficient to induce switching of dual plants into soybean crushing. Despite sufficient soybean production to supply an exportable surplus by the end of 2029, the high cost of transportation from SA’s summer rainfall regions to the Western Cape in particular, implies that South Africa will continue to import soybean oilcake into the coastal regions. Reducing this cost, by investment in rail infrastructure, would enable South Africa to become self-sufficient. Vegetable oil consumption increased by 43% over the past 10 years but is however projected to increase by only 10% over the coming decade. Between 2007 and 2009 to 2019, soybean oil consumption increased by 17%. This growth is projected to slow to 9% by 2029, relative to the 2017-2019 base period.
1 060 tons of soybeans/products have been exported so far this season compared to the 5 336 and 32 810 tons of the previous two seasons respectively. The 10-year average is 38 746 tons. Globally, soybean exports during the 2019/20 season amounted to an estimated 165.18 million metric tons, with Brazil exporting 56% and the United States 28% of this figure. The projected world soybean exports for the 2020/21 season currently stands at 169.72 million metric tons. Argentina, followed by Brazil and the USA are the largest exporters of soybean meal as well as soybean oil (WASDE).
Graph 11: Soybean supply and demand overview for the current marketing season
(Mar 2020 - Jan 2021)
Information provided by SAGIS.
200 000
400 000
600 000
800 000
1 000 000
1 200 000
1 400 000
1 600 000
1 800 000
CEC Estimate SAGIS deliveries Processed Exports
Ton
1 245 5001 215 964
1 310 037
1 060
South African Soybean Crop Quality Report 2019/2020 Season6
SO
YB
EA
NS
: S
UP
PLY
AN
D D
EM
AN
D T
AB
LE
BA
SE
D O
N S
AG
IS' IN
FO
(T
ON
)P
ub
lic
ati
on
da
te:
20
21
-02
-25
Seaso
n (
Mar
- F
eb
)
Cu
rre
nt
Se
as
on
Ma
r -
Ja
n
10
Ye
ar
av
era
ge
04/0
505/0
606/0
707/0
808/0
909/1
010/1
111/1
212/1
313/1
414
/15
15
/16
16
/17
17
/18
18
/19
19
/20
20
/21
20
10
/11
-
20
19
/20
***
11
CE
C (
Cro
p E
sti
mate
)22
0 00
0 2
72 5
00 4
24 0
00 2
05 0
00 2
82 0
00 5
16 0
00 5
66 0
00 7
10 0
00 6
50 0
00 7
84 5
00 9
48 0
001
070
000
742
000
1 31
6 00
01
540
000
1 17
0 34
51
245
500
949
685
SU
PP
LY
Op
en
ing
sto
ck (1
Mar)
34
300
77 7
00
49
500
86
600
57
800
48
700
56
000
46
200
225
800
68
639
61
806
63
704
89
128
84
792
330
535
502
241
138
455
152
885
Pro
d d
eliveri
es
217
900
265
200
419
100
185
400
264
000
508
200
531
500
690
300
621
892
759
146
919
723
1 04
2 12
9 7
13 6
601
290
218
1 50
2 97
61
135
145
1 21
5 96
4 9
20 6
69
Imp
ort
s 2
3 30
0 9
700
5 0
00 1
32 1
00 4
200
3 1
00 6
00 3
00 3
00 3
256
102
977
124
981
271
098
27
508
6 9
45 9
098
115
165
54
706
Su
rplu
s 0
0
3 9
00 3
300
900
700
1 5
00 1
800
1 6
98 2
572
0
10
526
1 1
22 2
519
4 4
970
1 6
06 2
623
To
tal S
up
ply
275 5
00
352 6
00
477 5
00
407 4
00
326 9
00
560 7
00
589 6
00
738 6
00
849 6
90
833 6
13
1 0
84 5
06
1 2
41 3
40
1 0
75
008
1 4
05 0
37
1 8
44 9
53
1 6
46 4
84
1 4
71 1
90
1 1
30 8
83
DE
MA
ND
Pro
cessed
184
100
285
200
380
200
341
800
260
300
337
400
406
900
451
300
615
272
742
104
1 00
5 54
81
134
110
974
901
1 06
3 78
31
298
544
1 48
4 69
21
310
037
917
715
-h
um
an
16
700
24
600
24
200
21
900
28
400
28
800
31
000
31
000
25
913
24
860
25
319
24
323
23
875
25
056
25
005
23
759
22
008
26
011
-an
imal fe
ed
(fu
ll f
at
so
ya)
134
500
199
600
216
600
179
900
109
300
181
800
191
800
150
200
137
407
155
654
118
598
121
763
98
718
147
302
218
973
191
323
135
373
153
174
-cru
sh
(o
il/o
ilcake)
32
900
61
000
139
400
140
000
122
600
126
800
184
100
270
100
451
952
561
590
861
631
988
024
852
308
891
425
1 05
4 56
61
269
610
1 15
2 65
6 7
38 5
31
Wit
hd
raw
n b
y p
rod
ucers
2 4
00 3
000
4 9
00 3
000
4 3
00 4
800
4 3
00 4
100
4 4
63 3
877
1 9
75 2
393
367
1 3
31 5
67 6
76 4
89 2
405
Rele
ased
to
en
d-c
on
su
mers
2 6
00 3
400
1 9
00 9
00 1
200
900
3 7
00 3
400
2 7
57 2
825
2 8
86 2
650
1 0
98 6
08 4
31 3
67 6
58 2
036
Seed
fo
r p
lan
tin
g p
urp
oses
2 6
00 2
400
2 6
00 1
400
3 1
00 5
300
4 9
00 5
200
5 7
00 5
295
5 1
11 7
577
5 6
78 8
795
10
599
7 6
40 7
860
6 6
50
Net
receip
ts(-
)/d
isp
(+)
1 1
00 1
500
300
1 6
00 1
300
3 2
00 1
900
1 6
000
2 3
16 1
924
805
1 4
27-
429
- 23
9 1
107
395
1 0
41
Defi
cit
2 0
00 6
000
0
0
0
00
0
0
2 7
82 0
0
00
8 0
970
1 0
88
Exp
ort
s 3
000
7 0
00
1 0
00 9
00 8
000
153
100
121
700
47
200
152
616
15
390
576
4 6
77 6
745
414
32
810
5 3
36 1
060
38
746
To
tal D
em
an
d 1
97 8
00
303 1
00
390 9
00
349 6
00
278 2
00
504 7
00
543 4
00
512 8
00
780 8
08
771 8
07
1 0
20 8
02
1 1
52 2
12
990 2
16
1 0
74 5
02
1 3
42 7
12
1 5
07 9
15
1 3
20 4
99
969 7
17
En
din
g S
tock (
28 F
eb
) 7
7 7
00
49 5
00
86 6
00
57 8
00
48 7
00
56 0
00
46 2
00
225 8
00
68 8
82
61 8
06
63 7
04
89 1
28
84 7
92
330 5
35
502 2
41
138 5
69
150 6
91
161 1
66
- p
rocessed
p/m
on
th 1
5 30
0 2
3 80
0 3
1 70
0 2
8 50
0 2
1 70
0 2
8 10
0 3
3 90
0 3
7 60
0 5
1 30
0 6
1 84
2 8
3 79
6 9
4 50
9 8
1 24
2 8
8 64
9 1
08 2
12 1
23 7
24 1
19 0
94 7
6 47
7
- m
on
ths' sto
ck
5.1
2.1
2.7
2.0
2.2
2.0
1.4
6.0
1.3
1.0
0.8
0.9
1.0
3.7
4.6
1.1
1.3
2
No
te:
**
* F
igu
res
for
curr
en
t se
aso
n u
p t
o d
ate
***

South African Soybean Crop Quality Report 2019/2020 Season7
Graph 12: Soybeans: CEC Estimate vs SAGIS deliveries over 10 marketing seasons
Graph 13: Soybeans: Imports and Exports over 10 marketing seasons
Graph 14: Soybeans: Consumption and Processed over 10 marketing seasons
Graph 15: Soybeans: Opening and closing stock over 10 marketing seasons
Information provided by SAGIS.
0
200000
400000
600000
800000
1000000
1200000
1400000
1600000
1800000
11/12 12/13 13/14 14/15 15/16 16/17 17/18 18/19 19/20 20/21
Ton
CEC Estimate SAGIS Deliveries
0
50000
100000
150000
200000
250000
300000
11/12 12/13 13/14 14/15 15/16 16/17 17/18 18/19 19/20 20/21
Ton
Imports Exports
0
200000
400000
600000
800000
1000000
1200000
1400000
11/12 12/13 13/14 14/15 15/16 16/17 17/18 18/19 19/20 20/21
Ton
Human consumption Animal full fat Crush
0
100000
200000
300000
400000
500000
600000
11/12 12/13 13/14 14/15 15/16 16/17 17/18 18/19 19/20 20/21
Ton
Opening stock Closing stock

South African Soybean Crop Quality Report 2019/2020 Season8
SeasonSOYBEANS: IMPORTS FOR RSA PER COUNTRY (Tons)
Australia Brazil Ethiopia Malawi Mozambique Nigeria Paraguay Ukraine USA Zambia Zimbabwe Total
2015/16 0 59 998 1 648 862 0 0 59 697 0 0 2 776 0 124 981
2016/17 0 0 3 314 0 0 204 263 576 0 0 4 004 0 271 098
2017/18 0 0 371 3 153 0 0 0 0 0 22 912 1 072 27 508
2018/19 0 0 160 1 953 343 0 0 645 0 3 844 0 6 945
2019/20 343 0 0 2 492 2 151 0 0 0 0 4 112 0 9 098
2020/21 0 55 000 0 1 280 1 623 0 0 0 52 534 4 728 0 115 165
Season
SOYBEANS IMPORTS PER HARBOUR (Tons)
Harbours
East London Durban Cape Town Port Elizabeth Total
2006/07 0 0 10 374 0 10 374
2007/08 0 71 885 31 433 0 103 318
2008/09 0 12 004 0 0 12 004
2009/10 0 0 0 0 0
2010/11 0 0 0 0 0
2011/12 0 163 0 0 163
2012/13 0 344 0 0 344
2013/14 0 2 661 0 98 2 759
2014/15 0 61 705 0 0 61 705
2015/16 0 121 343 0 0 121 343
2016/17 0 267 094 0 0 267 094
2017/18 0 371 0 0 371
2018/19 0 805 0 0 805
2019/20 0 343 0 0 343
2020/21* 0 107 534 0 0 107 534
SeasonSOYBEANS: RSA EXPORTS PER COUNTRY (Tons)
Botswana Lesotho Mozambique Turkey Eswatini Zimbabwe Total
2015/16 220 0 4 457 0 0 0 4 677
2016/17 0 0 2 614 0 0 4 131 6 745
2017/18 4 0 410 0 0 0 414
2018/19 17 0 160 27 660 0 4 973 32 810
2019/20 189 0 291 0 0 4 856 5 336
2020/21 744 9 298 0 7 2 1 060
Season
SOYBEANS EXPORTS PER HARBOUR (Tons)
Harbours
East London Durban Cape Town Port Elizabeth Total
2006/07 0 0 0 0 0
2007/08 0 0 0 0 0
2008/09 0 0 0 0 0
2009/10 0 151 212 0 0 151 212
2010/11 0 121 243 0 0 121 243
2011/12 0 40 633 0 0 40 633
2012/13 0 152 318 0 0 152 318
2013/14 0 15 044 0 0 15 044
2014/15 0 0 0 0 0
2015/16 0 0 0 0 0
2016/17 0 0 0 0 0
2017/18 0 0 0 0 0
2018/19 0 27 660 0 0 27 660
2019/20 0 0 0 0 0
2020/21* 0 0 0 0 0
* Progressive March 2020 - January 2021
* Progressive March 2020 - January 2021Note: Includes Imports for RSA and Other Countries

South African Soybean Crop Quality Report 2019/2020 Season9
OIL
SE
ED
S P
RO
DU
CT
S P
ER
MO
NT
H M
AN
UF
AC
TU
RE
D
Mark
eti
ng
year
Mar
2018 -
Feb
2019
Prog
ress
ive:
12
Mon
ths
Mark
eti
ng
year
Mar
2019 -
Feb
2020
Prog
ress
ive:
12
Mon
ths
Mar
2020
Man
ufac
ture
dTo
ns
Ap
r 2020
Man
ufac
ture
d To
ns
May 2
020
Man
ufac
ture
d To
ns
Ju
n 2
020
Man
ufac
ture
d To
ns
Ju
l 2020
Man
ufac
ture
d To
ns
Au
g 2
020
Man
ufac
ture
d To
ns
Sep
2020
Man
ufac
ture
d To
ns
Oct
2020
Man
ufac
ture
d To
ns
No
v 2
019
Man
ufac
ture
d To
ns
Dec 2
020
Man
ufac
ture
d To
ns
Jan
2021
Man
ufac
ture
d To
ns
Mark
eti
ng
year
Mar
2020 -
Feb
2021
Prog
ress
ive:
11
Mon
ths
Palm
Oil a
nd
Deri
vati
ves
0
0
0
0
0
0
0
0
0
0
0
0
0
0
So
yb
ean
Oil
180 3
25
220 3
07
17
921
17
819
21
620
19
795
17
070
16
395
22
377
20
075
17
283
15
525
12
175
1
98
05
5
Sunfl
ower
Oil
315 4
06
234 5
57
17
896
13
828
25
570
28
315
28
375
28
484
28
410
33
509
33
930
25
941
19
781
2
84
03
9
Co
co
nu
t O
il/ G
rou
nd
nu
t O
il
/ C
an
ola
Oil /
Co
rn (
Maiz
e)
Oil
/ B
len
ds
or
mix
es
of
Oils w
hic
h i
nclu
des o
ne o
f
the a
bo
ve O
ils /
Bio
die
sel
/
Co
tto
nseed
Oil
51 7
80
47 9
10
3 5
81 3
249
3 4
72 4
608
3 6
10 4
161
3 1
03 4
650
5 5
23 4
112
4 2
61
44
33
0
Sunfl
ower
Oilc
ake
379 3
95
276 7
66
20
422
17
956
29
362
32
723
33
257
31
432
31
410
36
909
38
350
28
973
24
563
3
25
35
7
Co
co
nu
t O
ilcake
0
0
0
0
0
0
0
0
0
0
0
0
0
0
Palm
nu
t O
ilcake
0
0
0
0
0
0
0
0
0
0
0
0
0
0
So
yb
ean
O
ilcake /
Can
ola
Oilcake
/ C
ott
on
seed
Oilcake
847 0
62
1 0
22 4
15
76
838
77
603
98
410
93
328
80
868
84
658
102
121
95
313
83
197
75
556
59
870
9
27
76
2
So
yb
ean
Flo
urs
an
d M
eals
/ Textu
red
V
eg
eta
ble
Pro
tein
38 7
79
39 7
85
3 9
41 3
676
3 8
09 3
779
3 5
44 3
445
3 3
97 3
357
2 2
63 1
307
2 7
71
35
28
9
So
yb
ean
Fu
llfa
t
224 2
33
194 2
28
14
285
12
396
13
687
14
375
14
749
13
586
15
321
13
173
10
780
8 9
24 9
130
1
40
40
6
Pean
ut
Bu
tter
an
d P
as
te
29 7
34
28 0
26
3 0
99 2
828
3 2
61 3
305
2 9
45 3
110
3 9
15 3
475
3 1
81 2
655
2 5
89
34
36
3
To
tal
2 0
66 7
14
2 0
63 9
94
1
57
98
3
14
9 3
55
1
99
19
1
20
0 2
28
1
84
41
8
18
5 2
71
2
10
05
4
21
0 4
61
1
94
50
7
16
2 9
93
1
35
14
0 1
98
9 6
01
South African Soybean Crop Quality Report 2019/2020 Season10
OIL
SE
ED
S P
RO
DU
CT
S P
ER
MO
NT
H I
MP
OR
TE
D
Mark
eti
ng
year
Mar
2018 -
Feb
2019
Prog
ress
ive:
12
Mon
ths
Mark
eti
ng
year
Mar
2019 -
Feb
2020
Prog
ress
ive:
12
Mon
ths
Mar
2020
Man
ufac
ture
dTo
ns
Ap
r 2020
Man
ufac
ture
d To
ns
May 2
020
Man
ufac
ture
d To
ns
Ju
n 2
020
Man
ufac
ture
d To
ns
Ju
l 2020
Man
ufac
ture
d To
ns
Au
g 2
020
Man
ufac
ture
d To
ns
Sep
2020
Man
ufac
ture
d To
ns
Oct
2020
Man
ufac
ture
d To
ns
No
v 2
019
Man
ufac
ture
d To
ns
Dec 2
020
Man
ufac
ture
d To
ns
Jan
2021
Man
ufac
ture
d To
ns
Mark
eti
ng
year
Mar
2020 -
Feb
2021
Prog
ress
ive:
11
Mon
ths
Palm
Oil a
nd
Deri
vati
ves
536 9
57
534 4
56
52
663
42
626
4
4 0
07
37
715
48
105
42
488
46
811
51
691
35
277
63
920
18
697
4
84
00
0
So
yb
ean
Oil
116 8
28
90 9
34
8 9
95 4
300
12
486
12
598
5 0
00 1
4 50
4 5
000
13
938
13
150
13
388
9 9
20
11
3 2
79
Sunfl
ower
Oil
143 6
35
244 0
99
18
931
14
862
14
914
2 5
24 1
8 06
0 3
2 71
6 7
199
94
7 1
1 96
9 6
011
6 2
00
13
4 3
33
Co
co
nu
t O
il/ G
rou
nd
nu
t O
il
/ C
an
ola
Oil /
Co
rn (
Maiz
e)
Oil
/ B
len
ds
or
mix
es
of
Oils w
hic
h i
nclu
des o
ne o
f
the a
bo
ve O
ils /
Bio
die
sel
/
Co
tto
nseed
Oil
15 8
91
14 3
86
99
9 1
232
3 0
33 1
153
60
0
40
1 1
63
77
7 1
084
93
8
805
11
82
4
Sunfl
ower
Oilc
ake
48 7
77
118 7
91
0
6 7
83
0
0
0 0
0
0
0
0
0
6
78
3
Co
co
nu
t O
ilcake
0
0
0
0
0
0
0
0
0
0
0
0
0
0
Palm
nu
t O
ilcake
0
0
0
0
0
0
0
0
0
0
0
0
0
0
So
yb
ean
O
ilcake /
Can
ola
Oilcake
/ C
ott
on
seed
Oilcake
358 8
50
463 4
78
11
028
55
828
32
525
6 9
16 5
8 78
0 1
9 08
7 1
7 01
8 7
3 15
4 3
0 14
8
57 5
0 31
8
35
4 8
59
So
yb
ean
Flo
urs
an
d M
eals
/ Textu
red
V
eg
eta
ble
Pro
tein
0
0
0
0
0
0
0
0
0
0
0
0
0
0
So
yb
ean
Fu
llfa
t
0
0
0
0
0
0
0
0
0
0
0
0
0
0
Pean
ut
Bu
tter
an
d P
as
te
1 0
35
1 3
91
14
8
110
54
0
19
5
75
0
0
265
19
7
55
1 0
99
To
tal
1 2
21 9
73
1 4
67 5
35
9
2 7
64
1
25
74
1
10
7 0
19
6
0 9
06
1
30
74
0
10
8 9
10
7
7 1
91
1
40
50
7
91
89
3
84
511
8
5 9
95
1 1
06
17
7

South African Soybean Crop Quality Report 2019/2020 Season11
OIL
SE
ED
S P
RO
DU
CT
S P
ER
MO
NT
H E
XP
OR
TE
D
Mark
eti
ng
year
Mar
2018 -
Feb
2019
Prog
ress
ive:
12
Mon
ths
Mark
eti
ng
year
Mar
2019 -
Feb
2020
Prog
ress
ive:
12
Mon
ths
Mar
2020
Man
ufac
ture
dTo
ns
Ap
r 2020
Man
ufac
ture
d To
ns
May 2
020
Man
ufac
ture
d To
ns
Ju
n 2
020
Man
ufac
ture
d To
ns
Ju
l 2020
Man
ufac
ture
d To
ns
Au
g 2
020
Man
ufac
ture
d To
ns
Sep
2020
Man
ufac
ture
d To
ns
Oct
2020
Man
ufac
ture
d To
ns
No
v 2
019
Man
ufac
ture
d To
ns
Dec 2
020
Man
ufac
ture
d To
ns
Jan
2021
Man
ufac
ture
d To
ns
Mark
eti
ng
year
Mar
2020 -
Feb
2021
Prog
ress
ive:
11
Mon
ths
Palm
Oil a
nd
Deri
vati
ves
15 7
71
16 0
78
94
8
647
1 0
66 1
656
1 6
47 1
236
1 3
96 1
027
78
5
821
63
3
11
86
2
So
yb
ean
Oil
29 4
59
17 6
19
2 9
78 6
523
7
04
7 3
538
3 8
19 2
847
4 3
13 1
268
1 8
06 2
253
5 7
86
42
17
8
Sunfl
ower
Oil
2 1
69
3 0
67
15
0
70
22
7
271
46
4
434
58
8
254
28
1
234
13
6
3 1
09
Co
co
nu
t O
il/ G
rou
nd
nu
t O
il
/ C
an
ola
Oil /
Co
rn (
Maiz
e)
Oil
/ B
len
ds
or
mix
es
of
Oils w
hic
h i
nclu
des o
ne o
f
the a
bo
ve O
ils /
Bio
die
sel
/
Co
tto
nseed
Oil
9
77
9
33
45
1
288
22
8
791
36
9
876
91
1
544
57
7
720
31
6
6 0
71
Sunfl
ower
Oilc
ake
3 4
64
3 0
06
98
13
5
160
16
0
170
13
6
130
10
0
102
10
0
150
1
44
1
Co
co
nu
t O
ilcake
0
0
0
0
0
0
0
0
0
0
0
0
0
0
Palm
nu
t O
ilcake
0
0
0
0
0
0
0
0
0
0
0
0
0
0
So
yb
ean
O
ilcake /
Can
ola
Oilcake
/ C
ott
on
seed
Oilcake
11 4
20
10 5
20
1 1
31
588
87
9
907
1 1
17
697
1 0
20 1
751
1 3
48 1
096
24
6
10
78
0
So
yb
ean
Flo
urs
an
d M
eals
/
Textu
red
Veg
eta
ble
Pro
tein
1 8
02
4 1
08
23
5
262
37
5
0
204
20
4
918
64
6
703
57
8
870
4
99
5
So
yb
ean
Fu
llfa
t
7 1
20
2 7
23
19
6
235
16
3
34
204
96
27
2
544
29
8
164
33
5
2 5
41
Pean
ut
Bu
tter
an
d P
as
te
821
2
74
26
27
23
16
23
19
19
17
24
2
12
2
08
To
tal
73 0
03
58 3
28
6
21
3
8 7
75
1
0 1
68
7
37
3
8 0
17
6
54
5
9 5
67
6
15
1
5 9
24
5
96
8
8 4
84
8
3 1
85

South African Soybean Crop Quality Report 2019/2020 Season12
RSA Production RegionsThe RSA is divided into 9 provinces as illustrated in Figure 1.
! !
!
!
!
!
!
!
!
!
!
Maputo
Durban
Maseru
Mbabane
Gaborone
Pretoria
Cape Town
Johannesburg
Bloemfontein
Port Elizabeth
Pietermaritzburg
Namibia
Botswana Mozambique
Lesotho
Zimbabwe
Swaziland
Northern Cape
Limpopo
Eastern Cape
Free State
Western Cape
North West
KwaZulu-Natal
Mpumalanga
Gauteng
µ
Legend
Provincial Boundaries
Figure 1: RSA Provinces
Provincial map with gratitude to SIQ.
The 9 provinces are divided into 36 grain production regions.
The regions are distributed as follows:Region 1: NamakwalandRegions 2 to 4: SwartlandRegions 5 and 6: RûensRegions 7 and 8: Eastern CapeRegion 9: KarooRegion 10: Griqualand WestRegion 11: VaalhartsRegions 12 to 20: North WestRegions 21 to 28: Free StateRegions 29 to 33: MpumalangaRegion 34: GautengRegion 35: LimpopoRegion 36: KwaZulu-Natal
Please see the Crop Production Regions map on the next page.
The production regions from which soybeans have been received for the crop quality survey of the 2019/20 production season, are named and described on pages 22 to 25. All the silo/intake stands as well as the type of storage structure, situated in a particular region, are provided.

South African Soybean Crop Quality Report 2019/2020 Season13
Fig
ure
2:
RS
A C
rop
Pro
du
ctio
n R
eg
ion
s
Reg
iona
l map
with
gra
titud
e to
Agb
iz G
rain
and
SiQ
.

South African Soybean Crop Quality Report 2019/2020 Season14
Soybean Crop Quality 2019/20 – Summary of resultsSeventy-three percent (109) of the 150 samples analysed for the purpose of this survey were graded as Grade SB1, while 41 (27%) of the samples were downgraded to COSB (Class Other Soya Beans). During the previous two seasons, 11% (2018/19) and 13% (2017/18) of the samples were downgraded to COSB.
• Four of the 41 samples were downgraded as a result of the percentage other grain exceeding the maximum permissible deviation of 0.5%.
• Eight of the samples were downgraded as a result of the percentage defective soybeans on the 4.75 mm round-hole sieve exceeding the maximum permissible deviation of 10%.
• Fifteen samples were downgraded as a result of the percentage soiled soybeans present in the samples exceeding the maximum permissible deviation of 10%.
• Six samples were downgraded as a result of the number of Datura sp. poisonous seeds present exceeding the maximum permissible number of 1 per 1000 g.
• The remaining eight samples were downgraded as a result of a combination of one or more of the following deviations exceeding the maximum permissible deviation: foreign matter, other grain, sunflower seed, stones, defective soybeans above the 4.75 mm sieve, soiled soybeans and poisonous seeds (Datura and Ipomoea purpurea Roth.)
Wet pods were not present in any of the 150 samples received and graded.
The percentage samples containing sclerotia from the fungus Sclerotinia sclerotiorum, increased from 27% (41 samples) in the previous season to 41% (62 samples) this season. In the 2017/18 season, 88 samples (59%) contained sclerotia. The three highest percentages sclerotia, 1.10%, 0.60% and 0.30% were all observed on samples originating in Mpumalanga. As a matter of fact, 52% of the samples that contained sclerotia originated in Mpumalanga. All these percentages sclerotia found to be present in the samples are however still well below the maximum permissible level of 4%. The national weighted average percentage this season was 0.06% compared to the 0.03% of the previous season. See Graph 16.
Graph 16: Average percentage sclerotia per province over five seasons
0.00
0.02
0.04
0.06
0.08
0.10
0.12
0.14
0.16
0.18
%
2015/16
2016/17
2017/18
2018/19
2019/20
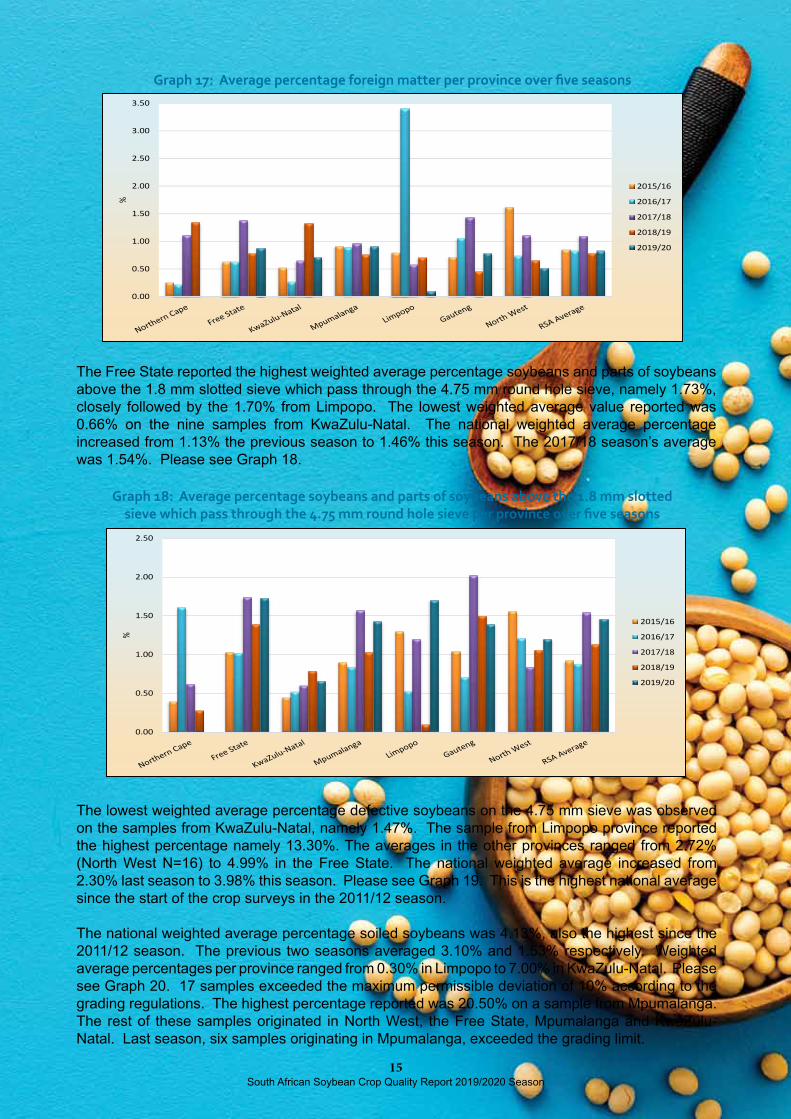
The samples received from Mpumalanga province (65 samples) had the highest percentage foreign matter (0.91%), followed closely by the 0.88% weighted average of the 51 samples from the Free State regions. The percentage foreign matter in the rest of the samples ranged from 0.10% in the sample from Limpopo to 0.79% in Gauteng (8 samples). The national weighted average of 0.83% was in line with previous seasons. Please refer to Graph 17.
South African Soybean Crop Quality Report 2019/2020 Season15
Graph 18: Average percentage soybeans and parts of soybeans above the 1.8 mm slotted
sieve which pass through the 4.75 mm round hole sieve per province over five seasons
The Free State reported the highest weighted average percentage soybeans and parts of soybeans above the 1.8 mm slotted sieve which pass through the 4.75 mm round hole sieve, namely 1.73%, closely followed by the 1.70% from Limpopo. The lowest weighted average value reported was 0.66% on the nine samples from KwaZulu-Natal. The national weighted average percentage increased from 1.13% the previous season to 1.46% this season. The 2017/18 season’s average was 1.54%. Please see Graph 18.
0.00
0.50
1.00
1.50
2.00
2.50
%
2015/16
2016/17
2017/18
2018/19
2019/20
Graph 17: Average percentage foreign matter per province over five seasons
The lowest weighted average percentage defective soybeans on the 4.75 mm sieve was observed on the samples from KwaZulu-Natal, namely 1.47%. The sample from Limpopo province reported the highest percentage namely 13.30%. The averages in the other provinces ranged from 2.72% (North West N=16) to 4.99% in the Free State. The national weighted average increased from 2.30% last season to 3.98% this season. Please see Graph 19. This is the highest national average since the start of the crop surveys in the 2011/12 season.
The national weighted average percentage soiled soybeans was 4.13%, also the highest since the 2011/12 season. The previous two seasons averaged 3.10% and 1.53% respectively. Weighted average percentages per province ranged from 0.30% in Limpopo to 7.00% in KwaZulu-Natal. Please see Graph 20. 17 samples exceeded the maximum permissible deviation of 10% according to the grading regulations. The highest percentage reported was 20.50% on a sample from Mpumalanga. The rest of these samples originated in North West, the Free State, Mpumalanga and KwaZulu-Natal. Last season, six samples originating in Mpumalanga, exceeded the grading limit.
0.00
0.50
1.00
1.50
2.00
2.50
3.00
3.50
%
2015/16
2016/17
2017/18
2018/19
2019/20

South African Soybean Crop Quality Report 2019/2020 Season16
0.00
2.00
4.00
6.00
8.00
10.00
12.00
14.00
%
2015/16
2016/17
2017/18
2018/19
2019/20
Graph 20: Average percentage soiled soybeans per province over five seasons
Test weight does not form part of the grading regulations for soybeans in South Africa. An approximation of the test weight of South African soybeans is provided in Table 2 for information purposes. The standard working procedure of the Kern 222 instrument, as described in ISO 7971-3:2019, was followed. The g/1 L filling mass of the soybean samples was determined and divided by two. The test weight was then extrapolated by means of the following formulas obtained from the Test Weight Conversion Chart for Soybean of the Canadian Grain Commission: y = 0.1898x + 2.2988 (291 to 350 g/0.5 L) and y = 0.1895x + 2.3964 (351 to 410 g/0.5 L). Please see Graph 21 for a comparison of the test weight per province over the last five seasons.
Table 2: Approximation of test weight per province over three seasons
Province
Test weight, kg/hl
2019/20 Season 2018/19 Season 2017/18 Season
Weighted
averageRange
No. of
samples
Weighted
averageRange
No. of
samples
Weighted
averageRange
No. of
samples
Northern Cape (Regions 10 - 11) - - - 72.2 - 1 71.4 70.2 - 72.5 2
Free State (Regions 21 - 28) 72.5 70.3 - 74.4 51 71.9 69.4 - 74.2 42 70.6 67.2 - 73.6 *44
KwaZulu-Natal (Region 36) 71.1 70.0 - 72.3 9 70.1 68.2 - 72.4 12 70.7 70.0 - 71.6 9
Mpumalanga (Regions 29 - 33) 72.4 70.2 - 74.0 *64 71.4 67.8 - 74.6 73 71.0 68.2 - 72.5 71
Limpopo (Region 35) 71.5 - 1 70.5 68.9 - 73.2 3 71.6 71.4 - 72.1 4
Gauteng (Region 34) 72.1 71.0 - 73.2 8 72.5 71.7 - 73.8 12 71.5 70.3 - 74.0 11
North West (Region 12 - 20) 71.8 68.7 - 73.3 16 72.0 72.1 - 73.5 **5 70.4 69.0 - 72.5 8
RSA 72.3 68.7-74.4 149 71.5 67.8-74.6 148 70.9 67.2-74.0 149
Graph 19: Average percentage defective soybeans on the 4.75 mm round hole
sieve per province over five seasons
0.00
1.00
2.00
3.00
4.00
5.00
6.00
7.00
8.00
%
2015/16
2016/17
2017/18
2018/19
2019/20
* One sample with an outlier value was not taken into account for calculation purposes.
**Two samples with outlier values were not taken into account for calculation purposes.

South African Soybean Crop Quality Report 2019/2020 Season17
68.5
69.0
69.5
70.0
70.5
71.0
71.5
72.0
72.5
73.0
kg/hl
2015/16
2016/17
2017/18
2018/19
2019/20
Graph 21: Comparison of the test weight per province over five seasons
Table 3: Comparison of weighted average nutritional component values on
a dry and ‘as is’ basis over five seasonsSeason 2019/20 2018/19 2017/18 2016/17 2015/16
Moisture, % (17hr, 103°C) 7.2 7.0 7.4 7.4 7.4
Moisture basis Dry basis As is Dry basis As is Dry basis As is Dry basis As is Dry basis As is
Crude protein, % 39.99 37.12 40.43 37.60 40.18 37.40 40.15 37.20 40.22 37.22
Crude fat, % 18.0 16.7 19.1 17.8 19.3 18.0 19.8 18.5 19.4 17.9
Crude fibre, % 7.0 6.5 6.8 6.3 5.9 5.5 5.9 5.4 7.3 6.8
Ash, % 4.63 4.19 4.67 4.34 4.59 4.27 4.58 4.24 4.61 4.27
No.ofsamples 150 150 150 150 150
The nutritional component analyses, namely crude protein, - fat, - fibre and ash are reported on a dry/moisture-free basis (db) for the current as well as the previous surveys. For comparison purposes the national average ‘as is’ or wet basis results for the last five seasons are provided in Table 3. These ‘as is’ average values were calculated by converting each individual value from dry basis to ‘as is’.
The weighted average crude protein content this season was 39.99% compared to the 40.43% of the previous season. As in the previous three seasons, Limpopo had the highest weighted average crude protein content (41.58%). North West (39.08%) and Gauteng (39.55%) reported the lowest averages. The weighted average crude fat percentage of 18.0% was the lowest since the 2011/12 season. The samples from KwaZulu-Natal had (as in the previous season) the highest weighted average crude fat content, namely 20.0%. The lowest average fat contents were observed in the Limpopo and Free State provinces, with 16.6% and 17.5% respectively.
The weighted average percentage crude fibre varied from 6.2% in Gauteng to 7.5% in the Free State. The RSA weighted average, 7.0%, was the second highest of the annual surveys since the 7.3% reported in the 2015/16 season. A small variation of only 0.09% is observed with regards to the national weighted average ash content over the nine seasons that this survey has been conducted. This season, the average ash content was 4.63%. Last season this value was 4.67% and the highest of the nine seasons since 2011/12.
Graphs 22 to 25 on page 18 provide comparisons between provinces over seasons for the nutritional components mentioned above.

South African Soybean Crop Quality Report 2019/2020 Season18
Graph 22: Average crude protein content per province over five seasons
Graph 23: Average crude fat content per province over five seasons
Graph 24: Average crude fibre content per province over five seasons
38.00
38.50
39.00
39.50
40.00
40.50
41.00
41.50
42.00
% db
2015/16
2016/17
2017/18
2018/19
2019/20
16.0
16.5
17.0
17.5
18.0
18.5
19.0
19.5
20.0
20.5
21.0
21.5
22.0
% db
2015/16
2016/17
2017/18
2018/19
2019/20
4.40
4.60
4.80
5.00
5.20
5.40
% db
2015/16
2016/17
2017/18
2018/19
2019/20
Graph 25: Average ash content per province over five seasons
5.0
5.5
6.0
6.5
7.0
7.5
8.0
% db
2015/16
2016/17
2017/18
2018/19
2017/2018

South African Soybean Crop Quality Report 2019/2020 Season19
The 2019/20 season is the second season that the SAGL conducted the moisture, crude protein and crude fat analyses on the ARC Grain Crops soybean cultivar trials’ samples. Please see a comparison of the results between the crop survey and cultivar samples in Table 4.
Table 4: Comparison between the moisture, crude protein and crude fat
results of the soybean crop quality and ARC cultivar trial samples of the
2019/20 season
AnalysisMoisture, %
(17hr, 103°C)
Crude
Protein, %
(db)
Crude
Protein, %
(as is)
Crude Fat, %
(db)
Crude Fat, %
(as is)
Soybean Crop Quality Survey results
Average 7.2 39.99 37.12 18.0 16.7
Minimum 6.4 33.81 31.54 15.4 14.3
Maximum 10.0 43.70 40.68 22.1 20.4
Standard Deviation 0.64 1.42 1.32 1.20 1.11
No.ofsamples 150 150 150 150 150
ARC Grain Crops Cultivar trial sample results
Average 7.8 40.87 37.68 19.9 18.4
Minimum 6.9 38.47 35.33 15.8 14.6
Maximum 8.8 44.87 41.33 23.5 21.7
Standard Deviation 0.51 1.25 1.15 1.96 1.84
No.ofsamples 84 84 84 84 84
% Difference between crop and cultivar
samples
-0.6 -0.88 -0.56 -1.9 -1.7
All fifteen samples tested for genetic modification (GM), tested positive for the presence of the CP4 EPSPS trait (Roundup Ready®). Please refer to the results in Table 5 on page 20 of this report.
A summary of the RSA Soybean Crop Quality averages of the 2019/20 season compared to those of the 2018/19 season, is provided in Table 6 on page 21.
Please see pages 26 to 33 for the average soybean quality per region.

South African Soybean Crop Quality Report 2019/2020 Season20
Genetic Modification (GM)The majority of soybeans produced/grown in South Africa is genetically modified, an estimated 95% of the area planted to soybeans in South Africa was GM. These soybeans have tolerance to herbicides (chemical products used to destroy weeds, but not the crop plants). Globally, GM soybeans occupy approximately 80% of the total soybean area planted.
The SAGL screened 15 of the crop samples to test for the presence of CP4 EPSPS (Roundup Ready®).
The crop quality samples received by the SAGL are composite samples per class and grade, made up of individual deliveries to grain silos.
SAGL used the EnviroLogix QuickComb kit for bulk soybeans to quantitatively determine the presence of genetically modified soybeans.
All the screened samples tested positive for the presence of the CP4 EPSPS (RR1/RR2) protein.
The sensitivity of the measurements using the above-mentioned kit is 0.25%, i.e., one Roundup Ready soybean in 400 conventional soybeans. The limit of detection (LOD) for measurements of the CP4 EPSPS protein is 0.125%. The highest measurement that can be quantified is 3%. Values higher than 3% is reported as >3.0%.
Table 5: GM results for the 2019/20 season
REGION Class and grade CP4 EPSPS, %
14 COSB >3.020 COSB >3.021 SB1 >3.022 SB1 >3.024 SB1 >3.026 COSB >3.028 SB1 >3.029 SB1 >3.030 SB1 >3.031 SB1 >3.032 SB1 >3.033 SB1 >3.034 SB1 >3.035 COSB >3.036 SB1 >3.0
Average of samples >3.0Number of samples 15
South African Soybean Crop Quality Report 2019/2020 Season21
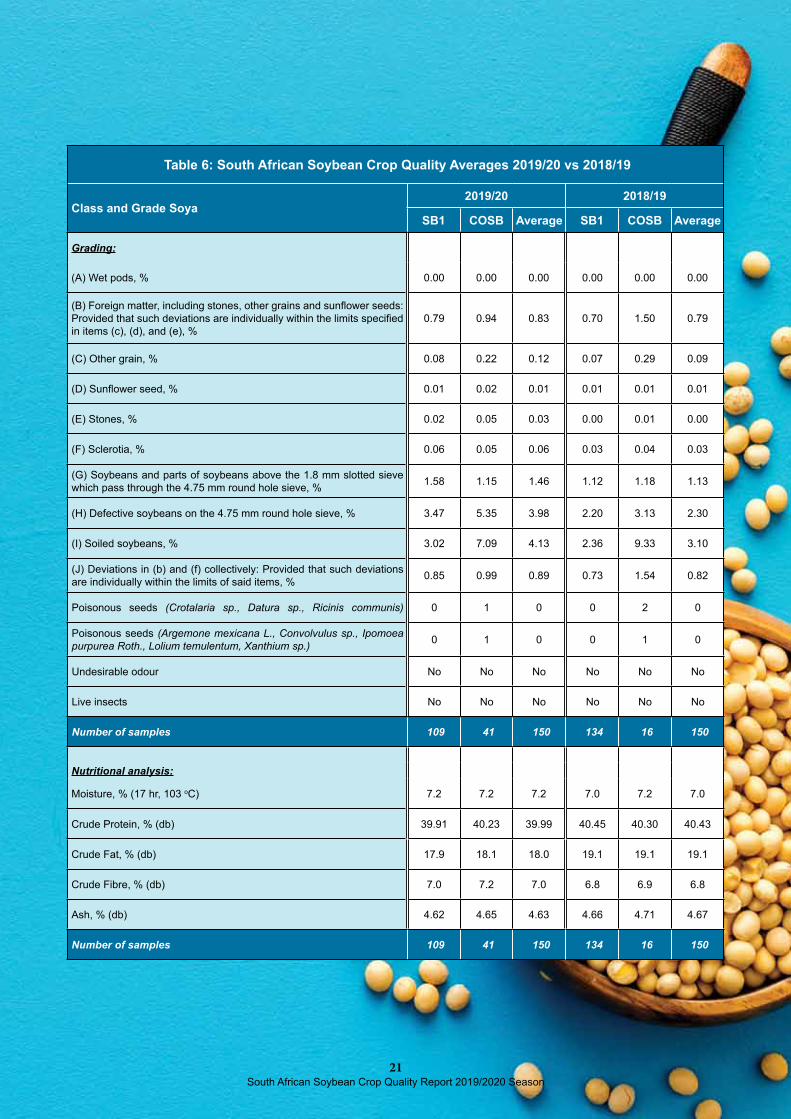
Table 6: South African Soybean Crop Quality Averages 2019/20 vs 2018/19
Class and Grade Soya2019/20 2018/19
SB1 COSB Average SB1 COSB Average
Grading:
(A) Wet pods, % 0.00 0.00 0.00 0.00 0.00 0.00
(B) Foreign matter, including stones, other grains and sunflower seeds: Provided that such deviations are individually within the limits specified in items (c), (d), and (e), %
0.79 0.94 0.83 0.70 1.50 0.79
(C) Other grain, % 0.08 0.22 0.12 0.07 0.29 0.09
(D) Sunflower seed, % 0.01 0.02 0.01 0.01 0.01 0.01
(E) Stones, % 0.02 0.05 0.03 0.00 0.01 0.00
(F) Sclerotia, % 0.06 0.05 0.06 0.03 0.04 0.03
(G) Soybeans and parts of soybeans above the 1.8 mm slotted sieve which pass through the 4.75 mm round hole sieve, % 1.58 1.15 1.46 1.12 1.18 1.13
(H) Defective soybeans on the 4.75 mm round hole sieve, % 3.47 5.35 3.98 2.20 3.13 2.30
(I) Soiled soybeans, % 3.02 7.09 4.13 2.36 9.33 3.10
(J) Deviations in (b) and (f) collectively: Provided that such deviations are individually within the limits of said items, % 0.85 0.99 0.89 0.73 1.54 0.82
Poisonous seeds (Crotalaria sp., Datura sp., Ricinis communis) 0 1 0 0 2 0
Poisonous seeds (Argemone mexicana L., Convolvulus sp., Ipomoea
purpurea Roth., Lolium temulentum, Xanthium sp.)0 1 0 0 1 0
Undesirable odour No No No No No No
Live insects No No No No No No
Number of samples 109 41 150 134 16 150
Nutritional analysis:
Moisture, % (17 hr, 103 oC) 7.2 7.2 7.2 7.0 7.2 7.0
Crude Protein, % (db) 39.91 40.23 39.99 40.45 40.30 40.43
Crude Fat, % (db) 17.9 18.1 18.0 19.1 19.1 19.1
Crude Fibre, % (db) 7.0 7.2 7.0 6.8 6.9 6.8
Ash, % (db) 4.62 4.65 4.63 4.66 4.71 4.67
Number of samples 109 41 150 134 16 150

South African Soybean Crop Quality Report 2019/2020 Season22
Grain Production RegionsSilo/Intake stands per region indicating type of storage structure
Region 12: North-West Western Region
NWK Blaauwbank (Bins) NWK Mareetsane (Bins)
NWK Buhrmannsdrif (Bins) Suidwes Landbou Kameel (Bins)
NWK Kameel (Bins) Suidwes Landbou Vryburg (Bins)
Region 13: North-West Central Region (Sannieshof)
NWK Biesiesvlei (Bins) NWK Oppaslaagte (Bins)
NWK Bossies (Bins) NWK Sannieshof (Bins)
NWK Gerdau (Bins)
Region 14: North-West Southern Region
NWK Barberspan (Bins) NWK Taaibospan (Bins)
NWK Delareyville (Bins) Suidwes Landbou Amalia (Bins)
NWK Excelsior (Bins) Suidwes Landbou Hallatshope (Bins)
NWK Geysdorp (Bins) Suidwes Landbou Migdol (Bins)
NWK Migdol (Bins) Suidwes Landbou Schweizer-Reneke (Bins)
NWK Nooitgedacht (Bins)
Region 16: North-West Central Eastern Region
Senwes Klerksdorp (Bins) Suidwes Landbou Makwassie (Bins)
Senwes Regina (Bins) Suidwes Landbou Strydpoort (Bins)
Suidwes Bamboesspruit (Bins) Suidwes Landbou Wolmaranstad (Bins)
Suidwes Leeudoringstad (Bins)
Region 18: North-West Central Region (Ventersdorp)
NWK Bodenstein (Bins) Senwes Makokskraal (Bins)
NWK Coligny (Bins) Senwes Potchefstroom (Bins)
Senwes Buckingham (Bins) Senwes Ventersdorp Silo A (Bins)
Senwes Enselspruit (Bins) Senwes Ventersdorp Silo B (Bins)
Region 19: North-West Central Region (Lichtenburg)
Afgri Lichtenburg Bunker NWK Lottie Halte (Bins)
NWK Grootpan 1 (Bins) NWK Lusthof (Bins)
NWK Grootpan 2 (Bins) NWK Lichtenburg Silo 3 (Bins)
NWK Halfpad (Bins) NWK Lichtenburg Silo 5 (Bins)
NWK Hibernia (Bins) NWK Mafikeng (Bins)
Region 20: North-West Eastern Region
Afgri Battery (Bins) NWK Derby (Bins)
Afgri Brits (Bins) NWK Koster (Bins)
Afgri Beestekraal (Bunkers) NWK Swartruggens (Bins)
NWK Boons (Bins) NWK Syferbult (Bins)

South African Soybean Crop Quality Report 2019/2020 Season23
Grain Production RegionsSilo/Intake stands per region indicating type of storage structure
Region 21: Free State North-Western Region (Viljoenskroon)
Senwes Attie (Bins) Senwes Vierfontein (Bins)
Senwes Groenebloem (Bins) Senwes Viljoenskroon (Bins)
Senwes Heuningspruit (Bins) Senwes Vredefort (Bins)
Senwes Koppies (Bins) Senwes Weiveld (Bins)
Senwes Rooiwal (Bins)
Region 22: Free State North-Western Region (Bothaville)
Senwes Allanridge (Bins) Senwes Schoonspruit (Bins)
Senwes Bothaville Silo A (Bins) Senwes Schuttesdraai (Bins)
Senwes Bothaville Silo B (Bins) Suidwes Landbou Bothaville depot (Bins)
Senwes Mirage (Bins) Suidwes Landbou Misgunst (Bunkers)
Senwes Odendaalsrus (Bins)
Region 23: Free State North-Western Region (Bultfontein)
Senwes Bultfontein (Bins) Senwes Tierfontein (Bins)
Senwes Losdoorns (Bins) Senwes Wesselsbron (Bins)
Senwes Protespan (Bins) Senwes Willemsrus (Bins)
Region 24: Free State Central Region
Senwes Bloemfontein (Bins) Senwes Petrusburg (Bins)
Senwes Brandfort (Bins) Senwes Theunissen (Bins)
Senwes De Brug (Bins) Senwes Van Tonder (Bins)
Senwes Geneva (Bins) Senwes Welgeleë (Bins)
Senwes Hennenman (Bins) Senwes Winburg (Bins)
Senwes Kroonstad (Bins)
Region 25: Free State South-Western Region
Afgri Bethlehem (Bins) OVK Marseilles (Bins)
Afgri Slabberts (Bins) OVK Modderpoort (Bins)
OVK Clocolan (Bins) OVK Tweespruit (Bins)
OVK Ficksburg (Bins) OVK Westminster (Bins)
OVK Fouriesburg (Bins)
Region 26: Free State South-Eastern Region
Afgri Kaallaagte (Bins) Afgri Monte Video (Bins)
Afgri Libertas (Bins) Afgri Senekal (Bins)
Afgri Marquard (Bins) Senwes Arlington (Bins)
Afgri Meets (Bins) Senwes Steynsrus (Bins)
Region 27: Free State Northern Region
Senwes Gottenburg (Bins) Senwes Mooigeleë (Bins)
Senwes Heilbron (Bins) Senwes Wolwehoek (Bins)
Senwes Hoogte Grainlink (Bins) VKB Petrus Steyn (Bins)

South African Soybean Crop Quality Report 2019/2020 Season24
Grain Production RegionsSilo/Intake stands per region indicating type of storage structure
Region 28: Free State Eastern Region
Afgri Afrikaskop (Bins/Bunkers) VKB Jim Fouché (Bins)
Afgri Eeram (Bins) VKB Memel (Bins)
Afgri Harrismith (Bins) VKB Reitz (Bins)
Afgri Kransfontein (Bins/Bunkers) VKB Tweeling (Bins)
VKB Ascent (Bins) VKB Villiers (Bins/Bulk)
VKB Cornelia (Bins) VKB Vrede (Bins)
VKB Daniëlsrus (Bins) VKB Warden (Bins)
VKB Frankfort (Bins) VKB Windfield (Bins)
Region 29: Mpumalanga Southern Region
Afgri Balfour (Bins) Afgri Leeuspruit (Bins)
Afgri Greylingstad (Bins) Afgri Platrand (Bins)
Afgri Grootvlei (Bins) Afgri Standerton (Bins)
Afgri Harvard (Bins) Afgri Val (Bins)
Afgri Holmdene (Bins)
Region 30: Mpumalanga Eastern Region
Afgri Amersfoort (Bins) Afgri Lothair (Bins)
Afgri Carolina (Bins) Afgri Maizefield (Bins)
Afgri Davel (Bins) Afgri Morgenzon (Bins)
Afgri Eerstelingsfontein (Bunkers) Afgri Overvaal (Bins)
Afgri Ermelo (Bins) Afgri Sandspruit (Bunkers)
Afgri Estancia (Bins) TWK Mkondo (Bins)
Afgri Hendriksvallei (Bunkers) TWK Panbult (Bins)
Region 31: Mpumalanga Central Region
Afgri Bakenlaagte (Bunkers) Afgri Leslie (Bins)
Afgri Bethal (Bins) Afgri Palmietfontein (Bunkers)
Afgri Brakfontein (Bunkers) Afgri Trichardt (Bins)
Afgri Devon (Bins) Afgri Vaalkrantz (Bunkers)
Afgri Kinross (Bins/Bunkers)
Region 32: Mpumalanga Western Region
Afgri Argent (Bins/Bunkers) Afgri Hawerklip (Bins)
Afgri Dryden (Bins) Afgri Kendal (Bins)
Afgri Eloff (Bins) Afgri Ogies (Bins)
Afgri Endicott (Bins) Afgri Vlakfontein (Bunkers)
Region 33: Mpumalanga Northern Region
Afgri Arnot (Bins) Afgri Middelburg (Bins)
Afgri Driefontein (Bins) Afgri Pan (Bins)
Afgri Lydenburg (Bins) Afgri Stoffberg (Bins)
Afgri Marble Hall (Bins) Afgri Wonderfontein (Bins)

South African Soybean Crop Quality Report 2019/2020 Season25
Grain Production RegionsSilo/Intake stands per region indicating type of storage structure
Region 34: Gauteng Region
Afgri Bloekomspruit (Bins) Afgri Nigel (Bins)
Afgri Bronkhorstspruit (Bins) Afgri Pretoria Wes (Bins)
Afgri Glenroy (Bins) Afgri Vogelvallei (Bunkers)
Afgri Goeie Hoek (Bins) Senwes Middelvlei (Bins)
Afgri Kaalfontein (Bins) Senwes Oberholzer (Bins)
Afgri Kliprivier (Bunkers) Senwes Raathsvlei (Bins)
Afgri Meyerton (Bunkers)
Region 35: Limpopo Region
Afgri Northam (Bins) VKB Nylstroom (Modimolle) (Bins)
VKB Alma (Bins) VKB Potgietersrus (Mokopane) (Bins)
VKB Lehau (Bins) VKB Roedtan (Bins)
VKB Naboomspruit (Mookgophong) (Bins) VKB Settlers (Bins)
VKB Nutfield (Bins) VKB Warmbad (Bela-Bela) (Bins)
Region 36: KwaZulu-Natal Region
Afgri Bergville (Bins/Bunkers) Afgri Mizpah (Bins)
Afgri Bloedrivier (Bins) Afgri Paulpietersburg (Bins)
Afgri Chelmsford Dam (Bunkers) Afgri Pietermaritzburg (Bins)
Afgri Dannhauser (Bins) Afgri Vryheid (Bins)
Afgri Dundee (Bins) Afgri Winterton (Bins/Bunkers)
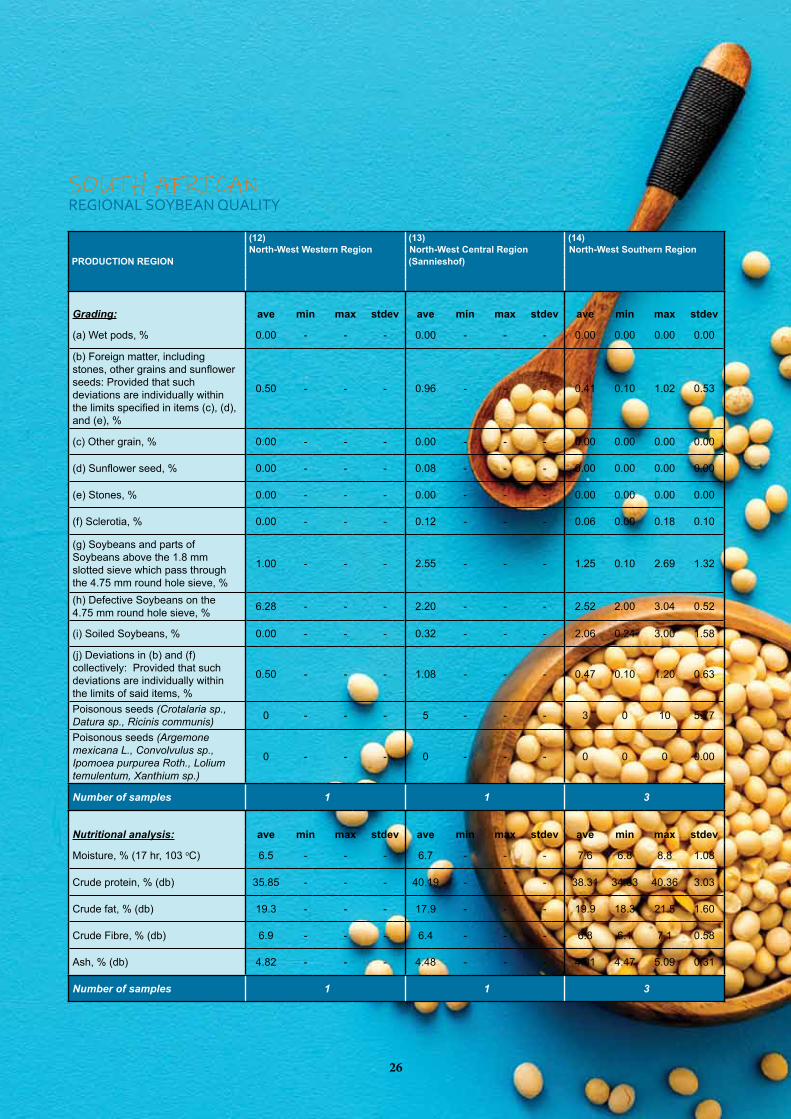
South African Soybean Crop Quality Report 2019/2020 Season26
SOUTH AFRICANREGIONAL SOYBEAN QUALITY
PRODUCTION REGION
(12) (13) (14)
North-West Western Region North-West Central Region North-West Southern Region
(Sannieshof)
Grading: ave min max stdev ave min max stdev ave min max stdev
(a) Wet pods, % 0.00 - - - 0.00 - - - 0.00 0.00 0.00 0.00
(b) Foreign matter, including stones, other grains and sunflower seeds: Provided that such deviations are individually within the limits specified in items (c), (d), and (e), %
0.50 - - - 0.96 - - - 0.41 0.10 1.02 0.53
(c) Other grain, % 0.00 - - - 0.00 - - - 0.00 0.00 0.00 0.00
(d) Sunflower seed, % 0.00 - - - 0.08 - - - 0.00 0.00 0.00 0.00
(e) Stones, % 0.00 - - - 0.00 - - - 0.00 0.00 0.00 0.00
(f) Sclerotia, % 0.00 - - - 0.12 - - - 0.06 0.00 0.18 0.10
(g) Soybeans and parts of Soybeans above the 1.8 mm slotted sieve which pass through the 4.75 mm round hole sieve, %
1.00 - - - 2.55 - - - 1.25 0.10 2.69 1.32
(h) Defective Soybeans on the 4.75 mm round hole sieve, % 6.28 - - - 2.20 - - - 2.52 2.00 3.04 0.52
(i) Soiled Soybeans, % 0.00 - - - 0.32 - - - 2.06 0.24 3.00 1.58
(j) Deviations in (b) and (f) collectively: Provided that such deviations are individually within the limits of said items, %
0.50 - - - 1.08 - - - 0.47 0.10 1.20 0.63
Poisonous seeds (Crotalaria sp.,
Datura sp., Ricinis communis)0 - - - 5 - - - 3 0 10 5.77
Poisonous seeds (Argemone
mexicana L., Convolvulus sp.,
Ipomoea purpurea Roth., Lolium
temulentum, Xanthium sp.)
0 - - - 0 - - - 0 0 0 0.00
Number of samples 1 1 3
Nutritional analysis: ave min max stdev ave min max stdev ave min max stdev
Moisture, % (17 hr, 103 oC) 6.5 - - - 6.7 - - - 7.6 6.8 8.8 1.08
Crude protein, % (db) 35.85 - - - 40.19 - - - 38.31 34.83 40.36 3.03
Crude fat, % (db) 19.3 - - - 17.9 - - - 19.9 18.3 21.5 1.60
Crude Fibre, % (db) 6.9 - - - 6.4 - - - 6.8 6.1 7.1 0.58
Ash, % (db) 4.82 - - - 4.48 - - - 4.81 4.47 5.09 0.31
Number of samples 1 1 3
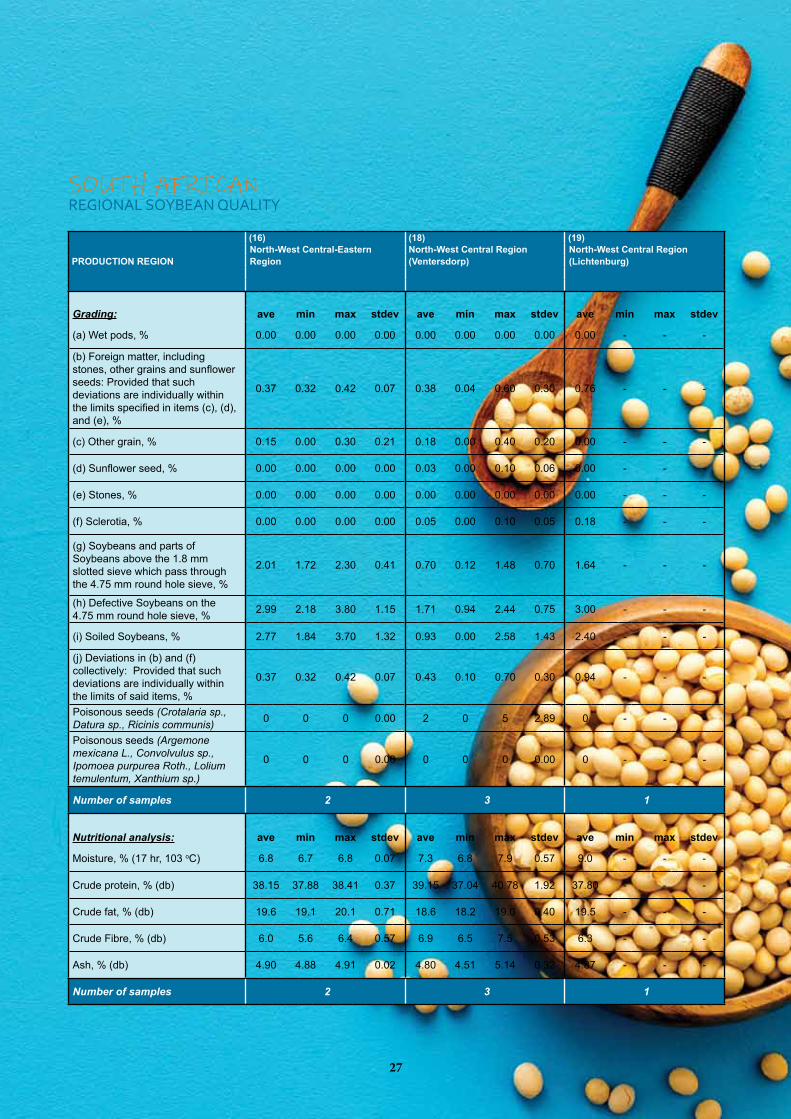
South African Soybean Crop Quality Report 2019/2020 Season27
SOUTH AFRICANREGIONAL SOYBEAN QUALITY
PRODUCTION REGION
(16) (18) (19)
North-West Central-Eastern North-West Central Region North-West Central Region
Region (Ventersdorp) (Lichtenburg)
Grading: ave min max stdev ave min max stdev ave min max stdev
(a) Wet pods, % 0.00 0.00 0.00 0.00 0.00 0.00 0.00 0.00 0.00 - - -
(b) Foreign matter, including stones, other grains and sunflower seeds: Provided that such deviations are individually within the limits specified in items (c), (d), and (e), %
0.37 0.32 0.42 0.07 0.38 0.04 0.60 0.30 0.76 - - -
(c) Other grain, % 0.15 0.00 0.30 0.21 0.18 0.00 0.40 0.20 0.00 - - -
(d) Sunflower seed, % 0.00 0.00 0.00 0.00 0.03 0.00 0.10 0.06 0.00 - - -
(e) Stones, % 0.00 0.00 0.00 0.00 0.00 0.00 0.00 0.00 0.00 - - -
(f) Sclerotia, % 0.00 0.00 0.00 0.00 0.05 0.00 0.10 0.05 0.18 - - -
(g) Soybeans and parts of Soybeans above the 1.8 mm slotted sieve which pass through the 4.75 mm round hole sieve, %
2.01 1.72 2.30 0.41 0.70 0.12 1.48 0.70 1.64 - - -
(h) Defective Soybeans on the 4.75 mm round hole sieve, % 2.99 2.18 3.80 1.15 1.71 0.94 2.44 0.75 3.00 - - -
(i) Soiled Soybeans, % 2.77 1.84 3.70 1.32 0.93 0.00 2.58 1.43 2.40 - - -
(j) Deviations in (b) and (f) collectively: Provided that such deviations are individually within the limits of said items, %
0.37 0.32 0.42 0.07 0.43 0.10 0.70 0.30 0.94 - - -
Poisonous seeds (Crotalaria sp.,
Datura sp., Ricinis communis)0 0 0 0.00 2 0 5 2.89 0 - - -
Poisonous seeds (Argemone
mexicana L., Convolvulus sp.,
Ipomoea purpurea Roth., Lolium
temulentum, Xanthium sp.)
0 0 0 0.00 0 0 0 0.00 0 - - -
Number of samples 2 3 1
Nutritional analysis: ave min max stdev ave min max stdev ave min max stdev
Moisture, % (17 hr, 103 oC) 6.8 6.7 6.8 0.07 7.3 6.8 7.9 0.57 9.0 - - -
Crude protein, % (db) 38.15 37.88 38.41 0.37 39.15 37.04 40.78 1.92 37.80 - - -
Crude fat, % (db) 19.6 19.1 20.1 0.71 18.6 18.2 19.0 0.40 19.5 - - -
Crude Fibre, % (db) 6.0 5.6 6.4 0.57 6.9 6.5 7.5 0.53 6.3 - - -
Ash, % (db) 4.90 4.88 4.91 0.02 4.80 4.51 5.14 0.32 4.87 - - -
Number of samples 2 3 1

South African Soybean Crop Quality Report 2019/2020 Season28
SOUTH AFRICANREGIONAL SOYBEAN QUALITY
PRODUCTION REGION
(20) (21) (22)
North-West Eastern Region Free State North-Western Region Free State North-Western Region
(Viljoenskroon) (Bothaville)
Grading: ave min max stdev ave min max stdev ave min max stdev
(a) Wet pods, % 0.00 0.00 0.00 0.00 0.00 0.00 0.00 0.00 0.00 0.00 0.00 0.00
(b) Foreign matter, including stones, other grains and sunflower seeds: Provided that such deviations are individually within the limits specified in items (c), (d), and (e), %
0.61 0.20 1.98 0.77 2.19 0.36 5.86 2.28 1.70 0.58 5.03 1.89
(c) Other grain, % 0.02 0.00 0.08 0.04 0.03 0.00 0.16 0.07 0.08 0.00 0.38 0.17
(d) Sunflower seed, % 0.02 0.00 0.08 0.04 0.03 0.00 0.08 0.04 0.00 0.00 0.00 0.00
(e) Stones, % 0.02 0.00 0.08 0.04 0.00 0.00 0.00 0.00 0.00 0.00 0.00 0.00
(f) Sclerotia, % 0.00 0.00 0.00 0.00 0.06 0.00 0.08 0.04 0.01 0.00 0.05 0.02
(g) Soybeans and parts of Soybeans above the 1.8 mm slotted sieve which pass through the 4.75 mm round hole sieve, %
0.84 0.10 1.88 0.74 1.66 0.90 2.20 0.48 3.27 1.53 7.54 2.47
(h) Defective Soybeans on the 4.75 mm round hole sieve, % 2.66 1.08 4.18 1.26 2.58 1.40 4.00 0.98 2.15 0.40 4.32 1.42
(i) Soiled Soybeans, % 8.37 0.00 18.28 7.88 1.06 0.00 1.80 0.87 0.76 0.00 1.88 0.84
(j) Deviations in (b) and (f) collectively: Provided that such deviations are individually within the limits of said items, %
0.61 0.20 1.98 0.77 2.25 0.44 5.86 2.24 1.71 0.58 5.08 1.91
Poisonous seeds (Crotalaria sp.,
Datura sp., Ricinis communis)0 0 0 0.00 0 0 0 0.00 0 0 0 0.00
Poisonous seeds (Argemone
mexicana L., Convolvulus sp.,
Ipomoea purpurea Roth., Lolium
temulentum, Xanthium sp.)
0 0 0 0.00 0 0 0 0.00 0 0 0 0.00
Number of samples 5 5 5
Nutritional analysis: ave min max stdev ave min max stdev ave min max stdev
Moisture, % (17 hr, 103 oC) 6.9 6.6 7.2 0.27 7.7 6.9 9.1 0.93 6.9 6.7 7.1 0.14
Crude protein, % (db) 40.55 40.05 40.90 0.32 39.62 38.54 40.83 0.84 37.28 34.31 40.93 3.03
Crude fat, % (db) 18.8 17.0 19.9 1.30 18.3 17.8 19.3 0.64 18.5 17.4 19.4 0.79
Crude Fibre, % (db) 6.8 5.8 7.6 0.64 7.4 6.1 8.5 0.92 7.9 7.0 9.2 0.87
Ash, % (db) 4.74 4.26 5.07 0.37 4.74 4.62 4.86 0.11 4.99 4.53 5.54 0.49
Number of samples 5 5 5

South African Soybean Crop Quality Report 2019/2020 Season29
SOUTH AFRICANREGIONAL SOYBEAN QUALITY
PRODUCTION REGION
(23) (24) (25)
Free State North-Western Region Free State Central Region Free State South-Western Region
(Bultfontein)
Grading: ave min max stdev ave min max stdev ave min max stdev
(a) Wet pods, % 0.00 0.00 0.00 0.00 0.00 0.00 0.00 0.00 0.00 - - -
(b) Foreign matter, including stones, other grains and sunflower seeds: Provided that such deviations are individually within the limits specified in items (c), (d), and (e), %
0.93 0.10 1.76 1.17 0.80 0.20 1.80 0.73 0.34 - - -
(c) Other grain, % 0.00 0.00 0.00 0.00 0.18 0.00 0.70 0.35 0.12 - - -
(d) Sunflower seed, % 0.00 0.00 0.00 0.00 0.03 0.00 0.10 0.05 0.00 - - -
(e) Stones, % 0.00 0.00 0.00 0.00 0.00 0.00 0.00 0.00 0.00 - - -
(f) Sclerotia, % 0.09 0.00 0.18 0.13 0.00 0.00 0.00 0.00 0.06 - - -
(g) Soybeans and parts of Soybeans above the 1.8 mm slotted sieve which pass through the 4.75 mm round hole sieve, %
1.45 0.20 2.70 1.77 0.77 0.38 1.30 0.38 1.40 - - -
(h) Defective Soybeans on the 4.75 mm round hole sieve, % 9.21 1.72 16.70 10.59 2.77 1.00 6.00 2.26 1.34 - - -
(i) Soiled Soybeans, % 1.91 0.00 3.82 2.70 0.19 0.00 0.74 0.37 0.00 - - -
(j) Deviations in (b) and (f) collectively: Provided that such deviations are individually within the limits of said items, %
1.02 0.10 1.94 1.30 0.80 0.20 1.80 0.73 0.40 - - -
Poisonous seeds (Crotalaria sp.,
Datura sp., Ricinis communis)3 0 5 3.54 1 0 5 2.50 0 - - -
Poisonous seeds (Argemone
mexicana L., Convolvulus sp.,
Ipomoea purpurea Roth., Lolium
temulentum, Xanthium sp.)
0 0 0 0.00 0 0 0 0.00 0 - - -
Number of samples 2 4 1
Nutritional analysis: ave min max stdev ave min max stdev ave min max stdev
Moisture, % (17 hr, 103 oC) 7.0 6.9 7.1 0.14 7.0 6.9 7.3 0.19 7.8 - - -
Crude protein, % (db) 40.38 38.50 42.25 2.65 39.18 38.64 39.98 0.63 42.20 - - -
Crude fat, % (db) 17.3 16.3 18.3 1.41 17.6 15.4 19.6 1.76 16.4 - - -
Crude Fibre, % (db) 7.7 7.3 8.0 0.49 8.0 7.8 8.4 0.28 7.6 - - -
Ash, % (db) 4.85 4.76 4.93 0.12 4.79 4.62 5.17 0.26 4.39 - - -
Number of samples 2 4 1
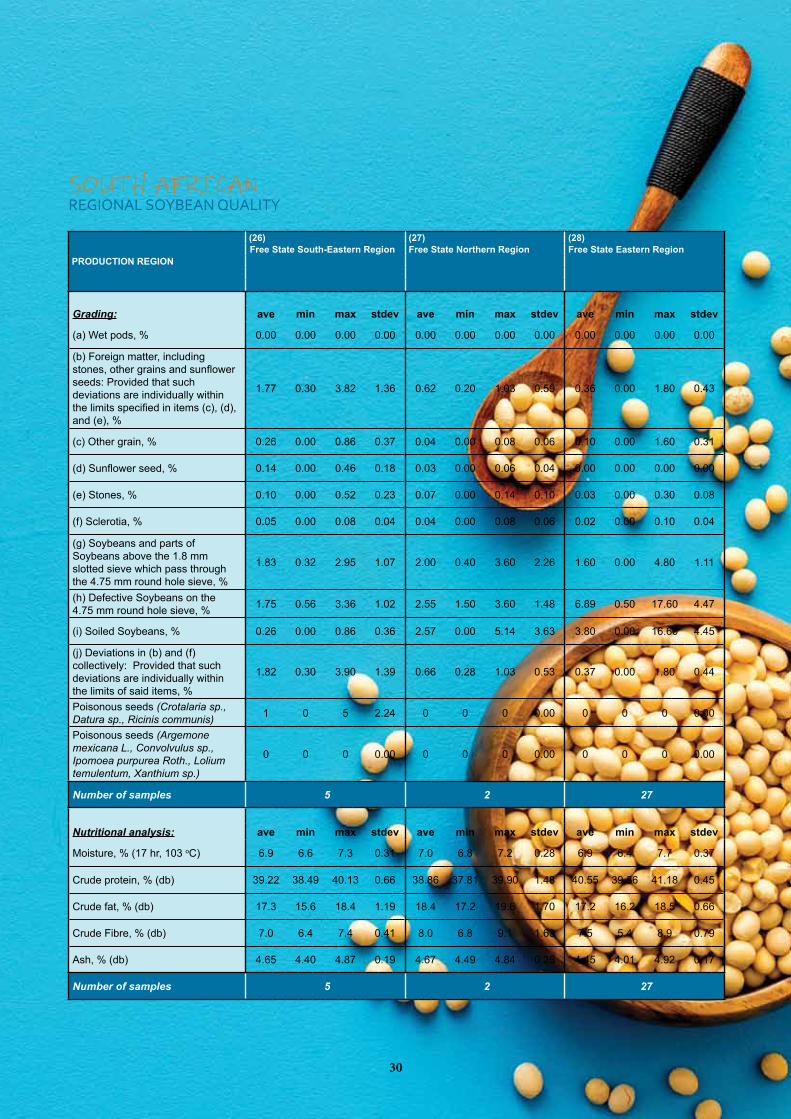
South African Soybean Crop Quality Report 2019/2020 Season30
SOUTH AFRICANREGIONAL SOYBEAN QUALITY
PRODUCTION REGION
(26) (27) (28)
Free State South-Eastern Region Free State Northern Region Free State Eastern Region
Grading: ave min max stdev ave min max stdev ave min max stdev
(a) Wet pods, % 0.00 0.00 0.00 0.00 0.00 0.00 0.00 0.00 0.00 0.00 0.00 0.00
(b) Foreign matter, including stones, other grains and sunflower seeds: Provided that such deviations are individually within the limits specified in items (c), (d), and (e), %
1.77 0.30 3.82 1.36 0.62 0.20 1.03 0.59 0.36 0.00 1.80 0.43
(c) Other grain, % 0.26 0.00 0.86 0.37 0.04 0.00 0.08 0.06 0.10 0.00 1.60 0.31
(d) Sunflower seed, % 0.14 0.00 0.46 0.18 0.03 0.00 0.06 0.04 0.00 0.00 0.00 0.00
(e) Stones, % 0.10 0.00 0.52 0.23 0.07 0.00 0.14 0.10 0.03 0.00 0.30 0.08
(f) Sclerotia, % 0.05 0.00 0.08 0.04 0.04 0.00 0.08 0.06 0.02 0.00 0.10 0.04
(g) Soybeans and parts of Soybeans above the 1.8 mm slotted sieve which pass through the 4.75 mm round hole sieve, %
1.83 0.32 2.95 1.07 2.00 0.40 3.60 2.26 1.60 0.00 4.80 1.11
(h) Defective Soybeans on the 4.75 mm round hole sieve, % 1.75 0.56 3.36 1.02 2.55 1.50 3.60 1.48 6.89 0.50 17.60 4.47
(i) Soiled Soybeans, % 0.26 0.00 0.86 0.36 2.57 0.00 5.14 3.63 3.80 0.00 16.60 4.45
(j) Deviations in (b) and (f) collectively: Provided that such deviations are individually within the limits of said items, %
1.82 0.30 3.90 1.39 0.66 0.28 1.03 0.53 0.37 0.00 1.80 0.44
Poisonous seeds (Crotalaria sp.,
Datura sp., Ricinis communis)1 0 5 2.24 0 0 0 0.00 0 0 0 0.00
Poisonous seeds (Argemone
mexicana L., Convolvulus sp.,
Ipomoea purpurea Roth., Lolium
temulentum, Xanthium sp.)
0 0 0 0.00 0 0 0 0.00 0 0 0 0.00
Number of samples 5 2 27
Nutritional analysis: ave min max stdev ave min max stdev ave min max stdev
Moisture, % (17 hr, 103 oC) 6.9 6.6 7.3 0.31 7.0 6.8 7.2 0.28 6.9 6.4 7.7 0.37
Crude protein, % (db) 39.22 38.49 40.13 0.66 38.86 37.81 39.90 1.48 40.55 39.56 41.18 0.45
Crude fat, % (db) 17.3 15.6 18.4 1.19 18.4 17.2 19.6 1.70 17.2 16.2 18.5 0.66
Crude Fibre, % (db) 7.0 6.4 7.4 0.41 8.0 6.8 9.1 1.63 7.5 5.4 8.9 0.79
Ash, % (db) 4.65 4.40 4.87 0.19 4.67 4.49 4.84 0.25 4.45 4.01 4.92 0.17
Number of samples 5 2 27

South African Soybean Crop Quality Report 2019/2020 Season31
SOUTH AFRICANREGIONAL SOYBEAN QUALITY
PRODUCTION REGION
(29) (30) (31)
Mpumalanga Mpumalanga Mpumalanga
Southern Region Eastern Region Central Region
Grading: ave min max stdev ave min max stdev ave min max stdev
(a) Wet pods, % 0.00 0.00 0.00 0.00 0.00 0.00 0.00 0.00 0.00 0.00 0.00 0.00
(b) Foreign matter, including stones, other grains and sunflower seeds: Provided that such deviations are individually within the limits specified in items (c), (d), and (e), %
0.93 0.10 2.30 0.71 0.99 0.10 3.50 0.73 0.57 0.22 1.52 0.41
(c) Other grain, % 0.10 0.00 0.34 0.13 0.08 0.00 0.90 0.21 0.09 0.00 0.60 0.20
(d) Sunflower seed, % 0.02 0.00 0.10 0.04 0.00 0.00 0.00 0.00 0.00 0.00 0.00 0.00
(e) Stones, % 0.03 0.00 0.10 0.04 0.02 0.00 0.10 0.04 0.01 0.00 0.10 0.03
(f) Sclerotia, % 0.02 0.00 0.10 0.04 0.10 0.00 1.10 0.22 0.02 0.00 0.10 0.04
(g) Soybeans and parts of Soybeans above the 1.8 mm slotted sieve which pass through the 4.75 mm round hole sieve, %
1.54 0.30 2.22 0.64 1.79 0.34 5.30 1.11 0.98 0.20 2.20 0.74
(h) Defective Soybeans on the 4.75 mm round hole sieve, % 2.97 0.76 7.20 2.42 4.65 0.10 13.20 2.94 3.52 1.00 7.30 2.10
(i) Soiled Soybeans, % 3.23 0.00 9.00 3.98 5.41 0.00 20.50 4.62 5.60 0.00 10.24 4.18
(j) Deviations in (b) and (f) collectively: Provided that such deviations are individually within the limits of said items, %
0.95 0.10 2.30 0.70 1.10 0.30 3.58 0.72 0.59 0.22 1.52 0.42
Poisonous seeds (Crotalaria sp.,
Datura sp., Ricinis communis)0 0 0 0.00 0 0 5 1.02 0 0 0 0.00
Poisonous seeds (Argemone
mexicana L., Convolvulus sp.,
Ipomoea purpurea Roth., Lolium
temulentum, Xanthium sp.)
0 0 5 1.51 0 0 5 1.41 1 0 10 3.33
Number of samples 11 24 9
Nutritional analysis: ave min max stdev ave min max stdev ave min max stdev
Moisture, % (17 hr, 103 oC) 7.2 6.7 8.0 0.51 7.5 6.6 10.0 1.00 7.1 6.7 7.7 0.31
Crude protein, % (db) 40.06 36.91 41.38 1.34 40.50 39.33 42.37 0.78 40.09 39.25 41.29 0.70
Crude fat, % (db) 17.9 16.3 18.8 0.80 17.5 16.2 19.4 0.74 18.2 16.9 19.8 0.90
Crude Fibre, % (db) 6.9 5.8 8.4 0.78 7.1 5.0 9.6 1.24 7.4 6.0 9.6 1.17
Ash, % (db) 4.56 4.27 4.82 0.21 4.50 4.22 4.89 0.19 4.58 4.36 4.90 0.16
Number of samples 11 24 9

South African Soybean Crop Quality Report 2019/2020 Season32
SOUTH AFRICANREGIONAL SOYBEAN QUALITY
PRODUCTION REGION
(32) (33) (34)
Mpumalanga Mpumalanga Gauteng Region
Western Region Northern Region
Grading: ave min max stdev ave min max stdev ave min max stdev
(a) Wet pods, % 0.00 0.00 0.00 0.00 0.00 0.00 0.00 0.00 0.00 0.00 0.00 0.00
(b) Foreign matter, including stones, other grains and sunflower seeds: Provided that such deviations are individually within the limits specified in items (c), (d), and (e), %
1.13 0.25 3.40 1.14 0.79 0.15 2.30 0.67 0.79 0.25 1.70 0.48
(c) Other grain, % 0.15 0.00 1.30 0.41 0.20 0.00 0.60 0.24 0.22 0.00 0.90 0.31
(d) Sunflower seed, % 0.00 0.00 0.00 0.00 0.00 0.00 0.00 0.00 0.00 0.00 0.00 0.00
(e) Stones, % 0.01 0.00 0.08 0.03 0.12 0.00 1.35 0.41 0.03 0.00 0.20 0.07
(f) Sclerotia, % 0.17 0.00 0.60 0.18 0.06 0.00 0.10 0.05 0.05 0.00 0.20 0.07
(g) Soybeans and parts of Soybeans above the 1.8 mm slotted sieve which pass through the 4.75 mm round hole sieve, %
1.32 0.78 2.07 0.43 0.98 0.10 2.70 0.87 1.39 0.07 3.53 1.08
(h) Defective Soybeans on the 4.75 mm round hole sieve, % 3.76 0.30 7.80 2.37 2.67 0.80 4.40 1.13 3.73 1.20 7.00 2.21
(i) Soiled Soybeans, % 5.15 0.00 9.90 2.90 8.11 0.20 17.80 5.88 2.34 0.10 7.10 2.29
(j) Deviations in (b) and (f) collectively: Provided that such deviations are individually within the limits of said items, %
1.29 0.38 3.50 1.11 0.84 0.23 2.30 0.66 0.84 0.25 1.90 0.55
Poisonous seeds (Crotalaria sp.,
Datura sp., Ricinis communis)1 0 5 1.58 0 0 0 0.00 0 0 0 0.00
Poisonous seeds (Argemone
mexicana L., Convolvulus sp.,
Ipomoea purpurea Roth., Lolium
temulentum, Xanthium sp.)
1 0 5 1.58 0 0 5 1.51 0 0 0 0.00
Number of samples 10 11 8
Nutritional analysis: ave min max stdev ave min max stdev ave min max stdev
Moisture, % (17 hr, 103 oC) 7.2 6.6 9.1 0.72 7.3 6.8 8.2 0.40 7.1 6.4 7.9 0.49
Crude protein, % (db) 40.41 39.07 41.10 0.66 40.77 39.78 43.70 1.11 39.55 33.81 41.16 2.41
Crude fat, % (db) 17.9 16.6 19.3 0.87 18.0 16.6 19.5 1.06 17.9 15.8 20.9 1.63
Crude Fibre, % (db) 6.3 5.6 7.4 0.48 6.7 4.6 7.8 0.94 6.2 5.0 8.5 1.10
Ash, % (db) 4.63 4.41 5.08 0.19 4.75 4.42 4.98 0.17 4.71 4.50 5.23 0.24
Number of samples 10 11 8

South African Soybean Crop Quality Report 2019/2020 Season33
SOUTH AFRICANREGIONAL SOYBEAN QUALITY
PRODUCTION REGION
(35) (36)
Limpopo Region KwaZulu-Natal Region
Grading: ave min max stdev ave min max stdev
(a) Wet pods, % 0.00 - - - 0.00 0.00 0.00 0.00
(b) Foreign matter, including stones, other grains and sunflower seeds: Provided that such deviations are individually within the limits specified in items (c), (d), and (e), %
0.10 - - - 0.72 0.10 1.58 0.60
(c) Other grain, % 0.00 - - - 0.20 0.00 1.00 0.32
(d) Sunflower seed, % 0.00 - - - 0.00 0.00 0.00 0.00
(e) Stones, % 0.00 - - - 0.00 0.00 0.00 0.00
(f) Sclerotia, % 0.00 - - - 0.08 0.00 0.20 0.08
(g) Soybeans and parts of Soybeans above the 1.8 mm slotted sieve which pass through the 4.75 mm round hole sieve, %
1.70 - - - 0.66 0.00 1.64 0.61
(h) Defective Soybeans on the 4.75 mm round hole sieve, % 13.30 - - - 1.47 0.40 4.34 1.26
(i) Soiled Soybeans, % 0.30 - - - 7.00 2.00 12.00 3.85
(j) Deviations in (b) and (f) collectively: Provided that such deviations are individually within the limits of said items, %
0.10 - - - 0.80 0.10 1.78 0.67
Poisonous seeds (Crotalaria sp.,
Datura sp., Ricinis communis)0 - - - 0 0 0 0.00
Poisonous seeds (Argemone
mexicana L., Convolvulus sp.,
Ipomoea purpurea Roth., Lolium
temulentum, Xanthium sp.)
0 - - - 1 0 10 3.33
Number of samples 1 9
Nutritional analysis: ave min max stdev ave min max stdev
Moisture, % (17 hr, 103 oC) 6.5 - - - 7.3 6.6 8.3 0.56
Crude protein, % (db) 41.58 - - - 39.70 38.13 40.57 0.88
Crude fat, % (db) 16.6 - - - 20.0 18.12 22.1 1.14
Crude Fibre, % (db) 6.7 - - - 6.4 5.8 7.1 0.42
Ash, % (db) 4.88 - - - 4.71 4.57 4.93 0.12
Number of samples 1 9

South African Soybean Crop Quality Report 2019/2020 Season34
Fatty acid Profile
Fatty acid profiles are the most important tool for identification of authenticity of vegetable fats and oils. All types of oil have their own specific fatty acid profile which is unique to that product. Fatty acids are typically esterified to a glycerol backbone to form triglycerides (also called fats or oils). Fatty acids are either described as saturated or unsaturated, with saturated fatty acids being solid at room temperature and unsaturated fatty acids being liquid at room temperature. Unsaturated fatty acids are further subdivided into mono-unsaturated (one double bond in the carbon chain) or poly-unsaturated (more than one double bond in the carbon chain). The unique fatty acid profile of each product/crop is a combination of saturated, mono-unsaturated and poly-unsaturated oils and is specific to that type of oil.
Fatty acid profiles of every crop, however, are subject to variation. The variation or typical pattern of fatty acids in a specific oil not only influences the stability and physical properties of the oil but also aids in distinguishing one type of oil from another. Variation of fatty acids within the same product depend on climate, latitude, soil type, cultivar, rainfall as well as seasonal variation. These variations should be included when ranges for identification of authenticity are determined.
It is imperative to include ranges wherein fatty acids vary, in order to successfully validate the authenticity of a specific vegetable oil. Building of a database requires gathering of information over different seasons, areas and cultivars in order to give a true reflection of the ranges wherein fatty acids can differ. Currently, no national updated database for fatty acid composition of soybean oil is available.
It is important that South Africa, as a soybean producing country, develop and maintain a national fatty acid profile database to the benefit of the Oil Seed Industry. Annual analysis of crop and cultivar samples will ensure that the natural variation caused by different cultivars as well as the influence of climate and locality are included in the database values. Seasonal variations will also be addressed. Recording all variation applicable to the crops in the database will enable the annual review of the specified ranges.
Precision Oil Laboratories was subcontracted for the second consecutive season to perform fatty acid profile analyses on 20 composite crop samples representing different production regions as well as 21 cultivar samples from different localities. Please refer to Tables 7, 8 and 9 on pages 35 to 38 for the results.
The following fatty acid were included in the profile analysis:C14:0 Myristic acid C18:3n3 n3 Linolenic acidC16:0 Palmitic acid C20:0 Arachidic acidC16:1 Palmitoleic acid C20:1 Eicosenoic acidC17:0 Margaric acid C20:2 Eicosadienoic acidC17:1 Glinkgolic acid C21:0 Heneicosanoic acidC18:0 Stearic acid C22:0 Behenic acid
C18:1 c cis Oleic acid C22:1 Erucic acidC18:2 c cis Linoleic acid C24:0 Lignoceric acidC18:3n6 n6 Linolenic acid
References:
Accum, F., 1820. “A Treatise on Adulteration of Food and Culinary Poisons”, Longman, Hurst, Rees, Orme and Row, London. Gunstone, F.D., 1996. Fatty Acid and Lipid Chemistry, 1st edition, Blackie Academic & Professional, London, pp 1-23. Rossell, J.B., Measurement of rancidity. IN: J.C. and Hamilton R.J. (Eds), Rancidity in Foods. Blackie Academic and Professional, Glasgow, pp22-53.Van Niekerk, P.J., 1990. Determination of the component oils of edible oil blends. University of Pretoria.
TheFattyacidProfileinformationwassuppliedbyDr.MathildaMostertfromPrecisionOilLaboratories.
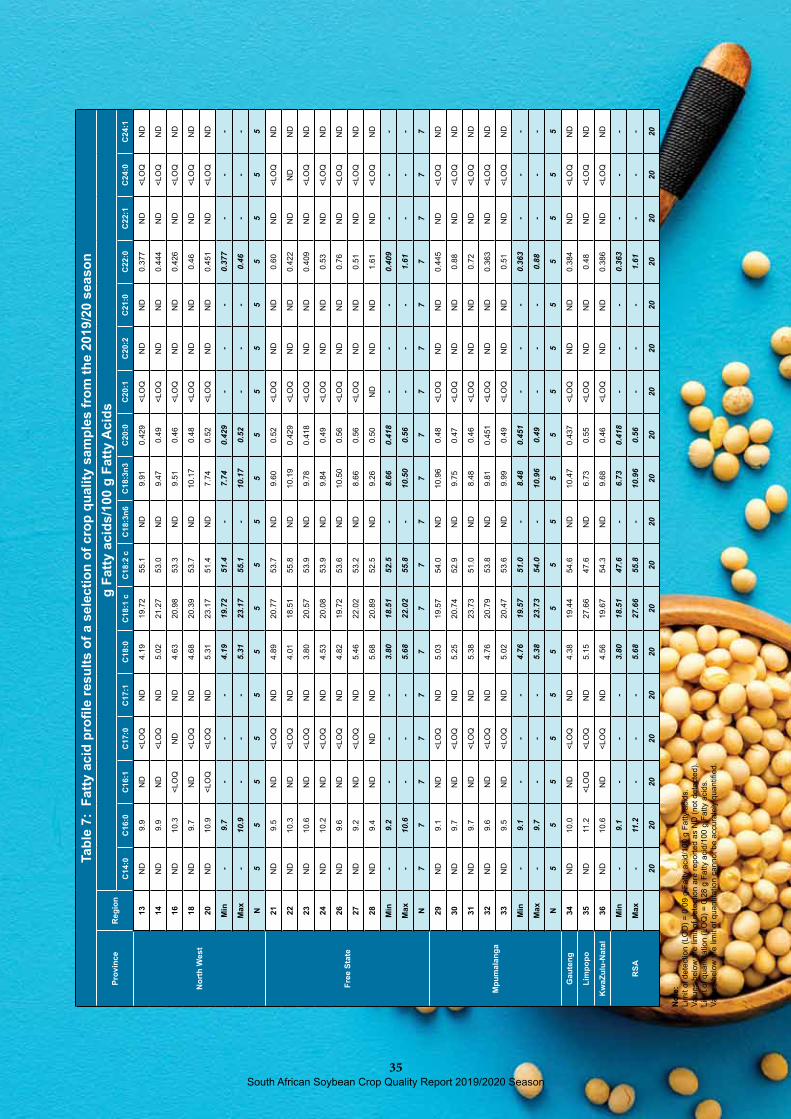
South African Soybean Crop Quality Report 2019/2020 Season35
Tabl
e 7:
Fat
ty a
cid
profi
le re
sults
of a
sel
ectio
n of
cro
p qu
ality
sam
ples
from
the
2019
/20
seas
on
Pro
vin
ce
Reg
ion
g F
att
y a
cid
s/1
00 g
Fatt
y A
cid
s
C14:0
C
16:0
C16:1
C17:0
C17:1
C18:0
C18:1
cC
18:2
cC
18:3
n6
C18:3
n3
C20:0
C20:1
C20:2
C21:0
C22:0
C22:1
C24:0
C24:1
No
rth
West
13
ND
9.9
ND
<LO
QN
D4.
1919
.72
55.1
ND
9.91
0.42
9<L
OQ
ND
ND
0.37
7N
D<L
OQ
ND
14
ND
9.9
ND
<LO
QN
D5.
0221
.27
53.0
ND
9.47
0.49
<LO
QN
DN
D0.
444
ND
<LO
QN
D
16
ND
10.3
<LO
QN
DN
D4.
6320
.98
53.3
ND
9.51
0.46
<LO
QN
DN
D0.
426
ND
<LO
QN
D
18
ND
9.7
ND
<LO
QN
D4.
6820
.39
53.7
ND
10.1
70.
48<L
OQ
ND
ND
0.46
ND
<LO
QN
D
20
ND
10.9
<LO
Q<L
OQ
ND
5.31
23.1
751
.4N
D7.
740.
52<L
OQ
ND
ND
0.45
1N
D<L
OQ
ND
Min
-9.7
--
-4.19
19.72
51.4
-7.74
0.429
--
-0.377
--
-
Max
-10.9
--
-5.31
23.17
55.1
-10.17
0.52
--
-0.46
--
-
N5
55
55
55
55
55
55
55
55
5
Fre
e S
tate
21
ND
9.5
ND
<LO
QN
D4.
8920
.77
53.7
ND
9.60
0.52
<LO
QN
DN
D0.
60N
D<L
OQ
ND
22
ND
10.3
ND
<LO
QN
D4.
0118
.51
55.8
ND
10.1
90.
429
<LO
QN
DN
D0.
422
ND
ND
ND
23
ND
10.6
ND
<LO
QN
D3.
8020
.57
53.9
ND
9.78
0.41
8<L
OQ
ND
ND
0.40
9N
D<L
OQ
ND
24
ND
10.2
ND
<LO
QN
D4.
5320
.08
53.9
ND
9.84
0.49
<LO
QN
DN
D0.
53N
D<L
OQ
ND
26
ND
9.6
ND
<LO
QN
D4.
8219
.72
53.6
ND
10.5
00.
56<L
OQ
ND
ND
0.76
ND
<LO
QN
D
27
ND
9.2
ND
<LO
QN
D5.
4622
.02
53.2
ND
8.66
0.56
<LO
QN
DN
D0.
51N
D<L
OQ
ND
28
ND
9.4
ND
ND
ND
5.68
20.8
952
.5N
D9.
260.
50N
DN
DN
D1.
61N
D<L
OQ
ND
Min
-9.2
--
-3.80
18.51
52.5
-8.66
0.418
--
-0.409
--
-
Max
-10.6
--
-5.68
22.02
55.8
-10.50
0.56
--
-1.61
--
-
N7
77
77
77
77
77
77
77
77
7
Mp
um
ala
ng
a
29
ND
9.1
ND
<LO
QN
D5.
0319
.57
54.0
ND
10.9
60.
48<L
OQ
ND
ND
0.44
5N
D<L
OQ
ND
30
ND
9.7
ND
<LO
QN
D5.
2520
.74
52.9
ND
9.75
0.47
<LO
QN
DN
D0.
88N
D<L
OQ
ND
31
ND
9.7
ND
<LO
QN
D5.
3823
.73
51.0
ND
8.48
0.46
<LO
QN
DN
D0.
72N
D<L
OQ
ND
32
ND
9.6
ND
<LO
QN
D4.
7620
.79
53.8
ND
9.81
0.45
1<L
OQ
ND
ND
0.36
3N
D<L
OQ
ND
33
ND
9.5
ND
<LO
QN
D5.
0220
.47
53.6
ND
9.99
0.49
<LO
QN
DN
D0.
51N
D<L
OQ
ND
Min
-9.1
--
-4.76
19.57
51.0
-8.48
0.451
--
-0.363
--
-
Max
-9.7
--
-5.38
23.73
54.0
-10.96
0.49
--
-0.88
--
-
N5
55
55
55
55
55
55
55
55
5
Gau
ten
g34
ND
10.0
ND
<LO
QN
D4.
3819
.44
54.6
ND
10.4
70.
437
<LO
QN
DN
D0.
384
ND
<LO
QN
D
Lim
po
po
35
ND
11.2
<LO
Q<L
OQ
ND
5.15
27.6
647
.6N
D6.
730.
55<L
OQ
ND
ND
0.48
ND
<LO
QN
D
Kw
aZ
ulu
-Nata
l36
ND
10.6
ND
<LO
QN
D4.
5619
.67
54.3
ND
9.68
0.46
<LO
QN
DN
D0.
386
ND
<LO
QN
D
RS
A
Min
-9.1
--
-3.80
18.51
47.6
-6.73
0.418
--
-0.363
--
-
Max
-11.2
--
-5.68
27.66
55.8
-10.96
0.56
--
-1.61
--
-
20
20
20
20
20
20
20
20
20
20
20
20
20
20
20
20
20
20
No
te:
Lim
it of
det
ectio
n (L
OD
) = 0
.09
g Fa
tty a
cid/
100
g Fa
tty a
cids
.Va
lues
bel
ow th
e lim
it of
det
ectio
n ar
e re
porte
d as
ND
(not
det
ecte
d).
Lim
it of
qua
ntita
tion
(LO
Q) =
0.2
8 g
Fatty
aci
d/10
0 g
Fatty
aci
ds.
Valu
es b
elow
the
limit
of q
uant
itatio
n ca
nnot
be
accu
rate
ly q
uant
ified
.
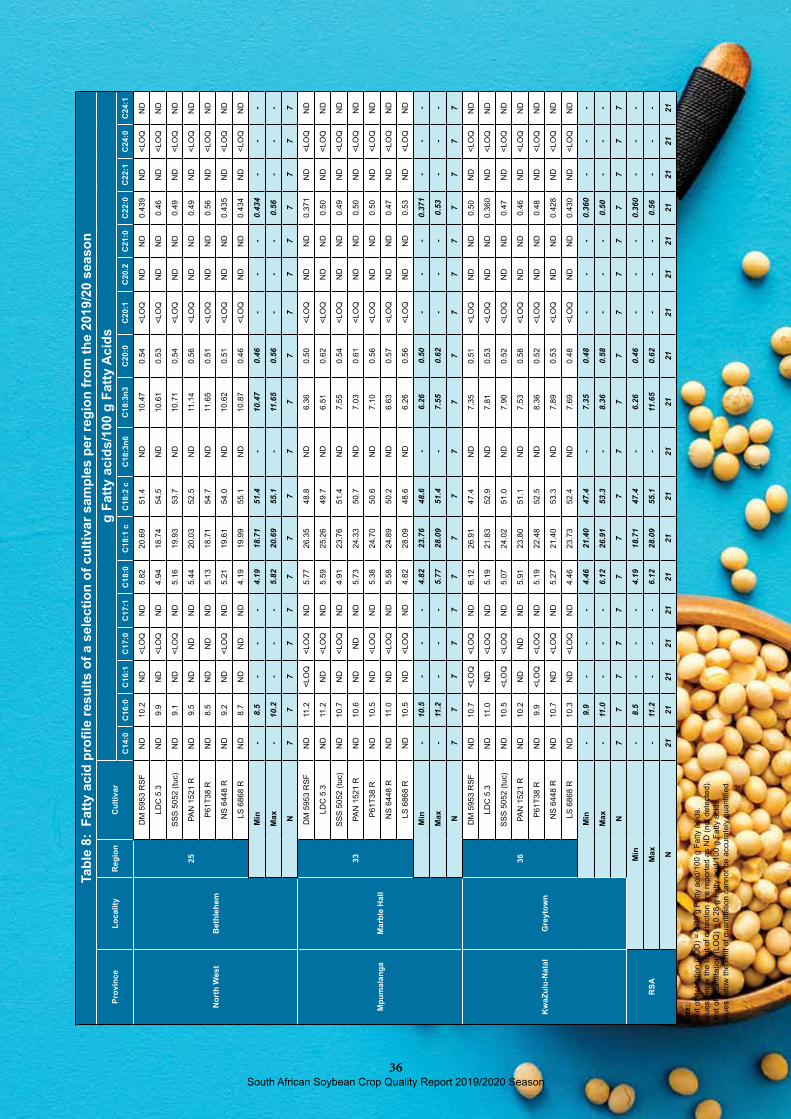
South African Soybean Crop Quality Report 2019/2020 Season36
Tabl
e 8:
Fat
ty a
cid
profi
le re
sults
of a
sel
ectio
n of
cul
tivar
sam
ples
per
regi
on fr
om th
e 20
19/2
0 se
ason
Pro
vin
ce
Lo
cality
R
eg
ion
Cu
ltiv
ar
g F
att
y a
cid
s/1
00 g
Fatt
y A
cid
s
C14:0
C
16:0
C16:1
C17:0
C17:1
C18:0
C18:1
cC
18:2
cC
18:3
n6
C18:3
n3
C20:0
C20:1
C20.2
C21:0
C22:0
C22:1
C24:0
C24:1
No
rth
West
Beth
leh
em
25
DM
595
3 R
SFN
D10
.2N
D<L
OQ
ND
5.82
20.6
951
.4N
D10
.47
0.54
<LO
QN
DN
D0.
439
ND
<LO
QN
D
LDC
5.3
ND
9.9
ND
<LO
QN
D4.
9418
.74
54.5
ND
10.6
10.
53<L
OQ
ND
ND
0.46
ND
<LO
QN
D
SSS
5052
(tuc
)N
D9.
1N
D<L
OQ
ND
5.16
19.9
353
.7N
D10
.71
0.54
<LO
QN
DN
D0.
49N
D<L
OQ
ND
PAN
152
1 R
ND
9.5
ND
ND
ND
5.44
20.0
352
.5N
D11
.14
0.56
<LO
QN
DN
D0.
49N
D<L
OQ
ND
P61T
38 R
ND
8.5
ND
ND
ND
5.13
18.7
154
.7N
D11
.65
0.51
<LO
QN
DN
D0.
56N
D<L
OQ
ND
NS
6448
RN
D9.
2N
D<L
OQ
ND
5.21
19.6
154
.0N
D10
.62
0.51
<LO
QN
DN
D0.
435
ND
<LO
QN
D
LS 6
868
RN
D8.
7N
DN
DN
D4.
1919
.99
55.1
ND
10.8
70.
46<L
OQ
ND
ND
0.43
4N
D<L
OQ
ND
Min
-8.5
--
-4.19
18.71
51.4
-10.47
0.46
--
-0.434
--
-
Max
-10.2
--
-5.82
20.69
55.1
-11.65
0.56
--
-0.56
--
-
N7
77
77
77
77
77
77
77
77
7
Mp
um
ala
ng
aM
arb
le H
all
33
DM
595
3 R
SFN
D11
.2<L
OQ
<LO
QN
D5.
7726
.35
48.8
ND
6.36
0.50
<LO
QN
DN
D0.
371
ND
<LO
QN
D
LDC
5.3
ND
11.2
ND
<LO
QN
D5.
5925
.26
49.7
ND
6.51
0.62
<LO
QN
DN
D0.
50N
D<L
OQ
ND
SSS
5052
(tuc
)N
D10
.7N
D<L
OQ
ND
4.91
23.7
651
.4N
D7.
550.
54<L
OQ
ND
ND
0.49
ND
<LO
QN
D
PAN
152
1 R
ND
10.6
ND
ND
ND
5.73
24.3
350
.7N
D7.
030.
61<L
OQ
ND
ND
0.50
ND
<LO
QN
D
P61T
38 R
ND
10.5
ND
<LO
QN
D5.
3824
.70
50.6
ND
7.10
0.56
<LO
QN
DN
D0.
50N
D<L
OQ
ND
NS
6448
RN
D11
.0N
D<L
OQ
ND
5.58
24.8
950
.2N
D6.
630.
57<L
OQ
ND
ND
0.47
ND
<LO
QN
D
LS 6
868
RN
D10
.5N
D<L
OQ
ND
4.82
28.0
948
.6N
D6.
260.
56<L
OQ
ND
ND
0.53
ND
<LO
QN
D
Min
-10.5
--
-4.82
23.76
48.6
-6.26
0.50
--
-0.371
--
-
Max
-11.2
--
-5.77
28.09
51.4
-7.55
0.62
--
-0.53
--
-
N7
77
77
77
77
77
77
77
77
7
Kw
aZ
ulu
-Nata
lG
reyto
wn
36
DM
595
3 R
SFN
D10
.7<L
OQ
<LO
QN
D6.
1226
.91
47.4
ND
7.35
0.51
<LO
QN
DN
D0.
50N
D<L
OQ
ND
LDC
5.3
ND
11.0
ND
<LO
QN
D5.
1921
.83
52.9
ND
7.81
0.53
<LO
QN
DN
D0.
360
ND
<LO
QN
D
SSS
5052
(tuc
)N
D10
.5<L
OQ
<LO
QN
D5.
0724
.02
51.0
ND
7.90
0.52
<LO
QN
DN
D0.
47N
D<L
OQ
ND
PAN
152
1 R
ND
10.2
ND
ND
ND
5.91
23.8
051
.1N
D7.
530.
58<L
OQ
ND
ND
0.46
ND
<LO
QN
D
P61T
38 R
ND
9.9
<LO
Q<L
OQ
ND
5.19
22.4
852
.5N
D8.
360.
52<L
OQ
ND
ND
0.48
ND
<LO
QN
D
NS
6448
RN
D10
.7N
D<L
OQ
ND
5.27
21.4
053
.3N
D7.
890.
53<L
OQ
ND
ND
0.42
8N
D<L
OQ
ND
LS 6
868
RN
D10
.3N
D<L
OQ
ND
4.46
23.7
352
.4N
D7.
690.
48<L
OQ
ND
ND
0.43
0N
D<L
OQ
ND
Min
-9.9
--
-4.46
21.40
47.4
-7.35
0.48
--
-0.360
--
-
Max
-11.0
--
-6.12
26.91
53.3
-8.36
0.58
--
-0.50
--
-
N7
77
77
77
77
77
77
77
77
7
RS
A
Min
-8.5
--
-4.19
18.71
47.4
-6.26
0.46
--
-0.360
--
-
Max
-11.2
--
-6.12
28.09
55.1
-11.65
0.62
--
-0.56
--
-
N21
21
21
21
21
21
21
21
21
21
21
21
21
21
21
21
21
21
No
te:
Lim
it of
det
ectio
n (L
OD
) = 0
.09
g Fa
tty a
cid/
100
g Fa
tty a
cids
.Va
lues
bel
ow th
e lim
it of
det
ectio
n ar
e re
porte
d as
ND
(not
det
ecte
d).
Lim
it of
qua
ntita
tion
(LO
Q) =
0.2
8 g
Fatty
aci
d/10
0 g
Fatty
aci
ds.
Valu
es b
elow
the
limit
of q
uant
itatio
n ca
nnot
be
accu
rate
ly q
uant
ified
.

South African Soybean Crop Quality Report 2019/2020 Season37
Tabl
e 9:
Fat
ty a
cid
profi
le re
sults
per
cul
tivar
from
the
2019
/20
seas
on
Cu
ltiv
ar
Lo
cality
Reg
ion
g F
att
y a
cid
s/1
00 g
Fatt
y A
cid
s
C14:0
C
16:0
C16:1
C17:0
C17:1
C18:0
C18:1
cC
18:2
cC
18:3
n6
C18:3
n3
C20:0
C20:1
C20:2
C21:0
C22:0
C22:1
C24:0
C24:1
DM
5953 R
SF
Beth
leh
em
25
ND
10.2
ND
<LO
QN
D5.
8220
.69
51.4
ND
10.4
70.
54<L
OQ
ND
ND
0.43
9N
D<L
OQ
ND
Marb
le H
all
33
ND
11.2
<LO
Q<L
OQ
ND
5.77
26.3
548
.8N
D6.
360.
50<L
OQ
ND
ND
0.37
1N
D<L
OQ
ND
Gre
yto
wn
36
ND
10.7
<LO
Q<L
OQ
ND
6.12
26.9
147
.4N
D7.
350.
51<L
OQ
ND
ND
0.50
ND
<LO
QN
D
Min
-10.2
--
-5.77
20.69
47.4
-6.36
0.50
--
-0.371
--
-
Max
-11.2
--
-6.12
26.91
51.4
-10.47
0.54
--
-0.50
--
-
N3
33
33
33
33
33
33
33
33
3
LD
C 5
.3
Be
thle
hem
25
ND
9.9
ND
<LO
QN
D4.
9418
.74
54.5
ND
10.6
10.
53<L
OQ
ND
ND
0.46
ND
<LO
QN
D
Marb
le H
all
33
ND
11.2
ND
<LO
QN
D5.
5925
.26
49.7
ND
6.51
0.62
<LO
QN
DN
D0.
50N
D<L
OQ
ND
Gre
yto
wn
36
ND
11.0
ND
<LO
QN
D5.
1921
.83
52.9
ND
7.81
0.53
<LO
QN
DN
D0.
360
ND
<LO
QN
D
Min
-9.9
--
-4.94
18.74
49.7
-6.51
0.53
--
-0.360
--
-
Max
-11.2
--
-5.59
25.26
54.5
-10.61
0.62
--
-0.50
--
-
N3
33
33
33
33
33
33
33
33
3
SS
S 5
052 (
tuc)
Beth
leh
em
25
ND
9.1
ND
<LO
QN
D5.
1619
.93
53.7
ND
10.7
10.
54<L
OQ
ND
ND
0.49
ND
<LO
QN
D
Ma
rble
Hall
33
ND
10.7
ND
<LO
QN
D4.
9123
.76
51.4
ND
7.55
0.54
<LO
QN
DN
D0.
49N
D<L
OQ
ND
Gre
yto
wn
36
ND
10.5
<LO
Q<L
OQ
ND
5.07
24.0
251
.0N
D7.
900.
52<L
OQ
ND
ND
0.47
ND
<LO
QN
D
Min
-9.1
--
-4.91
19.93
51.0
-7.55
0.52
--
-0.47
--
-
Max
-10.7
--
-5.16
24.02
53.7
-10.71
0.54
--
-0.49
--
-
N3
33
33
33
33
33
33
33
33
3
PA
N 1
521 R
Beth
leh
em
25
ND
9.5
ND
ND
ND
5.44
20.0
352
.5N
D11
.14
0.56
<LO
QN
DN
D0.
49N
D<L
OQ
ND
Marb
le H
all
33
ND
10.6
ND
ND
ND
5.73
24.3
350
.7N
D7.
030.
61<L
OQ
ND
ND
0.50
ND
<LO
QN
D
Gre
yto
wn
36
ND
10.2
ND
ND
ND
5.91
23.8
051
.1N
D7.
530.
58<L
OQ
ND
ND
0.46
ND
<LO
QN
D
Min
-9.5
--
-5.44
20.03
50.7
-7.03
0.56
--
-0.46
--
-
Max
-10.6
--
-5.91
24.33
52.5
-11.14
0.61
--
-0.50
--
-
N3
33
33
33
33
33
33
33
33
3
P61T
38R
Beth
leh
em
25
ND
8.5
ND
ND
ND
5.13
18.7
154
.7N
D11
.65
0.51
<LO
QN
DN
D0.
56N
D<L
OQ
ND
Marb
le H
all
33
ND
10.5
ND
<LO
QN
D5.
3824
.70
50.6
ND
7.10
0.56
<LO
QN
DN
D0.
50N
D<L
OQ
ND
Gre
yto
wn
36
ND
9.9
<LO
Q<L
OQ
ND
5.19
22.4
852
.5N
D8.
360.
52<L
OQ
ND
ND
0.48
ND
<LO
QN
D
Min
-8.5
--
-5.13
18.71
50.6
-7.10
0.51
--
-0.48
--
-
Max
-10.5
--
-5.38
24.70
54.7
-11.65
0.56
--
-0.56
--
-
N3
33
33
33
33
33
33
33
33
3
NS
6448 R
Beth
leh
em
25
ND
9.2
ND
<LO
QN
D5.
2119
.61
54.0
ND
10.6
20.
51<L
OQ
ND
ND
0.43
5N
D<L
OQ
ND
Ma
rble
Hall
33
ND
11.0
ND
<LO
QN
D5.
5824
.89
50.2
ND
6.63
0.57
<LO
QN
DN
D0.
47N
D<L
OQ
ND
Gre
yto
wn
36
ND
10.7
ND
<LO
QN
D5.
2721
.40
53.3
ND
7.89
0.53
<LO
QN
DN
D0.
428
ND
<LO
QN
D
Min
-9.2
--
-5.21
19.61
50.2
-6.63
0.51
--
-0.428
--
-
Max
-11.0
--
-5.58
24.89
54.0
-10.62
0.57
--
-0.47
--
-
N3
33
33
33
33
33
33
33
33
3

South African Soybean Crop Quality Report 2019/2020 Season38
Tabl
e 9:
Fat
ty a
cid
profi
le re
sults
per
cul
tivar
from
the
2019
/20
seas
on
Cu
ltiv
ar
Lo
cality
Reg
ion
g F
att
y a
cid
s/1
00 g
Fatt
y A
cid
s (
co
nti
nu
e)
C1
4:0
C
16:0
C16:1
C17:0
C17:1
C18:0
C18:1
cC
18:2
cC
18:3
n6
C18:3
n3
C20:0
C20:1
C20:2
C21:0
C22:0
C22:1
C24:0
C24:1
LS
6868 R
Beth
leh
em
25
ND
8.7
ND
ND
ND
4.19
19.9
955
.1N
D10
.87
0.46
<LO
QN
DN
D0.
434
ND
<LO
QN
D
Marb
le H
all
33
ND
10.5
ND
<LO
QN
D4.
8228
.09
48.6
ND
6.26
0.56
<LO
QN
DN
D0.
53N
D<L
OQ
ND
Gre
yto
wn
36
ND
10.3
ND
<LO
QN
D4.
4623
.73
52.4
ND
7.69
0.48
<LO
QN
DN
D0.
430
ND
<LO
QN
D
Min
-8.7
--
-4.19
19.99
48.6
-6.26
0.46
--
-0.430
--
-
Max
-10.5
--
-4.82
28.09
55.1
-10.87
0.56
--
-0.53
--
-
N3
33
33
33
33
33
33
33
33
3
RS
A
Min
-8.5
--
-4.19
18.71
47.4
-6.26
0.46
--
-0.360
--
-
Max
-11.2
--
-6.12
28.09
55.1
-11.65
0.62
--
-0.56
--
-
N2
121
21
21
21
21
21
21
21
21
21
21
21
21
21
21
21
21
No
te:
Lim
it of
det
ectio
n (L
OD
) = 0
.09
g Fa
tty a
cid/
100
g Fa
tty a
cids
.Va
lues
bel
ow th
e lim
it of
det
ectio
n ar
e re
porte
d as
ND
(not
det
ecte
d).
Lim
it of
qua
ntita
tion
(LO
Q) =
0.2
8 g
Fatty
aci
d/10
0 g
Fatty
aci
ds.
Valu
es b
elow
the
limit
of q
uant
itatio
n ca
nnot
be
accu
rate
ly q
uant
ified
.

South African Soybean Crop Quality Report 2019/2020 Season39
MethodsSampling Procedure:A working group determined the procedure to be followed to ensure that the crop quality samples sent to the SAGL by the various grain silo owners, were representative of the total crop.
Each delivery was sampled as per the grading regulations for grading purposes.
After grading, the grading samples were placed in separate containers according to class and grade, per silo bin at each silo.
After 80% of the expected harvest had been received, the content of each container was divided with a multi slot divider in order to obtain a 3 kg sample.
If there were more than one container per class and grade per silo bin, the combined contents of the containers were mixed thoroughly before dividing it with a multi slot divider to obtain the required 3 kg sample.
The samples were marked clearly with the name of the depot, the bin/bag/bunker number(s) represented by each individual sample as well as the class and grade and were then forwarded to the SAGL
Grading:Full grading was done in accordance with the Regulations relating to the Grading, Packing and Marking of Soybeans intended for sale in the Republic of South Africa (Government Notice NO. R. 370 of 21 April 2017).
Please see pages 85 to 94 of this report.
Test Weight:Test weight provides a measure of the bulk density of grain and oilseeds.
Test weight does not form part of the grading regulations for soybeans in South Africa. An approximation of the test weight of South African soybeans is provided in this report for information purposes. The standard working procedure of the Kern 222 instrument, as described in ISO 7971-3:2019, was followed. The g/1 L filling mass of the soybean samples was determined and divided by two. The test weight was then extrapolated by means of the following formulas obtained from the Test Weight Conversion Chart for Soybean of the Canadian Grain Commission: y = 0.1898x + 2.2988 (291 to 350 g/0.5 L) and y = 0.1895x + 2.3964 (351 to 410 g/0.5 L).
Nutritional Analysis:
MillingPrior to the chemical analyses, the soybean samples were milled on a Retch ZM 200 mill fitted with a 1.0 mm screen.
MoistureThe method prescribed under the ISTA International Rules for Seed Testing, Section 9, latest edition was used to determine the moisture content of the soya samples. This method determines moisture content as a loss in weight of a sample when dried in an oven at 103 °C for 17 hours.
South African Soybean Crop Quality Report 2019/2020 Season40
Crude proteinThe Dumas combustion analysis technique was used to determine the crude protein content, according to AACCI method 46-30.01, latest edition.
This method prescribes a generic combustion method for the determination of crude protein. Combustion at high temperature in pure oxygen sets nitrogen free, which is measured by thermal conductivity detection. The total nitrogen content of the sample is determined and converted to equivalent protein by multiplication with a factor of 6.25 to obtain the crude protein content.
Crude fatIn-House method 024 was used for the determination of the crude fat in the samples. After sample preparation the fat is extracted by petroleum ether with the aid of the Soxhlet extraction apparatus, followed by the removal of the solvent by evaporation and weighing the dried residue thus obtained. The residue is expressed as % crude fat.
Crude fibreIn-House method 020 was used for the determination of the crude fibre in the samples. Crude fibre is the loss on ignition of the dried residue remaining after digestion of the sample with 1.25% Sulphuric acid (H2SO4) and 1.25% Sodium hydroxide (NaOH) solutions under specific conditions.
AshAsh is defined as the quantity of mineral matter which remains as incombustible residue of the tested substance, after application of the described working method. In-house method No. 011, based on AACCI method 08-02.01 Rapid (Magnesium Acetate) method, was used for the determination. The samples were incinerated at 700 ± 10 °C in a muffle furnace for 45 minutes.
GMO (Genetically Modified Organisms):The EnviroLogix QuickComb kit for bulk soybeans was used to quantitatively determine the presence of genetically modified soybeans. The kit is designed to extract and detect the presence of certain proteins at the levels typically expressed in genetically modified bulk soybeans. The procedure prescribed in the EnviroLogix – QuickScan Instruction Manual, latest edition was followed. Results were scanned and interpreted quantitatively with the EnviroLogix QuickScan system.
Precision Oil Laboratories’ Fatty Acid Profile Methods:
Fat ExtractionIn-House method POL 019 was used for the extraction of the crude fat from the samples. After sample preparation the fat is extracted by petroleum ether under reflux, followed by the removal of the solvent by evaporation. The residue obtained from the fat extraction is used for preparation of methyl esters for determination of the fatty acid profile.
Fatty Acid ProfileIn-House method POL 015 was used for determination of the fatty acid composition. Extracted fat is converted to methyl esters using an alkali catalyzed method. Methyl esters are injected into a Gas Chromatograph and an external fatty acid methyl ester standard is used to identify peaks based on retention times. The fatty acid composition is expressed as a total fatty acid content of 100% with different fatty acids representing a percentage of the total fatty acids.

South African Soybean Crop Quality Report 2019/2020 Season41

South African Soybean Crop Quality Report 2019/2020 Season42
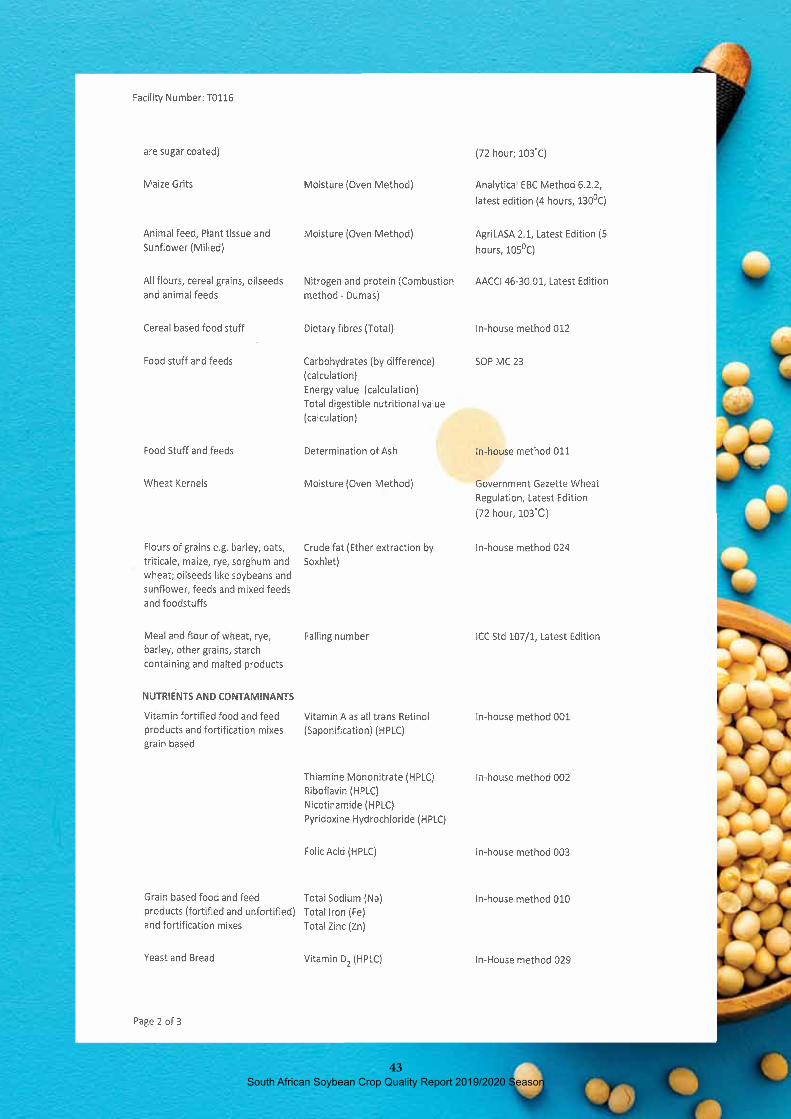
South African Soybean Crop Quality Report 2019/2020 Season43

South African Soybean Crop Quality Report 2019/2020 Season44

South African Soybean Crop Quality Report 2019/2020 Season
45
Landbounavorsingsraad
Graangewasse
Potchefstroom
Agricultural Research Council
Grain Crops
Potchefstroom
Republiek van Suid Afrika
Republic of South Africa
VERSLAG VAN DIE NASIONALE
SOJABOON KULTIVARPROEWE/
2019/20
REPORT OF THE NATIONAL
SOYBEAN CULTIVAR TRIALS
Verantwoordelike beampte:
Responsible officer:
AS de Beer
L Bronkhorst
N Cochrane

South African Soybean Crop Quality Report 2019/2020 Season
46
BEDANKINGS
Dank is verskuldig aan die volgende persone vir hul onderskeie bydraes in die
verwesenliking van hierdie verslag:
1 Alle medewerkers en koöperateurs soos gelys op bladsy 11.
2 Mev. H. Vermeulen vir rekenarisering van data en saamstel van die
verslag.
3 Me Nicolene Cochrane vir haar hulp met die verwerking en interpertering
van die data.
4 Die Navorsings Bestuurder, GG; en sojabooncultivarevaluasiekomitee,
onder wie se wakende oog die proewe uitgevoer is.
5 Kollegas (Me L. Bronkhorst, Mnre N. Mogapi, C. Ramatlotlo en S.
Seutwladi) en personeel van GG wie op direkte of indirekte wyse bystand
verleen het.
6 Die saadmaatskappye (Tabel 1). Olie- en Proteïensade Ontwikkelingstrust
(OPOT) en Landbounavorsingsraad (LNR) wie die projek finansieer.
ACKNOWLEDGEMENTS
Credit is due to the following persons for their respective contributions to this
report:
1 All the collaborators and co-operators as listed on page 11.
2 Mrs. H. Vermeulen for processing of data and for compiling the report.
3 Me Nicolene Cochrane for the processing and interpretation of the data.
4 The Research Manager (GC), and the soybean cultivar evaluation
committee under whose watchful eye the trials were executed.
5 Collegues (Me L. Bronkhorst, Mr’s N. Mogapi, C Ramatlotlo and S.
Seutwladi) and personnel of GC who rendered assistance in a direct or
indirect way.
6 The Seed Companies (Table 1), Oil- and Protein Seeds Development Trust
(OPDT) and Agricultural Research Council (ARC) for financing the project.

South African Soybean Crop Quality Report 2019/2020 Season
47
INHOUD/INDEX
ONDERWERP BLADSY
SUBJECT PAGE
1 INLEIDING .................................................................................................1
INTRODUCTION .......................................................................................1
1.1 DOEL .........................................................................................................1
AIM ............................................................................................................1
2 MATERIAAL EN METODE .......................................................................1
MATERIALS AND METHODS ..................................................................1
2.1 ALGEMEEN ..............................................................................................1
GENERAL .................................................................................................1
2.2 WAARNEMINGS .......................................................................................2
OBSERVATIONS ......................................................................................2
2.2.1 Blomdatum ...............................................................................................2
Date of flowering ......................................................................................2
2.2.2 Fisiologies ryp .........................................................................................2
Physiological maturity.............................................................................2
2.2.3 Oesrypdatum ............................................................................................2
Date of harvest maturity ..........................................................................2
2.2.4 Planthoogte ..............................................................................................2
Plant height ..............................................................................................2
2.2.5 Peulhoogte ...............................................................................................2
Pod height ................................................................................................2
2.2.6 Omval ........................................................................................................2
Lodging .....................................................................................................2
2.2.7 Groenstam ................................................................................................3
Green Stem ...............................................................................................3
2.2.8 Oopspring .................................................................................................3
Shattering .................................................................................................3
2.2.9 Aantal plante (3 weke na opkoms) .........................................................3
Number of plants (3 weeks after emergence) ........................................3
2.2.10 Massa per 100 sade .................................................................................3
100 Seed mass .........................................................................................3
2.2.11 Ongewenste sade ....................................................................................3
Undesirable seed .....................................................................................3
2.2.12 Proteïen-en oliepersentasie ....................................................................3
Protein and oil percentage ......................................................................3
2.2.13 Graanopbrengs ........................................................................................3
Grain yield ................................................................................................3
2.3 DIE EVALUERING VAN PROEWE ...........................................................3
THE EVALUATION OF TRIALS ...............................................................4
3 BESPREKING VAN RESULTATE ............................................................4
DISCUSSION OF RESULTS .....................................................................4
South African Soybean Crop Quality Report 2019/2020 Season
48
3.1 ALGEMEEN ..............................................................................................4
GENERAL .................................................................................................4
3.2 BESPREKING VAN TABELLE .................................................................5
DISCUSSION OF TABLES .......................................................................5
3.2.1 Dae tot blom, fisiologiesryp en lengte van die groeiperiode .............. 5
Days to flowering, physiological maturity and length of growing
season .....................................................................................................5
3.2.2 Planthoogte ..............................................................................................6
Plant height ..............................................................................................5
3.2.3 Peulhoogte ...............................................................................................5
Pod height ................................................................................................5
3.2.4 Omval ........................................................................................................6
Lodging .....................................................................................................6
3.2.5 Groenstam ................................................................................................7
Green stem ...............................................................................................6
3.2.6 Oopspring .................................................................................................6
Shattering .................................................................................................6
3.2.7 Planttelling ...............................................................................................7
Number of plants .....................................................................................6
3.2.8 Persentasie ongewenste sade ................................................................7
Percentage undesirable seed .................................................................7
3.2.9 Saadgrootte ..............................................................................................7
Seed size ..................................................................................................7
3.2.10 Oliepersentasie ........................................................................................7
Oil percentage ..........................................................................................7
3.2.11 Ru-proteïenpersenasie ............................................................................7
Crude Protein Percentage .......................................................................7
3.2.12 Protolie .....................................................................................................8
Profat ........................................................................................................7
3.2.13 Opbrengs ..................................................................................................8
Yield ..........................................................................................................8
4 INTERPRETASIE VAN OPBRENGSRESULTATE ...................................8
INTERPRETATION OF YIELD RESULTS ...............................................8
4.1 INLEIDING .................................................................................................8
INTRODUCTION .......................................................................................8
4.2 OPBRENGSWAARSKYNLIKHEID EN OPBRENGS................................9
YIELD PROBABILITY AND YIELD ...........................................................9

South African Soybean Crop Quality Report 2019/2020 Season
49
TABEL BLADSY
TABLE PAGE
Lys van medewerkers ........................................................................... 10
List of co-operators ............................................................................... 10
NASIONALE SOJABOONKULTIVARPROEWE
NATIONAL SOYBEAN CULTIVAR TRIALS
1 Sojaboonsaad eienskappe en saadverskaffers .................................. 11
Soybean seed characteristics and agents ........................................... 11
2 Grond en verbouingsinligting ............................................................... 12
Soil and general information ................................................................ 12
3 Reënvalgegewens .................................................................................. 13
Rainfall detail ......................................................................................... 13
4 Dae tot blom ........................................................................................... 14
Days to flowering ................................................................................... 14
5 Dae tot fisiologiesrypstadium ............................................................... 15
Days to physiological maturity ............................................................. 15
6 Lengte van groeiperiode ....................................................................... 16
Length of growing season .................................................................... 16
7 Planthoogte (cm) ................................................................................... 17
Plant height (cm) .................................................................................... 17
8 Peulhoogte (cm) ..................................................................................... 18
Pod height (cm) ...................................................................................... 18
9 Omval (1-5) ............................................................................................. 19
Lodging (1-5) .......................................................................................... 19
10 Groenstam (1-5) ..................................................................................... 20
Green stem (1-5) .................................................................................... 20
11 Oopspring (1-5) ...................................................................................... 21
Shattering (1-5) ...................................................................................... 21
12 Planttelling (3 weke na plant) ................................................................ 22
Number of plants (3 weeks after emergence ....................................... 22
13 Persentasie ongewenste sade .............................................................. 23
Percentage undesirable seed ............................................................... 23
South African Soybean Crop Quality Report 2019/2020 Season
50
14 Massa/100 sade (g) ................................................................................ 24
Mass/100 seeds (g) ................................................................................ 24
15 Oliepersentasie – Resultate nog nie beskikbaar .....................................
Oil percentage – Results not available yet ..............................................
16 Ru-proteïenpersentasie – Resultate nog nie beskikbaar .......................
Crude Protein Percentage – Results not available yet ...........................
17 Protolie – Resultate nog nie beskikbaar ..................................................
Profat – Results not available yet .............................................................
18 Opbrengste per lokaliteit ...................................................................... 25
Actual yield for various localities ........................................................ 25
19 Opbrengswaarskynlikheid vir koeler produksiegebiede (3 jaar) ....... 26
Yield probability for cooler production areas (3 year) ........................ 26
20 Opbrengste vir koeler produksiegebiede (2 jaar) ............................... 27
Actual yield for cooler production areas (2 year) ............................... 27
21 Opbrengswaarskynlikheid vir matige produksiegebiede (3 jaar) ...... 28
Yield probability for moderate production areas (3 year) .................. 28
22 Opbrengste vir matige produksiegebiede (2 jaar) .............................. 29
Actual yield for moderate production areas (2 year) .......................... 29
23 Opbrengswaarskynlikheid vir warmer produksiegebiede (3 jaar) ..... 30
Yield probability for warmer production areas (3 year) ...................... 30
24 Opbrengste vir warmer produksiegebiede (2 jaar) ............................. 31
Actual yield for warmer production areas (2 year) ............................. 31
25 Saamgevatte inligting vir koeler produksiegebiede ........................... 32
Summerised information for cooler production areas ....................... 32
26 Saamgevatte inligting vir matige produksiegebiede .......................... 33
Summerised information for moderate production areas .................. 33
27 Saamgevatte inligting vir warmer produksiegebiede ......................... 34
Summerised information for warmer production areas ..................... 34

South African Soybean Crop Quality Report 2019/2020 Season
51
1
1 INTRODUCTION
The National Soybean Cultivar Trials (project M101/62 (P05000002) were planted for
the 42th successive year this past growing season. A total of 18 trials (of the planned
21 trials) were planted at 18 localities, illustrated in the locality list.
1.1 AIM
The aim of the project was primarily the following:
(I) To compare cultivars for agronomic and economic performance;
(ii) to test the adaptability of cultivars and new releases for specific areas and
cultivation practices.
2 MATERIALS AND METHODS
2.1 GENERAL
The trials were planted as randomized block designs as well as a Latinized row-
column design using three replications and 28 cultivars. Cultivar characteristics are
shown in Table 1.
Each trial plot consisted of four, 5 m rows. Four metres were harvested from each of
the middle two rows, in order to avoid border effects. Soil form, fertilization and weed
control are indicated together with row spacing in Table 2. All seeds were inoculated
with Bradyrhizobium japonicum bacteria at planting.
The localities where trials were planted represent a wide range of climatic conditions.
Trials were carried out on the ARC and Departmental Research Stations as well as on
privately owned farms. Observations were recorded by responsible officers and
collaborators as indicated in the list of collaborators. Planting time and cultivation
practice were executed to correspond with that of commercial plantings in the specific

South African Soybean Crop Quality Report 2019/2020 Season
52
2
areas. Rainfall and irrigation are indicated in Table 3. Note that rainfall is only recorded
from October to April and not for the specific growing season of a trial.
2.2 OBSERVATIONS
A brief definition of some of the observations in the trials is as follow:
2.2.1 Date of flowering: The time at which one fully open flower per plant was
observed across 50% of the plots.
2.2.2 Physiological maturity: The number of days when 50% of the pods appear
yellow or brown.
2.2.3 Date of harvest maturity: When 95% of the pods for a given plot had turned
brown. This is an indication of length of growing season, (number of days
from date of planting to date of maturity).
2.2.4 Plant height: The average height in centimetre (cm) of plants from the soil
surface to the growth point at maturity.
2.2.5 Pod height: The average height in centimetre (cm) of the lowest pods on
the plant from soil surface at maturity.
2.2.6 Lodging: Lodging at time of harvest was rated on the following scale:
1 = No lodging
2 = Few lodging, will not hamper mechanical harvesting
3 = Few lodging, lodging less than what will hamper mechanical
harvesting
4 = Few lodging, will hamper mechanical harvesting, with yield loss
5 = Fair number of plants lodged, will hamper mechanical harvesting,
with yield loss
6 = Many plants lodged, will hamper mechanical harvesting, with yield
loss

South African Soybean Crop Quality Report 2019/2020 Season
53
3
7 = A large number of plants lodged, will hamper mechanical harvesting,
with yield loss
8 = Nearly all plants lodged, will hamper mechanical harvesting, yield
loss
9 = All plants lodged, will hamper mechanical harvesting, yield loss
2.2.7 Green stem: The percentage green stems at harvest rated on a 1 (normally
mature) to 5 (more than 80% green stems) scale.
2.2.8 Shattering: Measured at time of harvest. Shattering is reported on a scale
of 1 (no shattering) to 5 (more than 91-100% pods shattered).
2.2.9 Plant count three (3) weeks after emergence: The number of plants
counted on 5 m of the two inner rows. This data will be used to calculate
the germination percentage and will be compared with the germination
percentage of different soil types.
2.2.10 100 seeds mass: Determined on an air dry basis from a randomly selected
sample retained on a 4,75 mm standard grading screen.
2.2.11 Undesirable seed: The mass of undesirable seed was determined in a
random 100 g sample with seed size greater than 4,75 mm (excluding
mechanical damaged seeds).
2.2.12 Protein and oil percentage: The analysis was done by the SAGL (Southern
African Grain Laboratory NPC) by using the “Soxhlet” apparatus (oil
percentage) and the “Dumas” method (protein percentage).
2.2.13 Grain yield: Four metres of the two centre rows were harvested by hand at
soil level and threshed. The grain moisture was determined and yield
calculated on a basis of 12,5% moisture content.

South African Soybean Crop Quality Report 2019/2020 Season
54
4
2.3 THE EVALUATION OF TRIALS
The yield data of the individual trials were subjected to analysis of variance (ANOVA)
with a randomized complete block design (RCBD) as well as a Latinized row-column
design.
The localities with coefficient of variance higher than 25% were rejected from the
analysis.
The trial means (x-axis) versus the cultivar means (y-axis) is plotted. A regression line
is then fitted with the trial means as x variable and cultivar means as predictor variable.
Out of the regression estimates, the yield probability percentage above the mean for
each cultivar at different yield potentials is then calculated and presented in a table as
a guideline for the use of different cultivars under different circumstances.
A yield probability of more than 50% indicated above average yield and a yield
probability of less than 50% indicated a below average yield.
3 DISCUSSION OF RESULTS
3.1 GENERAL
The rainfall and irrigation data are shown in Table 3.
Three (3) of the 18 trials planted could not be included (16.7%) in the report compared
to the eight (8) out of 22 trials (36.4%) in the 2018/19 season.
The following trials could not be included in the report for the following reasons:
1 Delmas – Not harvested due to Covid 19 restrictions.
2 Brits – Flooding. Trial terminated.
3 Potchefstroom (Seed Co) – Not harvested due to Covid 19 restrictions.
As in the previous seasons the evaluation of the trials was based on a number of
parameters. No conclusion can be made on a single parameter.

South African Soybean Crop Quality Report 2019/2020 Season
55
5
3.2 DISCUSSION OF TABLES
3.2.1 Days to flowering (Table 4), physiologically mature (Table 5) and length of the
growing season (Table 6)
The number of days from planting to flowering (Table 4) is an effective measure for
the grouping of cultivars because the relative order of rank for this characteristic is
repeated to a great extent over localities and years. As expected the average days to
flowering was the shortest in the warm areas (48 days Schweizer Reneke) and the
longest in the cooler areas (80 days at Clarens).
The number of days to physiological maturity is shown in Table 5. The longest average
days to maturity was experienced at Clarens (143 days).
The number of days to harvest maturity (Table 6) was used to determine the length of
the growing season of a cultivar. The number of days to harvest maturity is however,
more dependent on climatic changes and planting date for soybeans and, the number
of days to flowering is therefore a more reliable maturity grouping criterion.
3.2.2 Plant height (Table 7)
The indeterminate cultivar DM 6.8i RR (MG 6.8) had a mean plant height of 103 cm
(highest) in the cool area compared to 46 cm (lowest) of the determinate cultivar
P61T38 R (MG 6.1) in the warm region.
The average plant height between localities varied from a mean of 55 cm at Stoffberg
to 98 cm at Bergville.
3.2.3 Pod height (Table 8)
The variation in pod and plant height between cultivars is linked with the length of the
growing season of a cultivar. The cultivar LS 6860 R (MG 6.0; indeterminate), had a
mean pod height of 16 cm in the warm area, but also had an above average pod height
in the cool and moderate areas.

South African Soybean Crop Quality Report 2019/2020 Season
56
6
Other cultivars with above average pod heights for all the climate areas are SSS 5052
(tuc) (MG 5.5; indeterminate), NS 5909 R (MG 5.9; indeterminate), LS 6860 R (MG
6.0; indeterminate), PAN 1521 R (MG 5.7; indeterminate), LS 6161 R (MG 6.1;
indeterminate), PAN 1555 R (MG 5.7, indeterminate), DM 6.8i RR (MG 6.8;
indeterminate) and DM 6968 RSF (MG 6.9; indeterminate).
P48T48 R (MG 4.8; indeterminate), DM 5953 RSF (MG 4.8; indeterminate) and LDC
5.3 (MG 5.3; indeterminate) and LS 6851 R (VG 5.5) (determinate) had the lowest
reading of 4 cm. Considerable harvest losses can occur due to low pod height; thus
pod height is an important factor influencing cultivar choice. Differences in pod height
between localities can mainly be attributed to differences in row width and climate. A
pod height of at least 7.5 cm (combine harvesting height) is preferable.
3.2.4 Lodging (Table 9)
The highest overall lodging occurred in the trial at Bapsfontein. The highest lodging
figures was reported for DM 6968 RSF, NA 5509 R, PAN 1663 R, LS 6868 R at
Bergville in the moderate area.
3.2.5 Green stem (Table 10)
A high percentage of green stem, was recorded at Stoffberg and Hoopstad while the
cultivars DM 5351 RSF, PAN 1575 R, DM 6968 RSF and NS 5909 R showed an above
average tendency for green stem for all the climatic regions. Plants also retained their
leaves that could hamper the harvesting process.
3.2.6 Shattering with harvesting (Table 11)
The highest shattering occurred at Stoffberg in the moderate area.
3.2.7 Number of plants three (3) weeks after emergence (Table 12)
Enough certified seed was provided to establish 400 000 plants ha-1 for the irrigation

South African Soybean Crop Quality Report 2019/2020 Season
57
7
and high rainfall areas and 350 000 for dryland. The lowest plants ha-1 count were
recorded at Clarens due to a dry spell just after planting.
3.2.8 Percentage undesirable seed (Table 13)
The lowest mean of 0.17% undesirable seeds was recorded for the cool region. The
range varied from 0.66% at Stoffberg 0.07% at Kinross.
3.2.9 Mass (g) 100-1 seeds (Table 14)
The variation in seed mass among localities ranged between 13.57 g 100-1 seeds at
Clarens to 20.12 g 100-1 seeds at Cedara. The highest seed mass was recorded for
PAN 1555 R in the moderate region, while SSS 5449 (tuc), had the smallest seed in
all the climate regions.
3.2.10 Oil percentage (Table 15)
The cultivar PAN 1663 R had, the highest average oil percentage for all the regions
(21.02% cool, 22.08% moderate, 22.54% warm). The average oil percentage are
20.85% for the warm, 20.44% for the moderate and 19.82% for the cool area.
3.2.11 Crude Protein percentage (Table 16)
The cultivar DM 5302 RSF, as the previous seasons had the highest values for all the
climate regions (40.20% cool, 41.43% moderate, 42.28% warm). The overall average
are 39.67% for the warm, 39.53% for the moderate and 37.99% for the cool area.
3.2.12 Profat (Table 17)
The inclusion of this table in the report was requested by Dr Erhard Bredenham as the
total value of oil and protein is a much better indicator for the selection of a cultivar
than the single oil or protein factor. The cultivar DM 5302 RSF, as the previous
seasons, had the highest average profat value for all the regions.

South African Soybean Crop Quality Report 2019/2020 Season
58
8
3.2.10 Yield (Table 18)
Due to the sensitivity of soybean cultivars to environmental conditions, it is preferable
to divide the soybean production areas into cool, moderate and warm regions. A better
yield can be established by choosing a cultivar suitably adapted for a specific region.
It is also necessary to use data from more than one year to select between cultivars.
Due to the significant cultivar and locality interaction, conclusions on cultivar
performance should not be made from average yield data alone. The mean yield over
localities has therefore been omitted.
4 INTERPRETATION OF YIELD RESULTS
4.1 INTRODUCTION
A stated aim of the national soybean cultivar trials is the evaluation of cultivars for their
adaptability to a potential production area, and for their yield performance. Adaptability
is especially important because of the fact that soybean cultivars are known to be
restricted in terms of recommended production area. This fact is also demonstrated
by the results discussed in this report.
Because of genotypic restriction in adaptability the statistical analysis of data over all
trial entries and localities tend to demonstrate strong interaction components which
confound interpretation. Interaction makes genotype rankings at one site inapplicable
to another site. The larger the interaction the more information is lost if interaction is
not analysed effectively. This will be a lesser problem for homogeneous areas than
for non-homogeneous areas. However, a purpose of the national trials is to identify
homogeneous areas or homogeneous growing conditions based on cultivar
performance. Localities were therefore grouped together based on past research
experience and with the assistance of photo thermal charts provided by the Institute
for Soil, Climate and Water. Localities were grouped in cool, moderate and warm
production areas.

South African Soybean Crop Quality Report 2019/2020 Season
59
9
4.2 YIELD PROBABILITY AND YIELD (Tables 19, 20, 21, 22, 23 & 24)
A minimum number of successful trials per climatic area are needed to calculate saved
yield probability values. Yield probability tables are set up for cool-, moderate and
warm regions, if enough data is available.
Yield probability of a cultivar is the chance to get an above average yield at a particular
yield potential. For instance, if the yield probability of a cultivar, at a particular yield
potential equals 60%, the chance to get a yield above the mean of all cultivars is 60%
with a 40% chance of obtaining a yield below the mean. Thus a 60% probability
indicated a 10% change of an above average yield, while a 40% probability indicated
a 10% change of getting a below average yield.
DM 5351 RSF and PAN 1521 R showed an above average yield probability (Table 19)
for all the yield potentials in the cool area. For the moderate area LS 6860 R and DM
6.8i RR showed above average figures over the whole production potential range
(Table 21 and 23). P61T38 R also performed above average for the warm areas
(Table 23).

South African Soybean Crop Quality Report 2019/2020 Season
60
10
Lo
calit
ies,
co
-op
erat
ors
an
d a
dd
ress
es o
f th
e cu
ltiv
ar t
rial
s, 2
019/
20
____
____
____
____
____
____
____
____
____
____
____
____
____
____
____
____
____
____
____
____
____
____
____
____
____
____
____
____
____
____
____
___
____
____
____
____
___
Nr
Lo
kalit
eit
Adr
es v
an p
roef
loka
litei
t
Tel
. no.
Ver
antw
oord
elik
e be
ampt
e N
o
Loca
lity
Adr
ess
of tr
ial l
ocal
ity
Tel
. nr.
R
espo
nsib
le o
ffice
r __
____
____
____
____
____
____
____
____
____
____
____
____
____
____
____
____
____
____
____
____
____
____
____
____
____
____
____
____
____
____
___
____
____
____
____
____
_ 1
Bap
sfon
tein
Cor
teva
Agr
isci
ence
Res
earc
h C
entr
e F
arm
Olif
ants
font
ein
R
50 M
odde
rfon
tein
Roa
d D
elm
as 2
210
013
665
2251
/082
969
198
1 A
Mat
hebu
la
2
B
elfa
st
G R
oos
Gel
uk B
elfa
st 1
100
08
2 37
5 89
99
L
Bro
nkho
rst
3
B
ergv
ille
J Ja
ckso
n S
ham
rock
H4
Ber
gvill
e 33
50
082
388
0311
R W
esse
ls
4
B
ethl
ehem
Kle
ingr
aan
Inst
ituut
Bet
hleh
em 9
700
082
375
8999
L B
ronk
hors
t 5
Bos
sies
-
08
2 37
5 89
99/0
83 6
60 2
521
G d
e B
eer
& L
Bro
nkho
rst
6
Brit
s K
2
K
2 N
avor
sing
stas
ie B
rits
0250
071
601
5092
D L
eeuw
ner
7
C
edar
a
C
edar
a P
/bag
X90
59 P
iete
rmar
itzbu
rg 3
200
033-
355
9495
/079
898
552
2 J
Ara
thoo
n 8
Cla
rens
D
Ter
blan
che
Tai
llefe
rt C
lare
ns 9
707
082
388
0311
R W
esse
ls
9
D
elm
as-P
anna
r
Pan
nar
Saa
d N
avor
sing
spla
as P
osbu
s 43
9 D
elm
as 2
210
013-
665
8524
/082
969
198
1 A
Mat
hebu
la
10
G
reyt
own
Pan
nar
Pro
efpl
aas
Pos
bus
19 G
reyt
own
3250
033-
413
9639
A J
arvi
e 11
Gro
bler
sdal
(A
gric
ol)
R L
ouw
De
Wag
ensr
ift B
5 S
uite
38
post
net G
robl
ersd
al 0
470
083
625
4906
/081
016
784
8 R
van
Nie
kerk
& C
Sch
oem
an
12
H
oops
tad
R T
alja
ard
Pos
bus
120
Hoo
psta
d 94
79
082
375
8999
/083
660
252
1 G
de
Bee
r &
L B
ronk
hors
t 13
Kin
ross
V
osst
offe
l Boe
rder
y P
osbu
s 80
Kin
ross
227
0
08
2 37
5 89
99
L
Bro
nkho
rst
14
K
roon
stad
Hoë
rsko
ol K
roon
stad
Kro
onst
ad 9
500
082
375
8999
L B
ronk
hors
t
15
Le
eudo
rings
tad
H
Fou
che
Son
derh
out L
eeud
orin
gsta
d 26
40
08
2 37
5 89
99/0
83 6
60 2
521
G d
e B
eer
& L
Bro
nkho
rst
16
Li
chte
nbur
g W
es
-
082
375
8999
/083
660
252
1 G
de
Bee
r &
L B
ronk
hors
t 17
Mar
ble
Hal
l
P L
ouw
Mar
ble
Hal
l 045
0
071
601
5092
D L
eeuw
ner
18
Pot
chef
stro
om S
eed
Co
See
d C
o R
esea
rch
Sta
tion
Pot
chef
stro
om 2
520
08
2 31
4 09
59
K
hulis
o 19
Sch
wei
zer
Ren
eke
J du
Ple
ssis
Sch
wei
zer
Ren
eke
2780
08
2 37
5 89
99/0
83 6
60 2
521
G d
e B
eer
& L
Bro
nkho
rst
20
Sto
ffber
g
P
Prin
sloo
Blin
kwat
er P
osbu
s 6
Sto
ffber
g 10
56
08
3 62
5 49
06/0
81 0
16 7
848
R v
an N
ieke
rk &
C S
choe
man
21
W
inte
rton
T
erry
Mui
rhea
d G
outo
n F
arm
Par
tner
ship
, Win
tert
on 3
340
084
701
9915
F
Mid
dlet
on
10

South African Soybean Crop Quality Report 2019/2020 Season
61
Tab
el
1 S
oja
bo
on
saad
eie
nskap
pe e
n i
nlig
tin
g o
or
vers
kaff
ers
, 2019/2
0
Tab
le 1
S
oyb
ean
seed
ch
ara
cte
risti
cs a
nd
in
form
ati
on
ab
ou
t ag
en
ts,
2019/2
0
----
----
----
----
----
----
----
----
----
----
----
----
----
----
----
----
----
----
----
----
----
----
----
----
----
----
----
----
----
----
----
----
----
----
----
----
----
----
----
----
----
----
----
----
----
----
----
----
----
----
----
----
----
----
----
----
----
----
----
----
----
----
K
ult
ivar
V
olw
assen
heid
s-
Gro
eiw
yse
Hil
um
kle
ur
Blo
mkle
ur
Haark
leu
r O
p v
ari
ete
its l
ys
Vers
kaff
er
T
ele
rsre
gte
C
ult
ivar
g
roep
eri
ng
s
Gro
wth
hab
it
Hil
um
co
lou
r F
low
er
co
lou
r P
ub
escen
ce
On
vari
ety
lis
t A
gen
t
Bre
ed
ing
rig
hts
M
atu
rity
Gro
up
*1
*2
*3
*4
--
----
----
----
----
----
----
----
----
----
----
----
----
----
----
----
----
----
----
----
----
----
----
----
----
----
----
----
----
----
----
----
----
----
----
----
----
----
----
----
----
----
----
----
----
----
----
----
----
----
----
----
----
----
----
----
----
----
----
----
----
----
--
P48T
48
R
4.8
I B
L
W
T
JA
/YE
S
Pio
neer
JA
/YE
S
DM
5351 R
SF
4.8
I IB
W
T
JA
/YE
S
GD
M S
eed
s
JA
/YE
S
DM
5953 R
SF
4.8
I IB
P
T
JA
/YE
S
GD
M S
eed
s
JA
/YE
S
SS
S 5
449 (
tuc)
4.9
I B
P
G
JA
/YE
S
Sen
sako
JA
/YE
S
DM
5302 R
SF
5.3
I L
B
P
G
JA
/YE
S
GD
M S
eed
s
JA
/YE
S
LD
C 5
.3
5.3
I B
W
G
JA
/YE
S
Lo
uis
e D
reyfu
s
N
EE
/NO
SS
S 5
052 (
tuc)
5.5
I B
W
G
JA
/YE
S
Sen
sako
JA
/YE
S
NA
5509
5.5
I B
L
P
B
JA
/YE
S
K2
N
EE
/NO
LS
6851 R
5.5
D
B
P
W
JA
/YE
S
Lin
k S
eed
JA
/YE
S
PA
N 1
575 R
5.5
I B
L
P
T
JA
/YE
S
Pan
nar
JA
/YE
S
PA
N 1
521 R
5.7
I IB
P
G
JA
/YE
S
Pan
nar
JA
/YE
S
PA
N 1
555 R
5.7
I B
P
T
JA
/YE
S
Pan
nar
JA
/YE
S
NS
5909 R
5.9
I IB
P
G
JA
/YE
S
K2
NE
E/N
O
LD
C 5
.9
5.9
I L
B
W
B
JA
/YE
S
Lo
uis
e D
reyfu
s
N
EE
/NO
DM
5901 R
SF
5.9
I L
B
W
G
JA
/YE
S
GD
M S
eed
s
JA
/YE
S
LS
6860 R
6.0
I B
P
W
JA
/YE
S
Lin
k S
eed
JA
/YE
S
LS
6164 R
6.0
I L
B
W
G
JA
/YE
S
Lin
k S
eed
JA
/YE
S
PA
N 1
663 R
6.0
I IB
P
G
JA
/YE
S
Pan
nar
JA
/YE
S
P61T
38 R
6.1
D
LB
W
G
JA
/YE
S
Pan
nar
JA
/YE
S
LS
6161 R
6.1
I IB
P
B
JA
/YE
S
L
ink S
eed
JA
/YE
S
SS
S 6
560 (
tuc)
6.2
I B
W
G
JA
/YE
S
Sen
sako
JA
/YE
S
NS
6448 R
6.4
SD
L
B
P
G
JA
/YE
S
K2
NE
E/N
O
P64T
39 R
6.4
I K
L
W
G
JA
/YE
S
Pan
nar
JA
/YE
S
PA
N 1
644 R
6.7
I IB
P
G
JA
/YE
S
Pan
nar
NE
E/N
O
LS
6868 R
6.8
I B
W
W
JA
/YE
S
Lin
k S
eed
JA
/YE
S
DM
6.8
i R
R
6.8
I B
P
G
JA
/YE
S
GD
M S
eed
s
JA
/YE
S
DM
6968 R
SF
6.9
I IB
P
G
JA
/YE
S
GD
M S
eed
s
JA
/YE
S
P71T
74 R
7.1
I K
L
W
G
JA
/YE
S
Pio
neer
JA
/YE
S
----
----
----
----
----
----
----
----
----
----
----
----
----
----
----
----
----
----
----
----
----
----
----
----
----
----
----
----
----
----
----
----
----
----
----
----
----
----
----
----
----
----
----
----
----
----
----
----
----
----
----
----
----
----
----
----
----
----
----
----
----
----
--
*1
D -
Bep
aald
/dete
rmin
ate
; I
- O
nb
ep
aald
/in
dete
rmin
ate
; S
D -
Sem
i-B
ep
aald
/sem
i d
ete
min
ate
*
2
BL
- S
wart
/bla
ck;
IB -
On
vo
llo
dig
sw
art
/im
perf
ect
bla
ck;
B -
Bru
in/b
row
n;
LB
- L
igb
ruin
/bu
ff;
G -
Gry
s/g
rey;
KL
- K
leu
rlo
os/b
uff
*
3
P -
Pers
/pu
rple
; W
- W
it/w
hit
e
*
4
B -
Bru
in/b
row
n;
G -
Gry
s/g
rey;
W -
Wit
/wh
ite;
T –
Taan
kle
uri
g/T
aw
ny
11
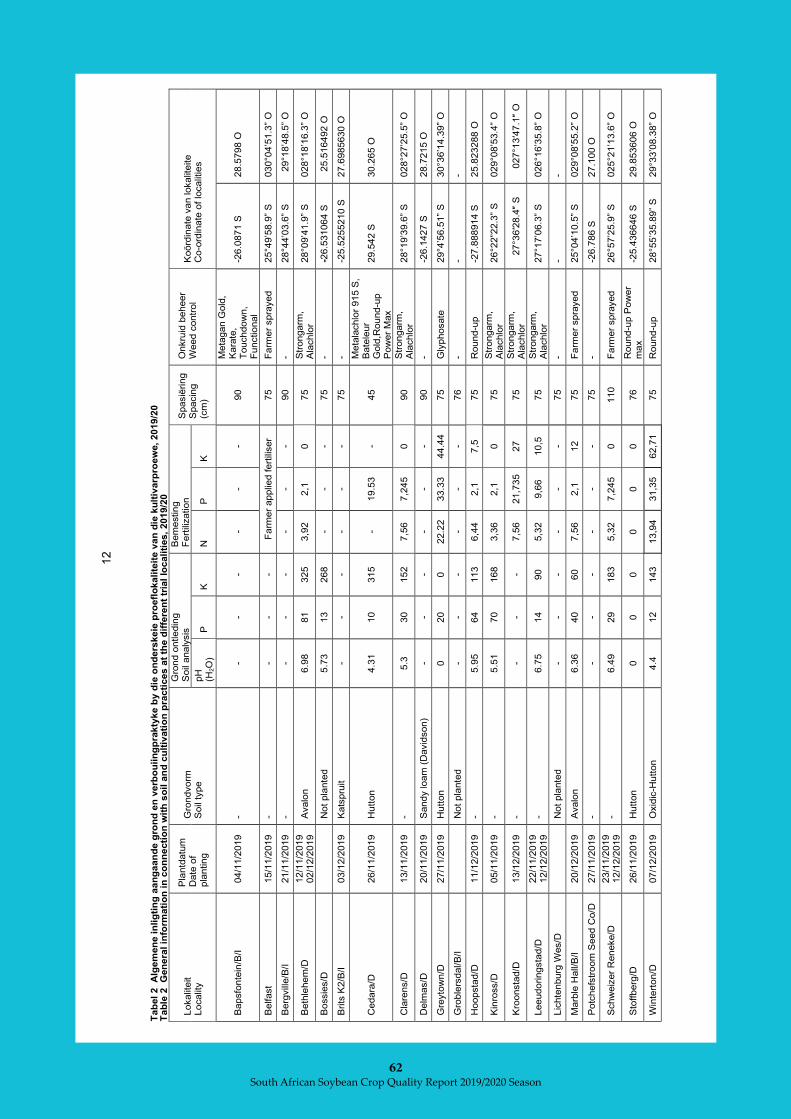
South African Soybean Crop Quality Report 2019/2020 Season
62
T
ab
el
2
Alg
em
en
e in
lig
tin
g a
an
ga
an
de
gro
nd
en
verb
ou
iin
gp
rakty
ke b
y d
ie o
nd
ers
keie
pro
efl
okali
teit
e v
an
die
ku
ltiv
arp
roew
e, 2019/2
0
Tab
le 2
G
en
era
l in
form
ati
on
in
co
nn
ecti
on
wit
h s
oil a
nd
cu
ltiv
ati
on
pra
cti
ces a
t th
e d
iffe
ren
t tr
ial
loc
ali
ties,
2019/2
0
Lokalit
eit
Localit
y
Pla
ntd
atu
m
Date
of
pla
ntin
g
Gro
ndvorm
S
oil
type
Gro
nd o
ntle
din
g
Soil
analy
sis
B
em
estin
g
Fe
rtili
zatio
n
Spasië
rin
g
Spacin
g
(cm
)
Onkru
id b
eheer
Weed c
ontr
ol
Koörd
inate
van lokalit
eite
Co-o
rdin
ate
of
localit
ies
pH
(H
2O
) P
K
N
P
K
Bapsfo
nte
in/B
/I
04/1
1/2
019
- -
- -
- -
- 90
Me
tagan G
old
, K
ara
te,
To
uchdow
n,
Fu
nctio
nal
-26.0
871 S
28.5
798 O
Belfast
15/1
1/2
019
- -
- -
Fa
rme
r applie
d fert
iliser
75
Fa
rme
r spra
yed
25°4
9’5
8.9
” S
030°0
4’5
1.3
” O
Berg
vill
e/B
/I
21/1
1/2
019
- -
- -
- -
- 90
- 28°4
4’0
3.6
” S
29°1
8’4
8.5
” O
Beth
lehem
/D
12/1
1/2
019
02/1
2/2
019
Avalo
n
6.9
8
81
325
3,9
2
2,1
0
75
Str
ongarm
, A
lachlo
r 28°0
9’4
1.9
” S
028°1
8’1
6.3
” O
Bossie
s/D
Not
pla
nte
d
5.7
3
13
268
- -
- 75
- -2
6.5
31064 S
25.5
16492 O
Brits
K2/B
/I
03/1
2/2
019
Kats
pru
it
- -
- -
- -
75
- -2
5.5
255210 S
27.6
985630 O
Cedara
/D
26/1
1/2
019
Hutt
on
4.3
1
10
315
- 19.5
3
- 45
Me
tala
chlo
r 915 S
, B
ate
leur
Gold
,Round
-up
Pow
er
Max
29.5
42 S
30.2
65 O
Cla
rens/D
13/1
1/2
019
- 5.3
30
152
7,5
6
7,2
45
0
90
Str
ongarm
, A
lachlo
r 28°1
9’3
9.6
” S
028°2
7’2
5.5
” O
Delm
as/D
20/1
1/2
019
Sandy lo
am
(D
avid
son)
- -
- -
- -
90
- -2
6.1
427 S
28.7
215 O
Gre
yto
wn/D
27/1
1/2
019
Hutt
on
0
20
0
22.2
2
33.3
3
44.4
4
75
Gly
phosate
29°4
’56.5
1”
S
30°3
6’1
4.3
9”
O
Gro
ble
rsdal/B
/I
N
ot
pla
nte
d
- -
- -
- -
76
- -
-
Hoopsta
d/D
11/1
2/2
019
- 5.9
5
64
113
6,4
4
2,1
7,5
75
Round
-up
-2
7.8
88914 S
25.8
23288 O
Kin
ross/D
05/1
1/2
019
- 5.5
1
70
168
3,3
6
2,1
0
75
Str
ongarm
, A
lachlo
r 26°2
2”2
2.3
” S
029°0
8’5
3.4
” O
Kro
onsta
d/D
13/1
2/2
019
- -
- -
7,5
6
21,7
35
27
75
Str
ongarm
, A
lachlo
r 27
°36′
28.4
″ S
027°
13′4
7.1″
O
Leeudoringsta
d/D
22/1
1/2
019
12/1
2/2
019
- 6.7
5
14
90
5,3
2
9,6
6
10,5
75
Str
ongarm
, A
lachlo
r 27°1
7’0
6.3
” S
026°1
6’3
5.8
” O
Lic
hte
nburg
Wes/D
Not
pla
nte
d
- -
- -
- -
75
- -
-
Ma
rble
Hall/
B/I
20/1
2/2
019
Avalo
n
6.3
6
40
60
7,5
6
2,1
12
75
Fa
rme
r spra
yed
25°0
4’1
0.5
” S
029°0
8’5
5.2
” O
Potc
hefs
troom
Seed C
o/D
27/1
1/2
019
- -
- -
- -
- 75
- -2
6.7
86 S
27.1
00 O
Schw
eiz
er
Reneke/D
23/1
1/2
019
12/1
2/2
019
- 6.4
9
29
183
5,3
2
7,2
45
0
110
Fa
rme
r spra
yed
26°5
7’2
5.9
” S
025°2
1’1
3.6
” O
Sto
ffberg
/D
26/1
1/2
019
Hutt
on
0
0
0
0
0
0
76
Round
-up P
ow
er
ma
x
-25.4
36646 S
29.8
53606 O
Win
tert
on/D
07/1
2/2
019
Oxid
ic-H
utt
on
4.4
12
143
13,9
4
31,3
5
62,7
1
75
Round
-up
28°5
5’3
5.8
9”
S
29°3
3’0
8.3
8”
O
12

South African Soybean Crop Quality Report 2019/2020 Season
63
Tabel 3 R
eënval en b
espro
eiing v
ir d
ie v
ers
kille
nde lokalite
ite (
mm
), 2
019/2
0
Ta
ble
3 R
ain
fall a
nd irr
igatio
n a
t th
e d
iffe
rent lo
calitie
s (
mm
), 2
019/2
0
Lokalite
it
Maandelikse r
eënval (m
m)/
T
ota
al
Bespro
eiing
To
taal
Locality
M
onth
ly r
ain
fall (
mm
) T
ota
l I
rrig
atio
n
To
tal
O
kt
Nov
Des
Jan
Fe
b
Mrt
A
pr
*
**
Beth
lehem
3,5
6
42,9
3
129,5
4
109,2
2
71,1
2
58,6
7
73,1
5
488,1
9
300
788,1
9
Cedara
29,9
7
131,3
1
116,5
8
155,9
5
147,3
1
104,6
4
76,7
1
762,4
7
0
762,4
7
Gre
yto
wn
- -
85,2
96,3
6
73,2
9
71,3
1
70,8
6
397,0
2
0
397,0
2
Schw
eiz
er
Reneke
0
62
124
91
60
123
70
530
0
530
Sto
ffberg
0
126
202
144
90
115
78
755
0
755
Win
tert
on
11
52
102
194
95
99
76
629
0
629
* V
ir r
eënval/F
or
rain
fall
* V
ir r
eënval en b
espro
eiing/F
or
rain
fall a
nd irr
igation
13

South African Soybean Crop Quality Report 2019/2020 Season
64
Ta
bel 4 D
ie a
anta
l dae v
anaf pla
nt to
t 50%
blo
msta
diu
m v
an d
ie v
ers
kille
nde s
oja
boonkultiv
ars
by d
ie v
ers
kille
nde p
roef
lokalite
ite,
2019/2
0
Ta
ble
4 T
he n
um
ber
of
days f
rom
pla
ntin
g t
o 5
0%
flo
werin
g s
tage o
f th
e d
iffe
rent soybean c
ultiv
ars
at th
e d
iffe
rent tr
ial lo
calitie
s,
2019/2
0
Kultivar
Cultivar
Koel/C
ool
Ma
tig
/Mo
dera
te
Warm
Bapsfontein
Bethlehem
Clarens
Kinross
Winterton
Gem/Mean
Bergville
Cedara
Kroonstad
Leeudoringstad
Stoffberg
Gem/Mean
Hoopstad
Schweizer-
Reneke
Gem/Mean
P48T
48 R
60
49
56
71
44
56
42
55
33
47
44
44
39
41
40
DM
5351 R
SF
60
49
56
71
44
56
42
55
33
44
44
44
39
35
37
DM
5953 R
SF
60
49
63
71
47
58
42
55
33
41
46
43
37
40
38
SS
S 5
449 (
tuc)
69
63
73
71
57
67
49
65
47
47
47
51
52
41
46
DM
5302 R
SF
70
63
73
74
55
67
42
64
39
49
53
49
54
45
50
LD
C 5
.3
71
75
73
71
57
69
56
63
47
49
47
52
41
44
42
SS
S 5
052 (
tuc)
71
70
77
76
60
71
56
67
64
57
54
60
49
46
48
NA
5509 R
71
70
89
73
63
73
63
68
47
58
52
58
52
49
51
LS
6851 R
69
63
73
71
58
67
49
64
47
49
51
52
50
51
51
PA
N 1
575 R
71
70
77
71
59
70
49
64
64
49
51
55
55
48
52
PA
N 1
521 R
73
70
77
80
62
72
66
68
64
55
61
63
54
52
53
PA
N 1
555 R
74
75
77
80
65
74
56
69
64
58
64
62
54
49
51
NS
5909 R
75
75
94
82
67
79
67
68
59
58
48
60
57
46
52
LD
C 5
.9
70
75
77
71
62
71
63
68
64
58
52
61
52
46
49
DM
5901 R
SF
73
70
73
73
59
70
49
67
64
52
63
59
52
49
51
LS
6860 R
76
75
94
73
65
77
70
72
64
59
63
65
53
54
54
LS
6164 R
72
70
89
76
59
73
70
67
64
53
60
63
52
49
51
PA
N 1
663 R
73
70
82
76
66
73
56
69
64
56
64
62
53
49
51
P61T
38 R
73
75
77
76
60
72
63
69
64
59
65
64
56
49
53
LS
6161 R
72
75
77
79
64
73
56
67
64
60
57
61
56
47
52
SS
S 6
560 (
tuc)
72
75
77
80
60
73
63
66
64
52
56
60
57
51
54
NS
6448 R
74
70
77
76
59
71
63
70
52
61
66
62
56
51
54
P64T
39 R
73
75
94
76
63
76
67
70
64
58
59
64
57
51
54
PA
N 1
644 R
73
75
94
79
66
77
63
69
64
59
66
64
56
53
54
LS
6868 R
74
70
94
80
66
77
67
73
52
55
65
62
59
41
50
DM
6.8
i R
R
72
70
77
80
65
73
67
70
59
59
66
64
58
52
55
DM
6968 R
SF
76
70
94
79
66
77
70
68
64
57
66
65
57
48
52
P71T
74 R
75
75
94
80
66
78
67
69
64
61
66
65
60
57
58
Gem
/Me
an
71
69
80
76
60
71
58
66
56
54
57
58
52
48
50
14

South African Soybean Crop Quality Report 2019/2020 Season
65
T
abel 5 D
ie a
anta
l dae v
anaf pla
nt to
t fisio
logie
sry
psta
diu
m v
an d
ie v
ers
kille
nde s
oja
boonkultiv
ars
by d
ie v
ers
kille
nde p
roef
lokalite
ite,
2019/2
0
Ta
ble
5 T
he n
um
ber
of
days f
rom
pla
ntin
g t
o p
hysio
logic
al m
atu
rity
of
the d
iffe
rent soybean c
ultiv
ars
at
the d
iffe
rent tr
ial lo
calities, 2019/2
0
Kultivar
Cultivar
Koel/C
ool
Ma
tig
/Mo
dera
te
Warm
Bethlehem
Clarens
Winterton
Gem/Mean
Bergville
Kroonstad
Leeudoringstad
Stoffberg
Gem/Mean
Hoopstad
Schweizer-Reneke
Gem/Mean
P48T
48 R
109
128
104
114
118
98
122
118
114
120
121
120
DM
5351 R
SF
109
128
114
117
130
98
121
119
117
120
121
120
DM
5953 R
SF
109
128
108
115
118
98
120
119
114
117
120
119
SS
S 5
449 (
tuc)
130
140
116
129
118
119
122
123
121
127
120
124
DM
5302 R
SF
130
140
114
128
118
115
120
121
119
118
122
120
LD
C 5
.3
126
145
123
131
125
126
128
125
126
120
121
120
SS
S 5
052 (
tuc)
130
145
123
133
125
126
126
131
127
128
125
126
NA
5509 R
126
145
125
132
125
119
129
128
125
127
125
126
LS
6851 R
130
149
118
132
125
126
124
130
126
131
121
126
PA
N 1
575 R
130
140
120
130
125
119
130
124
125
122
121
122
PA
N 1
521 R
121
140
118
126
130
119
121
128
125
120
127
123
PA
N 1
555 R
136
149
126
137
125
126
129
130
127
121
121
121
NS
5909 R
151
149
128
143
130
126
133
131
130
131
123
127
LD
C 5
.9
130
149
126
135
130
126
133
131
130
129
129
129
DM
5901 R
SF
145
140
122
136
125
126
128
126
126
131
125
128
LS
6860 R
151
154
127
144
130
126
132
130
130
134
125
129
LS
6164 R
135
145
125
135
137
126
126
128
129
133
123
128
PA
N 1
663 R
146
128
128
134
126
126
124
130
127
134
125
129
P61T
38 R
126
145
130
134
123
126
134
132
129
130
123
126
LS
6161 R
140
140
125
135
130
126
129
131
129
131
125
128
SS
S 6
560 (
tuc)
135
140
126
134
130
126
129
128
128
127
123
125
NS
6448 R
126
145
130
134
130
126
137
132
131
135
125
130
P64
T3
9 R
151
154
128
144
130
126
133
131
130
137
121
129
PA
N 1
644 R
136
145
127
136
126
126
132
135
130
137
133
135
LS
6868 R
140
154
132
142
- 126
136
134
132
138
128
133
DM
6.8
i R
R
145
149
130
141
137
126
136
135
133
140
127
134
DM
6968 R
SF
156
149
133
146
137
126
138
136
134
138
128
133
P71T
74 R
151
154
132
146
137
126
144
137
136
142
137
140
Gem
/Me
an
134
143
123
134
127
122
129
129
127
129
124
127
15
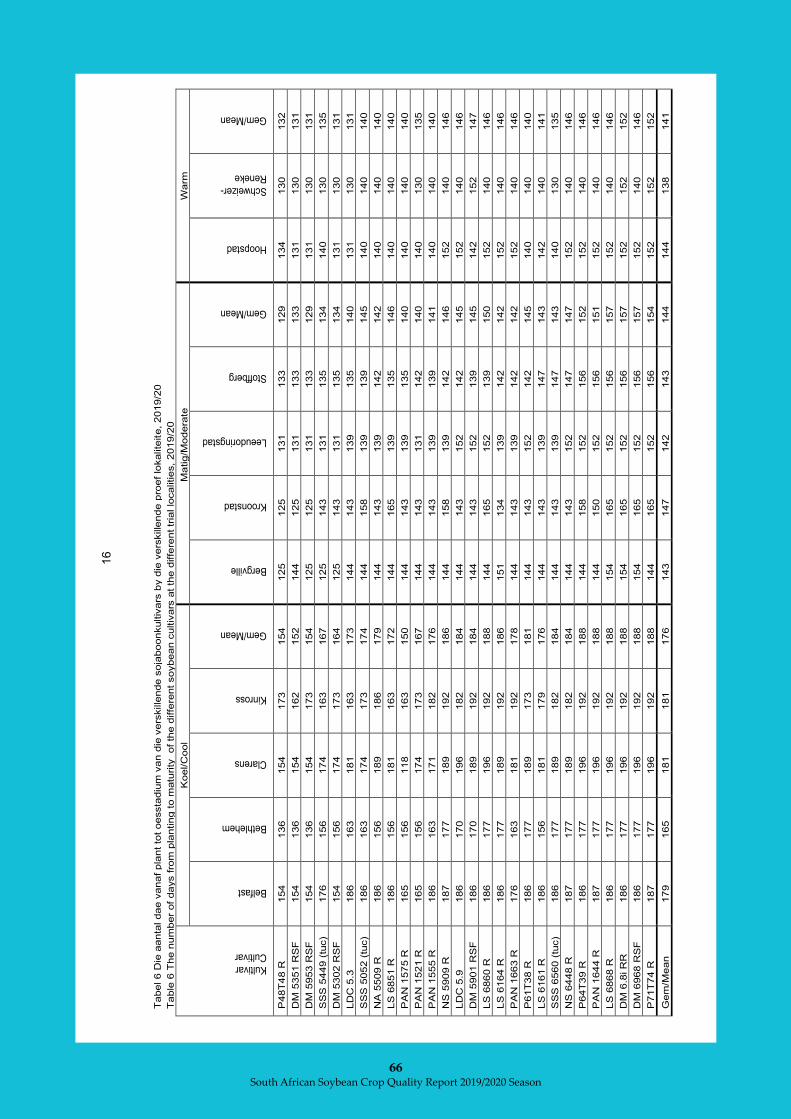
South African Soybean Crop Quality Report 2019/2020 Season
66
Ta
bel 6 D
ie a
anta
l dae v
anaf pla
nt to
t oessta
diu
m v
an d
ie v
ers
kille
nde s
oja
boonkultiv
ars
by d
ie v
ers
kille
nde p
roef
lokalite
ite, 2019/2
0
Ta
ble
6 T
he n
um
ber
of
days f
rom
pla
ntin
g t
o m
atu
rity
of th
e d
iffe
rent soybean c
ultiv
ars
at th
e d
iffe
rent tr
ial lo
calitie
s,
2019/2
0
Kultivar
Cultivar
Koel/C
ool
Ma
tig
/Mo
dera
te
Warm
Belfast
Bethlehem
Clarens
Kinross
Gem/Mean
Bergville
Kroonstad
Leeudoringstad
Stoffberg
Gem/Mean
Hoopstad
Schweizer-
Reneke
Gem/Mean
P48T
48 R
154
136
154
173
154
125
125
131
133
129
134
130
132
DM
5351 R
SF
154
136
154
162
152
144
125
131
133
133
131
130
131
DM
5953 R
SF
154
136
154
173
154
125
125
131
133
129
131
130
131
SS
S 5
449 (
tuc)
176
156
174
163
167
125
143
131
135
134
140
130
135
DM
5302 R
SF
154
156
174
173
164
125
143
131
135
134
131
130
131
LD
C 5
.3
186
163
181
163
173
144
143
139
135
140
131
130
131
SS
S 5
052 (
tuc)
186
163
174
173
174
144
158
139
139
145
140
140
140
NA
5509 R
186
156
189
186
179
144
143
139
142
142
140
140
140
LS
6851 R
186
156
181
163
172
144
165
139
135
146
140
140
140
PA
N 1
575 R
165
156
118
163
150
144
143
139
135
140
140
140
140
PA
N 1
521 R
165
156
174
173
167
144
143
131
142
140
140
130
135
PA
N 1
555 R
186
163
171
182
176
144
143
139
139
141
140
140
140
NS
5909 R
187
177
189
192
186
144
158
139
142
146
152
140
146
LD
C 5
.9
186
170
196
182
184
144
143
152
142
145
152
140
146
DM
5901 R
SF
186
170
189
192
184
144
143
152
139
145
142
152
147
LS
6860 R
186
177
196
192
188
144
165
152
139
150
152
140
146
LS
6164 R
186
177
189
192
186
151
134
139
142
142
152
140
146
PA
N 1
663 R
176
163
181
192
178
144
143
139
142
142
152
140
146
P61T
38 R
186
177
189
173
181
144
143
152
142
145
140
140
140
LS
6161 R
186
156
181
179
176
144
143
139
147
143
142
140
141
SS
S 6
560 (
tuc)
186
177
189
182
184
144
143
139
147
143
140
130
135
NS
6448 R
187
177
189
182
184
144
143
152
147
147
152
140
146
P64T
39 R
186
177
196
192
188
144
158
152
156
152
152
140
146
PA
N 1
644 R
187
177
196
192
188
144
150
152
156
151
152
140
146
LS
6868 R
186
177
196
192
188
154
165
152
156
157
152
140
146
DM
6.8
i R
R
186
177
196
192
188
154
165
152
156
157
152
152
152
DM
6968 R
SF
186
177
196
192
188
154
165
152
156
157
152
140
146
P71T
74 R
187
177
196
192
188
144
165
152
156
154
152
152
152
Gem
/Me
an
179
165
181
181
176
143
147
142
143
144
144
138
141
16

South African Soybean Crop Quality Report 2019/2020 Season
67
T
abel 7 D
ie p
lanth
oogte
van d
ie v
ers
kill
ende s
oja
boonkultiv
ars
by d
ie v
ers
kill
ende p
roef lo
kalit
eite,
2019/2
0
Table
7 T
he p
lant heig
ht o
f th
e d
iffe
rent soybean c
ultiv
ars
at th
e d
iffe
rent
tria
l lo
calit
ies, 2019/2
0
Kultivar Cultivar
Koel/C
ool
Matig/M
odera
te
Warm
Bapsfontein
Belfast
Bethlehem
Clarens
Kinross
Winterton
Gem/Mean
Bergville
Cedara
Greytown
Kroonstad
Leeudoringstad
Stoffberg
Gem/Mean
Hoopstad
Marble Hall
Schweizer-
Reneke
Gem/Mean
P48T
48 R
52
62
53
57
43
53
53
70
72
64
50
26
40
54
75
47
22
48
DM
5351 R
SF
69
73
72
62
53
67
66
100
90
84
57
50
45
71
65
62
56
61
DM
5953 R
SF
66
68
83
65
62
60
67
90
83
73
62
60
45
69
65
60
48
58
SS
S 5
449 (
tuc)
85
90
90
68
70
67
78
95
85
83
68
55
55
73
56
58
54
56
DM
5302 R
SF
76
88
82
63
63
60
72
85
75
70
55
45
50
63
80
57
44
60
LD
C 5
.3
73
88
92
73
63
67
76
105
83
80
65
42
50
71
71
50
49
57
SS
S 5
052 (
tuc)
91
92
93
68
73
77
82
110
88
81
68
70
70
81
90
60
55
68
NA
5509 R
87
88
100
75
77
73
83
95
92
87
67
56
56
75
100
60
61
74
LS
6851 R
59
77
80
57
42
60
62
60
70
73
52
42
35
55
66
52
43
54
PA
N 1
575 R
80
92
95
72
62
77
80
95
92
82
72
45
55
74
90
63
48
67
PA
N 1
521 R
87
97
108
85
90
70
90
105
90
79
72
75
62
80
98
62
49
70
PA
N 1
555 R
86
100
90
75
70
73
82
110
96
85
73
75
60
83
100
65
69
78
NS
5909 R
80
95
95
72
75
70
81
110
92
82
78
70
65
83
100
62
70
77
LD
C 5
.9
83
103
110
73
88
70
88
100
91
89
78
80
58
83
75
65
68
69
DM
5901 R
SF
86
93
90
75
68
63
79
95
84
78
60
71
70
76
90
63
60
71
LS
6860 R
100
102
103
80
77
83
91
110
98
92
80
65
75
87
116
68
86
90
LS
6164 R
99
102
112
77
83
80
92
105
110
91
68
87
60
87
85
72
62
73
PA
N 1
663 R
80
90
98
73
65
73
80
105
85
82
73
58
52
76
96
65
71
77
P61T
38 R
71
77
78
63
47
67
67
65
76
78
57
45
28
58
65
45
29
46
LS
6161 R
95
102
103
83
70
83
89
90
87
94
78
75
63
81
90
63
76
76
SS
S 6
560 (
tuc)
90
88
113
78
80
70
87
105
99
89
72
80
61
84
95
70
78
81
NS
6448 R
78
82
93
70
60
77
77
95
90
89
67
55
60
76
90
58
67
72
P64T
39 R
91
102
107
77
93
73
90
110
102
90
78
80
68
88
106
67
78
83
PA
N 1
644 R
94
97
82
77
80
70
83
100
90
89
67
70
61
80
66
63
71
67
LS
6868 R
87
98
95
70
63
83
83
105
80
85
67
56
44
73
65
58
50
58
DM
6.8
i R
R
107
118
120
92
92
87
103
110
120
106
63
80
56
89
113
85
90
96
DM
6968 R
SF
95
97
97
67
83
87
88
110
100
92
80
50
59
82
85
77
90
84
P71T
74 R
107
103
103
84
93
73
94
110
102
96
82
45
48
81
122
83
71
92
Gem
/Mean
84
92
94
73
71
72
81
98
90
84
68
61
55
76
86
63
61
70
17

South African Soybean Crop Quality Report 2019/2020 Season
68
T
abel 8 D
ie p
eulh
oogte
van d
ie v
ers
kille
nde s
oja
boonkultiv
ars
by d
ie v
ers
kille
nde p
roef lo
kalite
ite,
2019/2
0
T
able
8 T
he p
od h
eig
ht of th
e d
iffe
rent
soybean c
ultiv
ars
at th
e d
iffe
rent
tria
l lo
calities,
2019/2
0
Kultivar
Cultivar
Koel/C
ool
Matig/M
odera
te
Warm
Bapsfontein
Belfast
Bethlehem
Clarens
Kinross
Winterton
Gem/Mean
Bergville
Cedara
Greytown
Kroonstad
Leeudoringstad
Stoffberg
Gem/Mean
Hoopstad
Marble Hall
Schweizer-Reneke
Gem/Mean
P48T
48 R
6
9
1
1
4
5
4
5
10
9
1
1
4
5
11
2
1
5
DM
5351 R
SF
6
6
4
1
6
5
5
10
11
15
2
5
5
8
4
5
5
5
DM
5953 R
SF
7
9
6
2
8
8
7
8
10
11
3
5
5
7
4
4
2
4
SS
S 5
449 (
tuc)
9
8
9
5
9
11
9
8
12
14
4
5
3
8
5
5
4
5
DM
5302 R
SF
6
9
7
3
5
6
6
8
13
14
3
3
6
8
9
2
4
5
LD
C 5
.3
11
9
10
5
6
5
8
13
10
13
3
4
6
8
6
3
3
4
SS
S 5
052 (
tuc)
14
10
10
8
11
13
11
10
15
19
6
6
15
12
15
8
7
10
NA
5509 R
14
12
11
6
9
9
10
10
16
16
3
5
3
9
14
6
6
9
LS
6851 R
9
8
12
3
3
7
7
5
16
18
2
5
1
8
6
4
1
4
PA
N 1
575 R
12
12
8
1
6
11
8
10
15
16
3
4
7
9
13
7
5
8
PA
N 1
521 R
8
13
13
7
12
13
11
10
19
18
7
10
11
12
16
7
4
9
PA
N 1
555 R
15
13
12
6
6
16
12
18
19
20
8
5
13
14
14
7
5
9
NS
5909 R
13
11
16
10
12
18
13
11
19
21
14
14
13
15
14
9
4
9
LD
C 5
.9
8
14
15
6
5
7
9
10
15
14
6
11
4
10
11
6
10
9
DM
5901 R
SF
10
11
11
7
7
9
9
10
14
14
3
5
8
9
12
9
5
9
LS
6860 R
15
11
14
9
8
17
13
10
15
21
9
5
15
13
20
9
19
16
LS
6164 R
15
12
13
7
10
15
12
15
16
21
5
9
5
12
9
8
4
7
PA
N 1
663 R
10
10
9
5
7
11
9
15
14
15
5
9
6
11
10
8
10
10
P61T
38 R
17
12
13
6
6
13
11
10
18
21
9
5
2
11
10
7
1
6
LS
6161 R
17
12
12
10
7
19
13
10
15
18
9
10
8
12
11
7
11
9
SS
S 6
560 (
tuc)
10
12
14
8
9
10
11
18
17
21
7
8
7
13
9
8
8
8
NS
6448 R
13
11
13
10
6
10
11
10
16
21
8
5
5
11
11
4
5
7
P64T
39 R
13
13
14
6
11
11
11
19
17
16
8
5
6
12
12
3
8
8
PA
N 1
644 R
11
11
10
5
4
8
8
12
15
20
3
6
9
11
6
3
5
5
LS
6868 R
12
14
11
6
7
13
11
16
14
20
6
5
3
11
9
4
4
6
DM
6.8
i R
R
15
13
14
8
11
9
12
17
15
17
9
9
7
12
17
7
11
11
DM
6968 R
SF
20
15
14
8
14
16
15
17
15
21
13
5
8
13
9
10
11
10
P71T
74 R
19
12
15
9
13
14
14
10
16
19
8
4
4
10
20
8
6
11
Gem
/Mean
12
11
11
6
8
11
10
12
15
17
6
6
7
10
11
6
6
8
18

South African Soybean Crop Quality Report 2019/2020 Season
69
T
abel 9 O
mvalw
aarn
em
ings (
1-5
) van d
ie v
ers
kill
ende s
oja
boonkultiv
ars
by d
ie v
ers
kille
nde p
roef
lokalit
eite,
2019/2
0
Table
9 L
odgin
g d
at
(1-5
) of th
e d
iffe
rent soybean c
ultiv
ars
at th
e d
iffe
rent
tria
l lo
calit
ies, 2019/2
0
Kultivar
Cultivar
Koel/C
ool
Matig/M
odera
te
Warm
Bapsfontein
Belfast
Bethlehem
Clarens
Kinross
Winterton
Gem/Mean
Bergville
Greytown
Kroonstad
Leeudoringstad
Stoffberg
Gem/Mean
Hoopstad
Marble Hall
Schweizer-
Reneke
Gem/Mean
P48T
48 R
1,6
7
1,0
0
1,0
0
1,0
0
1,0
0
1,0
0
1,1
1
1,0
0
1,0
0
1,0
0
1,0
0
1,0
0
1,0
0
1,0
0
1,0
0
1,0
0
1,0
0
DM
5351 R
SF
3,0
0
1,0
0
1,0
0
1,0
0
1,0
0
1,0
0
1,3
3
4,0
0
1,0
0
1,0
0
1,0
0
1,0
0
1,6
0
1,0
0
1,0
0
1,0
0
1,0
0
DM
5953 R
SF
2,0
0
1,0
0
1,0
0
1,0
0
1,0
0
1,0
0
1,1
7
1,0
0
1,0
0
1,0
0
1,0
0
1,0
0
1,0
0
1,0
0
1,0
0
1,0
0
1,0
0
SS
S 5
449 (
tuc)
2,6
7
1,0
0
1,0
0
1,0
0
1,0
0
1,0
0
1,2
8
1,0
0
1,0
0
1,0
0
1,0
0
1,0
0
1,0
0
1,0
0
1,0
0
1,0
0
1,0
0
DM
5302 R
SF
2,6
7
1,0
0
1,0
0
1,0
0
1,0
0
1,0
0
1,2
8
1,0
0
1,0
0
1,0
0
1,0
0
1,0
0
1,0
0
1,0
0
1,0
0
1,0
0
1,0
0
LD
C 5
.3
2,3
3
1,0
0
1,0
0
1,0
0
1,0
0
1,0
0
1,2
2
1,0
0
1,3
3
1,0
0
1,0
0
1,0
0
1,0
7
1,0
0
1,0
0
1,0
0
1,0
0
SS
S 5
052 (
tuc)
2,6
7
1,0
0
1,0
0
1,0
0
1,0
0
1,0
0
1,2
8
1,0
0
1,3
3
1,0
0
1,0
0
2,0
0
1,2
7
1,0
0
1,0
0
1,0
0
1,0
0
NA
5509 R
2,6
7
1,0
0
1,0
0
1,0
0
1,0
0
1,0
0
1,2
8
5,0
0
1,0
0
1,0
0
1,0
0
2,0
0
2,0
0
1,0
0
1,0
0
1,0
0
1,0
0
LS
6851 R
1,0
0
1,0
0
1,0
0
1,0
0
1,0
0
1,0
0
1,0
0
1,0
0
1,3
3
1,0
0
1,0
0
1,0
0
1,0
7
1,0
0
1,3
3
1,0
0
1,1
1
PA
N 1
575 R
2,0
0
1,0
0
1,0
0
1,0
0
1,0
0
1,0
0
1,1
7
1,0
0
1,0
0
1,0
0
1,0
0
1,0
0
1,0
0
1,0
0
1,0
0
1,0
0
1,0
0
PA
N 1
521 R
3,0
0
1,0
0
2,0
0
1,0
0
1,0
0
1,0
0
1,5
0
1,0
0
1,0
0
1,0
0
1,0
0
1,0
0
1,0
0
1,0
0
1,0
0
1,0
0
1,0
0
PA
N 1
555 R
3,0
0
1,0
0
1,0
0
1,0
0
1,0
0
1,0
0
1,3
3
1,0
0
1,0
0
1,0
0
1,0
0
1,0
0
1,0
0
1,0
0
1,0
0
1,0
0
1,0
0
NS
5909 R
3,3
3
1,0
0
1,0
0
1,0
0
1,0
0
1,0
0
1,3
9
1,0
0
1,0
0
1,0
0
1,0
0
1,0
0
1,0
0
1,0
0
1,0
0
1,0
0
1,0
0
LD
C 5
.9
3,0
0
1,0
0
2,0
0
1,0
0
1,0
0
1,0
0
1,5
0
4,0
0
1,0
0
1,0
0
1,0
0
1,0
0
1,6
0
1,0
0
1,0
0
1,0
0
1,0
0
DM
5901 R
SF
2,3
3
1,0
0
1,0
0
1,0
0
1,0
0
1,0
0
1,2
2
1,0
0
1,0
0
1,0
0
1,0
0
1,0
0
1,0
0
1,0
0
1,0
0
1,0
0
1,0
0
LS
6860 R
3,3
3
1,0
0
1,0
0
1,0
0
1,0
0
1,0
0
1,3
9
4,0
0
1,6
7
1,0
0
1,0
0
2,0
0
1,9
3
1,0
0
1,0
0
1,0
0
1,0
0
LS
6164 R
3,3
3
1,0
0
2,3
3
1,0
0
1,0
0
1,0
0
1,6
1
3,0
0
1,0
0
1,0
0
1,0
0
2,0
0
1,6
0
1,0
0
1,0
0
1,0
0
1,0
0
PA
N 1
663 R
2,3
3
1,0
0
1,0
0
1,0
0
1,0
0
1,0
0
1,2
2
5,0
0
1,0
0
1,0
0
1,0
0
1,0
0
1,8
0
1,0
0
1,0
0
1,0
0
1,0
0
P61T
38 R
2,0
0
1,0
0
1,0
0
1,0
0
1,0
0
1,0
0
1,1
7
1,0
0
1,0
0
1,0
0
1,0
0
1,0
0
1,0
0
1,0
0
1,0
0
1,0
0
1,0
0
LS
6161 R
3,0
0
1,0
0
1,0
0
1,0
0
1,0
0
1,0
0
1,3
3
3,0
0
1,0
0
1,0
0
1,0
0
2,0
0
1,6
0
1,0
0
1,0
0
1,0
0
1,0
0
SS
S 6
560 (
tuc)
3,0
0
1,0
0
2,3
3
1,0
0
1,0
0
1,0
0
1,5
6
2,3
3
1,0
0
1,0
0
1,0
0
2,0
0
1,4
7
1,0
0
1,0
0
1,0
0
1,0
0
NS
6448 R
2,3
3
1,0
0
1,0
0
1,0
0
1,0
0
1,0
0
1,2
2
3,0
0
1,0
0
1,0
0
1,0
0
1,0
0
1,4
0
1,0
0
1,0
0
1,0
0
1,0
0
P64T
39 R
3,3
3
1,0
0
3,0
0
1,0
0
1,0
0
1,0
0
1,7
2
1,0
0
1,0
0
1,0
0
1,0
0
1,0
0
1,0
0
1,0
0
1,0
0
1,0
0
1,0
0
PA
N 1
644 R
3,0
0
1,0
0
1,0
0
1,0
0
1,0
0
1,0
0
1,3
3
1,0
0
1,0
0
1,0
0
1,0
0
1,0
0
1,0
0
1,0
0
1,0
0
1,0
0
1,0
0
LS
6868 R
2,6
7
1,0
0
1,0
0
1,0
0
1,0
0
1,0
0
1,2
8
5,0
0
1,0
0
1,0
0
1,0
0
1,0
0
1,8
0
1,0
0
1,0
0
1,0
0
1,0
0
DM
6.8
i R
R
3,3
3
1,0
0
1,3
3
1,0
0
1,0
0
1,6
7
1,5
6
4,0
0
1,6
7
1,0
0
1,0
0
1,0
0
1,7
3
1,0
0
1,0
0
1,0
0
1,0
0
DM
6968 R
SF
4,0
0
1,6
7
1,3
3
1,0
0
1,0
0
1,0
0
1,6
7
5,0
0
1,0
0
1,0
0
1,0
0
1,0
0
1,8
0
1,0
0
1,0
0
1,0
0
1,0
0
P71T
74 R
3,6
7
1,0
0
1,3
3
1,0
0
1,0
0
1,3
3
1,5
6
1,0
0
1,0
0
1,0
0
1,0
0
1,0
0
1,0
0
1,0
0
1,0
0
1,0
0
1,0
0
Gem
/Mean
2,7
4
1,0
2
1,2
7
1,0
0
1,0
0
1,0
4
1,3
5
2,2
6
1,0
8
1,0
0
1,0
0
1,2
1
1,3
1
1,0
0
1,0
1
1,0
0
1,0
0
19

South African Soybean Crop Quality Report 2019/2020 Season
70
T
abel 10 G
roensta
m (
1-5
) v
an d
ie v
ers
kill
ende s
oja
boonkultiv
ars
by d
ie v
ers
kill
ende p
roef lo
kalit
eite,
2019/2
0
T
able
10 G
reenste
m (
1-5
) of th
e d
iffe
rent soybean c
ultiv
ars
at th
e d
iffe
rent
tria
l lo
calit
ies, 2019/2
0
Kultivar
Cultivar
Koel/C
ool
Ma
tig
/Mo
dera
te
Warm
Bapsfontein
Belfast
Bethlehem
Clarens
Kinross
Winterton
Gem/Mean
Bergville
Cedara
Kroonstad
Leeudoringstad
Stoffberg
Gem/Mean
Hoopstad
Marble Hall
Schweizer-
Reneke
Gem/Mean
P48T
48 R
1,3
3
5,0
0
1,0
0
1,0
0
1,0
0
1,0
0
1,7
2
1,0
0
1,0
0
2,3
3
1,0
0
1,0
0
1,2
7
3,0
0
3,6
7
1,0
0
2,5
6
DM
5351 R
SF
1,6
7
3,3
3
1,0
0
1,0
0
1,0
0
1,0
0
1,5
0
4,0
0
1,0
0
1,0
0
3,0
0
3,0
0
2,4
0
2,0
0
2,6
7
1,0
0
1,8
9
DM
5953 R
SF
1,0
0
1,0
0
1,0
0
1,0
0
1,0
0
1,0
0
1,0
0
1,0
0
1,0
0
1,3
3
1,0
0
1,0
0
1,0
7
1,0
0
1,0
0
1,0
0
1,0
0
SS
S 5
449 (
tuc)
1,3
3
2,0
0
1,0
0
1,0
0
1,0
0
1,0
0
1,2
2
1,0
0
1,0
0
1,0
0
1,0
0
4,0
0
1,6
0
3,0
0
1,0
0
1,0
0
1,6
7
DM
5302 R
SF
1,3
3
3,0
0
1,0
0
1,0
0
1,0
0
1,0
0
1,3
9
1,0
0
1,0
0
1,0
0
1,0
0
1,0
0
1,0
0
1,0
0
1,0
0
1,0
0
1,0
0
LD
C 5
.3
2,3
3
2,6
7
1,0
0
1,0
0
1,0
0
1,0
0
1,5
0
1,0
0
1,0
0
1,0
0
3,0
0
3,0
0
1,8
0
3,0
0
1,0
0
1,0
0
1,6
7
SS
S 5
052 (
tuc)
2,0
0
2,0
0
1,3
3
1,0
0
2,0
0
1,0
0
1,5
6
1,0
0
1,3
3
1,0
0
1,0
0
2,0
0
1,2
7
1,0
0
1,3
3
1,0
0
1,1
1
NA
5509 R
2,3
3
1,0
0
1,0
0
1,0
0
1,0
0
1,0
0
1,2
2
1,0
0
1,0
0
1,0
0
1,0
0
2,0
0
1,2
0
1,0
0
2,0
0
1,0
0
1,3
3
LS
6851 R
1,0
0
1,0
0
1,0
0
1,0
0
1,0
0
1,0
0
1,0
0
1,0
0
1,0
0
1,6
7
1,0
0
5,0
0
1,9
3
5,0
0
2,6
7
2,6
7
3,4
4
PA
N 1
575 R
1,3
3
3,6
7
1,0
0
1,0
0
1,0
0
1,0
0
1,5
0
2,0
0
1,0
0
1,0
0
1,0
0
5,0
0
2,0
0
5,0
0
1,0
0
1,0
0
2,3
3
PA
N 1
521 R
1,0
0
3,0
0
1,0
0
1,0
0
1,0
0
1,0
0
1,3
3
1,0
0
1,0
0
1,0
0
1,0
0
5,0
0
1,8
0
1,0
0
1,3
3
1,0
0
1,1
1
PA
N 1
555 R
2,3
3
1,0
0
1,3
3
1,0
0
1,0
0
1,0
0
1,2
8
1,0
0
1,0
0
1,0
0
2,0
0
2,0
0
1,4
0
5,0
0
1,0
0
1,0
0
2,3
3
NS
5909 R
2,6
7
2,6
7
1,0
0
1,0
0
1,0
0
1,0
0
1,5
6
1,0
0
2,0
0
1,0
0
1,0
0
5,0
0
2,0
0
5,0
0
2,0
0
1,0
0
2,6
7
LD
C 5
.9
2,0
0
1,3
3
1,0
0
1,0
0
2,0
0
1,0
0
1,3
9
1,0
0
1,0
0
1,0
0
1,0
0
5,0
0
1,8
0
1,0
0
1,0
0
1,6
7
1,2
2
DM
5901 R
SF
2,3
3
3,0
0
1,0
0
1,0
0
1,0
0
1,0
0
1,5
6
1,0
0
1,0
0
1,0
0
1,0
0
1,0
0
1,0
0
1,0
0
2,3
3
1,0
0
1,4
4
LS
6860 R
3,0
0
2,3
3
1,0
0
1,0
0
1,3
3
1,0
0
1,6
1
1,0
0
1,0
0
1,3
3
1,0
0
3,0
0
1,4
7
1,0
0
1,3
3
1,0
0
1,1
1
LS
6164 R
3,0
0
1,0
0
1,0
0
1,0
0
1,0
0
1,0
0
1,3
3
1,0
0
1,0
0
1,0
0
2,0
0
2,0
0
1,4
0
3,3
3
2,3
3
1,0
0
2,2
2
PA
N 1
663 R
1,6
7
1,0
0
1,0
0
1,0
0
1,0
0
1,0
0
1,1
1
1,0
0
1,0
0
1,0
0
1,0
0
1,0
0
1,0
0
1,0
0
1,0
0
1,0
0
1,0
0
P61T
38 R
2,3
3
2,0
0
1,0
0
1,0
0
2,0
0
1,0
0
1,5
6
1,0
0
1,3
3
1,0
0
1,0
0
1,0
0
1,0
7
4,0
0
1,6
7
1,0
0
2,2
2
LS
6161 R
3,0
0
1,0
0
1,6
7
1,0
0
1,3
3
1,0
0
1,5
0
3,0
0
1,0
0
1,0
0
1,0
0
1,0
0
1,4
0
1,0
0
3,0
0
1,0
0
1,6
7
SS
S 6
560 (
tuc)
2,3
3
1,0
0
1,0
0
1,0
0
2,0
0
1,0
0
1,3
9
1,0
0
1,0
0
1,0
0
2,0
0
4,0
0
1,8
0
3,0
0
2,3
3
1,0
0
2,1
1
NS
6448 R
2,0
0
1,0
0
1,0
0
1,0
0
2,0
0
1,0
0
1,3
3
1,0
0
1,0
0
1,0
0
1,0
0
4,0
0
1,6
0
1,0
0
1,0
0
1,0
0
1,0
0
P64T
39 R
3,6
7
1,6
7
1,0
0
1,0
0
1,0
0
1,0
0
1,5
6
1,0
0
1,0
0
1,0
0
1,0
0
1,0
0
1,0
0
1,0
0
1,0
0
1,0
0
1,0
0
PA
N 1
644 R
2,3
3
1,0
0
1,0
0
1,0
0
1,0
0
1,0
0
1,2
2
1,0
0
1,0
0
1,0
0
1,0
0
1,0
0
1,0
0
3,3
3
1,3
3
1,0
0
1,8
9
LS
6868 R
3,6
7
3,0
0
1,0
0
1,0
0
1,0
0
1,0
0
1,7
8
1,0
0
1,0
0
1,0
0
1,0
0
2,0
0
1,2
0
3,6
7
1,6
7
2,0
0
2,4
4
DM
6.8
i R
R
3,3
3
2,0
0
1,0
0
1,0
0
1,0
0
1,0
0
1,5
6
1,0
0
1,0
0
1,0
0
1,0
0
1,0
0
1,0
0
2,3
3
3,6
7
1,0
0
2,3
3
DM
6968 R
SF
3,6
7
3,6
7
1,0
0
1,0
0
2,0
0
1,0
0
2,0
6
1,0
0
2,3
3
2,0
0
2,0
0
1,0
0
1,6
7
1,0
0
2,6
7
2,0
0
1,8
9
P71T
74 R
3,0
0
4,0
0
1,0
0
1,0
0
2,0
0
1,0
0
2,0
0
1,0
0
1,0
0
1,0
0
3,0
0
1,0
0
1,4
0
5,0
0
3,6
7
1,0
0
3,2
2
Gem
/Me
an
2,2
5
2,1
5
1,0
5
1,0
0
1,2
7
1,0
0
1,4
5
1,2
1
1,1
1
1,1
3
1,3
6
2,4
3
1,4
5
2,4
5
1,8
5
1,1
5
1,8
2
20

South African Soybean Crop Quality Report 2019/2020 Season
71
T
abel 11 O
opsprin
g (
1-5
) v
an d
ie v
ers
kille
nde s
oja
boonkultiv
ars
by d
ie v
ers
kille
nde p
roef lo
kalite
ite,
2019/2
0
Ta
ble
11 S
hatt
erin
g (
1-5
) o
f th
e d
iffe
rent soybean c
ultiv
ars
at th
e d
iffe
rent
tria
l lo
calities, 2019/2
0
Kultivar Cultivar
Koel/C
ool
Ma
tig
/Mo
deera
te
Warm
Bapsfontein
Belfast
Bethlehem
Clarens
Kinross
Winterton
Gem/Mean
Cedara
Kroonstad
Leeudoringstad
Stoffberg
Gem/Mean
Hoopstad
Marble Hall
Schweizer-
Reneke
Gem/Mean
P48T
48 R
1,3
3
1,0
0
1,0
0
1,0
0
1,6
7
1,0
0
1,1
7
1,0
0
1,0
0
1,0
0
1,0
0
1,0
0
1,0
0
1,0
0
1,0
0
1,0
0
DM
5351 R
SF
1,3
3
1,0
0
1,0
0
1,0
0
2,0
0
1,0
0
1,2
2
1,0
0
1,0
0
1,0
0
2,0
0
1,2
5
1,0
0
1,0
0
1,0
0
1,0
0
DM
5953 R
SF
1,0
0
1,0
0
1,0
0
1,0
0
1,0
0
1,0
0
1,0
0
1,0
0
1,0
0
1,0
0
2,0
0
1,2
5
1,0
0
1,0
0
1,0
0
1,0
0
SS
S 5
449 (
tuc)
1,6
7
1,0
0
1,0
0
1,0
0
1,0
0
1,0
0
1,1
1
1,0
0
1,0
0
1,0
0
3,0
0
1,5
0
1,0
0
1,6
7
1,0
0
1,2
2
DM
5302 R
SF
1,6
7
1,0
0
1,0
0
1,0
0
1,3
3
1,0
0
1,1
7
1,0
0
1,0
0
1,0
0
1,0
0
1,0
0
1,0
0
1,0
0
1,0
0
1,0
0
LD
C 5
.3
1,0
0
1,0
0
1,0
0
1,0
0
1,0
0
1,0
0
1,0
0
1,0
0
1,0
0
1,0
0
1,0
0
1,0
0
1,0
0
1,0
0
1,0
0
1,0
0
SS
S 5
052 (
tuc)
1,3
3
1,0
0
1,0
0
1,0
0
1,0
0
1,0
0
1,0
6
1,0
0
1,0
0
1,0
0
1,0
0
1,0
0
1,0
0
1,0
0
1,0
0
1,0
0
NA
5509 R
1,0
0
1,0
0
1,0
0
1,0
0
1,0
0
1,0
0
1,0
0
1,0
0
1,0
0
1,0
0
1,0
0
1,0
0
1,0
0
1,0
0
1,0
0
1,0
0
LS
6851 R
1,3
3
1,0
0
1,0
0
1,0
0
1,0
0
1,0
0
1,0
6
1,0
0
1,0
0
1,0
0
1,0
0
1,0
0
1,0
0
1,0
0
1,0
0
1,0
0
PA
N 1
575 R
1,3
3
1,0
0
1,0
0
1,0
0
1,0
0
1,0
0
1,0
6
1,0
0
1,0
0
1,0
0
2,0
0
1,2
5
1,0
0
1,0
0
1,0
0
1,0
0
PA
N 1
521 R
1,0
0
1,0
0
1,0
0
1,0
0
1,0
0
1,0
0
1,0
0
1,0
0
1,0
0
1,0
0
2,0
0
1,2
5
1,0
0
1,0
0
1,0
0
1,0
0
PA
N 1
555 R
1,3
3
1,0
0
1,0
0
1,0
0
1,0
0
1,0
0
1,0
6
1,0
0
1,0
0
1,0
0
1,0
0
1,0
0
1,0
0
1,0
0
1,0
0
1,0
0
NS
5909 R
1,0
0
1,0
0
1,0
0
1,0
0
1,0
0
1,0
0
1,0
0
1,0
0
1,0
0
1,0
0
1,0
0
1,0
0
1,0
0
1,0
0
1,0
0
1,0
0
LD
C 5
.9
1,0
0
1,0
0
1,0
0
1,0
0
1,0
0
1,0
0
1,0
0
1,0
0
1,0
0
1,0
0
1,0
0
1,0
0
1,0
0
1,0
0
1,0
0
1,0
0
DM
5901 R
SF
1,3
3
1,0
0
1,0
0
1,0
0
1,0
0
1,0
0
1,0
6
1,0
0
1,0
0
1,0
0
1,0
0
1,0
0
1,0
0
1,0
0
1,0
0
1,0
0
LS
6860 R
1,0
0
1,0
0
1,0
0
1,0
0
1,0
0
1,0
0
1,0
0
1,0
0
1,0
0
1,0
0
2,0
0
1,2
5
1,0
0
1,0
0
1,0
0
1,0
0
LS
6164 R
1,0
0
1,0
0
1,0
0
1,0
0
1,0
0
1,0
0
1,0
0
1,0
0
1,0
0
1,0
0
1,0
0
1,0
0
1,0
0
1,0
0
1,0
0
1,0
0
PA
N 1
663 R
1,3
3
1,0
0
1,0
0
1,0
0
1,0
0
1,0
0
1,0
6
1,0
0
1,0
0
1,0
0
1,0
0
1,0
0
1,0
0
1,0
0
1,0
0
1,0
0
P61T
38 R
1,0
0
1,0
0
1,0
0
1,0
0
1,0
0
1,0
0
1,0
0
1,0
0
1,0
0
1,0
0
2,0
0
1,2
5
1,0
0
1,0
0
1,0
0
1,0
0
LS
6161 R
1,0
0
1,0
0
1,0
0
1,0
0
1,6
7
1,0
0
1,1
1
1,0
0
1,0
0
1,0
0
1,0
0
1,0
0
1,0
0
1,0
0
1,0
0
1,0
0
SS
S 6
560 (
tuc)
1,0
0
1,0
0
1,0
0
1,0
0
1,0
0
1,0
0
1,0
0
1,0
0
1,0
0
1,0
0
1,0
0
1,0
0
1,0
0
1,0
0
1,0
0
1,0
0
NS
6448 R
1,0
0
1,0
0
1,0
0
1,0
0
1,0
0
1,0
0
1,0
0
1,0
0
1,0
0
1,0
0
2,0
0
1,2
5
1,0
0
1,0
0
1,0
0
1,0
0
P64T
39 R
1,3
3
1,0
0
1,0
0
1,0
0
1,0
0
1,0
0
1,0
6
1,0
0
1,0
0
1,0
0
1,0
0
1,0
0
1,0
0
1,0
0
1,0
0
1,0
0
PA
N 1
644 R
1,0
0
1,0
0
1,0
0
1,0
0
1,0
0
1,0
0
1,0
0
1,0
0
1,0
0
1,0
0
3,0
0
1,5
0
1,0
0
1,0
0
1,0
0
1,0
0
LS
6868 R
1,0
0
1,0
0
1,0
0
1,0
0
1,0
0
1,0
0
1,0
0
1,0
0
1,0
0
1,0
0
1,0
0
1,0
0
1,0
0
1,0
0
1,0
0
1,0
0
DM
6.8
i R
R
1,0
0
1,0
0
1,0
0
1,0
0
1,0
0
1,0
0
1,0
0
1,0
0
1,0
0
1,0
0
1,0
0
1,0
0
1,0
0
1,0
0
1,0
0
1,0
0
DM
6968 R
SF
1,0
0
1,0
0
1,0
0
1,0
0
1,0
0
1,0
0
1,0
0
1,0
0
1,0
0
1,0
0
1,0
0
1,0
0
1,0
0
1,0
0
1,0
0
1,0
0
P71T
74 R
1,3
3
1,0
0
1,0
0
1,0
0
1,0
0
1,0
0
1,0
6
1,0
0
1,0
0
1,0
0
3,0
0
1,5
0
1,0
0
1,0
0
1,0
0
1,0
0
Gem
/Me
an
1,1
7
1,0
0
1,0
0
1,0
0
1,1
0
1,0
0
1,0
4
1,0
0
1,0
0
1,0
0
1,4
6
1,1
2
1,0
0
1,0
2
1,0
0
1,0
1
21

South African Soybean Crop Quality Report 2019/2020 Season
72
Tabel 12 D
ie p
lantt
ellin
g g
eoes (
x 1
000)
van d
ie v
ers
kille
nde s
oja
boonkultiv
ars
by d
ie v
ers
kille
nde p
roeflokalite
ite,
2019/2
0
Table
12 T
he n
um
ber
of
pla
nt harv
este
d (
x 1
000)
of th
e d
iffe
rent soybean c
ultiv
ars
at
the d
iffe
rent tr
ial lo
calities,
2019/2
0
Kultivar
Cultivar
Koel/C
ool
Matig/M
odera
ste
W
arm
Bapsfontein
Belfast
Bethlehem
Clarens
Kinross
Winterton
Gem/Mean
Cedara
Kroonstad
Leeudoringstad
Stoffberg
Gem/Mean
Hoopstad
Marble Hall
Schweizer-
Reneke
Gem/Mean
P48T
48 R
123
117
285
82
205
259
178
197
179
145
127
162
172
256
111
180
DM
5351 R
SF
93
211
312
99
217
267
200
258
141
162
126
172
165
246
105
172
DM
5953 R
SF
79
226
333
146
212
312
218
247
204
210
120
196
155
249
108
171
SS
S 5
449 (
tuc)
149
223
298
168
201
299
223
253
170
197
125
186
170
256
160
195
DM
5302 R
SF
152
217
306
151
206
304
223
236
154
233
132
189
168
245
161
192
LD
C 5
.3
122
201
269
169
202
218
197
215
163
207
123
177
167
245
98
170
SS
S 5
052 (
tuc)
182
195
278
134
236
278
217
257
186
165
125
183
203
292
138
211
NA
5509 R
153
183
249
90
202
249
188
230
136
167
126
165
178
257
135
190
LS
6851 R
177
200
313
154
187
301
222
260
162
160
112
174
202
277
151
210
PA
N 1
575 R
99
117
211
75
178
177
143
197
157
162
119
159
125
256
128
170
PA
N 1
521 R
141
219
318
143
204
301
221
235
215
203
122
194
173
272
148
198
PA
N 1
555 R
104
196
293
121
195
252
194
218
188
133
125
166
197
243
69
170
NS
5909 R
176
181
286
129
212
269
209
237
172
192
119
180
155
238
231
208
LD
C 5
.9
145
183
297
172
193
190
197
206
127
145
120
149
137
239
101
159
DM
5901 R
SF
159
192
304
80
213
235
197
181
168
140
123
153
165
254
160
193
LS
6860 R
149
168
277
104
217
263
196
181
160
122
133
149
148
259
116
174
LS
6164 R
144
191
308
146
231
287
218
252
142
158
123
169
200
277
169
216
PA
N 1
663 R
163
157
277
95
196
280
195
201
148
138
123
153
88
249
117
151
P61T
38 R
172
183
307
134
233
270
217
233
154
160
117
166
143
264
172
193
LS
6161 R
190
223
288
166
209
309
231
218
160
195
131
176
153
276
127
186
SS
S 6
560 (
tuc)
157
194
317
125
194
312
217
258
188
215
120
195
157
269
113
179
NS
6448 R
145
176
269
145
224
290
208
250
129
123
124
157
167
258
119
181
P64T
39 R
137
201
330
145
209
293
219
269
252
203
123
212
190
260
138
196
PA
N 1
644 R
109
189
297
106
147
270
186
249
167
170
120
176
125
262
111
166
LS
6868 R
124
171
308
74
192
251
187
174
171
165
127
159
142
256
114
170
DM
6.8
i R
R
132
209
311
147
222
311
222
279
191
198
122
198
185
279
148
204
DM
6968 R
SF
141
92
252
70
181
227
161
140
162
98
116
129
167
254
109
177
P71T
74 R
172
195
321
151
224
273
223
218
173
190
116
174
173
257
123
184
Gem
/Mean
142
186
293
126
205
270
204
227
169
170
123
172
163
259
131
184
22

South African Soybean Crop Quality Report 2019/2020 Season
73
T
abel 13 P
ers
enta
sie
ongew
enste
sade v
an d
ie v
ers
kille
nde s
oja
boonkultiv
ars
by d
ie v
ers
kill
ende p
roef
lokalite
ite, 2019/2
0
Table
13 P
erc
enta
ge u
ndesirable
seed o
f th
e d
iffe
rent soybean c
ultiv
ars
at th
e d
iffe
rent tr
ial lo
calities, 2019/2
0
Kultivar
Cultivar
Koel/C
ool
Matig/M
odera
te
Warm
Bapsfontein
Belfast
Bethlehem
Clarens
Kinross
Winterton
Gem/Mean
Cedara
Greytown
Kroonstad
Leeudoringstad
Stoffberg
Gem/Mean
Hoopstad
Marble Hall
Schweizer-Reneke
Gem/Mean
P48T
48 R
0,0
0
0,0
0
0,0
0
0,0
0
0,0
0
0,2
3
0,0
4
0,0
0
0,3
8
0,0
0
0,0
0
0,1
1
0,1
0
0,1
9
0,0
0
0,4
1
0,2
0
DM
5351 R
SF
0,0
0
0,0
0
0,1
0
0,0
0
0,0
0
0,0
5
0,0
3
0,3
0
0,3
6
0,0
8
0,0
0
0,7
3
0,2
9
0,3
5
0,0
0
0,1
6
0,1
7
DM
5953 R
SF
0,0
0
0,0
0
0,2
2
0,3
6
0,1
3
0,5
6
0,2
1
0,0
0
0,2
3
0,0
0
0,1
5
0,0
0
0,0
8
0,3
2
0,0
0
0,1
9
0,1
7
SS
S 5
449 (
tuc)
0,0
0
0,1
6
0,5
6
0,3
1
0,0
0
0,1
2
0,1
9
0,2
1
0,1
8
0,0
0
0,0
0
0,5
2
0,1
8
0,3
5
0,0
0
0,2
0
0,1
8
DM
5302 R
SF
0,0
8
0,0
9
0,1
4
0,4
8
0,0
0
0,2
6
0,1
8
0,1
6
0,5
8
0,0
0
0,5
5
0,2
6
0,3
1
0,1
0
0,3
6
0,4
7
0,3
1
LD
C 5
.3
0,1
2
0,3
0
0,2
1
0,5
9
0,1
4
0,4
0
0,2
9
0,0
0
0,3
1
0,2
6
0,3
7
0,2
7
0,2
4
0,2
4
0,0
0
0,4
9
0,2
4
SS
S 5
052 (
tuc)
0,2
6
0,0
0
0,1
5
0,8
1
0,0
0
0,1
0
0,2
2
0,0
0
0,5
5
0,0
0
0,2
4
0,0
0
0,1
6
0,0
0
0,0
0
0,2
1
0,0
7
NA
5509 R
0,1
6
0,1
8
0,2
1
0,4
3
0,0
0
0,1
2
0,1
8
0,0
0
0,3
0
0,0
0
0,0
6
1,5
5
0,3
8
0,0
7
0,0
0
0,3
0
0,1
2
LS
6851 R
0,4
9
0,1
2
0,4
5
0,6
7
0,5
0
0,0
0
0,3
7
0,0
0
0,5
5
0,0
7
0,3
4
0,7
5
0,3
4
0,0
0
0,0
0
0,3
0
0,1
0
PA
N 1
575 R
0,2
7
0,0
0
0,3
4
0,0
9
0,1
3
0,1
4
0,1
6
0,4
0
0,2
3
0,0
0
0,1
7
1,1
2
0,3
8
0,0
0
0,0
0
0,3
3
0,1
1
PA
N 1
521 R
0,3
4
0,1
5
0,2
4
0,2
5
0,0
0
0,0
5
0,1
7
0,2
2
0,5
8
0,0
8
0,1
0
0,6
1
0,3
2
0,0
0
0,2
7
0,2
5
0,1
7
PA
N 1
555 R
0,0
7
0,1
2
0,0
0
0,3
2
0,0
0
0,1
1
0,1
0
0,2
0
0,3
2
0,3
4
0,0
0
0,3
7
0,2
5
0,2
3
0,0
0
0,3
6
0,2
0
NS
5909 R
0,1
9
0,6
4
0,0
0
0,2
2
0,0
0
0,3
7
0,2
4
0,0
0
0,3
8
0,3
6
0,1
1
0,4
5
0,2
6
0,1
1
0,2
7
0,8
3
0,4
0
LD
C 5
.9
0,0
8
0,0
0
0,0
0
0,1
3
0,0
0
0,0
5
0,0
4
0,2
0
0,4
0
0,0
0
0,0
3
0,8
8
0,3
0
0,0
0
0,0
0
0,6
1
0,2
0
DM
5901 R
SF
0,0
7
0,0
0
0,0
0
0,3
6
0,0
0
0,2
4
0,1
1
0,0
0
0,5
0
0,2
6
0,0
0
0,6
4
0,2
8
0,0
9
0,0
0
0,3
2
0,1
4
LS
6860 R
0,1
0
0,6
1
0,2
2
0,7
3
0,0
9
0,0
7
0,3
0
0,4
2
0,7
7
0,0
0
0,1
6
1,2
2
0,5
1
0,0
5
0,0
0
0,4
5
0,1
7
LS
6164 R
0,0
0
0,0
0
0,8
9
0,2
5
0,0
0
0,1
1
0,2
1
0,3
1
0,5
1
0,2
0
0,1
8
0,6
6
0,3
7
0,0
9
0,1
6
0,4
7
0,2
4
PA
N 1
663 R
0,4
3
0,0
0
0,0
0
0,4
3
0,2
1
0,2
4
0,2
2
0,0
6
0,8
3
0,2
8
0,2
4
1,6
9
0,6
2
0,3
8
0,0
0
0,2
5
0,2
1
P61T
38 R
0,0
0
0,0
0
0,0
0
0,0
8
0,1
3
0,2
2
0,0
7
0,7
2
0,4
2
0,1
2
0,0
3
0,5
9
0,3
8
0,6
7
0,0
0
0,3
1
0,3
3
LS
6161 R
0,1
3
0,0
0
0,2
1
0,3
2
0,0
0
0,1
0
0,1
3
0,3
3
0,9
1
0,2
3
0,1
3
0,3
9
0,4
0
0,0
0
0,0
0
0,2
4
0,0
8
SS
S 6
560 (
tuc)
0,0
3
0,0
0
0,3
1
0,1
5
0,0
0
0,2
6
0,1
3
0,1
8
0,2
5
0,0
0
0,0
7
0,5
4
0,2
1
0,2
8
0,2
1
0,2
0
0,2
3
NS
6448 R
0,1
6
0,0
0
0,0
0
0,1
7
0,0
0
0,1
0
0,0
7
0,0
0
0,5
5
0,0
0
0,1
8
0,9
0
0,3
3
0,2
1
0,0
0
0,2
5
0,1
5
P64T
39 R
0,3
3
0,2
4
0,2
3
0,3
9
0,1
0
0,2
6
0,2
6
0,4
6
0,5
5
0,1
1
0,2
1
0,8
1
0,4
3
0,0
9
0,2
0
0,0
2
0,1
0
PA
N 1
644 R
0,1
9
0,0
0
0,0
0
0,2
3
0,0
9
0,1
8
0,1
2
0,2
2
0,5
0
0,2
5
0,0
0
0,2
0
0,2
3
0,0
0
0,0
0
0,1
4
0,0
5
LS
6868 R
0,1
8
0,0
0
0,1
9
1,4
0
0,0
7
0,3
7
0,3
7
0,2
1
0,6
9
0,0
9
0,0
5
0,8
3
0,3
7
0,0
0
0,1
5
0,1
5
0,1
0
DM
6.8
i R
R
0,2
1
0,0
0
0,0
0
0,4
6
0,0
0
0,1
9
0,1
4
0,3
9
0,8
2
0,1
4
0,1
9
0,4
9
0,4
1
0,0
6
0,4
6
0,1
6
0,2
3
DM
6968 R
SF
0,1
8
0,0
0
0,1
3
0,2
1
0,1
1
0,0
5
0,1
1
0,2
7
0,6
9
0,2
8
0,0
9
1,1
8
0,5
0
0,0
0
0,3
2
0,4
7
0,2
6
P71T
74 R
0,4
0
0,0
0
0,2
5
0,3
1
0,2
0
0,2
5
0,2
4
0,3
2
0,4
5
0,3
5
0,2
4
0,7
7
0,4
3
0,7
7
0,2
2
0,0
4
0,3
4
Gem
/Mean
0,1
6
0,0
9
0,1
8
0,3
6
0,0
7
0,1
9
0,1
7
0,2
0
0,4
9
0,1
3
0,1
4
0,6
6
0,3
2
0,1
7
0,0
9
0,3
1
0,1
9
23

South African Soybean Crop Quality Report 2019/2020 Season
74
Tabel 14 M
assa v
an 1
00 s
ade (
g)
van d
ie v
ers
kill
ende s
oja
boonkultiv
ars
by d
ie v
ers
kille
nde p
roef
lokalit
eite,
2019/2
0
Table
14 M
ass 1
00 s
eeds (
g)
of th
e d
iffe
rent soybean c
ultiv
ars
at th
e d
iffe
rent tr
ial lo
calit
ies,
2019/2
0
Kultivar
Cultivar
Koel/C
ool
Matig/M
odera
te
Warm
Bapsfontein
Belfast
Bethlehem
Clarens
Kinross
Winterton
Gem/Mean
Cedara
Greytown
Kroonstad
Leeudoringstad
Stoffberg
Gem/Mean
Hoopstad
Marble Hall
Schweizer-
Reneke
Gem/Mean
P48T
48 R
17,9
9
18,1
3
18,6
9
16,6
6
19,0
5
20,0
8
18,4
3
20,0
9
21,0
7
19,7
1
18,8
0
17,2
7
19,3
9
19,2
7
18,9
6
18,2
0
18,8
1
DM
5351 R
SF
14,7
0
17,6
1
16,3
4
14,3
1
15,9
4
17,1
1
16,0
0
18,6
5
17,2
3
16,4
3
16,3
3
14,8
3
16,7
0
17,3
3
17,3
6
16,5
3
17,0
7
DM
5953 R
SF
13,7
5
15,8
5
17,2
4
14,4
7
16,8
1
16,5
8
15,7
8
17,5
4
16,4
0
16,4
6
14,1
3
17,8
4
16,4
8
15,9
3
17,6
9
16,1
3
16,5
9
SS
S 5
449 (
tuc)
13,4
1
14,1
9
14,2
4
11,7
1
14,8
1
13,7
3
13,6
8
14,2
5
14,2
3
14,1
4
16,0
0
12,9
3
14,3
1
15,5
3
15,3
6
13,9
3
14,9
4
DM
5302 R
SF
15,9
8
14,1
9
14,4
4
13,9
9
18,0
8
15,9
0
15,4
3
15,9
2
16,7
0
16,8
3
17,2
0
13,5
4
16,0
4
18,0
7
16,9
6
17,8
7
17,6
3
LD
C 5
.3
14,4
7
14,7
1
14,4
6
12,8
0
14,9
0
15,9
5
14,5
5
16,3
9
15,2
2
15,1
1
15,5
3
14,2
5
15,3
0
17,9
3
14,8
8
15,7
3
16,1
8
SS
S 5
052 (
tuc)
14,5
2
15,2
4
12,6
3
12,0
9
14,8
7
14,4
5
13,9
7
14,8
0
15,0
3
15,5
3
17,0
7
12,8
7
15,0
6
16,8
0
16,6
8
15,4
7
16,3
2
NA
5509 R
15,8
1
15,9
8
14,4
7
13,4
8
16,5
6
17,1
5
15,5
7
16,8
5
17,9
1
16,1
2
18,7
3
13,9
8
16,7
2
18,9
3
18,0
8
16,7
3
17,9
1
LS
6851 R
13,3
7
14,8
2
13,1
9
12,7
6
14,9
3
13,9
8
13,8
4
14,6
2
13,6
6
16,1
1
14,0
0
12,8
9
14,2
6
16,6
0
16,2
4
17,6
0
16,8
1
PA
N 1
575 R
16,1
8
17,6
2
15,9
7
13,8
2
15,9
3
16,5
3
16,0
1
18,4
0
17,5
1
17,0
0
16,9
3
14,3
9
16,8
5
19,5
3
16,8
7
16,2
0
17,5
4
PA
N 1
521 R
16,0
6
15,8
6
14,9
4
13,7
3
18,2
6
16,7
7
15,9
4
17,1
3
16,1
7
17,2
2
16,3
3
14,2
1
16,2
1
18,8
7
18,7
5
17,1
3
18,2
5
PA
N 1
555 R
16,8
7
17,4
7
16,6
3
15,1
3
17,5
5
17,5
6
16,8
7
61,7
3
17,3
2
17,9
9
13,8
0
15,3
3
25,2
4
18,3
3
17,5
6
17,5
3
17,8
1
NS
5909 R
16,0
6
16,5
8
14,8
5
12,7
0
17,3
1
16,0
0
15,5
8
16,5
7
17,5
2
16,1
8
14,7
3
14,6
0
15,9
2
16,2
7
17,4
4
16,6
0
16,7
7
LD
C 5
.9
17,7
3
17,9
9
15,5
9
15,5
2
19,6
0
16,9
7
17,2
3
19,1
7
18,2
2
18,3
9
16,2
7
16,4
5
17,7
0
16,1
3
16,9
4
17,7
3
16,9
3
DM
5901 R
SF
16,3
2
15,5
2
14,5
2
13,4
1
18,7
6
16,2
3
15,7
9
61,2
1
17,1
3
15,4
2
17,7
3
12,7
4
24,8
5
17,1
3
18,0
8
17,2
7
17,4
9
LS
6860 R
18,4
9
17,8
5
16,4
2
15,1
8
19,2
4
17,4
0
17,4
3
18,3
1
17,3
8
18,5
2
15,4
7
16,4
9
17,2
3
17,4
7
20,8
4
18,6
7
18,9
9
LS
6164 R
14,6
4
14,2
5
13,2
7
12,4
1
16,3
8
16,1
0
14,5
1
15,5
9
15,4
7
13,7
5
16,4
7
14,7
6
15,2
1
15,8
7
16,9
1
16,2
7
16,3
5
PA
N 1
663 R
15,1
8
16,9
3
14,7
3
14,2
8
16,5
5
15,2
2
15,4
8
16,5
7
17,3
2
15,7
0
17,8
0
14,4
8
16,3
7
18,6
7
16,0
2
16,1
3
16,9
4
P61T
38 R
14,9
4
15,3
4
15,2
5
13,0
2
16,5
1
15,1
6
15,0
4
16,2
6
16,1
9
16,5
6
19,4
0
13,5
9
16,4
0
19,2
0
16,9
3
16,2
0
17,4
4
LS
6161 R
15,9
3
15,4
1
14,4
1
12,8
5
15,8
0
15,1
7
14,9
3
16,0
8
16,2
1
15,5
5
18,0
0
14,1
9
16,0
0
15,4
0
16,9
4
15,1
3
15,8
3
SS
S 6
560 (
tuc)
15,3
1
15,7
2
13,4
4
12,6
9
15,4
4
15,0
8
14,6
1
16,0
5
15,8
8
15,1
0
15,8
0
12,9
8
15,1
6
16,2
7
17,2
7
15,6
0
16,3
8
NS
6448 R
15,4
0
15,6
0
13,1
4
12,6
3
16,9
6
16,1
6
14,9
8
16,9
8
16,4
8
15,9
1
18,0
0
11,4
0
15,7
5
20,2
0
17,6
0
16,3
3
18,0
4
P64T
39 R
16,1
6
16,2
5
14,8
0
13,3
8
18,1
9
15,8
4
15,7
7
16,8
4
17,0
5
15,9
9
15,6
7
15,1
3
16,1
4
19,2
0
16,5
3
17,2
7
17,6
7
PA
N 1
644 R
16,0
1
15,6
5
15,0
4
13,3
4
18,8
3
15,3
9
15,7
1
17,1
4
17,9
0
15,5
7
16,1
3
15,1
9
16,3
9
18,2
0
16,6
7
18,1
3
17,6
7
LS
6868 R
14,8
5
14,0
7
12,9
1
12,0
8
15,0
9
13,4
3
13,7
4
14,6
4
15,6
4
14,8
3
19,0
7
13,2
6
15,4
9
18,0
0
16,1
5
15,8
0
16,6
5
DM
6.8
i R
R
18,2
4
17,0
9
15,5
2
13,6
1
18,3
5
18,3
6
16,8
6
17,8
6
16,6
1
17,3
2
18,8
0
15,9
8
17,3
1
17,2
7
19,9
8
16,1
3
17,7
9
DM
6968 R
SF
19,6
8
17,1
8
17,0
4
15,2
5
20,0
9
19,4
9
18,1
2
20,5
1
20,6
0
18,6
2
16,8
0
17,3
4
18,7
7
16,4
0
22,3
5
18,8
0
19,1
8
P71T
74 R
16,8
9
16,8
9
14,7
8
12,6
9
18,1
0
16,6
1
16,0
0
17,0
7
17,1
9
15,7
6
15,5
3
14,6
5
16,0
4
18,0
0
19,6
2
17,0
0
18,2
1
Gem
/Mean
15,8
9
16,0
7
14,9
6
13,5
7
17,1
0
16,2
3
15,6
4
20,1
2
16,8
3
16,3
5
16,6
6
14,5
6
16,9
0
17,6
0
17,5
6
16,7
2
17,2
9
24
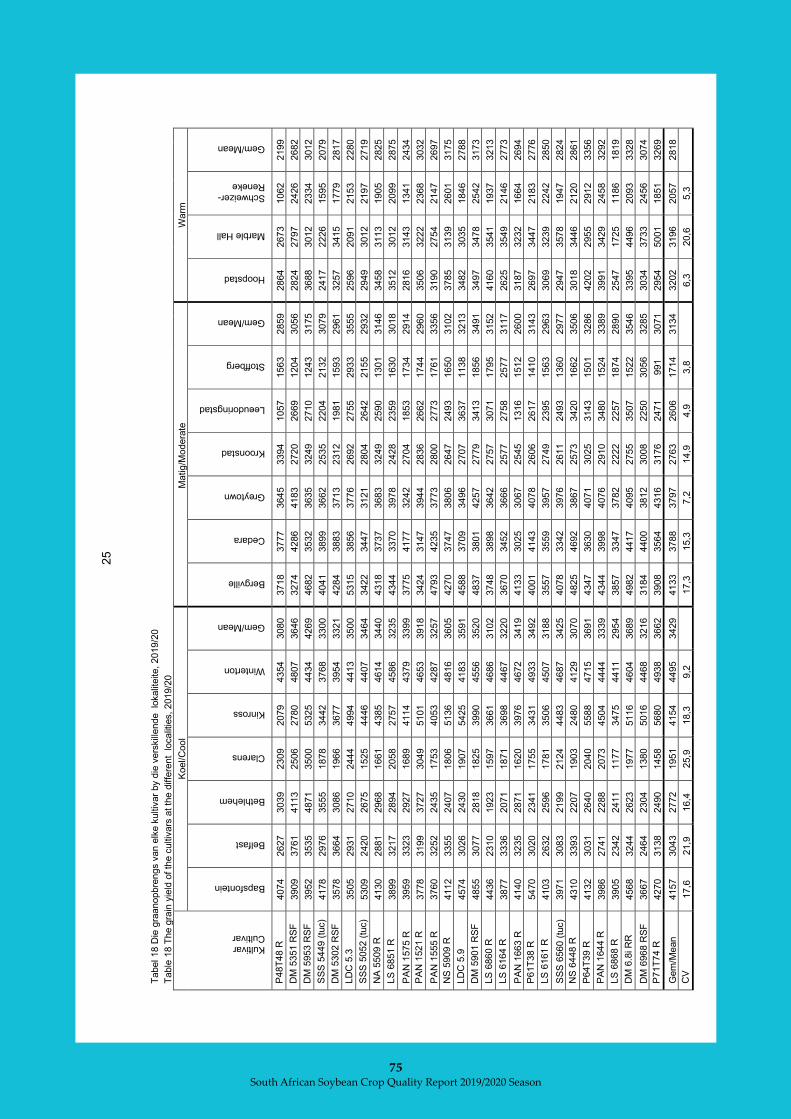
South African Soybean Crop Quality Report 2019/2020 Season
75
Ta
bel 18 D
ie g
raanopbre
ngs v
an e
lke k
ultiv
ar
by d
ie v
ers
kill
ende lo
kalit
eite, 2019/2
0
Ta
ble
18 T
he g
rain
yie
ld o
f th
e c
ultiv
ars
at th
e d
iffe
rent lo
calit
ies, 2019/2
0
Kultivar Cultivar
Koel/C
ool
Ma
tig
/Mo
dera
te
Warm
Bapsfontein
Belfast
Bethlehem
Clarens
Kinross
Winterton
Gem/Mean
Bergville
Cedara
Greytown
Kroonstad
Leeudoringstad
Stoffberg
Gem/Mean
Hoopstad
Marble Hall
Schweizer-Reneke
Gem/Mean
P48T
48 R
4074
2627
3039
2309
2079
4354
3080
3718
3777
3645
3394
1057
1563
2859
2864
2673
1062
2199
DM
5351 R
SF
3909
3761
4113
2506
2780
4807
3646
3274
4286
4183
2720
2669
1204
3056
2824
2797
2426
2682
DM
5953 R
SF
3952
3535
4871
3500
5325
4434
4269
4682
3532
3635
3249
2710
1243
3175
3688
3012
2334
3012
SS
S 5
449 (
tuc)
4178
2976
3555
1878
3442
3768
3300
4041
3899
3662
2535
2204
2132
3079
2417
2226
1595
2079
DM
5302 R
SF
3578
3664
3086
1966
3677
3954
3321
4284
3883
3713
2312
1981
1593
2961
3257
3415
1779
2817
LD
C 5
.3
3505
2931
2710
2444
4994
4413
3500
5315
3856
3776
2692
2755
2933
3555
2596
2091
2153
2280
SS
S 5
052 (
tuc)
5309
2420
2675
1525
4446
4407
3464
3422
3447
3121
2804
2642
2155
2932
2949
3012
2197
2719
NA
5509 R
4130
2881
2968
1661
4385
4614
3440
4318
3737
3683
3249
2590
1301
3146
3458
3113
1905
2825
LS
6851 R
3899
3217
2894
2058
2757
4586
3235
4344
3370
3978
2428
2359
1630
3018
3512
3012
2099
2875
PA
N 1
575 R
3959
3323
2927
1689
4114
4379
3399
3775
4177
3242
2704
1853
1734
2914
2816
3143
1341
2434
PA
N 1
521 R
3778
3199
3727
3049
5101
4653
3918
3424
3147
3944
2836
2662
1744
2960
3506
3222
2368
3032
PA
N 1
555 R
3760
3252
2435
1753
4053
4287
3257
4793
4235
3773
2800
2773
1761
3356
3190
2754
2147
2697
NS
5909 R
4112
3355
2407
1806
5136
4816
3605
4270
3747
3806
2647
2493
1650
3102
3785
3139
2601
3175
LD
C 5
.9
4574
3026
2430
1907
5425
4183
3591
4588
3709
3496
2707
3637
1138
3213
3482
3035
1846
2788
DM
5901 R
SF
4855
3077
2818
1825
3990
4556
3520
4837
3801
4257
2779
3413
1856
3491
3497
3478
2542
3173
LS
6860 R
4436
2310
1923
1597
3661
4686
3102
3748
3898
3642
2757
3071
1795
3152
4160
3541
1937
3213
LS
6164 R
3877
3336
2071
1871
3698
4467
3220
3670
3452
3666
2577
2758
2577
3117
2625
3549
2146
2773
PA
N 1
663 R
4140
3235
2871
1620
3976
4672
3419
4133
3025
3067
2545
1316
1512
2600
3187
3232
1664
2694
P61T
38 R
5470
3020
2341
1755
3431
4933
3492
4001
4143
4078
2606
2617
1410
3143
2697
3447
2183
2776
LS
6161 R
4103
2632
2596
1781
3506
4507
3188
3557
3559
3957
2749
2395
1563
2963
3069
3239
2242
2850
SS
S 6
560 (
tuc)
3971
3083
2199
2124
4483
4687
3425
4078
3342
3976
2611
2493
1360
2977
2947
3578
1947
2824
NS
6448 R
4310
3393
2207
1903
2480
4129
3070
4825
4692
3867
2573
3420
1662
3506
3018
3446
2120
2861
P64T
39 R
4132
3031
2640
2040
5588
4715
3691
4347
3630
4071
3025
3143
1501
3286
4202
2955
2912
3356
PA
N 1
644 R
3986
2741
2288
2073
4504
4444
3339
4344
3998
4076
2910
3480
1524
3389
3991
3429
2458
3292
LS
6868 R
3905
2342
2411
1177
3475
4411
2954
3857
3347
3782
2222
2257
1874
2890
2547
1725
1186
1819
DM
6.8
i R
R
4568
3244
2623
1977
5116
4604
3689
4982
4417
4095
2755
3507
1522
3546
3395
4496
2093
3328
DM
6968 R
SF
3667
2464
2304
1380
5016
4468
3216
3184
4400
3812
3008
2250
3056
3285
3034
3733
2456
3074
P71T
74 R
4270
3138
2490
1458
5680
4938
3662
3908
3564
4316
3176
2471
991
3071
2954
5001
1851
3269
Gem
/Me
an
4157
3043
2772
1951
4154
4495
3429
4133
3788
3797
2763
2606
1714
3134
3202
3196
2057
2818
CV
17,6
21,9
16,4
25,9
18,3
9,2
17,3
15,3
7,2
14,9
4,9
3,8
6,3
20,6
5,3
25
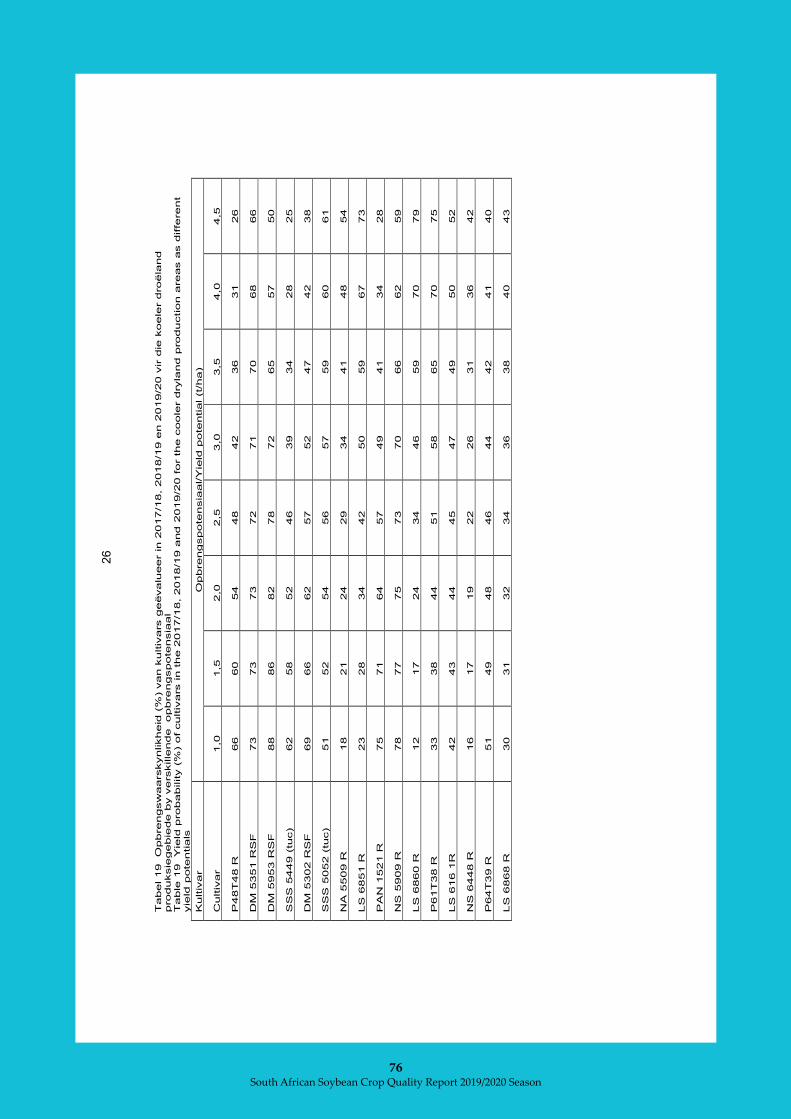
South African Soybean Crop Quality Report 2019/2020 Season
76
T
abel 19 O
pbrengsw
aarskynlikheid
(%
) v
an k
ultiv
ars g
eëvalu
eer in
2017/1
8,
2018/1
9 e
n 2
019/2
0 v
ir d
ie k
oele
r d
roëla
nd
produksie
gebie
de b
y v
erskille
nde opbrengspote
nsia
al
Ta
ble
19 Y
ield
probability (
%) o
f cultiv
ars in t
he 2
017/1
8, 2018/1
9 a
nd 2
019/2
0 f
or t
he c
oole
r d
ryla
nd p
roductio
n a
reas a
s d
iffe
rent
yie
ld p
ote
ntia
ls
Kultiv
ar
Opbrengspote
nsia
al/Y
ield
pote
ntial (t/
ha)
Cultiv
ar
1,0
1,5
2,0
2,5
3,0
3,5
4,0
4,5
P48T
48 R
66
60
54
48
42
36
31
26
DM
5351 R
SF
73
73
73
72
71
70
68
66
DM
5953 R
SF
88
86
82
78
72
65
57
50
SS
S 5
449 (
tuc)
62
58
52
46
39
34
28
25
DM
5302 R
SF
69
66
62
57
52
47
42
38
SS
S 5
052 (
tuc)
51
52
54
56
57
59
60
61
NA
5509 R
18
21
24
29
34
41
48
54
LS
6851 R
23
28
34
42
50
59
67
73
PA
N 1
521 R
75
71
64
57
49
41
34
28
NS
5909 R
78
77
75
73
70
66
62
59
LS
6860 R
12
17
24
34
46
59
70
79
P61T
38 R
33
38
44
51
58
65
70
75
LS
616 1
R
42
43
44
45
47
49
50
52
NS
6448 R
16
17
19
22
26
31
36
42
P64T
39 R
51
49
48
46
44
42
41
40
LS
6868 R
30
31
32
34
36
38
40
43
26

South African Soybean Crop Quality Report 2019/2020 Season
77
T
abel 20 G
raanopbre
ngs (
kg/h
a-1)
van k
ultiv
ars
gedure
nde d
ie 2
018/1
9 e
n 2
019/2
0 g
roeis
eis
oen t
en o
psig
te v
an d
ie v
ers
kille
nde lo
kalite
ite w
at in
die
koele
r pro
duksie
gebie
de
gele
ë is
Ta
ble
20 G
rain
yie
ld (
kg/h
a-1)
of cultiv
ars
durin
g the 2
018/1
9 a
nd 2
019
/20 g
row
ing s
eason for
the v
arious localitie
s s
ituate
d in
the c
oole
r pro
ductio
n a
reas
Kultivar
Cultivar
2018/1
9
2019/2
0
Bapsfontein
Bethlehem
Clarens
Kinross
Kokstad
Gem/Mean
Bapsfontein
Belfast
Bethlehem
Clarens
Kinross
Winterton
Gem/Mean
P48T
48 R
4375
2716
1929
3621
2056
2939
4074
2627
3039
2309
2079
4354
3080
DM
5351 R
SF
5214
2324
2131
4544
3991
3641
3909
3761
4113
2506
3885
4807
3830
DM
5953 R
SF
4782
3167
2345
4300
2241
3367
3952
3535
4871
3500
4183
4434
4079
SS
S 5
449 (
tuc)
4767
2492
1791
3302
2917
3054
4178
2976
3555
1878
3442
3768
3300
DM
5302 R
SF
5947
2710
2174
3926
2972
3546
3578
3664
3086
1966
3677
3954
3321
LD
C 5
.3
5657
2770
2444
3241
3176
3458
3505
2931
2710
2444
4994
4413
3500
SS
S 5
052 (
tuc)
6108
3063
2234
2847
2278
3306
3817
2420
2675
1525
4446
4407
3215
NA
5509 R
4944
3845
1814
3137
2917
3331
4130
2881
2968
1661
4385
4614
3440
LS
6851 R
5389
2901
2560
3136
3435
3484
3899
3217
2894
2058
2757
4586
3235
PA
N 1
575 R
-
- -
- -
- 3959
3323
2927
1689
4114
4379
3399
PA
N 1
521 R
5821
2824
2274
3215
3009
3429
3778
3199
3727
3049
5101
4653
3918
PA
N 1
555 R
-
- -
- -
- 3760
3252
2435
1753
4053
4287
3257
NS
5909 R
6140
2801
1929
2800
2639
3262
4112
3355
2407
1806
5136
4816
3605
LD
C 5
.9
6077
3964
1680
3284
3907
3783
4574
3026
2430
1907
5425
4183
3591
DM
5901 R
SF
5588
2882
2436
3092
3000
3400
4855
3077
2818
1825
3990
4556
3520
LS
6860 R
5391
2737
2142
2719
2796
3157
4436
2310
1923
1597
3661
4686
3102
LS
6164 R
4867
3389
2496
2724
2898
3275
3877
3336
2071
1871
3698
4467
3220
PA
N 1
663 R
-
- -
- -
- 4140
3235
2871
1620
3976
4672
3419
P61T
38 R
5452
2353
2372
2600
2991
3153
4194
3020
2341
1755
3431
4933
3279
LS
6161 R
5245
3315
2056
2961
3185
3352
4103
2632
2596
1781
3506
4507
3188
SS
S 6
560 (
tuc)
- -
- -
- -
3971
3083
2199
2124
4483
4687
3425
NS
6448 R
5232
3202
2129
3313
3167
3409
4310
3393
2207
1903
2480
4129
3070
P64T
39 R
5624
4671
2895
3366
3056
3922
4132
3031
2640
2040
5588
4715
3691
PA
N 1
644 R
5167
2788
2169
3436
3565
3425
3986
2741
2288
2073
4504
4444
3339
LS
6868 R
5459
2721
2600
2516
2435
3146
3905
2342
2411
1177
3475
4411
2954
DM
6.8
i R
R
- -
- -
- -
4568
3244
2623
1977
5116
4604
3689
DM
6968 R
SF
-
- -
- -
- 3667
2464
2304
1380
5016
4468
3216
P71T
74 R
-
- -
- -
- 4270
3138
2490
1458
5680
4938
3662
LS
6248 R
5001
2642
2017
2611
2713
2997
- -
- -
- -
-
NS
5009 R
4032
2770
1249
2653
2287
2598
- -
- -
- -
-
NS
5258 R
3229
2084
1914
3507
3435
2834
- -
- -
- -
-
PA
N 1
532 R
5017
2674
2325
2788
3407
3242
- -
- -
- -
-
Y 5
40
- -
1631
2263
1667
1854
- -
- -
- -
-
PA
N 1
653 R
5183
3089
2073
2519
3028
3178
- -
- -
- -
-
Gem
/Me
an
5220
2957
2141
3127
2932
3242
4059
3043
2772
1951
4153
4495
3412
27

South African Soybean Crop Quality Report 2019/2020 Season
78
T
abel 21 O
pbrengsw
aarskynlikheid
(%
) v
an k
ultiv
ars
geëvalu
eer in 2
017/1
8,
2018/1
9 e
n 2
019/2
0 v
ir d
ie m
atige p
roduksie
gebie
de
by
verskille
nde opbrengspote
nsia
al
Table
21 Y
ield
probability (
%) o
f cultiv
ars
in t
he 2
017/1
8, 2018/1
9 a
nd 2
019/2
0 f
or
the m
oderate
production a
reas a
s d
iffe
re
nt yie
ld
pote
ntials
Kultiv
ar
O
pbrengspote
nsia
al/Y
ield
pote
ntial (t/
ha)
Cultiv
ar
1,0
1,5
2,0
2,5
3,0
3,5
4,0
4,5
P48T
48 R
24
25
26
27
29
31
33
36
DM
5351 R
SF
19
24
29
36
43
52
59
66
DM
5953 R
SF
55
51
46
42
37
33
28
26
SS
S 5
449 (
tuc)
60
54
46
39
32
26
20
16
DM
5302 R
SF
71
62
50
39
27
18
11
8
SS
S 5
052 (
tuc)
83
78
71
63
54
45
36
29
NA
5509 R
71
69
66
63
59
56
51
48
LS
6851 R
9
14
21
31
43
57
69
79
PA
N 1
521 R
90
87
82
76
67
58
48
39
NS
5909 R
20
28
36
48
58
70
78
85
LS
6860 R
84
81
78
74
69
63
57
51
P61T
38 R
30
38
47
58
68
77
83
88
LS
6161 R
63
58
52
45
39
32
27
23
NS
6448 R
43
49
56
63
70
76
81
84
P64T
39 R
49
56
63
70
76
82
85
88
LS
6868 R
17
17
18
20
21
24
27
30
DM
6.8
i R
R
71
74
75
77
78
80
80
81
28
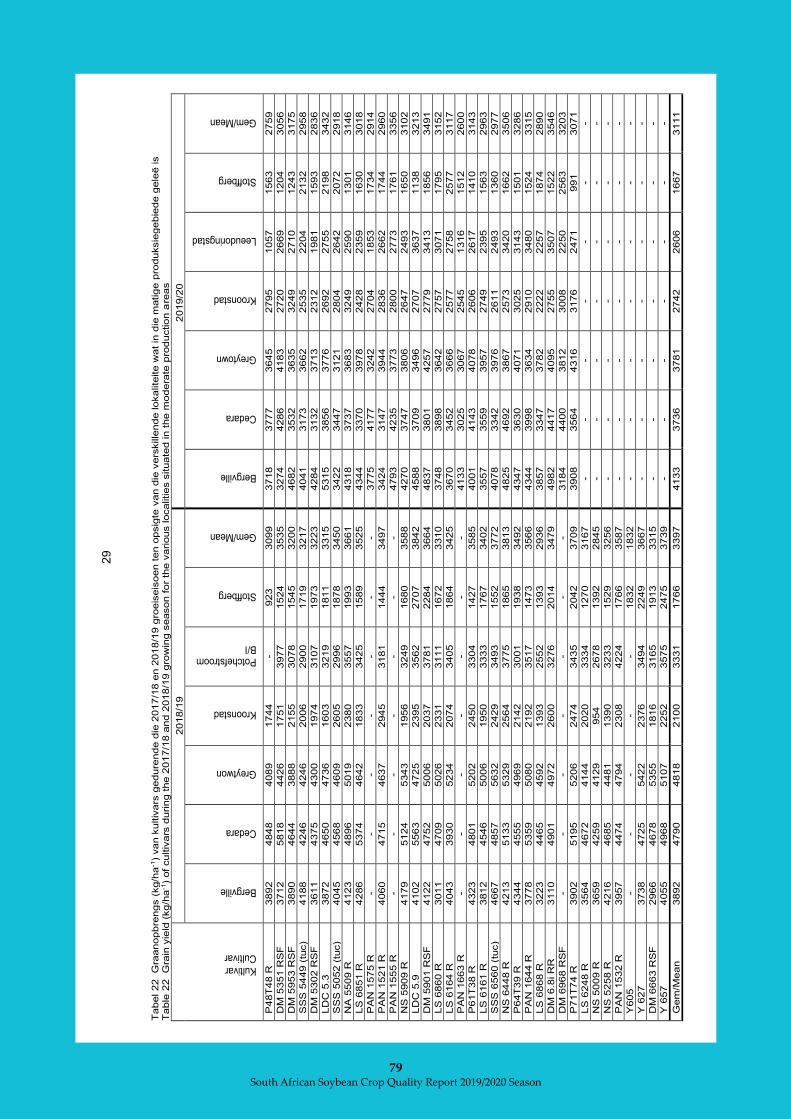
South African Soybean Crop Quality Report 2019/2020 Season
79
Ta
bel 22 G
raanopbre
ngs (
kg/h
a-1)
van k
ultiv
ars
gedure
nde d
ie 2
017/1
8 e
n 2
018/1
9 g
roeis
eis
oen t
en o
psig
te v
an d
ie v
ers
kille
nde lo
kalite
ite w
at in
die
matig
e p
roduksie
gebie
de g
ele
ë is
Ta
ble
22 G
rain
yie
ld (
kg/h
a-1)
of cultiv
ars
durin
g the 2
017/1
8 a
nd 2
018/1
9 g
row
ing s
eason for
the v
arious localitie
s s
ituate
d in
the m
odera
te p
roductio
n a
reas
Kultivar
Cultivar
2018/1
9
2019/2
0
Bergville
Cedara
Greytwon
Kroonstad
Potchefstroom B/I
Stoffberg
Gem/Mean
Bergville
Cedara
Greytown
Kroonstad
Leeudoringstad
Stoffberg
Gem/Mean
P48T
48 R
3892
4848
4089
1744
- 923
3099
3718
3777
3645
2795
1057
1563
2759
DM
5351 R
SF
3712
5818
4426
1751
3977
1524
3535
3274
4286
4183
2720
2669
1204
3056
DM
5953 R
SF
3890
4644
3888
2155
3078
1545
3200
4682
3532
3635
3249
2710
1243
3175
SS
S 5
449 (
tuc)
4188
4246
4246
2006
2900
1719
3217
4041
3173
3662
2535
2204
2132
2958
DM
5302 R
SF
3611
4375
4300
1974
3107
1973
3223
4284
3132
3713
2312
1981
1593
2836
LD
C 5
.3
3872
4650
4736
1603
3219
1811
3315
5315
3856
3776
2692
2755
2198
3432
SS
S 5
052 (
tuc)
4045
4568
4609
2605
2996
1878
3450
3422
3447
3121
2804
2642
2072
2918
NA
5509 R
4123
4896
5019
2380
3557
1993
3661
4318
3737
3683
3249
2590
1301
3146
LS
6851 R
4286
5374
4642
1833
3425
1589
3525
4344
3370
3978
2428
2359
1630
3018
PA
N 1
575 R
-
- -
- -
- -
3775
4177
3242
2704
1853
1734
2914
PA
N 1
521 R
4060
4715
4637
2945
3181
1444
3497
3424
3147
3944
2836
2662
1744
2960
PA
N 1
555 R
-
- -
- -
- -
4793
4235
3773
2800
2773
1761
3356
NS
5909 R
4179
5124
5343
1956
3249
1680
3588
4270
3747
3806
2647
2493
1650
3102
LD
C 5
.9
4102
5563
4725
2395
3562
2707
3842
4588
3709
3496
2707
3637
1138
3213
DM
5901 R
SF
4122
4752
5006
2037
3781
2284
3664
4837
3801
4257
2779
3413
1856
3491
LS
6860 R
3011
4709
5026
2331
3111
1672
3310
3748
3898
3642
2757
3071
1795
3152
LS
6164 R
4043
3930
5234
2074
3405
1864
3425
3670
3452
3666
2577
2758
2577
3117
PA
N 1
663 R
-
- -
- -
- -
4133
3025
3067
2545
1316
1512
2600
P61T
38 R
4323
4801
5202
2450
3304
1427
3585
4001
4143
4078
2606
2617
1410
3143
LS
6161 R
3812
4546
5006
1950
3333
1767
3402
3557
3559
3957
2749
2395
1563
2963
SS
S 6
560 (
tuc)
4667
4857
5632
2429
3493
1552
3772
4078
3342
3976
2611
2493
1360
2977
NS
6448 R
4213
5133
5329
2564
3775
1865
3813
4825
4692
3867
2573
3420
1662
3506
P64T
39 R
4344
4555
4969
2142
3001
1938
3492
4347
3630
4071
3025
3143
1501
3286
PA
N 1
644 R
3778
5359
5080
2192
3517
1473
3566
4344
3998
3634
2910
3480
1524
3315
LS
6868 R
3223
4465
4592
1393
2552
1393
2936
3857
3347
3782
2222
2257
1874
2890
DM
6.8
i R
R
3110
4901
4972
2600
3276
2014
3479
4982
4417
4095
2755
3507
1522
3546
DM
6968 R
SF
-
- -
- -
- -
3184
4400
3812
3008
2250
2563
3203
P71T
74 R
3902
5195
5206
2474
3435
2042
3709
3908
3564
4316
3176
2471
991
3071
LS
6248 R
3564
4672
4144
2020
3334
1270
3167
- -
- -
- -
-
NS
5009 R
3659
4259
4129
954
2678
1392
2845
- -
- -
- -
-
NS
5258 R
4216
4685
4481
1390
3233
1529
3256
- -
- -
- -
-
PA
N 1
532 R
3957
4474
4794
2308
4224
1766
3587
- -
- -
- -
-
Y605
-
- -
- -
1832
1832
- -
- -
- -
-
Y 6
27
3738
4725
5422
2376
3494
2249
3667
- -
- -
- -
-
DM
6663 R
SF
2966
4678
5355
1816
3165
1913
3315
- -
- -
- -
-
Y 6
57
4055
4968
5107
2252
3575
2475
3739
- -
- -
- -
-
Gem
/Me
an
3892
4790
4818
2100
3331
1766
3397
4133
3736
3781
2742
2606
1667
3111
29
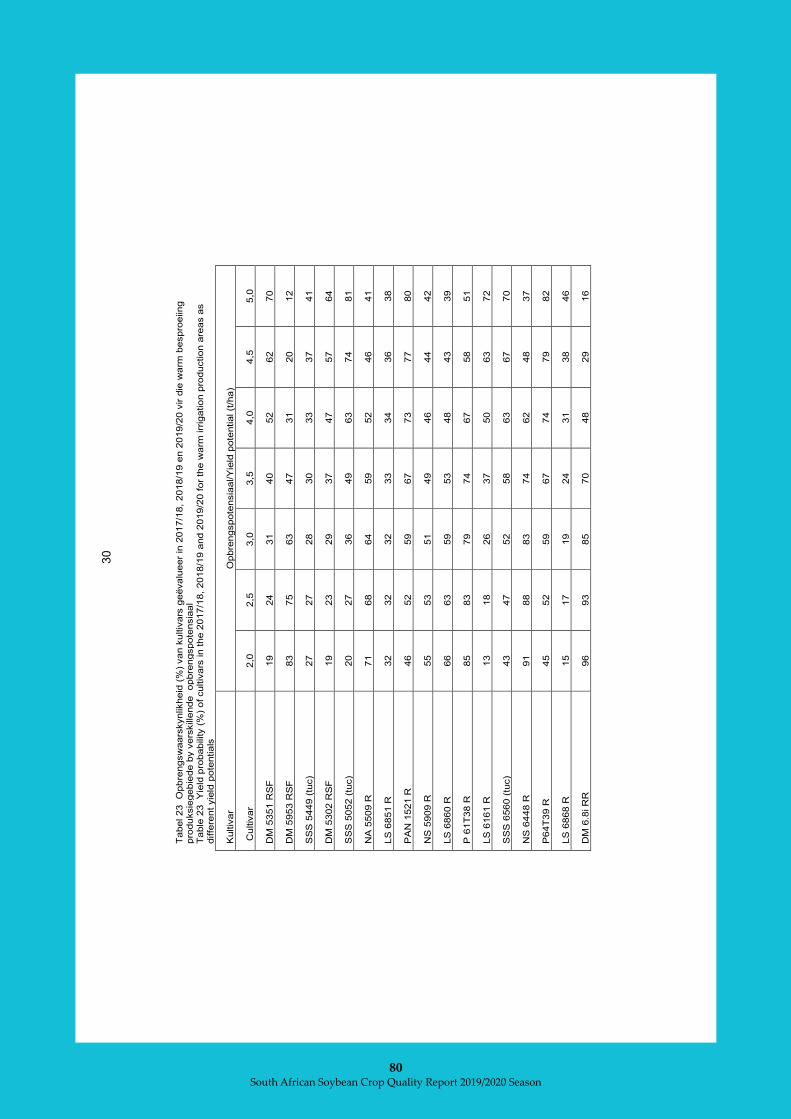
South African Soybean Crop Quality Report 2019/2020 Season
80
30
T
abel 23 O
pbre
ngsw
aars
kynlikheid
(%
) van k
ultiv
ars
geëvalu
eer
in 2
017/1
8,
2018/1
9 e
n 2
019/2
0 v
ir d
ie w
arm
bespro
eiing
pro
duksie
gebie
de b
y v
ers
kille
nde
opbre
ngspote
nsia
al
Table
23 Y
ield
pro
bability (
%)
of cultiv
ars
in t
he 2
017/1
8, 2018/1
9 a
nd 2
019/2
0 f
or
the w
arm
irr
igation p
roduction a
reas a
s
diffe
rent yie
ld p
ote
ntials
Kultiv
ar
Opbre
ngspote
nsia
al/Y
ield
pote
ntial (t
/ha)
Cultiv
ar
2,0
2,5
3,0
3,5
4,0
4,5
5,0
DM
5351 R
SF
19
24
31
40
52
62
70
DM
5953 R
SF
83
75
63
47
31
20
12
SS
S 5
449 (
tuc)
27
27
28
30
33
37
41
DM
5302 R
SF
19
23
29
37
47
57
64
SS
S 5
052 (
tuc)
20
27
36
49
63
74
81
NA
5509 R
71
68
64
59
52
46
41
LS
6851 R
32
32
32
33
34
36
38
PA
N 1
521 R
46
52
59
67
73
77
80
NS
5909 R
55
53
51
49
46
44
42
LS
6860 R
66
63
59
53
48
43
39
P 6
1T
38 R
85
83
79
74
67
58
51
LS
6161 R
13
18
26
37
50
63
72
SS
S 6
560 (
tuc)
43
47
52
58
63
67
70
NS
6448 R
91
88
83
74
62
48
37
P64T
39 R
45
52
59
67
74
79
82
LS
6868 R
15
17
19
24
31
38
46
DM
6.8
i R
R
96
93
85
70
48
29
16
30

South African Soybean Crop Quality Report 2019/2020 Season
81
Ta
bel 2
4 G
raanopbre
ngs (
kg/h
a-1)
van k
ultiv
ars
gedure
nde d
ie 2
017/1
8 e
n 2
018/1
9 g
roeis
eis
oen t
en o
psig
te v
an d
ie v
ers
kille
nde lo
kalite
ite w
at in
die
w
arm
pro
duksie
gebie
de g
ele
ë is
Ta
ble
24
G
rain
yie
ld (
kg/h
a-1)
of cultiv
ars
durin
g the 2
017/1
8 a
nd 2
018/1
9 g
row
ing s
eason for
the v
arious localitie
s s
ituate
d in
the w
arm
pro
ductio
n a
reas
Kultivar Cultivar
2018/1
9
2019/2
0
Brits K2
Groblersdal-Agricol
Marble Hall
Gem/Mean
Hoopstad
Marble Hall
Schweizer-
Reneke
Gem/Mean
P48T
48 R
-
- -
- 2864
2673
1062
2199
DM
5351 R
SF
3933
3900
3751
3861
2824
2797
2426
2682
DM
5953 R
SF
3678
4492
4301
4157
3688
3012
2334
3012
SS
S 5
449 (
tuc)
4366
2833
3091
3430
2417
2226
1595
2079
DM
5302 R
SF
3570
3825
3090
3495
3257
3415
1779
2817
LD
C 5
.3
3916
3952
3599
3822
2596
2091
2153
2280
SS
S 5
052 (
tuc)
4197
4386
3667
4083
2949
3012
2197
2719
NA
5509 R
3282
4683
3551
3838
3458
3113
1905
2825
LS
6851 R
3603
3770
3630
3667
3512
3012
2099
2875
PA
N 1
575 R
-
- -
- 2816
3143
1341
2434
PA
N 1
521 R
3848
4592
3497
3979
3506
3222
2368
3032
PA
N 1
555 R
-
- -
- 3190
2754
2147
2697
NS
5909 R
3797
3854
3815
3822
3785
3139
2601
3175
LD
C 5
.9
3828
4027
3846
3901
3482
3035
1846
2788
DM
5901 R
SF
3374
4158
3350
3627
3497
3478
2542
3173
LS
6860 R
3385
4039
2240
3222
4160
3541
1937
3213
LS
6164 R
3207
4514
3531
3751
2625
3549
2146
2773
PA
N 1
663 R
-
- -
- 3187
3232
1664
2694
P61T
38 R
2523
4257
3583
3455
2697
3447
2183
2776
LS
6161 R
3263
4132
3447
3614
3069
3239
2242
2850
SS
S 6
560 (
tuc)
3225
4382
3825
3811
2947
3578
1947
2824
NS
6448 R
4319
3910
2724
3651
3018
3446
2120
2861
P64T
39 R
3482
4601
3890
3991
4202
2955
2912
3356
PA
N 1
644 R
3448
4233
3323
3668
3991
3429
2458
3292
LS
6868 R
4060
2786
2991
3279
2547
1725
1186
1819
DM
6.8
i R
R
3735
3855
3474
3688
3395
4496
2093
3328
DM
6968 R
SF
3655
3454
4180
3763
3034
3733
2456
3074
P71T
74 R
4652
4334
3648
4211
2954
5001
1851
3269
LS
6248 R
3578
3716
3212
3502
- -
- -
NS
5009 R
2980
4194
3083
3419
- -
- -
NS
5258 R
3763
4242
3360
3788
- -
- -
PA
N 1
532 R
3323
2919
3728
3323
- -
- -
Y 6
27
3740
4121
3652
3838
- -
- -
DM
6663 R
SF
4111
4239
3506
3952
- -
- -
Y 6
57
3666
4229
3948
3948
- -
- -
PA
N 1
653 R
3704
4189
3702
3865
- -
- -
Gem
/Me
an
3663
4026
3507
3732
3202
3196
2057
2818
31

South African Soybean Crop Quality Report 2019/2020 Season
82
32
Tabel 25 S
aam
gevatt
e inligting v
an a
l die
lokalit
eite in d
ie k
oel pro
duksie
gebie
de,
2019/2
0
Table
25 S
um
merised info
rmation for
all the localities in t
he c
ool pro
duction a
reas, 2019/2
0
Kultiv
ar/
Cultiv
ar
Dae t
ot
blo
m/
Days t
o
flow
e-
ring
Fis
iolo
gie
s
ryp/
Physolo
gic
al
matu
re
Oes
datu
m/
Harv
est
date
Pla
nth
oogte
/ P
lant heig
ht
Peulh
oogte
/ P
od h
eig
ht
Om
val/
Lod-
gin
g
Gro
ensta
m/
Gre
en s
tem
O
opspring/
Shatt
ering
Pla
nttellin
g/
Num
ber
of
pla
nts
Pers
enta
sie
ongew
enste
sade/P
erc
enta
ge
undesirable
seed
Massa
100 s
ade/
Mass 1
00
seeds
Opbre
ngs/
Yie
ld
P48T
48 R
56
114
154
53
4
1,1
1
1,7
2
1,1
7
178
0,0
4
18,4
3
3080
DM
5351 R
SF
56
117
152
66
5
1,3
3
1,5
0
1,2
2
200
0,0
3
16,0
0
3830
DM
5953 R
SF
58
115
154
67
7
1,1
7
1,0
0
1,0
0
218
0,2
1
15,7
8
4079
SS
S 5
449 (
tuc)
67
129
167
78
9
1,2
8
1,2
2
1,1
1
223
0,1
9
13,6
8
3300
DM
5302 R
SF
67
128
164
72
6
1,2
8
1,3
9
1,1
7
223
0,1
8
15,4
3
3321
LD
C 5
,3
69
131
173
76
8
1,2
2
1,5
0
1,0
0
197
0,2
9
14,5
5
3500
SS
S 5
052 (
tuc)
71
133
174
82
11
1,2
8
1,5
6
1,0
6
217
0,2
2
13,9
7
3215
NA
5509 R
73
132
179
83
10
1,2
8
1,2
2
1,0
0
188
0,1
8
15,5
7
3440
LS
6851 R
67
132
172
62
7
1,0
0
1,0
0
1,0
6
222
0,3
7
13,8
4
3235
PA
N 1
575 R
70
130
150
80
8
1,1
7
1,5
0
1,0
6
143
0,1
6
16,0
1
3399
PA
N 1
521 R
72
126
167
90
11
1,5
0
1,3
3
1,0
0
221
0,1
7
15,9
4
3918
PA
N 1
555 R
74
137
176
82
12
1,3
3
1,2
8
1,0
6
194
0,1
0
16,8
7
3257
NS
5909 R
79
143
186
81
13
1,3
9
1,5
6
1,0
0
209
0,2
4
15,5
8
3605
LD
C 5
,9
71
135
184
88
9
1,5
0
1,3
9
1,0
0
197
0,0
4
17,2
3
3591
DM
5901 R
SF
70
136
184
79
9
1,2
2
1,5
6
1,0
6
197
0,1
1
15,7
9
3520
LS
6860 R
77
144
188
91
13
1,3
9
1,6
1
1,0
0
196
0,3
0
17,4
3
3102
LS
6164 R
73
135
186
92
12
1,6
1
1,3
3
1,0
0
218
0,2
1
14,5
1
3220
PA
N 1
663 R
73
134
178
80
9
1,2
2
1,1
1
1,0
6
195
0,2
2
15,4
8
3419
P61T
38 R
72
134
181
67
11
1,1
7
1,5
6
1,0
0
217
0,0
7
15,0
4
3279
LS
6161 R
73
135
176
89
13
1,3
3
1,5
0
1,1
1
231
0,1
3
14,9
3
3188
SS
S 6
560 (
tuc)
73
134
184
87
11
1,5
6
1,3
9
1,0
0
217
0,1
3
14,6
1
3425
NS
6448 R
71
134
184
77
11
1,2
2
1,3
3
1,0
0
208
0,0
7
14,9
8
3070
P64T
39
R
76
144
188
90
11
1,7
2
1,5
6
1,0
6
219
0,2
6
15,7
7
3691
PA
N 1
644 R
77
136
188
83
8
1,3
3
1,2
2
1,0
0
186
0,1
2
15,7
1
3339
LS
6868 R
77
142
188
83
11
1,2
8
1,7
8
1,0
0
187
0,3
7
13,7
4
2954
DM
6,8
i R
R
73
141
188
103
12
1,5
6
1,5
6
1,0
0
222
0,1
4
16,8
6
3689
DM
6968 R
SF
77
146
188
88
15
1,6
7
2,0
6
1,0
0
161
0,1
1
18,1
2
3216
P71T
74 R
78
146
188
94
14
1,5
6
2,0
0
1,0
6
223
0,2
4
16,0
0
3662
Gem
/Mean
71
134
176
81
10
1,3
5
1,4
5
1,0
4
204
0,1
7
15,6
4
3412
32

South African Soybean Crop Quality Report 2019/2020 Season
83
Ta
bel 26 S
aam
gevatt
e in
ligtin
g v
an a
l die
lo
kalite
ite in d
ie m
atig
e p
roduksie
gebie
de, 2019/2
0
Ta
ble
26 S
um
merised
info
rma
tio
n for
all the localities in t
he m
odera
te p
roductio
n a
reas, 2019/2
0
Kultiv
ar/
Cultiv
ar
Dae t
ot
blo
m/
Days t
o
flo
we-
rin
g
Fis
iolo
gie
s
ryp/
Physolo
gic
al
ma
ture
Oes
datu
m/
Harv
est
date
Pla
nth
oogte
/ P
lant heig
ht
Peulh
oogte
/ P
od h
eig
ht
Om
val/
Lod-
gin
g
Gro
ensta
m/
Gre
en s
tem
O
opsprin
g/
Shatt
erin
g
Pla
nttellin
g/
Num
ber
of
pla
nts
Pers
enta
sie
ongew
enste
sade/P
erc
enta
ge
undesirable
seed
Ma
ssa
100 s
ade/
Ma
ss 1
00
seeds
Opbre
ngs/
Yie
ld
P48T
48 R
44
114
129
54
5
1,0
0
1,2
7
1,0
0
162
0,1
0
19,3
9
2759
DM
5351 R
SF
44
117
133
71
8
1,6
0
2,4
0
1,2
5
172
0,2
9
16,7
0
3056
DM
5953 R
SF
43
114
129
69
7
1,0
0
1,0
7
1,2
5
196
0,0
8
16,4
8
3175
SS
S 5
449 (
tuc)
51
121
134
73
8
1,0
0
1,6
0
1,5
0
186
0,1
8
14,3
1
2958
DM
5302 R
SF
49
119
134
63
8
1,0
0
1,0
0
1,0
0
189
0,3
1
16,0
4
2836
LD
C 5
,3
52
126
140
71
8
1,0
7
1,8
0
1,0
0
177
0,2
4
15,3
0
3432
SS
S 5
052 (
tuc)
60
127
145
81
12
1,2
7
1,2
7
1,0
0
183
0,1
6
15,0
6
2918
NA
5509 R
58
125
142
75
9
2,0
0
1,2
0
1,0
0
165
0,3
8
16,7
2
3146
LS
6851 R
52
126
146
55
8
1,0
7
1,9
3
1,0
0
174
0,3
4
14,2
6
3018
PA
N 1
575 R
55
125
140
74
9
1,0
0
2,0
0
1,2
5
159
0,3
8
16,8
5
2914
PA
N 1
521 R
63
125
140
80
12
1,0
0
1,8
0
1,2
5
194
0,3
2
16,2
1
2960
PA
N 1
555 R
62
127
141
83
14
1,0
0
1,4
0
1,0
0
166
0,2
5
25,2
4
3356
NS
5909 R
60
130
146
83
15
1,0
0
2,0
0
1,0
0
180
0,2
6
15,9
2
3102
LD
C 5
,9
61
130
145
83
10
1,6
0
1,8
0
1,0
0
149
0,3
0
17,7
0
3213
DM
5901 R
SF
59
126
145
76
9
1,0
0
1,0
0
1,0
0
153
0,2
8
24,8
5
3491
LS
6860 R
65
130
150
87
13
1,9
3
1,4
7
1,2
5
149
0,5
1
17,2
3
3152
LS
6164 R
63
129
142
87
12
1,6
0
1,4
0
1,0
0
169
0,3
7
15,2
1
3117
PA
N 1
663 R
62
127
142
76
11
1,8
0
1,0
0
1,0
0
153
0,6
2
16,3
7
2600
P61T
38 R
64
129
145
58
11
1,0
0
1,0
7
1,2
5
166
0,3
8
16,4
0
3143
LS
6161 R
61
129
143
81
12
1,6
0
1,4
0
1,0
0
176
0,4
0
16,0
0
2963
SS
S 6
560 (
tuc)
60
128
143
84
13
1,4
7
1,8
0
1,0
0
195
0,2
1
15,1
6
2977
NS
6448 R
62
131
147
76
11
1,4
0
1,6
0
1,2
5
157
0,3
3
15,7
5
3506
P64T
39
R
64
130
152
88
12
1,0
0
1,0
0
1,0
0
212
0,4
3
16,1
4
3286
PA
N 1
644 R
64
130
151
80
11
1,0
0
1,0
0
1,5
0
176
0,2
3
16,3
9
3315
LS
6868 R
62
132
157
73
11
1,8
0
1,2
0
1,0
0
159
0,3
7
15,4
9
2890
DM
6,8
i R
R
64
133
157
89
12
1,7
3
1,0
0
1,0
0
198
0,4
1
17,3
1
3546
DM
6968 R
SF
65
134
157
82
13
1,8
0
1,6
7
1,0
0
129
0,5
0
18,7
7
3203
P71T
74 R
65
136
154
81
10
1,0
0
1,4
0
1,5
0
174
0,4
3
16,0
4
3071
Gem
58
127
144
76
10
1,3
1
1,4
5
1,1
2
172
0,3
2
16,9
0
3111
33

South African Soybean Crop Quality Report 2019/2020 Season
84
Ta
bel 27 S
aam
gevatt
e in
ligtin
g v
an a
l die
lo
kalite
ite in d
ie w
arm
er
pro
duksie
gebie
de, 2019/2
0
Ta
ble
27 S
um
merised info
rma
tio
n for
all the localities in t
he w
arm
er
pro
ductio
n a
reas,
2019/2
0
Kultiv
ar/
Cultiv
ar
Dae t
ot
blo
m/
Days t
o
flo
we-
rin
g
Fis
iolo
gie
s
ryp/
Physolo
gic
al
ma
ture
Oes
datu
m/
Harv
est
date
Pla
nth
oogte
/ P
lant heig
ht
Peulh
oogte
/ P
od h
eig
ht
Om
val/
Lod-
gin
g
Gro
ensta
m/
Gre
en s
tem
O
opsprin
g/
Shatt
erin
g
Pla
nttellin
g/
Num
ber
of
pla
nts
Pers
enta
sie
ongew
enste
sade/P
erc
enta
ge
undesirable
seed
Ma
ssa
100 s
ade/
Ma
ss 1
00
seeds
Opbre
ngs/
Yie
ld
P48T
48 R
40
120
132
48
5
1,0
0
2,5
6
1,0
0
180
0,2
0
18,8
1
2199
DM
5351 R
SF
37
120
131
61
5
1,0
0
1,8
9
1,0
0
172
0,1
7
17,0
7
2682
DM
5953 R
SF
38
119
131
58
4
1,0
0
1,0
0
1,0
0
171
0,1
7
16,5
9
3012
SS
S 5
449 (
tuc)
46
124
135
56
5
1,0
0
1,6
7
1,2
2
195
0,1
8
14,9
4
2079
DM
5302 R
SF
50
120
131
60
5
1,0
0
1,0
0
1,0
0
192
0,3
1
17,6
3
2817
LD
C 5
,3
42
120
131
57
4
1,0
0
1,6
7
1,0
0
170
0,2
4
16,1
8
2280
SS
S 5
052 (
tuc)
48
126
140
68
10
1,0
0
1,1
1
1,0
0
211
0,0
7
16,3
2
2719
NA
5509 R
51
126
140
74
9
1,0
0
1,3
3
1,0
0
190
0,1
2
17,9
1
2825
LS
6851 R
51
126
140
54
4
1,1
1
3,4
4
1,0
0
210
0,1
0
16,8
1
2875
PA
N 1
575 R
52
122
140
67
8
1,0
0
2,3
3
1,0
0
170
0,1
1
17,5
4
2434
PA
N 1
521 R
53
123
135
70
9
1,0
0
1,1
1
1,0
0
198
0,1
7
18,2
5
3032
PA
N 1
555 R
51
121
140
78
9
1,0
0
2,3
3
1,0
0
170
0,2
0
17,8
1
2697
NS
5909 R
52
127
146
77
9
1,0
0
2,6
7
1,0
0
208
0,4
0
16,7
7
3175
LD
C 5
,9
49
129
146
69
9
1,0
0
1,2
2
1,0
0
159
0,2
0
16,9
3
2788
DM
5901 R
SF
51
128
147
71
9
1,0
0
1,4
4
1,0
0
193
0,1
4
17,4
9
3173
LS
6860 R
54
129
146
90
16
1,0
0
1,1
1
1,0
0
174
0,1
7
18,9
9
3213
LS
6164 R
51
128
146
73
7
1,0
0
2,2
2
1,0
0
216
0,2
4
16,3
5
2773
PA
N 1
663 R
51
129
146
77
10
1,0
0
1,0
0
1,0
0
151
0,2
1
16,9
4
2694
P61T
38 R
53
126
140
46
6
1,0
0
2,2
2
1,0
0
193
0,3
3
17,4
4
2776
LS
6161 R
52
128
141
76
9
1,0
0
1,6
7
1,0
0
186
0,0
8
15,8
3
2850
SS
S 6
560 (
tuc)
54
125
135
81
8
1,0
0
2,1
1
1,0
0
179
0,2
3
16,3
8
2824
NS
6448 R
54
130
146
72
7
1,0
0
1,0
0
1,0
0
181
0,1
5
18,0
4
2861
P64T
39
R
54
129
146
83
8
1,0
0
1,0
0
1,0
0
196
0,1
0
17,6
7
3356
PA
N 1
644 R
54
135
146
67
5
1,0
0
1,8
9
1,0
0
166
0,0
5
17,6
7
3292
LS
6868 R
50
133
146
58
6
1,0
0
2,4
4
1,0
0
170
0,1
0
16,6
5
1819
DM
6,8
i R
R
55
134
152
96
11
1,0
0
2,3
3
1,0
0
204
0,2
3
17,7
9
3328
DM
6968 R
SF
52
133
146
84
10
1,0
0
1,8
9
1,0
0
177
0,2
6
19,1
8
3074
P71T
74 R
58
140
152
92
11
1,0
0
3,2
2
1,0
0
184
0,3
4
18,2
1
3269
Gem
50
127
141
70
8
1,0
0
1,8
2
1,0
1
184
0,1
9
17,2
9
2818
34
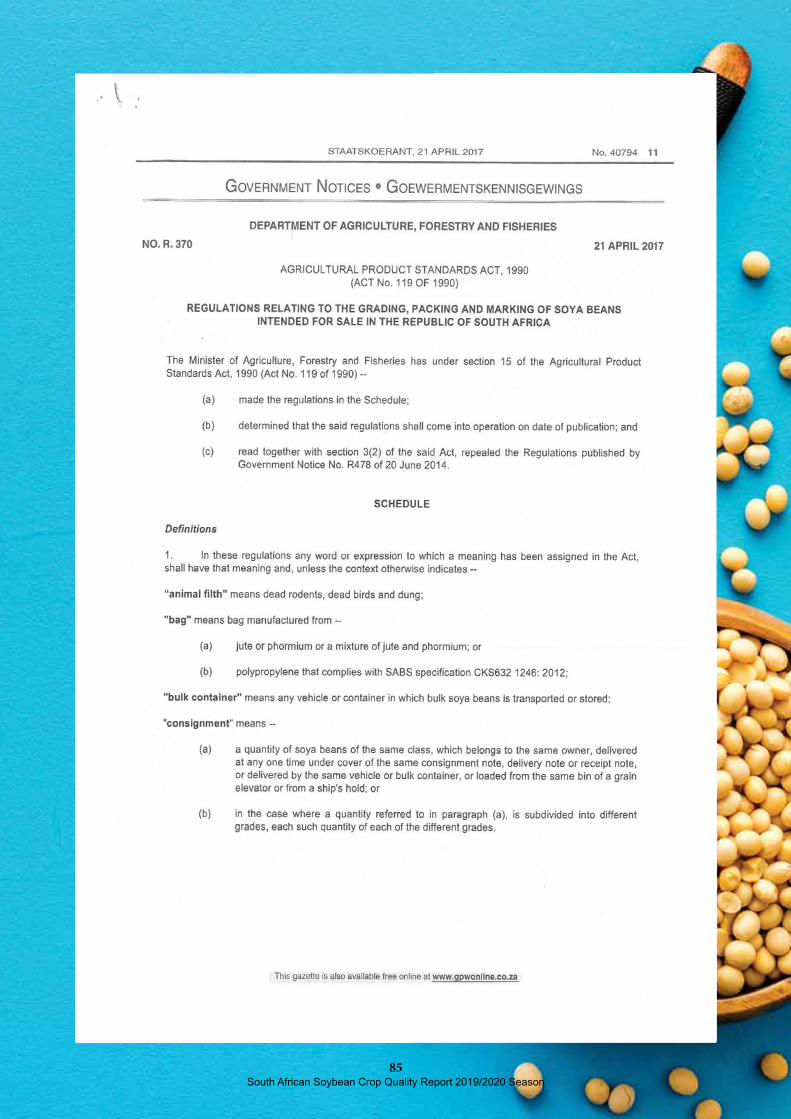
South African Soybean Crop Quality Report 2019/2020 Season85

South African Soybean Crop Quality Report 2019/2020 Season86
South African Soybean Crop Quality Report 2019/2020 Season87

South African Soybean Crop Quality Report 2019/2020 Season88

South African Soybean Crop Quality Report 2019/2020 Season89
South African Soybean Crop Quality Report 2019/2020 Season90
South African Soybean Crop Quality Report 2019/2020 Season91

South African Soybean Crop Quality Report 2019/2020 Season92

South African Soybean Crop Quality Report 2019/2020 Season93

South African Soybean Crop Quality Report 2019/2020 Season94

